37
Repsol YPF Fourth Quarter & Full Year 2009 Results February 2010 WEBCAST – CONFERENCE CALL February 25 th , 2010 Antonio Brufau CEO

Repsol YPFFourth Quarter & Full Year 2009 Results
February 2010
WEBCAST – CONFERENCE CALLFebruary 25th, 2010
Antonio BrufauCEO
Antonio BrufauCEO

2
DisclaimerALL RIGHTS ARE RESERVED
© REPSOL YPF, S.A. 2010
Repsol YPF, S.A. is the exclusive owner of this document. No part of this document may be reproduced (including photocopying), stored, duplicated, copied, distributed or introduced into a retrieval system of any nature or transmitted in any form or by any means without the prior written permission of Repsol YPF, S.A.
This document contains statements that Repsol YPF believes constitute forward-looking statements within the meaning of the US Private Securities Litigation Reform Act of 1995. These forward-looking statements may include statements regarding the intent, belief, or current expectations of Repsol YPF and its management, including statements with respect to trends affecting Repsol YPF’s financial condition, financial ratios, results of operations, business, strategy, geographic concentration, production volume and reserves, as well as Repsol YPF’s plans, expectations or objectives with respect to capital expenditures, business, strategy, geographic concentration, costs savings, investments and dividend payout policies. These forward-looking statements may also include assumptions regarding futureeconomic and other conditions, such as future crude oil and other prices, refining and marketing margins and exchange rates. These statements are not guarantees of future performance, prices, margins, exchange rates or other events and are subject to material risks, uncertainties, changes and other factors which may be beyond Repsol YPF’s control or may be difficult to predict.
Repsol YPF’s future financial condition, financial ratios, results of operations, business, strategy, geographic concentration, production volumes, reserves, capital expenditures, costs savings, investments and dividend payout policies, as well as future economic and other conditions, such as future crude oil and other prices, refining margins and exchange rates, could differ materially from those expressed or implied in any such forward-looking statements. Important factors that could cause such differences include, but are not limited to, oil, gas and other price fluctuations, supply and demand levels, currency fluctuations, exploration, drilling and production results, changes in reserves estimates, success in partnering with third parties, loss of market share, industry competition, environmental risks, physical risks, the risks of doing business in developing countries, legislative, tax, legal and regulatory developments, economic and financial market conditions in various countries and regions, political risks, wars and acts of terrorism, natural disasters, project delays or advancements and lack of approvals, as well as those factors described in the filings made by Repsol YPF and its affiliates with the Comisión Nacional del Mercado de Valores in Spain, the Comisión Nacional de Valores in Argentina, and the Securities and Exchange Commission in the United States; in particular, those described in Section 1.3 “Key information about Repsol YPF – Risk Factors” and Section 3 “Operating and Financial Review and Prospects” in Repsol YPF’s Annual Report on Form 20-F for the fiscal year ended December 31, 2008 filed with the US Securities and Exchange Commission and in Section I “Risk factors” in Repsol YPF’s Registration Document filed with the Comisión Nacional del Mercado de Valores in Spain on December 2009. Both documents are available on Repsol YPF’s website (www.repsol.com). In light of the foregoing, the forward-looking statements included in this document may not occur.
Repsol YPF does not undertake to publicly update or revise these forward-looking statements even if experience or future changes make it clear that the projected performance, conditions or events expressed or implied therein will not be realized.
This document does not constitute an offer to purchase, subscribe, sale or exchange of Repsol YPF's or YPF Sociedad Anonima's respective ordinary shares or ADSsin the United States or otherwise. Repsol YPF's and YPF Sociedad Anonima's respective ordinary shares and ADSs may not be sold in the United States absent registration or an exemption from registration under the US Securities Act of 1933, as amended.

3
Macro Situation
Main Developments
Status Key Growth Projects
4th Q 2009 and Annual Results
Financial Overview
2010 Perspectives
Agenda
4
Macro Situation
5
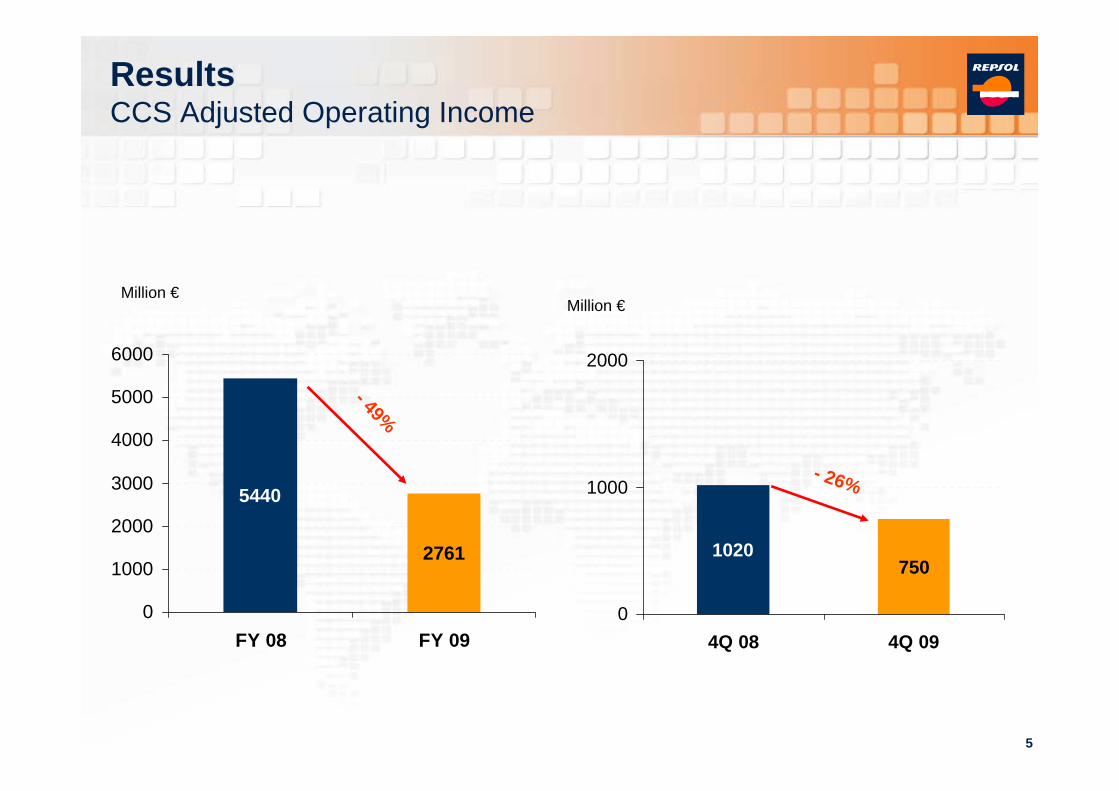
ResultsCCS Adjusted Operating Income
2761
5440
0
1000
2000
3000
4000
5000
6000
FY 08 FY 09
- 49%
Million €
7501020
0
1000
2000
4Q 08 4Q 09
- 26%
Million €
6
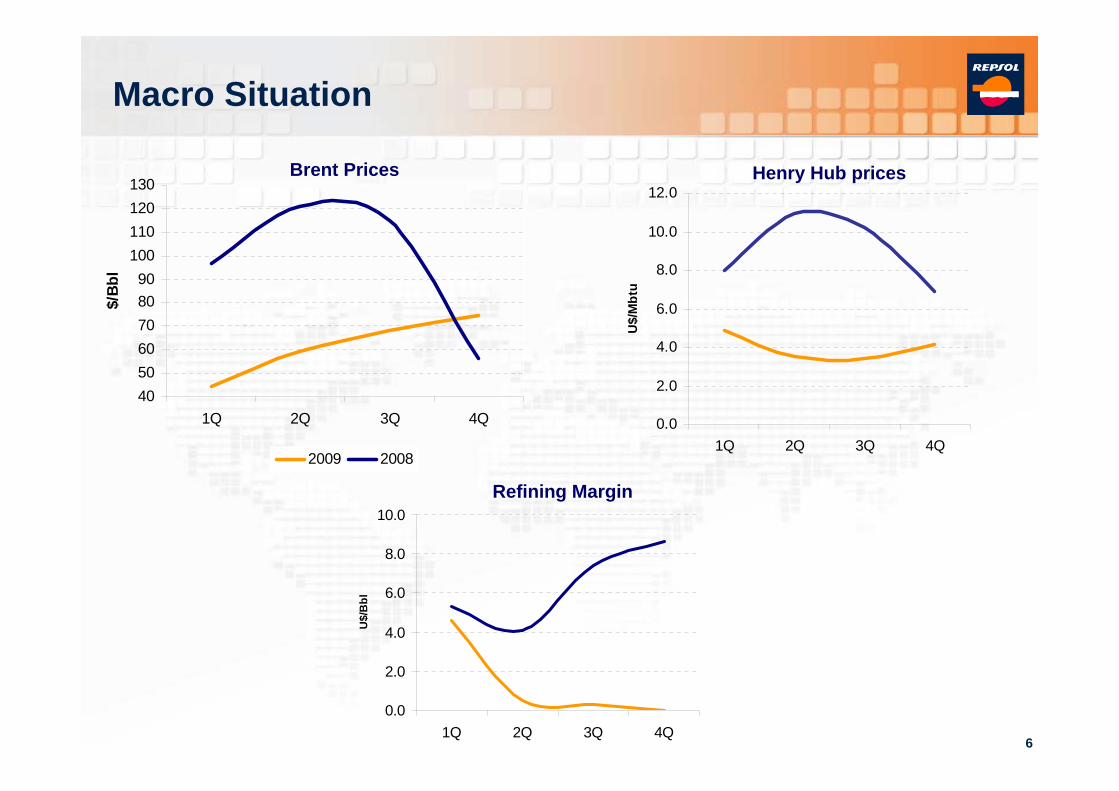
0.0
2.0
4.0
6.0
8.0
10.0
12.0
1Q 2Q 3Q 4Q
U$/
Mbt
u
Macro Situation
405060708090
100110120130
1Q 2Q 3Q 4Q
$/Bb
l
2009 2008
Brent Prices
0.0
2.0
4.0
6.0
8.0
10.0
1Q 2Q 3Q 4Q
U$/
Bbl
Refining Margin
Henry Hub prices

7
Macro Situation
1. Net Cash Margin = Gross Margin ($/bbl) – Cash Operating Expenses ($/bbl).Fuente: WoodMackenzie Refinery Evaluation Model
Cartagena withoutinvestment
Cartagena withinvestment
Refining margin in Europe Mid-Cycle
Improvement at Mid-cycle (*)
(*) Refining margin GAP of 5 us$/bbl in a low cycle year as 2009
8
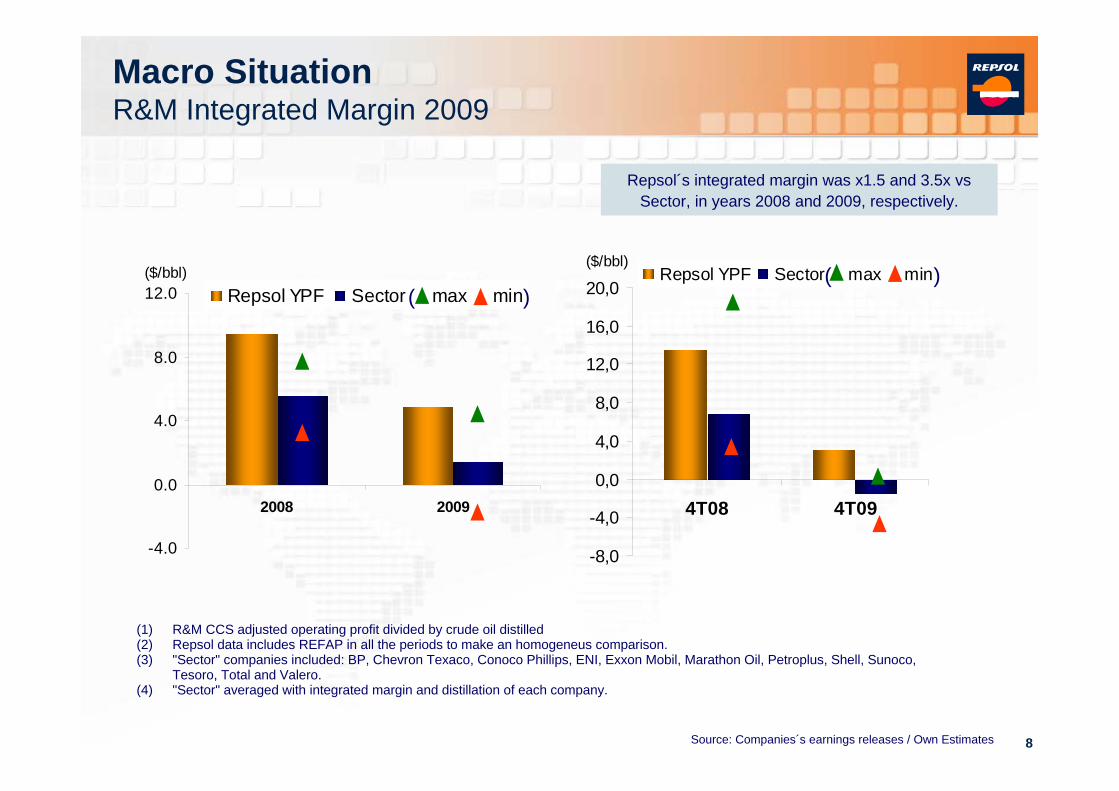
Macro SituationR&M Integrated Margin 2009
(1) R&M CCS adjusted operating profit divided by crude oil distilled(2) Repsol data includes REFAP in all the periods to make an homogeneus comparison.(3) "Sector" companies included: BP, Chevron Texaco, Conoco Phillips, ENI, Exxon Mobil, Marathon Oil, Petroplus, Shell, Sunoco,
Tesoro, Total and Valero.(4) "Sector" averaged with integrated margin and distillation of each company.
Repsol´s integrated margin was x1.5 and 3.5x vsSector, in years 2008 and 2009, respectively.
-4.0
0.0
4.0
8.0
12.0
2008 2009
($/bbl)Repsol YPF Sector max min
-8,0
-4,0
0,0
4,0
8,0
12,0
16,0
20,0
4T08 4T09
($/bbl)Repsol YPF Sector max min
Source: Companies´s earnings releases / Own Estimates
( )( )
9
2.0
2.5
3.0
3.5
4.0
4.5
1Q 2Q 3Q 4Q
Pes
o/U$
2008 2009
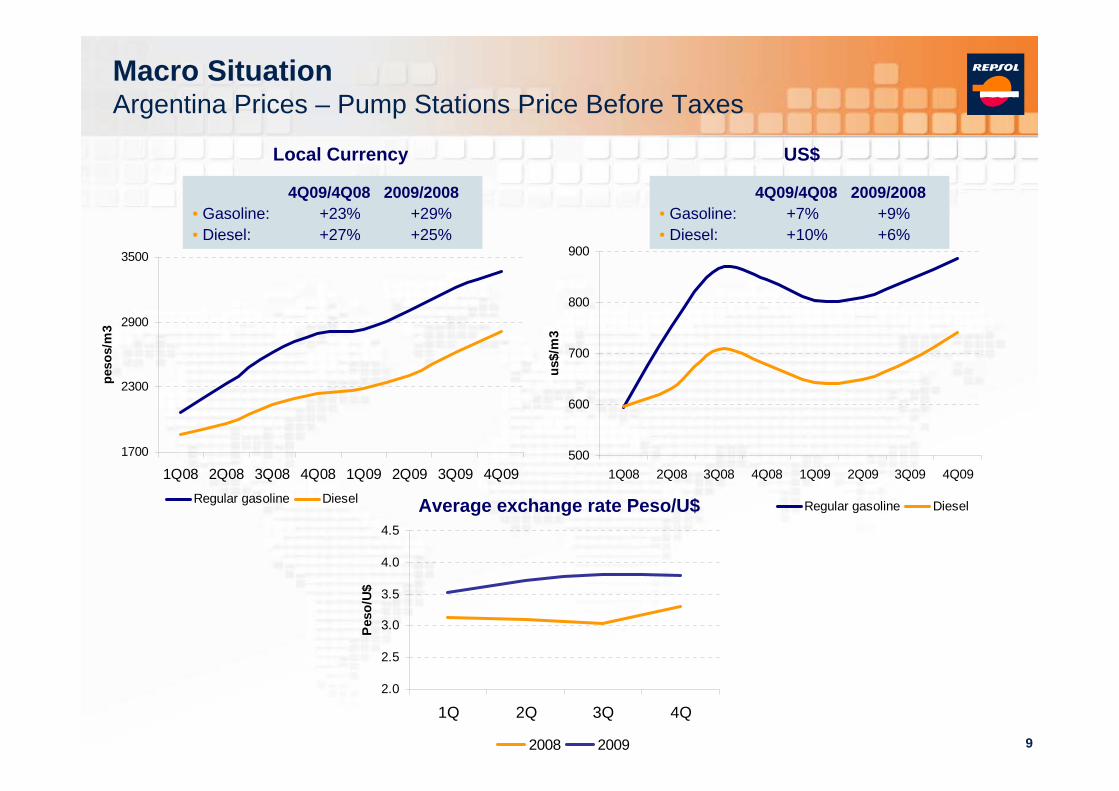
Macro SituationArgentina Prices – Pump Stations Price Before Taxes
Regular gasoline Diesel Average exchange rate Peso/U$
4Q09/4Q08 2009/2008• Gasoline: +7% +9%• Diesel: +10% +6%
4Q09/4Q08 2009/2008• Gasoline: +23% +29%• Diesel: +27% +25%
1700
2300
2900
3500
1Q08 2Q08 3Q08 4Q08 1Q09 2Q09 3Q09 4Q09
peso
s/m
3
Regular gasoline Diesel
500
600
700
800
900
1Q08 2Q08 3Q08 4Q08 1Q09 2Q09 3Q09 4Q09
us$/
m3
Local Currency US$
10
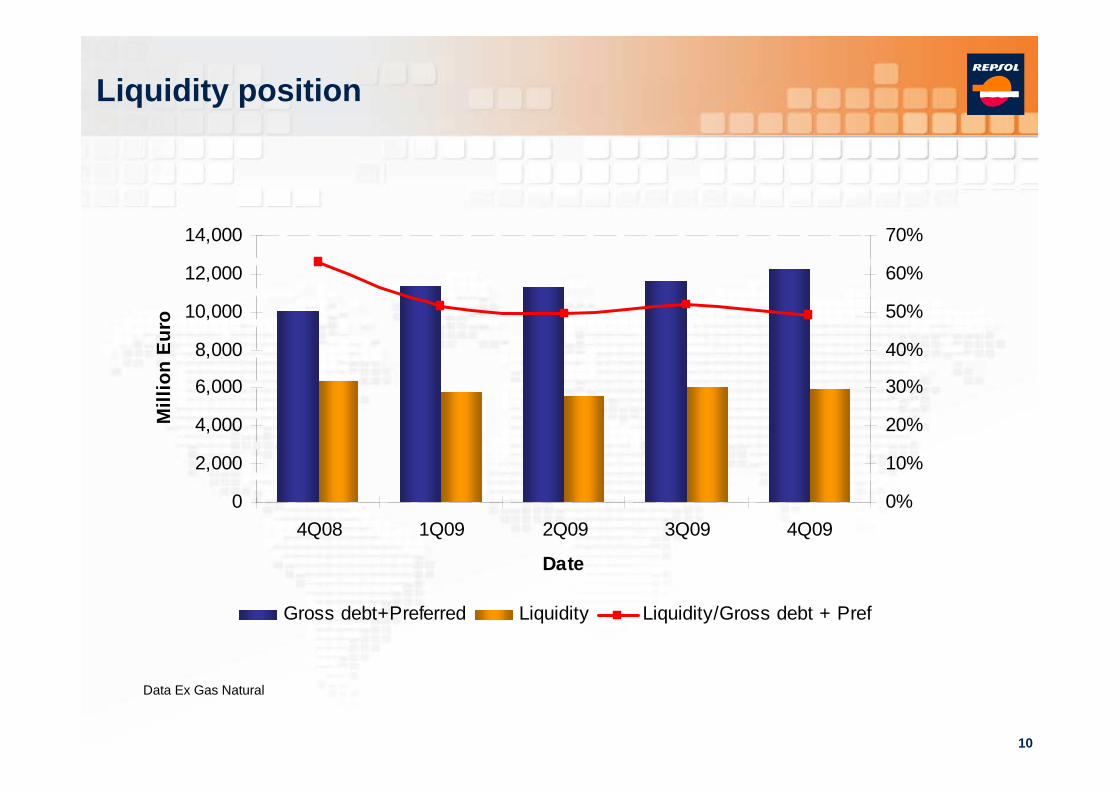
Liquidity position
Data Ex Gas Natural
0
2,000
4,000
6,000
8,000
10,000
12,000
14,000
4Q08 1Q09 2Q09 3Q09 4Q09
Date
Mill
ion
Euro
0%
10%
20%
30%
40%
50%
60%
70%
Gross debt+Preferred Liquidity Liquidity/Gross debt + Pref

11
Savings Plan
EXPENSES
800 M€ LESS THAN 2008 (1)
Number of measures: 1,190
(1) 12M cummulative on a like-for-like basis
Upstream14%
LNG1%
Downstream33%
YPF41%
Corporation11%
Personnel9%
Trading & Transport
11%
Other16%
External Services
64%
12
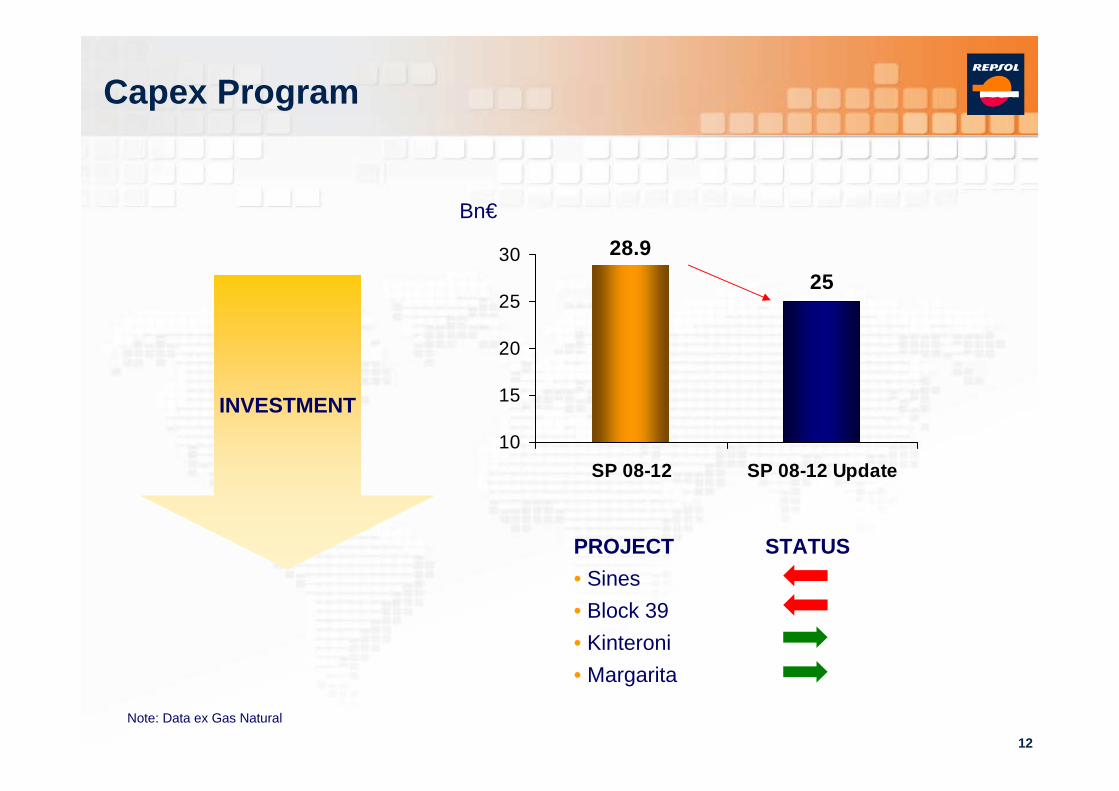
Capex Program
INVESTMENT
28.925
10
15
20
25
30
SP 08-12 SP 08-12 Update
Bn€
Note: Data ex Gas Natural
PROJECT STATUS• Sines• Block 39• Kinteroni• Margarita

13
Macro Situation
Main Developments
Status Key Growth Projects
4th Q 2009 and Annual Results
Financial Overview
2010 Perspectives
Agenda

14
Year 2009 Main Developments

15
1
1
5
1
25
2
1Morocco- Anchois 1
Brazil (*)
- Guara- Iguazu- Piracuca- Panoramix- Abaré Oeste
3
1
Bolivia- Huacaya X1
1
Algeria- AZSE-2- TIO-3 (Reggane)- KLS-1 (Reggane)- OTLH-2 (Ahnet)- TGFO-1 (Ahnet)
Sierra Leone- Venus B-1
Spain- Lubina- Montanazo
Peru- Kinteroni(bloque 57)
Colombia- Cosecha Z- Cosecha Y Norte- Capachos Sur 1
Venezuela- Perla 1 (Cardon-IV)
US GoM- Buckskin
20082009
Libya- Y1 (NC 186)- NC-202 (Barracuda)
Main DevelopmentsExploratory successes: 8 in 2008 and 15 in 2009
Success rate in 2008(*): 26%Success rate in 2009(*): 50%(*) appraisals not included
16
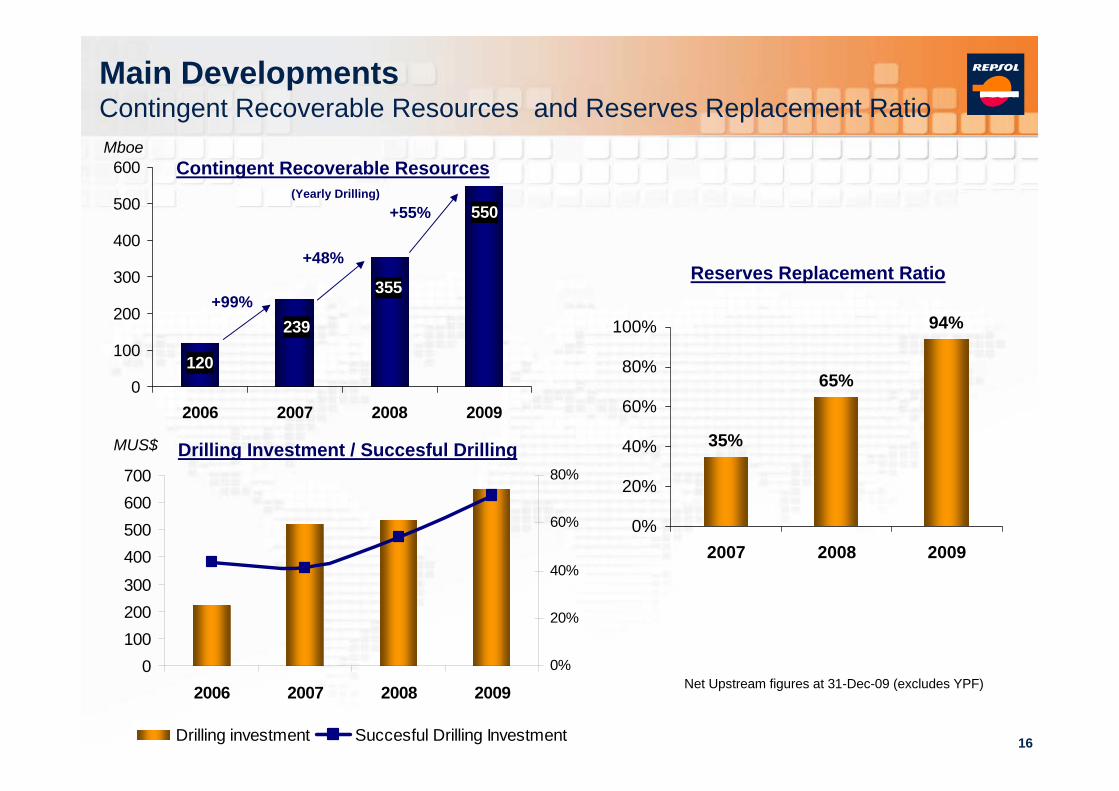
Main DevelopmentsContingent Recoverable Resources and Reserves Replacement Ratio
550
355
239
1200
100
200
300
400
500
600
2006 2007 2008 2009
+99%
+48%
+55%
Contingent Recoverable Resources(Yearly Drilling)
Mboe
35%
65%
94%
0%
20%
40%
60%
80%
100%
2007 2008 2009
Reserves Replacement Ratio
Net Upstream figures at 31-Dec-09 (excludes YPF)0
100200300
400500600700
2006 2007 2008 20090%
20%
40%
60%
80%
Drilling investment Succesful Drilling Investment
MUS$ Drilling Investment / Succesful Drilling
17
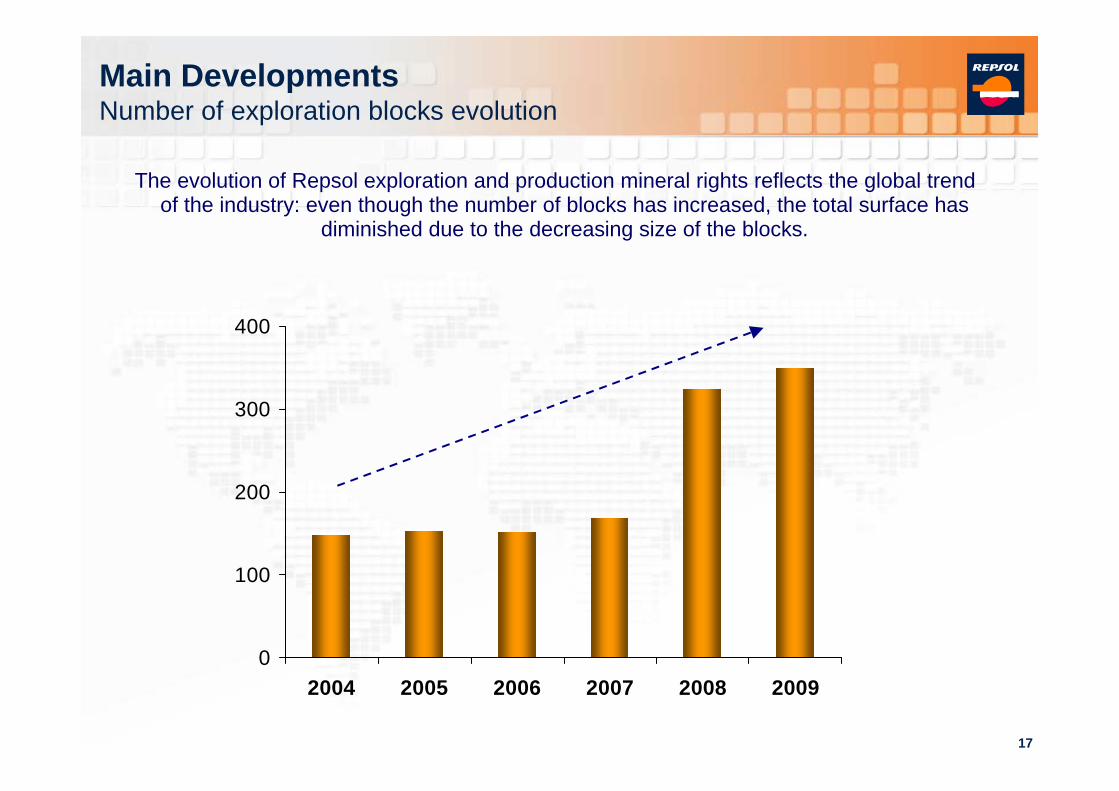
Main DevelopmentsNumber of exploration blocks evolution
The evolution of Repsol exploration and production mineral rights reflects the global trend of the industry: even though the number of blocks has increased, the total surface has
diminished due to the decreasing size of the blocks.
0
100
200
300
400
2004 2005 2006 2007 2008 2009
18
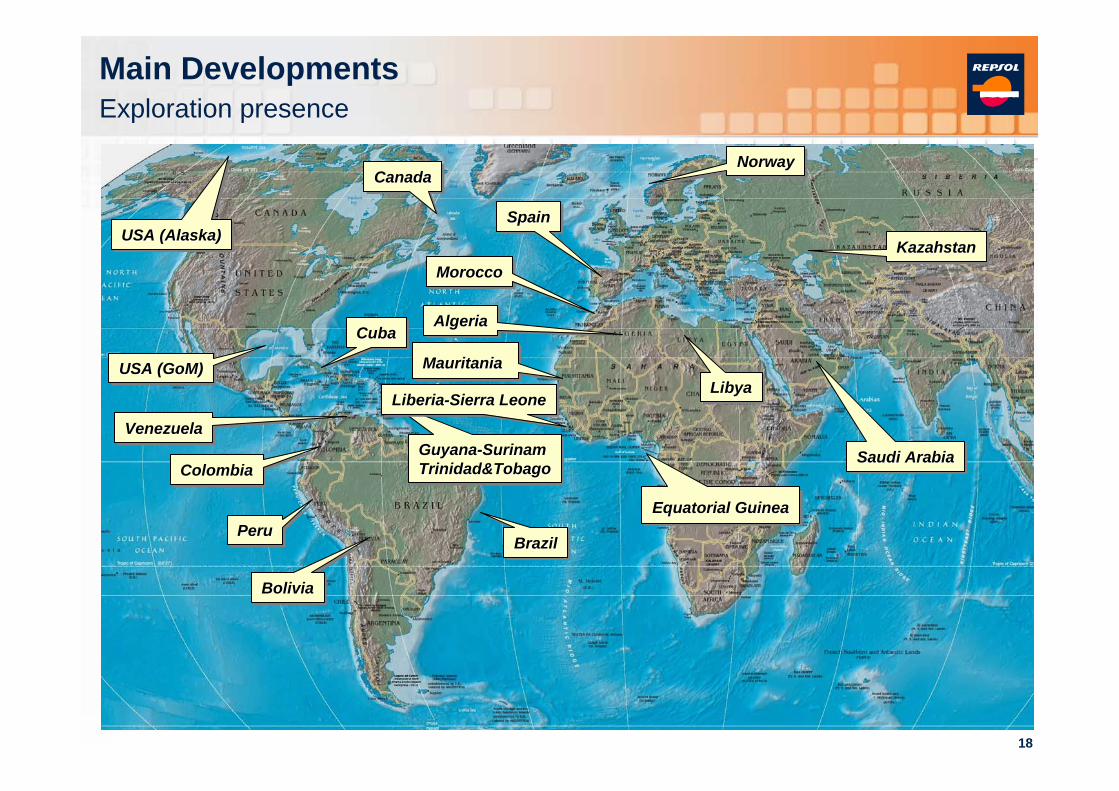
ColombiaColombiaColombia
PeruPeruPeru
SpainSpainSpain
MoroccoMoroccoMorocco
AlgeriaAlgeriaAlgeria
VenezuelaVenezuelaVenezuela
Equatorial GuineaEquatorialEquatorial GuineaGuinea
MauritaniaMauritaniaMauritania
BrazilBrazilBrazil
Saudi ArabiaSaudi ArabiaSaudi Arabia
BoliviaBoliviaBolivia
CanadaCanadaCanada
USA (Alaska)USA (Alaska)USA (Alaska)
USA (GoM)USA (USA (GoMGoM))
CubaCubaCuba
Guyana-SurinamTrinidad&TobagoGuyanaGuyana--SurinamSurinamTrinidad&TobagoTrinidad&Tobago
KazahstanKazahstanKazahstan
Liberia-Sierra LeoneLiberiaLiberia--Sierra LeoneSierra Leone
NorwayNorwayNorway
LibyaLibyaLibya
Main DevelopmentsExploration presence

19
330 349
0
100
200
300
400
4Q08 4Q09
kboed
Note: All figures exclude Argentina
+ 5.8%
333 334
0
100
200
300
400
2008 2009
+ 5.4%
kboed
2008 Production Mix
62%38%
2009 Production Mix
60%40%
Liquids Gas
Main DevelopmentsProduction growth
(*) Impact on production due to contractual and regulatory changes in Libya, Bolivia and Ecuador
(*)
4T08 Production Mix
62%38%
4T09 Production Mix
57%43%
Year Quarter

20
Macro Situation
Main Developments
Status Key Growth Projects
4th Q 2009 and Annual Results
Financial Overview
2010 Perspectives
Agenda
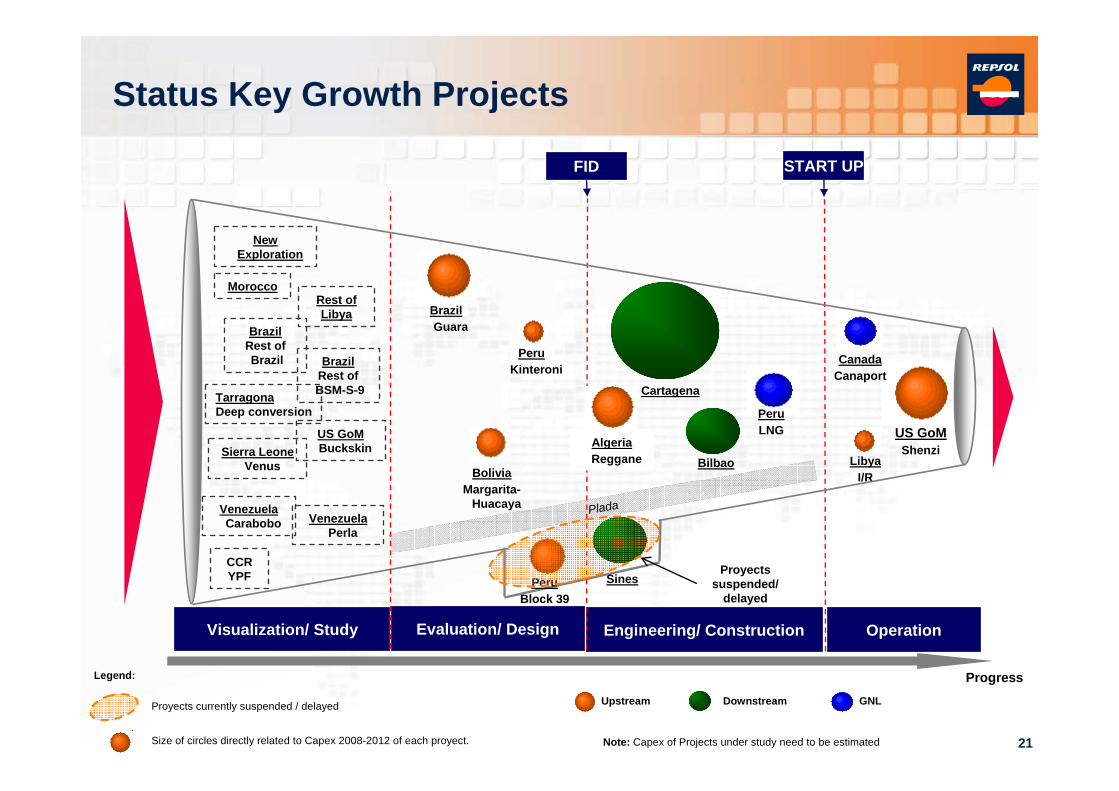
21
Plada
Visualization/ Study OperationEngineering/ ConstructionEvaluation/ Design
FID START UP
BrazilGuara
AlgeriaReggane
PeruKinteroni
BoliviaMargarita-
Huacaya
PeruBlock 39
Sines
Cartagena
Bilbao
PeruLNG
CanadaCanaport
LibyaI/R
US GoMShenzi
Progress
Proyectssuspended/
delayed
US GoMBuckskinSierra Leone
Venus
Rest ofLibya
BrazilRest ofBSM-S-9
VenezuelaPerla
CCRYPF
Proyects currently suspended / delayed
Size of circles directly related to Capex 2008-2012 of each proyect.
Legend:
Note: Capex of Projects under study need to be estimated
Upstream Downstream GNL
Morocco
TarragonaDeep conversion
VenezuelaCarabobo
Status Key Growth Projects
NewExploration
BrazilRest ofBrazil

22
Macro Situation
Main Developments
Status Key Growth Projects
4th Q 2009 and Annual Results
Financial Overview
2010 Perspectives
Agenda

23
2009 Results

24
ResultsCCS Adjusted Operating Income
2761
5440
0
1000
2000
3000
4000
5000
6000
FY 08 FY 09
- 49%
Million €
7501020
0
1000
2000
4Q 08 4Q 09
- 26%
Million €
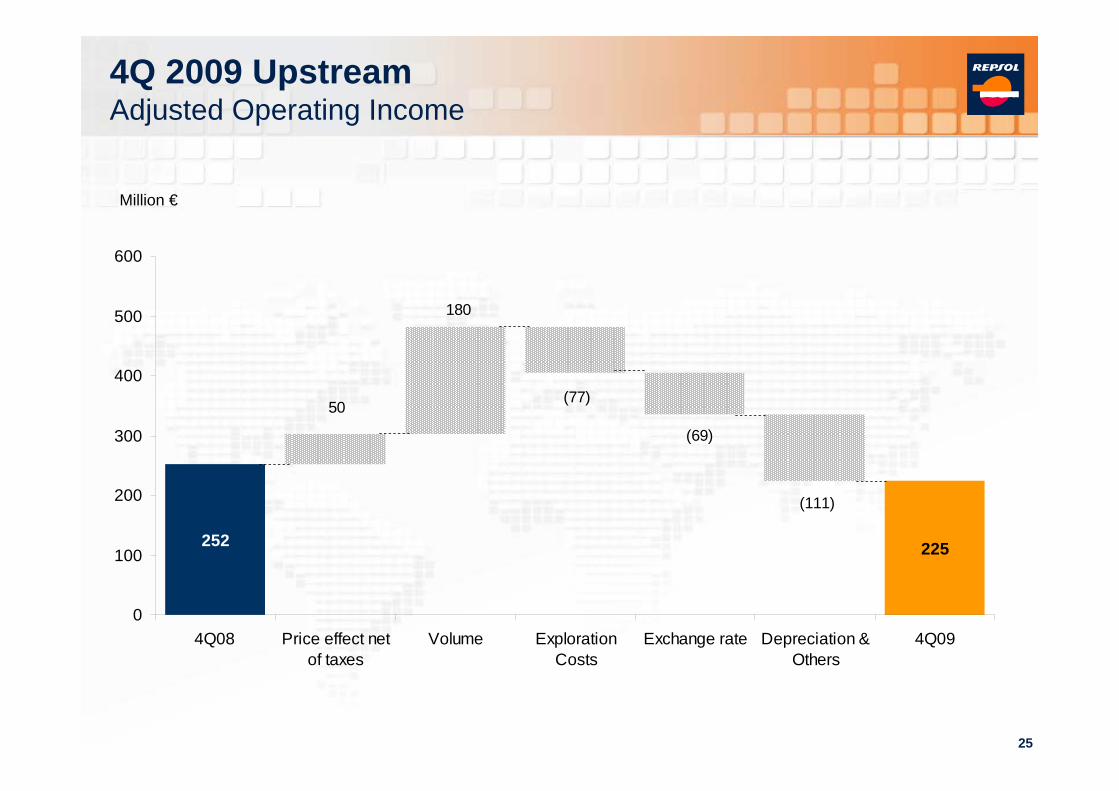
25
252
50
225
180
(111)
(77)
(69)
0
100
200
300
400
500
600
4Q08 Price effect netof taxes
Volume ExplorationCosts
Exchange rate Depreciation &Others
4Q09
4Q 2009 UpstreamAdjusted Operating Income
Million €

26
2227
86
884
94
99
(1661)
41
0
500
1000
1500
2000
2500
2008 Price effectnet of taxes
Volume ExplorationCosts
Exchangerate
Depreciation& Others
2009
2009 Results UpstreamAdjusted Operating Income
Million €
27
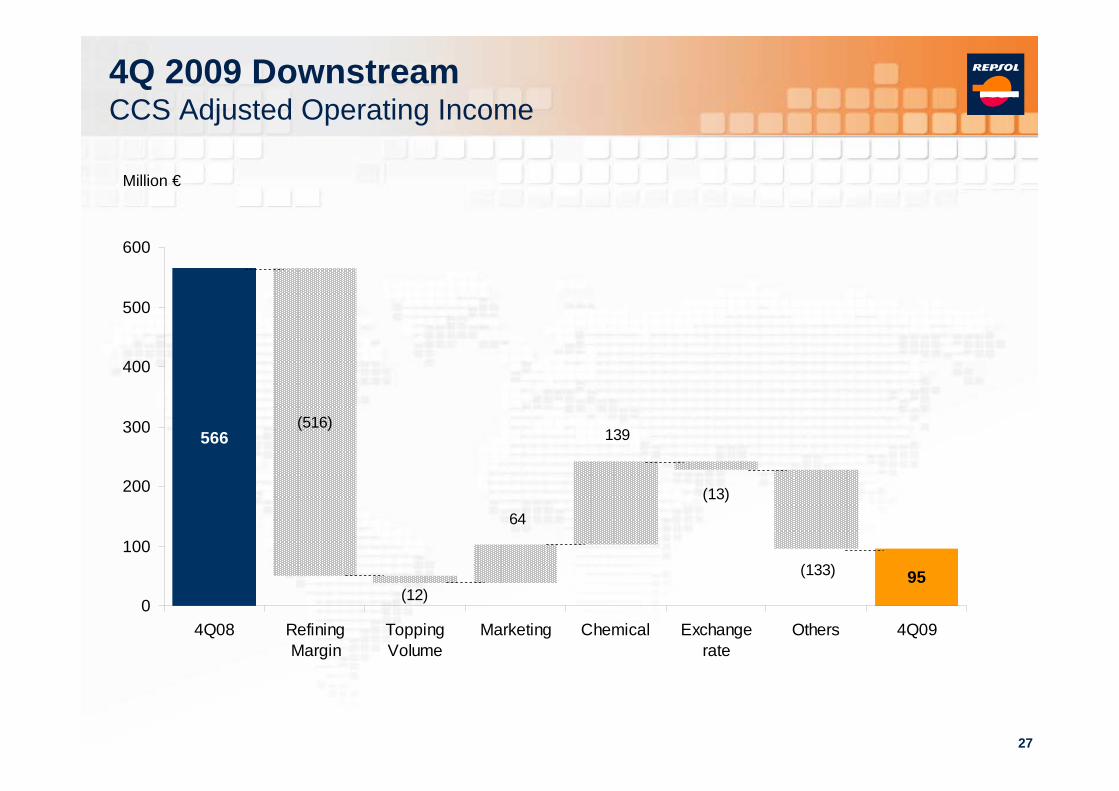
566
95
139
64
(133)
(13)
(12)
(516)
0
100
200
300
400
500
600
4Q08 RefiningMargin
ToppingVolume
Marketing Chemical Exchangerate
Others 4Q09
4Q 2009 DownstreamCCS Adjusted Operating Income
Million €
28
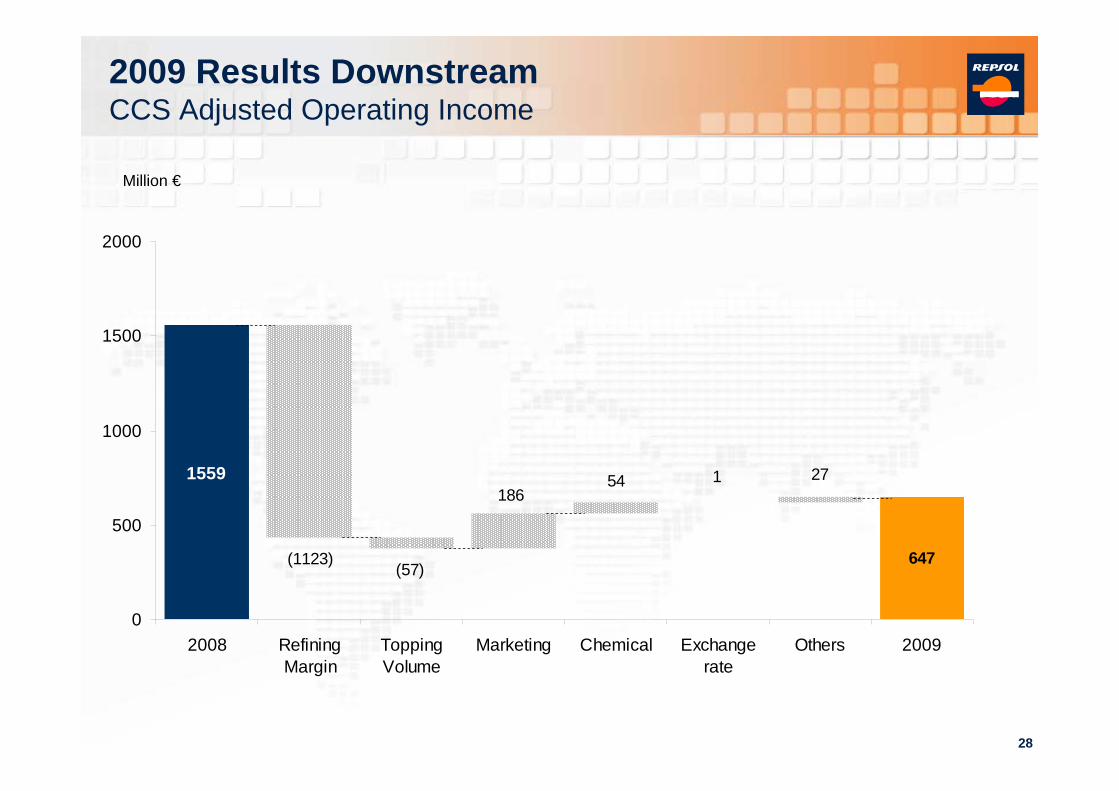
1559
647
2754 1186
(57)(1123)
0
500
1000
1500
2000
2008 RefiningMargin
ToppingVolume
Marketing Chemical Exchangerate
Others 2009
2009 Results DownstreamCCS Adjusted Operating Income
Million €

29
131
4993
141
331(83)
106
(104) (2)
0
100
200
300
400
4Q08 Priceincreases in
domesticmarkets
Export prices& internationalprice relatedproducts net
of taxes
Volume sales Gas Costs Depreciation Others 4Q09
4Q 2009 YPFAdjusted Operating Income
Million €

30
1317
789
93
24378
26
(228)
(565)
(175)
0
500
1000
1500
2008 Price increasesin domestic
markets
Export prices &internationalprice related
products net oftaxes
Volume sales Gas Costs Depreciation Others 2009
2009 Results YPFAdjusted Operating Income
Million €
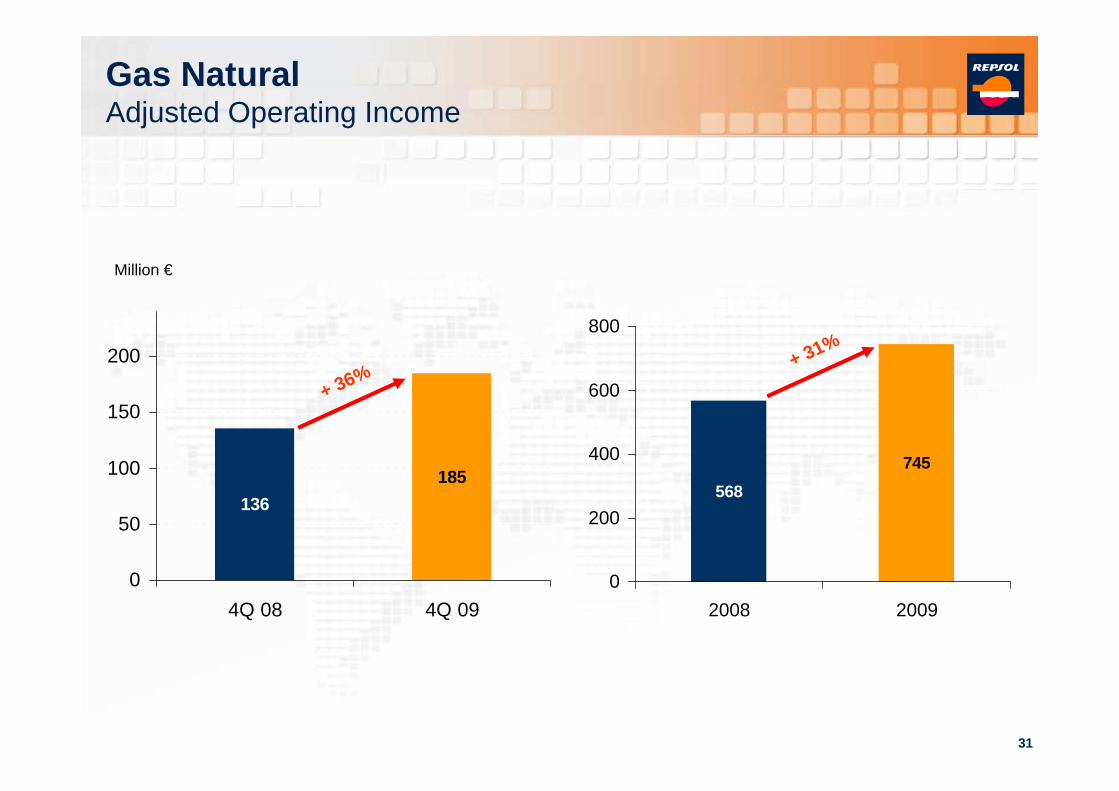
31
136185
0
50
100
150
200
4Q 08 4Q 09
+ 36%
Million €
Gas NaturalAdjusted Operating Income
568745
0
200
400
600
800
2008 2009
+ 31%
32
Macro Situation
Main Developments
Status Key Growth Projects
4th Q 2009 and Annual Results
Financial Overview
2010 Perspectives
Agenda

33
Financial OverviewCredit metrics overview
Million Euro
NET DEBT
NET DEBT / CAPITAL EMPLOYED (%)
CAPITAL EMPLOYED
EBITDA
EBITDA / NET DEBT
EBITDA / NET INTEREST + DIVIDENDS PREFERRED
NET INTEREST
NET INTEREST + DIVIDENDS PREFERRED SHARES
EBITDA / NET INTEREST
7.7%
2,030
26,434
7,273
3.6
21.1
136
345
53.5
16.7%
4,905
29,346
5,517
1.1
15.1
231
31 Dic 09(Ex Gas Nat.)
366
23.9
31 Dic 08(Ex Gas Nat.)

34
0
1000
2000
3000
4000
2010 2011 2012
REPSOL YPF GAS NATURAL
M€
Financial OverviewMaturities as of December 2009
35
Macro Situation
Main Developments
Status Key Growth Projects
4th Q 2009 and Annual Results
Financial Overview
2010 Perspectives
Agenda
36
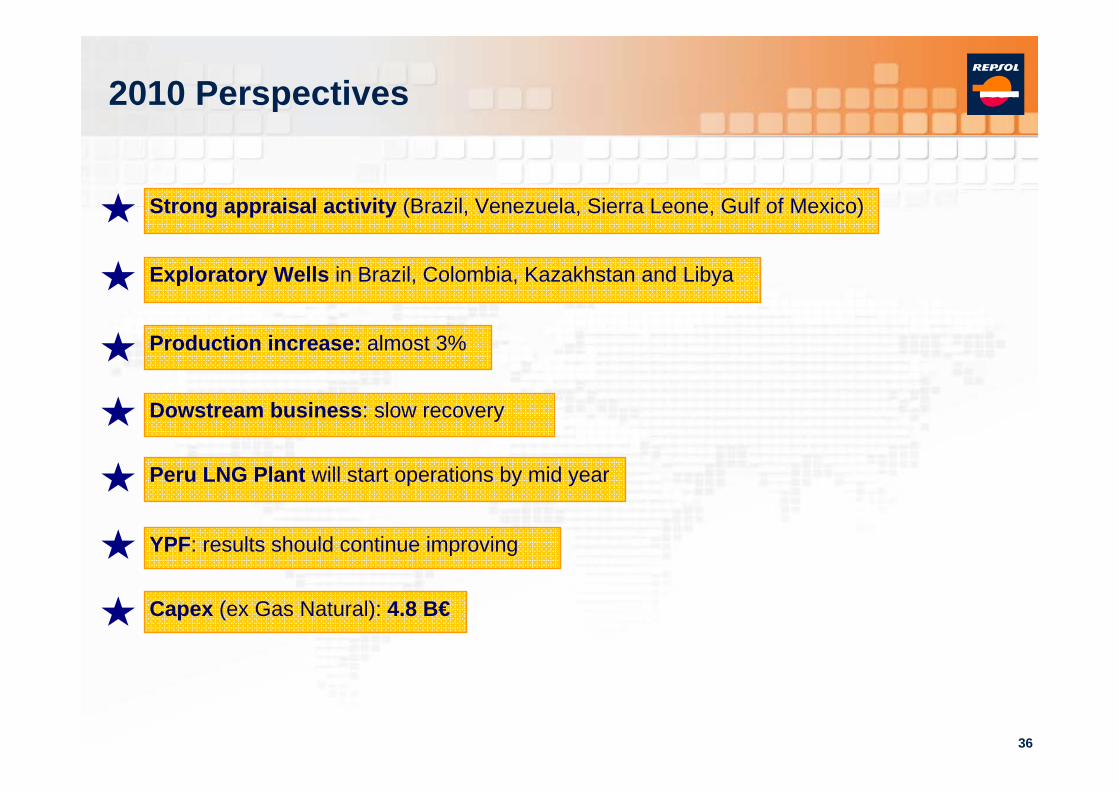
2010 Perspectives
Strong appraisal activity (Brazil, Venezuela, Sierra Leone, Gulf of Mexico)
Exploratory Wells in Brazil, Colombia, Kazakhstan and Libya
Production increase: almost 3%
Dowstream business: slow recovery
Peru LNG Plant will start operations by mid year
YPF: results should continue improving
Capex (ex Gas Natural): 4.8 B€
Repsol YPFFourth Quarter 2010 Preliminary Results
February 2010
WEBCAST – CONFERENCE CALLFebruary 25th, 2010
Antonio BrufauCEO
Antonio BrufauCEO


