REPUBLIC OF CHINA The Petrochemical Industry of Taiwan, ROC 2014 Global Economic Outlook Global economy activity strengthened during the second half of 2013 and is expected to improve further in 2014-15. Global growth is now projected to be slightly higher in 2014, at around 3.7 %, rising to 3.9 % in 2015. Amid this, the advanced economies continue to recover except Euro area. The United States is expected to grow at 2.8 % in 2014, but the growth in Euro area under 1 %.The developing economies are expected to increase to 5.1 percent in 2014 and to 5.4 percent in 2015. Growth in China rebounded strongly in the second half of 2013, due largely to an acceleration in investment. This surge is expected to slow down, in part because of policy measures aimed at slowing credit growth and raising the cost of capital. Growth is thus expected to moderate around 7 % in 2014, as illustrated in table 1. Table 1. Economic Growth Rate (%) in Selected Regions & Countries Source : IMF 2012 2013 2014(EST) 2015(EST) 2016(EST) 2017(EST) World 3.37 3.28 3.7 3.85 4.04 4.07 USA 2.32 2.22 2.8 3.09 3.03 2.95 Euro Area -0.66 -0.43 0.83 1.35 1.7 1.71 Japan 1.46 1.52 0.89 0.83 0.84 0.91 China 7.65 7.7 7.38 7.09 6.84 6.63 Taiwan 1.48 2.09 3.49 3.84 4.18 4.35 India 4.74 5.02 5.63 6.35 6.46 6.63
Transcript
REPUBLIC OF CHINA The Petrochemical Industry of Taiwan, ROC
2014 Global Economic Outlook Global economy activity strengthened during the second half of 2013 and is expected to improve further in 2014-15. Global growth is now projected to be slightly higher in 2014, at around 3.7 %, rising to 3.9 % in 2015. Amid this, the advanced economies continue to recover except Euro area. The United States is expected to grow at 2.8 % in 2014, but the growth in Euro area under 1 %.The developing economies are expected to increase to 5.1 percent in 2014 and to 5.4 percent in 2015. Growth in China rebounded strongly in the second half of 2013, due largely to an acceleration in investment. This surge is expected to slow down, in part because of policy measures aimed at slowing credit growth and raising the cost of capital. Growth is thus expected to moderate around 7 % in 2014, as illustrated in table 1.
Table 1. Economic Growth Rate (%) in Selected Regions & Countries
Source : IMF
2012 2013 2014(EST) 2015(EST) 2016(EST) 2017(EST) World 3.37 3.28 3.7 3.85 4.04 4.07 USA 2.32 2.22 2.8 3.09 3.03 2.95 Euro Area -0.66 -0.43 0.83 1.35 1.7 1.71 Japan 1.46 1.52 0.89 0.83 0.84 0.91 China 7.65 7.7 7.38 7.09 6.84 6.63 Taiwan 1.48 2.09 3.49 3.84 4.18 4.35 India 4.74 5.02 5.63 6.35 6.46 6.63
Taiwan Economic and petrochemical industry Outlook Economic figures showed Taiwan GDP growth in 2014isexpected to speed up to 3.49%. As the global economy is heading to recovery, Taiwan is forecast to grow 3.84 % in 2015, as shown in Figure 1. Consumer Price Index (CPI) increased 1.19 % in 2014 but Whole- sale price index (WPI) decreased 0.1 % due to energy price plunged. Even though global economycontinues to growbut Inflation pressure will be contained because oil price drops continuously.
1.482.09
3.493.84
4.18 4.35
0
1
2
3
4
5
2012 2013 2014(EST) 2015(EST) 2016(EST) 2017(EST)
Fig 1 Taiwan's Economic GrowthGDP Growth Rate, %
Year
2014 Taiwan petrochemical industry production values increased to 67.3 billion dollars as global economic recovery stimulated petrochemical demand. But CPC No.5 cracker shutdown unexpectedly in Q2 and Kaohsiung gas explosion accident happened in Q3, as well as global oil prices fell synchronized downturn in petrochemicals and other factors, which made our 2014 petrochemical output value of only modest growth, as shown in Figure 2.
The 2014 Petrochemical Industry Situations in Taiwan Overview The production of six basic raw materials and twenty four major petrochemical intermediates totaled 28,746,671 metric tons, andecrease of 1.1% over the previous year, according to PIAT statistics, as indicated in Table 2. The decrease of production
Fig 2 Production Contribution of Petrochemicals in TaiwanBillion USD
Year
value and volume was a result of CPC No.5 cracker shutdown unexpectedly and FPCC No.3 cracker turnaround in Q3. The total import was down by 5.9 % whereas the total demandwas down2.6 % in 2014, compared with 2013.
Table 2. Supply and Demand for Major Petrochemicals in Taiwan
2013 2014 Growth
Basic Material
Production 11,798,593 12,237,015 3.7%
Import 3,039,169 2,531,824 -16.7%
Export 2,621,066 2,976,383 13.6%
Demand 12,216,696 11,792,456 -3.5%
Intermediates
Production 17,267,064 16,509,656 -4.4%
Import 3,341,021 3,470,466 3.9%
Export 8,190,882 7,769,443 -5.1%
Demand 12,417,203 12,210,679 -1.7%
Total
Production 29,065,657 28,746,671 -1.1%
Import 6,380,190 6,002,290 -5.9%
Export 10,811,948 10,745,826 -0.6%
Demand 24,633,899 24,003,135 -2.6%
Demand= Production+ Import- Export Unit: Metric ton
While Taiwan’s downstream derivative producers and converters have invested heavily in China for almost two decades, the Taiwan government has long restricted the investment in upstream in China. This policy was lifted in January, 2014. Gulei petrochemical project planned in Fujian Province of China is the first one that has been approved by Taiwan Government. Initially they are fully integrated from refinery through naphtha cracker to downstream plants. But now they have gave up refinery investment and separate the naphtha cracker into two sectors,one is naphtha feed, the other is methanol feed.
Basic Raw materials The supply & demand statistics for petrochemical basic raw materials is illustrated in Table 3. The production of ethylene、
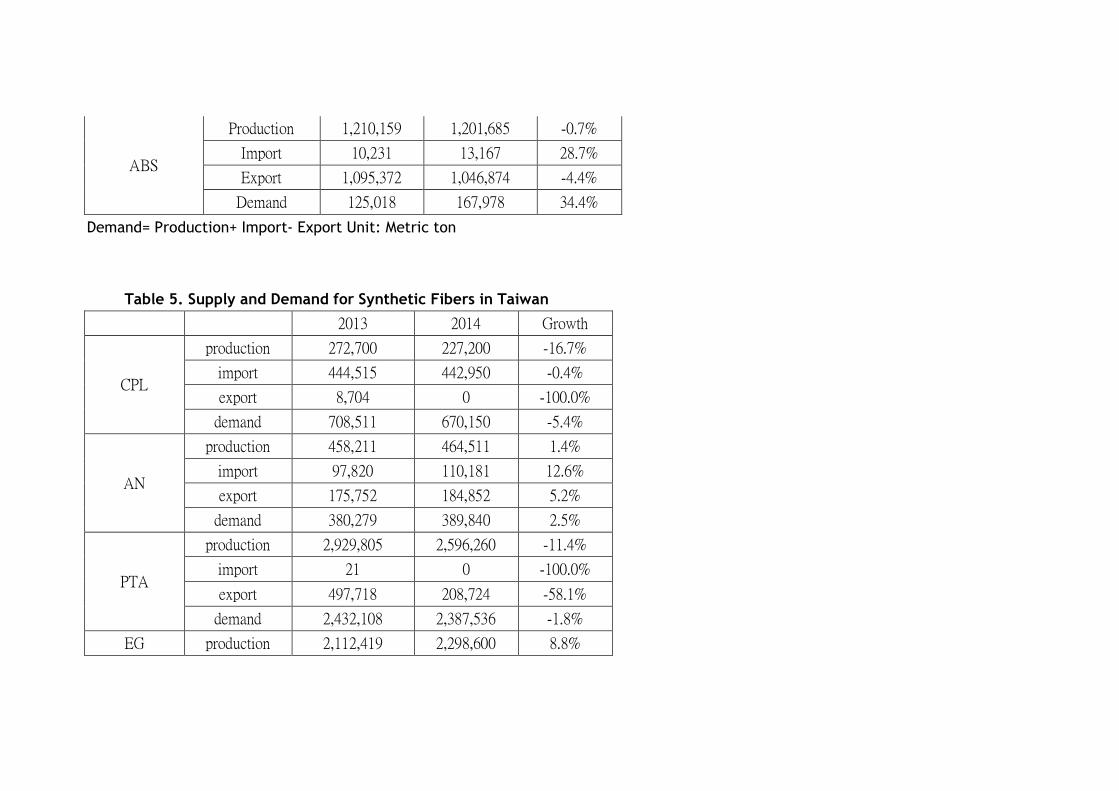
propylene、butadiene、benzene、toluene, all increased to certain extents in 2014 except that of xylenes with a minor setback. The imports of ethylene, propylene,butadiene, toluene and xylenes declined while imports of benzene grew. Exports of ethylene, propylene, butadiene, benzene and toluene increased in 2014, compared with 2013, however export of xylene receded. The apparent domestic demands for all basic raw materials registered positive growth for ethylene, butadiene and benzene in 2014, negative growth for propylene, toluene and xylenes. Taiwan became a net exporter for all basic raw materials except for butadiene and benzene. Petrochemical Intermediates Table 2 also indicates the supply & demand of 24 petrochemical intermediates in 2013&2014. The production and export all decreased to certain extent in 2014, mainly attributed to CPL &PTA. Synthetic Resins or Plastics The supply & demand statistics for plastics are summarized in Table 4. The production of six commodity plastics all showed negative growth in 2014 over the previous year. Raw materials for Synthetic Fibers Supply & demand balance of materials for synthetic fibers is depicted in Table 5. Materials AN/MEG showed positive sign in production/export in 2014. CPL continued to be in far short supply in 2013/2014 and relied heavily on import. Due to PTA
substantial expansion projects in China within the past two years and import tax difference between Taiwan & ASEAN made Taiwan PTA producers slashed production/export volume in 2013/2014. Synthetic Rubbers Table 6 summarized supply & demand for synthetic rubbers in 2013/ 2014. In 2014, the production of SBR amounted to 97,945 MT, up by 13.8% over the previous year and the production of BR increased 6.4% to 63,540 MT. Domestic demand of SBR increased by 6.6% and that of BR shrank to a larger extent of 83.2%.
Table 3. Supply and Demand for Basic Petrochemicals in Taiwan
2013 2014 Growth
Ethylene
Production 3,925,325 4,182,340 6.5%
Import 254,440 130,877 -48.6%
Export 193,643 199,211 2.9%
Demand 3,986,122 4,114,006 3.2%
Propylene
Production 3,047,400 3,237,323 6.2%
Import 245,872 144,305 -41.3%
Export 522,271 829,598 58.8%
Demand 2,771,001 2,552,030 -7.9%
Butadiene
Production 545,953 585,097 7.2%
Import 128,426 127,705 -0.6%
Export 92,225 107,787 16.9%
Demand 582,154 605,015 3.9%
Benzene
Production 1,725,922 1,793,826 3.9%
Import 708,956 760,183 7.2%
Export 0 68,000
Demand 2,434,878 2,486,009 2.1%
Toluene
Production 76,019 285,659 275.8%
Import 372,106 241,307 -35.2%
Export 69,227 281,620 306.8%
Demand 378,898 245,346 -35.2%
Xylene
Production 2,477,974 2,152,770 -13.1%
Import 1,329,369 1,127,447 -15.2%
Export 1,743,700 1,490,167 -14.5%
Demand 2,063,643 1,790,050 -13.3%
Total
Production 11,798,593 12,237,015 3.7%
Import 3,039,169 2,531,824 -16.7%
Export 2,621,066 2,976,383 13.6%
Demand 12,216,696 11,792,456 -3.5%
Demand= Production+ Import- Export Unit: Metric ton
Table 4. Supply and Demand for Plastics in Taiwan
2013 2014 Growth
LDPE/LLLD/EVA
Production 588,571 576,133 -2.1%
Import 271,777 290,637 6.9%
Export 464,458 416,823 -10.3%
Demand 395,890 449,947 13.7%
HDPE
Production 560,121 524,555 -6.3%
Import 76,987 78,261 1.7%
Export 329,079 303,446 -7.8%
Demand 308,029 299,370 -2.8%
PVC
Production 1,621,111 1,514,893 -6.6%
Import 22,522 26,643 18.3%
Export 1,068,876 975,206 -8.8%
Demand 574,757 566,330 -1.5%
PP
Production 1,208,987 1,042,198 -13.8%
Import 154,331 175,081 13.4%
Export 790,067 660,063 -16.5%
Demand 573,251 557,216 -2.8%
PS
Production 828,031 775,078 -6.4%
Import 8,508 7,743 -9.0%
Export 760,927 723,916 -4.9%
Demand 75,612 58,905 -22.1%
ABS
Production 1,210,159 1,201,685 -0.7%
Import 10,231 13,167 28.7%
Export 1,095,372 1,046,874 -4.4%
Demand 125,018 167,978 34.4%
Demand= Production+ Import- Export Unit: Metric ton
Table 5. Supply and Demand for Synthetic Fibers in Taiwan
2013 2014 Growth
CPL
production 272,700 227,200 -16.7%
import 444,515 442,950 -0.4%
export 8,704 0 -100.0%
demand 708,511 670,150 -5.4%
AN
production 458,211 464,511 1.4%
import 97,820 110,181 12.6%
export 175,752 184,852 5.2%
demand 380,279 389,840 2.5%
PTA
production 2,929,805 2,596,260 -11.4%
import 21 0 -100.0%
export 497,718 208,724 -58.1%
demand 2,432,108 2,387,536 -1.8%
EG production 2,112,419 2,298,600 8.8%
import 311,130 204,556 -34.3%
export 1,323,431 1,482,794 12.0%
demand 1,100,118 1,020,362 -7.2%
Demand= Production+ Import- Export Unit: Metric ton
Table 6. Supply and Demand for Synthetic Rubbers
2013 2014 Growth
SBR
production 86,076 97,945 13.8%
import 48,485 38,377 -20.8%
export 67,647 64,969 -4.0%
demand 66,914 71,353 6.6%
BR
production 59,705 63,540 6.4%
import 29,415 27,276 -7.3%
export 73,442 88,185 20.1%
demand 15,678 2,631 -83.2%
CB
production 90,378 93,163 3.1%
import 69,851 81,544 16.7%
export 37,006 40,338 9.0%
demand 123,223 134,369 9.0%
Demand= Production+ Import- Export Unit: Metric ton
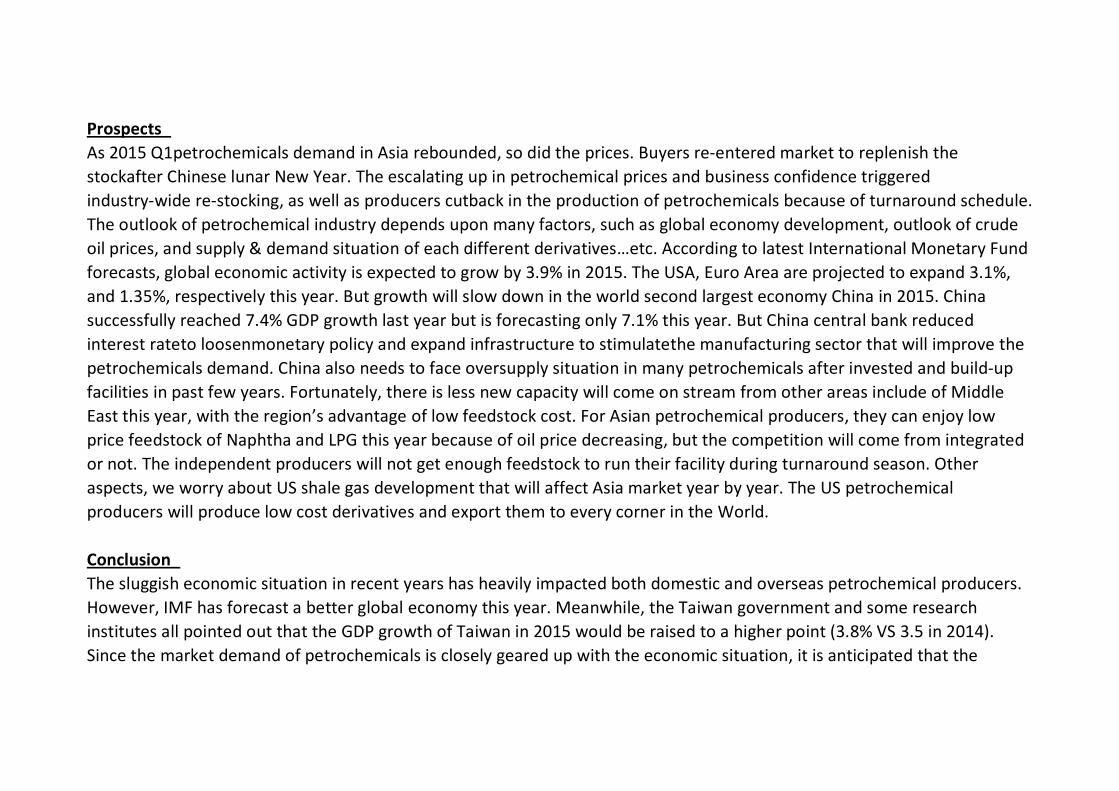
Prospects As 2015 Q1petrochemicals demand in Asia rebounded, so did the prices. Buyers re-entered market to replenish the stockafter Chinese lunar New Year. The escalating up in petrochemical prices and business confidence triggered industry-wide re-stocking, as well as producers cutback in the production of petrochemicals because of turnaround schedule. The outlook of petrochemical industry depends upon many factors, such as global economy development, outlook of crude oil prices, and supply & demand situation of each different derivatives…etc. According to latest International Monetary Fund forecasts, global economic activity is expected to grow by 3.9% in 2015. The USA, Euro Area are projected to expand 3.1%, and 1.35%, respectively this year. But growth will slow down in the world second largest economy China in 2015. China successfully reached 7.4% GDP growth last year but is forecasting only 7.1% this year. But China central bank reduced interest rateto loosenmonetary policy and expand infrastructure to stimulatethe manufacturing sector that will improve the petrochemicals demand. China also needs to face oversupply situation in many petrochemicals after invested and build-up facilities in past few years. Fortunately, there is less new capacity will come on stream from other areas include of Middle East this year, with the region’s advantage of low feedstock cost. For Asian petrochemical producers, they can enjoy low price feedstock of Naphtha and LPG this year because of oil price decreasing, but the competition will come from integrated or not. The independent producers will not get enough feedstock to run their facility during turnaround season. Other aspects, we worry about US shale gas development that will affect Asia market year by year. The US petrochemical producers will produce low cost derivatives and export them to every corner in the World.
Conclusion The sluggish economic situation in recent years has heavily impacted both domestic and overseas petrochemical producers. However, IMF has forecast a better global economy this year. Meanwhile, the Taiwan government and some research institutes all pointed out that the GDP growth of Taiwan in 2015 would be raised to a higher point (3.8% VS 3.5 in 2014). Since the market demand of petrochemicals is closely geared up with the economic situation, it is anticipated that the
general performance of the petrochemical industry of Taiwan will benefit to some extent in 2015 and upcoming 2 to 3 years.
The year of 2015 should be a better year for the petrochemical industry worldwide as a whole, as oil price decrease, all petrochemical producers will make money due to low cost feedstock. Demand will grow in line with a recovery in global GDP, although the recovery varies by geographic regions. Butthere is no powerful engine to support a strong upturn in petrochemical demand, the pace of improvement might be moderate this year, largely driven by domestic demand in many emerging and developing countries. China, with its huge and growing demand for petrochemicals, will remain the single most influential factor in determining the outlook of Asian petrochemical. With more and more new capacities coming on stream, as mentioned above, China is going to change its position from a net importer to a net exporter in different derivatives (PTA、SBR、CPL…etc.) The re-rise of the USA (shale gas), as the world’s new production base for petrochemicals will surely changing this industry landscape. The competition for Asian petrochemical producers in coming years will be fierce under a surplus scenario. Flexible feedstock slates, upgraded production facilities and integrated local utilities/logistics to minimize production cost, will be major factors to survive for Asian petrochemical producers.
TAIWAN, REPUBLIC OF CHINA
General Matters& Raw Materials Committee
1. Olefins (Ethylene , Propylene , Butadiene )
ITEM:Ethylene Unit:MT
Year 2011 2012 2013 2014 2015(est) Supply
Production 3,522,138 3,478,448 2,925,325 4,182,340 4,200,000 Import 373,205 348,415 254,440 130,877 220,000 Total 3,895,343 3,826,863 4,179,765 4,313,217 4,420,000
2014 Review July 31 , 2014 will be remembered as the worst day ever in Taiwan Petro- chemical Industry . 32 people lost their lives and 321 people injured due to human errors which caused a major propylene explosion in Chien -Cheng district of Kaohsiung City. Several pipelines, including Ethylene & Propylene, were terminated by local Government immediately. Finger-pointing & blame games are still underway between Central & Local Government but from local people’s point of view how to take
action to ensure tragedies like this never happen again is most important of all . Reclaiming land from the sea adjacent to Kaohsiung Harbor and build a new grass root petrochemical complex seems to be a better solution. Total production of ethylene last year in Taiwan was 4,182,140 MT, a growth of 6.55 % than previous year. The increase was attributed to CPC Taiwan New No.3 naphtha cracker commercial running since Q4 2013. However, the increase was lower than expected due to CPC Taiwan No.5 cracker shutdown from middle July of 2014. Imports were down quite a lot due to increased self-sufficiency and nose-dive of crude oil in H2 2014. While export was up 2.88% , reached an all time high of 199,211 MT . 2015Prospect Though fair to middling by 1H Feb., market got much better after Chinese Lunar New Year. Players do believe to see strong rebounding from March due to heavy maintenance of crackers in NEA and expect to come to a long way from H2 of this year . Taiwan Government latest forecasts GDP growth of 3.78% this year will certainly contribute recovery of petrochemical business .
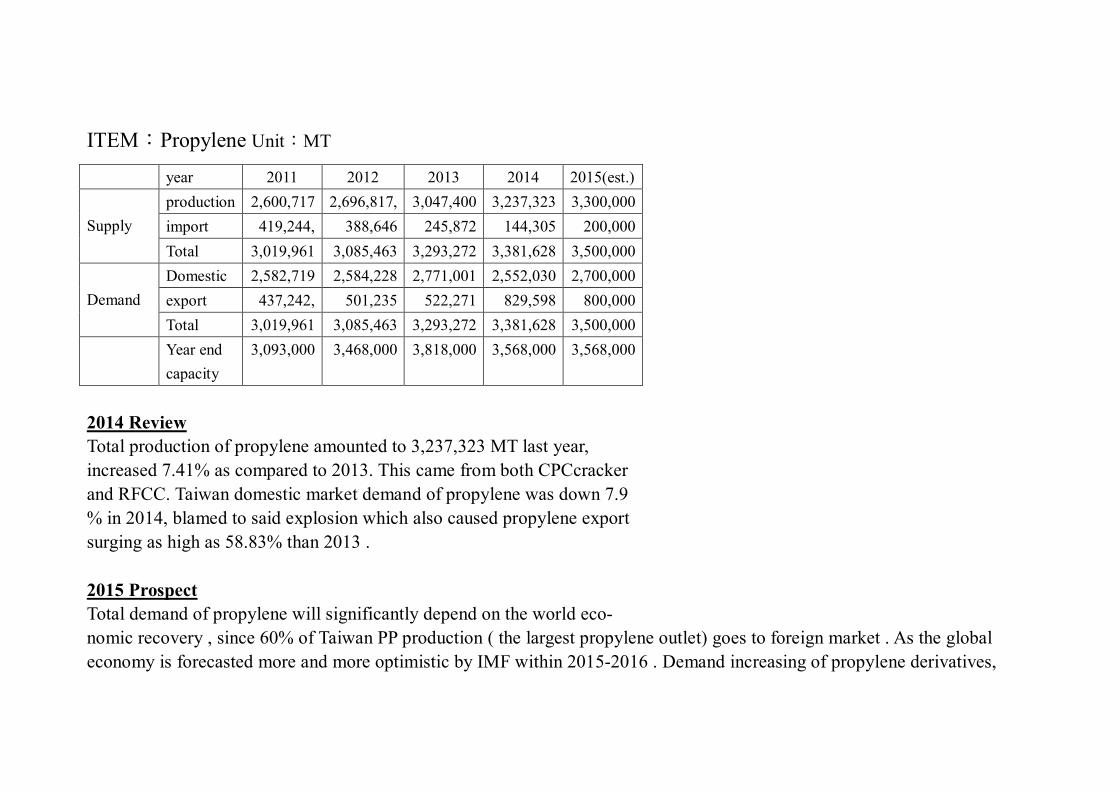
ITEM:Propylene Unit:MT
year 2011 2012 2013 2014 2015(est.) Supply
production 2,600,717 2,696,817, 3,047,400 3,237,323 3,300,000 import 419,244, 388,646 245,872 144,305 200,000 Total 3,019,961 3,085,463 3,293,272 3,381,628 3,500,000
2014 Review Total production of propylene amounted to 3,237,323 MT last year, increased 7.41% as compared to 2013. This came from both CPCcracker and RFCC. Taiwan domestic market demand of propylene was down 7.9 % in 2014, blamed to said explosion which also caused propylene export surging as high as 58.83% than 2013 . 2015 Prospect Total demand of propylene will significantly depend on the world eco- nomic recovery , since 60% of Taiwan PP production ( the largest propylene outlet) goes to foreign market . As the global economy is forecasted more and more optimistic by IMF within 2015-2016 . Demand increasing of propylene derivatives,
particular in developed countries, will apparently reflect on propylene demand in the near future. However, nearly two million MT of PDH new capacities came on stream in H2 of 2014. This certainly has negative effect for Taiwan PP producers.
ITEM:ButadieneUnit:MT
year 2011 2012 2013 2014 2015(est.) Supply
production 500,604 481,880 545,953 585,097 600,000 import 199,945 165,642 128,426 127,705 120,000 Total 700,549 647,522 674,379 712,802 720,000
2014 Review In recent years, butadiene price has been changed drastically, leading to a very poor balance of supply/demand. In 2014, ample supply of domestic butadiene and spiral down of crude oil price made import butadiene down 0 .6%. The stagnant of butadiene consumption last year also clearly reflected from the negative growth rate of major butadiene derivatives , such as
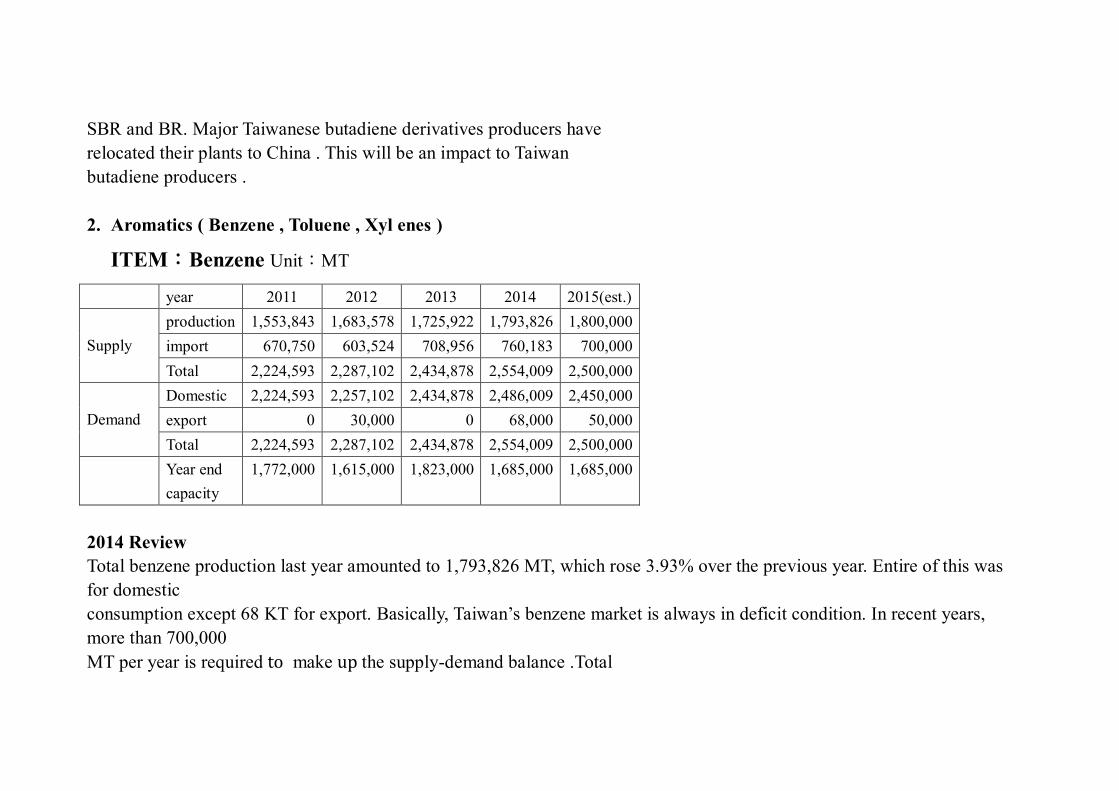
SBR and BR. Major Taiwanese butadiene derivatives producers have relocated their plants to China . This will be an impact to Taiwan butadiene producers . 2. Aromatics ( Benzene , Toluene , Xyl enes )
ITEM:Benzene Unit:MT
year 2011 2012 2013 2014 2015(est.) Supply
production 1,553,843 1,683,578 1,725,922 1,793,826 1,800,000 import 670,750 603,524 708,956 760,183 700,000 Total 2,224,593 2,287,102 2,434,878 2,554,009 2,500,000
2014 Review Total benzene production last year amounted to 1,793,826 MT, which rose 3.93% over the previous year. Entire of this was for domestic consumption except 68 KT for export. Basically, Taiwan’s benzene market is always in deficit condition. In recent years, more than 700,000 MT per year is required to make up the supply-demand balance .Total
benzene demand was 2,554,009 MT in 2014. The vast majority of it were consumed in producing SM , Phenol , and alkyl benzene . Benzene price dropped dramatically in H2 of 2014 made its consumers kept wait and see stance. This certainly had negative effect to benzene downstream demand, especial in SM. 2015 Prospect In view of the improvement of supply-demand situation and the recovery of downstream market . Taiwan benzene business should be more stable this year. Supply from CPC is expected to decline due to shutdown of No. 5 NC , which turns out less pygas available for the feedstock of benzene production .
ITEM:Toluene Unit:MT year 2011 2012 2013 2014 2015(est.) Supply
production 22,982 26,731 76,019 285,659 200,000 import 168,974 242,956 372,106 241,307 250,000 Total 191,956 269,687 448,125 526,966 450,000
Total production of toluene was 285,659 MT last year .It surged 275.77% over a year before . The apparent consumption was 245,346 MT. Export constituted 98% of production. Import accounted for more than 95% of local market consumption. Local two major aromatics players, CPC and FCFC, Played different strategies last year. FCFC did not take toluene as a major product; rather, FCFC transformed it into benzene and xylenes through TDP unit. On the other side , CPC got toluene from BTX units and sold to local market , with the remaining exported offshore . 2015 Prospect Due to economical unattractive in CPC xylenes separation system , more toluene will export from CPC this year. Total local toluene consumption seems to be decreasing along with the continued out-move of industrial investments to foreign countries.
ITEM:Xylenes Unit:MT
year 2011 2012 2013 2014 2015(est.) Supply
production 2,496,345 2,594,550 2,477,974 2,152,770 2,600,000 import 1,850,883 1,357,938 1,329,369 1,127,447 1,200,000 Total 4,347,228 3,952,488 3,807,343 3,280,217 3,800,000
2014 Review In 2013, total xylenes production registered 2,152,770 MT, comprising different isomers of xylenes. This marked a down rate of 13.12% over 2013. Production has been descending since 2011, following the cyclical peak of fiber business. Para-xylene accounted for the vast majority of xylenes output. However, surging new PTA capacities in China plus differential import tax to China from ASEAN countries made Taiwan PTA producers slashed PTA units’ utilization last year. 2015 Prospect Taiwan PTA industry has been in difficult; profitability has been eroded very serious and hardly to recover in the near future. Under this circum- stance and weak oil prices, xylene prices would stay at low level when gasoline season is over in coming few years.
2. The Asia propylene price had a dramatic change in 2014.In Aug’14; the price reached a record high. However owing to oil price decline and
the on purpose propylene facility start-up in China, the price dropped about 54% by end of the year. Unstable feedstock price made
propylene users face huge challenge on procurement strategy.
3. LCY Chemical Corp. PP facility outage, caused from serious propylene pipeline explosion in Kaohsiung, brought about regional PP supply tight.
PP price trend went up during Q3~Q4’14 combined with propylene price drop resulted in other PP producers’ margin in high level.
2015 Outlook
1. Taiwan domestic propylene supply will become tight because CPC’s cracker No.5 may permanent shutdownthis year.
2. In Q2’15, propylene will be rather tight as a result of cracker schedule shut down in NEA. However it will turn to loose in Q3-Q4’15 due to
the 3 more PDH/MTO new additional capacity start-up in China and consecutive propylene expansion in SEA (Shell, Petron, Pertamina and
IRPC).
3. LCY Chemical Corp. obtained the Government’s permission to restart one 150kt/year polypropylene (PP) production line by lorry
transported propylene since late January of 2015. Now is being in official audition. It may get fully permission during Q3’15 and will recover
the capacity step by step. Its production forecast in 2015 is about 250,000 ton.
TAIWAN, REPUBLIC OF CHINA
Styrenics Committee
ITEM:STYRENE
Year 2012 2013 2014 2015(E)
Supply
Production 1,790,376 2,044,325 1,974,323 2,033,552
Import 383,669 393,855 384,808 396,352
Total 2,174,045 2,438,180 2,359,131 2,429,904
Demand
Domestic 1,822,088 1,924,233 1,794,666 1,981,959
Export 351,957 513,947 564,465 447,945
Total 2,174,045 2,438,180 2,359,131 2,429,904
Year End Capacity 1,910,000 2,030,000 2,030,000 2,030,000
2014 Market Review
1) The export volume of SM was 564KT and most of which was sipped by FCFC to their PS/ABS plants in Ningbo, China. The total import
volume near the same as 2013, the supply/demand balance was still net short in Taiwan.
2) The globally weak macroeconomic environment is suppressing styrene demand growth. Slower real estate prices and stagnant housing
and constructions sectors are weighing on styrene demand, especially in China.
2015 Outlook
1) Demand growth is inevitable concentrated in China throughout the forecast years. However some growth is also expected in Taiwan,
mainly for making ABS for export. Forecast annual growth rate in Northeast Asia is expected to be slower at around 3%.
2) A combination of feedstock, low oil price, technical, economic, logistical and commercial factors will cause SM supply to increase; the
forecast is 3% growth in comparison with last year.
3) It is critical for the world’s styrene industry partly because of China’s demand growth remains strong and continues to import more
quantities of styrene. In case China operates its styrene plants at full capacity, and supply the product to Chinese consumers for captive
uses, then the world styrene industry as a whole might be suffered for losing huge exports to China market.
ITEM:Polystyrene
Year 2012 2013 2014 2015(E)
Production 838,330 828,031 775,078 803,190
Import 10,539 8,508 7,743 8,252
Export 745,904 760,927 723,940 738,099
Domestic Demand 102,635 75,612 58,881 73,343
Export Comparison
Year 2013 2014 Change of 2014
Hong Kong 103,505 63,618 -39,887
China 324,923 229,041 -95,882
Other 332,499 431,281 98,782
Total 760,927 723,940 -36,987
2014 Market Review
1) Total export volume decreased 4.9% or 37.0 KT, resulting from demand decline from China and HK market for which export volume
decreased 31.7% in comparison with last year. HK and China markets shared 40.4% of total PS export volume of Taiwan. The Middle East
demand increased 29.7% over last year.
2) In 2014, the crude oil prices continued to move lower; PS market in China declined also.
3. Indeed, 2014 has been a major disappointment, particularly for demand of EPS which showed a negative growth for the first time since
2010.
2015 Outlook
1) PS market in China forecasted to keep declining in 2015 because of the slowdown of its GDP growth and rise of self-sufficiency. PS
production in Taiwan is forecasted to be the same as 2015 in view of the cheaper raw materials and stable economic recovery.
2) PS manufactures in Taiwan keep making their effort to cautiously expand export markets in developing countries particularly in the
Middle East area.
ITEM:ABS
Year 2012 2013 2014 2015(E)
Production 1,209,109 1,210,159 1,201,685 1,204,108
Import 14,561 10,231 13,167 13,101
Export 1,100,340 1,095,372 1,046,883 1,046,895
Domestic Demand 123,330 125,018 167,969 170,314
Export Comparison
Year 2013 2014 Change of 2014
Hong Kong 298,396 296,445 -1,951
China 569,389 523,932 -45,457
Other 227,587 226,506 -1,081
Total 1,095,372 1,046,883 -48,488
2014 Market Review
1) ABS export volume from Taiwan decreased 4.4% or 48.5KT in comparison with 2013 mostly resulted from demand decrease from HK and
China.
2) In 2014, with the crude oil prices continued to move lower, the ABS market in China faced downward pressure as domestic demand stayed
lackluster.
3) Total ABS capacity of China’s local manufacturers increased approximately 120KT in 2014. In the same time, demand from Europe
declined due to the reference point is becoming less obvious.
2015 Outlook
1) GDP of China is forecasted to be +7.1% this year. Supply of chemicals tends to be saturated, and the self-sufficiency rate is also on the
rise.
2) Over the next years, operating rates are expected to improve to over 80% as global demand improves, and the excessive capacity would
be absorbed.
3) Domestic ABS demand in Taiwan is forecasted to be flat.
TAIWAN, REPUBLIC OF CHINA The PVC committee
1. Market review of PVC in 2014
In 2014 PVC production was 1,515 KMT in Taiwan, representing a 83.5% of operating rate and 6.5% annual decrease due to
high crude oil and ethylene prices that caused ethylene based PVC less competitive against China’s carbide based PVC in
the first three quarter of 2014.
PVC demand in 2014 amounted to 524 KMT with a decrease of 8.1% from previous year, because of less competitive of PVC
finished goods with Chinese products.
In 2014, PVC export was 975 KMT, a decrease of 8.8%.Some part of export to India market was taken by low-priced carbide
based PVC from China.
Taiwan imported 27 KMT PVC in 2014.
2. Market review of VCM in 2014
In 2014 VCM production was 1,822 KMT in Taiwan, a 4.1% of annual decrease which was caused by poor ethylene based
PVC competitiveness in 2014.
2014 VCM demand was 1,529 KMT, declined 6.4%.
2014 VCM export recorded 346 KMT and the major volume was shipped to FPC’s Ningbo plant for captive consumption.
Taiwan imported 53 KMT of VCM in 2014.
3. 2014 Review and 2015 Prospect of PVC
In the year of 2014, China was experiencing the adjustment of economic structure, while Europe was under the pressure of deflation. This contributed to the slowing down of global PVC demand growth. Among the three feed stocks for making PVC, i.e., natural gas-based ethylene, carbide-derived acetylene, and naphtha-based ethylene, the relative cost of naphtha-based ethylene is apparently the highest that sharply deteriorated its competitiveness against the other two during the first 3 quarters of 2014. However, the price of crude oil plunged in the 4th quarter due to global oversupply and has been floating at US$50~60/bbl since then. The pressure of high cost for those Asian PVC manufacturers using naphtha-based ethylene has also been greatly eased. Yet, the over capacity of PVC in Asia, especially in China, is still in a critical condition, and it’ll take several years to balance. Sources said, about 1,530 thousand tons of carbide PVC plants in China had shut down last year due to keen competition. It is believed that such kind of plant closures would be continuing in 2015. Many developing countries, such as India, are striving to prosper their economy. This creates huge demand of PVC for infrastructure constructions, and is considered as a main power of PVC market growth. In this vision, accompanied by relatively stable crude oil price and the phasing- out of the high cost capacity in China, we can expect a rather optimistic growth of PVC demand in 2015.
Table 1. Nameplate Capacity of PVC in Taiwan Unit:KMT/YR
2,380,000 2,380,000 2,380,000 2,380,000 2,380,000 2,580,000 2,630,000 Review 2014 In 2014, domestic production increased 8.8% to 2.3MMT; demand went down 7% to 1MMT due to strong competition of polyesters market. Extremely high raw material ethylene cost went up 8% to $1410/MT ; poor downstream demand pulled MEG price down 12% to $900-950/MT, which actually eroded margins in the period. In the Q4 of 2014, crude oil price remained low, down 50% to below $55/bbl of WTI against the price level in June. As lower crude oil price led to withdrawal of raw material speculators, MEG-C2 spread recovered back to $200/MT. Prospect 2015 With crude oil price hit the psychological bottom, polyester fiber demand growth will be stimulated in the traditional growing season. Market expects supply could be tight as SABIC plans to shut its 3 units for maintenance, and NanYa alternatively shut its plants for safety inspection in Q3. . Domestic polyester fiber makers is expected to consume around 1-1.1MMT as that of 2014.
Capacity(as of the end of each year) 5,470,000 5,470,000 5,470,000 5,470,000 5,470,000 5,470,001 Review 2014 In 2014, PTA still in oversupply and could not reflect raw material cost. The squeezed spread showed below $100/MT. Due to severe competition from China producers, restructured local makers exported 2MMT PTA, less 60% than that of 2013. Domestic production reduced 11% YoY as target market oversupply. Prospect 2015 PX follow crude oil price down to $800-900/MT but spread value still below $100/MT Severe competitive conditions will continue to drive domestic makers running at a lower operation rate. Domestic polyester fiber makers is hopefully to consume 2.3-2.4MMT in 2015.
Capacity(as of the end of each year) 495,000 495,000 520,000 520,000 520,000 520,000 Review 2014 In 2014, the demand side from ABS, AF, NBR, all seemed to have a slight "improvement," compared with 2013. ABS showed a slight growth; AF was relatively stable as AN price kept firm; NBR kept stable as usual. The AN price trend seemed to "copy" the one in 2013; however, with a higher AN price in 2014 for no new capacity addition. As usual, 2 peaks in Q1 and Q3, and Q2 is the coldest season, Q4 is slightly different since crude oil price dropped sharply. At an overall review, 2014 performance is slightly better than that of 2013. The use of AN for ABS production increased slightly. Chi Mei, the huge player, estimated 2-3% of global growth. Prospect 2015 The economic situations in China, USA, and Europe need to be closely observed. Chi-Mei estimates ABS global growth rate with a conservative viewpoint. GPPC and TAITA, another major ABS producer in Taiwan, both foresee weaker demand. As for the AF business, Tonghua is facing tough challenges from Chinese and Thailand AF producers. Two or three new plants (capacity amounted to 390~650kMTA) will on stream, so the Taiwanese export will definitely be reduced. This will also exert negative impact to Asian market. Furthermore, the Chinese government is implementing new AN policies (like prohibition of re-exporting, the domestic regulations on AN procurement and transportation). The AN producers in Japan, Korea, Taiwan, Thailand will face a SERIOUS challenge, and be forced to follow the RMB pricing system or to leave the market. Overall, it is believed that 2015 will be much tougher than 2014. ABS, AF, NBR producers in Taiwan will face
46
challenges from China, with keen competition, over-supply and low AN price. As a result, negative forecast of AN demand in Taiwan this year should be noted. CPL Supply & Demand 2010 2011 2012 2013 2014 2015(est) Supply Production 290,359 271,215 291,873 278,000 228,000 300,000
Capacity(as of the end of each year) 280,000 300,000 300,000 400,000 400,000 400,000 Review 2014 The business of Taiwan Nylon chain and the downstream sectors is highly dependent on export, with China as a major demand market. As a result of three successive years of caprolactam capacity boost, the output of CPL raised nearly 3 times. China is no longer a destination for import cargo. Foreign players need to find market elsewhere. Compare with year 2013, Taiwan producer cut back about 18% of CPL production and about 3.6% import volume. The impact of overcapacity was not merely regional; it was also a worldwide shock. In general, the CPL market had suffered a hard landing and hit the bottom already. Prospect 2015 As there will be more CPL production capacity planned to be on commissioning in China this year, we can’t go easy with the market so far. And yet, fortunately, the capacity difference between efficient CPL and Polyamide 6 facility will diminish a little bit compare with year 2014. The polymer production requirement will stimulate the CPL demand. Also, it will provide the Chinese CPL importer a bit more room and squeeze the polymer producer a bit further. Meanwhile, CPL producers in the rest of the world will have to fight another way out to overcome the over capacity, and to establish new supply-demand balance.
Demand Direct Export 231,870 156,178 135,408 98,101 137,700 Total 1,070,050 1,064,679 1,124,817 1,076,695 1,143,500
Capacity (as end of the year) 1,080,000
1,080,000
1,080,000
1,080,000
1,080,000
Review of 2014
Overall, Taiwan’s production has maintained constant with no major fluctuations compared with that of previous year. Imported volume increased sharply due to un-smoothly restart up of one supplier after its annual maintenance.
Prospect of 2015
48
Supply and demand balance will not have a big change in Taiwan in year 2015. CCP will increase its captive use upon DTBE plant starts up second half of 2015. High captive use volume will help phenol producers in Taiwan to maintain reasonable operation rate while too much new capacity addition is seen in China. ITEM: ACETIC ACID Unit: MT
Year 2011 2012 2013 2014 2015 Item (Estimated
) Production 573,000 720,000 883,000 950,000 890,000
Demand Direct Export 21,500 68,700 301,000 347,500 300,400 Total 739,000 748,000 889,400 951,100 892,000
Capacity (as end of the year)
49
1,180,000 1,180,000 1,180,000 1,180,000 1,180,000
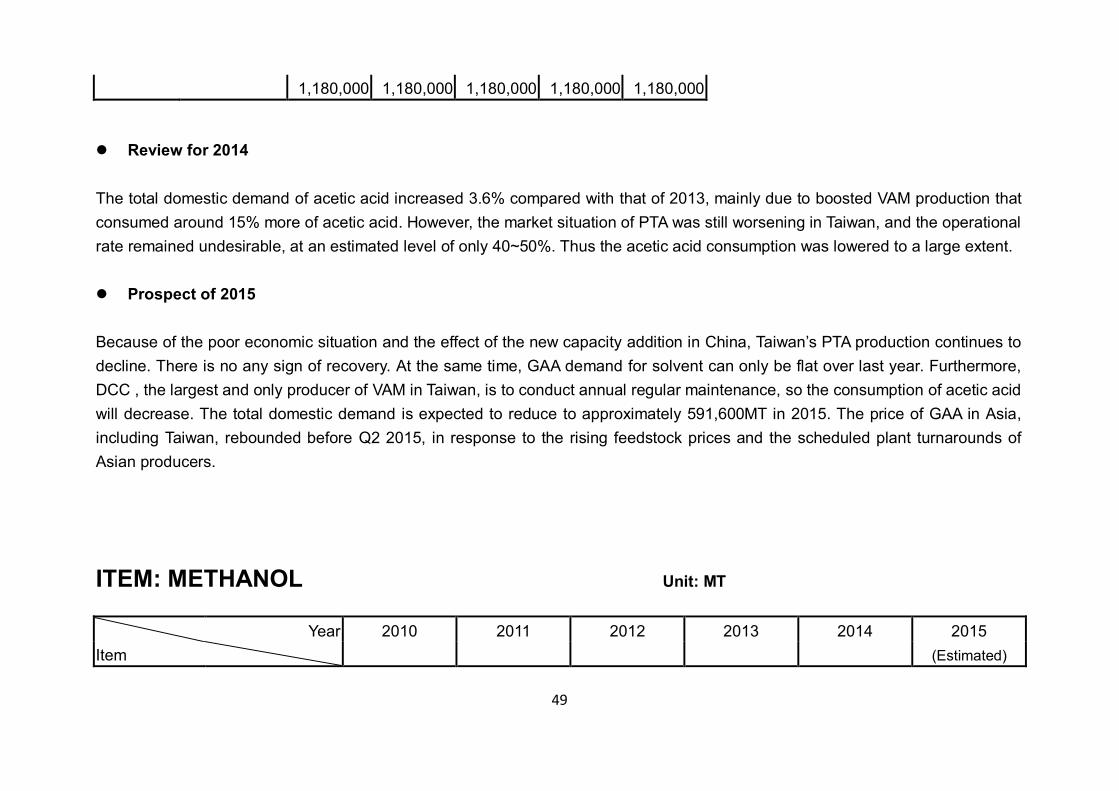
Review for 2014
The total domestic demand of acetic acid increased 3.6% compared with that of 2013, mainly due to boosted VAM production that consumed around 15% more of acetic acid. However, the market situation of PTA was still worsening in Taiwan, and the operational rate remained undesirable, at an estimated level of only 40~50%. Thus the acetic acid consumption was lowered to a large extent.
Prospect of 2015
Because of the poor economic situation and the effect of the new capacity addition in China, Taiwan’s PTA production continues to decline. There is no any sign of recovery. At the same time, GAA demand for solvent can only be flat over last year. Furthermore, DCC , the largest and only producer of VAM in Taiwan, is to conduct annual regular maintenance, so the consumption of acetic acid will decrease. The total domestic demand is expected to reduce to approximately 591,600MT in 2015. The price of GAA in Asia, including Taiwan, rebounded before Q2 2015, in response to the rising feedstock prices and the scheduled plant turnarounds of Asian producers. ITEM: METHANOL Unit: MT
Year 2010 2011 2012 2013 2014 2015 Item (Estimated)
Total 1,074,061 1,082,784 1,150,822 1,168,934 1,340,936
1,400,000
Capacity (as end of the year) 0
0
0
0
0
Review of 2014
Methanol pricing had a wide range spread in 2014, ranging from USD 540 to USD 250. Per ton. Overall, the supply-demand of its derivatives, such as formaldehyde, MMA, MTBE and POM, were in healthy and stable condition. However, the methanol price fell down, especially in the 4th quarter of 2014 owning to sharp drop of crude oil price and the delay of some MTO/MTP commissioning in China. Thus, it affected customer’s confidence in the upcoming market operation and the pricing structure negotiation Prospect of 2015
Due to unforeseeable situation of MTO/MTP development in China, this will continue to impact the market in the rest of Asian countries, including Taiwan. Also, the trend of crude oil price is believed to be another influencing factor. The policy of China government on the development of some methanol derivatives, such as DME, MTBE and Methyl compounds, are important
51
concerns that will decide methanol price level. Few methanol producers from Southeast Asia are expected to schedule plant maintenance in Q2, 2015. The methanol market in Taiwan is most likely to remain stable. ITEM : ALKYLBENZENE Item Year 2013 2014 2015(EST)
Supply
Production 102000 90800 100000 Import 0 0 0 Total 102000 90800 100000
Demand
Domestic 22000 20500 21000 Direct Export 76000 72000 77000 Total 98000 92500 98000
Capacity(as of the end of each year)
125000 125000 125000
Review of 2014 Synthetic detergent production in Taiwan was 182,990MT in 2013 and is 172,020MT in 2014. This decreasing of synthetic detergent production caused Taiwan domestic alkyl benzene consumption falling to 20500MT last year. Alkyl benzene export quantity diminished because of the keen competition from substitute materials and other alkyl benzene suppliers. Prospect of 2015 The alkyl benzene market competition will be even fierce because the forecast global demand of alkyl benzene will keep flat , and there will be a new capacity addition.