113
REPUBLIC OF CROATIA MINISTRY OF ENVIRONMENTAL AND NATURE PROTECTION SECOND BIENNIAL REPORT OF THE REPUBLIC OF CROATIA UNDER THE UN FRAMEWORK CONVENTION ON CLIMATE CHANGE December 2015

REPUBLIC OF CROATIA
MINISTRY OF ENVIRONMENTAL AND NATURE PROTECTION
SECOND BIENNIAL REPORT OF THE REPUBLIC OF CROATIA UNDER THE UN FRAMEWORK CONVENTION ON
CLIMATE CHANGE
December 2015
SECOND BIENNIAL REPORT OF THE REPUBLIC OF CROATIA
Page 2/38
TABLE OF CONTENTS
LIST OF FIGURES ..................................................................................... 4
LIST OF TABLES ...................................................................................... 5
ABBREVIATIONS ...................................................................................... 8
EXECUTIVE SUMMARY ............................................................................ 9
1. GREENHOUSE GAS EMISSION INVENTORIES .............................. 10
1.1. SUMMARY INFORMATION ON GHG EMISSIONS TRENDS ......................... 10
1.2. NATIONAL INVENTORY ARRANGEMENTS ................................................... 30
1.2.1. CHANGES TO NATIONAL INVENTORY ARRANGEMENTS SINCE THE LAST
BIENNIAL REPORT .................................................................................................... 32
2. QUANTIFIED ECONOMY-WIDE EMISSION REDUCTION
TARGET ............................................................................................. 33
2.1. THE EU TARGET UNDER THE CONVENTION .............................................. 33
2.2. THE EU TARGET COMPLIANCE ARCHITECTURE ....................................... 35
2.2.1. THE 2020 CLIMATE AND ENERGY PACKAGE ......................................................... 35
2.3. THE CROATIAN EMISSION REDUCTION TARGETS .................................... 38
2.3.1. KYOTO PROTOCOL LIMIT 2008-2012 ....................................................................... 38
2.3.2. ESD TARGET UNTIL 2020 ......................................................................................... 39
3. POLICIES AND MEASURES ............................................................. 43
3.1. EMISSIONS TRADING SYSTEM ..................................................................... 43
3.2. SECTORAL POLICIES AND MEASURES: ENERGY ...................................... 45
3.3. SECTORAL POLICIES AND MEASURES: TRANSPORT ............................... 51
3.4. SECTORAL POLICIES AND MEASURES: INDUSTRY / INDUSTRIAL
PROCESSES ................................................................................................... 53
SECOND BIENNIAL REPORT OF THE REPUBLIC OF CROATIA
Page 3/38
3.5. SECTORAL POLICIES AND MEASURES: AGRICULTURE ............................ 55
3.6. SECTORAL POLICIES AND MEASURES: FORESTRY / LULUCF ................. 56
3.7. SECTORAL POLICIES AND MEASURES: WASTE MANAGEMENT /
WASTE ............................................................................................................. 58
3.8. OTHER (CROSS-CUTTING) POLICIES AND MEASURES ............................. 61
3.9. ASSESSMENT OF THE ECONOMIC AND SOCIAL CONSEQUENCE OF
RESPONSE MEASURES ................................................................................. 76
3.10. ESTIMATES OF EMISSION REDUCTIONS AND REMOVALS AND THE
USE OF UNITS FROM MARKET-BASED MECHANISMS AND LULUCF
ACTIVITIES ...................................................................................................... 77
4. PROJECTIONS .................................................................................. 82
4.1. PROJECTIONS OF GREENHOUSE GAS EMISSIONS BY SECTORS .......... 83
4.2. PROJECTIONS OF GREENHOUSE GAS EMISSIONS BY Gases ................. 87
4.3. TOTAL PROJECTIONS .................................................................................... 88
4.4. EMISSIONS OF ETS AND NON-ETS SECTORS ............................................ 90
4.5. QUANTIFIED PROGRESS TO 2020 TARGETS .............................................. 93
4.6. DESCRIPTIONS OF METHODOLOGIES, MODELS, UNDERLYING
ASSUMPTIONS AND KEY INPUT AND OUTPUT PARAMETERS FOR
PROJECTIONS ................................................................................................ 94
5. PROVISION OF FINANCIAL, TECHNOLOGICAL AND
CAPACITY BUILDING SUPPORT TO DEVELOPING
COUNTRIES .................................................................................... 104
LITERATURE ......................................................................................... 112

SECOND BIENNIAL REPORT OF THE REPUBLIC OF CROATIA
Page 4/38
LIST OF FIGURES
Figure 1-1: Trend of GHG emissions, by sectors ...................................................................... 12
Figure 1-2: Trend of GHG emissions, by gases ........................................................................ 14
Figure 2-1: GHG targets under the 2020 climate and energy package ...................................... 36
Figure 2-2: National 2020 GHG emission limits under the ESD, relative to 2005 emissions levels
................................................................................................................................. 37
Figure 2-3: Comparison with Kyoto Protocol limit ...................................................................... 39
Figure 4-1: Historical and projected greenhouse emissions by sectors, 'without measures'
scenario .................................................................................................................... 85
Figure 4-2: Historical and projected greenhouse emissions by sectors, 'with measures' scenario
................................................................................................................................. 85
Figure 4-3: Historical and projected greenhouse emissions by sectors, 'with additional
measures' scenario ................................................................................................... 86
Figure 4-4: Historical and projected removals by sinks in the LULUCF sector, 'with measures'
scenario .................................................................................................................... 86
Figure 4-5: Projections of greenhouse emissions by gases ...................................................... 87
Figure 4-6: Total projections of greenhouse gas emissions (without LULUCF) for period until
2035 ......................................................................................................................... 88
Figure 4-7: Historical emissions and projections of emissions within ETS and non-ETS, scenario
'without measures' .................................................................................................... 91
Figure 4-8: Historical emissions and projections of emissions within ETS and non-ETS, scenario
'with measures' ......................................................................................................... 91
Figure 4-9: Historical emissions and projections of emissions within ETS and non-ETS, scenario
'with additional measures' ......................................................................................... 92

SECOND BIENNIAL REPORT OF THE REPUBLIC OF CROATIA
Page 5/38
LIST OF TABLES
Table 1-1: Emissions/removals of GHG by sectors for the every five years from 1990 to 2005 (kt
CO2-eq)..................................................................................................................... 11
Table 1-2: Emissions/removals of GHG by sectors for the period from 2010-2013 (kt CO2-eq) . 11
Table 1-3: Emissions/removals of GHG by gases for the every five years from 1990 to 2005 (kt
CO2-eq)..................................................................................................................... 13
Table 1-4: Emissions/removals of GHG by gases for the period from 2010-2013 (kt CO2-eq) ... 13
CTF Table 1 Greenouse Gas emissions (kt CO2 eq) ................................................................. 15
CTF Table 1 Greenouse Gas emissions (kt CO2 eq), cont. ....................................................... 16
CTF Table 1 Greenouse Gas emissions (kt CO2 eq), cont. ....................................................... 16
CTF Table 1(a) Emission trends (CO2). .................................................................................... 18
Emission trends (CO2), cont ..................................................................................................... 19
CTF Table 1(a) Emission trends (CO2), cont. ............................................................................ 19
CTF Table 1(b) Emission trends (CH4) ...................................................................................... 21
CTF Table 1(b) Emission trends (CH4), cont. ............................................................................ 22
CTF Table 1(b) Emission trends (CH4), cont. ............................................................................ 23
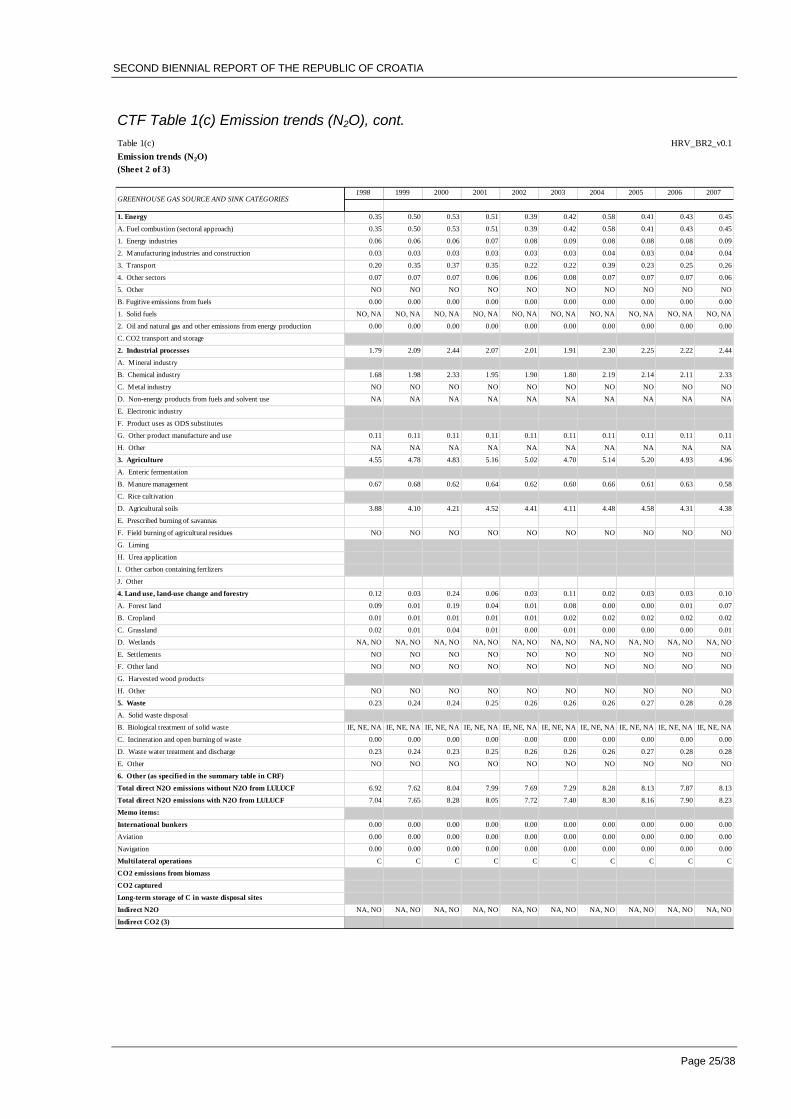
CTF Table 1(c) Emission trends (N2O) ...................................................................................... 24
CTF Table 1(c) Emission trends (N2O), cont. ........................................................................... 25
CTF Table 1(c) Emission trends (N2O), cont. ........................................................................... 26
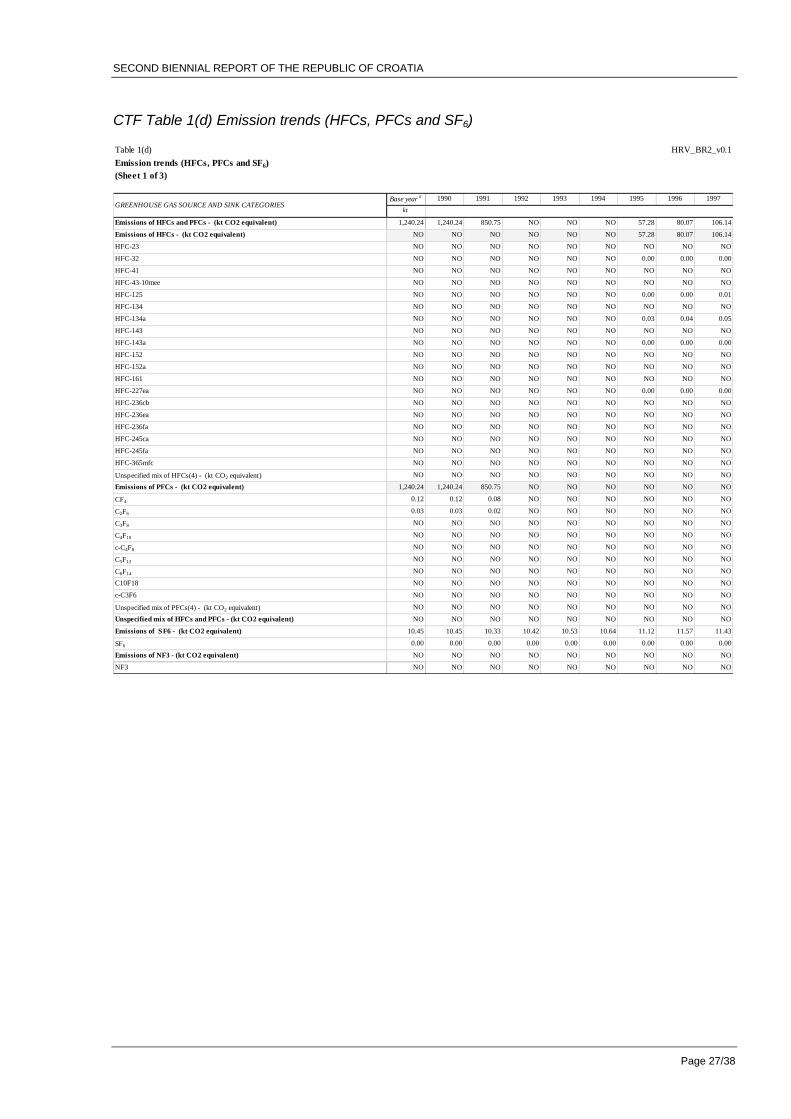
CTF Table 1(d) Emission trends (HFCs, PFCs and SF6) ........................................................... 27
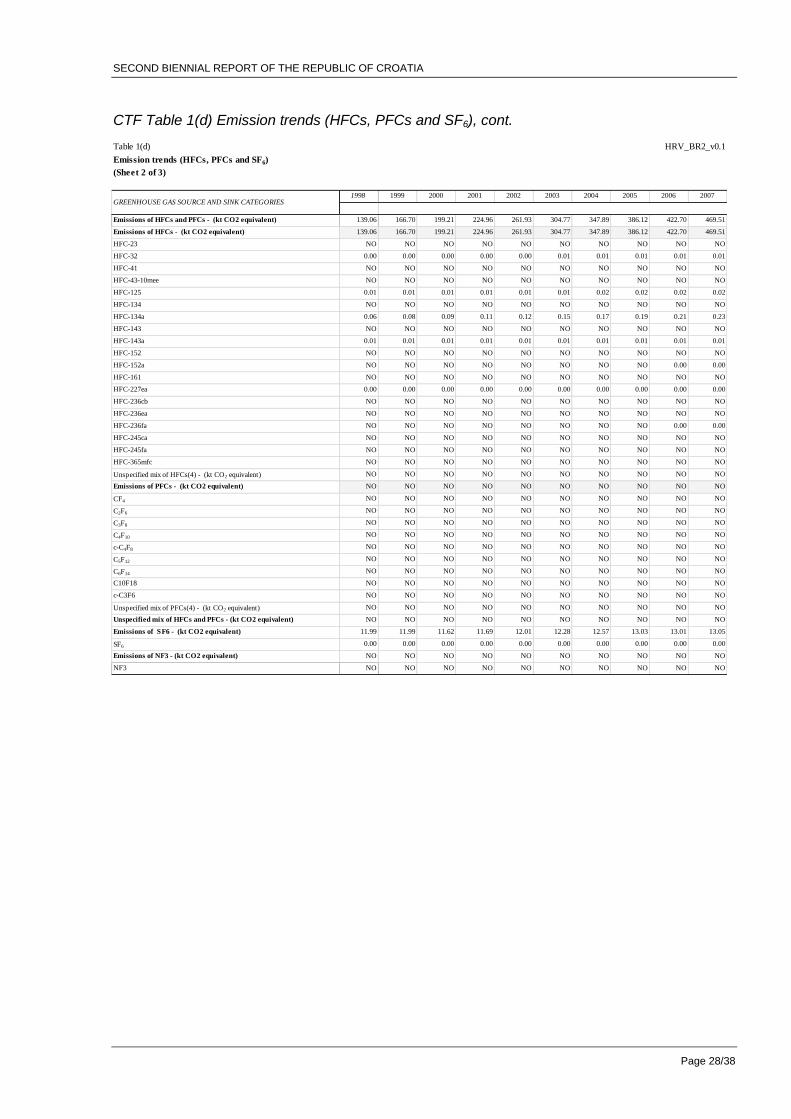
CTF Table 1(d) Emission trends (HFCs, PFCs and SF6), cont. ................................................. 28
CTF Table 1(d) Emission trends (HFCs, PFCs and SF6), cont. ................................................ 29
Table 2-1: Key facts of the Convention target of the EU-28....................................................... 34
Table 2-2: The difference to the Kyoto Protocol target, kt CO2 eq (AR 2) .................................. 38
Table 2-3: Annual emission allocations for the Republic of Croatia for the period 2013-2020 [t
CO2eq] ...................................................................................................................... 39
CTF Table 2(a) Description of quantified economy-wide emission reduction target: base year . 40
CTF Table 2(b) Description of quantified economy-wide emission reducing target: gasses and
sectors covered ........................................................................................................ 40
CTF Table 2(c) Description of quantified economy-wide emission reducing target: global
warming .................................................................................................................... 41
CTF Table 2(d) Description of quantified economy-wide emission reducing target: approach to
counting emissions and removals from LULUCF sector ............................................ 41
SECOND BIENNIAL REPORT OF THE REPUBLIC OF CROATIA
Page 6/38
CTF Table 2(e)I Description of quantified economy-wide emission reducing target: market-
based mechanisms under the Convention ................................................................ 41
CTF Table 2(e)II Description of quantified economy-wide emission reducing target: market-
based mechanisms under the Convention ................................................................ 42
CTF Table 2(f) Description of quantified economy-wide emission reducing target: any other
information ................................................................................................................ 42
CTF Table 3 Progress in achievement of the quantified economy-wide emission reduction
target: information on mitigation actions and their effects .......................................... 63
CTF Table 4: Reporting on progress ......................................................................................... 78
CTF Table 4(a)I_2013: Progress in achieving the quantified economy-wide emission reduction
targets-further information on mitigation actions relevant to the contribution of the land
use, land-use change and forestry sector in 2013 ..................................................... 79
Table 4-1: Historical emissions and projections of greenhouse gas emissions, kt CO2 eq ........ 89
Table 4-2: Historical emissions and projections of greenhouse gas emissions in ETS and non-
ETS sectors, kt CO2 eq ............................................................................................. 90
Table 4-3: Projected development in relation to the national annual quota in period 2013 – 2020
[t CO2eq] ................................................................................................................... 93
Assumptions for projections by sector – energy and transport .................................................. 95
Assumptions for projections by sector – industry ...................................................................... 97
Assumptions for projections – agriculture .................................................................................. 98
Assumptions for projections – waste management ................................................................... 98
Assumptions for projections – LULUCF .................................................................................... 99
CTF Table 5 Summary of key variables and assumptions used in the projections analysis..... 100
CTF Table 6(a) Information on updated greenhouse gas projections under a ‘with measures’
scenario .................................................................................................................. 101
CTF Table 6(b) Information on updated greenhouse gas projections under a ‘without measures’
scenario .................................................................................................................. 102
CTF Table 6(c) Information on updated greenhouse gas projections under a ‘with additional
measures’ scenario ................................................................................................. 103
CTF Table 7: Provision of public financial support: summary information in 2013 ................... 105
CTF Table 7: Provision of public financial support: summary information in 2014 ................... 106
CTF Table 7 (a): Provision of public financial support: contribution through multilateral channels
in 2013 .................................................................................................................... 107
CTF Table 7 (a): Provision of public financial support: contribution through multilateral channels
in 2014 .................................................................................................................... 108
SECOND BIENNIAL REPORT OF THE REPUBLIC OF CROATIA
Page 7/38
CTF Table 7 (b): Provision of public financial support: contribution through bilateral, regional
and other channels in 2013 ..................................................................................... 109
CTF Table 7 (b): Provision of public financial support: contribution through bilateral, regional
and other channels in 2014 ..................................................................................... 110
CTF Table 8: Provision of technology development and transfer support ................................ 111
CTF Table 9: Provision of capacity-building support ............................................................... 111
SECOND BIENNIAL REPORT OF THE REPUBLIC OF CROATIA
Page 8/38
ABBREVIATIONS
CCS Carbon capture and storage
EC European Commission
EE Energy efficiency
ESIF European structural and investment funds
EU European Union
EU ETS EU emission trading system
GDP Gross domestic product
GHG Greenhouse gas
IPCC Intergovernmental Panel on Climate Change
RC Republic of Croatia
RES Renewable energy sources
UNFCCC United Nations Framework Convention on Climate Change
SECOND BIENNIAL REPORT OF THE REPUBLIC OF CROATIA
Page 9/38
EXECUTIVE SUMMARY
This Second Biennial Report of the Republic of Croatia was prepared according to Decision
2/CP.17. For preparation of second biennial report (BR), UNFCCC reporting guidelines was
used. According to Decision 19/CP.18 for reporting and submitting BR tables of the common
tabular format (CTF), electronic reporting application was used. The CTF consists of 27 tables
designed to facilitate the provision of information on:
Greenhouse gas (GHG) emission trends (table 1)
Description of quantified economy-wide emission reduction target (tables 2a-f)
Progress in achievement of this target (tables 3,4a-b)
GHG projections (5,6a-c)
Provision of financial, technological and capacity building support (tables 7a-b, 8 and 9)
In regard to greenhouse gas (GHG) emissions, this Report covers the period from 1990-2013.
Emission projections are based on conditions and projections of macroeconomic parameters
from 2012.

SECOND BIENNIAL REPORT OF THE REPUBLIC OF CROATIA
Page 10/38
1. GREENHOUSE GAS EMISSION INVENTORIES
This Biennial Report presents the inventory of greenhouse gas emissions and removals in the
Republic of Croatia in the period from 1990 to 2013. The inventory includes direct greenhouse
gases: carbon dioxide (CO2), methane (CH4), nitrous oxide (N2O), hydrofluorocarbons (HFCs),
perfluorocarbons (PFCs), sulphur hexafluoride (SF6) and nitrogen trifluoride (NF3) as well as
indirect greenhouse gases: carbon monoxide (CO), oxides of nitrogen (NOx), non-methane
volatile organic compounds (NMVOCs) and sulphur dioxide (SO2).
The emission data presented in Biennial Report is based on the Croatian national greenhouse
gas inventory 1990-2013, submitted to the UNFCCC on 06 November 2015. The inventory is in
line with the UNFCCC reporting guidelines on annual inventories for Parties included in Annex I
to the Convention (Decision 24/CP.19) and with Regulation (EU) No 525/2013 on mechanism
for monitoring and reporting greenhouse gas emissions and for reporting other information at
national and Union level relevant to climate change and repealing decision No 280/2004/EC.
1.1. SUMMARY INFORMATION ON GHG EMISSIONS TRENDS
The total GHG emissions in 2013, excluding removals by sinks, amounted 24,492.8 mil. t CO2-
eq (equivalent CO2 emissions), which represents 30.3 percent emission reduction compared to
GHG emission in the year 1990.
Overall decline of economic activities and energy consumption in the period 1991-1994, which
was mainly the consequence of the war in Croatia, had directly caused the decline in total
emissions of greenhouse gases in that period. With the entire national economy in transition
process, some energy intensive industries reduced their activities or phased out certain
productions (e.g. blast furnaces in Sisak, primary aluminium production in Šibenik, coke plant in
Bakar), which was considerably reflected in GHG emissions reduction. Emissions have started
to increase in the 1995 at an average rate of 3 percent per year, till 2008. Due to decreasing of
economic activity within the period 2008-2013, emission has been reduced by 10.9 percent in
2011, 8.1 percent in 2012 and 21.3 percent in 2013, regarding 2008.
The main reasons of GHG emission increase in the period 1995-2007 was in Energy (Public
electricity and Heat production and Transport), Industrial processes (Cement production, Lime
production, Ammonia production, Nitric acid production and Consumption of HFCs) and Waste.
Increase in Public electricity and Heat production sector is mostly due to higher consumption of
liquid fuels. Lately, cement, lime, ammonia and nitric acid producers reached their highest
producing capacity which has reflected on emission levels. Waste disposal on land, as well as
Wastewater treatment and discharge, have the greatest impact on emission increase in Waste
sector.
The reasons of GHG emission decrease in 2013 was economic crisis and also implementation
of measures. During this period implementation of energy efficiency measures, use of
renewable energy sources and use of biofuels started. Because of above motioned reasons
there was decrease in industrial production and consequently, decrease in fuel consumption

SECOND BIENNIAL REPORT OF THE REPUBLIC OF CROATIA
Page 11/38
(greatest reduction in fuel consumption was in Manufacturing industries and construction sector
and also in Transport sector), and it was contributed to the GHG emission decrease.
A decrease of economic activities after 2007 influenced a reduction in cement, lime, and steel
productions. In 2013, overall emissions from industrial processes dropped by 9.0 percent,
regarding 2012 and by 30.9 percent, regarding 2008.
The results of the greenhouse gas (GHG) emission calculation are presented for the period
from 1990 to 2013. Total emissions/removals of GHG and their trend in sectors are given in
Tables 1-1, 1-2 and in Figure 1-1 while the contribution of the individual gases is given in Tables
1-3, 1-4 and Figure 1-2.
Table 1-1: Emissions/removals of GHG by sectors for the every five years from 1990 to 2005 (kt CO2-eq)
GREENHOUSE GAS SOURCE AND SINK CATEGORIES
1990 1995 2000 2005
CO2 equivalent (kt)
1. Energy 24,902.6 17,858.2 19,739.1 22,953.6
2. Industrial processes and product use 4,852.6 2,572.9 3,291.6 3,776.9
3. Agriculture 4,766.5 3,486.6 3,208.7 3,088.9
4. Land use, land-use change and forestry(5)
-5,536.7 -8,431.5 -7,162.1 -6,996.6
5. Waste 594.2 673.5 799.8 909.9
6. Other NO NO NO NO
Total (including LULUCF) 29,579.3 16,159.6 19,877.0 23,732.6
Total (excluding LULUCF) 35,116.0 24,591.1 27,039.1 30,729.3
Table 1-2: Emissions/removals of GHG by sectors for the period from 2010-2013 (kt CO2-eq)
GREENHOUSE GAS SOURCE AND SINK CATEGORIES
2010 2011 2012 2013
CO2 equivalent (kt)
1. Energy 21,035.3 20,559.4 18,685.7 18,122.7
2. Industrial processes and product use 3,591.3 3,361.9 3,092.0 2,812.6
3. Agriculture 2,526.1 2,587.1 2,512.6 2,318.0
4. Land use, land-use change and forestry -6,260.3 -5,187.8 -5,036.4 -5,125.2
5. Waste 1,173.3 1,211.0 1,214.8 1,239.5
6. Other 0.0 0.0 0.0 0.0
Total (including LULUCF) 22,065.7 22,531.5 20,468.7 19,367.6
Total (excluding LULUCF) 28,326.1 27,719.3 25,505.1 24,492.8
SECOND BIENNIAL REPORT OF THE REPUBLIC OF CROATIA
Page 12/38
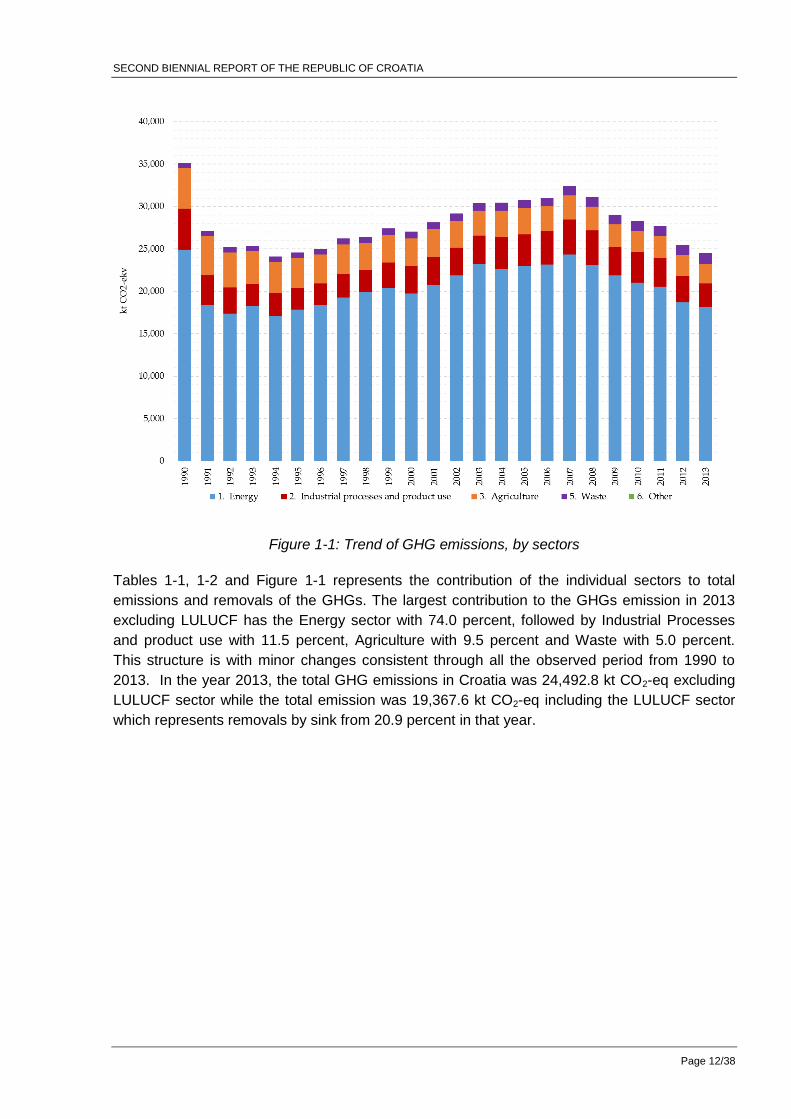
Figure 1-1: Trend of GHG emissions, by sectors
Tables 1-1, 1-2 and Figure 1-1 represents the contribution of the individual sectors to total
emissions and removals of the GHGs. The largest contribution to the GHGs emission in 2013
excluding LULUCF has the Energy sector with 74.0 percent, followed by Industrial Processes
and product use with 11.5 percent, Agriculture with 9.5 percent and Waste with 5.0 percent.
This structure is with minor changes consistent through all the observed period from 1990 to
2013. In the year 2013, the total GHG emissions in Croatia was 24,492.8 kt CO2-eq excluding
LULUCF sector while the total emission was 19,367.6 kt CO2-eq including the LULUCF sector
which represents removals by sink from 20.9 percent in that year.
SECOND BIENNIAL REPORT OF THE REPUBLIC OF CROATIA
Page 13/38
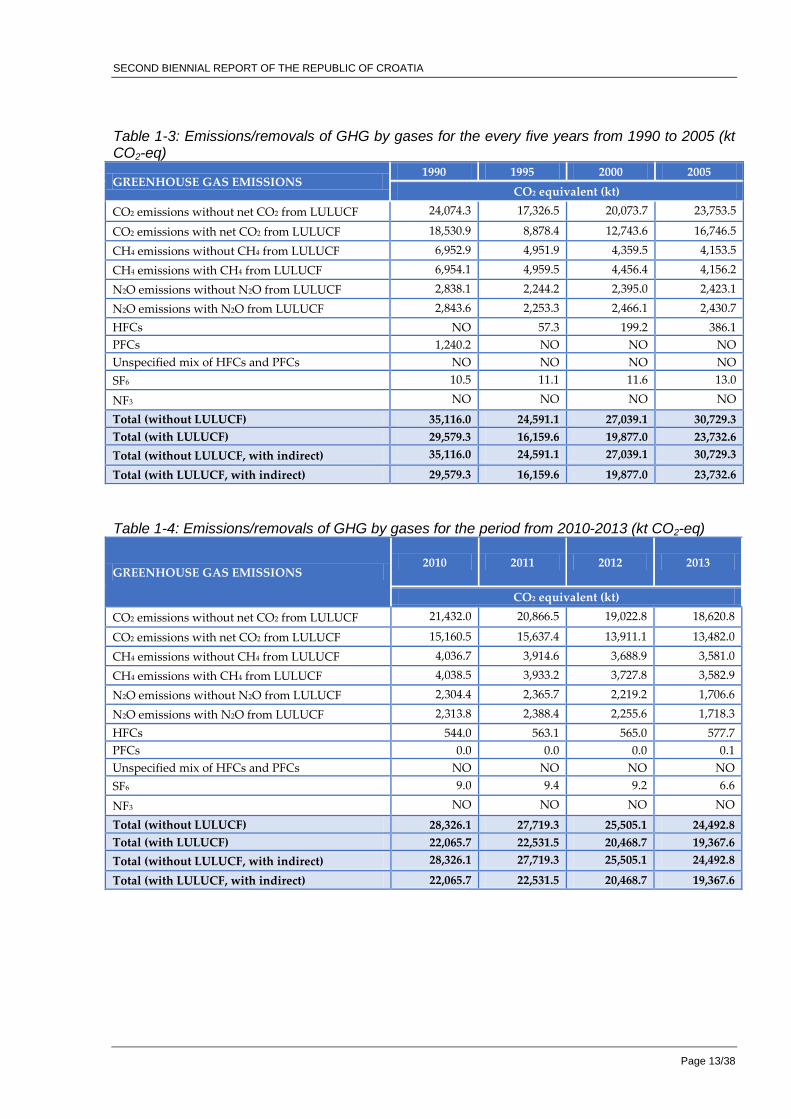
Table 1-3: Emissions/removals of GHG by gases for the every five years from 1990 to 2005 (kt CO2-eq)
GREENHOUSE GAS EMISSIONS 1990 1995 2000 2005
CO2 equivalent (kt)
CO2 emissions without net CO2 from LULUCF 24,074.3 17,326.5 20,073.7 23,753.5
CO2 emissions with net CO2 from LULUCF 18,530.9 8,878.4 12,743.6 16,746.5
CH4 emissions without CH4 from LULUCF 6,952.9 4,951.9 4,359.5 4,153.5
CH4 emissions with CH4 from LULUCF 6,954.1 4,959.5 4,456.4 4,156.2
N2O emissions without N2O from LULUCF 2,838.1 2,244.2 2,395.0 2,423.1
N2O emissions with N2O from LULUCF 2,843.6 2,253.3 2,466.1 2,430.7
HFCs NO 57.3 199.2 386.1
PFCs 1,240.2 NO NO NO
Unspecified mix of HFCs and PFCs NO NO NO NO
SF6 10.5 11.1 11.6 13.0
NF3 NO NO NO NO
Total (without LULUCF) 35,116.0 24,591.1 27,039.1 30,729.3
Total (with LULUCF) 29,579.3 16,159.6 19,877.0 23,732.6
Total (without LULUCF, with indirect) 35,116.0 24,591.1 27,039.1 30,729.3
Total (with LULUCF, with indirect) 29,579.3 16,159.6 19,877.0 23,732.6
Table 1-4: Emissions/removals of GHG by gases for the period from 2010-2013 (kt CO2-eq)
GREENHOUSE GAS EMISSIONS 2010 2011 2012 2013
CO2 equivalent (kt)
CO2 emissions without net CO2 from LULUCF 21,432.0 20,866.5 19,022.8 18,620.8
CO2 emissions with net CO2 from LULUCF 15,160.5 15,637.4 13,911.1 13,482.0
CH4 emissions without CH4 from LULUCF 4,036.7 3,914.6 3,688.9 3,581.0
CH4 emissions with CH4 from LULUCF 4,038.5 3,933.2 3,727.8 3,582.9
N2O emissions without N2O from LULUCF 2,304.4 2,365.7 2,219.2 1,706.6
N2O emissions with N2O from LULUCF 2,313.8 2,388.4 2,255.6 1,718.3
HFCs 544.0 563.1 565.0 577.7
PFCs 0.0 0.0 0.0 0.1
Unspecified mix of HFCs and PFCs NO NO NO NO
SF6 9.0 9.4 9.2 6.6
NF3 NO NO NO NO
Total (without LULUCF) 28,326.1 27,719.3 25,505.1 24,492.8
Total (with LULUCF) 22,065.7 22,531.5 20,468.7 19,367.6
Total (without LULUCF, with indirect) 28,326.1 27,719.3 25,505.1 24,492.8
Total (with LULUCF, with indirect) 22,065.7 22,531.5 20,468.7 19,367.6
SECOND BIENNIAL REPORT OF THE REPUBLIC OF CROATIA
Page 14/38
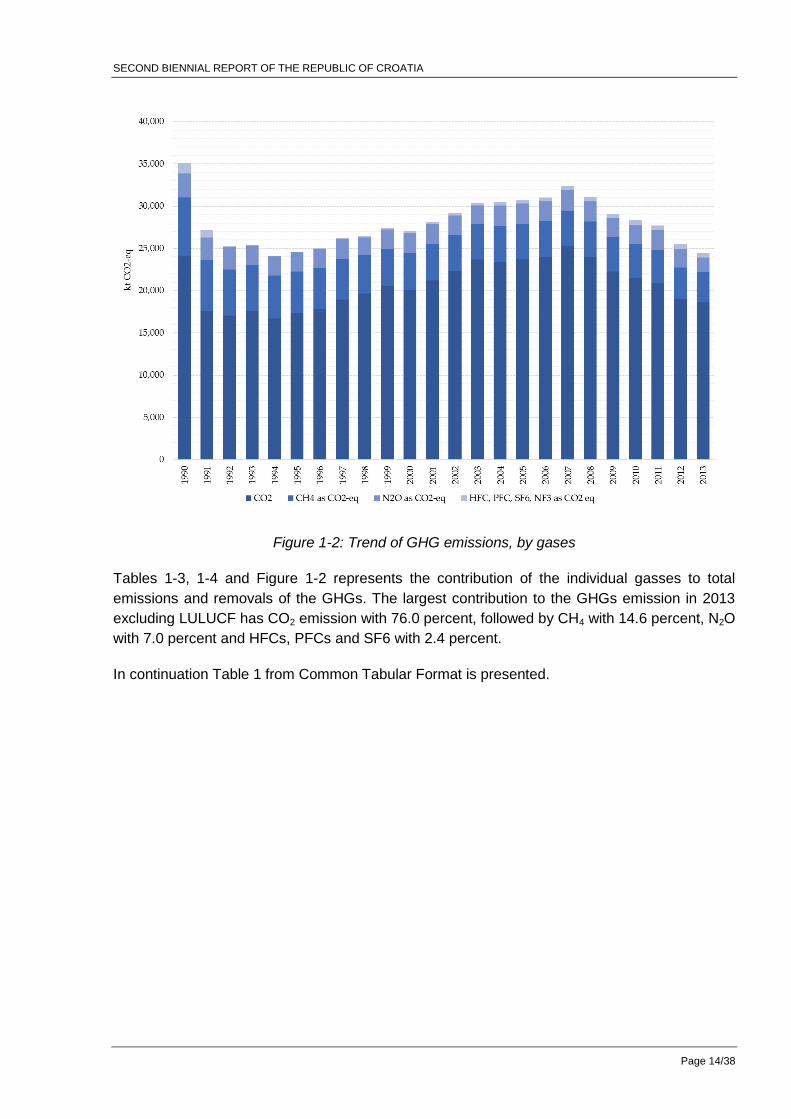
Figure 1-2: Trend of GHG emissions, by gases
Tables 1-3, 1-4 and Figure 1-2 represents the contribution of the individual gasses to total
emissions and removals of the GHGs. The largest contribution to the GHGs emission in 2013
excluding LULUCF has CO2 emission with 76.0 percent, followed by CH4 with 14.6 percent, N2O
with 7.0 percent and HFCs, PFCs and SF6 with 2.4 percent.
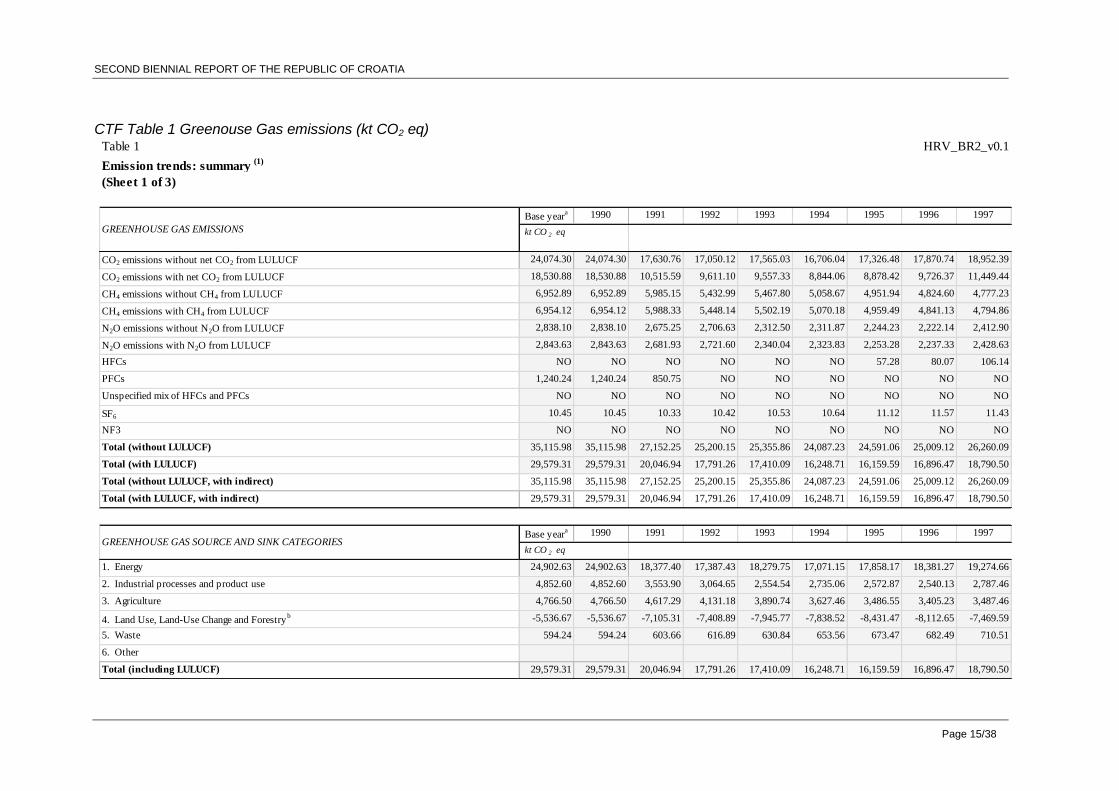
In continuation Table 1 from Common Tabular Format is presented.
SECOND BIENNIAL REPORT OF THE REPUBLIC OF CROATIA
Page 15/38
CTF Table 1 Greenouse Gas emissions (kt CO2 eq) Table 1 HRV_BR2_v0.1
Emission trends: summary (1) Source: Submission 2016 v2, CROATIA
(Sheet 1 of 3) #REF!
Base yeara 1990 1991 1992 1993 1994 1995 1996 1997
kt CO 2 eq
CO2 emissions without net CO2 from LULUCF 24,074.30 24,074.30 17,630.76 17,050.12 17,565.03 16,706.04 17,326.48 17,870.74 18,952.39
CO2 emissions with net CO2 from LULUCF 18,530.88 18,530.88 10,515.59 9,611.10 9,557.33 8,844.06 8,878.42 9,726.37 11,449.44
CH4 emissions without CH4 from LULUCF 6,952.89 6,952.89 5,985.15 5,432.99 5,467.80 5,058.67 4,951.94 4,824.60 4,777.23
CH4 emissions with CH4 from LULUCF 6,954.12 6,954.12 5,988.33 5,448.14 5,502.19 5,070.18 4,959.49 4,841.13 4,794.86
N2O emissions without N2O from LULUCF 2,838.10 2,838.10 2,675.25 2,706.63 2,312.50 2,311.87 2,244.23 2,222.14 2,412.90
N2O emissions with N2O from LULUCF 2,843.63 2,843.63 2,681.93 2,721.60 2,340.04 2,323.83 2,253.28 2,237.33 2,428.63
HFCs NO NO NO NO NO NO 57.28 80.07 106.14
PFCs 1,240.24 1,240.24 850.75 NO NO NO NO NO NO
Unspecified mix of HFCs and PFCs NO NO NO NO NO NO NO NO NO
SF6 10.45 10.45 10.33 10.42 10.53 10.64 11.12 11.57 11.43
NF3 NO NO NO NO NO NO NO NO NO
Total (without LULUCF) 35,115.98 35,115.98 27,152.25 25,200.15 25,355.86 24,087.23 24,591.06 25,009.12 26,260.09
Total (with LULUCF) 29,579.31 29,579.31 20,046.94 17,791.26 17,410.09 16,248.71 16,159.59 16,896.47 18,790.50
Total (without LULUCF, with indirect) 35,115.98 35,115.98 27,152.25 25,200.15 25,355.86 24,087.23 24,591.06 25,009.12 26,260.09
Total (with LULUCF, with indirect) 29,579.31 29,579.31 20,046.94 17,791.26 17,410.09 16,248.71 16,159.59 16,896.47 18,790.50
Base yeara 1990 1991 1992 1993 1994 1995 1996 1997
kt CO 2 eq
1. Energy 24,902.63 24,902.63 18,377.40 17,387.43 18,279.75 17,071.15 17,858.17 18,381.27 19,274.66
2. Industrial processes and product use 4,852.60 4,852.60 3,553.90 3,064.65 2,554.54 2,735.06 2,572.87 2,540.13 2,787.46
3. Agriculture 4,766.50 4,766.50 4,617.29 4,131.18 3,890.74 3,627.46 3,486.55 3,405.23 3,487.46
4. Land Use, Land-Use Change and Forestryb -5,536.67 -5,536.67 -7,105.31 -7,408.89 -7,945.77 -7,838.52 -8,431.47 -8,112.65 -7,469.59
5. Waste 594.24 594.24 603.66 616.89 630.84 653.56 673.47 682.49 710.51
6. Other
Total (including LULUCF) 29,579.31 29,579.31 20,046.94 17,791.26 17,410.09 16,248.71 16,159.59 16,896.47 18,790.50
GREENHOUSE GAS EMISSIONS
GREENHOUSE GAS SOURCE AND SINK CATEGORIES
SECOND BIENNIAL REPORT OF THE REPUBLIC OF CROATIA
Page 16/38
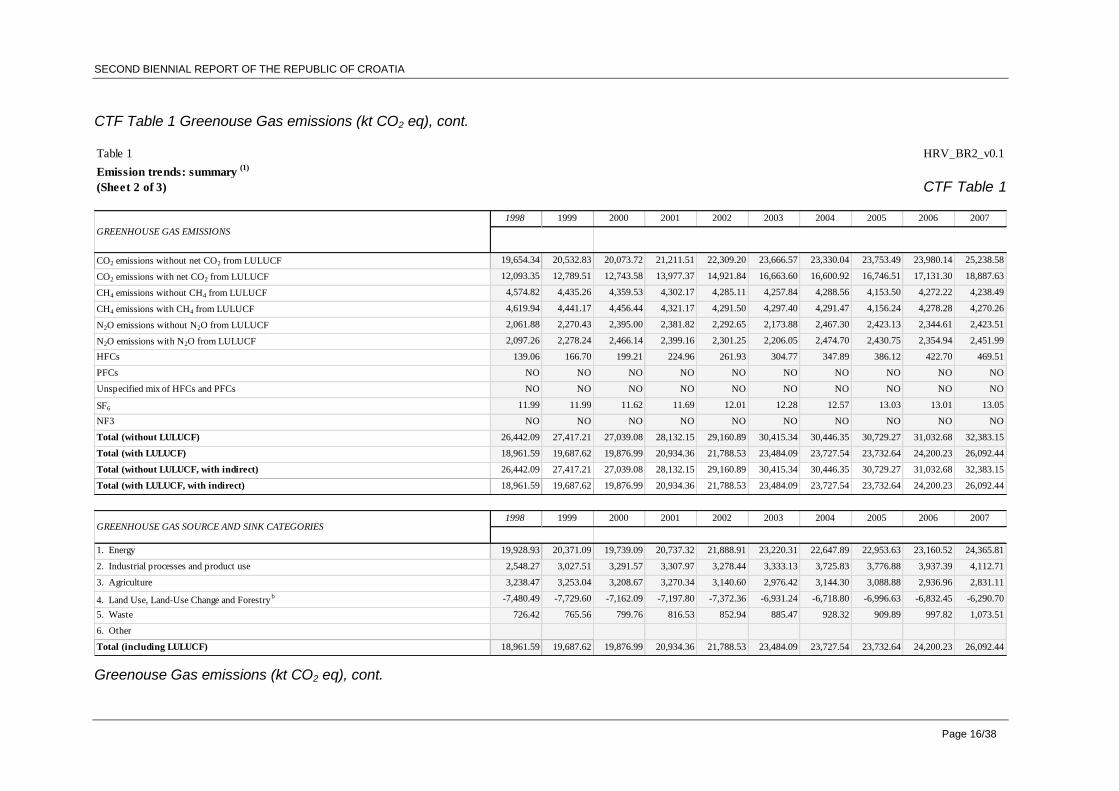
CTF Table 1 Greenouse Gas emissions (kt CO2 eq), cont.
CTF Table 1
Greenouse Gas emissions (kt CO2 eq), cont.
Table 1 HRV_BR2_v0.1
Emission trends: summary (1) Source: Submission 2016 v2, CROATIA
(Sheet 2 of 3) #REF!
1998 1999 2000 2001 2002 2003 2004 2005 2006 2007
CO2 emissions without net CO2 from LULUCF 19,654.34 20,532.83 20,073.72 21,211.51 22,309.20 23,666.57 23,330.04 23,753.49 23,980.14 25,238.58
CO2 emissions with net CO2 from LULUCF 12,093.35 12,789.51 12,743.58 13,977.37 14,921.84 16,663.60 16,600.92 16,746.51 17,131.30 18,887.63
CH4 emissions without CH4 from LULUCF 4,574.82 4,435.26 4,359.53 4,302.17 4,285.11 4,257.84 4,288.56 4,153.50 4,272.22 4,238.49
CH4 emissions with CH4 from LULUCF 4,619.94 4,441.17 4,456.44 4,321.17 4,291.50 4,297.40 4,291.47 4,156.24 4,278.28 4,270.26
N2O emissions without N2O from LULUCF 2,061.88 2,270.43 2,395.00 2,381.82 2,292.65 2,173.88 2,467.30 2,423.13 2,344.61 2,423.51
N2O emissions with N2O from LULUCF 2,097.26 2,278.24 2,466.14 2,399.16 2,301.25 2,206.05 2,474.70 2,430.75 2,354.94 2,451.99
HFCs 139.06 166.70 199.21 224.96 261.93 304.77 347.89 386.12 422.70 469.51
PFCs NO NO NO NO NO NO NO NO NO NO
Unspecified mix of HFCs and PFCs NO NO NO NO NO NO NO NO NO NO
SF6 11.99 11.99 11.62 11.69 12.01 12.28 12.57 13.03 13.01 13.05
NF3 NO NO NO NO NO NO NO NO NO NO
Total (without LULUCF) 26,442.09 27,417.21 27,039.08 28,132.15 29,160.89 30,415.34 30,446.35 30,729.27 31,032.68 32,383.15
Total (with LULUCF) 18,961.59 19,687.62 19,876.99 20,934.36 21,788.53 23,484.09 23,727.54 23,732.64 24,200.23 26,092.44
Total (without LULUCF, with indirect) 26,442.09 27,417.21 27,039.08 28,132.15 29,160.89 30,415.34 30,446.35 30,729.27 31,032.68 32,383.15
Total (with LULUCF, with indirect) 18,961.59 19,687.62 19,876.99 20,934.36 21,788.53 23,484.09 23,727.54 23,732.64 24,200.23 26,092.44
1998 1999 2000 2001 2002 2003 2004 2005 2006 2007
1. Energy 19,928.93 20,371.09 19,739.09 20,737.32 21,888.91 23,220.31 22,647.89 22,953.63 23,160.52 24,365.81
2. Industrial processes and product use 2,548.27 3,027.51 3,291.57 3,307.97 3,278.44 3,333.13 3,725.83 3,776.88 3,937.39 4,112.71
3. Agriculture 3,238.47 3,253.04 3,208.67 3,270.34 3,140.60 2,976.42 3,144.30 3,088.88 2,936.96 2,831.11
4. Land Use, Land-Use Change and Forestryb -7,480.49 -7,729.60 -7,162.09 -7,197.80 -7,372.36 -6,931.24 -6,718.80 -6,996.63 -6,832.45 -6,290.70
5. Waste 726.42 765.56 799.76 816.53 852.94 885.47 928.32 909.89 997.82 1,073.51
6. Other
Total (including LULUCF) 18,961.59 19,687.62 19,876.99 20,934.36 21,788.53 23,484.09 23,727.54 23,732.64 24,200.23 26,092.44
GREENHOUSE GAS EMISSIONS
GREENHOUSE GAS SOURCE AND SINK CATEGORIES

SECOND BIENNIAL REPORT OF THE REPUBLIC OF CROATIA
Page 17/38
Table 1 HRV_BR2_v0.1
Emission trends: summary (1) Source: Submission 2016 v2, CROATIA
(Sheet 3 of 3) #REF!
2008 2009 2010 2011 2012 2013 Change
from base
to latest
reported
year
(%)
CO2 emissions without net CO2 from LULUCF 24,024.90 22,241.22 21,432.05 20,866.49 19,022.78 18,620.85 -22.65
CO2 emissions with net CO2 from LULUCF 17,594.45 15,720.67 15,160.49 15,637.40 13,911.07 13,481.96 -27.25
CH4 emissions without CH4 from LULUCF 4,150.28 4,094.73 4,036.71 3,914.58 3,688.94 3,581.00 -48.50
CH4 emissions with CH4 from LULUCF 4,159.86 4,099.83 4,038.47 3,933.20 3,727.82 3,582.93 -48.48
N2O emissions without N2O from LULUCF 2,451.74 2,223.46 2,304.36 2,365.71 2,219.17 1,706.58 -39.87
N2O emissions with N2O from LULUCF 2,465.59 2,234.63 2,313.81 2,388.40 2,255.63 1,718.35 -39.57
HFCs 490.33 495.65 543.95 563.13 564.96 577.71
PFCs NO 0.26 0.03 0.02 0.03 0.06 -100.00
Unspecified mix of HFCs and PFCs NO NO NO NO NO NO
SF6 11.98 8.03 8.95 9.37 9.21 6.58 -37.03
NF3 NO NO NO NO NO NO
Total (without LULUCF) 31,129.23 29,063.35 28,326.05 27,719.29 25,505.09 24,492.78 -30.25
Total (with LULUCF) 24,722.21 22,559.06 22,065.71 22,531.52 20,468.71 19,367.59 -34.52
Total (without LULUCF, with indirect) 31,129.23 29,063.35 28,326.05 27,719.29 25,505.09 24,492.78 -30.25
Total (with LULUCF, with indirect) 24,722.21 22,559.06 22,065.71 22,531.52 20,468.71 19,367.59 -34.52
2008 2009 2010 2011 2012 2013 Change
from base
to latest
reported
year
(%)
1. Energy 23,119.75 21,894.64 21,035.31 20,559.37 18,685.67 18,122.71 -27.23
2. Industrial processes and product use 4,073.01 3,350.43 3,591.27 3,361.89 3,092.03 2,812.59 -42.04
3. Agriculture 2,789.11 2,633.75 2,526.14 2,587.06 2,512.58 2,317.95 -51.37
4. Land Use, Land-Use Change and Forestryb -6,407.02 -6,504.29 -6,260.34 -5,187.77 -5,036.37 -5,125.18 -7.43
5. Waste 1,147.35 1,184.53 1,173.33 1,210.97 1,214.81 1,239.53 108.59
6. Other
Total (including LULUCF) 24,722.21 22,559.06 22,065.71 22,531.52 20,468.71 19,367.59 -34.52
GREENHOUSE GAS EMISSIONS
GREENHOUSE GAS SOURCE AND SINK CATEGORIES

SECOND BIENNIAL REPORT OF THE REPUBLIC OF CROATIA
Page 18/38
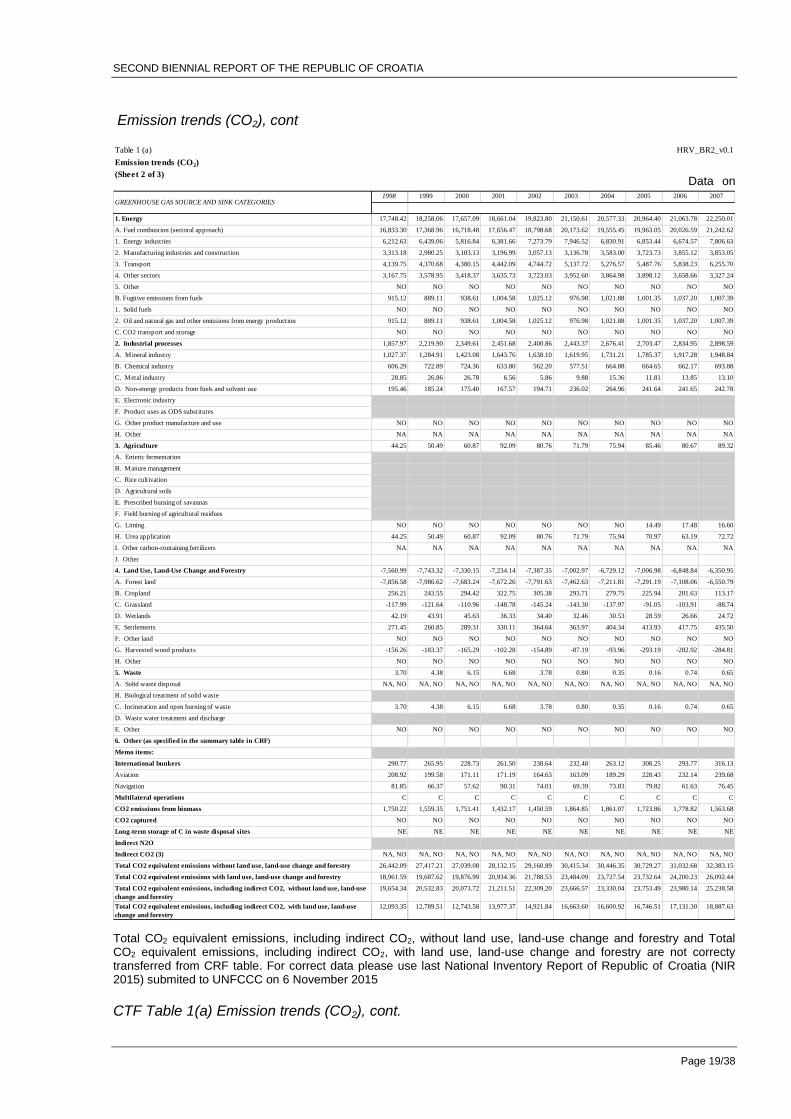
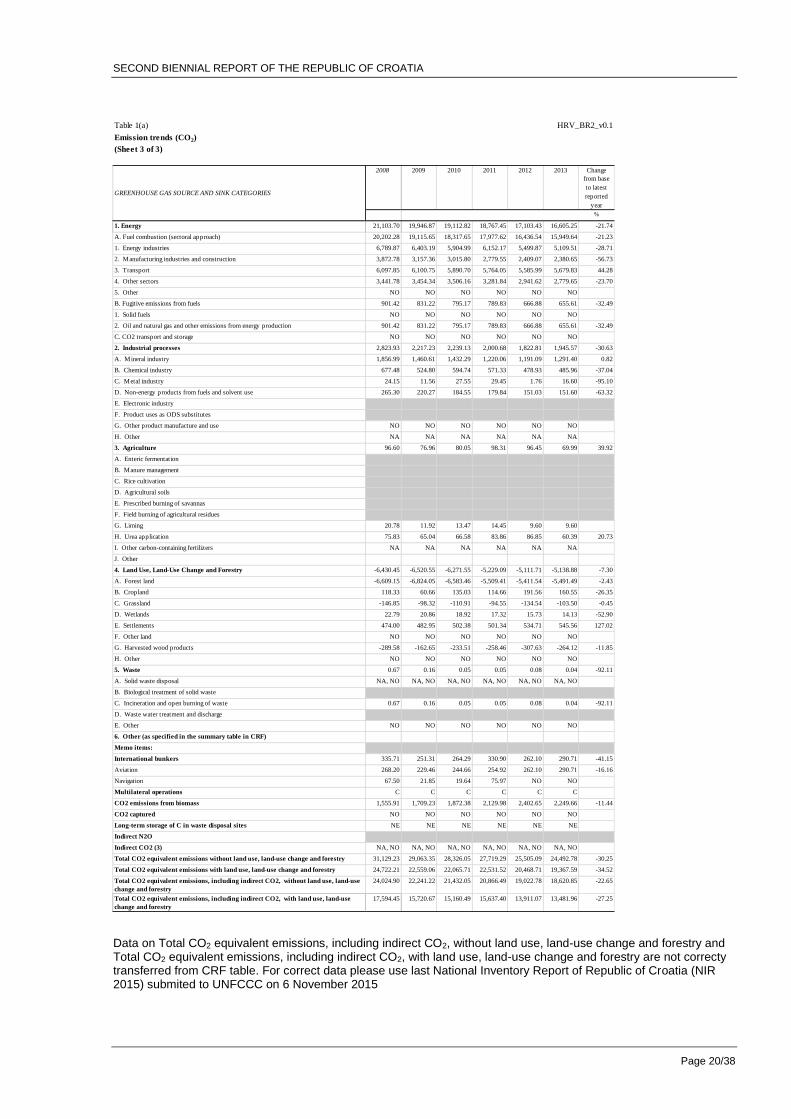
CTF Table 1(a) Emission trends (CO2).
Data
on Total CO2 equivalent emissions, including indirect CO2, without land use, land-use change and forestry and Total CO2 equivalent emissions, including indirect CO2, with land use, land-use change and forestry are not correcty transferred from CRF table. For correct data please use last National Inventory Report of Republic of Croatia (NIR 2015) submited to UNFCCC on 6 November 2015
Table 1 (a) HRV_BR2_v0.1
Emission trends (CO2) Source: Submission 2016 v2, CROATIA
(Sheet 1 of 3) #REF!
Base yeara 1990 1991 1992 1993 1994 1995 1996 1997
kt
1. Energy 21,219.16 21,219.16 15,591.70 14,836.41 15,660.54 14,680.04 15,492.70 16,039.92 16,916.62
A. Fuel combustion (sectoral approach) 20,248.04 20,248.04 14,708.90 13,962.33 14,572.22 13,704.59 14,381.82 14,969.77 15,896.54
1. Energy industries 7,166.75 7,166.75 4,835.34 5,499.07 6,030.66 4,694.84 5,226.83 5,054.87 5,557.44
2. Manufacturing industries and construction 5,501.67 5,501.67 3,919.00 3,114.89 3,031.80 3,202.34 2,954.66 2,998.35 3,026.43
3. Transport 3,936.62 3,936.62 2,892.28 2,788.08 2,961.47 3,171.46 3,343.51 3,659.57 4,004.29
4. Other sectors 3,642.99 3,642.99 3,062.28 2,560.29 2,548.29 2,635.95 2,856.82 3,256.98 3,308.37
5. Other NO NO NO NO NO NO NO NO NO
B. Fugitive emissions from fuels 971.12 971.12 882.80 874.08 1,088.31 975.45 1,110.88 1,070.15 1,020.08
1. Solid fuels NO NO NO NO NO NO NO NO NO
2. Oil and natural gas and other emissions from energy production 971.12 971.12 882.80 874.08 1,088.31 975.45 1,110.88 1,070.15 1,020.08
C. CO2 transport and storage NO NO NO NO NO NO NO NO NO
2. Industrial processes 2,804.58 2,804.58 1,987.58 2,147.66 1,851.82 1,977.89 1,786.96 1,777.85 1,965.56
A. Mineral industry 1,280.88 1,280.88 863.47 938.79 804.89 976.59 759.97 844.58 954.10
B. Chemical industry 771.87 771.87 682.27 850.24 729.48 749.67 770.84 712.81 756.12
C. Metal industry 338.56 338.56 273.84 118.53 58.10 80.11 38.37 19.30 40.11
D. Non-energy products from fuels and solvent use 413.27 413.27 167.99 240.10 259.34 171.51 217.78 201.16 215.23
E. Electronic industry
F. Product uses as ODS substitutes
G. Other product manufacture and use NO NO NO NO NO NO NO NO NO
H. Other NA NA NA NA NA NA NA NA NA
3. Agriculture 50.02 50.02 50.95 65.51 52.14 47.57 46.29 52.44 68.39
A. Enteric fermentation
B. Manure management
C. Rice cultivation
D. Agricultural soils
E. Prescribed burning of savannas
F. Field burning of agricultural residues
G. Liming NO NO NO NO NO NO NO NO NO
H. Urea application 50.02 50.02 50.95 65.51 52.14 47.57 46.29 52.44 68.39
I. Other carbon-containing fertilizers NA NA NA NA NA NA NA NA NA
J. Other
4. Land Use, Land-Use Change and Forestry -5,543.42 -5,543.42 -7,115.18 -7,439.02 -8,007.70 -7,861.98 -8,448.06 -8,144.37 -7,502.95
A. Forest land -5,628.11 -5,628.11 -7,758.27 -8,186.62 -8,528.92 -8,281.22 -8,814.07 -8,565.32 -7,868.69
B. Cropland 217.98 217.98 214.29 221.14 208.74 224.35 229.48 226.36 243.47
C. Grassland -103.97 -103.97 -76.80 -83.63 -86.55 -94.08 -99.94 -104.68 -113.41
D. Wetlands 30.00 30.00 30.17 31.89 33.60 35.32 37.04 38.76 40.47
E. Settlements 240.31 240.31 250.75 251.11 251.47 260.78 252.79 252.84 254.85
F. Other land NO NO NO NO NO NO NO NO NO
G. Harvested wood products -299.62 -299.62 224.69 327.10 113.96 -7.13 -53.35 7.68 -59.65
H. Other NO NO NO NO NO NO NO NO NO
5. Waste 0.54 0.54 0.54 0.54 0.54 0.54 0.54 0.54 1.82
A. Solid waste disposal NA, NO NA, NO NA, NO NA, NO NA, NO NA, NO NA, NO NA, NO NA, NO
B. Biological treatment of solid waste
C. Incineration and open burning of waste 0.54 0.54 0.54 0.54 0.54 0.54 0.54 0.54 1.82
D. Waste water treatment and discharge
E. Other NO NO NO NO NO NO NO NO NO
6. Other (as specified in the summary table in CRF)
Memo items:
International bunkers 493.99 493.99 68.88 57.20 140.58 329.86 291.72 268.66 266.50
Aviation 346.76 346.76 68.88 57.20 140.58 190.08 188.64 177.80 192.09
Navigation 147.23 147.23 NO NO NO 139.78 103.08 90.86 74.41
Multilateral operations C C C C C C C C C
CO2 emissions from biomass 2,540.16 2,540.16 1,751.68 1,520.96 1,447.04 1,462.72 1,514.24 1,807.68 1,869.84
CO2 captured NO NO NO NO NO NO NO NO NO
Long-term storage of C in waste disposal sites NE NE NE NE NE NE NE NE NE
Indirect N2O
Indirect CO2 (3) NA, NO NA, NO NA, NO NA, NO NA, NO NA, NO NA, NO NA, NO NA, NO
Total CO2 equivalent emissions without land use, land-use change and forestry 35,115.98 35,115.98 27,152.25 25,200.15 25,355.86 24,087.23 24,591.06 25,009.12 26,260.09
Total CO2 equivalent emissions with land use, land-use change and forestry 29,579.31 29,579.31 20,046.94 17,791.26 17,410.09 16,248.71 16,159.59 16,896.47 18,790.50
Total CO2 equivalent emissions, including indirect CO2, without land use, land-use
change and forestry
24,074.30 24,074.30 17,630.76 17,050.12 17,565.03 16,706.04 17,326.48 17,870.74 18,952.39
Total CO2 equivalent emissions, including indirect CO2, with land use, land-use
change and forestry
18,530.88 18,530.88 10,515.59 9,611.10 9,557.33 8,844.06 8,878.42 9,726.37 11,449.44
GREENHOUSE GAS SOURCE AND SINK CATEGORIES
SECOND BIENNIAL REPORT OF THE REPUBLIC OF CROATIA
Page 19/38
Emission trends (CO2), cont
Data on
Total CO2 equivalent emissions, including indirect CO2, without land use, land-use change and forestry and Total CO2 equivalent emissions, including indirect CO2, with land use, land-use change and forestry are not correcty transferred from CRF table. For correct data please use last National Inventory Report of Republic of Croatia (NIR 2015) submited to UNFCCC on 6 November 2015
CTF Table 1(a) Emission trends (CO2), cont.
Table 1 (a) HRV_BR2_v0.1
Emission trends (CO2) Source: Submission 2016 v2, CROATIA
(Sheet 2 of 3) #REF!
1998 1999 2000 2001 2002 2003 2004 2005 2006 2007
1. Energy 17,748.42 18,258.06 17,657.09 18,661.04 19,823.80 21,150.61 20,577.33 20,964.40 21,063.78 22,250.01
A. Fuel combustion (sectoral approach) 16,833.30 17,368.96 16,718.48 17,656.47 18,798.68 20,173.62 19,555.45 19,963.05 20,026.59 21,242.62
1. Energy industries 6,212.63 6,439.06 5,816.84 6,381.66 7,273.79 7,946.52 6,830.91 6,853.44 6,674.57 7,806.63
2. Manufacturing industries and construction 3,313.18 2,980.25 3,103.13 3,196.99 3,057.13 3,136.78 3,583.00 3,723.73 3,855.12 3,853.05
3. Transport 4,139.75 4,370.68 4,380.15 4,442.09 4,744.72 5,137.72 5,276.57 5,487.76 5,838.23 6,255.70
4. Other sectors 3,167.75 3,578.95 3,418.37 3,635.73 3,723.03 3,952.60 3,864.98 3,898.12 3,658.66 3,327.24
5. Other NO NO NO NO NO NO NO NO NO NO
B. Fugitive emissions from fuels 915.12 889.11 938.61 1,004.58 1,025.12 976.98 1,021.88 1,001.35 1,037.20 1,007.39
1. Solid fuels NO NO NO NO NO NO NO NO NO NO
2. Oil and natural gas and other emissions from energy production 915.12 889.11 938.61 1,004.58 1,025.12 976.98 1,021.88 1,001.35 1,037.20 1,007.39
C. CO2 transport and storage NO NO NO NO NO NO NO NO NO NO
2. Industrial processes 1,857.97 2,219.90 2,349.61 2,451.68 2,400.86 2,443.37 2,676.41 2,703.47 2,834.95 2,898.59
A. Mineral industry 1,027.37 1,284.91 1,423.08 1,643.76 1,638.10 1,619.95 1,731.21 1,785.37 1,917.28 1,948.84
B. Chemical industry 606.29 722.89 724.36 633.80 562.20 577.51 664.88 664.65 662.17 693.88
C. Metal industry 28.85 26.86 26.78 6.56 5.86 9.88 15.36 11.81 13.85 13.10
D. Non-energy products from fuels and solvent use 195.46 185.24 175.40 167.57 194.71 236.02 264.96 241.64 241.65 242.78
E. Electronic industry
F. Product uses as ODS substitutes
G. Other product manufacture and use NO NO NO NO NO NO NO NO NO NO
H. Other NA NA NA NA NA NA NA NA NA NA
3. Agriculture 44.25 50.49 60.87 92.09 80.76 71.79 75.94 85.46 80.67 89.32
A. Enteric fermentation
B. Manure management
C. Rice cultivation
D. Agricultural soils
E. Prescribed burning of savannas
F. Field burning of agricultural residues
G. Liming NO NO NO NO NO NO NO 14.49 17.48 16.60
H. Urea application 44.25 50.49 60.87 92.09 80.76 71.79 75.94 70.97 63.19 72.72
I. Other carbon-containing fertilizers NA NA NA NA NA NA NA NA NA NA
J. Other
4. Land Use, Land-Use Change and Forestry -7,560.99 -7,743.32 -7,330.15 -7,234.14 -7,387.35 -7,002.97 -6,729.12 -7,006.98 -6,848.84 -6,350.95
A. Forest land -7,856.58 -7,986.62 -7,683.24 -7,672.26 -7,791.63 -7,462.63 -7,211.81 -7,291.19 -7,108.06 -6,550.79
B. Cropland 256.21 243.55 294.42 322.75 305.38 293.71 279.75 225.94 201.63 113.17
C. Grassland -117.99 -121.64 -110.96 -148.78 -145.24 -143.30 -137.97 -91.05 -103.91 -88.74
D. Wetlands 42.19 43.91 45.63 36.33 34.40 32.46 30.53 28.59 26.66 24.72
E. Settlements 271.45 260.85 289.31 330.11 364.64 363.97 404.34 413.93 417.75 435.50
F. Other land NO NO NO NO NO NO NO NO NO NO
G. Harvested wood products -156.26 -183.37 -165.29 -102.28 -154.89 -87.19 -93.96 -293.19 -282.92 -284.81
H. Other NO NO NO NO NO NO NO NO NO NO
5. Waste 3.70 4.38 6.15 6.68 3.78 0.80 0.35 0.16 0.74 0.65
A. Solid waste disposal NA, NO NA, NO NA, NO NA, NO NA, NO NA, NO NA, NO NA, NO NA, NO NA, NO
B. Biological treatment of solid waste
C. Incineration and open burning of waste 3.70 4.38 6.15 6.68 3.78 0.80 0.35 0.16 0.74 0.65
D. Waste water treatment and discharge
E. Other NO NO NO NO NO NO NO NO NO NO
6. Other (as specified in the summary table in CRF)
Memo items:
International bunkers 290.77 265.95 228.73 261.50 238.64 232.48 263.12 308.25 293.77 316.13
Aviation 208.92 199.58 171.11 171.19 164.63 163.09 189.29 228.43 232.14 239.68
Navigation 81.85 66.37 57.62 90.31 74.01 69.39 73.83 79.82 61.63 76.45
Multilateral operations C C C C C C C C C C
CO2 emissions from biomass 1,750.22 1,559.35 1,751.41 1,432.17 1,450.59 1,864.85 1,861.07 1,723.86 1,778.82 1,563.68
CO2 captured NO NO NO NO NO NO NO NO NO NO
Long-term storage of C in waste disposal sites NE NE NE NE NE NE NE NE NE NE
Indirect N2O
Indirect CO2 (3) NA, NO NA, NO NA, NO NA, NO NA, NO NA, NO NA, NO NA, NO NA, NO NA, NO
Total CO2 equivalent emissions without land use, land-use change and forestry 26,442.09 27,417.21 27,039.08 28,132.15 29,160.89 30,415.34 30,446.35 30,729.27 31,032.68 32,383.15
Total CO2 equivalent emissions with land use, land-use change and forestry 18,961.59 19,687.62 19,876.99 20,934.36 21,788.53 23,484.09 23,727.54 23,732.64 24,200.23 26,092.44
Total CO2 equivalent emissions, including indirect CO2, without land use, land-use
change and forestry
19,654.34 20,532.83 20,073.72 21,211.51 22,309.20 23,666.57 23,330.04 23,753.49 23,980.14 25,238.58
Total CO2 equivalent emissions, including indirect CO2, with land use, land-use
change and forestry
12,093.35 12,789.51 12,743.58 13,977.37 14,921.84 16,663.60 16,600.92 16,746.51 17,131.30 18,887.63
GREENHOUSE GAS SOURCE AND SINK CATEGORIES
SECOND BIENNIAL REPORT OF THE REPUBLIC OF CROATIA
Page 20/38
Data on Total CO2 equivalent emissions, including indirect CO2, without land use, land-use change and forestry and Total CO2 equivalent emissions, including indirect CO2, with land use, land-use change and forestry are not correcty transferred from CRF table. For correct data please use last National Inventory Report of Republic of Croatia (NIR 2015) submited to UNFCCC on 6 November 2015
Table 1(a) HRV_BR2_v0.1
Emission trends (CO2) Source: Submission 2016 v2, CROATIA
(Sheet 3 of 3) #REF!
2008 2009 2010 2011 2012 2013 Change
from base
to latest
reported
year
%
1. Energy 21,103.70 19,946.87 19,112.82 18,767.45 17,103.43 16,605.25 -21.74
A. Fuel combustion (sectoral approach) 20,202.28 19,115.65 18,317.65 17,977.62 16,436.54 15,949.64 -21.23
1. Energy industries 6,789.87 6,403.19 5,904.99 6,152.17 5,499.87 5,109.51 -28.71
2. Manufacturing industries and construction 3,872.78 3,157.36 3,015.80 2,779.55 2,409.07 2,380.65 -56.73
3. Transport 6,097.85 6,100.75 5,890.70 5,764.05 5,585.99 5,679.83 44.28
4. Other sectors 3,441.78 3,454.34 3,506.16 3,281.84 2,941.62 2,779.65 -23.70
5. Other NO NO NO NO NO NO
B. Fugitive emissions from fuels 901.42 831.22 795.17 789.83 666.88 655.61 -32.49
1. Solid fuels NO NO NO NO NO NO
2. Oil and natural gas and other emissions from energy production 901.42 831.22 795.17 789.83 666.88 655.61 -32.49
C. CO2 transport and storage NO NO NO NO NO NO
2. Industrial processes 2,823.93 2,217.23 2,239.13 2,000.68 1,822.81 1,945.57 -30.63
A. Mineral industry 1,856.99 1,460.61 1,432.29 1,220.06 1,191.09 1,291.40 0.82
B. Chemical industry 677.48 524.80 594.74 571.33 478.93 485.96 -37.04
C. Metal industry 24.15 11.56 27.55 29.45 1.76 16.60 -95.10
D. Non-energy products from fuels and solvent use 265.30 220.27 184.55 179.84 151.03 151.60 -63.32
E. Electronic industry
F. Product uses as ODS substitutes
G. Other product manufacture and use NO NO NO NO NO NO
H. Other NA NA NA NA NA NA
3. Agriculture 96.60 76.96 80.05 98.31 96.45 69.99 39.92
A. Enteric fermentation
B. Manure management
C. Rice cultivation
D. Agricultural soils
E. Prescribed burning of savannas
F. Field burning of agricultural residues
G. Liming 20.78 11.92 13.47 14.45 9.60 9.60
H. Urea application 75.83 65.04 66.58 83.86 86.85 60.39 20.73
I. Other carbon-containing fertilizers NA NA NA NA NA NA
J. Other
4. Land Use, Land-Use Change and Forestry -6,430.45 -6,520.55 -6,271.55 -5,229.09 -5,111.71 -5,138.88 -7.30
A. Forest land -6,609.15 -6,824.05 -6,583.46 -5,509.41 -5,411.54 -5,491.49 -2.43
B. Cropland 118.33 60.66 135.03 114.66 191.56 160.55 -26.35
C. Grassland -146.85 -98.32 -110.91 -94.55 -134.54 -103.50 -0.45
D. Wetlands 22.79 20.86 18.92 17.32 15.73 14.13 -52.90
E. Settlements 474.00 482.95 502.38 501.34 534.71 545.56 127.02
F. Other land NO NO NO NO NO NO
G. Harvested wood products -289.58 -162.65 -233.51 -258.46 -307.63 -264.12 -11.85
H. Other NO NO NO NO NO NO
5. Waste 0.67 0.16 0.05 0.05 0.08 0.04 -92.11
A. Solid waste disposal NA, NO NA, NO NA, NO NA, NO NA, NO NA, NO
B. Biological treatment of solid waste
C. Incineration and open burning of waste 0.67 0.16 0.05 0.05 0.08 0.04 -92.11
D. Waste water treatment and discharge
E. Other NO NO NO NO NO NO
6. Other (as specified in the summary table in CRF)
Memo items:
International bunkers 335.71 251.31 264.29 330.90 262.10 290.71 -41.15
Aviation 268.20 229.46 244.66 254.92 262.10 290.71 -16.16
Navigation 67.50 21.85 19.64 75.97 NO NO
Multilateral operations C C C C C C
CO2 emissions from biomass 1,555.91 1,709.23 1,872.38 2,129.98 2,402.65 2,249.66 -11.44
CO2 captured NO NO NO NO NO NO
Long-term storage of C in waste disposal sites NE NE NE NE NE NE
Indirect N2O
Indirect CO2 (3) NA, NO NA, NO NA, NO NA, NO NA, NO NA, NO
Total CO2 equivalent emissions without land use, land-use change and forestry 31,129.23 29,063.35 28,326.05 27,719.29 25,505.09 24,492.78 -30.25
Total CO2 equivalent emissions with land use, land-use change and forestry 24,722.21 22,559.06 22,065.71 22,531.52 20,468.71 19,367.59 -34.52
Total CO2 equivalent emissions, including indirect CO2, without land use, land-use
change and forestry
24,024.90 22,241.22 21,432.05 20,866.49 19,022.78 18,620.85 -22.65
Total CO2 equivalent emissions, including indirect CO2, with land use, land-use
change and forestry
17,594.45 15,720.67 15,160.49 15,637.40 13,911.07 13,481.96 -27.25
GREENHOUSE GAS SOURCE AND SINK CATEGORIES
SECOND BIENNIAL REPORT OF THE REPUBLIC OF CROATIA
Page 21/38
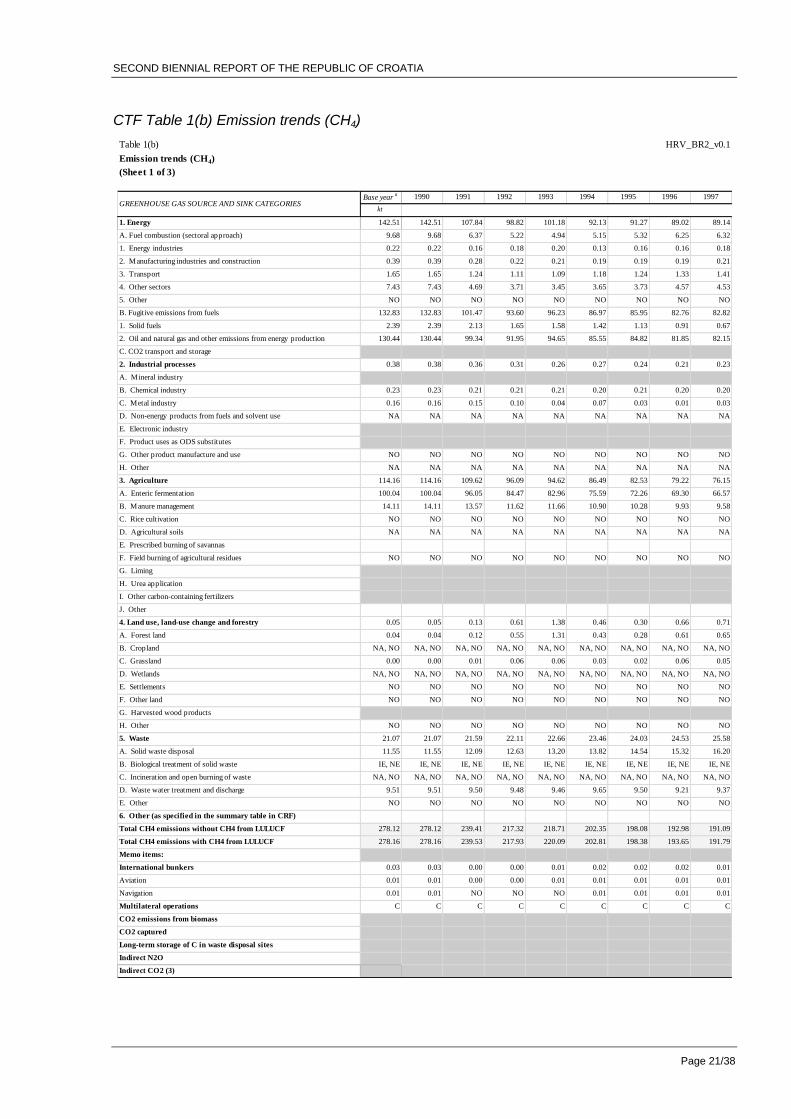
CTF Table 1(b) Emission trends (CH4)
Table 1(b) HRV_BR2_v0.1
Emission trends (CH4) Source: Submission 2016 v2, CROATIA
(Sheet 1 of 3) #REF!
Base yeara 1990 1991 1992 1993 1994 1995 1996 1997
kt
1. Energy 142.51 142.51 107.84 98.82 101.18 92.13 91.27 89.02 89.14
A. Fuel combustion (sectoral approach) 9.68 9.68 6.37 5.22 4.94 5.15 5.32 6.25 6.32
1. Energy industries 0.22 0.22 0.16 0.18 0.20 0.13 0.16 0.16 0.18
2. Manufacturing industries and construction 0.39 0.39 0.28 0.22 0.21 0.19 0.19 0.19 0.21
3. Transport 1.65 1.65 1.24 1.11 1.09 1.18 1.24 1.33 1.41
4. Other sectors 7.43 7.43 4.69 3.71 3.45 3.65 3.73 4.57 4.53
5. Other NO NO NO NO NO NO NO NO NO
B. Fugitive emissions from fuels 132.83 132.83 101.47 93.60 96.23 86.97 85.95 82.76 82.82
1. Solid fuels 2.39 2.39 2.13 1.65 1.58 1.42 1.13 0.91 0.67
2. Oil and natural gas and other emissions from energy production 130.44 130.44 99.34 91.95 94.65 85.55 84.82 81.85 82.15
C. CO2 transport and storage
2. Industrial processes 0.38 0.38 0.36 0.31 0.26 0.27 0.24 0.21 0.23
A. Mineral industry
B. Chemical industry 0.23 0.23 0.21 0.21 0.21 0.20 0.21 0.20 0.20
C. Metal industry 0.16 0.16 0.15 0.10 0.04 0.07 0.03 0.01 0.03
D. Non-energy products from fuels and solvent use NA NA NA NA NA NA NA NA NA
E. Electronic industry
F. Product uses as ODS substitutes
G. Other product manufacture and use NO NO NO NO NO NO NO NO NO
H. Other NA NA NA NA NA NA NA NA NA
3. Agriculture 114.16 114.16 109.62 96.09 94.62 86.49 82.53 79.22 76.15
A. Enteric fermentation 100.04 100.04 96.05 84.47 82.96 75.59 72.26 69.30 66.57
B. Manure management 14.11 14.11 13.57 11.62 11.66 10.90 10.28 9.93 9.58
C. Rice cultivation NO NO NO NO NO NO NO NO NO
D. Agricultural soils NA NA NA NA NA NA NA NA NA
E. Prescribed burning of savannas
F. Field burning of agricultural residues NO NO NO NO NO NO NO NO NO
G. Liming
H. Urea application
I. Other carbon-containing fertilizers
J. Other
4. Land use, land-use change and forestry 0.05 0.05 0.13 0.61 1.38 0.46 0.30 0.66 0.71
A. Forest land 0.04 0.04 0.12 0.55 1.31 0.43 0.28 0.61 0.65
B. Cropland NA, NO NA, NO NA, NO NA, NO NA, NO NA, NO NA, NO NA, NO NA, NO
C. Grassland 0.00 0.00 0.01 0.06 0.06 0.03 0.02 0.06 0.05
D. Wetlands NA, NO NA, NO NA, NO NA, NO NA, NO NA, NO NA, NO NA, NO NA, NO
E. Settlements NO NO NO NO NO NO NO NO NO
F. Other land NO NO NO NO NO NO NO NO NO
G. Harvested wood products
H. Other NO NO NO NO NO NO NO NO NO
5. Waste 21.07 21.07 21.59 22.11 22.66 23.46 24.03 24.53 25.58
A. Solid waste disposal 11.55 11.55 12.09 12.63 13.20 13.82 14.54 15.32 16.20
B. Biological treatment of solid waste IE, NE IE, NE IE, NE IE, NE IE, NE IE, NE IE, NE IE, NE IE, NE
C. Incineration and open burning of waste NA, NO NA, NO NA, NO NA, NO NA, NO NA, NO NA, NO NA, NO NA, NO
D. Waste water treatment and discharge 9.51 9.51 9.50 9.48 9.46 9.65 9.50 9.21 9.37
E. Other NO NO NO NO NO NO NO NO NO
6. Other (as specified in the summary table in CRF)
Total CH4 emissions without CH4 from LULUCF 278.12 278.12 239.41 217.32 218.71 202.35 198.08 192.98 191.09
Total CH4 emissions with CH4 from LULUCF 278.16 278.16 239.53 217.93 220.09 202.81 198.38 193.65 191.79
Memo items:
International bunkers 0.03 0.03 0.00 0.00 0.01 0.02 0.02 0.02 0.01
Aviation 0.01 0.01 0.00 0.00 0.01 0.01 0.01 0.01 0.01
Navigation 0.01 0.01 NO NO NO 0.01 0.01 0.01 0.01
Multilateral operations C C C C C C C C C
CO2 emissions from biomass
CO2 captured
Long-term storage of C in waste disposal sites
Indirect N2O
Indirect CO2 (3)
GREENHOUSE GAS SOURCE AND SINK CATEGORIES
SECOND BIENNIAL REPORT OF THE REPUBLIC OF CROATIA
Page 22/38
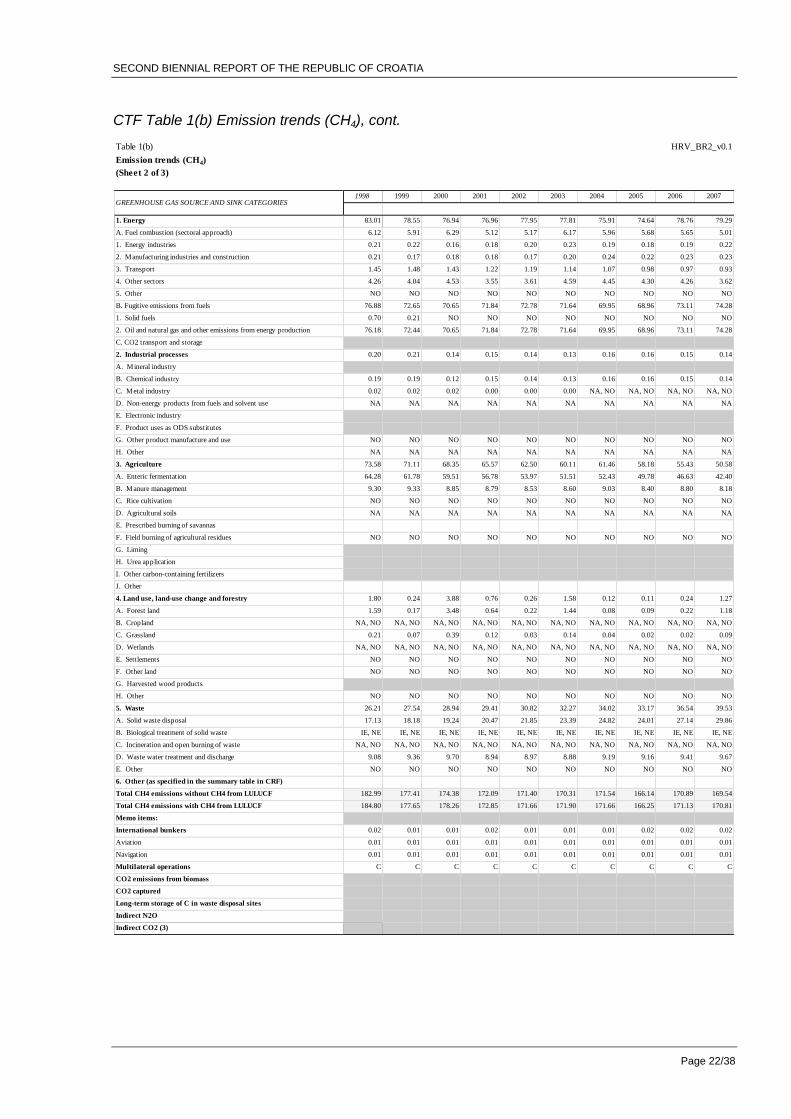
CTF Table 1(b) Emission trends (CH4), cont.
Table 1(b) HRV_BR2_v0.1
Emission trends (CH4) Source: Submission 2016 v2, CROATIA
(Sheet 2 of 3) #REF!
1998 1999 2000 2001 2002 2003 2004 2005 2006 2007
1. Energy 83.01 78.55 76.94 76.96 77.95 77.81 75.91 74.64 78.76 79.29
A. Fuel combustion (sectoral approach) 6.12 5.91 6.29 5.12 5.17 6.17 5.96 5.68 5.65 5.01
1. Energy industries 0.21 0.22 0.16 0.18 0.20 0.23 0.19 0.18 0.19 0.22
2. Manufacturing industries and construction 0.21 0.17 0.18 0.18 0.17 0.20 0.24 0.22 0.23 0.23
3. Transport 1.45 1.48 1.43 1.22 1.19 1.14 1.07 0.98 0.97 0.93
4. Other sectors 4.26 4.04 4.53 3.55 3.61 4.59 4.45 4.30 4.26 3.62
5. Other NO NO NO NO NO NO NO NO NO NO
B. Fugitive emissions from fuels 76.88 72.65 70.65 71.84 72.78 71.64 69.95 68.96 73.11 74.28
1. Solid fuels 0.70 0.21 NO NO NO NO NO NO NO NO
2. Oil and natural gas and other emissions from energy production 76.18 72.44 70.65 71.84 72.78 71.64 69.95 68.96 73.11 74.28
C. CO2 transport and storage
2. Industrial processes 0.20 0.21 0.14 0.15 0.14 0.13 0.16 0.16 0.15 0.14
A. Mineral industry
B. Chemical industry 0.19 0.19 0.12 0.15 0.14 0.13 0.16 0.16 0.15 0.14
C. Metal industry 0.02 0.02 0.02 0.00 0.00 0.00 NA, NO NA, NO NA, NO NA, NO
D. Non-energy products from fuels and solvent use NA NA NA NA NA NA NA NA NA NA
E. Electronic industry
F. Product uses as ODS substitutes
G. Other product manufacture and use NO NO NO NO NO NO NO NO NO NO
H. Other NA NA NA NA NA NA NA NA NA NA
3. Agriculture 73.58 71.11 68.35 65.57 62.50 60.11 61.46 58.18 55.43 50.58
A. Enteric fermentation 64.28 61.78 59.51 56.78 53.97 51.51 52.43 49.78 46.63 42.40
B. Manure management 9.30 9.33 8.85 8.79 8.53 8.60 9.03 8.40 8.80 8.18
C. Rice cultivation NO NO NO NO NO NO NO NO NO NO
D. Agricultural soils NA NA NA NA NA NA NA NA NA NA
E. Prescribed burning of savannas
F. Field burning of agricultural residues NO NO NO NO NO NO NO NO NO NO
G. Liming
H. Urea application
I. Other carbon-containing fertilizers
J. Other
4. Land use, land-use change and forestry 1.80 0.24 3.88 0.76 0.26 1.58 0.12 0.11 0.24 1.27
A. Forest land 1.59 0.17 3.48 0.64 0.22 1.44 0.08 0.09 0.22 1.18
B. Cropland NA, NO NA, NO NA, NO NA, NO NA, NO NA, NO NA, NO NA, NO NA, NO NA, NO
C. Grassland 0.21 0.07 0.39 0.12 0.03 0.14 0.04 0.02 0.02 0.09
D. Wetlands NA, NO NA, NO NA, NO NA, NO NA, NO NA, NO NA, NO NA, NO NA, NO NA, NO
E. Settlements NO NO NO NO NO NO NO NO NO NO
F. Other land NO NO NO NO NO NO NO NO NO NO
G. Harvested wood products
H. Other NO NO NO NO NO NO NO NO NO NO
5. Waste 26.21 27.54 28.94 29.41 30.82 32.27 34.02 33.17 36.54 39.53
A. Solid waste disposal 17.13 18.18 19.24 20.47 21.85 23.39 24.82 24.01 27.14 29.86
B. Biological treatment of solid waste IE, NE IE, NE IE, NE IE, NE IE, NE IE, NE IE, NE IE, NE IE, NE IE, NE
C. Incineration and open burning of waste NA, NO NA, NO NA, NO NA, NO NA, NO NA, NO NA, NO NA, NO NA, NO NA, NO
D. Waste water treatment and discharge 9.08 9.36 9.70 8.94 8.97 8.88 9.19 9.16 9.41 9.67
E. Other NO NO NO NO NO NO NO NO NO NO
6. Other (as specified in the summary table in CRF)
Total CH4 emissions without CH4 from LULUCF 182.99 177.41 174.38 172.09 171.40 170.31 171.54 166.14 170.89 169.54
Total CH4 emissions with CH4 from LULUCF 184.80 177.65 178.26 172.85 171.66 171.90 171.66 166.25 171.13 170.81
Memo items:
International bunkers 0.02 0.01 0.01 0.02 0.01 0.01 0.01 0.02 0.02 0.02
Aviation 0.01 0.01 0.01 0.01 0.01 0.01 0.01 0.01 0.01 0.01
Navigation 0.01 0.01 0.01 0.01 0.01 0.01 0.01 0.01 0.01 0.01
Multilateral operations C C C C C C C C C C
CO2 emissions from biomass
CO2 captured
Long-term storage of C in waste disposal sites
Indirect N2O
Indirect CO2 (3)
GREENHOUSE GAS SOURCE AND SINK CATEGORIES
SECOND BIENNIAL REPORT OF THE REPUBLIC OF CROATIA
Page 23/38
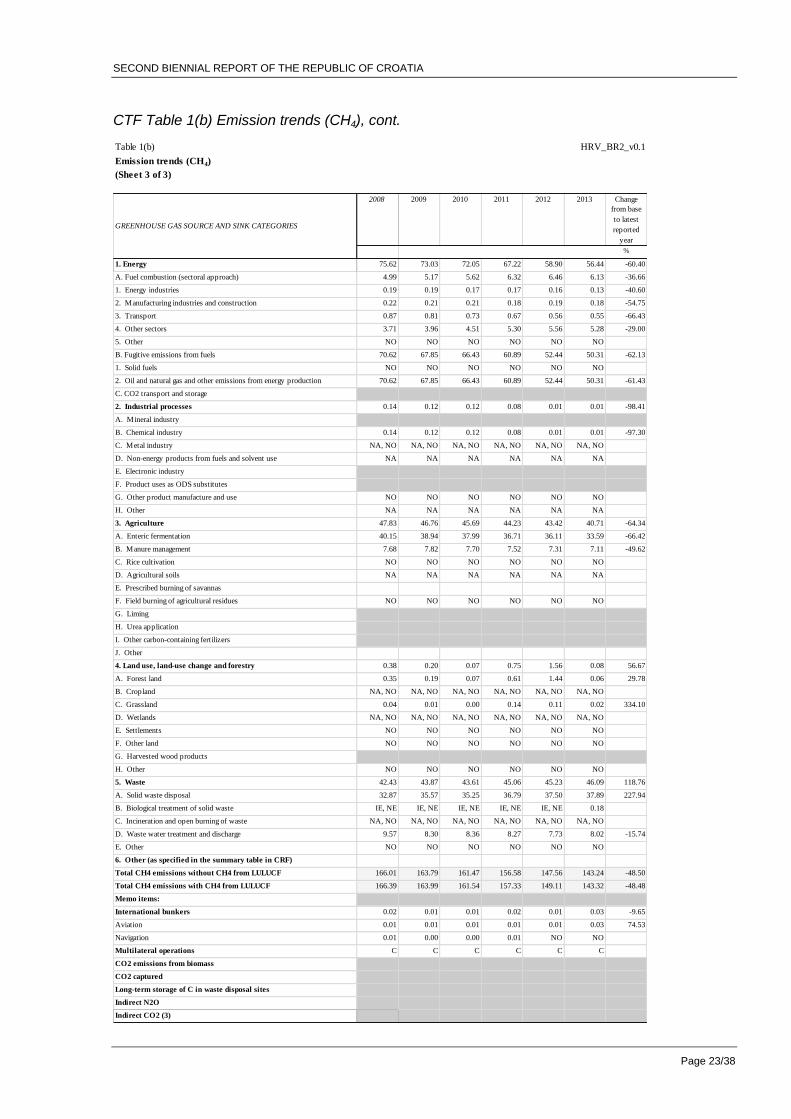
CTF Table 1(b) Emission trends (CH4), cont.
Table 1(b) HRV_BR2_v0.1
Emission trends (CH4) Source: Submission 2016 v2, CROATIA
(Sheet 3 of 3) #REF!
2008 2009 2010 2011 2012 2013 Change
from base
to latest
reported
year
%
1. Energy 75.62 73.03 72.05 67.22 58.90 56.44 -60.40
A. Fuel combustion (sectoral approach) 4.99 5.17 5.62 6.32 6.46 6.13 -36.66
1. Energy industries 0.19 0.19 0.17 0.17 0.16 0.13 -40.60
2. Manufacturing industries and construction 0.22 0.21 0.21 0.18 0.19 0.18 -54.75
3. Transport 0.87 0.81 0.73 0.67 0.56 0.55 -66.43
4. Other sectors 3.71 3.96 4.51 5.30 5.56 5.28 -29.00
5. Other NO NO NO NO NO NO
B. Fugitive emissions from fuels 70.62 67.85 66.43 60.89 52.44 50.31 -62.13
1. Solid fuels NO NO NO NO NO NO
2. Oil and natural gas and other emissions from energy production 70.62 67.85 66.43 60.89 52.44 50.31 -61.43
C. CO2 transport and storage
2. Industrial processes 0.14 0.12 0.12 0.08 0.01 0.01 -98.41
A. Mineral industry
B. Chemical industry 0.14 0.12 0.12 0.08 0.01 0.01 -97.30
C. Metal industry NA, NO NA, NO NA, NO NA, NO NA, NO NA, NO
D. Non-energy products from fuels and solvent use NA NA NA NA NA NA
E. Electronic industry
F. Product uses as ODS substitutes
G. Other product manufacture and use NO NO NO NO NO NO
H. Other NA NA NA NA NA NA
3. Agriculture 47.83 46.76 45.69 44.23 43.42 40.71 -64.34
A. Enteric fermentation 40.15 38.94 37.99 36.71 36.11 33.59 -66.42
B. Manure management 7.68 7.82 7.70 7.52 7.31 7.11 -49.62
C. Rice cultivation NO NO NO NO NO NO
D. Agricultural soils NA NA NA NA NA NA
E. Prescribed burning of savannas
F. Field burning of agricultural residues NO NO NO NO NO NO
G. Liming
H. Urea application
I. Other carbon-containing fertilizers
J. Other
4. Land use, land-use change and forestry 0.38 0.20 0.07 0.75 1.56 0.08 56.67
A. Forest land 0.35 0.19 0.07 0.61 1.44 0.06 29.78
B. Cropland NA, NO NA, NO NA, NO NA, NO NA, NO NA, NO
C. Grassland 0.04 0.01 0.00 0.14 0.11 0.02 334.10
D. Wetlands NA, NO NA, NO NA, NO NA, NO NA, NO NA, NO
E. Settlements NO NO NO NO NO NO
F. Other land NO NO NO NO NO NO
G. Harvested wood products
H. Other NO NO NO NO NO NO
5. Waste 42.43 43.87 43.61 45.06 45.23 46.09 118.76
A. Solid waste disposal 32.87 35.57 35.25 36.79 37.50 37.89 227.94
B. Biological treatment of solid waste IE, NE IE, NE IE, NE IE, NE IE, NE 0.18
C. Incineration and open burning of waste NA, NO NA, NO NA, NO NA, NO NA, NO NA, NO
D. Waste water treatment and discharge 9.57 8.30 8.36 8.27 7.73 8.02 -15.74
E. Other NO NO NO NO NO NO
6. Other (as specified in the summary table in CRF)
Total CH4 emissions without CH4 from LULUCF 166.01 163.79 161.47 156.58 147.56 143.24 -48.50
Total CH4 emissions with CH4 from LULUCF 166.39 163.99 161.54 157.33 149.11 143.32 -48.48
Memo items:
International bunkers 0.02 0.01 0.01 0.02 0.01 0.03 -9.65
Aviation 0.01 0.01 0.01 0.01 0.01 0.03 74.53
Navigation 0.01 0.00 0.00 0.01 NO NO
Multilateral operations C C C C C C
CO2 emissions from biomass
CO2 captured
Long-term storage of C in waste disposal sites
Indirect N2O
Indirect CO2 (3)
GREENHOUSE GAS SOURCE AND SINK CATEGORIES

SECOND BIENNIAL REPORT OF THE REPUBLIC OF CROATIA
Page 24/38
CTF Table 1(c) Emission trends (N2O)
Table 1(c) HRV_BR2_v0.1
Emission trends (N2O) Source: Submission 2016 v2, CROATIA
(Sheet 1 of 3) #REF!
Base yeara 1990 1991 1992 1993 1994 1995 1996 1997
kt
1. Energy 0.41 0.41 0.30 0.27 0.30 0.30 0.28 0.39 0.43
A. Fuel combustion (sectoral approach) 0.40 0.40 0.30 0.27 0.30 0.29 0.28 0.39 0.43
1. Energy industries 0.06 0.06 0.04 0.05 0.06 0.04 0.04 0.04 0.05
2. Manufacturing industries and construction 0.06 0.06 0.04 0.03 0.03 0.03 0.03 0.03 0.03
3. Transport 0.18 0.18 0.15 0.13 0.16 0.17 0.15 0.24 0.28
4. Other sectors 0.10 0.10 0.07 0.06 0.05 0.06 0.06 0.07 0.07
5. Other NO NO NO NO NO NO NO NO NO
B. Fugitive emissions from fuels 0.00 0.00 0.00 0.00 0.00 0.00 0.00 0.00 0.00
1. Solid fuels NO, NA NO, NA NO, NA NO, NA NO, NA NO, NA NO, NA NO, NA NO, NA
2. Oil and natural gas and other emissions from energy production 0.00 0.00 0.00 0.00 0.00 0.00 0.00 0.00 0.00
C. CO2 transport and storage
2. Industrial processes 2.64 2.64 2.34 3.02 2.30 2.48 2.39 2.23 2.34
A. Mineral industry
B. Chemical industry 2.53 2.53 2.22 2.90 2.19 2.37 2.28 2.12 2.23
C. Metal industry NO NO NO NO NO NO NO NO NO
D. Non-energy products from fuels and solvent use NA NA NA NA NA NA NA NA NA
E. Electronic industry
F. Product uses as ODS substitutes
G. Other product manufacture and use 0.11 0.11 0.11 0.11 0.11 0.11 0.11 0.11 0.11
H. Other NA NA NA NA NA NA NA NA NA
3. Agriculture 6.25 6.25 6.13 5.58 4.94 4.76 4.62 4.60 5.09
A. Enteric fermentation
B. Manure management 1.09 1.09 1.04 0.85 0.86 0.78 0.75 0.72 0.67
C. Rice cultivation
D. Agricultural soils 5.16 5.16 5.09 4.73 4.08 3.97 3.87 3.89 4.41
E. Prescribed burning of savannas
F. Field burning of agricultural residues NO NO NO NO NO NO NO NO NO
G. Liming
H. Urea application
I. Other carbon containing fertlizers
J. Other
4. Land use, land-use change and forestry 0.02 0.02 0.02 0.05 0.09 0.04 0.03 0.05 0.05
A. Forest land 0.00 0.00 0.01 0.03 0.07 0.02 0.02 0.03 0.04
B. Cropland 0.02 0.02 0.02 0.01 0.01 0.01 0.01 0.01 0.01
C. Grassland 0.00 0.00 0.00 0.01 0.01 0.00 0.00 0.01 0.00
D. Wetlands NA, NO NA, NO NA, NO NA, NO NA, NO NA, NO NA, NO NA, NO NA, NO
E. Settlements NO NO NO NO NO NO NO NO NO
F. Other land NO NO NO NO NO NO NO NO NO
G. Harvested wood products
H. Other NO NO NO NO NO NO NO NO NO
5. Waste 0.22 0.22 0.21 0.21 0.21 0.22 0.24 0.23 0.23
A. Solid waste disposal
B. Biological treatment of solid waste IE, NE, NA IE, NE, NA IE, NE, NA IE, NE, NA IE, NE, NA IE, NE, NA IE, NE, NA IE, NE, NA IE, NE, NA
C. Incineration and open burning of waste 0.00 0.00 0.00 0.00 0.00 0.00 0.00 0.00 0.00
D. Waste water treatment and discharge 0.22 0.22 0.21 0.21 0.21 0.22 0.24 0.23 0.23
E. Other NO NO NO NO NO NO NO NO NO
6. Other (as specified in the summary table in CRF)
Total direct N2O emissions without N2O from LULUCF 9.52 9.52 8.98 9.08 7.76 7.76 7.53 7.46 8.10
Total direct N2O emissions with N2O from LULUCF 9.54 9.54 9.00 9.13 7.85 7.80 7.56 7.51 8.15
Memo items:
International bunkers 0.01 0.01 0.00 0.00 0.00 0.01 0.00 0.00 0.00
Aviation 0.00 0.00 0.00 0.00 0.00 0.00 0.00 0.00 0.00
Navigation 0.00 0.00 NO NO NO 0.00 0.00 0.00 0.00
Multilateral operations C C C C C C C C C
CO2 emissions from biomass
CO2 captured
Long-term storage of C in waste disposal sites
Indirect N2O NA, NO NA, NO NA, NO NA, NO NA, NO NA, NO NA, NO NA, NO NA, NO
Indirect CO2 (3)
GREENHOUSE GAS SOURCE AND SINK CATEGORIES
SECOND BIENNIAL REPORT OF THE REPUBLIC OF CROATIA
Page 25/38
CTF Table 1(c) Emission trends (N2O), cont.
Table 1(c) HRV_BR2_v0.1
Emission trends (N2O) Source: Submission 2016 v2, CROATIA
(Sheet 2 of 3) #REF!
1998 1999 2000 2001 2002 2003 2004 2005 2006 2007
1. Energy 0.35 0.50 0.53 0.51 0.39 0.42 0.58 0.41 0.43 0.45
A. Fuel combustion (sectoral approach) 0.35 0.50 0.53 0.51 0.39 0.42 0.58 0.41 0.43 0.45
1. Energy industries 0.06 0.06 0.06 0.07 0.08 0.09 0.08 0.08 0.08 0.09
2. Manufacturing industries and construction 0.03 0.03 0.03 0.03 0.03 0.03 0.04 0.03 0.04 0.04
3. Transport 0.20 0.35 0.37 0.35 0.22 0.22 0.39 0.23 0.25 0.26
4. Other sectors 0.07 0.07 0.07 0.06 0.06 0.08 0.07 0.07 0.07 0.06
5. Other NO NO NO NO NO NO NO NO NO NO
B. Fugitive emissions from fuels 0.00 0.00 0.00 0.00 0.00 0.00 0.00 0.00 0.00 0.00
1. Solid fuels NO, NA NO, NA NO, NA NO, NA NO, NA NO, NA NO, NA NO, NA NO, NA NO, NA
2. Oil and natural gas and other emissions from energy production 0.00 0.00 0.00 0.00 0.00 0.00 0.00 0.00 0.00 0.00
C. CO2 transport and storage
2. Industrial processes 1.79 2.09 2.44 2.07 2.01 1.91 2.30 2.25 2.22 2.44
A. Mineral industry
B. Chemical industry 1.68 1.98 2.33 1.95 1.90 1.80 2.19 2.14 2.11 2.33
C. Metal industry NO NO NO NO NO NO NO NO NO NO
D. Non-energy products from fuels and solvent use NA NA NA NA NA NA NA NA NA NA
E. Electronic industry
F. Product uses as ODS substitutes
G. Other product manufacture and use 0.11 0.11 0.11 0.11 0.11 0.11 0.11 0.11 0.11 0.11
H. Other NA NA NA NA NA NA NA NA NA NA
3. Agriculture 4.55 4.78 4.83 5.16 5.02 4.70 5.14 5.20 4.93 4.96
A. Enteric fermentation
B. Manure management 0.67 0.68 0.62 0.64 0.62 0.60 0.66 0.61 0.63 0.58
C. Rice cultivation
D. Agricultural soils 3.88 4.10 4.21 4.52 4.41 4.11 4.48 4.58 4.31 4.38
E. Prescribed burning of savannas
F. Field burning of agricultural residues NO NO NO NO NO NO NO NO NO NO
G. Liming
H. Urea application
I. Other carbon containing fertlizers
J. Other
4. Land use, land-use change and forestry 0.12 0.03 0.24 0.06 0.03 0.11 0.02 0.03 0.03 0.10
A. Forest land 0.09 0.01 0.19 0.04 0.01 0.08 0.00 0.00 0.01 0.07
B. Cropland 0.01 0.01 0.01 0.01 0.01 0.02 0.02 0.02 0.02 0.02
C. Grassland 0.02 0.01 0.04 0.01 0.00 0.01 0.00 0.00 0.00 0.01
D. Wetlands NA, NO NA, NO NA, NO NA, NO NA, NO NA, NO NA, NO NA, NO NA, NO NA, NO
E. Settlements NO NO NO NO NO NO NO NO NO NO
F. Other land NO NO NO NO NO NO NO NO NO NO
G. Harvested wood products
H. Other NO NO NO NO NO NO NO NO NO NO
5. Waste 0.23 0.24 0.24 0.25 0.26 0.26 0.26 0.27 0.28 0.28
A. Solid waste disposal
B. Biological treatment of solid waste IE, NE, NA IE, NE, NA IE, NE, NA IE, NE, NA IE, NE, NA IE, NE, NA IE, NE, NA IE, NE, NA IE, NE, NA IE, NE, NA
C. Incineration and open burning of waste 0.00 0.00 0.00 0.00 0.00 0.00 0.00 0.00 0.00 0.00
D. Waste water treatment and discharge 0.23 0.24 0.23 0.25 0.26 0.26 0.26 0.27 0.28 0.28
E. Other NO NO NO NO NO NO NO NO NO NO
6. Other (as specified in the summary table in CRF)
Total direct N2O emissions without N2O from LULUCF 6.92 7.62 8.04 7.99 7.69 7.29 8.28 8.13 7.87 8.13
Total direct N2O emissions with N2O from LULUCF 7.04 7.65 8.28 8.05 7.72 7.40 8.30 8.16 7.90 8.23
Memo items:
International bunkers 0.00 0.00 0.00 0.00 0.00 0.00 0.00 0.00 0.00 0.00
Aviation 0.00 0.00 0.00 0.00 0.00 0.00 0.00 0.00 0.00 0.00
Navigation 0.00 0.00 0.00 0.00 0.00 0.00 0.00 0.00 0.00 0.00
Multilateral operations C C C C C C C C C C
CO2 emissions from biomass
CO2 captured
Long-term storage of C in waste disposal sites
Indirect N2O NA, NO NA, NO NA, NO NA, NO NA, NO NA, NO NA, NO NA, NO NA, NO NA, NO
Indirect CO2 (3)
GREENHOUSE GAS SOURCE AND SINK CATEGORIES

SECOND BIENNIAL REPORT OF THE REPUBLIC OF CROATIA
Page 26/38
CTF Table 1(c) Emission trends (N2O), cont.
Table 1(c) HRV_BR2_v0.1
Emission trends (N2O) Source: Submission 2016 v2, CROATIA
(Sheet 3 of 3) #REF!
2008 2009 2010 2011 2012 2013 Change
from base
to latest
reported
year
%
1. Energy 0.42 0.41 0.41 0.37 0.37 0.36 -11.86
A. Fuel combustion (sectoral approach) 0.42 0.41 0.41 0.37 0.37 0.36 -11.57
1. Energy industries 0.08 0.07 0.07 0.07 0.07 0.07 11.86
2. Manufacturing industries and construction 0.03 0.03 0.03 0.03 0.03 0.03 -56.25
3. Transport 0.25 0.24 0.23 0.19 0.19 0.19 3.21
4. Other sectors 0.06 0.06 0.07 0.08 0.08 0.08 -25.21
5. Other NO NO NO NO NO NO
B. Fugitive emissions from fuels 0.00 0.00 0.00 0.00 0.00 0.00 -77.72
1. Solid fuels NO, NA NO, NA NO, NA NO, NA NO, NA NO, NA
2. Oil and natural gas and other emissions from energy production 0.00 0.00 0.00 0.00 0.00 0.00 -77.72
C. CO2 transport and storage
2. Industrial processes 2.49 2.10 2.67 2.64 2.33 0.95 -64.14
A. Mineral industry
B. Chemical industry 2.38 1.99 2.57 2.53 2.19 0.81 -68.13
C. Metal industry NO NO NO NO NO NO
D. Non-energy products from fuels and solvent use NA NA NA NA NA NA
E. Electronic industry
F. Product uses as ODS substitutes
G. Other product manufacture and use 0.11 0.11 0.10 0.11 0.14 0.14 26.03
H. Other NA NA NA NA NA NA
3. Agriculture 5.02 4.66 4.38 4.64 4.46 4.13 -33.94
A. Enteric fermentation
B. Manure management 0.55 0.55 0.54 0.51 0.47 0.47 -56.57
C. Rice cultivation
D. Agricultural soils 4.48 4.11 3.84 4.14 3.99 3.66 -29.18
E. Prescribed burning of savannas
F. Field burning of agricultural residues NO NO NO NO NO NO
G. Liming
H. Urea application
I. Other carbon containing fertlizers
J. Other
4. Land use, land-use change and forestry 0.05 0.04 0.03 0.08 0.12 0.04 113.04
A. Forest land 0.02 0.01 0.00 0.03 0.08 0.00 29.78
B. Cropland 0.02 0.03 0.03 0.03 0.03 0.03 120.63
C. Grassland 0.00 0.00 0.00 0.01 0.01 0.00 334.10
D. Wetlands NA, NO NA, NO NA, NO NA, NO NA, NO NA, NO
E. Settlements NO NO NO NO NO NO
F. Other land NO NO NO NO NO NO
G. Harvested wood products
H. Other NO NO NO NO NO NO
5. Waste 0.29 0.29 0.28 0.28 0.28 0.29 30.23
A. Solid waste disposal
B. Biological treatment of solid waste IE, NE, NA IE, NE, NA IE, NE, NA IE, NE, NA IE, NE, NA 0.01
C. Incineration and open burning of waste 0.00 NA, NO NA, NO NA, NO NA, NO NA, NO
D. Waste water treatment and discharge 0.29 0.29 0.28 0.28 0.28 0.28 24.76
E. Other NO NO NO NO NO NO
6. Other (as specified in the summary table in CRF)
Total direct N2O emissions without N2O from LULUCF 8.23 7.46 7.73 7.94 7.45 5.73 -39.87
Total direct N2O emissions with N2O from LULUCF 8.27 7.50 7.76 8.01 7.57 5.77 -39.57
Memo items:
International bunkers 0.00 0.00 0.00 0.00 0.00 0.00 -64.53
Aviation 0.00 0.00 0.00 0.00 0.00 0.00 -17.32
Navigation 0.00 0.00 0.00 0.00 NO NO
Multilateral operations C C C C C C
CO2 emissions from biomass
CO2 captured
Long-term storage of C in waste disposal sites
Indirect N2O NA, NO NA, NO NA, NO NA, NO NA, NO NA, NO
Indirect CO2 (3)
GREENHOUSE GAS SOURCE AND SINK CATEGORIES
SECOND BIENNIAL REPORT OF THE REPUBLIC OF CROATIA
Page 27/38
CTF Table 1(d) Emission trends (HFCs, PFCs and SF6)
Table 1(d) HRV_BR2_v0.1
Emission trends (HFCs, PFCs and SF6) Source: Submission 2016 v2, CROATIA
(Sheet 1 of 3) #REF!
Base yeara 1990 1991 1992 1993 1994 1995 1996 1997
kt
Emissions of HFCs and PFCs - (kt CO2 equivalent) 1,240.24 1,240.24 850.75 NO NO NO 57.28 80.07 106.14
Emissions of HFCs - (kt CO2 equivalent) NO NO NO NO NO NO 57.28 80.07 106.14
HFC-23 NO NO NO NO NO NO NO NO NO
HFC-32 NO NO NO NO NO NO 0.00 0.00 0.00
HFC-41 NO NO NO NO NO NO NO NO NO
HFC-43-10mee NO NO NO NO NO NO NO NO NO
HFC-125 NO NO NO NO NO NO 0.00 0.00 0.01
HFC-134 NO NO NO NO NO NO NO NO NO
HFC-134a NO NO NO NO NO NO 0.03 0.04 0.05
HFC-143 NO NO NO NO NO NO NO NO NO
HFC-143a NO NO NO NO NO NO 0.00 0.00 0.00
HFC-152 NO NO NO NO NO NO NO NO NO
HFC-152a NO NO NO NO NO NO NO NO NO
HFC-161 NO NO NO NO NO NO NO NO NO
HFC-227ea NO NO NO NO NO NO 0.00 0.00 0.00
HFC-236cb NO NO NO NO NO NO NO NO NO
HFC-236ea NO NO NO NO NO NO NO NO NO
HFC-236fa NO NO NO NO NO NO NO NO NO
HFC-245ca NO NO NO NO NO NO NO NO NO
HFC-245fa NO NO NO NO NO NO NO NO NO
HFC-365mfc NO NO NO NO NO NO NO NO NO
Unspecified mix of HFCs(4) - (kt CO2 equivalent) NO NO NO NO NO NO NO NO NO
Emissions of PFCs - (kt CO2 equivalent) 1,240.24 1,240.24 850.75 NO NO NO NO NO NO
CF4 0.12 0.12 0.08 NO NO NO NO NO NO
C2F6 0.03 0.03 0.02 NO NO NO NO NO NO
C3F8 NO NO NO NO NO NO NO NO NO
C4F10 NO NO NO NO NO NO NO NO NO
c-C4F8 NO NO NO NO NO NO NO NO NO
C5F12 NO NO NO NO NO NO NO NO NO
C6F14 NO NO NO NO NO NO NO NO NO
C10F18 NO NO NO NO NO NO NO NO NO
c-C3F6 NO NO NO NO NO NO NO NO NO
Unspecified mix of PFCs(4) - (kt CO2 equivalent) NO NO NO NO NO NO NO NO NO
Unspecified mix of HFCs and PFCs - (kt CO2 equivalent) NO NO NO NO NO NO NO NO NO
Emissions of SF6 - (kt CO2 equivalent) 10.45 10.45 10.33 10.42 10.53 10.64 11.12 11.57 11.43
SF6 0.00 0.00 0.00 0.00 0.00 0.00 0.00 0.00 0.00
Emissions of NF3 - (kt CO2 equivalent) NO NO NO NO NO NO NO NO NO
NF3 NO NO NO NO NO NO NO NO NO
GREENHOUSE GAS SOURCE AND SINK CATEGORIES
SECOND BIENNIAL REPORT OF THE REPUBLIC OF CROATIA
Page 28/38
CTF Table 1(d) Emission trends (HFCs, PFCs and SF6), cont.
Table 1(d) HRV_BR2_v0.1
Emission trends (HFCs, PFCs and SF6) Source: Submission 2016 v2, CROATIA
(Sheet 2 of 3) #REF!
1998 1999 2000 2001 2002 2003 2004 2005 2006 2007
Emissions of HFCs and PFCs - (kt CO2 equivalent) 139.06 166.70 199.21 224.96 261.93 304.77 347.89 386.12 422.70 469.51
Emissions of HFCs - (kt CO2 equivalent) 139.06 166.70 199.21 224.96 261.93 304.77 347.89 386.12 422.70 469.51
HFC-23 NO NO NO NO NO NO NO NO NO NO
HFC-32 0.00 0.00 0.00 0.00 0.00 0.01 0.01 0.01 0.01 0.01
HFC-41 NO NO NO NO NO NO NO NO NO NO
HFC-43-10mee NO NO NO NO NO NO NO NO NO NO
HFC-125 0.01 0.01 0.01 0.01 0.01 0.01 0.02 0.02 0.02 0.02
HFC-134 NO NO NO NO NO NO NO NO NO NO
HFC-134a 0.06 0.08 0.09 0.11 0.12 0.15 0.17 0.19 0.21 0.23
HFC-143 NO NO NO NO NO NO NO NO NO NO
HFC-143a 0.01 0.01 0.01 0.01 0.01 0.01 0.01 0.01 0.01 0.01
HFC-152 NO NO NO NO NO NO NO NO NO NO
HFC-152a NO NO NO NO NO NO NO NO 0.00 0.00
HFC-161 NO NO NO NO NO NO NO NO NO NO
HFC-227ea 0.00 0.00 0.00 0.00 0.00 0.00 0.00 0.00 0.00 0.00
HFC-236cb NO NO NO NO NO NO NO NO NO NO
HFC-236ea NO NO NO NO NO NO NO NO NO NO
HFC-236fa NO NO NO NO NO NO NO NO 0.00 0.00
HFC-245ca NO NO NO NO NO NO NO NO NO NO
HFC-245fa NO NO NO NO NO NO NO NO NO NO
HFC-365mfc NO NO NO NO NO NO NO NO NO NO
Unspecified mix of HFCs(4) - (kt CO2 equivalent) NO NO NO NO NO NO NO NO NO NO
Emissions of PFCs - (kt CO2 equivalent) NO NO NO NO NO NO NO NO NO NO
CF4 NO NO NO NO NO NO NO NO NO NO
C2F6 NO NO NO NO NO NO NO NO NO NO
C3F8 NO NO NO NO NO NO NO NO NO NO
C4F10 NO NO NO NO NO NO NO NO NO NO
c-C4F8 NO NO NO NO NO NO NO NO NO NO
C5F12 NO NO NO NO NO NO NO NO NO NO
C6F14 NO NO NO NO NO NO NO NO NO NO
C10F18 NO NO NO NO NO NO NO NO NO NO
c-C3F6 NO NO NO NO NO NO NO NO NO NO
Unspecified mix of PFCs(4) - (kt CO2 equivalent) NO NO NO NO NO NO NO NO NO NO
Unspecified mix of HFCs and PFCs - (kt CO2 equivalent) NO NO NO NO NO NO NO NO NO NO
Emissions of SF6 - (kt CO2 equivalent) 11.99 11.99 11.62 11.69 12.01 12.28 12.57 13.03 13.01 13.05
SF6 0.00 0.00 0.00 0.00 0.00 0.00 0.00 0.00 0.00 0.00
Emissions of NF3 - (kt CO2 equivalent) NO NO NO NO NO NO NO NO NO NO
NF3 NO NO NO NO NO NO NO NO NO NO
GREENHOUSE GAS SOURCE AND SINK CATEGORIES
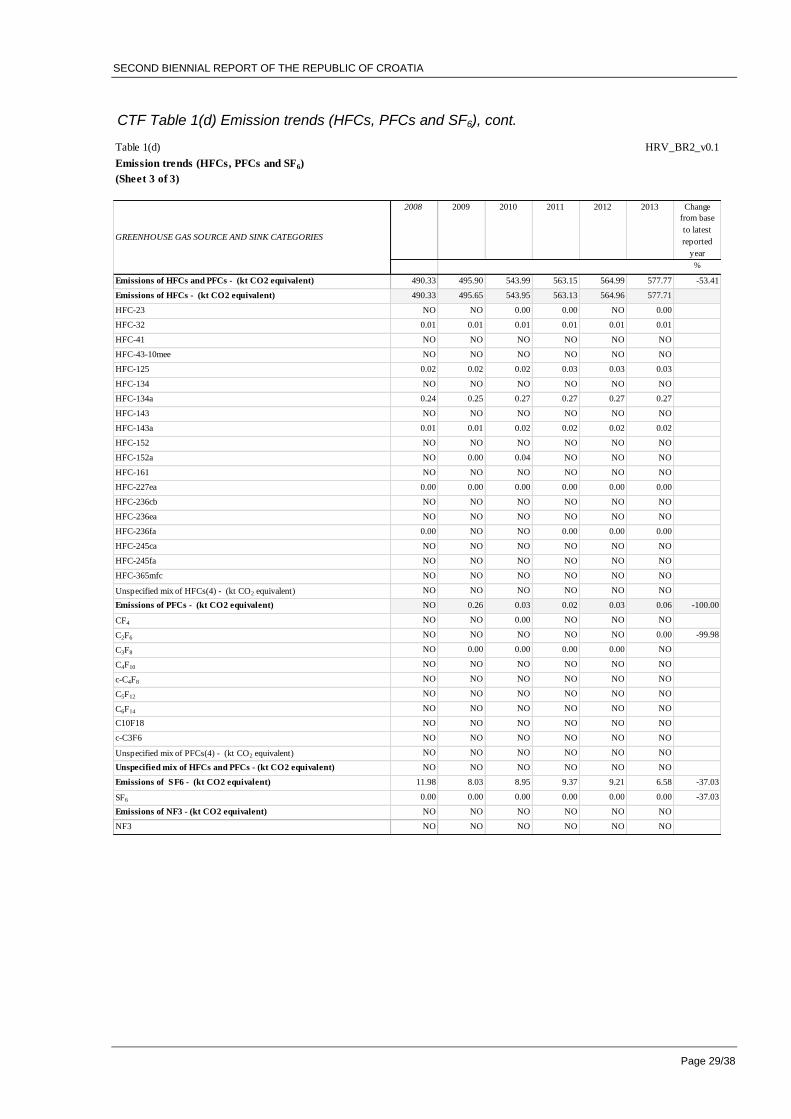
SECOND BIENNIAL REPORT OF THE REPUBLIC OF CROATIA
Page 29/38
CTF Table 1(d) Emission trends (HFCs, PFCs and SF6), cont.
Table 1(d) HRV_BR2_v0.1
Emission trends (HFCs, PFCs and SF6) Source: Submission 2016 v2, CROATIA
(Sheet 3 of 3) #REF!
2008 2009 2010 2011 2012 2013 Change
from base
to latest
reported
year
%
Emissions of HFCs and PFCs - (kt CO2 equivalent) 490.33 495.90 543.99 563.15 564.99 577.77 -53.41
Emissions of HFCs - (kt CO2 equivalent) 490.33 495.65 543.95 563.13 564.96 577.71
HFC-23 NO NO 0.00 0.00 NO 0.00
HFC-32 0.01 0.01 0.01 0.01 0.01 0.01
HFC-41 NO NO NO NO NO NO
HFC-43-10mee NO NO NO NO NO NO
HFC-125 0.02 0.02 0.02 0.03 0.03 0.03
HFC-134 NO NO NO NO NO NO
HFC-134a 0.24 0.25 0.27 0.27 0.27 0.27
HFC-143 NO NO NO NO NO NO
HFC-143a 0.01 0.01 0.02 0.02 0.02 0.02
HFC-152 NO NO NO NO NO NO
HFC-152a NO 0.00 0.04 NO NO NO
HFC-161 NO NO NO NO NO NO
HFC-227ea 0.00 0.00 0.00 0.00 0.00 0.00
HFC-236cb NO NO NO NO NO NO
HFC-236ea NO NO NO NO NO NO
HFC-236fa 0.00 NO NO 0.00 0.00 0.00
HFC-245ca NO NO NO NO NO NO
HFC-245fa NO NO NO NO NO NO
HFC-365mfc NO NO NO NO NO NO
Unspecified mix of HFCs(4) - (kt CO2 equivalent) NO NO NO NO NO NO
Emissions of PFCs - (kt CO2 equivalent) NO 0.26 0.03 0.02 0.03 0.06 -100.00
CF4 NO NO 0.00 NO NO NO
C2F6 NO NO NO NO NO 0.00 -99.98
C3F8 NO 0.00 0.00 0.00 0.00 NO
C4F10 NO NO NO NO NO NO
c-C4F8 NO NO NO NO NO NO
C5F12 NO NO NO NO NO NO
C6F14 NO NO NO NO NO NO
C10F18 NO NO NO NO NO NO
c-C3F6 NO NO NO NO NO NO
Unspecified mix of PFCs(4) - (kt CO2 equivalent) NO NO NO NO NO NO
Unspecified mix of HFCs and PFCs - (kt CO2 equivalent) NO NO NO NO NO NO
Emissions of SF6 - (kt CO2 equivalent) 11.98 8.03 8.95 9.37 9.21 6.58 -37.03
SF6 0.00 0.00 0.00 0.00 0.00 0.00 -37.03
Emissions of NF3 - (kt CO2 equivalent) NO NO NO NO NO NO
NF3 NO NO NO NO NO NO
GREENHOUSE GAS SOURCE AND SINK CATEGORIES
SECOND BIENNIAL REPORT OF THE REPUBLIC OF CROATIA
Page 30/113
1.2. NATIONAL INVENTORY ARRANGEMENTS
Institutional arrangement for inventory preparation in Croatia is regulated in Chapter II of the
Regulation on the Monitoring of Greenhouse Gas Emissions, Policies and Mitigation Measures
in the Republic of Croatia (Official gazette, No. 87/12) entitled National system for the
estimation and reporting of anthropogenic greenhouse gas emissions by sources and removals
by sinks. Institutional arrangements for inventory management and preparation in Croatia could
be characterized as decentralized and out-sourced with clear tasks breakdown between
participating institutions including MENP (MENP), Croatian Agency for the Environment and
Nature (CAEN) and competent governmental bodies responsible for providing of activity data.
The preparation of inventory itself is entrusted to Authorised Institution which is elected for
three-year period by public tendering. Committee for inter-sectorial coordination for national
system for monitoring of GHG emission (National System Commite) is included in the approval
process; its members provide their opinion on certain parts of the Inventory within the frame of
their speciality. Members of the National System Commitee are nominated by the authorized
Ministries upon the request of the MENP.
MENP is a governmental competent authority for the implementation of the UNFCCC and
national focal point for functioning of the National system in a sustainable manner, including:
mediation and exchange of data on greenhouse gas emissions and removals with
international organisations and Parties to the Convention;
mediation and exchange of data with competent bodies and organisations of the European
Union in a manner and within the time limits laid down by legal acts of the European Union;
control of methodology for calculation of greenhouse gas emissions and removals in line
with good practices and national circumstances;
consideration and approval of the National Inventory Report prior to its formal submission to
the Convention Secretariat.
CAEN is responsible for the following tasks:
organisation of greenhouse gas inventory preparation with the aim of meeting the due
deadlines referred to in Article 12 of this Regulation;
collection of activity data referred to in Article 11 the Regulation;
development of quality assurance and quality control plan (QA/QC plan) related to the
greenhouse gas inventory in line with the guidelines on good practices of the
Intergovernmental Panel on Climate Change;
implementation of the quality assurance procedure with regard to the greenhouse gas
inventory in line with the quality assurance and quality control plan;
archiving of activity data on calculation of emissions, emission factors, and of documents
used for inventory planning, preparation, quality control and quality assurance;
SECOND BIENNIAL REPORT OF THE REPUBLIC OF CROATIA
Page 31/113
maintaining of records and reporting on authorised legal persons participating in the Kyoto
Protocol flexible mechanisms;
selection of Authorised Institution (in Croatian: Ovlaštenik) for preparation of the
greenhouse gas inventory.
provide insight into data and documents for the purpose of technical reviews.
Authorised Institution is responsible for preparation of inventory, which include:
emission calculation of all anthropogenic emissions from sources and removals by
greenhouse gas sinks, and calculation of indirect greenhouse gas emissions, in line with
the methodology stipulated by the effective guidelines of the Convention, guidelines of the
Intergovernmental Panel on Climate Change, Instructions for reporting on greenhouse gas
emissions as published on the Ministry's website, and on the basis of the activities data
referred to in Article 11 of this Regulation;
quantitative estimate of the calculation uncertainty referred to in indent 1 of this Article for
each category of source and removal of greenhouse gas emissions, as well as for the
inventory as a whole, in line with the guidelines of the Intergovernmental Panel on Climate
Change;
identification of key categories of greenhouse gas emission sources and removals;
recalculation of greenhouse gas emissions and removals in cases of improvement of
methodology, emission factors or activity data, inclusion of new categories of sources and
sinks, or application of coordination/adjustment methods;
calculation of greenhouse gas emissions or removal from mandatory and selected activities
in the sector of land use, land-use change and forestry;
reporting on issuance, holding, transfer, acquisition, cancellation and retirement of emission
reduction units, certified emission reduction units, assigned amount units and removal units,
and carry-over, into the next commitment period, of emission reduction units, certified
emission reduction units and assigned amount units, from the Registry in line with the
effective decisions and guidelines of the Convention and supporting international treaties;
implementation of and reporting on quality control procedures in line with the quality control
and quality assurance plan;
preparation of the greenhouse gas inventory report, including also all additional
requirements in line with the Convention and supporting international treaties and
decisions;
cooperation with the Secretariat‟s ERTs for the purpose of technical review and
assessment/evaluation of the inventory submissions.
SECOND BIENNIAL REPORT OF THE REPUBLIC OF CROATIA
Page 32/113
EKONERG – Energy and Environmental Protection Institute was selected as Authorised
Institution for preparation of 2015 inventory submission.
1.2.1. CHANGES TO NATIONAL INVENTORY ARRANGEMENTS SINCE THE LAST
BIENNIAL REPORT
In 2015 Croatian Environment Agency changed its name to Croatian Agency for the
Environment and Nature. There are no other changes regarding national system since last
Biennial report.

SECOND BIENNIAL REPORT OF THE REPUBLIC OF CROATIA
Page 33/113
2. QUANTIFIED ECONOMY-WIDE EMISSION REDUCTION TARGET
This section explains the EU 2020 emission reduction target under the UNFCCC and the target
compliance architecture set up within the EU in order to meet that target, and gives an overview
of the emission reduction targets of the Republic of Croatia in the context of the EU emission
target.
2.1. THE EU TARGET UNDER THE CONVENTION
In 2010, the EU submitted a pledge to reduce its GHG emissions by 2020 by 20 % compared to
1990 levels, in order to contribute to achieving the ultimate objective of the UNFCCC: 'to
stabilise GHG concentrations at a level that would prevent dangerous anthropogenic (human-
induced) interference with the climate system' 1 , or, in other words, to limit the global
temperature increase to less than 2°C compared to temperature levels before industrialization
(FCCC/CP/2010/7/Add.1). The EU is also committed to raising this target to a 30 % emission
reduction by 2020 compared with 1990 levels, provided that other developed countries also
commit to achieving comparable emission reductions, and that developing countries contribute
adequately, according to their responsibilities and respective capabilities. This offer was
reiterated in the submission to the UNFCCC by the EU-28 and Iceland on 30 April 20142.
The definition of the Convention target for 2020 is documented in the revised note provided by
the UNFCCC Secretariat on the „Compilation of economy-wide emission reduction targets to be
implemented by Parties included in Annex I to the Convention‟ (FCCC/SB/2011/INF.1/Rev.1 of
7 June 2011). In addition, the EU provided additional information relating to its quantified
economy-wide emission reduction target in a submission as part of the process of clarifying the
developed country Parties' targets in 2012 (FCCC/AWGLCA/2012/MISC.1).
The EU clarified that the accounting rules for the target under the UNFCCC are more ambitious
than the current rules under the Kyoto Protocol, for example, including international aviation,
adding an annual compliance cycle for emissions under the Effort Sharing Decision (ESD,
Decision No 406/2009/EC on the effort of Member States to reduce their greenhouse gas
emissions to meet the Community‟s greenhouse gas emission reduction commitments up to
2020) or higher Clean Development Mechanism (CDM) quality standards under the EU
Emissions Trading System (EU ETS) (FCCC/TP/2013/7). Accordingly, the following
assumptions and conditions apply to the EU's 20 % target under the UNFCCC:
The EU Convention pledge does not include emissions/removals from Land Use, Land-
Use Change and Forestry, but it is estimated to be a net sink over the relevant period.
EU inventories also include information on emissions and removals from LULUCF in
1 First steps to a safer future: Introducing the United Nations Framework Convention on Climate Change
http://unfccc.int/essential/_background/convention/items/6036.php
2 European Union, its Member States and Iceland submission pursuant to par 9 of decision 1/CMP.8'
http://ec.europa.eu/clima/policies/international/negotiations/docs/eu_submission_20140430_en.pdf

SECOND BIENNIAL REPORT OF THE REPUBLIC OF CROATIA
Page 34/113
accordance with relevant reporting commitments under the UNFCCC. Accounting for
LULUCF activities only takes place under the Kyoto Protocol.
The target refers to 1990 as a single base year for all gases and all Member States.
Emissions from international aviation to the extent it is included in the EU ETS are
included in the target3.
A limited number of CERs and ERUs units may be used to achieve the target: in the
ETS, the use of international credits is capped. Quality standards also apply to the use
of international credits in the EU ETS, including a ban on credits from LULUCF projects
and certain industrial gas projects. In the ESD sectors, the annual use of international
credits is limited to up to 3 % of each Member State's ESD emissions in 2005, with a
limited number of Member States being permitted to use an additional 1 % from projects
in Least Developed Countries (LDCs) or Small Island Developing States (SIDS), subject
to conditions.
The Global Warming Potentials (GWPs) used to aggregate GHG emissions up to 2020
under EU legislation were those based on the Second Assessment Report of the IPCC
when the target was submitted. In its submission to clarify the 2020 target from 20 March
2012, the EU announced that the implications of the CMP Decision to revise the GWPs
to those from the IPCC Fourth Assessment Report (AR4) are under review. This review
has been completed and revised GWPs from AR4 were adopted for the EU ETS. For the
revision of ESD targets the revised GWPs were taken into account. For the
implementation until 2020, GWPs from AR4 will be used consistently with the UNFCCC
reporting guidelines for GHG inventories.
The target covers the gases CO2, CH4, N2O, HFCs, PFCs and SF6.
Table 2-1: Key facts of the Convention target of the EU-28
Parameters Target
Base Year 1990
Target Year 2020
Emission Reduction target -20% in 2020 compared to 1990
Gases covered CO2, CH4, N2O, HFCs, PFCs, SF6
Global Warming Potential AR4
Sectors Covered All IPCC sources and sectors, as measured by
3 In the EU, emissions covered by category 'international aviation' go beyond the scope of the EU target, as
emissions from international aviation are included in the EU Climate and Energy Package and the EU target under
the UNFCCC to the extent to which aviation is part of the EU ETS. As such emissions cannot be separated in the EU
inventory nor in the projections for the entire time series, emissions from international aviation have been considered
in their entirety throughout the report. Over the period, total emissions from international aviation were between 1.2-
2.9% of the annual total EU GHG emissions.
SECOND BIENNIAL REPORT OF THE REPUBLIC OF CROATIA
Page 35/113
Parameters Target
the full annual inventory and international aviation
to the extent it is included in the EU ETS.
Land Use, Land-Use Change, and
Forests
(LULUCF)
Accounted under KP, reported in EU inventories
under the Convention. Assumed to produce net
removals
Use of international credits (JI and CDM) Possible subject to quantitative and qualitative
limits.
Other
Conditional offer to move to a 30% reduction by
2020 compared to 1990 levels as part of a global
and comprehensive agreement for the period
beyond 2012, provided that other developed
countries commit themselves to comparable
emission reductions and that developing countries
contribute adequately according to their
responsibilities and respective capabilities.
2.2. THE EU TARGET COMPLIANCE ARCHITECTURE
2.2.1. The 2020 climate and energy package
In 2009 the EU established internal rules under its “2020 climate and energy package”4 - these
underpin the EU implementation of the target under the Convention. The package introduced a
clear approach to achieving the 20 % reduction of total GHG emissions from 1990 levels, which
is equivalent to a 14 % reduction compared to 2005 levels. This 14 % reduction objective is
divided between the ETS and ESD sectors. These two sub-targets are:
a 21 % reduction target compared to 2005 for emissions covered by the ETS (including
domestic and international aviation);
a 10 % reduction target compared to 2005 for ESD sectors, shared between the 28
Member States (MS) through individual national GHG targets.
The distribution of the total target across the ETS and ESD is shown in the Figure 2.1.
Source: European Commission
4 http://ec.europa.eu/clima/policies/package/index_en.htm

SECOND BIENNIAL REPORT OF THE REPUBLIC OF CROATIA
Page 36/113
Figure 2-1: GHG targets under the 2020 climate and energy package
Under the revised EU ETS Directive (Directive 2009/29/EC), a single ETS cap covers the EU
Member States and three participating non-EU countries (Norway, Iceland and Liechtenstein),
i.e. there are no further individual caps by country. Allowances allocated in the EU ETS from
2013 to 2020 decrease by 1.74 % annually, starting from the average level of allowances issued
by Member States for the second trading period (2008–2012).
The three non-EU countries participating in EU ETS (Norway, Iceland and Liechtenstein) are
also subject to a similarly defined cap and the same annual decrease in allowance allocation.
The vast majority of emissions within the EU which fall outside the scope of the EU ETS are
addressed under the Effort Sharing Decision (ESD) (Decision No 406/2009/EC). The ESD
covers emissions from all sources outside the EU ETS, except for emissions from domestic and
international aviation (which were included in the EU ETS from 1 January 2012), international
maritime, and emissions and removals from land use, land-use change and forestry (LULUCF).
It thus includes a diverse range of small-scale emitters in a wide range of sectors: transport
(cars, trucks), buildings (in particular heating), services, small industrial installations, fugitive
emissions from the energy sector, emissions of fluorinated gases from appliances and other
sources, agriculture and waste. Such sources currently account for about 60 % of total GHG
emissions in the EU. According to the Decision 529/2013/EU on accounting rules on GHG
emissions and removals resulting from the activities relating to land use, land use change and
forestry and on information concerning actions relating to those activities, Member States are
obliged to provide information on their LULUCF actions to limit or reduce emissions and to
maintain or increase removals.
2020 GHG target: − 20% compared to 1990
EU ETS− 21% compared to 2005 ESD Sectors
− 10% compared to 2005
28 Member State targets, ranging from − 20% to + 20%
− 14% compared to 2005
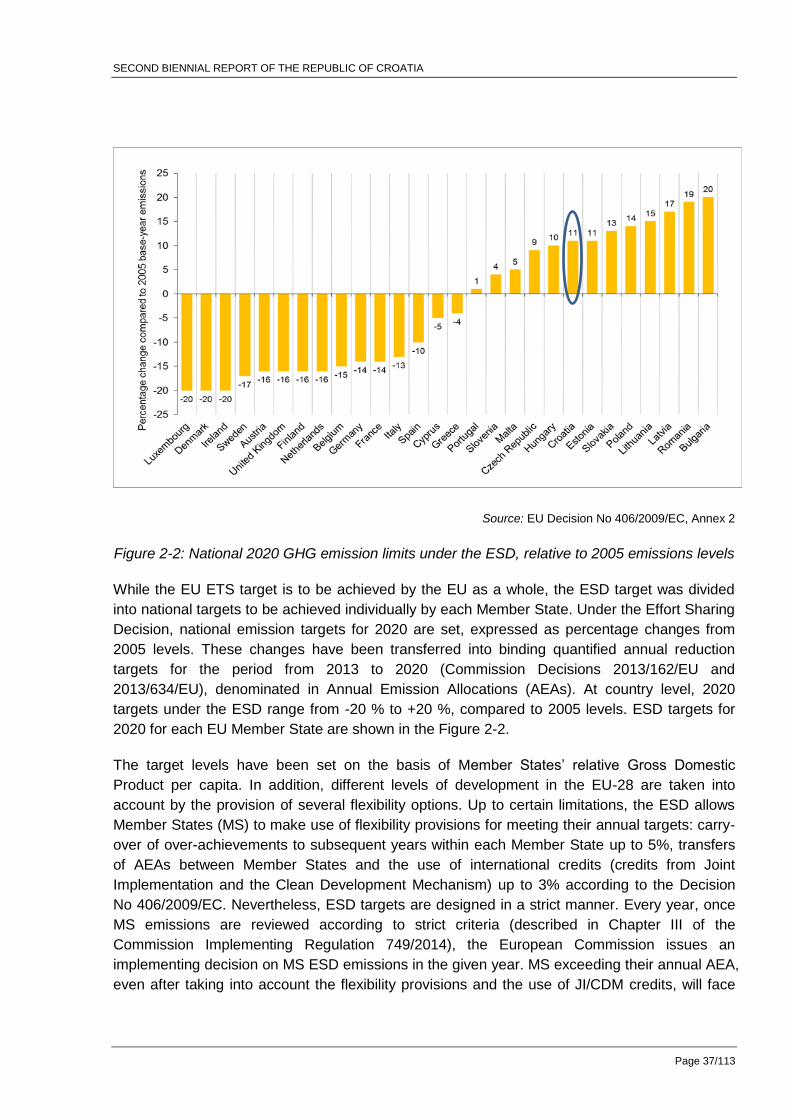
SECOND BIENNIAL REPORT OF THE REPUBLIC OF CROATIA
Page 37/113
Source: EU Decision No 406/2009/EC, Annex 2
Figure 2-2: National 2020 GHG emission limits under the ESD, relative to 2005 emissions levels
While the EU ETS target is to be achieved by the EU as a whole, the ESD target was divided
into national targets to be achieved individually by each Member State. Under the Effort Sharing
Decision, national emission targets for 2020 are set, expressed as percentage changes from
2005 levels. These changes have been transferred into binding quantified annual reduction
targets for the period from 2013 to 2020 (Commission Decisions 2013/162/EU and
2013/634/EU), denominated in Annual Emission Allocations (AEAs). At country level, 2020
targets under the ESD range from -20 % to +20 %, compared to 2005 levels. ESD targets for
2020 for each EU Member State are shown in the Figure 2-2.
The target levels have been set on the basis of Member States‟ relative Gross Domestic
Product per capita. In addition, different levels of development in the EU-28 are taken into
account by the provision of several flexibility options. Up to certain limitations, the ESD allows
Member States (MS) to make use of flexibility provisions for meeting their annual targets: carry-
over of over-achievements to subsequent years within each Member State up to 5%, transfers
of AEAs between Member States and the use of international credits (credits from Joint
Implementation and the Clean Development Mechanism) up to 3% according to the Decision
No 406/2009/EC. Nevertheless, ESD targets are designed in a strict manner. Every year, once
MS emissions are reviewed according to strict criteria (described in Chapter III of the
Commission Implementing Regulation 749/2014), the European Commission issues an
implementing decision on MS ESD emissions in the given year. MS exceeding their annual AEA,
even after taking into account the flexibility provisions and the use of JI/CDM credits, will face
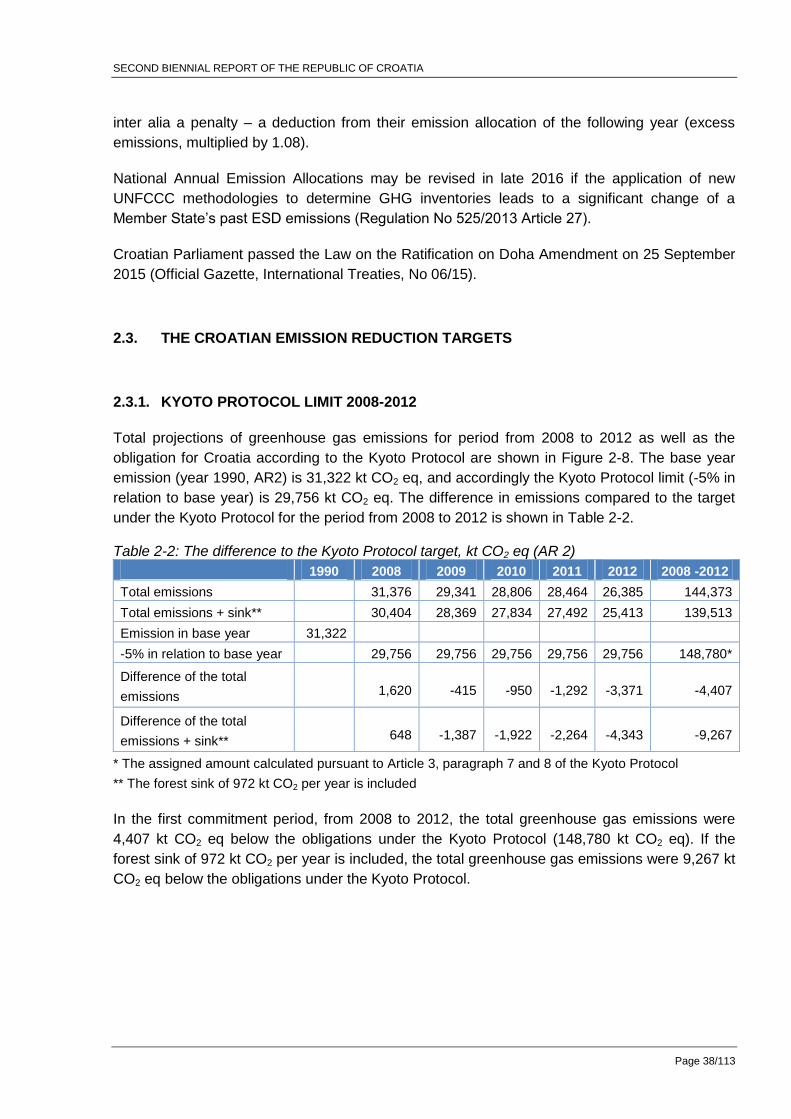
SECOND BIENNIAL REPORT OF THE REPUBLIC OF CROATIA
Page 38/113
inter alia a penalty – a deduction from their emission allocation of the following year (excess
emissions, multiplied by 1.08).
National Annual Emission Allocations may be revised in late 2016 if the application of new
UNFCCC methodologies to determine GHG inventories leads to a significant change of a
Member State‟s past ESD emissions (Regulation No 525/2013 Article 27).
Croatian Parliament passed the Law on the Ratification on Doha Amendment on 25 September
2015 (Official Gazette, International Treaties, No 06/15).
2.3. THE CROATIAN EMISSION REDUCTION TARGETS
2.3.1. KYOTO PROTOCOL LIMIT 2008-2012
Total projections of greenhouse gas emissions for period from 2008 to 2012 as well as the
obligation for Croatia according to the Kyoto Protocol are shown in Figure 2-8. The base year
emission (year 1990, AR2) is 31,322 kt CO2 eq, and accordingly the Kyoto Protocol limit (-5% in
relation to base year) is 29,756 kt CO2 eq. The difference in emissions compared to the target
under the Kyoto Protocol for the period from 2008 to 2012 is shown in Table 2-2.
Table 2-2: The difference to the Kyoto Protocol target, kt CO2 eq (AR 2)
1990 2008 2009 2010 2011 2012 2008 -2012
Total emissions 31,376 29,341 28,806 28,464 26,385 144,373
Total emissions + sink** 30,404 28,369 27,834 27,492 25,413 139,513
Emission in base year 31,322
-5% in relation to base year 29,756 29,756 29,756 29,756 29,756 148,780*
Difference of the total
emissions 1,620 -415 -950 -1,292 -3,371 -4,407
Difference of the total
emissions + sink** 648 -1,387 -1,922 -2,264 -4,343 -9,267
* The assigned amount calculated pursuant to Article 3, paragraph 7 and 8 of the Kyoto Protocol
** The forest sink of 972 kt CO2 per year is included
In the first commitment period, from 2008 to 2012, the total greenhouse gas emissions were
4,407 kt CO2 eq below the obligations under the Kyoto Protocol (148,780 kt CO2 eq). If the
forest sink of 972 kt CO2 per year is included, the total greenhouse gas emissions were 9,267 kt
CO2 eq below the obligations under the Kyoto Protocol.

SECOND BIENNIAL REPORT OF THE REPUBLIC OF CROATIA
Page 39/113
Figure 2-3: Comparison with Kyoto Protocol limit
2.3.2. ESD target until 2020
As described in previous chapter, outside of the EU ETS, aims to reduce or increase the
permitted emissions are determined on the basis of GDP per capita in the framework of the
Decision on joint efforts of the division. For the Republic of Croatia is allowed to increase
greenhouse gas emissions outside the EU ETS by 11% by 2020 compared to 2005. The
Commission Decision 2013/162/EC of 26 March 2013 determined the quotas expressed in
absolute terms for Croatia from 2013 to 2020. The Commission Decision 2013/634/EC of 31
October 2013 adjusted the quotas due to an increase in the scope of the EU ETS, which has
decreased the quotas for emissions outside the EU ETS. In both documents, quota is
expressed using the value of global warming potential (GWP) of the second and fourth report of
the Intergovernmental Panel on Climate Change (IPCC).
Table 2-3 shows the limitation of greenhouse gas emissions outside the EU ETS (national
annual quota) in the period 2013-2020 using GWP values from the second and fourth
assessment report of the IPCC.
Table 2-3: Annual emission allocations for the Republic of Croatia for the period 2013-2020 [t CO2eq]
2013 2014 2015 2016
GWP AR2 18,990,152 19,185,523 19,380,894 19,576,265
GWP AR4 19,613,805 19,805,256 19,996,708 20,188,161
2017 2018 2019 2020
GWP AR2 19,771,635 19,967,007 20,162,378 20,357,748
GWP AR4 20,379,612 20,571,063 20,762,515 20,953,966
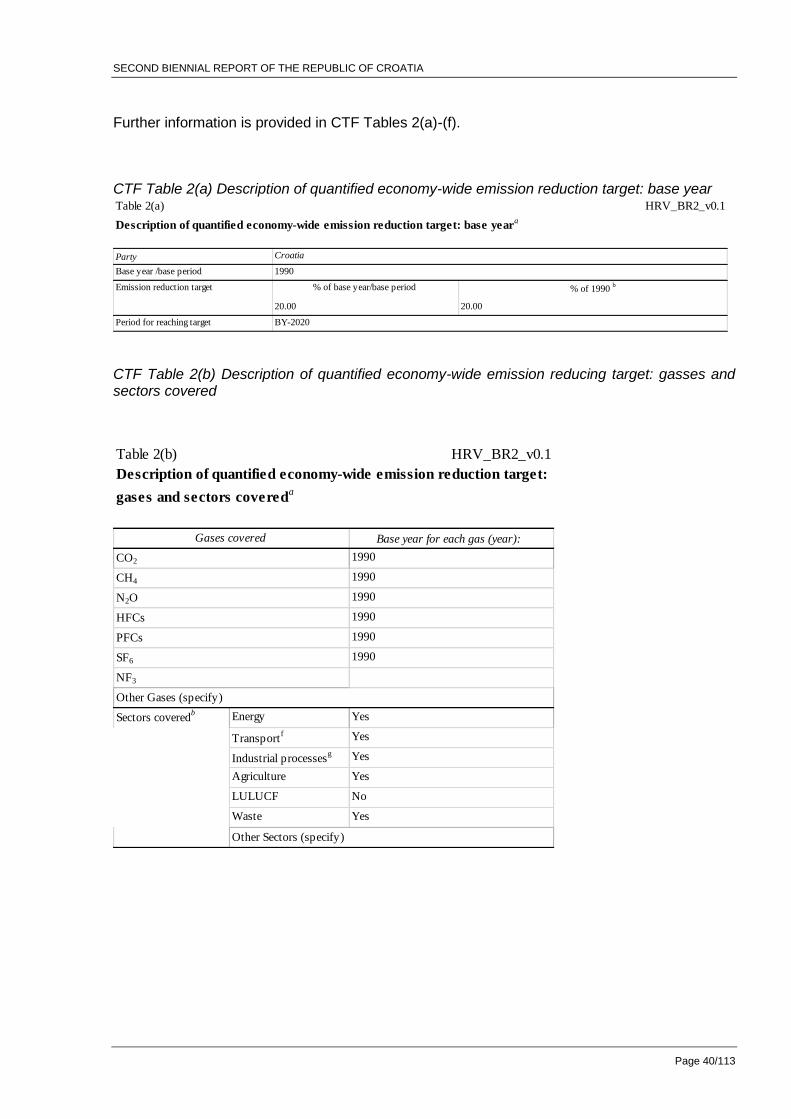
SECOND BIENNIAL REPORT OF THE REPUBLIC OF CROATIA
Page 40/113
Further information is provided in CTF Tables 2(a)-(f).
CTF Table 2(a) Description of quantified economy-wide emission reduction target: base year
CTF Table 2(b) Description of quantified economy-wide emission reducing target: gasses and sectors covered
Table 2(a) HRV_BR2_v0.1
Description of quantified economy-wide emission reduction target: base yeara
Party
Base year /base period
% of base year/base period % of 1990 b
20.00 20.00
Period for reaching target
Croatia
1990
BY-2020
Emission reduction target
Table 2(b) HRV_BR2_v0.1
Base year for each gas (year):
1990
1990
1990
1990
1990
1990
Energy Yes
Transportf Yes
Industrial processesg Yes
Agriculture Yes
LULUCF No
Waste Yes
Description of quantified economy-wide emission reduction target:
gases and sectors covereda
Gases covered
CO2
CH4
N2O
HFCs
PFCs
SF6
NF3
Other Gases (specify)
Other Sectors (specify)
Sectors coveredb
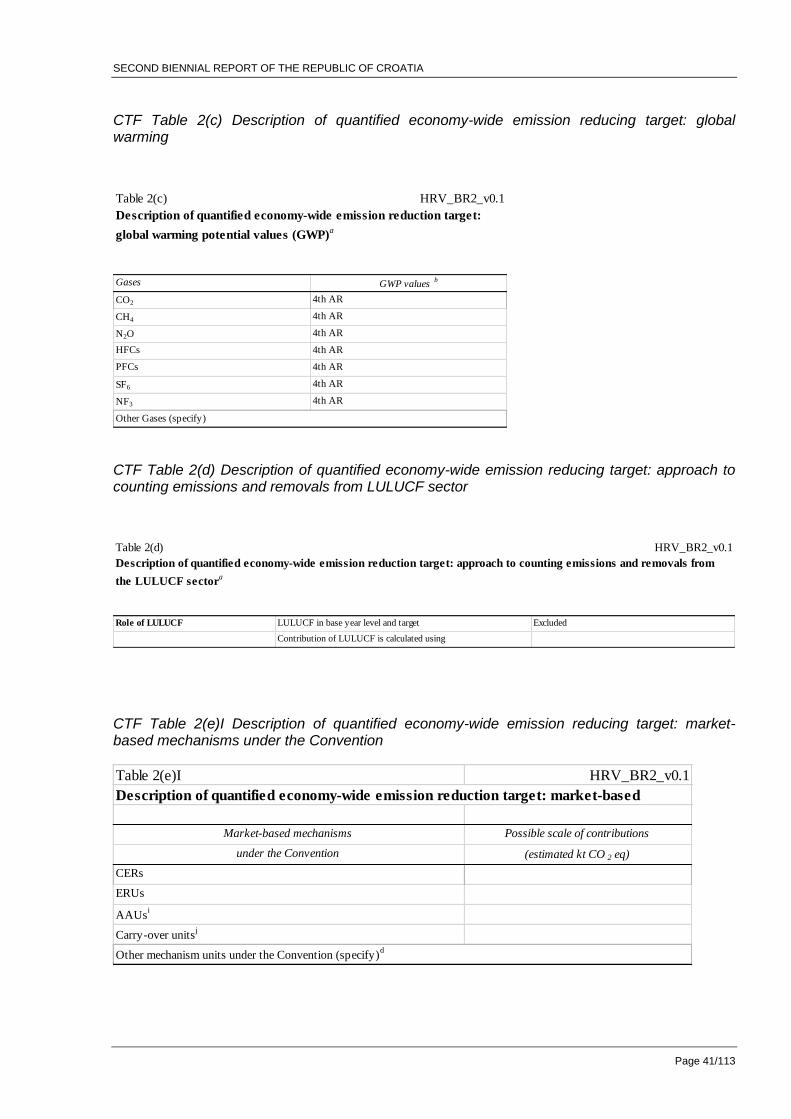
SECOND BIENNIAL REPORT OF THE REPUBLIC OF CROATIA
Page 41/113
CTF Table 2(c) Description of quantified economy-wide emission reducing target: global warming
CTF Table 2(d) Description of quantified economy-wide emission reducing target: approach to counting emissions and removals from LULUCF sector
CTF Table 2(e)I Description of quantified economy-wide emission reducing target: market-based mechanisms under the Convention
Table 2(c) HRV_BR2_v0.1
Gases GWP values b
CO2 4th AR
CH4 4th AR
N2O 4th AR
HFCs 4th AR
PFCs 4th AR
SF6 4th AR
NF3 4th AR
Description of quantified economy-wide emission reduction target:
global warming potential values (GWP)a
Other Gases (specify)
Table 2(d) HRV_BR2_v0.1
Role of LULUCF LULUCF in base year level and target Excluded
Contribution of LULUCF is calculated using
Description of quantified economy-wide emission reduction target: approach to counting emissions and removals from
the LULUCF sectora
Table 2(e)I HRV_BR2_v0.1
Market-based mechanisms Possible scale of contributions
under the Convention (estimated kt CO 2 eq)
CERs
ERUs
AAUsi
Carry-over unitsj
Description of quantified economy-wide emission reduction target: market-based
Other mechanism units under the Convention (specify)d

SECOND BIENNIAL REPORT OF THE REPUBLIC OF CROATIA
Page 42/113
CTF Table 2(e)II Description of quantified economy-wide emission reducing target: market-based mechanisms under the Convention
CTF Table 2(f) Description of quantified economy-wide emission reducing target: any other information
Legally binding target trajectories for the period 2013-2020 are enshrined in both the EU-ETS Directive (Directive
2003/87/EC and respective amendments) and the Effort Sharing Decision (Decision No406/2009/EC). These legally
binding trajectories not only result in a 20% GHG reduction in 2020 compared to 1990 but also define the EU's
annual target pathway to reduce EU GHG emissions from 2013 to 2020. The Effort Sharing Decision sets annual
national emission targets for all Member States for the period 2013-2020 for those sectors not covered by the EU
emissions trading system (ETS), expressed as percentage changes from 2005 levels. In March 2013,the
Commission formally adopted the national annual limits throughout the period for each Member State. By 2020, the
national targets will collectively deliver a reduction of around 10% in total EU emissions from the sectors covered
compared with 2005 levels. The emission reduction to be achieved from the sectors covered by the EU ETS will be
21% below 2005 emission levels.
Table 2(e)II HRV_BR2_v0.1
Other market-based mechanisms Possible scale of contributions
(Specify) (estimated kt CO 2 eq)
Description of quantified economy-wide emission reduction target: other market-based
mechanismsa
Table 2(f) HRV_BR2_v0.1
Description of quantified economy-wide emission reduction target: any other informationa,b
In December 2009, the European Council reiterated the conditional offer of the EU to move to a 30% reduction by 2020 compared to 1990 levels as part of a global and comprehensive
agreement for the period beyond 2012, provided that other developed countries commit themselves to comparable emission reductions and that developing countries contribute
adequately according to their responsibilities and respective capabilities.

SECOND BIENNIAL REPORT OF THE REPUBLIC OF CROATIA
Page 43/113
3. POLICIES AND MEASURES
Policies and measures that are subject of this report are included in the "with measures" and
"with additional measures" scenarios.
In this report, policies and measures that belong to the so-called ETS sector are being
separately observed from policies and measures in non-ETS sectors. This way of overview is
selected in accordance with the European practice in which the effects of policies and measures
are separated in such way. ETS (Emissions Trading System) sector includes all activities listed
in Annex I of the Regulation on trading with greenhouse gas emission allowances (OG 69/12,
154/14) and for the reduction of greenhouse gas emissions from these activities alone are
responsible plant operators involved in the trading system. Reduction commitments through
emission allowances allocated evenly have been distributed to all Member States, thus it can be
concluded that reduction of emissions of certain activities of the ETS is in fact regulated at EU
level. Emissions trading system is treated as a single group of measures to reduce emissions,
without dividing the activities covered by the system.
For all other activities at the state level, which are not covered by the ETS, common sectorial
division is applied, while responsibility for reducing the emissions and increasing the outflow by
implementing these policies and measures is on the Member States. For activities that are not
covered by the ETS sector, policies and measures to reduce emissions from sources and
increase sinks of greenhouse gases are shown separately for the following sectors:
− energy
− transport
− industrial processes
− waste management
− agriculture
− land use, land use change and forestry (LULUCF)
− other (cross-cutting) policies and measures.
3.1. EMISSIONS TRADING SYSTEM
Besides implementation of EU ETS in Croatia from 2013 onward, there are two measures
directly linked to the emission trading system. One measure refers to the use of funds obtained
from the sales of emission allowances through auctions and the other related to the regulation
of the geological storage of carbon dioxide. All three measures are described below.

SECOND BIENNIAL REPORT OF THE REPUBLIC OF CROATIA
Page 44/113
MSP-1: Inclusion of the operators in the European Union Emission Trading System (EU ETS) in
the full scale from 1 January 2013 and administering aviation operators from 1 January 2014
From 1 January 2013, the Republic of Croatia is fully integrated in the EU Emission Trading
System (EU ETS). Operators in Croatia - the pursuants in the EU ETS have obtained Permits
for greenhouse gas emissions and have established a regime for emissions monitoring and
reporting to the competent authority.
The EU ETS includes activities listed in Annex I of the Regulation on the Greenhouse Gas
Emission Allowances Trading (OG 69/12, 154/14). Greenhouse gases covered by EU ETS are:
carbon dioxide (CO2) for all activities and additionally for certain activities, nitrous oxide (N2O)
and perfluorocarbon (PFC). Additional activity included in EU ETS is aviation. Aircraft operators
in Croatia are included in the EU ETS from 2012, and Croatia undertook to administer aviation
operators included in the EU ETS from 2014.
All operators, except electricity producers for the third party‟s sales, have submitted their
applications for issuance of free allowances. Operators, which will not have a sufficient number
of allowances to cover their greenhouse gases emissions, have the option to purchase emission
units through auctions.
MSP-2: Adoption of the Plan for use of funds obtained from the sales of emission allowances
through auctions in the Republic of Croatia for the period from 2014 to 2016 (OG 140/14)
Of the total number of allowances designated for the allocation to operators and aircraft
operators, in each year of the trading period, a part is distributed free of charge according to the
prescribed method. The remaining part is distributed to the Member States of the European
Union and is subject to public auctions.
The Air Protection Act (OG 130/11, 47/14) stipulates that Republic of Croatia for such purposes
use all funds received decreased by 5 percent, i.e. 15 percent for 2014 and 2015, which will be
paid to the state budget of the Republic of Croatia to cover the costs of administering the
emissions trading system, for administrative affairs, functioning of the Union Registry,
auctioneers, National System for monitoring greenhouse gas emissions and other matters
related to climate change. Plan for the use of funds obtained from the sales of emission
allowances through auctions in the Republic of Croatia for the period from 2014 to 2016 was
adopted by the Croatian Government (OG 140/14) on the proposal of the ministry responsible
for environmental protection, while the funds are paid to a special account of the Environmental
Protection and Energy Efficiency Fund. Founds obtained from the sales of emission allowances
through auctions are planned to use for encouraging of energy efficiency and use sustainable
energy resources, reduction GHG emissions, reduction emissions from transport sector,
adaptation to climate change etc.

SECOND BIENNIAL REPORT OF THE REPUBLIC OF CROATIA
Page 45/113
MSP-3: Preparation of National Feasibility Study with the action plan for the preparatory
activities for CCS projects in Croatia
Technology for carbon capture and storage for large emission sources is not yet commercially
available. The possibility of commercial application is expected in the period after 2020.
According to Directive 2009/31/EC on the geological storage of carbon dioxide, respectively
Article 36 of Directive on industrial emissions 2010/75/EU, for power plants with capacity
exceeding 300 MW which have obtained the construction permit after the entry into force of the
Directive 2009/31/EC, it is necessary to assess whether the following requirements are
satisfied:
− suitable storage locations are available,
− transport facilities are technically and economically feasible and
− upgrade of the plant for CO2 capture is technically and economically feasible.
If these conditions are satisfied, the competent authority should provide adequate reserve area
on the plant's location for equipment for capturing and compressing extracted CO2.
Due to described commitments for new thermal power plants, with this measure the preparation
of National Feasibility Study with the action plan of the preparatory activities for CCS projects is
planned. This Study will include stages of capturing on the sources of emissions, transport,
injection and storage
3.2. SECTORAL POLICIES AND MEASURES: ENERGY
MEN-1: Promotion of energy efficiency in households and services through project activities
Increase of energy efficiency in buildings has been identified as an area with great potential for
saving energy and reducing greenhouse gas emissions. Important documents that have been
adopted are as follows:
− The Third National Action Plan for Energy Efficiency Croatia for the period 2014-2016
(Ministry of Economy, 2014),
− The Long-term Strategy to Stimulate Investment in the Renovation of the National Building
Stock in Croatia (OG 74/14),
− The Program of Energy Renovation of Apartment Buildings for the Period from 2014 to 2020
with a Detailed Plan for the Period from 2014 to 2016 (OG 78/14),
− The Program of Energy Renovation of Family Houses for the Period from 2014 to 2020 with
a Detailed Plan for the Period from 2014 to 2016 (OG 43/14),
SECOND BIENNIAL REPORT OF THE REPUBLIC OF CROATIA
Page 46/113
− The Program of Energy Renovation of Commercial Non-residential Buildings for the Period
from 2014 to 2020 with a Detailed Plan of Energy renovation of Commercial Non-residential
Buildings for the Period from 2014 to 2016 (OG 98/14) and
− The Programme for the Energy Renovation of Public Buildings 2012 - 2013 (Ministry of
Construction and Physical Planning),
− The Programme for the Energy Renovation of Public Buildings 2014 - 2015 (Ministry of
Construction and Physical Planning).
In the above listed documents, mechanisms, dynamics and aims to achieve energy savings and
reduce greenhouse gas emissions in buildings are prescribed.
In addition, incentives for energy efficiency improvements are expected under the Operative
Programme Competitiveness and cohesion for the period from 2014 to 2020 where, under
Priority Axis 4 - Promotion of energy efficiency and renewable energy sources, provides support
for energy efficiency.
MEN-2: Energy audits in industry
With this measure, support to assess the potential energy savings in industrial plants through
co-financing the implementation of energy audits should be provided. Scheme for Energy audits
in industry includes:
− mandatory energy audits for large companies (companies that meet at least two of the
following criteria: total assets of at least HRK 130,000,000.00, annual income of at least
HRK 260,000,000.00, an average of at least 250 employees during the financial year). The
obligation is regulated by the Law on Energy Efficiency (OG 127/14),
− voluntary scheme of energy audits for small and medium companies. Energy audits on a
voluntary basis are supported by the financial assistance provided by the Environmental
Protection and Energy Efficiency Fund.
MEN-3: Measurement and informative calculation of energy consumption
Law on Energy Efficiency (OG 127/14) stipulates that energy distributors ensure that, to the
extent that is technically possible, financially reasonable and proportionate in view of the
potential energy savings, final customers of energy and hot water in homes acquire individual
meters at competitive prices that accurately reflect the actual energy consumption of end
customers. Energy supplier shall free of charge on request of the end customer at least once a
year provide information on the calculation of electricity, heat or gas and previous consumption
of the end customer.
SECOND BIENNIAL REPORT OF THE REPUBLIC OF CROATIA
Page 47/113
Legible and understandable energy bills (electricity, heat and natural gas) and individual
consumption metering are obligation of distribution system operators and suppliers. This will
increase consumer awareness of the way in which they consume the energy. The bills should
include comparisons of consumption for the current year and for the corresponding period of the
previous year, as well as information on available energy efficiency measures.
MEN-4 and MEN-8: Promotion of the cogeneration construction
The legislative framework which introduces a system of incentives for electricity generation from
cogeneration was adopted for implementation of this measure. The largest contribution is
expected from new industrial cogeneration.
Incentives (tariffs) are the main mechanism for the promotion of cogeneration. Tariffs depend on
the installed plant capacity. In addition to the system of incentives for electricity generation from
cogeneration plants, this measure provides adoption of appropriate regulations to promote the
heat generation from cogeneration (defining the status of eligible heat producer).
MEN-5: Labelling the energy efficiency of household appliances
Scheme of labelling the energy efficiency of household appliances is legally prescribed in the
Regulations on Energy Labelling of Household Appliances (OG 130/07, 101/11). It is prescribed
that energy efficiency label have to be marked on all household appliances that use electricity
and are placed on the Croatian market, whether they are manufactured in the Republic of
Croatia or imported.
By energy labelling, customers are informed about the energy consumption of devices and
selection is directed towards more efficient appliances. For the implementation of these
measures, a lot has been done to raise public awareness and educate in order to increase the
market share of household appliances with A, A+, A++ energy efficiency class and reduce the
market share of household appliances under class C.
MEN-6: Eco-design of energy-using products
Ordinance on establishing Eco-design requirements for energy related products (OG 80/2013),
transferred the 2009/125/EC Directive of the European Parliament and of the Council of 21 the
October 2009 about establishing a framework for determining the Eco-design requirements for
energy related products to the Croatian legislation.
This Ordinance established a framework for the setting of EU Eco-design of energy-related
products with the aim of ensuring the free movement of these products on the internal market.
The Ordinance provides for the determination of requirements to be met by energy-related
products covered by implementing measures, to be placed on the market and / or in use. It
SECOND BIENNIAL REPORT OF THE REPUBLIC OF CROATIA
Page 48/113
contributes to sustainable development by increasing the energy efficiency and level of
environmental protection, while at the same time increasing the security of energy supply.
This Ordinance also allows the implementation of provisions related to the Directive
2009/125/EZ (air conditioners and fans, fan motor-driven, self-circulation pumps without seals,
household washing machines, electric motors, non-directional household lamps, lamps directed
to the corresponding equipment LED - lamps, fluorescent lamps, external power supplies,
cooling devices, simple control boxes, electric and electronic equipment in homes and offices -
mode, hold and mute, televisions, household dryers, washing household dishes and pumps
water). The Ordinance came into force on the date of the Republic of Croatia accession to EU.
MEN-7: Supporting the use of renewable energy sources in electricity generation
For the implementation of measures, legislative framework, which introduces a system of
incentives electricity generation using renewable energy sources, has been adopted. The main
mechanism for development of renewable energy sources are incentive prices (tariffs). The
tariffs depend on the type of source, power plant size and amount of generated electricity.
In the National Action Plan for Renewable Energy Sources (Ministry of Economy, 2013), the
Republic of Croatia determined the objectives and policy for increasing the share of RES in final
energy consumption by 2020. The Act on Renewable Energy Sources is under development
with expected adoption during 2016.
In addition, incentives for use of renewable energy sources are expected under the Operative
Programme Competitiveness and cohesion for the period from 2014 to 2020 where under
Priority Axis 4 - Promotion of energy efficiency and renewable energy the support of renewable
energy sources is planned.
MEN-9: Usage of biodegradable fraction of waste in public electricity and heating plants
This is a cross-cutting measure meaning that it requires coordination of activities with "Waste
management" sector. This measure is related to the measures Use of biogas from bioreactors
for electricity and heat generation and Thermal treatment of municipal waste and sludge from
wastewater treatment. The reduction of biodegradable waste in disposed municipal solid waste
is one of the main objectives defined in the Waste Management Plan of the Republic of Croatia
for the period from 2007 until 2015 (OG 85/07, 126/10, 31/11) and the Law of Sustainable
Waste Management (OG 94/13). Using of biodegradable waste for production of biogas that
could be used as a fuel, as well as municipal waste and sludge from wastewater treatment in
thermal treatment plant also means reducing the consumption of fossil fuels in the energy
sector. One of the activities leading to the accomplishment of this objective is the utilization of
waste as alternative fuel in public electricity and heating plants.
SECOND BIENNIAL REPORT OF THE REPUBLIC OF CROATIA
Page 49/113
MEN-10: Usage of refused derived fuel in the cement industry
The same applies to this measure as to the previous one, but waste is utilized as a fuel of rotary
kilns in cement industry. The Waste Management Plan defines technological processes of
processing and utilization of municipal waste before final disposal within the waste management
centers, whereat the procedure of mechanical-biological waste treatment is considered as
method for the production of fuel from waste. Use of fuel from waste results in reduced
consumption of primary energy sources. Precondition for implementation of this measure is to
ensure stable quantity, composition and structure of waste.
MEN-11: Promotion of the use of renewable energy sources in heat/cooling energy generation
The Law on Heat Market (OG 80/13, 14/14, 102/14) stipulates that use of renewable energy as
a source of heat is of interest for Croatia. The Republic of Croatia has in the National Action
Plan for Renewable Energy Sources (Ministry of Economy, 2013) determined the objectives and
policy for increasing the share of RES in final energy consumption by 2020 and in particular, the
estimated contribution of energy sources for heating and cooling from renewable energy. The
Act on Renewable Energy Sources is under development and expected adoption is during 2015.
In addition, incentives for use of renewable energy sources are expected under the Operative
Programme Competitiveness and cohesion for the period from 2014 to 2020 where under
Priority Axis 4 - Promotion of energy efficiency and renewable energy the support of renewable
energy sources is planned.
MEN-12: Promotion of the use of renewable energy sources and energy efficiency by HBOR-a
(Croatian Bank for Reconstruction and Development)
For the purpose of financing the environmental protection projects, HBOR extends loans
through the Loan programme for the Preparation of Renewable Energy Resources and Loan
Programme for the Financing of Projects of Environmental protection, Energy Efficiency and
Renewable Energy Sources.
The goal of the loan program of environmental projects, energy efficiency and renewable
energy sources is the realization of investment projects focused on environmental protection,
improving energy efficiency and promoting renewable energy. Loans are intended for
investment in land, buildings, equipment and devices. Final user may be local and territorial
(regional) governments, utility companies, companies, dealers and other legal entities.
MEN-13: Promotion of the use of renewable energy sources and energy efficiency by FZOEU
(The Environmental Protection and Energy Efficiency Fund) resources
The Environmental Protection and Energy Efficiency Fund provides funding for the preparation,
implementation and development of programs and projects in the field of environmental
SECOND BIENNIAL REPORT OF THE REPUBLIC OF CROATIA
Page 50/113
protection, energy efficiency and use of renewable energy sources and climate change
mitigation.
Funds for financing are provided from the revenues raised by environmental polluters, which
includes fees for nitrogen oxides, sulfur dioxide and carbon dioxide emissions, fees for
burdening the environment with waste, environmental user fees and special fees for the
environment for motor vehicles as well as from funds obtained from the sales of emission
allowances through auctions.
Resources of the Environmental Protection and Energy Efficiency Fund are allocated to projects,
which improve energy efficiency, including cogeneration, district heating systems, energy audits
and demonstration activities, public lighting projects, fuel replacement and waste heat use and
projects in the field of building construction and sustainable construction.
Renewable energy projects for which the Environmental Protection and Energy Efficiency Fund
grants resources include solar energy, wind energy, biomass, energy from small hydro and
geothermal energy.
The Environmental Protection and Energy Efficiency Fund provides grants to local and regional
governments, companies, craftsmen, non-profit organizations and individuals, through loans,
interest rate subsidies, financial aids and donations.
For some tenders of the Fund, operators in the EU ETS are eligible, thus this measure has
effects in the EU ETS and non-EU ETS sector.
MEN-14: Energy efficiency projects with implementation through energy services
Energy efficiency projects with implementation through energy services include modernization,
reconstruction and renovation of existing plants and facilities with the aim of rational use of
energy in a way to achieve the return on investment through savings in energy costs and
maintenance. These projects include the development, implementation and financing to improve
energy efficiency and reduce operation and maintenance. Areas of business are public and
private sectors, i.e. buildings (schools and kindergartens, offices, hotels, universities, hospitals),
public lighting, industry and power supply systems (cogeneration, district heating).
Center for monitoring of the energy sector and investment (CEI) was implementing the program
"Energy renovation of public buildings 2012 - 2013" under an agreement with the Ministry of
Construction and Physical Planning. CEI conducted the program and based on the Law on
Energy Efficiency in Final Consumption (OG 55/12) and the Regulation on the Negotiation and
Implementation of Energy Services (OG 69/12), by which CEI was responsible for the
implementation of public procurement procedures for energy services for budgetary and extra-
budgetary users (Law Art. 25(5)). The program involves contracting energy building renovation
process by public tender, which results in the signing of the energy performance contract
between bidder companies and the owner of the public building. Such a model has been
recognized as the most effective way to achieving energy savings.

SECOND BIENNIAL REPORT OF THE REPUBLIC OF CROATIA
Page 51/113
3.3. SECTORAL POLICIES AND MEASURES: TRANSPORT
MTR-2: Providing information to consumers on fuel economy and CO2 emission of new
passenger cars
Pursuant to the Ordinance on Availability of Information on Fuel Economy and CO2 Emissions
from Passenger Cars (OG 120/07), which was replaced by the new Ordinance on Availability of
Information on Fuel Economy and CO2 Emissions from Passenger Cars (OG 7/2015) each
supplier of new passenger cars intended for sale shall provide consumers with information on
the fuel consumption rate and specific CO2 emission of passenger cars. The Ministry of Interior
which is responsible for the road traffic safety, on the basis of the Ordinance once a year, not
later than 31 March of the current year, makes a Guidelines on cost-effectiveness of fuel
consumption and CO2 emission from new passenger cars available for purchase on the market
in the Republic of Croatia. The Guidelines contains required information for each model of new
passenger cars available in the domestic market.
MTR-3: Implementation of the pilot project and establishment of training system for drivers of
road vehicles for eco-driving
The pilot projects were conducted and systematic training for drivers of road vehicles for eco-
driving is implemented, as prescribed in the third National Action Plan for Energy Efficiency for
the Period from 2014 to 2016 (Ministry of Economy, 2014). This saves energy and increases
the level of awareness of all citizens and drivers in the Republic of Croatia on advantages of this
modern, intelligent and environmentally friendly driving style. Special elements are dedicated to
education on eco driving for drivers of passenger cars, buses and trucks.
MTR-4: Promotion of production and use of biofuels in transport
The basic regulation that regulates and promotes the usage of biofuel is Law on Biofuels for
Transport (OG 65/09, 145/10, 26/11, 144/12).
Based on this law, in 2010, the National Action Plan that promotes the production and use of
biofuels in transport for the period 2011 - 2020 was prepared. The Plan establishes a policy to
promote increased production and use of biofuels in transport in Croatia. The Plan contains a
review and assessment of the situation on the fuel market for transport and air protection,
comparative analysis, long-term goals, including the target-market of biofuels and measures to
promote increased production and use of biofuels in transport. Measures prescribed by action
plan include measures that promote the production of raw materials for the production of
biofuels, measures that promote the production of biofuels with reference to the fee for
promotion of production, measures that promote consumption of biofuels with reference to liquid
petroleum distributors to place the biofuels on market, administrative measures and research
and development activities. The National Action Plan for Renewable Energy Sources (Ministry
SECOND BIENNIAL REPORT OF THE REPUBLIC OF CROATIA
Page 52/113
of Economy, 2013) determined the goals and policies related to increasing the share of RES in
final energy consumption by 2020 and in particular the estimated contribution of energy of
biofuels in transport. The Act on Renewable Energy Sources is under development and the
expected adoption is during 2015.
MTR-5: Modification of the system for special fee payment for the environment for motor
vehicles
The current system of paying a special fee for the environment in motor vehicles is regulated by
Environmental Protection and Energy Efficiency Law (OG 107/03, 144/12), Regulation on unit
charges, corrective coefficients and detailed criteria and standards to determine the special
environmental fee for motor vehicles (OG 114/14, 147/14) and Ordinance on the manner and
terms of calculation and payment of the special fee for environment in motor vehicles (OG
20/04). Special fee was charged pursuant to the aforementioned Ordinance, taking into
consideration the type of engine and fuel, engine operating volume and vehicle‟s age.
This measure proposed changes in the method of calculating the fees according to the criteria
of pollutant emissions and greenhouse gas emissions to promote the purchase of vehicles with
lower emissions. By the Amendments to the Regulation on unit charges, corrective coefficients
and detailed criteria and benchmarks for determination of special environmental charges for
motor vehicles (OG 114/14, 147/14), this measure was implemented.
MTR-6: Financial incentives for the purchase of hybrid and electric vehicles
Electric and hybrid vehicles are due to the cost of technological development currently still more
expensive than conventional vehicles using internal combustion engines. Electric vehicles are
significantly more efficient than conventional from the standpoint of primary energy consumption
and are almost neutral from the standpoint of carbon dioxide emissions provided that are
powered by electricity generated by using renewable sources.
In order to increase the share of electric and hybrid vehicles, subsidies for the purchase of
electric and hybrid vehicles through a grant have been introduced. These payments are made
from the income of the Environmental Protection and Energy Efficiency Fund achieved, inter
alia, by collecting special environmental charge for motor vehicles. The Third National Action
Plan for Energy Efficiency for the Period from 2014 to 2016 (Ministry of Economy, 2014)
prescribed goals and a plan to support purchases of electric and hybrid vehicles.
In addition, the Law on Excise Tax on Motor Vehicles (OG 15/13, 108/13) introduced a special
tax that is calculated on the basis of unit CO2 emissions and is accounted for the purchase of
new motor vehicles. Electric and hybrid vehicles are not covered by this law, which has further
stimulated the procurement of vehicles with low greenhouse gas emissions.
MTR-7: Development of infrastructure for electric vehicles in urban areas
SECOND BIENNIAL REPORT OF THE REPUBLIC OF CROATIA
Page 53/113
The main objective of this measure is development and establishment of infrastructure
necessary for popularizing the concept of mobility in urban areas and increase the number of
electric vehicles in road traffic. Development of infrastructure should be focused on building the
charging stations and stations for changing electric batteries. Because of the battery capacity,
the autonomy of movement and time of charging, in urban areas is necessary to provide dense
network of filling stations for vehicles in relation to the distribution of filling stations for vehicles
with conventional drive. According to experiences in other countries, it was found that for the
same services as for conventional vehicles it is necessary to provide one charging station for
every four electric vehicles. For implementation of this measure it is necessary to prepare a
techno-economic analysis with optimal solution and proposed network of filling/ battery
changing stations.
MTR-8: Development of sustainable transport systems in urban areas
Traffic and need for mobility is one of the biggest pressures on the environment in urban areas.
Increase in the number of passenger cars, the way they are used, intensity of traffic and
unstructured expansion of urban areas largely reversed technological progress in relation to the
energy efficiency of vehicles and emission intensity, including noise.
With this measure, a gradual development of sustainable transport systems in urban areas of
Croatia is provided where Plans for sustainable transport development should be drawn up as
basic documents. These plans would include the analysis of the current situation, defining the
vision and objectives, impact analysis and the adoption of measures for all types of
transportation, distribution of responsibilities, method of implementation and monitoring
mechanism. These plans would be brought on the level of major cities, they should be prepared
in accordance with the European Commission guidelines and funded through EU programs and
funds.
In addition, incentives are expected and under the Operative Programme Competitiveness and
cohesion for the period from 2014 to 2020 where under Priority Axis 7 - Connectivity and
mobility, the development of public transport system with low levels of CO2 is planned.
3.4. SECTORAL POLICIES AND MEASURES: INDUSTRY / INDUSTRIAL PROCESSES
The Industrial Strategy of the Republic of Croatia 2014 – 2020 defines objectives of industrial
development and key indicators of the Croatian industry in the period 2014 – 2020. According to
the “real scenario”, in 2020 it is assumed to achieve the level of the volume of industrial
production in 2008, when the highest level of development of the Croatian economy was
reached.
Measures belonging to the ETS sector and included in the measure MSP-1 Inclusion of the
operators and aircraft operators in the European Union Emission Trading System (2013-2020)
are the following:

SECOND BIENNIAL REPORT OF THE REPUBLIC OF CROATIA
Page 54/113
– reducing the clinker factor in cement production – the share of additives in the cement is in
the range of 15-30%, depending on the composition of raw materials, availability of suitable
additives on the market and market demands for certain types of cement (clinker content in
cement is defined by standard HRN EN 197-1),
– N2O emission reduction in nitric acid production (catalytic decomposition) – N2O emission
reduction up to 88% can be achieved by installing the catalyst.
In addition to production of cement, nitric acid and ammonia, the key source in the Industrial
processes sector is the consumption of hydrofluorocarbons in refrigerating and air-conditioning
equipment. Regulation on substances that deplete the ozone layer and fluorinated greenhouse
gases (OG 90/14) prescribes the following measures:
MOS-1: Handling with substances that deplete the ozone layer and fluorinated greenhouse
gases
Release of controlled substances and fluorinated greenhouse gases into the atmosphere during
collecting, checking leakage, maintenance or servicing of devices and equipment is forbidden.
MOS-2: Technical and organizational measures for collecting, recycling, recovering and
destroying of controlled substances and fluorinated greenhouse gases
This group of measures defines the way in which used controlled substances and fluorinated
greenhouse gases contained in products and equipment must be recovered, recycled,
reclaimed or destroyed.
MOS 2a: Capacity building and strengthening the knowledge of servicer
Education of authorized servicers responsible for collection of controlled substances and
fluorinated greenhouse gases during servicing of devices and equipment and provide it to the
Centre for the collection, recycling and recovery of controlled substances and fluorinated
greenhouse gases.
MOS-3: Checking the leakage of controlled substances and fluorinated greenhouse gases
It is necessary to take all necessary technically feasible measures to prevent leakage, early
eliminate any detected leakage and reduce emissions of controlled substances and fluorinated
greenhouse gases into the atmosphere.

SECOND BIENNIAL REPORT OF THE REPUBLIC OF CROATIA
Page 55/113
3.5. SECTORAL POLICIES AND MEASURES: AGRICULTURE
MSP-4: Development of the assessment of implementation of GHG emission reduction
measures in the agriculture sector
Development of this assessment is recommended with the goal of valorization of middle-term
period of acceptability of potential emission reduction measures that imply various social and
economic risks for farmers. Possible measures to be analyzed are:
− improvement of cattle feeding regime and improvement of cattle meal (balanced ratio of
energy and protein) in order to reduce methane emissions from the storage of manure and
enteric fermentation
− anaerobic decomposition and biogas manufacturing
− improvement of nitrogen use efficiency with the goal of reducing the N2O emissions from
synthetic and organic fertilizer use
− carbon capture in agricultural soil.
MSP-4a: Rural Development Programme of the Republic of Croatia for the Period 2014-2020
One of the principal areas of institutional work of the European Union is the Common
Agricultural Policy (CAP). Rural development, as the second CAP tier, is financed through the
Agricultural Fund for Rural Development (EAFRD). Development of the Rural Development
Programme of the Republic of Croatia is a prerequisite for the EAFRD eligibility in the next
period. Goals set by the Europe 2020 Strategy are also evident within three CAP goals:
agriculture competitiveness, sustainable resource management and balanced development of
rural areas. The Rural Development Programme should achieve the goals set by CAP through
measures given in six priorities:
− Promotion of knowledge and innovation transfers in agriculture, forestry and rural areas
− Improvements in sustainability and competitiveness in agriculture, forestry and rural
areas
− Promotion of food provision chain, including processing and market placement of
agricultural products, animal welfare and risk management
− Revitalization, protection and improvement of agriculture and forestry related
ecosystems
− Promotion of resource efficiency and encouraging the shift to low-carbon farming,
resilient to climate changes in the agriculture, food and forestry sectors
SECOND BIENNIAL REPORT OF THE REPUBLIC OF CROATIA
Page 56/113
− Promotion of social involvement, combating poverty through economic development of
rural areas.
3.6. SECTORAL POLICIES AND MEASURES: FORESTRY / LULUCF
MSP-5: Improving the reporting from LULUCF sector
The Annex I countries of the United Nations Framework Convention on Climate Change,
including Croatia as well, are obligated in accordance with Annex I to Decision 15/CP.17
continuously review the quality of the relevant technical elements of GHG inventory. Because of
this commitment and because of the fact that additional improvements to the procedure for
determining the changes in carbon stocks in LULUCF sector need to be done for each store
separately, as well as the procedure for more detailed matrix of land, the implementation of
these measures is still considered necessary.
For the implementation of this measure, during 2014, the MENP launched two projects from the
LULUCF sector that are currently in the final stages of implementation. These are: 'Improving
the reporting in the sector Land use, land-use change and forestry during the first commitment
period of the Kyoto Protocol' (abbreviated as LULUCF 1) and 'Upgrade of the National System
for reporting on greenhouse gas emissions for the implementation of the Decision of the
European Parliament and of the Council No. 529/2013 of 21 May 2013 on accounting rules on
greenhouse gas emissions and removals resulting from activities relating to land use, land-use
change and forestry and on information concerning actions relating to those activities'
(abbreviated as LULUCF 2). Since the land matrix represents the basis for the calculation of
sinks/emissions of greenhouse gases in the LULUCF sector, the LULUCF 2 project includes
defining the proposal of national system for determining the land cover, use and land use
change, as well as the development of the new project proposal that would put the newly
defined system into operation.
MSP-6: Preparation of cost-benefit analysis of afforestation on new areas and natural
regeneration of forests as a measure of increasing the sinks in LULUCF sector
Changes in the sinks of greenhouse gases as a result of direct land use change caused by
human activity and forestry activities are allowed to be calculated in the national balance of
emissions and sinks of greenhouse gases and used to fulfill obligations under the Kyoto
Protocol. The aforementioned is stipulated by Article 3 paragraph 3 of Kyoto Protocol for parties
included by Annex I to the Kyoto Protocol.
By analyzing the costs and benefits of afforestation on the new areas, possibility of increasing
greenhouse gas sinks using reforestation activities on the barren productive forest floor will be
investigated. Thus would justify introduction of possible incentive measures, such as the
afforestation of fast-growing species and natural regeneration of forests, equivalent to measures
for greenhouse gas emissions reduction. The implementation of this activity was determined in
the Plan for Air Protection, Ozone Layer Protection and Climate Change Mitigation for the
period 2013-2017 (OG 139/13), and its implementation is planned for 2016.

SECOND BIENNIAL REPORT OF THE REPUBLIC OF CROATIA
Page 57/113
MSP-7: Revision of Forest Management Reference Level (FMRL) under Article 3.4 of the Kyoto
Protocol for the second commitment period
For the second commitment period of the Kyoto Protocol, new rules for the calculation of sinks
generated from forest management under which the outflow is calculated relative to the Forest
Management Reference Level (FMRL) were adopted. In addition, obligation of revision of
reference levels for forest management activities in accordance with the correction in the
national inventory is introduced and it is necessary to determine the new value of the reference
level for Croatia. For the purpose of implementing this measure, as part of the launched project
LULUCF 1, a review of the established value for FMRL is planned and the first technical
correction of FMRL for the Republic of Croatia will be performed. According to currently
available information, by the end of the Second commitment period it will be necessary to
perform another technical correction of FMRL considering that further improvements of the
LULUCF sector calculation are planned for this period.
MSP-8: Development of Action plan for LULUCF sector
According to the Decision 529/2013/EU5, as a member of the European Union, Croatia is
obliged to prepare and submit information from the forestry sector to the Commission in
accordance with Article 10 of Decision 529/2013/EU. The plan was drafted and submitted to the
EC on 9 January 2015, and will form an integral part of the national strategy for low carbon
development.
As part of the action plan, measures for maintaining/reducing emissions and
maintaining/increasing sinks of greenhouse gases that occur as a result of implementation of
activities of forest management, cropland management, grazing land management, and
implementation of afforestation and deforestation have been defined. The basis for the
preparation of the aforementioned document was the draft of Rural Development Programme of
the Republic of Croatia for the period 2014-2020 to define the measures in the forestry sector
as well as to define the measures associated with agricultural land use categories. During the
document preparation, data and information available in the National Inventory Report on
Greenhouse Gas Emissions for the Republic of Croatia (NIR 2014) were used, as well as data
and information available in a number of different strategic documents, national regulations (e.g.
Ordinance on cross-compliance OG 27/14) and the European Commission Guidance6, which
5 Decision No 529/2013/EU of the European Parliament and of the Council of 21 May 2013 on accounting rules on
greenhouse gas emissions and removals resulting from activities relating to land use, land-use change and forestry
and on information concerning actions relating to those activities
6 Guidance on Member State reports providing: „Information on LULUCF actions‟ in accordance with Article 10 of EU
Decision 529/2013/EU

SECOND BIENNIAL REPORT OF THE REPUBLIC OF CROATIA
Page 58/113
was created in order to assist Member States in fulfilling the obligations defined under Article 10
of the Decision 529/2013/EU. In order to address future activities within the low-carbon
development strategy it should be noted that the Air Protection Act (OG 130/11, 47/14)
stipulates the obligation of adopting the Low-Carbon Development Strategy of the Republic of
Croatia, which ensures a long-term economic and social development towards a low-GHG
emission society. The Low-Carbon Development Strategy defines the guidelines for long-term
actions by defining objectives in accordance with Article 4, paragraph 1 of the Regulation (EU)
No. 525/2013 and determining measures for their realization, taking into account the current
situation and international obligations. Given that some of the strategic plans were adopted prior
to or at the beginning of the process of Croatia accession to the European Union, and that they
e.g. National Environmental Strategy (OG 46/02) do not contain provisions related to
maintaining/increasing the carbon pools in forest ecosystems and wood products, it will be
necessary to revise them in the coming period and to align them with provisions of the
legislative acts which were adopted after the Croatia accession to the European Union.
Additionally, upon the adoption of the Low-Carbon Development Strategy, certain modifications
of some strategic documents that are of particular importance to the horizontal level will be
required, e.g. Sustainable Development Strategy of the Republic of Croatia (OG 30/09).
With the Plan for use of funds obtained from the sales of the emission allowances through
auctions in the Republic of Croatia for the period from 2014 to 2016 (OG 140/14), Croatia plans
to allocate the significant financial resources for emission reductions and adaptation to climate
change, in accordance with the provisions of Article 100 of the Air Protection Act (OG 130/11,
47/14). Activities that are planned to be financed by the Plan are determined in accordance with
the LULUCF sector activities included in the Decision No. 529/2013/EU, Low-Carbon
Development Strategy of the Republic of Croatia, which is in preparation, and Regulation
525/2013/EU.
3.7. SECTORAL POLICIES AND MEASURES: WASTE MANAGEMENT / WASTE
For the purpose of effective implementation of the measures included in the waste management
sector, along with the already adopted sectoral legislation that is harmonized with EU legislation,
it is necessary to adopt a more significant number of by-lows. It will primarily impact on the
projections after 2020 to measures MSP-9, MSP-10 and MSP-13, described below.
MSP-9: Prevention of and reducing the amount of municipal waste
Prevention of waste generation is the first priority in the priority order to the waste management,
as outlined in the Law on Sustainable Waste Management (OG 94/13) and Waste Management
Strategy of the Republic of Croatia (OG 130/05). The Waste Management Plan in the Republic
of Croatia for the period 2007 – 2015 (OG 85/07, 126/10, 31/11) was adopted to meet the
objectives of the Strategy. This measure should be achieved by cleaner production, education,
economic instruments, implementation of regulations on integrated pollution prevention and
control and investment in modern technologies. According to the Act concerning the conditions

SECOND BIENNIAL REPORT OF THE REPUBLIC OF CROATIA
Page 59/113
of accession of the Republic of Croatia to the European Union, quantitative targets and
deadlines for reducing the total amount of waste disposed to non-compliant landfills are defined.
By the end of 2015, the maximum waste disposed to non-compliant landfills amounts 1.21
million tons, by the end of 2016, 1.01 million tons and by the end of 2017, 800,000 tons.
Disposal of waste to non-compliant landfills in Croatia is prohibited after 31 December 2017.
MSP-10: Increasing the amount of separately collected and recycled municipal waste
Beside the Waste Management Strategy in Croatia, the Waste Framework Directive also
defines the quantitative targets and deadlines for increasing the amount of separately collected
and recycled waste. In accordance with the requirements of the Waste Framework Directive by
2015, it is necessary to ensure separate collection of at least paper, metal, plastic and glass. By
2020, it is necessary to ensure the preparation for re-use and recycling of the following waste
materials: paper, metal, plastic and glass from households and possibly from other sources if
these waste streams are similar to the waste from households, in the minimum share of 50% by
waste weight.
MSP-12: Methane flaring
The Ordinance on the Methods and Conditions for the Landfill of Waste, Categories and
Operational Requirements for Landfills (OG 117/07, 111/11, 17/13, 62/13) and Ordinance on
the Waste Management regulate technical requirements for landfill operation, which reduces
possible adverse effects of landfills on the environment. Landfills where landfill gas is generated
shall have the system for collecting the gas which shall be processed and used. If the collected
landfill gas cannot be used for energy generation, it must be flared at the landfill site and the
emission of those gases into air has to be prevented. Methane emission into atmosphere is
thereby reduced.
4,802 tons of methane is processed at Croatian landfills in 2012, whether it is burned in a flare
or used for electricity generation.
MSP-13: Reducing the amount of landfilled biodegradable municipal waste
The aim of this measure is to reduce the amount of biodegradable fraction of waste disposed at
landfills, thus reducing methane emissions resulting from anaerobic decomposition of waste.
Pursuant to the Law on Sustainable Waste Management, quantitative targets related to the
reduction of biodegradable municipal waste disposed to landfills are established. By the end of
2016, the share of biodegradable municipal waste disposed to landfills must be reduced to 50%
weight of biodegradable municipal waste produced in 1997, until the end of 2020 the share of
SECOND BIENNIAL REPORT OF THE REPUBLIC OF CROATIA
Page 60/113
biodegradable municipal waste disposed to landfills must be reduced to 35% weight of
biodegradable municipal waste generated in 1997.
Reducing the biodegradable fraction of waste disposed to the landfills results in reduced
emissions of methane, which would otherwise occur during the process of anaerobic
decomposition of waste in landfills.
MSP-14: Production of fuel from waste and processing of waste for use in the cement industry
The measure is related to the measures in Energy sector means of which the fossil fuels to
generate electricity and heat as well as for the cement production in rotary kilns is replaced by
the fuel from waste. Production of fuels from waste by mechanical-biological treatment of
municipal waste in regional and county waste management centres is planned. Using
biodegradable fraction of waste as fuel to generate electricity and heat as well as in the cement
industry is important from the standpoint of reducing the greenhouse gas emissions,
conservation of primary energy sources and reducing the amount of waste disposed to landfills.
Biodegradable fraction of waste is considered to be neutral with respect to carbon dioxide.
Reduction of methane emissions will be achieved by reducing the amount of disposed
biodegradable waste.
MSP-15: Use of biogas for electricity and heat generation
The measure is associated with measures Promoting the use of renewable sources in electricity
generation and Promoting the construction of cogeneration plants in the Energy sector. The
main mechanism for promoting the implementation of biogas for electricity generation and to
promote the construction of biogas cogeneration plants are incentive prices (tariffs) that depend
of the installed plant capacity. Looking at the waste management sector, the potential reduction
in greenhouse gas emissions of these measures is the potential to reduce methane emissions
(resulting from the anaerobic decomposition of the biodegradable fraction of waste), which is
used for electricity and heat generation.
MSP-16: Thermal treatment of municipal waste and sludge from wastewater treatment plants
Construction of a facility for thermal processing of municipal waste in the city of Zagreb is
planned, in which about 300,000 tonnes of municipal waste and about 70,000 tonnes of dried
sludge from the "Central waste water treatment plant" would be treated annually at the facility by
2020. Thermal treatment of municipal waste and sludge from wastewater treatment plant is
important from the standpoint of conservation of primary energy sources, reducing the amount
of waste disposed to landfills and reducing greenhouse gas emissions.
SECOND BIENNIAL REPORT OF THE REPUBLIC OF CROATIA
Page 61/113
3.8. OTHER (CROSS-CUTTING) POLICIES AND MEASURES
MSP-17: Establishment of monitoring, reporting and verification of greenhouse gas emissions in
the lifetime of liquid fuels
In accordance with the Air Protection Act (OG 130/11, 47/14), supplier that places the fuel on
domestic market shall monitor greenhouse gas emissions per energy unit in the life of the fuel.
Suppliers have to draw up a report that has to be verified and submitted to the Environmental
Protection Agency.
Pursuant to the Act, the Croatian Government's Decree on the quality of liquid petroleum fuels
(OG 33/11, 113/13, 76/14) stipulates limit values for components and quality characteristics of
liquid petroleum fuels, the method of determining and monitoring the quality of liquid petroleum
fuels, method of conformity, the conditions for the operation of laboratories for sampling and
laboratory analysis of quality liquid petroleum fuels, product labelling and the method and
deadline for the submission of reports on the quality of liquid petroleum fuels to the
Environmental Protection Agency.
MSP-18: CO2 emission tax
The Regulation on Unit Charges, Corrective Coefficients and Detailed Criteria and Benchmarks
for Determination of the Charge for Emissions into Environment of Carbon Dioxide (OG 73/07,
48/09) stipulates the obligation to pay charges on CO2 emission for all stationary sources
emitting more than 30 tonnes of CO2 per year. Fee payers who invest in energy efficiency,
renewable energy and other measures to reduce emissions of CO2 and other greenhouse gas
emissions are charged by lower fee.
The Environmental Protection and Energy Efficiency Fund is authorized for accounting and
collecting charges. The unit fee for 2013 is HRK 14 for emitting one tonne of CO2. The Law on
Amendments to the Law on Environmental Protection and Energy Efficiency Fund (OG 142/12)
stipulates that from 1 January 2013, legal or natural persons who own or use a single source of
CO2 emissions, for which permits for greenhouse gas emissions have been obtained, do not
have to pay fee. This means that from 2013 onwards measures apply only to sources that are
not covered by the ETS.
The amount of compensation paid by the operators of installations excluded from the EU ETS is
defined by the Decision on the amount of the unit charge on greenhouse gas emissions for
operators of installations excluded from emissions trading system for 2013 (OG 105/14).
SECOND BIENNIAL REPORT OF THE REPUBLIC OF CROATIA
Page 62/113
MSP-19: Establishment of the Committee for cross-sectoral coordination of policies and
measures for mitigation and adaptation to climate change
In accordance with the Air Protection Act (OG 130/11, 47/14), for monitoring and evaluation of
the implementation and planning of policies and measures for mitigation and adaptation to
climate change in the Republic of Croatia, the Commission for inter-sectoral coordination of
policies and measures for mitigation and adaptation to climate change (OG 114/14) was
established. The Committee members include representatives of relevant government bodies
and other relevant organizations, agencies and non-governmental organizations. The
Committee members, activities and functioning of the Commission are determined by the
Croatian Government on the proposal of the ministry responsible for environmental protection.
MSP-20: Intensifying the use of innovative information and communication technologies (ICT) to
reduce greenhouse gas emissions
Innovative information and communication technologies have an increasingly important role in
reducing greenhouse gas emissions and increasing energy efficiency. Intensifying their use in
public administration, services and manufacturing processes, will boost productivity and work
efficiency and at the same time will reduce energy consumption and consequent greenhouse
gas emissions. The measure is expected to intensify the use of innovative ICT and monitoring
of actual energy savings and reductions of greenhouse gas emissions.
Among others, examples of the implementation of this measure are:
− System for the Measurement and Verification of Energy Savings (SMIV, 2014), which
will monitor the energy savings and resultant reduction of greenhouse gas emissions,
was presented by the Ministry of Economy,
− Energy Management Information System (ISGE), which is supported and established by
the UNDP, GEF, the Fund and the Croatian Government, is used as a national tool for
systematic energy and water management in public buildings. ISGE is under the
competence of the Ministry of Construction and Physical Planning and Agency for
Transactions and Mediation in Immovable Properties (APN).
In continuation CTF table 3 regarding progress in achievement of the quantified economy-wide
emission reduction target: information on mitigation actions and their effects are presented

SECOND BIENNIAL REPORT OF THE REPUBLIC OF CROATIA
Page 63/113
CTF Table 3 Progress in achievement of the quantified economy-wide emission reduction target: information on mitigation actions and their effects
Name of mitigation action Sector(s) affected
GHG(s) affected
Objective and/or activity affected
Type of instrument
Status of implement.
Breaf description
Start year of
impl.
Implementing entity or entities
Estimate of mitigation impact (not cumulative)
in kt CO2-eq 2020
MSP-1: Inclusion of the operators in the European Union Emission Trading System (EU ETS) in the full scale from 1 January 2013 and administering aviation operators from 1 January 2014*
Energy, Industry/ industrial processes
CO2, N2O
Increase in renewable energy;Switch to less carbon-intensive fuels; Efficiency improvement in the energy and transformation sector; Efficiency improvement in industrial end-use sectors; Installation of abatement technologies; Reduction of losses
Other (Regulatory)
Implemented See Chapter 3 2013
MENP CEAN
kt CO2-eq
NE
MSP-2 Adoption of the Plan for use of funds obtained from the sales of emission allowances through auctions*
Cross-cutting CH4, CO2, N2O, PFCs, HFCs, SF6
Framework policy Economic
Implemented See Chapter 3 2014 MENP Government of Republic of Croatia
kt CO2-eq
0.0
MSP-3: Preparation of National Feasibility Study with the action plan for the preparatory activities for CCS projects in Croatia
Energy, Industry/industrial processes
CO2 Carbon capture and storage
Other (Information)
Planned See Chapter 3 2017 Ministry of Economy
0
MEN-1 Promotion of energy efficiency in households and services through project activities*
Energy CO2 Efficiency improvements of buildings Efficiency improvement in services/ tertiary sector Efficiency improvement of appliances Efficiency improvement in industrial end-use sectors
Economic|Regulatory|Information
Implemented See Chapter 3 2004 Ministry of Economy Ministry of Construction and Physical Planning
IE

SECOND BIENNIAL REPORT OF THE REPUBLIC OF CROATIA
Page 64/113
Name of mitigation action Sector(s) affected
GHG(s) affected
Objective and/or activity affected
Type of instrument
Status of implement.
Breaf description
Start year of
impl.
Implementing entity or entities
Estimate of mitigation impact (not cumulative)
in kt CO2-eq 2020
MEN-2 Energy audits in industry* Energy, Industry
/industrial processes
CO2, CH4, N2O
Efficiency improvements of buildings Demand management/reduction Efficiency improvement in industrial end-use sectors
Other (Regulatory)
Implemented See Chapter 3 2010 MENP Ministry of Economy
IE
MEN-3 Measurement and informative calculation of energy consumption*
Energy CO2 Demand management/reduction
Information Implemented See Chapter 3 2010 Ministry of Economy Distributing companies
IE
MEN-4, MEN-8 Promotion of the cogeneration construction*
Energy CO2 Efficiency improvement in the energy and transformation sector Increase in renewable energy
Other (Regulatory)
Implemented See Chapter 3 2007 Ministry of Economy
NE
MEN-5 Labelling the energy efficiency of household appliances*
Energy CO2 Efficiency improvement of appliances
Other (Information)
Implemented See Chapter 3 2007 Ministry of Economy
IE
MEN-6 Eco-design of energy-using products*
Energy CO2 Efficiency improvement of appliances
Other (Information)
Implemented See Chapter 3 2013 Ministry of Economy
IE
MEN-7 Supporting the use of renewable energy sources in electricity generation*
Energy CO2 Increase in renewable energy
Other (Regulatory)
Implemented See Chapter 3 2007 Ministry of Economy
IE
MEN-9 Usage of biodegradable fraction of municipal waste in public electricity and heating plants*
Energy, Waste management/waste
CH4, CO2
Switch to less carbon-intensive fuels Increase in renewable energy Enhanced CH4 collection and use
Other (Regulatory)
Implemented See Chapter 3 2012 MENP
IE
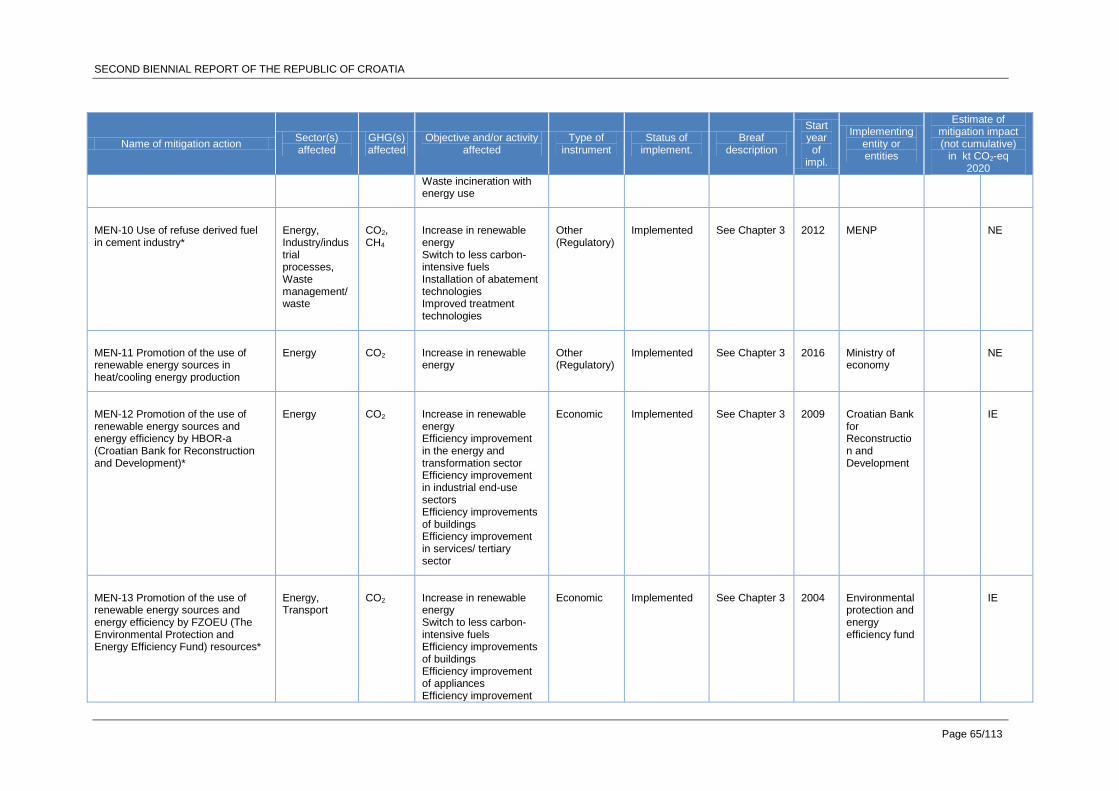
SECOND BIENNIAL REPORT OF THE REPUBLIC OF CROATIA
Page 65/113
Name of mitigation action Sector(s) affected
GHG(s) affected
Objective and/or activity affected
Type of instrument
Status of implement.
Breaf description
Start year of
impl.
Implementing entity or entities
Estimate of mitigation impact (not cumulative)
in kt CO2-eq 2020
Waste incineration with energy use
MEN-10 Use of refuse derived fuel in cement industry*
Energy, Industry/industrial processes, Waste management/waste
CO2, CH4
Increase in renewable energy Switch to less carbon-intensive fuels Installation of abatement technologies Improved treatment technologies
Other (Regulatory)
Implemented See Chapter 3 2012 MENP
NE
MEN-11 Promotion of the use of renewable energy sources in heat/cooling energy production
Energy CO2 Increase in renewable energy
Other (Regulatory)
Implemented See Chapter 3 2016 Ministry of economy
NE
MEN-12 Promotion of the use of renewable energy sources and energy efficiency by HBOR-a (Croatian Bank for Reconstruction and Development)*
Energy CO2 Increase in renewable energy Efficiency improvement in the energy and transformation sector Efficiency improvement in industrial end-use sectors Efficiency improvements of buildings Efficiency improvement in services/ tertiary sector
Economic Implemented See Chapter 3 2009 Croatian Bank for Reconstruction and Development
IE
MEN-13 Promotion of the use of renewable energy sources and energy efficiency by FZOEU (The Environmental Protection and Energy Efficiency Fund) resources*
Energy, Transport
CO2 Increase in renewable energy Switch to less carbon-intensive fuels Efficiency improvements of buildings Efficiency improvement of appliances Efficiency improvement
Economic Implemented See Chapter 3 2004 Environmental protection and energy efficiency fund
IE
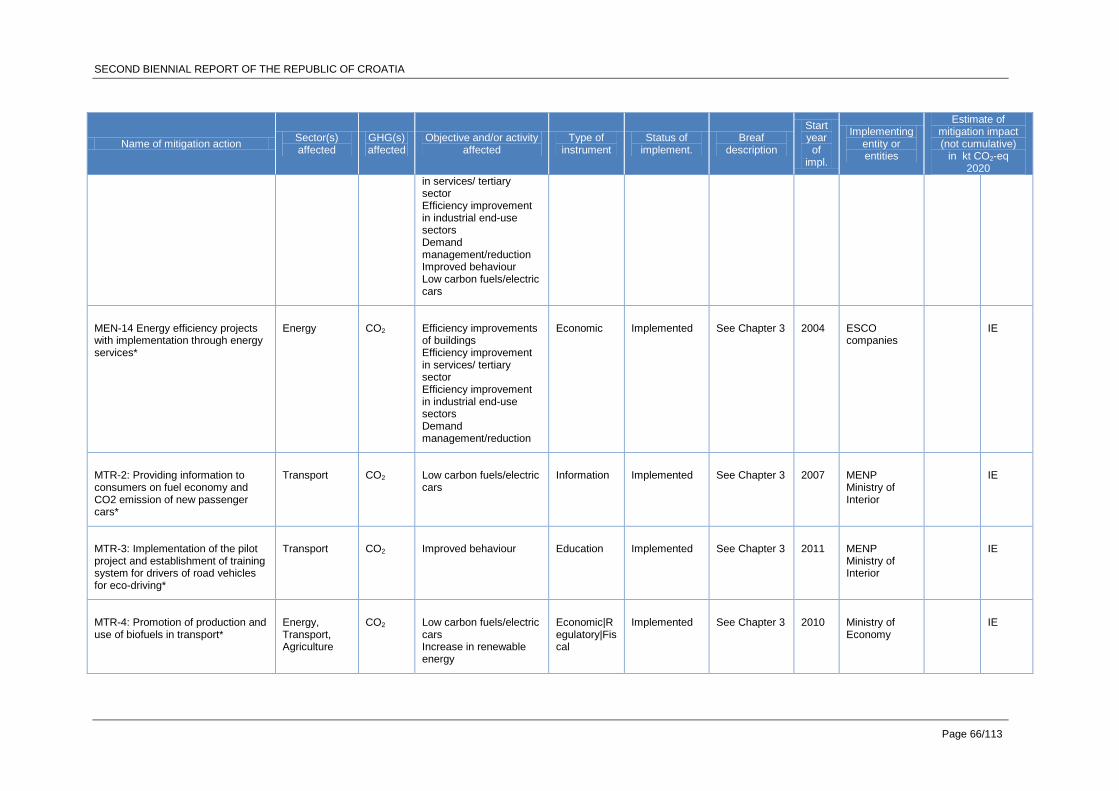
SECOND BIENNIAL REPORT OF THE REPUBLIC OF CROATIA
Page 66/113
Name of mitigation action Sector(s) affected
GHG(s) affected
Objective and/or activity affected
Type of instrument
Status of implement.
Breaf description
Start year of
impl.
Implementing entity or entities
Estimate of mitigation impact (not cumulative)
in kt CO2-eq 2020
in services/ tertiary sector Efficiency improvement in industrial end-use sectors Demand management/reduction Improved behaviour Low carbon fuels/electric cars
MEN-14 Energy efficiency projects with implementation through energy services*
Energy CO2 Efficiency improvements of buildings Efficiency improvement in services/ tertiary sector Efficiency improvement in industrial end-use sectors Demand management/reduction
Economic Implemented See Chapter 3 2004 ESCO companies
IE
MTR-2: Providing information to consumers on fuel economy and CO2 emission of new passenger cars*
Transport CO2 Low carbon fuels/electric cars
Information Implemented See Chapter 3 2007 MENP Ministry of Interior
IE
MTR-3: Implementation of the pilot project and establishment of training system for drivers of road vehicles for eco-driving*
Transport CO2 Improved behaviour Education Implemented See Chapter 3 2011 MENP Ministry of Interior
IE
MTR-4: Promotion of production and use of biofuels in transport*
Energy, Transport, Agriculture
CO2 Low carbon fuels/electric cars Increase in renewable energy
Economic|Regulatory|Fiscal
Implemented See Chapter 3 2010 Ministry of Economy
IE

SECOND BIENNIAL REPORT OF THE REPUBLIC OF CROATIA
Page 67/113
Name of mitigation action Sector(s) affected
GHG(s) affected
Objective and/or activity affected
Type of instrument
Status of implement.
Breaf description
Start year of
impl.
Implementing entity or entities
Estimate of mitigation impact (not cumulative)
in kt CO2-eq 2020
MTR-5: Modification of the system for special fee payment for the environment for motor vehicles*
Transport CO2 Low carbon fuels/electric cars Efficiency improvements of vehicles
Fiscal Implemented See Chapter 3 2014 MENP Environmental protection and energy efficiency fund
IE
MTR-6: Financial incentives for the purchase of hybrid and electric vehicles*
Transport CO2 Low carbon fuels/electric cars
Economic Implemented See Chapter 3 2014 MENP Ministry of Economy
IE
MTR-7: Development of infrastructure for electric vehicles in urban areas
Transport CO2 Improved transport infrastructure Low carbon fuels/electric cars
Economic Planned See Chapter 3 2016 Ministry of Economy Ministry of maritime affairs, transport and infrastructure
NE
MTR-8: Development of sustainable transport systems in urban areas
Transport CO2 Modal shift to public transport or non-motorized transport Demand management/reduction
Other (Planning)
Implemented See Chapter 3 2017 MENP Units of regional and local self-government
NE
MOS-1: Handling with substances that deplete the ozone layer and fluorinated greenhouse gases*
Industry/industrial processes
SF6, PFCs, HFCs
Reduction of emissions of fluorinated gases Replacement of fluorinated gases by other substances
Regulatory Implemented See Chapter 3 2014 MENP
NE
MOS-2: Technical and organizational measures for collecting, recycling, recovering and destroying of controlled substances and fluorinated greenhouse gases*
Industry/industrial processes
PFCs, SF6, HFCs
Reduction of emissions of fluorinated gases
Regulatory Implemented See Chapter 3 2014 Centers for collecting, recycling and recovering of controlled substances
NE
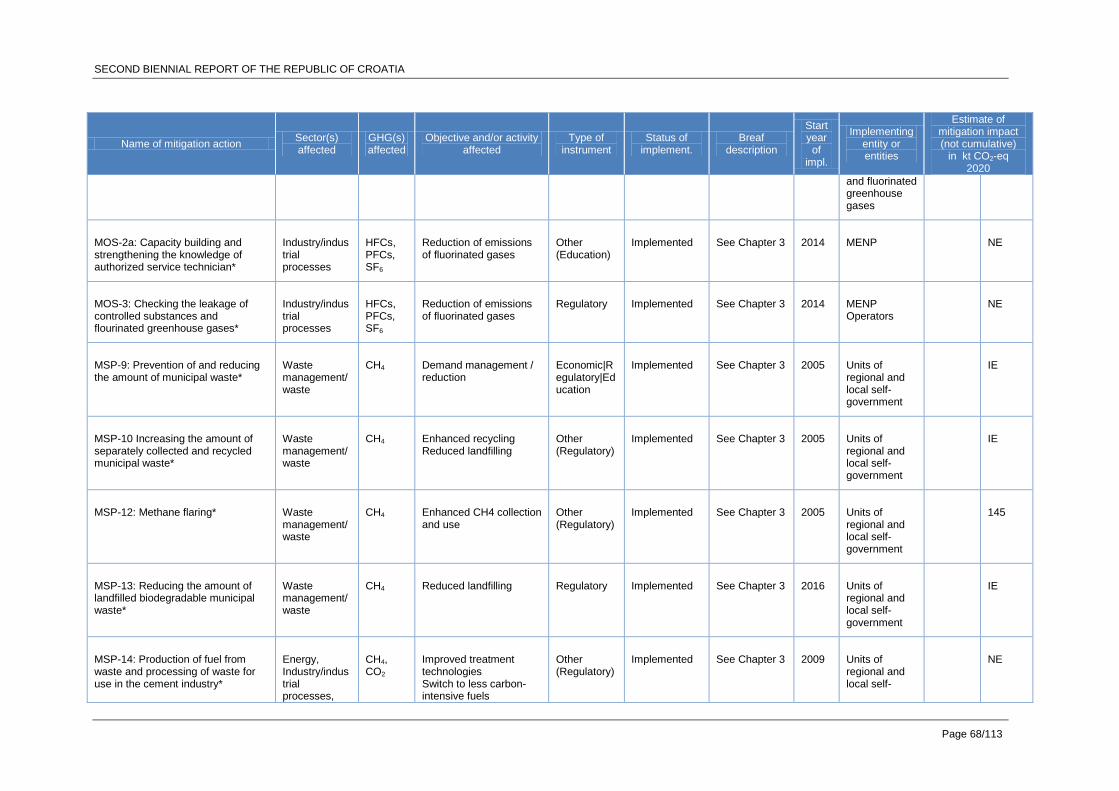
SECOND BIENNIAL REPORT OF THE REPUBLIC OF CROATIA
Page 68/113
Name of mitigation action Sector(s) affected
GHG(s) affected
Objective and/or activity affected
Type of instrument
Status of implement.
Breaf description
Start year of
impl.
Implementing entity or entities
Estimate of mitigation impact (not cumulative)
in kt CO2-eq 2020
and fluorinated greenhouse gases
MOS-2a: Capacity building and strengthening the knowledge of authorized service technician*
Industry/industrial processes
HFCs, PFCs, SF6
Reduction of emissions of fluorinated gases
Other (Education)
Implemented See Chapter 3 2014 MENP
NE
MOS-3: Checking the leakage of controlled substances and flourinated greenhouse gases*
Industry/industrial processes
HFCs, PFCs, SF6
Reduction of emissions of fluorinated gases
Regulatory Implemented See Chapter 3 2014 MENP Operators
NE
MSP-9: Prevention of and reducing the amount of municipal waste*
Waste management/waste
CH4 Demand management / reduction
Economic|Regulatory|Education
Implemented See Chapter 3 2005 Units of regional and local self-government
IE
MSP-10 Increasing the amount of separately collected and recycled municipal waste*
Waste management/waste
CH4 Enhanced recycling Reduced landfilling
Other (Regulatory)
Implemented See Chapter 3 2005 Units of regional and local self-government
IE
MSP-12: Methane flaring* Waste management/waste
CH4 Enhanced CH4 collection and use
Other (Regulatory)
Implemented See Chapter 3 2005 Units of regional and local self-government
145
MSP-13: Reducing the amount of landfilled biodegradable municipal waste*
Waste management/waste
CH4 Reduced landfilling Regulatory Implemented See Chapter 3 2016 Units of regional and local self-government
IE
MSP-14: Production of fuel from waste and processing of waste for use in the cement industry*
Energy, Industry/industrial processes,
CH4, CO2
Improved treatment technologies Switch to less carbon-intensive fuels
Other (Regulatory)
Implemented See Chapter 3 2009 Units of regional and local self-
NE

SECOND BIENNIAL REPORT OF THE REPUBLIC OF CROATIA
Page 69/113
Name of mitigation action Sector(s) affected
GHG(s) affected
Objective and/or activity affected
Type of instrument
Status of implement.
Breaf description
Start year of
impl.
Implementing entity or entities
Estimate of mitigation impact (not cumulative)
in kt CO2-eq 2020
Waste management/waste
Increase in renewable energy Installation of abatement technologies
government
MSP-15: Use of biogas for electricity and heat generation*
Waste management/waste, Energy
CH4, CO2
Increase in renewable energy Switch to less carbon-intensive fuels Enhanced CH4 collection and use Waste incineration with energy use
Other (Regulatory)
Implemented See Chapter 3 2012 Units of regional and local self-government
IE
MSP-16: Thermal treatment of municipal waste and sludge from wastewater treatment plants
Energy, Waste management/waste
CH4, CO2
Increase in renewable energy Switch to less carbon-intensive fuels Enhanced CH4 collection and use Waste incineration with energy use
Economic Planned See Chapter 3 2020 City of Zagreb
34
MSP-4: Development of the assessment of implementation of GHG emission reduction measures in the agriculture sector
Agriculture CH4, N2O
Reduction of fertilizer/manure use on cropland Other activities improving cropland management Improved livestock management Improved animal waste management systems Activities improving grazing land or grassland management Improved management of organic soils
Research Planned See Chapter 3 2016 Ministry of agriculture MENP
NE

SECOND BIENNIAL REPORT OF THE REPUBLIC OF CROATIA
Page 70/113
Name of mitigation action Sector(s) affected
GHG(s) affected
Objective and/or activity affected
Type of instrument
Status of implement.
Breaf description
Start year of
impl.
Implementing entity or entities
Estimate of mitigation impact (not cumulative)
in kt CO2-eq 2020
MSP-4a: Rural Development Programme of the Republic of Croatia for the Period 2014-2020*
Agriculture, Forestry/LULUCF
CH4, CO2
Other activities improving cropland management Improved livestock management Reduction of fertilizer/manure use on cropland Improved animal waste management systems Activities improving grazing land or grassland management Improved management of organic soils
Other (Economic)
Adopted See Chapter 3 2015 Ministry of agriculture
68
MSP-5: Improving the reporting from LULUCF sector*
Forestry/LULUCF
CO2 Conservation of carbon in existing forests Afforestation and reforestation Enhancing production in existing forests Enhanced forest management Increasing the harvested wood products pool Prevention of deforestation Strengthening protection against natural disturbances Substitution of GHG-intensive feedstocks and materials with harvested wood products Prevention of drainage or rewetting of wetlands Restoration of degraded lands
Regulatory Implemented See Chapter 3 2014 MENP Ministry of agriculture
NE

SECOND BIENNIAL REPORT OF THE REPUBLIC OF CROATIA
Page 71/113
Name of mitigation action Sector(s) affected
GHG(s) affected
Objective and/or activity affected
Type of instrument
Status of implement.
Breaf description
Start year of
impl.
Implementing entity or entities
Estimate of mitigation impact (not cumulative)
in kt CO2-eq 2020
MSP-6: Preparation of cost-benefit analysis of afforestation on new areas and natural regeneration of forests as a measure of increasing sinks in LULUCF sector
Forestry/LULUCF
CO2 Afforestation and reforestation Conservation of carbon in existing forests Enhancing production in existing forests Enhanced forest management Prevention of deforestation Increasing the harvested wood products pool Strengthening protection against natural disturbances Substitution of GHG-intensive feedstocks and materials with harvested wood products Prevention of drainage or rewetting of wetlands Restoration of degraded lands
Research Planned See Chapter 3 2016 MENP Ministry of agriculture
NE
MSP-7: Revision of Forest Management Reference Level (FMRL) under Article 3.4 of the Kyoto Protocol for the second commitment period
Forestry/LULUCF
CO2 Afforestation and reforestation Conservation of carbon in existing forests Enhancing production in existing forests Increasing the harvested wood products pool Enhanced forest management Prevention of deforestation Strengthening protection against natural disturbances Substitution of GHG-
Regulatory Implemented See Chapter 3 2014 MENP Ministry of agriculture
NE

SECOND BIENNIAL REPORT OF THE REPUBLIC OF CROATIA
Page 72/113
Name of mitigation action Sector(s) affected
GHG(s) affected
Objective and/or activity affected
Type of instrument
Status of implement.
Breaf description
Start year of
impl.
Implementing entity or entities
Estimate of mitigation impact (not cumulative)
in kt CO2-eq 2020
intensive feedstocks and materials with harvested wood products Prevention of drainage or rewetting of wetlands Restoration of degraded lands
MSP-8: Development of Action plan for LULUCF sector*
Forestry/LULUCF
CO2 Afforestation and reforestation Conservation of carbon in existing forests Enhancing production in existing forests Increasing the harvested wood products pool Prevention of deforestation Enhanced forest management Substitution of GHG-intensive feedstocks and materials with harvested wood products Strengthening protection against natural disturbances Prevention of drainage or rewetting of wetlands Restoration of degraded lands
Regulatory Implemented See Chapter 3 2014 MENP Ministry of agriculture
NE
MSP-18: CO2 emission tax* Energy, Cross-cutting, Industry/industrial processes
CO2 Framework policy Efficiency improvement in industrial end-use sectors Installation of abatement technologies
Fiscal Implemented See Chapter 3 2013 MENP Environmental protection and energy efficiency fund
NE
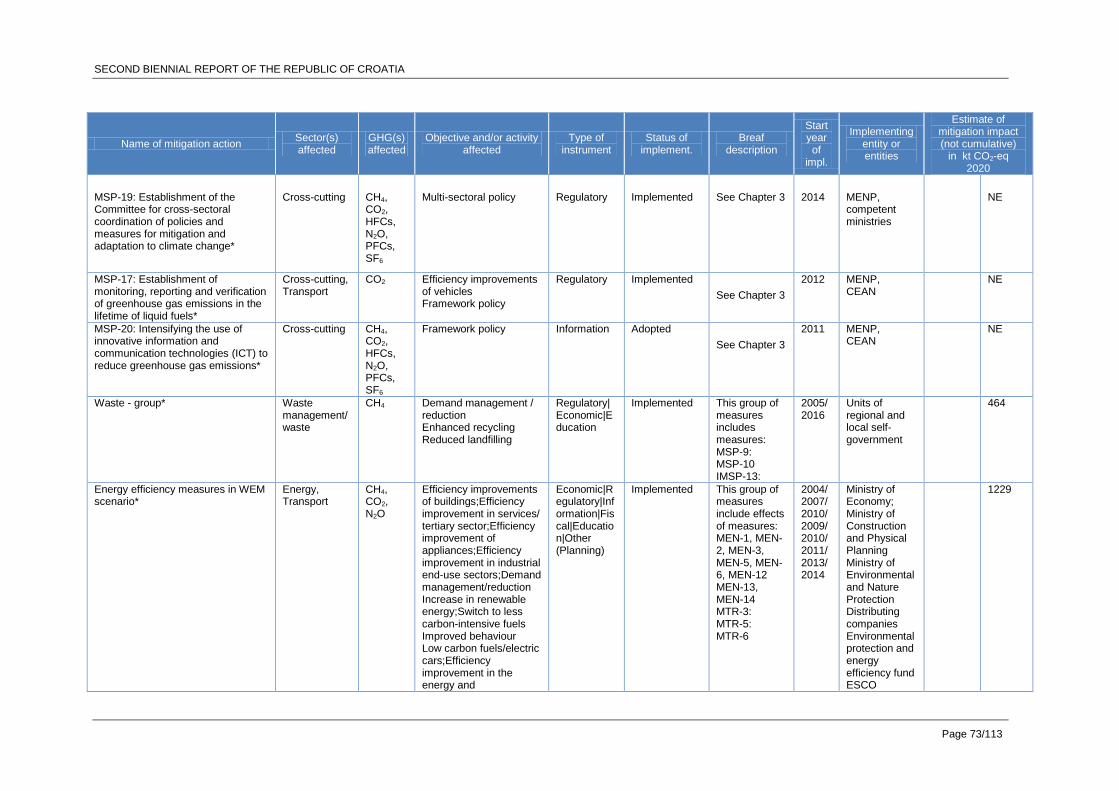
SECOND BIENNIAL REPORT OF THE REPUBLIC OF CROATIA
Page 73/113
Name of mitigation action Sector(s) affected
GHG(s) affected
Objective and/or activity affected
Type of instrument
Status of implement.
Breaf description
Start year of
impl.
Implementing entity or entities
Estimate of mitigation impact (not cumulative)
in kt CO2-eq 2020
MSP-19: Establishment of the Committee for cross-sectoral coordination of policies and measures for mitigation and adaptation to climate change*
Cross-cutting CH4, CO2, HFCs, N2O, PFCs, SF6
Multi-sectoral policy Regulatory Implemented See Chapter 3 2014 MENP, competent ministries
NE
MSP-17: Establishment of monitoring, reporting and verification of greenhouse gas emissions in the lifetime of liquid fuels*
Cross-cutting, Transport
CO2 Efficiency improvements of vehicles Framework policy
Regulatory Implemented
See Chapter 3
2012 MENP, CEAN
NE
MSP-20: Intensifying the use of innovative information and communication technologies (ICT) to reduce greenhouse gas emissions*
Cross-cutting CH4, CO2, HFCs, N2O, PFCs, SF6
Framework policy Information Adopted
See Chapter 3
2011 MENP, CEAN
NE
Waste - group* Waste management/waste
CH4 Demand management / reduction Enhanced recycling Reduced landfilling
Regulatory|Economic|Education
Implemented This group of measures includes measures: MSP-9: MSP-10 IMSP-13:
2005/2016
Units of regional and local self-government
464
Energy efficiency measures in WEM scenario*
Energy, Transport
CH4, CO2, N2O
Efficiency improvements of buildings;Efficiency improvement in services/ tertiary sector;Efficiency improvement of appliances;Efficiency improvement in industrial end-use sectors;Demand management/reduction Increase in renewable energy;Switch to less carbon-intensive fuels Improved behaviour Low carbon fuels/electric cars;Efficiency improvement in the energy and
Economic|Regulatory|Information|Fiscal|Education|Other (Planning)
Implemented This group of measures include effects of measures: MEN-1, MEN-2, MEN-3, MEN-5, MEN-6, MEN-12 MEN-13, MEN-14 MTR-3: MTR-5: MTR-6
2004/2007/2010/2009/2010/2011/2013/2014
Ministry of Economy; Ministry of Construction and Physical Planning Ministry of Environmental and Nature Protection Distributing companies Environmental protection and energy efficiency fund ESCO
1229

SECOND BIENNIAL REPORT OF THE REPUBLIC OF CROATIA
Page 74/113
Name of mitigation action Sector(s) affected
GHG(s) affected
Objective and/or activity affected
Type of instrument
Status of implement.
Breaf description
Start year of
impl.
Implementing entity or entities
Estimate of mitigation impact (not cumulative)
in kt CO2-eq 2020
transformation sector; Modal shift to public transport or non-motorized transport; Demand management/reduction Efficiency improvements of vehicles
companies Ministry of Interior Croatian Bank for Reconstruction and Development Units of regional and local self-government
Renewable energy in WEM scenario*
Energy, Waste management/waste, Transport
CH4, CO2, N2O
Increase in renewable energy;Switch to less carbon-intensive fuels Enhanced CH4 collection and use; Waste incineration with energy use; Efficiency improvements of buildings; Efficiency improvement of appliances; Efficiency improvement in services/ tertiary sector; Efficiency improvement in industrial end-use sectors;Demand management/reduction Improved behaviour;Low carbon fuels/electric cars
Economic|Regulatory|Fiscal
Implemented Incorporates estimated mitigation potential of measures: tMEN-7 MEN-9 MEN-12 MEN-13 MTR-4: MSP-15
2004/2007/2010/2012
Ministry of Economy Ministry of Environmental and Nature Protection Environmental protection and energy efficiency fund Ministry of Economy
4325
Energy efficiency measures in WAM scenario
Energy, Transport
CH4, CO2, N2O
Efficiency improvements of buildings; Efficiency improvement in services/ tertiary sector; Efficiency improvement of appliances;Efficiency improvement in industrial end-use sectors;Demand management/reduction Increase in renewable energy;Switch to less carbon-intensive fuels Improved behaviour
Economic|Regulatory|Information|Education|Fiscal|Other (Planning)
Implemented This group of measures include effects of measures: MEN-1 MEN-2 MEN-3 MEN-5 MEN-12 , MEN-13 MEN-14 MTR-2: MTR-3:
2004/2007/2010/2011/2014/2017
Ministry of Economy Ministry of Construction and Physical Planning Distributing companies Environmental protection and energy efficiency fund ESCO
2553

SECOND BIENNIAL REPORT OF THE REPUBLIC OF CROATIA
Page 75/113
Name of mitigation action Sector(s) affected
GHG(s) affected
Objective and/or activity affected
Type of instrument
Status of implement.
Breaf description
Start year of
impl.
Implementing entity or entities
Estimate of mitigation impact (not cumulative)
in kt CO2-eq 2020
Low carbon fuels/electric cars; Efficiency improvement in the energy and transformation sector; Modal shift to public transport or non-motorized transport Demand management/ reduction; Efficiency improvements of vehicles
MTR-5: MTR-6: MTR-8:
companies Ministry of Environmental and Nature Protection Ministry of Interior Croatian Bank for Reconstruction and Development Units of regional and local self-government
Renewable energy measures in WAM scenario
Energy, Waste management/waste, Transport
Increase in renewable energy, Switch to less carbon-intensive fuels Enhanced CH4 collection and use; Waste incineration with energy use;Efficiency improvements of buildings;Efficiency improvement of appliances;Efficiency improvement in services/ tertiary sector;Efficiency improvement in industrial end-use sectors;Demand management/reduction Improved behaviour Low carbon fuels/electric cars
Economic|Regulatory|Fiscal
Planned Incorporates estimated mitigation potential of measures: MEN-7 MEN-9 MEN-12 PMEN-13 MTR-4: MSP-15: MSP-16:
2021 Ministry of Economy Ministry of Environmental and Nature Protection Environmental protection and energy efficiency fund Ministry of Economy
0
* mitigation action is included in the „with measures‟ projection

SECOND BIENNIAL REPORT OF THE REPUBLIC OF CROATIA
Page 76/113
3.9. ASSESSMENT OF THE ECONOMIC AND SOCIAL CONSEQUENCE OF RESPONSE
MEASURES
According to paragraph 24 of the Annex to Decision 15/CMP.1 Parties included in Annex II, and
other Parties included in Annex I that are in a position to do so, shall incorporate information on
how they give priority, in implementing their commitments based on relevant methodologies
referred to in paragraph 8 of decision 31/CMP.1. As a country undergoing the process of
transition to market economy, Croatia has, pursuant to Article 22, paragraph 3 of the
Convention, assumed the commitments of countries included in Annex I, therefore Croatia is not
required to provide financial or any other assistance to developing countries.
According to Article 4, paragraphs 8 and 9 of the Convention Croatia strives to implement Kyoto
commitments in a way which minimize adverse impact on developing countries. In continuation
information on implementation of policies and measures that minimise adverse social,
environmental and economic impacts on non-Annex I Parties is provided.
a) Market imperfections, fiscal incentives, tax and duty exemptions and subsidies
The ongoing liberalization of energy market is in line with EU policies and directives. No
significant market distortions have been identified. Consumption taxes for electricity and fossil
fuels were harmonized recently. The main instrument addressing externalities is the emission
trading under the EU ETS.
b) Removing subsidies associated with the use of environmentally unsound and unsafe
technologies
In Republic of Croatia no subsidies for environmentally unsound and unsafe technologies have
been identified.
c) Technological development of non-energy uses of fossil fuels
The Republic of Croatia has not participated actively in activities of this nature.
d) Carbon capture and storage technology development
The Republic of Croatia does not take part in any such activity.
e) Improvements in fossil fuel efficiencies
In 2014 The Third National Energy Efficiency Action Plan for the 2014- 2016 period has been
drawn up in accordance with the template laid down by the European Commission, with which
all EU Member States must comply. Measures for the period from 2014 to 2016 regarding
energy efficiency are:
• supporting the use of renewable energy sources and energy efficiency by the
Environmental Protection and Energy Efficiency Fund (the Fund),
• encouraging the use of renewable energy and energy efficiency through the Croatian
Bank for Reconstruction and Development (HBOR),
SECOND BIENNIAL REPORT OF THE REPUBLIC OF CROATIA
Page 77/113
• energy efficiency projects with repayment through savings (ESCOs),
• increasing energy efficiency in buildings
• energy audits in the industry,
• promoting energy efficiency in households and the services sector through project
activities,
• labelling the energy efficiency of household appliances,
• metering and informative billing of energy consumption,
• eco-design of energy using products.
f) Assisting developing country Parties which are highly dependent on the export and
consumption of fossil fuels in diversifying their economies
As regard of above mentioned activity the Republic of Croatia does not take part in any such
activity.
3.10. ESTIMATES OF EMISSION REDUCTIONS AND REMOVALS AND THE USE OF
UNITS FROM MARKET-BASED MECHANISMS AND LULUCF ACTIVITIES
In this section summary information on estimates of emission reductions and removals and the
use of units from market-based mechanisms and land use, land use change and forestry
activities are provided in CTF Tables 4, 4(a) and 4(b).
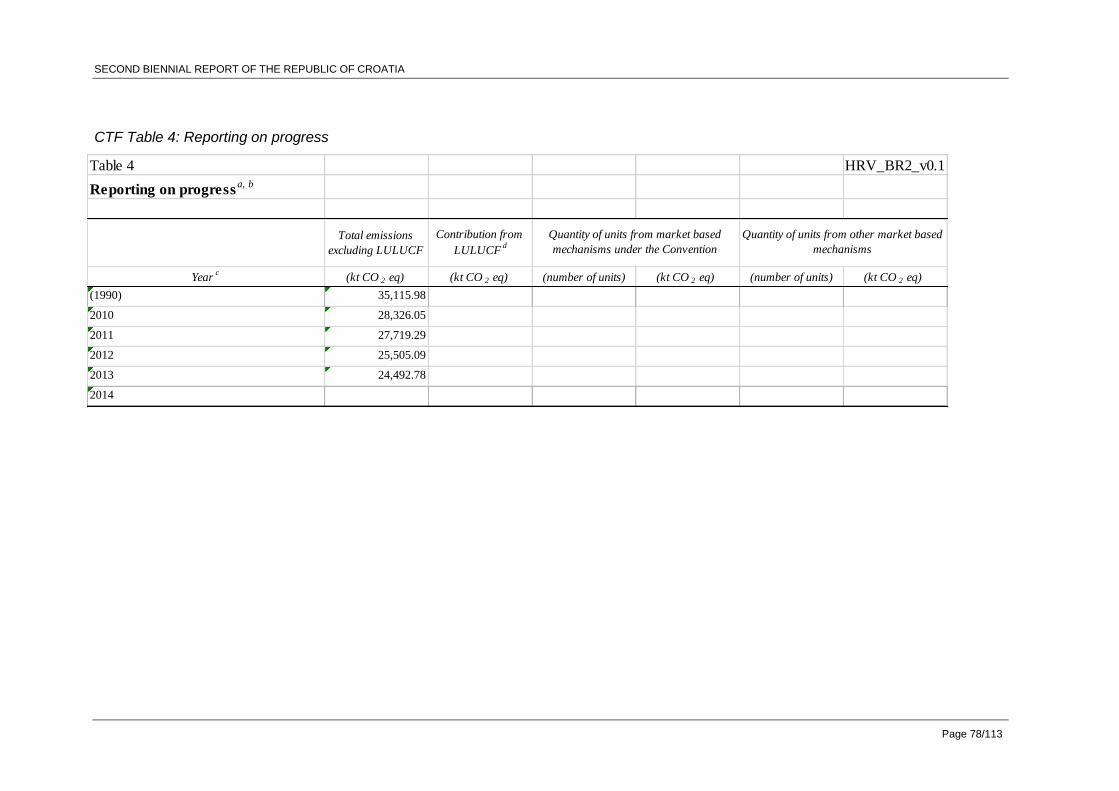
SECOND BIENNIAL REPORT OF THE REPUBLIC OF CROATIA
Page 78/113
Table 4 HRV_BR2_v0.1
Reporting on progressa, b
Total emissions
excluding LULUCF
Contribution from
LULUCFd
Yearc
(kt CO 2 eq) (kt CO 2 eq) (number of units) (kt CO 2 eq) (number of units) (kt CO 2 eq)
(1990) 35,115.98
2010 28,326.05
2011 27,719.29
2012 25,505.09
2013 24,492.78
2014
Quantity of units from market based
mechanisms under the Convention
Quantity of units from other market based
mechanisms
CTF Table 4: Reporting on progress
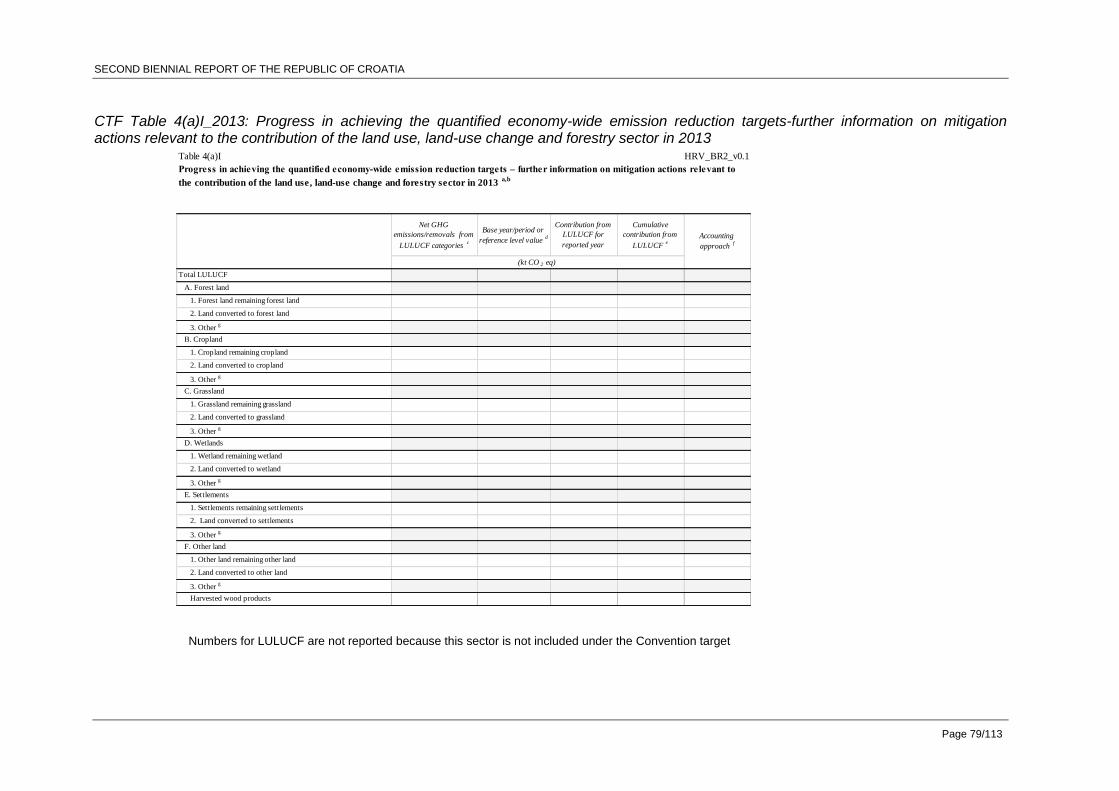
SECOND BIENNIAL REPORT OF THE REPUBLIC OF CROATIA
Page 79/113
CTF Table 4(a)I_2013: Progress in achieving the quantified economy-wide emission reduction targets-further information on mitigation actions relevant to the contribution of the land use, land-use change and forestry sector in 2013
Numbers for LULUCF are not reported because this sector is not included under the Convention target
Table 4(a)I HRV_BR2_v0.1
Net GHG
emissions/removals from
LULUCF categories c
Base year/period or
reference level value d
Contribution from
LULUCF for
reported year
Cumulative
contribution from
LULUCF e
Total LULUCF
A. Forest land
1. Forest land remaining forest land
2. Land converted to forest land
3. Other g
B. Cropland
1. Cropland remaining cropland
2. Land converted to cropland
3. Other g
C. Grassland
1. Grassland remaining grassland
2. Land converted to grassland
3. Other g
D. Wetlands
1. Wetland remaining wetland
2. Land converted to wetland
3. Other g
E. Settlements
1. Settlements remaining settlements
2. Land converted to settlements
3. Other g
F. Other land
1. Other land remaining other land
2. Land converted to other land
3. Other g
Harvested wood products
Progress in achieving the quantified economy-wide emission reduction targets – further information on mitigation actions relevant to
the contribution of the land use, land-use change and forestry sector in 2013 a,b
Accounting
approach f
(kt CO 2 eq)
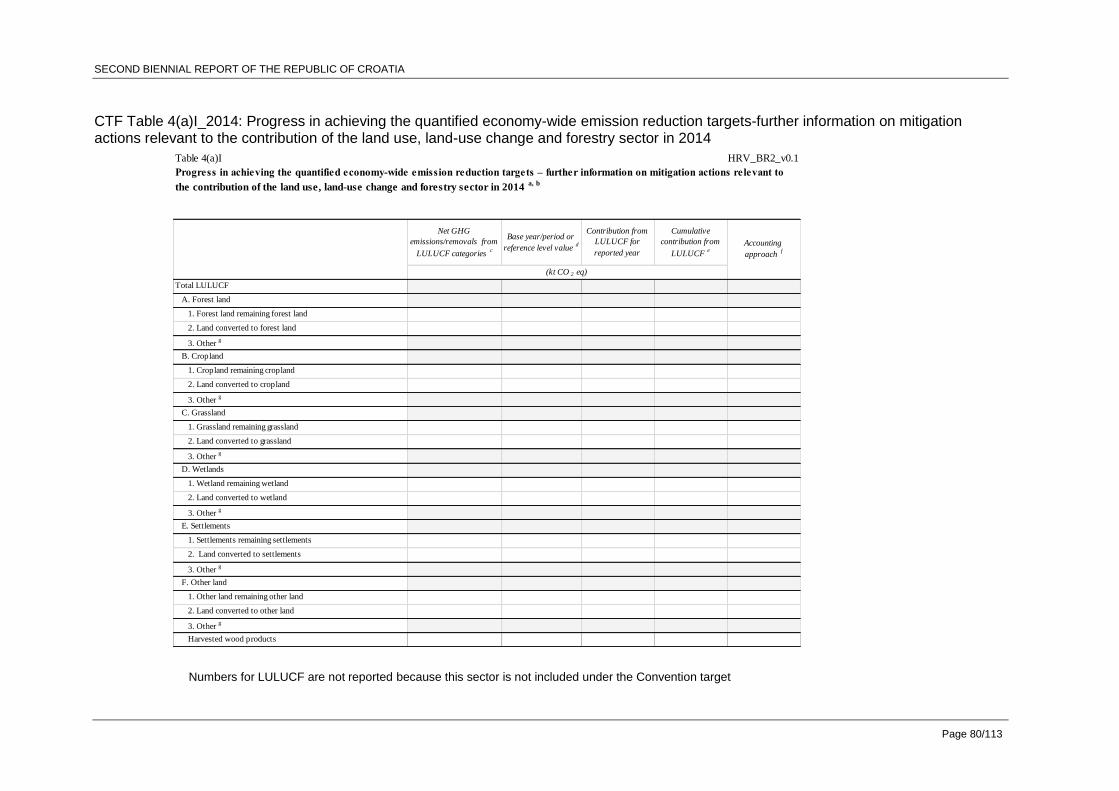
SECOND BIENNIAL REPORT OF THE REPUBLIC OF CROATIA
Page 80/113
CTF Table 4(a)I_2014: Progress in achieving the quantified economy-wide emission reduction targets-further information on mitigation actions relevant to the contribution of the land use, land-use change and forestry sector in 2014
Numbers for LULUCF are not reported because this sector is not included under the Convention target
Table 4(a)I HRV_BR2_v0.1
Net GHG
emissions/removals from
LULUCF categories c
Base year/period or
reference level value d
Contribution from
LULUCF for
reported year
Cumulative
contribution from
LULUCF e
Total LULUCF
A. Forest land
1. Forest land remaining forest land
2. Land converted to forest land
3. Other g
B. Cropland
1. Cropland remaining cropland
2. Land converted to cropland
3. Other g
C. Grassland
1. Grassland remaining grassland
2. Land converted to grassland
3. Other g
D. Wetlands
1. Wetland remaining wetland
2. Land converted to wetland
3. Other g
E. Settlements
1. Settlements remaining settlements
2. Land converted to settlements
3. Other g
F. Other land
1. Other land remaining other land
2. Land converted to other land
3. Other g
Harvested wood products
Progress in achieving the quantified economy-wide emission reduction targets – further information on mitigation actions relevant to
the contribution of the land use, land-use change and forestry sector in 2014 a, b
Accounting
approach f
(kt CO 2 eq)
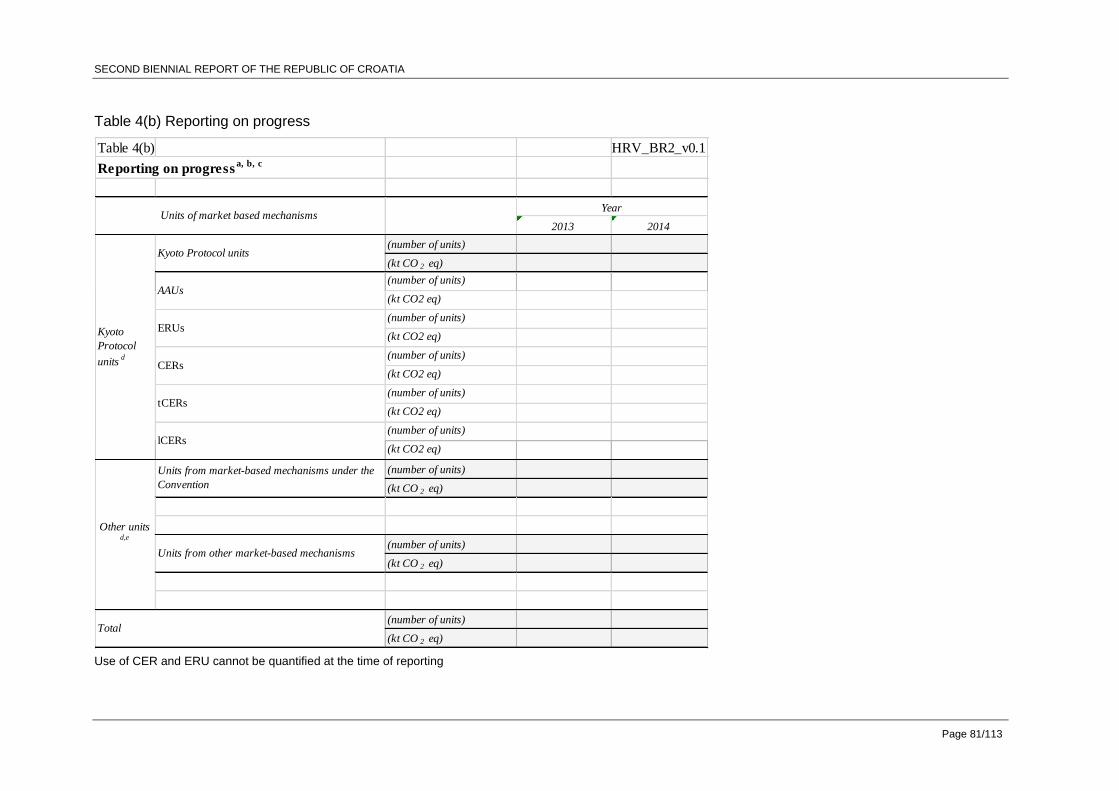
SECOND BIENNIAL REPORT OF THE REPUBLIC OF CROATIA
Page 81/113
Table 4(b) HRV_BR2_v0.1
Reporting on progressa, b, c
2013 2014
(number of units)
(kt CO 2 eq)
(number of units)
(kt CO2 eq)
(number of units)
(kt CO2 eq)
(number of units)
(kt CO2 eq)
(number of units)
(kt CO2 eq)
(number of units)
(kt CO2 eq)
(number of units)
(kt CO 2 eq)
(number of units)
(kt CO 2 eq)
(number of units)
(kt CO 2 eq)
Other units d,e
Units from market-based mechanisms under the
Convention
Units from other market-based mechanisms
Total
Units of market based mechanismsYear
Kyoto
Protocol
unitsd
Kyoto Protocol units
AAUs
ERUs
CERs
tCERs
lCERs
Table 4(b) Reporting on progress
Use of CER and ERU cannot be quantified at the time of reporting
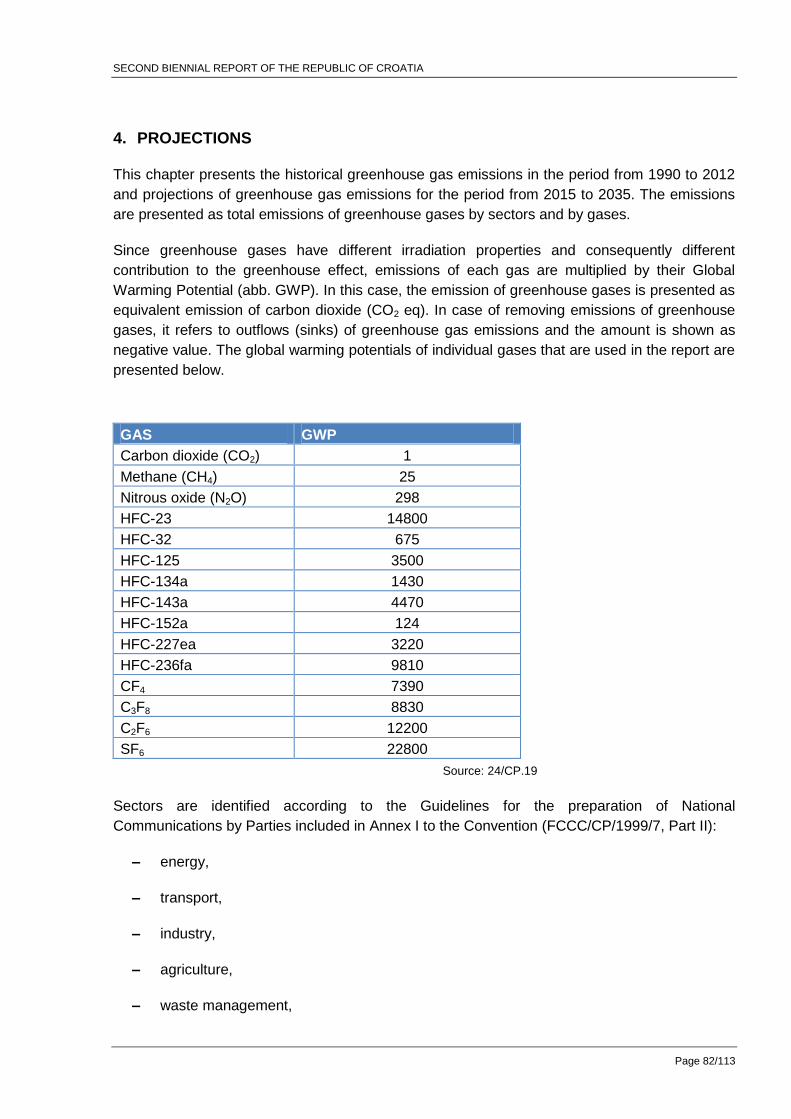
SECOND BIENNIAL REPORT OF THE REPUBLIC OF CROATIA
Page 82/113
4. PROJECTIONS
This chapter presents the historical greenhouse gas emissions in the period from 1990 to 2012
and projections of greenhouse gas emissions for the period from 2015 to 2035. The emissions
are presented as total emissions of greenhouse gases by sectors and by gases.
Since greenhouse gases have different irradiation properties and consequently different
contribution to the greenhouse effect, emissions of each gas are multiplied by their Global
Warming Potential (abb. GWP). In this case, the emission of greenhouse gases is presented as
equivalent emission of carbon dioxide (CO2 eq). In case of removing emissions of greenhouse
gases, it refers to outflows (sinks) of greenhouse gas emissions and the amount is shown as
negative value. The global warming potentials of individual gases that are used in the report are
presented below.
GAS GWP
Carbon dioxide (CO2) 1
Methane (CH4) 25
Nitrous oxide (N2O) 298
HFC-23 14800
HFC-32 675
HFC-125 3500
HFC-134a 1430
HFC-143a 4470
HFC-152a 124
HFC-227ea 3220
HFC-236fa 9810
CF4 7390
C3F8 8830
C2F6 12200
SF6 22800
Source: 24/CP.19
Sectors are identified according to the Guidelines for the preparation of National
Communications by Parties included in Annex I to the Convention (FCCC/CP/1999/7, Part II):
– energy,
– transport,
– industry,
– agriculture,
– waste management,

SECOND BIENNIAL REPORT OF THE REPUBLIC OF CROATIA
Page 83/113
– LULUCF.
Particularly the emissions of certain greenhouse gases are presented:
– CO2,
– CH4,
– N2O,
– HFCs and PFCs,
– SF6.
According to the Guidelines for the preparation of National Communications by Parties included
in Annex I to the Convention, projections are presented for three scenarios: „without measures‟
scenario, „with measures‟ scenario and „with additional measures‟ scenario. Scenario „without
measures‟ assumes that implementation of adopted policies and measures as well as
implementation of planned policies and measures will not happen. Scenario „with measures‟
assumes a consistent application of policies and measures, which application is already in
progress and application of adopted policies and measures, which application is likely, but still
not begun. Scenario ‟with additional measures‟ is based on application of planned policies and
measures.
Emission projections start from the last published inventory of greenhouse gas emissions which
includes an inventory of emissions and sinks of greenhouse gases for the period 1990 – 2012
(made in accordance with the 1996 IPCC Guidelines). Reference year for projection is 2012.
4.1. PROJECTIONS OF GREENHOUSE GAS EMISSIONS BY SECTORS
Historical and projected trends in greenhouse gas emissions by sectors are presented in
Figures 4-1 to 4-3. Emissions are presented for „without measures‟ scenario, „with measures‟
scenario and „with additional measures‟ scenario for the period from 1990 to 2035.
The energy sector covers all activities that involve fuel combustion from stationary sources and
fugitive emission from fuels. The emission from energy sector in 2012 amounted to 13,471 kt
CO2 and it is the main source of anthropogenic emission of greenhouse gases, it accounts
approximately 50% of the total greenhouse gases emission in 2012. In scenario „without
measures', without implementation of energy efficiency measures and renewable energy policy
and an increase in a number of fossil fuel power plants to reduce the import of electricity by
2020, projections show strong growth until 2020 and moderate growth thereafter. In the 'with
measures' scenario, projections show continuous downward trend in emissions by 2015
because of economic downturn and implementation of measures to encourage the use of
renewable energy sources and energy efficiency. In the period from 2015 to 2020, the increase
in emissions is a result of expected increase in installed capacity in thermal power plants using
fossil fuels to reduce the import of electricity. After 2020, this scenario shows a slight increase

SECOND BIENNIAL REPORT OF THE REPUBLIC OF CROATIA
Page 84/113
due to expected increase in economic activity and new power plants. Most measures to reduce
emissions in the energy sector are planned by 2020, so it has not yet been determined which
will be implemented after 2020. In scenario 'with additional measures', all measures planned in
the energy sector were taken into account and projections show a steady trend of a slight
reduction of emissions.
The transport sector includes emissions from fuel combustion in road transportation, civil
aviation, railways and navigation. The emission from transport sector in 2012 amounted to
5,709 kt CO2 eq, which makes about 21.5% of total Croatia‟s greenhouse gases emission. In
scenario „without measures', projections show a continuous trend of reducing emissions by
2015, while there is an increase expected in the period up to 2020, primarily due to strong ties
with expected increase in GDP. In the 'with measures' scenario in the period from 2015 to 2020,
projections indicate stagnation of emissions. Factors that encourage the growth of emissions
are expected increase in economic activities and living standards, while the emission reductions
are primarily affected by the measures to increase energy efficiency and use of renewable
sources in transport. Most of the existing measures have projected duration by 2020 so after
that the emissions show a slight increase. In scenario 'with additional measures', projections
show a continuous trend of reducing emissions by 2020, primarily due to planned additional
measures to increase energy efficiency [10]. Even though there is an expected development of
the technology foreseen, after 2020, projections show a slight increase, mainly due to expected
economic growth, increase in the number of vehicles, number of passenger and goods
transports with yet undefined measures to reduce greenhouse gas emissions.
The industry sector includes the process emission, while emission from fuel combustion in
industry is included into energy sector. The emission from industry sector in 2012 amounted to
3,041 kt CO2 eq, which makes about 11% of total Croatia‟s greenhouse gases emission in 2012.
Solvent use sector, which is observed within the framework of industry sector, contributes to the
total greenhouse gas emission with about 0,6% (153.6 kt CO2 eq). The projections of emissions
indicate an increase in all scenarios, due to expected increase in production to the maximum
utilization of existing productive capacity in the period until 2035, despite the implementation of
cost-effective measures to reduce emissions.
The agriculture sector covers about 12,9% of total greenhouse gas emissions in 2012 (emission
is 3,501 kt CO2 eq). The projections indicate an increase in emissions after 2015 because of a
recovery of livestock (assumption based on expert judgement and draft version of “Improving
NH3, CH4 and N2O emission calculations from manure management and drafting EFs report”,
University of Zagreb, Faculty of Agriculture) and normalization of agricultural production (trend
analysis).
The waste management sector participates in the total emission of greenhouse gases with
about 4,9% in 2012 (emission is 1,316 kt CO2 eq). Projections indicate emission reduction in
scenarios 'with measures' and 'with additional measures' after 2015. The potential of CO2
emission reduction, which can be achieved by implementing the measures included in the
scenarios 'with measures' and 'with additional measures' is balanced in the Energy sector.
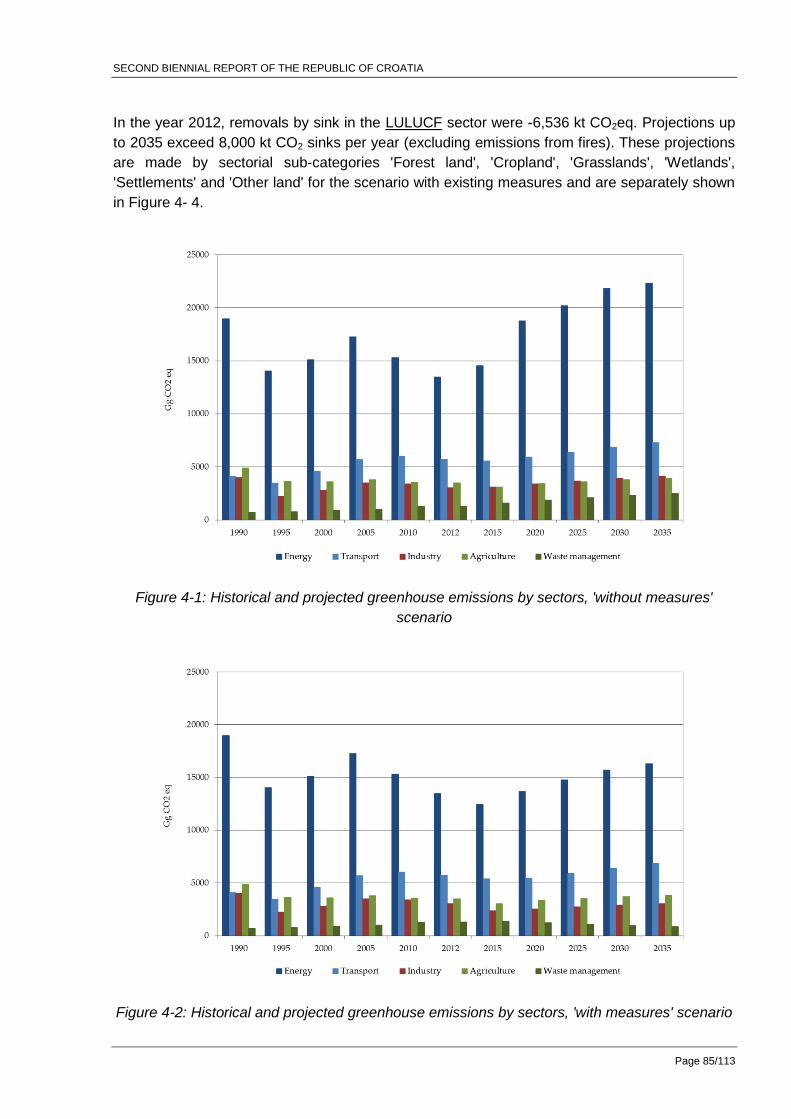
SECOND BIENNIAL REPORT OF THE REPUBLIC OF CROATIA
Page 85/113
In the year 2012, removals by sink in the LULUCF sector were -6,536 kt CO2eq. Projections up
to 2035 exceed 8,000 kt CO2 sinks per year (excluding emissions from fires). These projections
are made by sectorial sub-categories 'Forest land', 'Cropland', 'Grasslands', 'Wetlands',
'Settlements' and 'Other land' for the scenario with existing measures and are separately shown
in Figure 4- 4.
Figure 4-1: Historical and projected greenhouse emissions by sectors, 'without measures'
scenario
Figure 4-2: Historical and projected greenhouse emissions by sectors, 'with measures' scenario

SECOND BIENNIAL REPORT OF THE REPUBLIC OF CROATIA
Page 86/113
Figure 4-3: Historical and projected greenhouse emissions by sectors, 'with additional
measures' scenario
Figure 4-4: Historical and projected removals by sinks in the LULUCF sector, 'with measures'
scenario
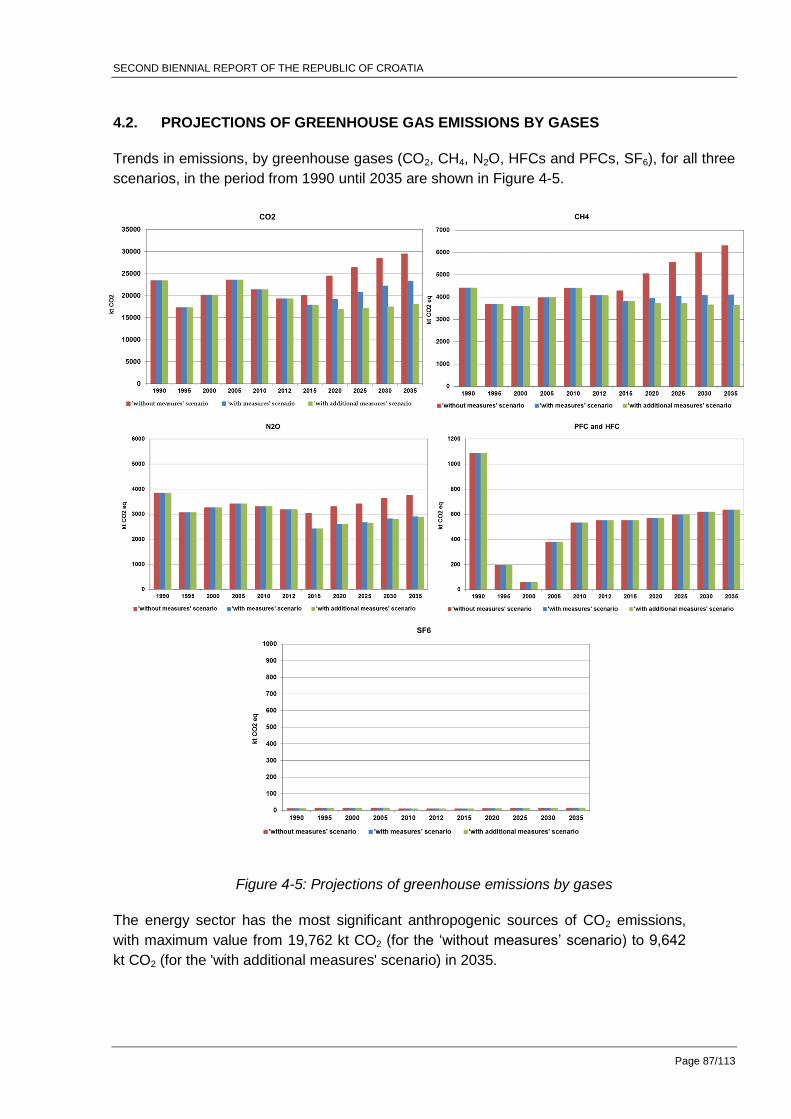
SECOND BIENNIAL REPORT OF THE REPUBLIC OF CROATIA
Page 87/113
4.2. PROJECTIONS OF GREENHOUSE GAS EMISSIONS BY GASES
Trends in emissions, by greenhouse gases (CO2, CH4, N2O, HFCs and PFCs, SF6), for all three
scenarios, in the period from 1990 until 2035 are shown in Figure 4-5.
Figure 4-5: Projections of greenhouse emissions by gases
The energy sector has the most significant anthropogenic sources of CO2 emissions,
with maximum value from 19,762 kt CO2 (for the „without measures‟ scenario) to 9,642
kt CO2 (for the 'with additional measures' scenario) in 2035.
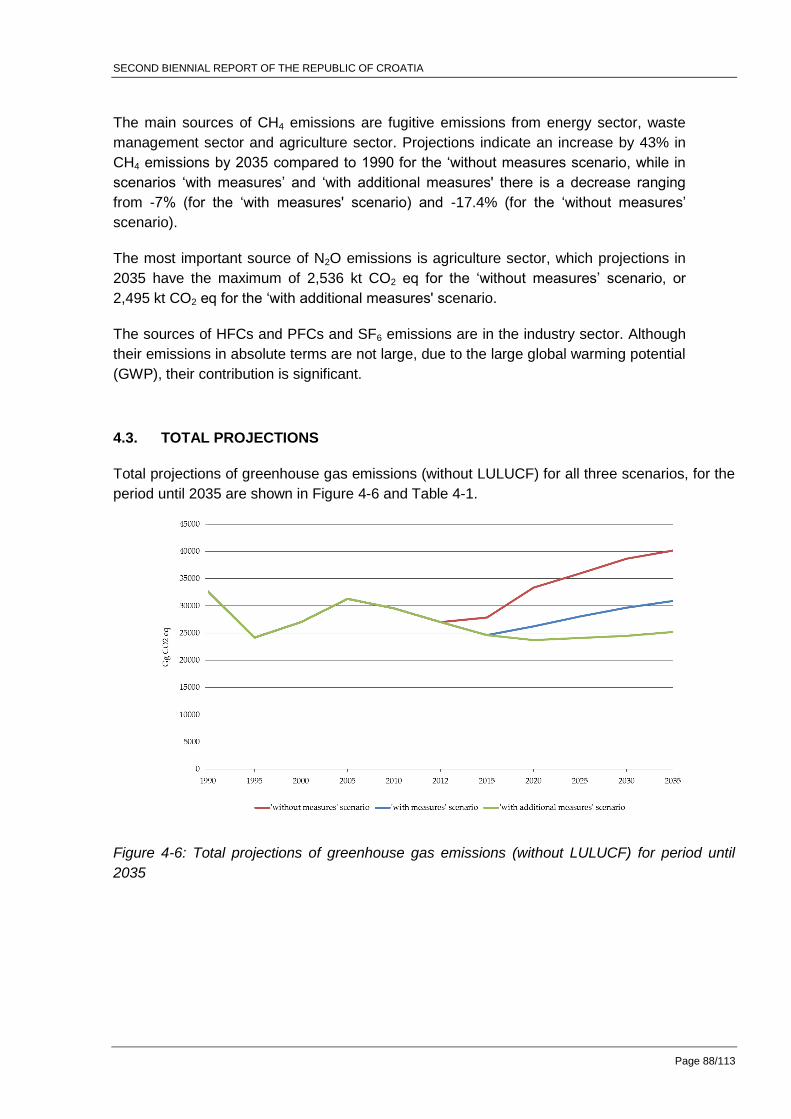
SECOND BIENNIAL REPORT OF THE REPUBLIC OF CROATIA
Page 88/113
The main sources of CH4 emissions are fugitive emissions from energy sector, waste
management sector and agriculture sector. Projections indicate an increase by 43% in
CH4 emissions by 2035 compared to 1990 for the „without measures scenario, while in
scenarios „with measures‟ and „with additional measures' there is a decrease ranging
from -7% (for the „with measures' scenario) and -17.4% (for the „without measures‟
scenario).
The most important source of N2O emissions is agriculture sector, which projections in
2035 have the maximum of 2,536 kt CO2 eq for the „without measures‟ scenario, or
2,495 kt CO2 eq for the „with additional measures' scenario.
The sources of HFCs and PFCs and SF6 emissions are in the industry sector. Although
their emissions in absolute terms are not large, due to the large global warming potential
(GWP), their contribution is significant.
4.3. TOTAL PROJECTIONS
Total projections of greenhouse gas emissions (without LULUCF) for all three scenarios, for the
period until 2035 are shown in Figure 4-6 and Table 4-1.
Figure 4-6: Total projections of greenhouse gas emissions (without LULUCF) for period until
2035

SECOND BIENNIAL REPORT OF THE REPUBLIC OF CROATIA
Page 89/113
Table 4-1: Historical emissions and projections of greenhouse gas emissions, kt CO2 eq
'without measures' scenario 2015 2020 2025 2030 2035
Energy 14,523 18,769 20,205 21,811 22,324
Transport 5,563 5,933 6,390 6,845 7,283
Industry 3,092 3,385 3,665 3,922 4,124
Waste management 1,605 1,854 2,098 2,314 2,498
Agriculture 3,101 3,423 3,589 3,783 3,916
TOTAL 27,885 33,365 35,948 38,675 40,145
with measures' scenario 2015 2020 2025 2030 2035
Energy 12,436 13,673 14,759 15,703 16,292
Transport 5,403 5,475 5,940 6,403 6,846
Industry 2,377 2,523 2,717 2,896 3,040
Waste management 1,353 1,245 1,103 981 876
Agriculture 3,044 3,355 3,515 3,704 3,833
TOTAL 24,614 26,271 28,034 29,687 30,888
with additional measures' scenario 2015 2020 2025 2030 2035
Energy 12,436 11,450 11,227 11,009 11,202
Transport 5,403 5,145 5,518 5,879 6,250
Industry 2,377 2,523 2,717 2,896 3,040
Waste management 1,353 1,245 1,103 981 876
Agriculture 3,044 3,355 3,515 3,704 3,833
TOTAL 24,614 23,719 24,079 24,469 25,202
Projections show that compared to 1990, in 2035 the emission suddenly increases by 22.9% in
the 'without measures' scenario. In the 'with measures' scenario, the emission in 2035 remains
approximately the same as in 1990, while in the 'with additional measures' scenario emission is
reduced by 22.9% compared to 1990.
In the 'with measures' scenario projections show continuous downward trend in emissions by
2015, primarily due to economic downturn and implementation of measures to encourage the
use of renewable energy sources and energy efficiency. In the period from 2015 to 2020, the
increase in emissions affects the expected increase in installed capacity in thermal power plants
using fossil fuels to reduce the import of electricity. After 2020, this scenario shows a slight
increase due to expected increase in economic activity and new power plants.
In the 'with additional measures' scenario, projections show a steady light downward trend of
emissions.
In 'with measures' scenario, in relation to the 'without measures' in 2035, the greenhouse gas
emissions will be reduced by 23%, while in the scenario 'with additional measures' by 37%.
In scenario 'with additional measures' in relation to the scenario 'with measures' in 2035,
greenhouse gas emissions will be reduced by 18.4%.
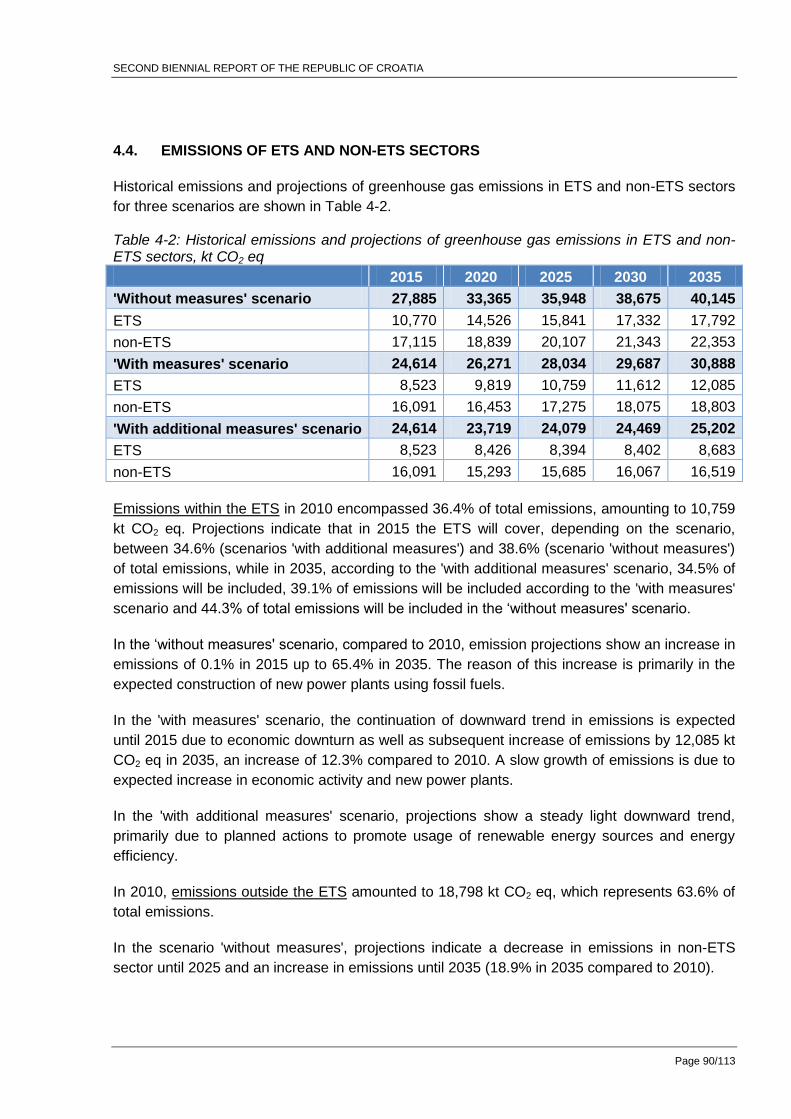
SECOND BIENNIAL REPORT OF THE REPUBLIC OF CROATIA
Page 90/113
4.4. EMISSIONS OF ETS AND NON-ETS SECTORS
Historical emissions and projections of greenhouse gas emissions in ETS and non-ETS sectors
for three scenarios are shown in Table 4-2.
Table 4-2: Historical emissions and projections of greenhouse gas emissions in ETS and non-ETS sectors, kt CO2 eq
2015 2020 2025 2030 2035
'Without measures' scenario 27,885 33,365 35,948 38,675 40,145
ETS 10,770 14,526 15,841 17,332 17,792
non-ETS 17,115 18,839 20,107 21,343 22,353
'With measures' scenario 24,614 26,271 28,034 29,687 30,888
ETS 8,523 9,819 10,759 11,612 12,085
non-ETS 16,091 16,453 17,275 18,075 18,803
'With additional measures' scenario 24,614 23,719 24,079 24,469 25,202
ETS 8,523 8,426 8,394 8,402 8,683
non-ETS 16,091 15,293 15,685 16,067 16,519
Emissions within the ETS in 2010 encompassed 36.4% of total emissions, amounting to 10,759
kt CO2 eq. Projections indicate that in 2015 the ETS will cover, depending on the scenario,
between 34.6% (scenarios 'with additional measures') and 38.6% (scenario 'without measures')
of total emissions, while in 2035, according to the 'with additional measures' scenario, 34.5% of
emissions will be included, 39.1% of emissions will be included according to the 'with measures'
scenario and 44.3% of total emissions will be included in the „without measures' scenario.
In the „without measures' scenario, compared to 2010, emission projections show an increase in
emissions of 0.1% in 2015 up to 65.4% in 2035. The reason of this increase is primarily in the
expected construction of new power plants using fossil fuels.
In the 'with measures' scenario, the continuation of downward trend in emissions is expected
until 2015 due to economic downturn as well as subsequent increase of emissions by 12,085 kt
CO2 eq in 2035, an increase of 12.3% compared to 2010. A slow growth of emissions is due to
expected increase in economic activity and new power plants.
In the 'with additional measures' scenario, projections show a steady light downward trend,
primarily due to planned actions to promote usage of renewable energy sources and energy
efficiency.
In 2010, emissions outside the ETS amounted to 18,798 kt CO2 eq, which represents 63.6% of
total emissions.
In the scenario 'without measures', projections indicate a decrease in emissions in non-ETS
sector until 2025 and an increase in emissions until 2035 (18.9% in 2035 compared to 2010).
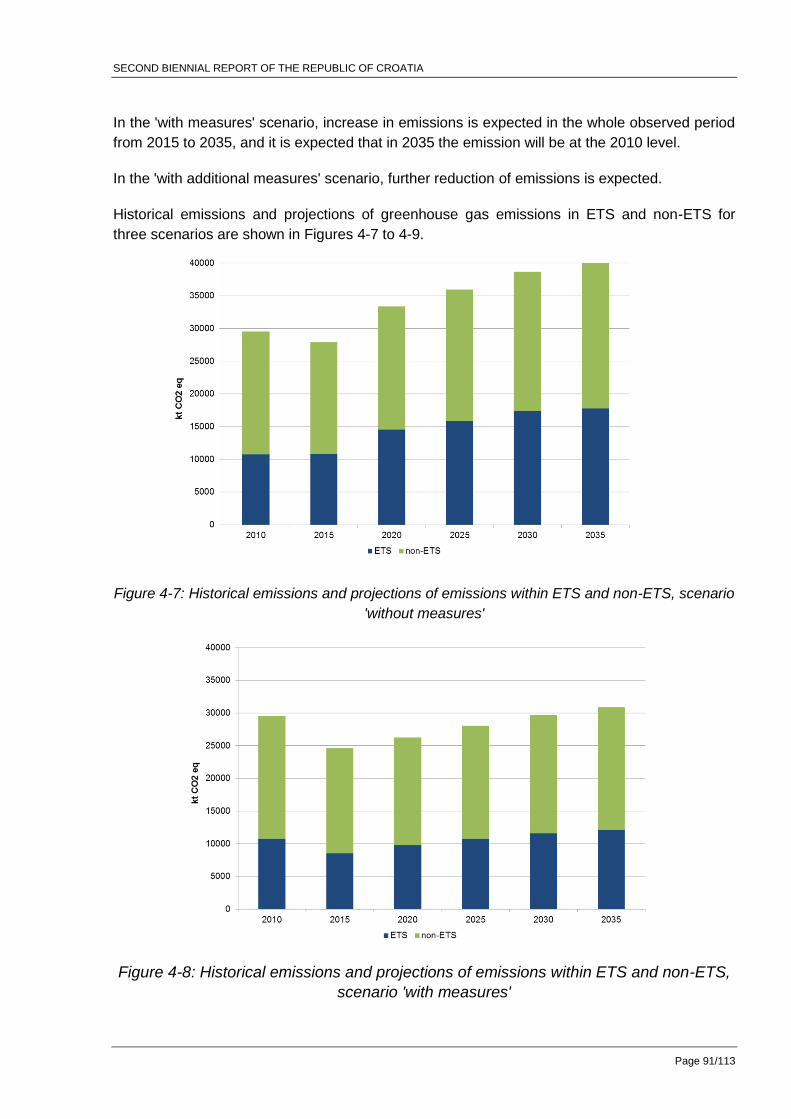
SECOND BIENNIAL REPORT OF THE REPUBLIC OF CROATIA
Page 91/113
In the 'with measures' scenario, increase in emissions is expected in the whole observed period
from 2015 to 2035, and it is expected that in 2035 the emission will be at the 2010 level.
In the 'with additional measures' scenario, further reduction of emissions is expected.
Historical emissions and projections of greenhouse gas emissions in ETS and non-ETS for
three scenarios are shown in Figures 4-7 to 4-9.
Figure 4-7: Historical emissions and projections of emissions within ETS and non-ETS, scenario
'without measures'
Figure 4-8: Historical emissions and projections of emissions within ETS and non-ETS,
scenario 'with measures'
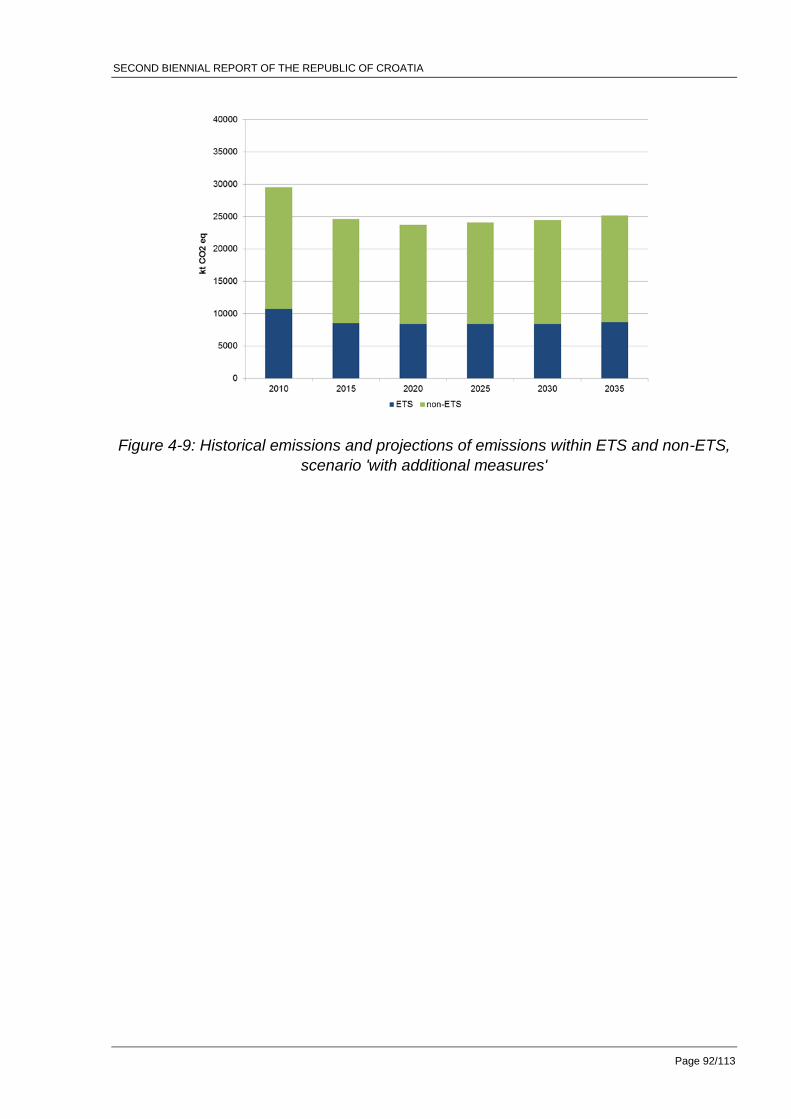
SECOND BIENNIAL REPORT OF THE REPUBLIC OF CROATIA
Page 92/113
Figure 4-9: Historical emissions and projections of emissions within ETS and non-ETS,
scenario 'with additional measures'
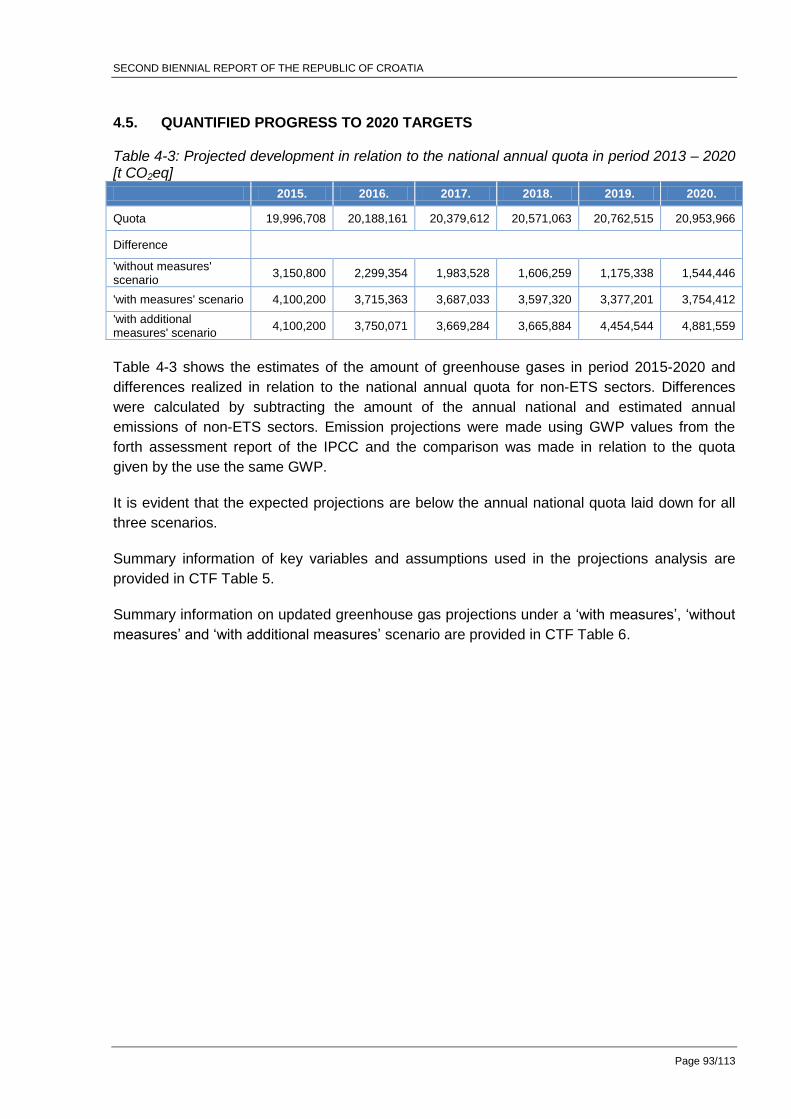
SECOND BIENNIAL REPORT OF THE REPUBLIC OF CROATIA
Page 93/113
4.5. QUANTIFIED PROGRESS TO 2020 TARGETS
Table 4-3: Projected development in relation to the national annual quota in period 2013 – 2020 [t CO2eq]
2015. 2016. 2017. 2018. 2019. 2020.
Quota 19,996,708 20,188,161 20,379,612 20,571,063 20,762,515 20,953,966
Difference
'without measures' scenario
3,150,800 2,299,354 1,983,528 1,606,259 1,175,338 1,544,446
'with measures' scenario 4,100,200 3,715,363 3,687,033 3,597,320 3,377,201 3,754,412
'with additional measures' scenario
4,100,200 3,750,071 3,669,284 3,665,884 4,454,544 4,881,559
Table 4-3 shows the estimates of the amount of greenhouse gases in period 2015-2020 and
differences realized in relation to the national annual quota for non-ETS sectors. Differences
were calculated by subtracting the amount of the annual national and estimated annual
emissions of non-ETS sectors. Emission projections were made using GWP values from the
forth assessment report of the IPCC and the comparison was made in relation to the quota
given by the use the same GWP.
It is evident that the expected projections are below the annual national quota laid down for all
three scenarios.
Summary information of key variables and assumptions used in the projections analysis are
provided in CTF Table 5.
Summary information on updated greenhouse gas projections under a „with measures‟, „without
measures‟ and „with additional measures‟ scenario are provided in CTF Table 6.
SECOND BIENNIAL REPORT OF THE REPUBLIC OF CROATIA
Page 94/113
4.6. DESCRIPTIONS OF METHODOLOGIES, MODELS, UNDERLYING ASSUMPTIONS
AND KEY INPUT AND OUTPUT PARAMETERS FOR PROJECTIONS
Projections were made in accordance with the Guidelines for preparation of national reports by
Parties included in Annex I to the Convention.
The potential for mitigation of national greenhouse gas emissions is analysed and assessed at
the sectoral level. This assessment takes into account the previous trends and the current state
as well as the future projections of parameters that determine the potential for mitigating
emissions. The model and methodology used in preparing the projections are described by
sector, in this chapter.
A list of assumptions and input data is provided in tabular form (Tables 3-1 to 3-5). The list
contains general parameters and parameters related to the sectors and sub-sectors (energy,
transport, buildings, industry, agriculture, waste management and LULUCF), in accordance with
Annex XII of Implementing Regulation.
The 'with measures' and 'with additional measures' scenarios included policies and measures
for reduction of emissions from sources and increase greenhouse gases sinks. In order to
determine the contribution of each individual policy and measure for emissions reduction, the
reduction potential was determined. In cases where the emission reduction potential of
individual policies and measures cannot be expressed separately, reports are aggregated with
other potential policies and measures.
Energy and transport
In preparing the projections, a software package LEAP (eng. Long-range Energy Alternatives
Planning System)7 was used, in which was created a model of the energy sector in Croatia.
Output data are structured in accordance with the structure of inventory of the United Nations
Framework Convention on Climate Change. It is the engineering simulation model in which are
the scenarios simulated and certain processes and decisions optimized in regard to the
assumptions and limitations. The model is detailed to the level of individual production units,
present and future.
Projections were made until 2030, with a single step every year. The model is of 'bottom-up'
type, because it starts from the sectoral data and individual emission sources in the power
sector and calculates CO2, CH4 and N2O emissions.
Assumptions and input parameters used in the preparation of projections are shown below:
7 More information available at http://www.energycommunity.org/default.asp?action=47
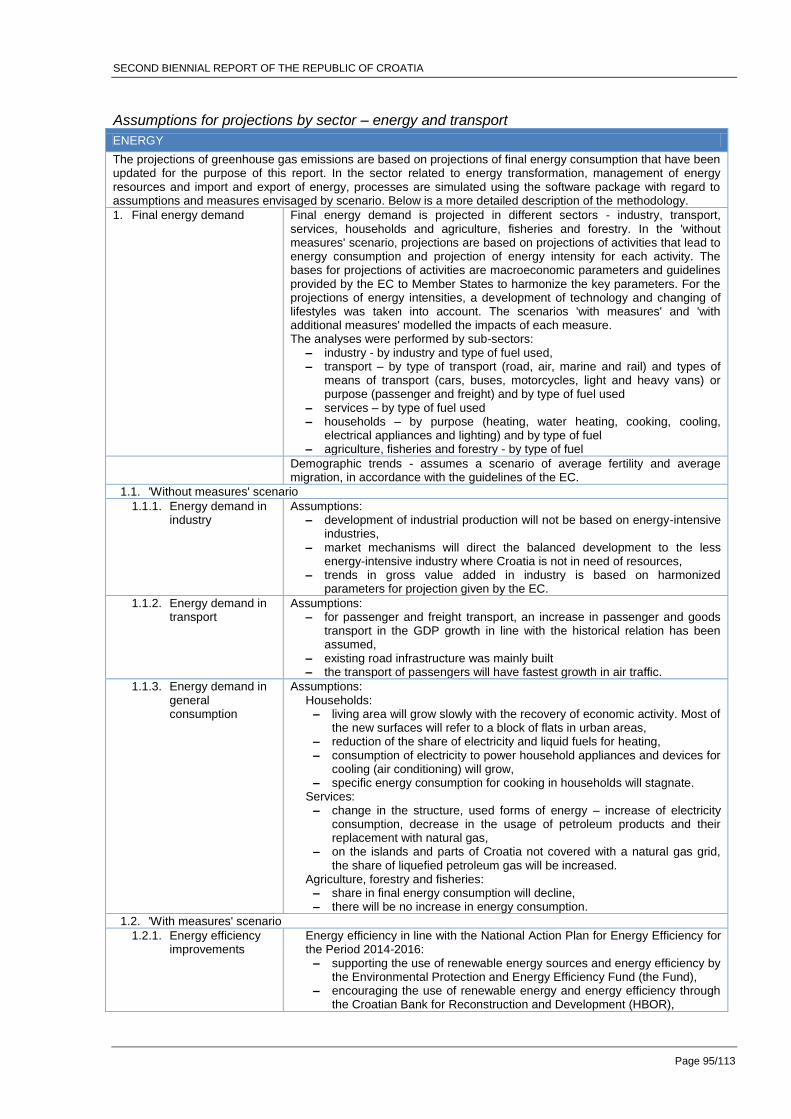
SECOND BIENNIAL REPORT OF THE REPUBLIC OF CROATIA
Page 95/113
Assumptions for projections by sector – energy and transport
ENERGY
The projections of greenhouse gas emissions are based on projections of final energy consumption that have been updated for the purpose of this report. In the sector related to energy transformation, management of energy resources and import and export of energy, processes are simulated using the software package with regard to assumptions and measures envisaged by scenario. Below is a more detailed description of the methodology.
1. Final energy demand Final energy demand is projected in different sectors - industry, transport, services, households and agriculture, fisheries and forestry. In the 'without measures' scenario, projections are based on projections of activities that lead to energy consumption and projection of energy intensity for each activity. The bases for projections of activities are macroeconomic parameters and guidelines provided by the EC to Member States to harmonize the key parameters. For the projections of energy intensities, a development of technology and changing of lifestyles was taken into account. The scenarios 'with measures' and 'with additional measures' modelled the impacts of each measure. The analyses were performed by sub-sectors:
– industry - by industry and type of fuel used, – transport – by type of transport (road, air, marine and rail) and types of
means of transport (cars, buses, motorcycles, light and heavy vans) or purpose (passenger and freight) and by type of fuel used
– services – by type of fuel used – households – by purpose (heating, water heating, cooking, cooling,
electrical appliances and lighting) and by type of fuel – agriculture, fisheries and forestry - by type of fuel
Demographic trends - assumes a scenario of average fertility and average migration, in accordance with the guidelines of the EC.
1.1. 'Without measures' scenario
1.1.1. Energy demand in industry
Assumptions: – development of industrial production will not be based on energy-intensive
industries, – market mechanisms will direct the balanced development to the less
energy-intensive industry where Croatia is not in need of resources, – trends in gross value added in industry is based on harmonized
parameters for projection given by the EC.
1.1.2. Energy demand in transport
Assumptions: – for passenger and freight transport, an increase in passenger and goods
transport in the GDP growth in line with the historical relation has been assumed,
– existing road infrastructure was mainly built – the transport of passengers will have fastest growth in air traffic.
1.1.3. Energy demand in general consumption
Assumptions: Households: – living area will grow slowly with the recovery of economic activity. Most of
the new surfaces will refer to a block of flats in urban areas, – reduction of the share of electricity and liquid fuels for heating, – consumption of electricity to power household appliances and devices for
cooling (air conditioning) will grow, – specific energy consumption for cooking in households will stagnate.
Services: – change in the structure, used forms of energy – increase of electricity
consumption, decrease in the usage of petroleum products and their replacement with natural gas,
– on the islands and parts of Croatia not covered with a natural gas grid, the share of liquefied petroleum gas will be increased.
Agriculture, forestry and fisheries: – share in final energy consumption will decline, – there will be no increase in energy consumption.
1.2. 'With measures' scenario
1.2.1. Energy efficiency improvements
Energy efficiency in line with the National Action Plan for Energy Efficiency for the Period 2014-2016: – supporting the use of renewable energy sources and energy efficiency by
the Environmental Protection and Energy Efficiency Fund (the Fund), – encouraging the use of renewable energy and energy efficiency through
the Croatian Bank for Reconstruction and Development (HBOR),
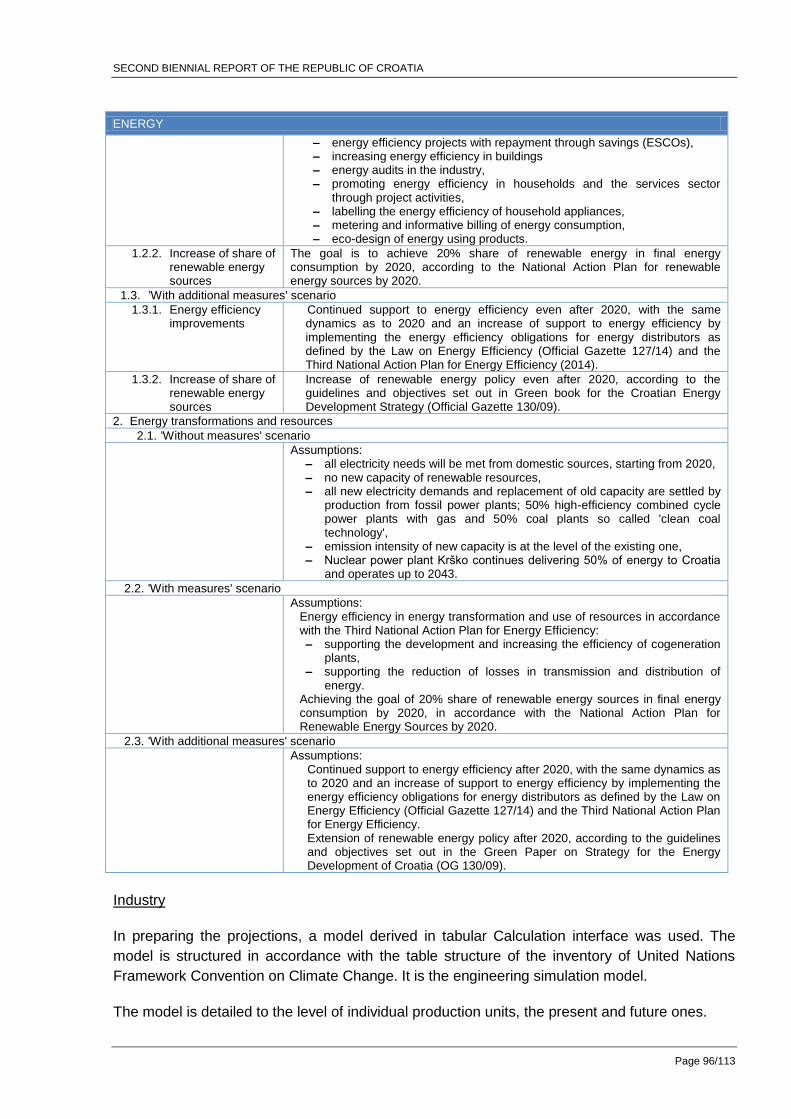
SECOND BIENNIAL REPORT OF THE REPUBLIC OF CROATIA
Page 96/113
ENERGY
– energy efficiency projects with repayment through savings (ESCOs), – increasing energy efficiency in buildings – energy audits in the industry, – promoting energy efficiency in households and the services sector
through project activities, – labelling the energy efficiency of household appliances, – metering and informative billing of energy consumption, – eco-design of energy using products.
1.2.2. Increase of share of renewable energy sources
The goal is to achieve 20% share of renewable energy in final energy consumption by 2020, according to the National Action Plan for renewable energy sources by 2020.
1.3. 'With additional measures' scenario
1.3.1. Energy efficiency improvements
Continued support to energy efficiency even after 2020, with the same dynamics as to 2020 and an increase of support to energy efficiency by implementing the energy efficiency obligations for energy distributors as defined by the Law on Energy Efficiency (Official Gazette 127/14) and the Third National Action Plan for Energy Efficiency (2014).
1.3.2. Increase of share of renewable energy sources
Increase of renewable energy policy even after 2020, according to the guidelines and objectives set out in Green book for the Croatian Energy Development Strategy (Official Gazette 130/09).
2. Energy transformations and resources
2.1. 'Without measures' scenario
Assumptions: – all electricity needs will be met from domestic sources, starting from 2020, – no new capacity of renewable resources, – all new electricity demands and replacement of old capacity are settled by
production from fossil power plants; 50% high-efficiency combined cycle power plants with gas and 50% coal plants so called 'clean coal technology',
– emission intensity of new capacity is at the level of the existing one, – Nuclear power plant Krško continues delivering 50% of energy to Croatia
and operates up to 2043.
2.2. 'With measures' scenario
Assumptions: Energy efficiency in energy transformation and use of resources in accordance with the Third National Action Plan for Energy Efficiency: – supporting the development and increasing the efficiency of cogeneration
plants, – supporting the reduction of losses in transmission and distribution of
energy. Achieving the goal of 20% share of renewable energy sources in final energy consumption by 2020, in accordance with the National Action Plan for Renewable Energy Sources by 2020.
2.3. 'With additional measures' scenario
Assumptions: Continued support to energy efficiency after 2020, with the same dynamics as to 2020 and an increase of support to energy efficiency by implementing the energy efficiency obligations for energy distributors as defined by the Law on Energy Efficiency (Official Gazette 127/14) and the Third National Action Plan for Energy Efficiency. Extension of renewable energy policy after 2020, according to the guidelines and objectives set out in the Green Paper on Strategy for the Energy Development of Croatia (OG 130/09).
Industry
In preparing the projections, a model derived in tabular Calculation interface was used. The
model is structured in accordance with the table structure of the inventory of United Nations
Framework Convention on Climate Change. It is the engineering simulation model.
The model is detailed to the level of individual production units, the present and future ones.

SECOND BIENNIAL REPORT OF THE REPUBLIC OF CROATIA
Page 97/113
Projections are made by 2020, indicative until 2030, in steps of five years. The model is of
'bottom-up' type, because it starts from the sectoral data and individual emission sources and
calculates CO2, CH4, N2O, HFCs, PFCs and SF6 emissions.
Assumptions and input parameters used in the preparation of projections are presented below:
Assumptions for projections by sector – industry
INDUSTRY
The projections were carried out based on the expected development of certain industries, which includes the production goals by 2035.
Emission projections start from the situation and projections of macroeconomic parameters in 2012 (annual growth rate of gross domestic product and gross value added and decrease in population) and the results of sector analysis and studies (cement and nitric acid production).
Assumptions for 'without measures' scenario:
– no installation of additional capacity,
– production will reach the maximum value by 2035.
The Industrial Strategy of the Republic of Croatia 2014 – 2020 defines objectives of industrial development and key indicators of the Croatian industry in the period 2014 – 2020. According to the “real scenario”, in 2020, the achievement of level of the volume of industrial production in 2008 is assumed, when the highest level of development of the Croatian economy is reached.
Assumptions for 'with measures' scenario:
– the application of cost-effective measures in the cement and nitric acid production,
– reduction of volatile organic compounds emission in solvent use sector.
According to good practice, the projections were made for activity data and emission factors:
– activity data – applying grade of 1, 2 and 3 methods (projections of macroeconomic parameters, effects of policies and measures, sectoral analysis and studies),
– emission factors – applying grade of 1 and 2 methods (projections based on average values for the previous five-year period, effects of policies and measures, sectoral analysis and studies).
Agriculture
In preparing the projections, a model derived in tabular Calculation interface was used. The
model is structured in accordance with the table structure of the inventory of United Nations
Framework Convention on Climate Change. It is the engineering simulation model.
The model is detailed to the level of individual sources, the present and future ones.
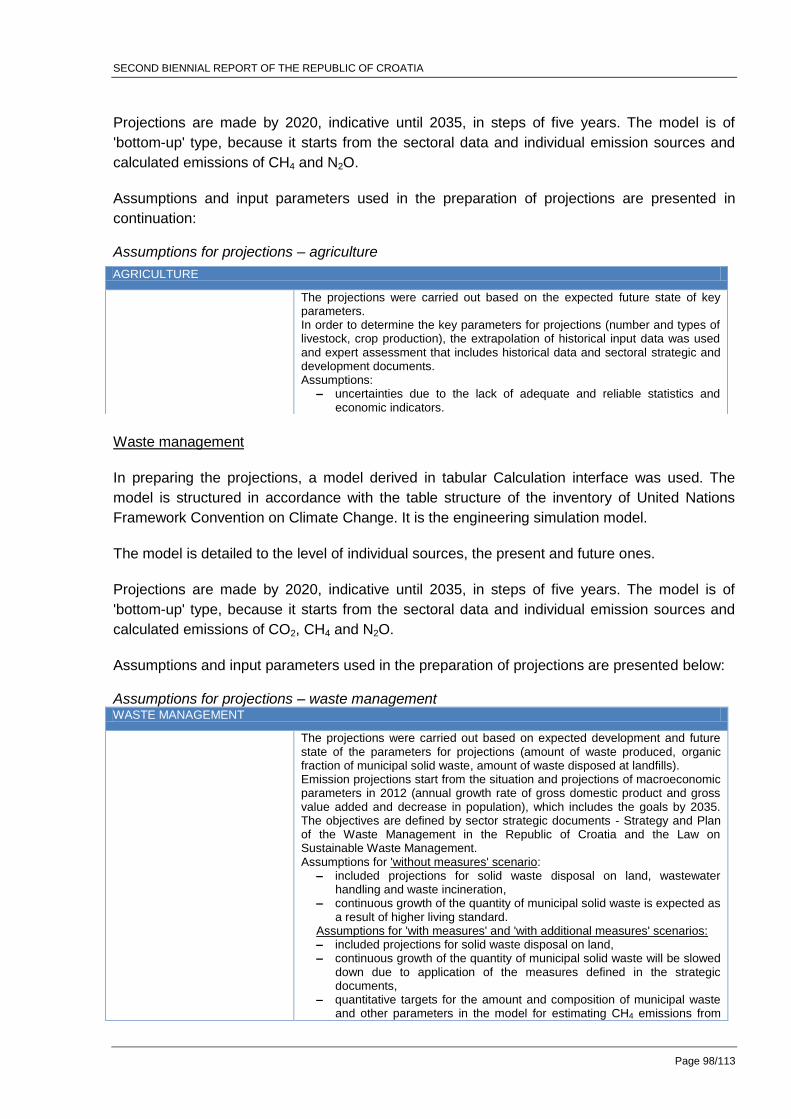
SECOND BIENNIAL REPORT OF THE REPUBLIC OF CROATIA
Page 98/113
Projections are made by 2020, indicative until 2035, in steps of five years. The model is of
'bottom-up' type, because it starts from the sectoral data and individual emission sources and
calculated emissions of CH4 and N2O.
Assumptions and input parameters used in the preparation of projections are presented in
continuation:
Assumptions for projections – agriculture
Waste management
In preparing the projections, a model derived in tabular Calculation interface was used. The
model is structured in accordance with the table structure of the inventory of United Nations
Framework Convention on Climate Change. It is the engineering simulation model.
The model is detailed to the level of individual sources, the present and future ones.
Projections are made by 2020, indicative until 2035, in steps of five years. The model is of
'bottom-up' type, because it starts from the sectoral data and individual emission sources and
calculated emissions of CO2, CH4 and N2O.
Assumptions and input parameters used in the preparation of projections are presented below:
Assumptions for projections – waste management WASTE MANAGEMENT
The projections were carried out based on expected development and future state of the parameters for projections (amount of waste produced, organic fraction of municipal solid waste, amount of waste disposed at landfills). Emission projections start from the situation and projections of macroeconomic parameters in 2012 (annual growth rate of gross domestic product and gross value added and decrease in population), which includes the goals by 2035. The objectives are defined by sector strategic documents - Strategy and Plan of the Waste Management in the Republic of Croatia and the Law on Sustainable Waste Management. Assumptions for 'without measures' scenario:
– included projections for solid waste disposal on land, wastewater handling and waste incineration,
– continuous growth of the quantity of municipal solid waste is expected as a result of higher living standard.
Assumptions for 'with measures' and 'with additional measures' scenarios: – included projections for solid waste disposal on land, – continuous growth of the quantity of municipal solid waste will be slowed
down due to application of the measures defined in the strategic documents,
– quantitative targets for the amount and composition of municipal waste and other parameters in the model for estimating CH4 emissions from
AGRICULTURE
The projections were carried out based on the expected future state of key parameters. In order to determine the key parameters for projections (number and types of livestock, crop production), the extrapolation of historical input data was used and expert assessment that includes historical data and sectoral strategic and development documents. Assumptions:
– uncertainties due to the lack of adequate and reliable statistics and economic indicators.
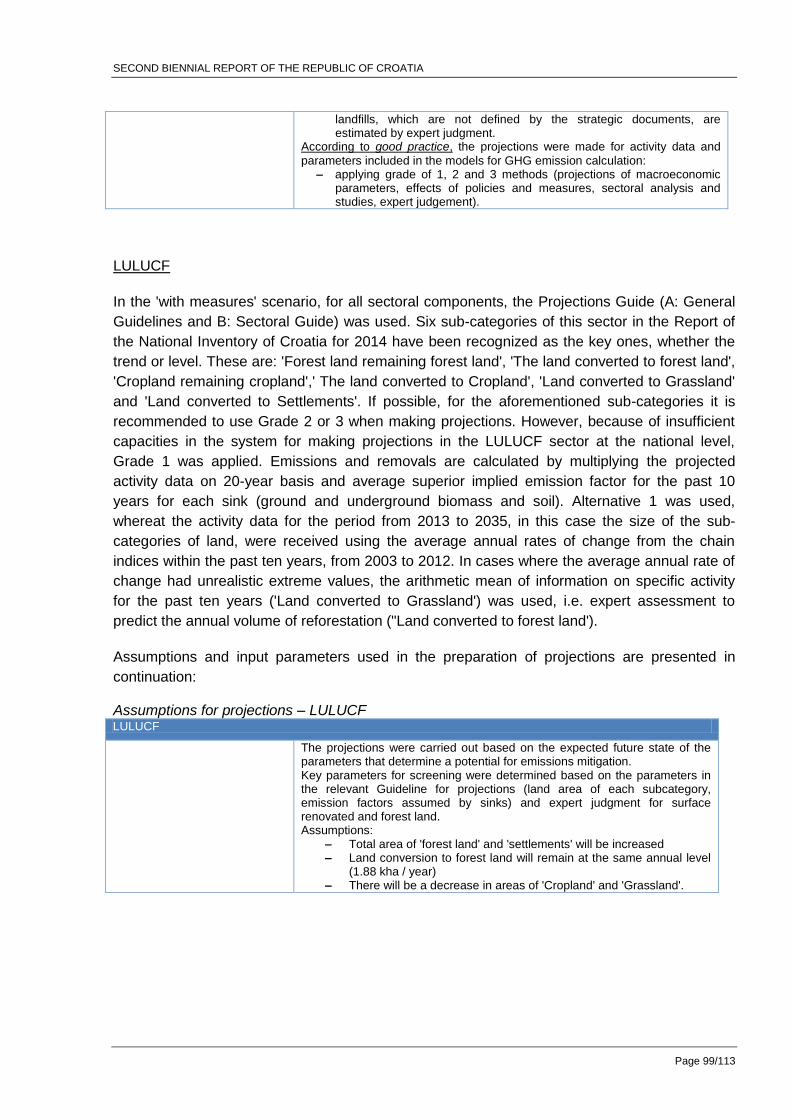
SECOND BIENNIAL REPORT OF THE REPUBLIC OF CROATIA
Page 99/113
landfills, which are not defined by the strategic documents, are estimated by expert judgment.
According to good practice, the projections were made for activity data and
parameters included in the models for GHG emission calculation: – applying grade of 1, 2 and 3 methods (projections of macroeconomic
parameters, effects of policies and measures, sectoral analysis and studies, expert judgement).
LULUCF
In the 'with measures' scenario, for all sectoral components, the Projections Guide (A: General
Guidelines and B: Sectoral Guide) was used. Six sub-categories of this sector in the Report of
the National Inventory of Croatia for 2014 have been recognized as the key ones, whether the
trend or level. These are: 'Forest land remaining forest land', 'The land converted to forest land',
'Cropland remaining cropland',' The land converted to Cropland', 'Land converted to Grassland'
and 'Land converted to Settlements'. If possible, for the aforementioned sub-categories it is
recommended to use Grade 2 or 3 when making projections. However, because of insufficient
capacities in the system for making projections in the LULUCF sector at the national level,
Grade 1 was applied. Emissions and removals are calculated by multiplying the projected
activity data on 20-year basis and average superior implied emission factor for the past 10
years for each sink (ground and underground biomass and soil). Alternative 1 was used,
whereat the activity data for the period from 2013 to 2035, in this case the size of the sub-
categories of land, were received using the average annual rates of change from the chain
indices within the past ten years, from 2003 to 2012. In cases where the average annual rate of
change had unrealistic extreme values, the arithmetic mean of information on specific activity
for the past ten years ('Land converted to Grassland') was used, i.e. expert assessment to
predict the annual volume of reforestation ("Land converted to forest land').
Assumptions and input parameters used in the preparation of projections are presented in
continuation:
Assumptions for projections – LULUCF LULUCF
The projections were carried out based on the expected future state of the parameters that determine a potential for emissions mitigation. Key parameters for screening were determined based on the parameters in the relevant Guideline for projections (land area of each subcategory, emission factors assumed by sinks) and expert judgment for surface renovated and forest land. Assumptions:
– Total area of 'forest land' and 'settlements' will be increased – Land conversion to forest land will remain at the same annual level
(1.88 kha / year) – There will be a decrease in areas of 'Cropland' and 'Grassland'.
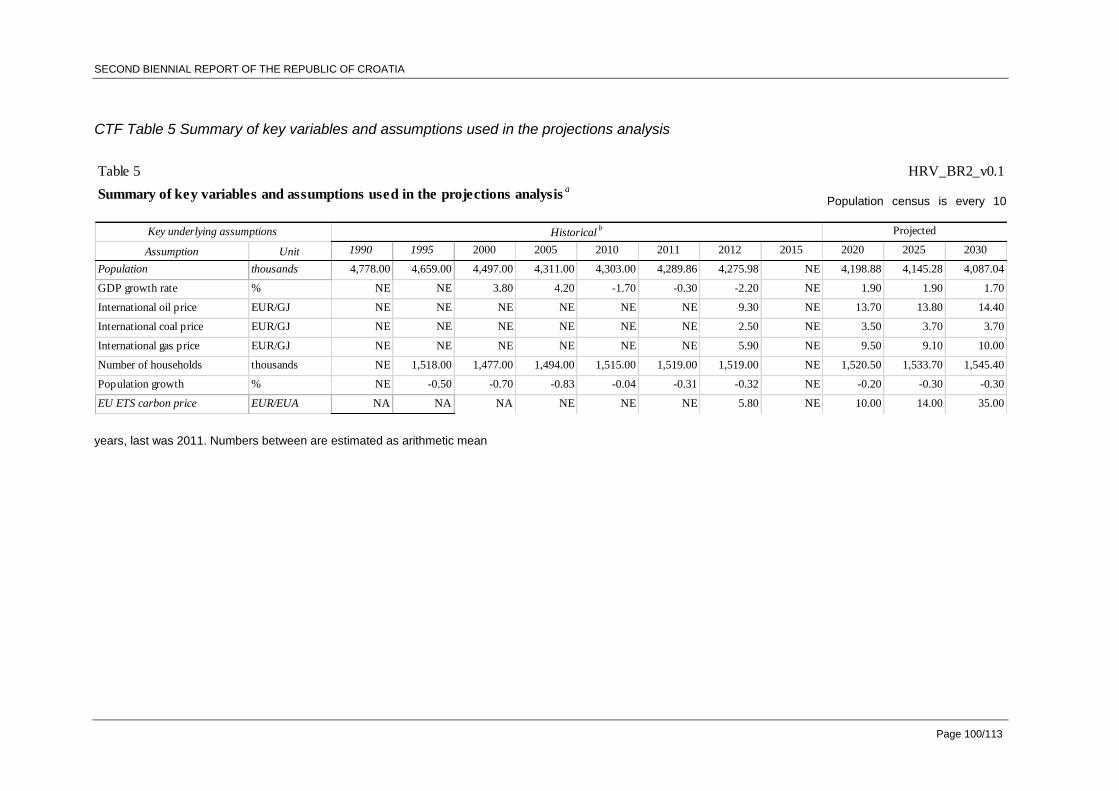
SECOND BIENNIAL REPORT OF THE REPUBLIC OF CROATIA
Page 100/113
CTF Table 5 Summary of key variables and assumptions used in the projections analysis
Population census is every 10
years, last was 2011. Numbers between are estimated as arithmetic mean
Table 5 HRV_BR2_v0.1
Summary of key variables and assumptions used in the projections analysisa
Assumption Unit 1990 1995 2000 2005 2010 2011 2012 2015 2020 2025 2030
Population thousands 4,778.00 4,659.00 4,497.00 4,311.00 4,303.00 4,289.86 4,275.98 NE 4,198.88 4,145.28 4,087.04
GDP growth rate % NE NE 3.80 4.20 -1.70 -0.30 -2.20 NE 1.90 1.90 1.70
International oil price EUR/GJ NE NE NE NE NE NE 9.30 NE 13.70 13.80 14.40
International coal price EUR/GJ NE NE NE NE NE NE 2.50 NE 3.50 3.70 3.70
International gas price EUR/GJ NE NE NE NE NE NE 5.90 NE 9.50 9.10 10.00
Number of households thousands NE 1,518.00 1,477.00 1,494.00 1,515.00 1,519.00 1,519.00 NE 1,520.50 1,533.70 1,545.40
Population growth % NE -0.50 -0.70 -0.83 -0.04 -0.31 -0.32 NE -0.20 -0.30 -0.30
EU ETS carbon price EUR/EUA NA NA NA NE NE NE 5.80 NE 10.00 14.00 35.00
Key underlying assumptions Historicalb Projected
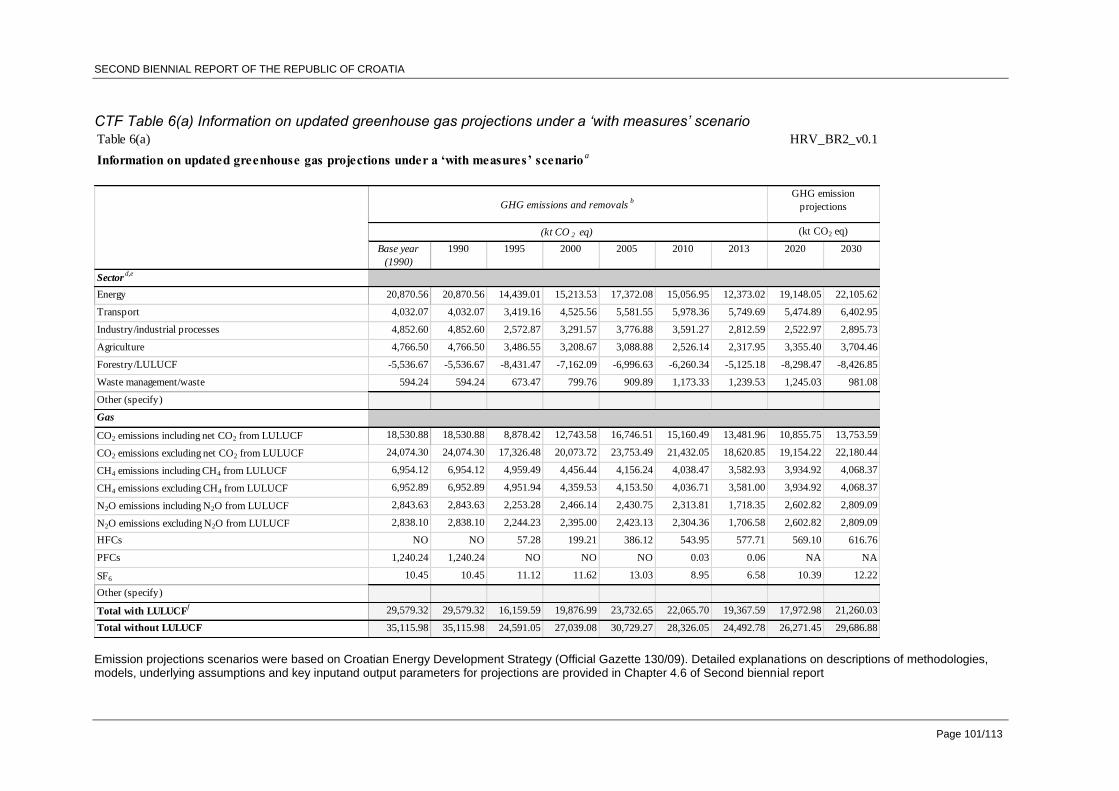
SECOND BIENNIAL REPORT OF THE REPUBLIC OF CROATIA
Page 101/113
CTF Table 6(a) Information on updated greenhouse gas projections under a ‘with measures’ scenario
Emission projections scenarios were based on Croatian Energy Development Strategy (Official Gazette 130/09). Detailed explanations on descriptions of methodologies, models, underlying assumptions and key inputand output parameters for projections are provided in Chapter 4.6 of Second biennial report
Table 6(a) HRV_BR2_v0.1
Information on updated greenhouse gas projections under a ‘with measures’ scenarioa
Base year
(1990)
1990 1995 2000 2005 2010 2013 2020 2030
Sectord,e
Energy 20,870.56 20,870.56 14,439.01 15,213.53 17,372.08 15,056.95 12,373.02 19,148.05 22,105.62
Transport 4,032.07 4,032.07 3,419.16 4,525.56 5,581.55 5,978.36 5,749.69 5,474.89 6,402.95
Industry/industrial processes 4,852.60 4,852.60 2,572.87 3,291.57 3,776.88 3,591.27 2,812.59 2,522.97 2,895.73
Agriculture 4,766.50 4,766.50 3,486.55 3,208.67 3,088.88 2,526.14 2,317.95 3,355.40 3,704.46
Forestry/LULUCF -5,536.67 -5,536.67 -8,431.47 -7,162.09 -6,996.63 -6,260.34 -5,125.18 -8,298.47 -8,426.85
Waste management/waste 594.24 594.24 673.47 799.76 909.89 1,173.33 1,239.53 1,245.03 981.08
Other (specify)
Gas
CO2 emissions including net CO2 from LULUCF 18,530.88 18,530.88 8,878.42 12,743.58 16,746.51 15,160.49 13,481.96 10,855.75 13,753.59
CO2 emissions excluding net CO2 from LULUCF 24,074.30 24,074.30 17,326.48 20,073.72 23,753.49 21,432.05 18,620.85 19,154.22 22,180.44
CH4 emissions including CH4 from LULUCF 6,954.12 6,954.12 4,959.49 4,456.44 4,156.24 4,038.47 3,582.93 3,934.92 4,068.37
CH4 emissions excluding CH4 from LULUCF 6,952.89 6,952.89 4,951.94 4,359.53 4,153.50 4,036.71 3,581.00 3,934.92 4,068.37
N2O emissions including N2O from LULUCF 2,843.63 2,843.63 2,253.28 2,466.14 2,430.75 2,313.81 1,718.35 2,602.82 2,809.09
N2O emissions excluding N2O from LULUCF 2,838.10 2,838.10 2,244.23 2,395.00 2,423.13 2,304.36 1,706.58 2,602.82 2,809.09
HFCs NO NO 57.28 199.21 386.12 543.95 577.71 569.10 616.76
PFCs 1,240.24 1,240.24 NO NO NO 0.03 0.06 NA NA
SF6 10.45 10.45 11.12 11.62 13.03 8.95 6.58 10.39 12.22
Other (specify)
Total with LULUCFf 29,579.32 29,579.32 16,159.59 19,876.99 23,732.65 22,065.70 19,367.59 17,972.98 21,260.03
Total without LULUCF 35,115.98 35,115.98 24,591.05 27,039.08 30,729.27 28,326.05 24,492.78 26,271.45 29,686.88
(kt CO2 eq)
GHG emission
projections
(kt CO 2 eq)
GHG emissions and removalsb
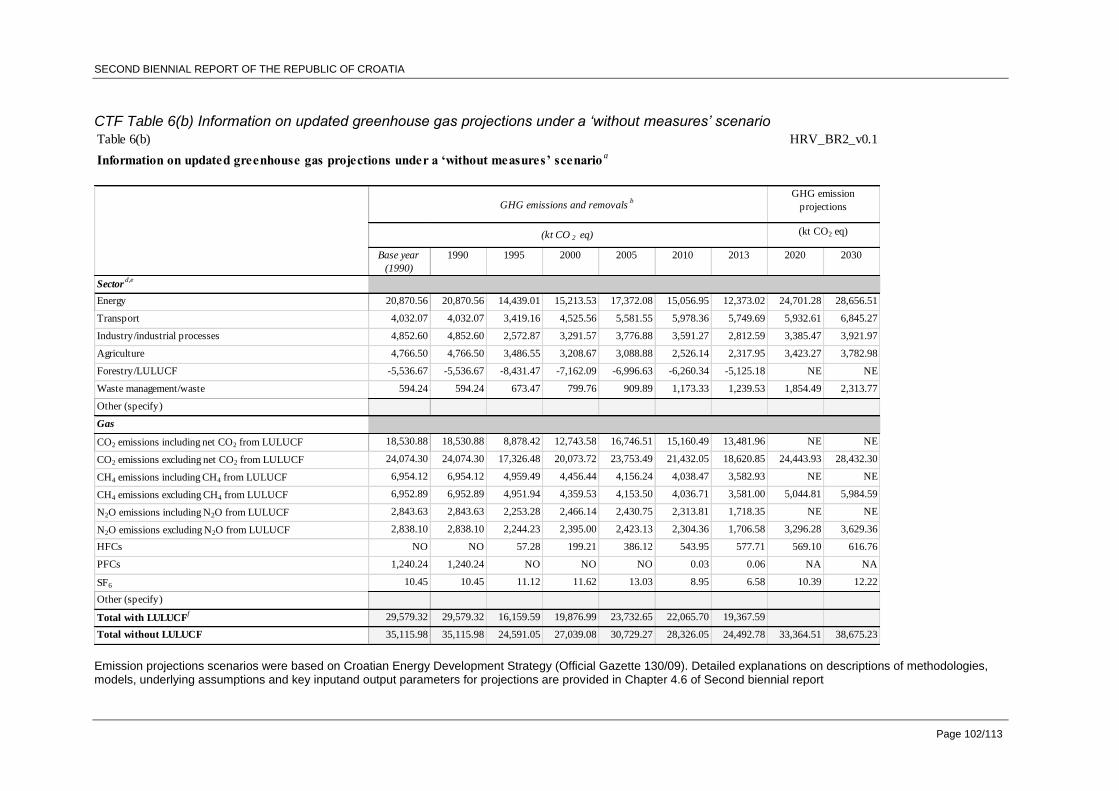
SECOND BIENNIAL REPORT OF THE REPUBLIC OF CROATIA
Page 102/113
CTF Table 6(b) Information on updated greenhouse gas projections under a ‘without measures’ scenario
Emission projections scenarios were based on Croatian Energy Development Strategy (Official Gazette 130/09). Detailed explanations on descriptions of methodologies, models, underlying assumptions and key inputand output parameters for projections are provided in Chapter 4.6 of Second biennial report
Table 6(b) HRV_BR2_v0.1
Information on updated greenhouse gas projections under a ‘without measures’ scenarioa
Base year
(1990)
1990 1995 2000 2005 2010 2013 2020 2030
Sectord,e
Energy 20,870.56 20,870.56 14,439.01 15,213.53 17,372.08 15,056.95 12,373.02 24,701.28 28,656.51
Transport 4,032.07 4,032.07 3,419.16 4,525.56 5,581.55 5,978.36 5,749.69 5,932.61 6,845.27
Industry/industrial processes 4,852.60 4,852.60 2,572.87 3,291.57 3,776.88 3,591.27 2,812.59 3,385.47 3,921.97
Agriculture 4,766.50 4,766.50 3,486.55 3,208.67 3,088.88 2,526.14 2,317.95 3,423.27 3,782.98
Forestry/LULUCF -5,536.67 -5,536.67 -8,431.47 -7,162.09 -6,996.63 -6,260.34 -5,125.18 NE NE
Waste management/waste 594.24 594.24 673.47 799.76 909.89 1,173.33 1,239.53 1,854.49 2,313.77
Other (specify)
Gas
CO2 emissions including net CO2 from LULUCF 18,530.88 18,530.88 8,878.42 12,743.58 16,746.51 15,160.49 13,481.96 NE NE
CO2 emissions excluding net CO2 from LULUCF 24,074.30 24,074.30 17,326.48 20,073.72 23,753.49 21,432.05 18,620.85 24,443.93 28,432.30
CH4 emissions including CH4 from LULUCF 6,954.12 6,954.12 4,959.49 4,456.44 4,156.24 4,038.47 3,582.93 NE NE
CH4 emissions excluding CH4 from LULUCF 6,952.89 6,952.89 4,951.94 4,359.53 4,153.50 4,036.71 3,581.00 5,044.81 5,984.59
N2O emissions including N2O from LULUCF 2,843.63 2,843.63 2,253.28 2,466.14 2,430.75 2,313.81 1,718.35 NE NE
N2O emissions excluding N2O from LULUCF 2,838.10 2,838.10 2,244.23 2,395.00 2,423.13 2,304.36 1,706.58 3,296.28 3,629.36
HFCs NO NO 57.28 199.21 386.12 543.95 577.71 569.10 616.76
PFCs 1,240.24 1,240.24 NO NO NO 0.03 0.06 NA NA
SF6 10.45 10.45 11.12 11.62 13.03 8.95 6.58 10.39 12.22
Other (specify)
Total with LULUCFf 29,579.32 29,579.32 16,159.59 19,876.99 23,732.65 22,065.70 19,367.59
Total without LULUCF 35,115.98 35,115.98 24,591.05 27,039.08 30,729.27 28,326.05 24,492.78 33,364.51 38,675.23
(kt CO 2 eq)
GHG emissions and removalsb
(kt CO2 eq)
GHG emission
projections

SECOND BIENNIAL REPORT OF THE REPUBLIC OF CROATIA
Page 103/113
CTF Table 6(c) Information on updated greenhouse gas projections under a ‘with additional measures’ scenario
Emission projections scenarios were based on Croatian Energy Development Strategy (Official Gazette 130/09). Detailed explanations on descriptions of methodologies, models, underlying assumptions and key inputand output parameters for projections are provided in Chapter 4.6 of Second biennial report
Table 6(c) HRV_BR2_v0.1
Information on updated greenhouse gas projections under a ‘with additional measures’ scenarioa
Base year
(1990)
1990 1995 2000 2005 2010 2013 2020 2030
Sectord,e
Energy 20,870.56 20,870.56 14,439.01 15,213.53 17,372.08 15,056.95 12,373.02 16,595.10 16,887.84
Transport 4,032.07 4,032.07 3,419.16 4,525.56 5,581.55 5,978.36 5,749.69 5,145.48 5,878.82
Industry/industrial processes 4,852.60 4,852.60 2,572.87 3,291.57 3,776.88 3,591.27 2,812.59 2,522.97 2,895.73
Agriculture 4,766.50 4,766.50 3,486.55 3,208.67 3,088.88 2,526.14 2,317.95 3,355.40 3,704.46
Forestry/LULUCF -5,536.67 -5,536.67 -8,431.47 -7,162.09 -6,996.63 -6,260.34 -5,125.18 NE NE
Waste management/waste 594.24 594.24 673.47 799.76 909.89 1,173.33 1,239.53 1,245.03 981.08
Other (specify)
Gas
CO2 emissions including net CO2 from LULUCF 18,530.88 18,530.88 8,878.42 12,743.58 16,746.51 15,160.49 13,481.96 NE NE
CO2 emissions excluding net CO2 from LULUCF 24,074.30 24,074.30 17,326.48 20,073.72 23,753.49 21,432.05 18,620.85 16,824.30 17,397.43
CH4 emissions including CH4 from LULUCF 6,954.12 6,954.12 4,959.49 4,456.44 4,156.24 4,038.47 3,582.93 NE NE
CH4 emissions excluding CH4 from LULUCF 6,952.89 6,952.89 4,951.94 4,359.53 4,153.50 4,036.71 3,581.00 3,726.53 3,648.00
N2O emissions including N2O from LULUCF 2,843.63 2,843.63 2,253.28 2,466.14 2,430.75 2,313.81 1,718.35 NE NE
N2O emissions excluding N2O from LULUCF 2,838.10 2,838.10 2,244.23 2,395.00 2,423.13 2,304.36 1,706.58 2,588.18 2,794.69
HFCs NO NO 57.28 199.21 386.12 543.95 577.71 569.10 616.76
PFCs 1,240.24 1,240.24 NO NO NO 0.03 0.06 NA NA
SF6 10.45 10.45 11.12 11.62 13.03 8.95 6.58 10.39 12.22
Other (specify)
Total with LULUCFf 29,579.32 29,579.32 16,159.59 19,876.99 23,732.65 22,065.70 19,367.59
Total without LULUCF 35,115.98 35,115.98 24,591.05 27,039.08 30,729.27 28,326.05 24,492.78 23,718.50 24,469.10
(kt CO 2 eq)
GHG emissions and removalsb
(kt CO2 eq)
GHG emission
projections
SECOND BIENNIAL REPORT OF THE REPUBLIC OF CROATIA
Page 104/113
5. PROVISION OF FINANCIAL, TECHNOLOGICAL AND CAPACITY BUILDING
SUPPORT TO DEVELOPING COUNTRIES
The Republic of Croatia became a Party to the Convention on 17 January 1996 when the
Croatian Parliament passed the law on its ratification (OG, International Treaties 2/96). For the
Republic of Croatia, the Convention came into force on 7 July 1996. As a country undergoing
the process of transition to market economy, Croatia has, pursuant to Article 22, paragraph 3 of
the Convention, assumed the commitments of countries included in Annex I. By the amendment
that came into force on 13 August 1998 Croatia was listed among Parties included in Annex I to
the Convention. Therefore, Croatia is not required to provide financial or any other assistance to
developing countries, because Croatia is one of them. This section applies to developed
countries, countries included in Annex II of the Convention.
The current impact of application of the Kyoto Protocol is still inestimable since in Croatia this
mechanism has not yet been used. Domestic measures were the only measures applied to
reduce emissions and increase sinks of greenhouse gases. The Regulation on Implementation
of the Flexible Mechanisms (OG 142/08) from 2008 remains in force, which is the standard way
of flexible mechanisms. From 2013, the system of emissions trading (EU ETS) the plants in
Croatia were included, which means that the application of the emissions trading mechanism at
the level of industrial plants has started. Croatia made no plans for the implementation of project
mechanisms, i.e. for investment in clean development mechanism and joint implementation by
which Croatia would acquire units of CERs and ERUs.
At the annual level, Croatia pays a fee for membership to the UNFCCC. In 2013 support to
Montenegrin institutions in strengthening administrative capacity in the EU accession process in
the field of climate change was given. Data for 2013 and 2014 are provided in CTF tables 7,
7(a) and 7(b).
CTF Table 8 and Table 9 remain blank because Republic of Croatia has not contributed to any
program specifically aimed at capacity building or technology transfer in developing countries.

SECOND BIENNIAL REPORT OF THE REPUBLIC OF CROATIA
Page 105/113
CTF Table 7: Provision of public financial support: summary information in 2013
Table 7 HRV_BR2_v0.1
Provision of public financial support: summary information in 2013a
Mitigation AdaptationCross-
cuttinge Other
f Mitigation AdaptationCross-
cuttinge Other
f
Total contributions through multilateral channels: 30,260.00 NO NO, NE NO
Multilateral climate change fundsg NO NO NO NO
Other multilateral climate change fundsh
Multilateral financial institutions, including regional
development banks
NO NO NO NO
Specialized United Nations bodies 30,260.00 NE
Total contributions through bilateral, regional and
other channels
NO 1,796.59 NO NE
Total 30,260.00 1,796.59 NO NO, NE NE NO
European euro - EUR
Climate-specificd
USDb
Allocation channels
Year
Climate-specificd
Core/
generalc
Core/
generalc
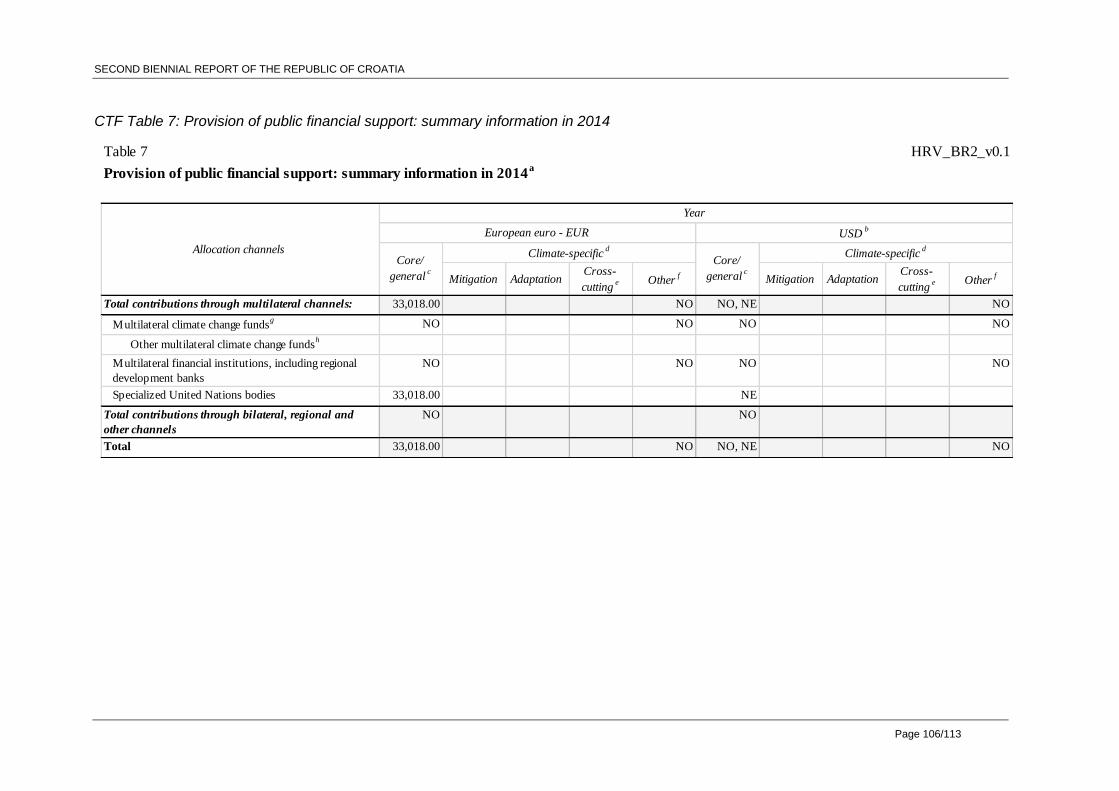
SECOND BIENNIAL REPORT OF THE REPUBLIC OF CROATIA
Page 106/113
Table 7 HRV_BR2_v0.1
Provision of public financial support: summary information in 2014a
Mitigation AdaptationCross-
cuttinge Other
f Mitigation AdaptationCross-
cuttinge Other
f
Total contributions through multilateral channels: 33,018.00 NO NO, NE NO
Multilateral climate change fundsg NO NO NO NO
Other multilateral climate change fundsh
Multilateral financial institutions, including regional
development banks
NO NO NO NO
Specialized United Nations bodies 33,018.00 NE
Total contributions through bilateral, regional and
other channels
NO NO
Total 33,018.00 NO NO, NE NO
Year
European euro - EUR USDb
Core/
generalc
Climate-specificd
Core/
generalc
Climate-specificdAllocation channels
CTF Table 7: Provision of public financial support: summary information in 2014
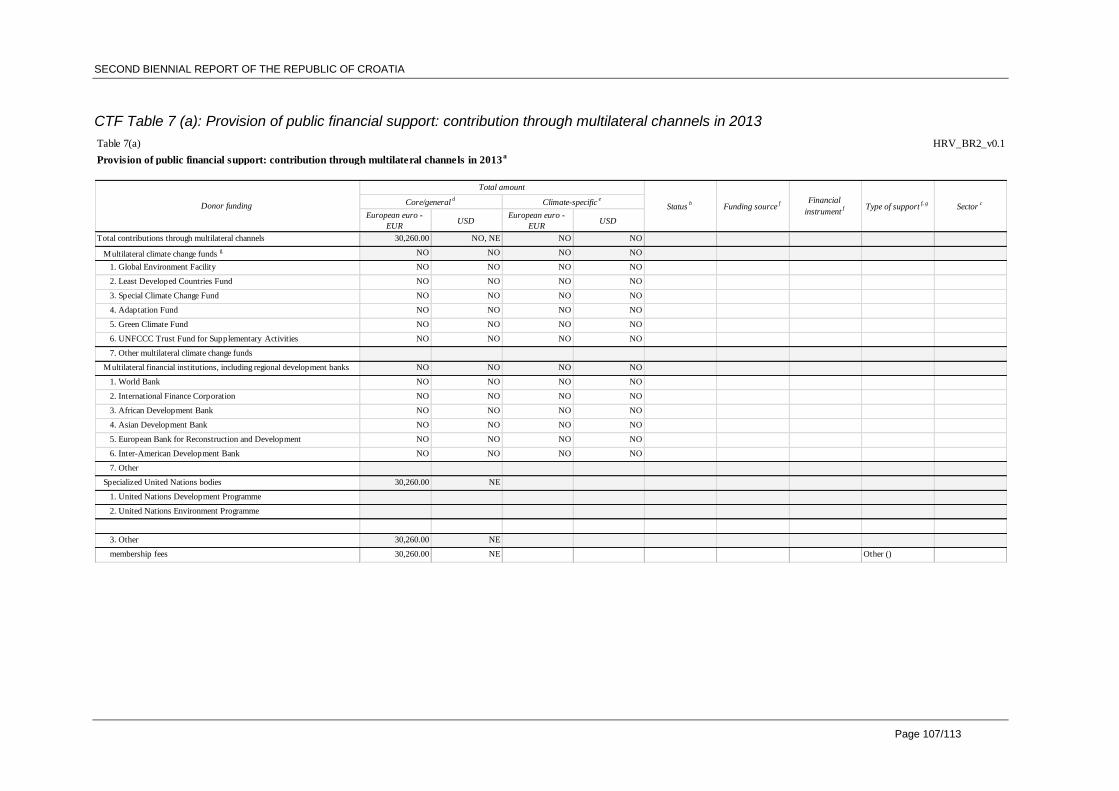
SECOND BIENNIAL REPORT OF THE REPUBLIC OF CROATIA
Page 107/113
CTF Table 7 (a): Provision of public financial support: contribution through multilateral channels in 2013
Table 7(a) HRV_BR2_v0.1
Provision of public financial support: contribution through multilateral channels in 2013a
European euro -
EURUSD
European euro -
EURUSD
Total contributions through multilateral channels 30,260.00 NO, NE NO NO
Multilateral climate change funds g NO NO NO NO
1. Global Environment Facility NO NO NO NO
2. Least Developed Countries Fund NO NO NO NO
3. Special Climate Change Fund NO NO NO NO
4. Adaptation Fund NO NO NO NO
5. Green Climate Fund NO NO NO NO
6. UNFCCC Trust Fund for Supplementary Activities NO NO NO NO
7. Other multilateral climate change funds
Multilateral financial institutions, including regional development banks NO NO NO NO
1. World Bank NO NO NO NO
2. International Finance Corporation NO NO NO NO
3. African Development Bank NO NO NO NO
4. Asian Development Bank NO NO NO NO
5. European Bank for Reconstruction and Development NO NO NO NO
6. Inter-American Development Bank NO NO NO NO
7. Other
Specialized United Nations bodies 30,260.00 NE
1. United Nations Development Programme
2. United Nations Environment Programme
3. Other 30,260.00 NE
membership fees 30,260.00 NE Other ()
Donor funding Core/generald
Total amount
Climate-specifice
Statusb
Funding sourcef Financial
instrumentf Type of support
f, gSector
c
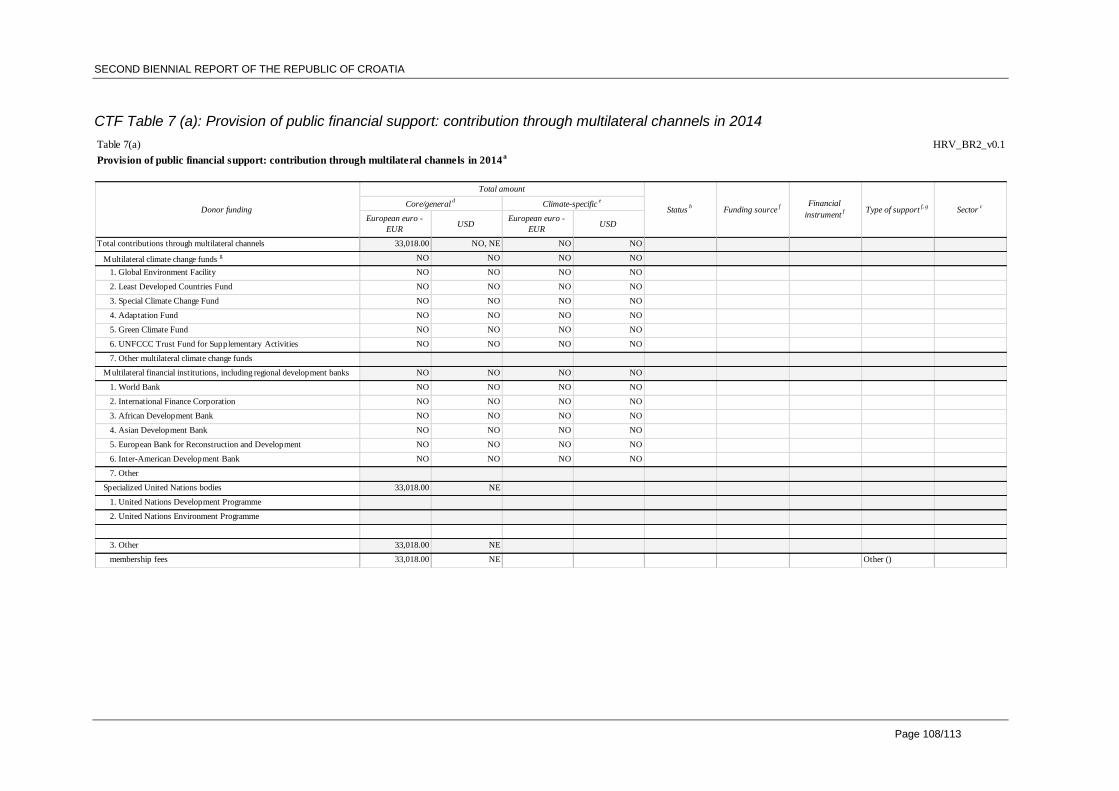
SECOND BIENNIAL REPORT OF THE REPUBLIC OF CROATIA
Page 108/113
Table 7(a) HRV_BR2_v0.1
Provision of public financial support: contribution through multilateral channels in 2014a
European euro -
EURUSD
European euro -
EURUSD
Total contributions through multilateral channels 33,018.00 NO, NE NO NO
Multilateral climate change funds g NO NO NO NO
1. Global Environment Facility NO NO NO NO
2. Least Developed Countries Fund NO NO NO NO
3. Special Climate Change Fund NO NO NO NO
4. Adaptation Fund NO NO NO NO
5. Green Climate Fund NO NO NO NO
6. UNFCCC Trust Fund for Supplementary Activities NO NO NO NO
7. Other multilateral climate change funds
Multilateral financial institutions, including regional development banks NO NO NO NO
1. World Bank NO NO NO NO
2. International Finance Corporation NO NO NO NO
3. African Development Bank NO NO NO NO
4. Asian Development Bank NO NO NO NO
5. European Bank for Reconstruction and Development NO NO NO NO
6. Inter-American Development Bank NO NO NO NO
7. Other
Specialized United Nations bodies 33,018.00 NE
1. United Nations Development Programme
2. United Nations Environment Programme
3. Other 33,018.00 NE
membership fees 33,018.00 NE Other ()
Donor funding
Total amount
Statusb
Funding sourcef Financial
instrumentf Type of support
f, gCore/generald
SectorcClimate-specific
e
CTF Table 7 (a): Provision of public financial support: contribution through multilateral channels in 2014
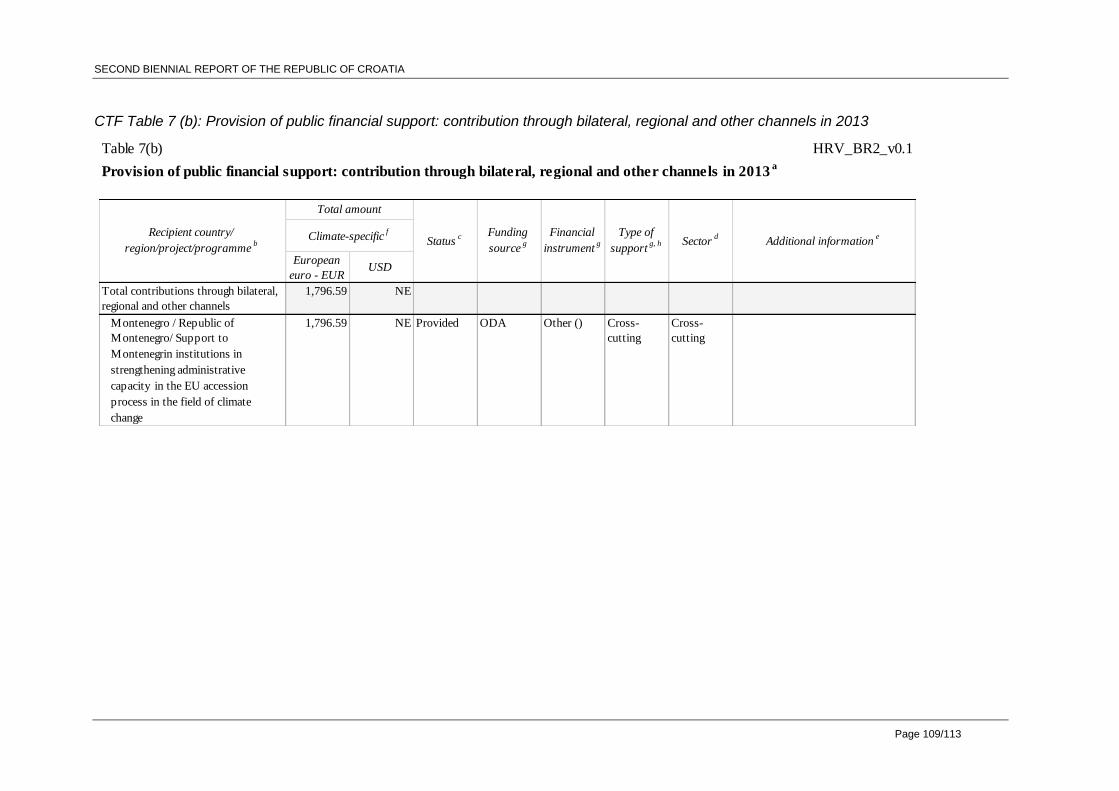
SECOND BIENNIAL REPORT OF THE REPUBLIC OF CROATIA
Page 109/113
CTF Table 7 (b): Provision of public financial support: contribution through bilateral, regional and other channels in 2013
Table 7(b) HRV_BR2_v0.1
Provision of public financial support: contribution through bilateral, regional and other channels in 2013a
European
euro - EURUSD
Total contributions through bilateral,
regional and other channels
1,796.59 NE
Montenegro / Republic of
Montenegro/ Support to
Montenegrin institutions in
strengthening administrative
capacity in the EU accession
process in the field of climate
change
1,796.59 NE Provided ODA Other () Cross-
cutting
Cross-
cutting
Sectord
Additional informatione
Total amount
Recipient country/
region/project/programmeb
Climate-specificf
Statusc Funding
sourceg
Financial
instrumentg
Type of
supportg, h
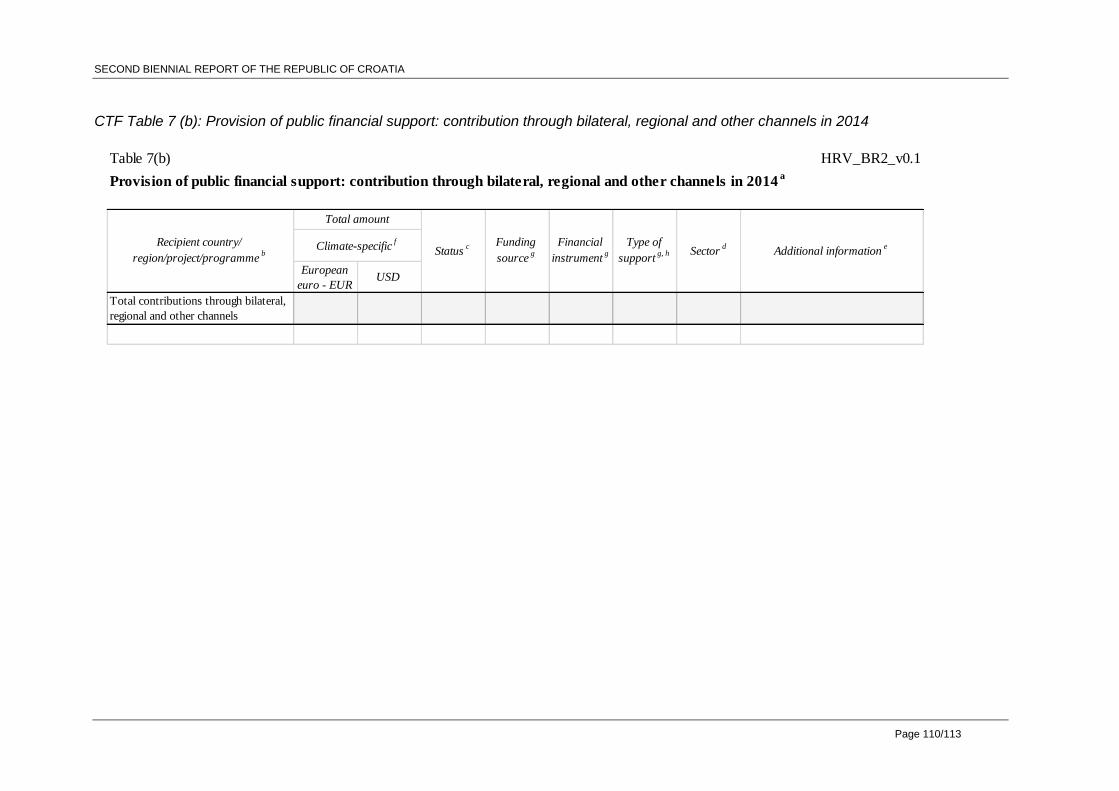
SECOND BIENNIAL REPORT OF THE REPUBLIC OF CROATIA
Page 110/113
CTF Table 7 (b): Provision of public financial support: contribution through bilateral, regional and other channels in 2014
Table 7(b) HRV_BR2_v0.1
Provision of public financial support: contribution through bilateral, regional and other channels in 2014a
European
euro - EURUSD
Total contributions through bilateral,
regional and other channels
Recipient country/
region/project/programmeb
Total amount
Statusc Funding
sourceg
Financial
instrumentg
Type of
supportg, h Sector
dAdditional information
eClimate-specificf
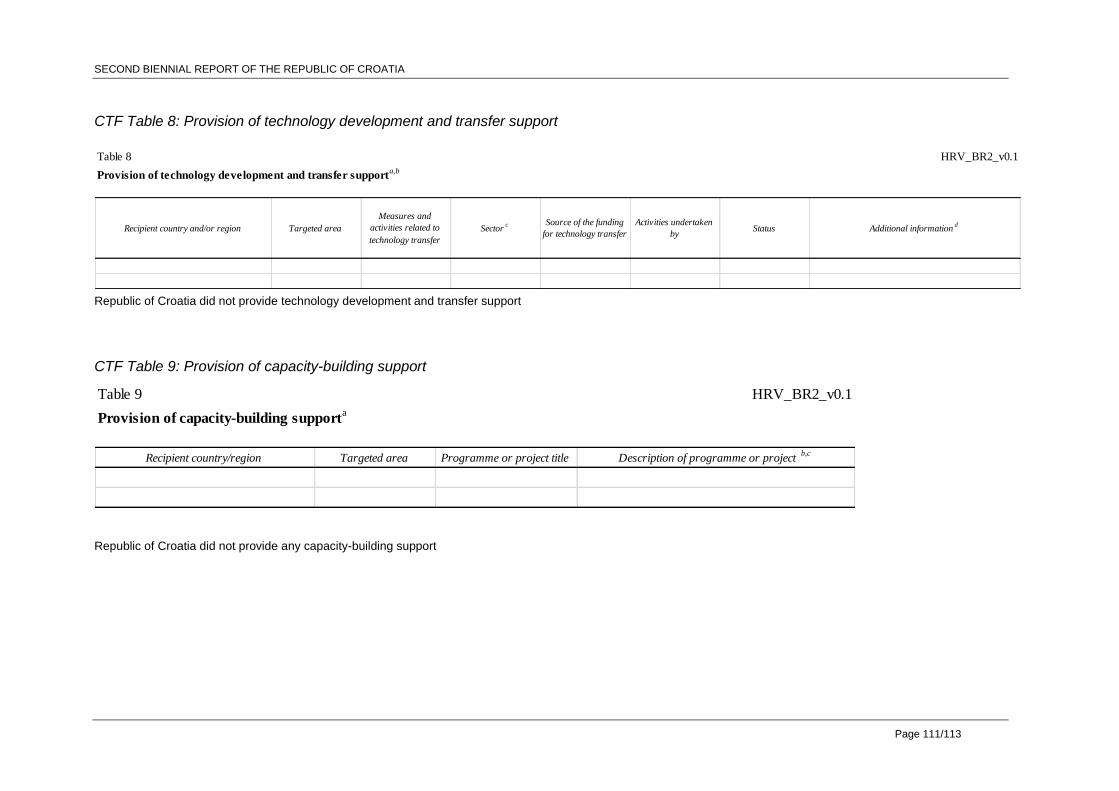
SECOND BIENNIAL REPORT OF THE REPUBLIC OF CROATIA
Page 111/113
Table 8 HRV_BR2_v0.1
Provision of technology development and transfer supporta,b
Recipient country and/or region Targeted area
Measures and
activities related to
technology transfer
Sectorc Source of the funding
for technology transfer
Activities undertaken
byStatus Additional information
d
Table 9 HRV_BR2_v0.1
Provision of capacity-building supporta
Recipient country/region Targeted area Programme or project title Description of programme or project b,c
CTF Table 8: Provision of technology development and transfer support
Republic of Croatia did not provide technology development and transfer support
CTF Table 9: Provision of capacity-building support
Republic of Croatia did not provide any capacity-building support
SECOND BIENNIAL REPORT OF THE REPUBLIC OF CROATIA
Page 112/113
LITERATURE
1. Ministry of Environmental and Nature Protection (2015) National Inventory Report 2015,
Croatian greenhouse gas inventory for the period 1990 – 2013, EKONERG, Zagreb
2. Ministry of Environmental and Nature Protection (2014) Sixth National Communication of
the Republic of Croatia under the United Nations Framework Convention on Climate
Change (UNFCCC), Zagreb
3. Ministry of Environmental and Nature Protection (2014) First Biennial Report of the
Republic of Croatia under the United Nations Framework Convention on Climate
Change (UNFCCC), Zagreb
4. Central Bureau of Statistics (2013) Statistical Yearbook – for period from 1990 till 2012,
Zagreb
5. Central Bureau of Statistics, Department of Manufacturing and Mining, Annual
PRODCOM results (1990 – 2013), Zagreb
6. National Observatory of Athens, Assessment of low carbon measures in transport sector
– Croatia, LOCSEE Project (Low Carbon South East Europe), 2014.
7. EU energy, transport and GHG emissions – trends to 2050 – reference scenario 2013,
2013.
8. The 2015 Ageing Report: Economic and budgetary projections for the 28 EU Member
States (2013-2060), European Comision, Directorate-General for Economic and
Financial Affairs, 2015.
9. The JRC-EU-TIMES model – Assessing the long-term role of the SET Plan Energy
Technologies, EU Joint Research Centre, 2013.
10. COM(2011) 144 final White Paper: Roadmap to a Single European Transport Area -
Towards a competitive and resource efficient transport system, 2011.
11. McKinsey and Company, Pathways to a Low-Carbon Economy: Version 2 of the Global
Greenhouse Gas Abatement COst Curve, McKinsey and Company, 2009.
12. Stručne podloge za definiranje nacrta Nacionalnog okvira politike (nop) za
implementaciju direktive Europskog parlamenta i Vijeća o uspostavi infrastrukture za
alternativna goriva, Energetski institut Hrvoje Požar, 2015.
13. Treći nacionalni akcijski plan energetske učinkovitosti za razdoblje 2014. – 2016.,
Ministarstvo gospodarstva, 2014.
14. Nacionalni akcijski plan za obnovljive izvore energije do 2020. godine, Ministarstvo
gospodarstva, 2013.
SECOND BIENNIAL REPORT OF THE REPUBLIC OF CROATIA
Page 113/113
15. European Environment Agency, Costs of air pollution from European industrial facilities
2008–2012, EEA, 2014.
16. Intergovernmental Panel on Climate Change, 2006 IPCC Guidelines for National
Greenhouse Gas Inventories, IPCC, 2006.
17. VITO EC-IES, Öko-Institut, IEEP, Assess and improve methodologies used for GHG
Projections, DG Climate, 2008.


