Page 1
Report No. 59755-GH
REPUBLIC OF GHANA
Education in Ghana
Improving Equity, Efficiency and Accountability of Education
Service Delivery
February 23, 2010
AFTED
Africa Region
Document of the World Bank
This document has a restricted distribution and may be used by recipients only in the performance of their official
duties. Its contents may not otherwise be disclosed without World Bank authorization.
Pub
lic D
iscl
osur
e A
utho
rized
Pub
lic D
iscl
osur
e A
utho
rized
Pub
lic D
iscl
osur
e A
utho
rized
Pub
lic D
iscl
osur
e A
utho
rized
Pub
lic D
iscl
osur
e A
utho
rized
Pub
lic D
iscl
osur
e A
utho
rized
Pub
lic D
iscl
osur
e A
utho
rized
Pub
lic D
iscl
osur
e A
utho
rized
Pub
lic D
iscl
osur
e A
utho
rized
Pub
lic D
iscl
osur
e A
utho
rized
Pub
lic D
iscl
osur
e A
utho
rized
Pub
lic D
iscl
osur
e A
utho
rized
Page 2
GHANA - GOVERNMENT FISCAL YEAR
January, 1 – December 31
CURRENCY EQUIVALENTS
(Exchange Rate Effective as of March 30, 2010)
Currency Unit = Ghana Cedi GH¢1 = US$0.70 US$1 = GH¢1.42
Weights and Measures Metric System
ABBREVIATION AND ACRONYMS
AFUF Academic Facility User Fees
BECE Basic Education Certificate Examination
CAGD Controller and Accountant General Department
CBO Community Based Organization
CCT Conditional Cash Transfer
CDD Center for Democratic Development
CIDA Canadian International Development Agency
CL Cluster Leader
COTVET Council for TVET
CREATE Consortium for Research on Educational Access, Transitions & Equity
CSA Civil Service Agency
CWIQ Core Welfare Indicators Questionnaire
DACF District Assembly Common Fund
DEO District Education Office
DEOC District Education Oversight Committees
DFID Department for International Development
DP Development Partner
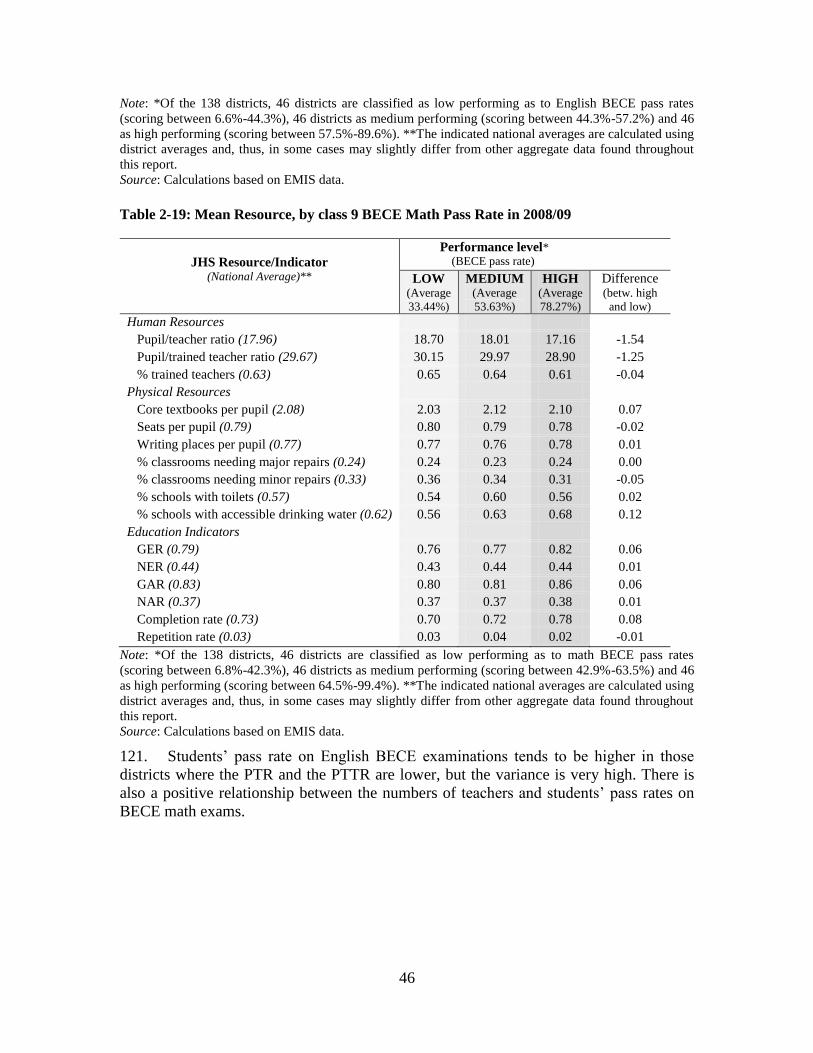
DWAP District-Wide Assistance Project
EDI EFA Development Index
EFA Education for All
EMIS Education Management Information System
ERP Economic Reform Program
ERRC Education Reform Review Committee
ESP Education Strategic Plan
ESPR Education Sector Performance Report
FCUBE Free Compulsory Universal Basic Education
FTI Fast Track Initiative
GAR Gross Admission Rate
GDHS Ghana Demographic and Health Survey
GDP Gross Domestic Product
GER Gross Enrolment Ratio
GES Ghana Education Service
GET-Fund Ghana Education Trust Fund
GLSS Ghana Living Standards Survey
GNAT Ghana National Association of Teachers
GNI Gross National Income
GoG Government of Ghana
Page 3
GPI Gender Parity Index
GPRS Growth and Poverty Reduction Strategy
GRATIS Ghana Regional Appropriate Technology Industrial Service
GSFP Ghana School Feeding Program
GSS Ghana Statistical Service
HDI Human Development Index
HE Higher Education
HEI Higher Education Institute
HIPC Heavily Indebted Poor Country
HIV&AIDS Human Immunodeficiency Virus and Acquired Immune Deficiency Syndrome
HND Higher National Diploma
ICCES Integrated Community Centers for Employable Skills
ICT Information and Communication Technology
IMF International Monetary Fund
IQR Inter-Quartile Range
JHS Junior High School
JICA Japan International Cooperation Agency
KG Kindergarten
KNUST Kwame Nkrumah University of Science and Technology
LEAP Livelihood Empowerment Against Poverty
LESs Less Endowed Schools
MDBS Multi-Donor Budget Support
MDG Millennium Development Goals
MDRI Multilateral Debt Relief Initiative
MLGRD Ministry of Local Government and Rural Development
MMDAs Metropolitan, Municipal and District Assemblies
MoE Ministry of Education
MOESS Ministry of Education Science and Sport
MoFEP Ministry of Finance and Economic Planning
MoLG Local Government
MPs fund Member of Parliament fund
MTEF Medium Term Expenditure Framework
NAB National Accreditation Board
NAR Net Admission Rate
NCTE National Council for Tertiary Education
NDC National Democratic Congress
NEA National Education Assessment
NER Net Enrolment Ratio
NERIC National Education Reform Implementation Committee
NERP National Education Reform Program
NESAR National Education Sector Annual Report
NGO Non-Governmental Organization
NPP New Patriotic Party
NVTIs National Vocation Training Institutes
OECD Organization of Economic Cooperation and Development
PBME Planning, Budgeting, Monitoring and Evaluation
PCE Per child recurrent expenditure
PE Personnel Emoluments
PER Public Expenditure Review
PPP Purchasing Power Parity
PRSCs Poverty Reduction Strategy Credits
PRSP Poverty Reduction Strategy Paper
PTA Parent Teacher Association
PTE Per teacher recurrent expenditure
PTR Pupil Teacher Ratio
PTTR Pupil Trained Teacher Ratio
Page 4
RFUF Residential Facility User Fees
SHS Senior High School
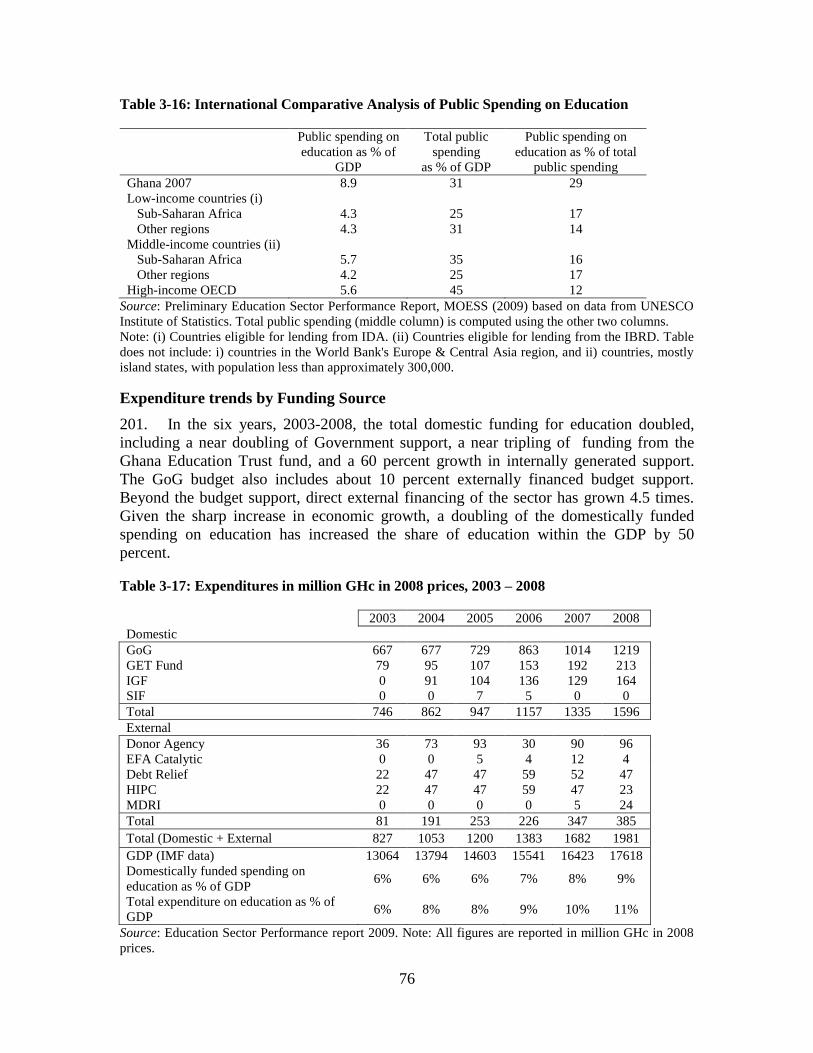
SIML Social Impact Mitigation Levy
SMC School Management Committee
SPAM School Performance Assessment Meeting
SSA Sub-Saharan Africa
SSSCE Senior Secondary School Certificate Examination
SSSS Single Spine Salary Structure
TED Teacher Education Department
TIMSS Trends in International Mathematics and Science Study
TTIs Technical Training Institutes
TTL Task Team Leader
TVET Technical and Vocational Education and Training
UBC Universal Basic Completion
UBE Universal Basic Education
UCC University of Cape Coast
UNDP United Nations Development Programme
UNESCO United Nations Education, Scientific and Cultural Organization
UNICEF United Nations Children’s Fund
UPC Universal Primary Completion
USAID United States Agency for International Development
VAT Value Added Tax
VTIs Vocational Technical Institutes
WAEC West African Examination Council
WASSCE West African Senior Secondary Certificate Examination
WB World Bank
WDI World Development Indicators
Acknowledgments
This report was prepared by Peter Darvas (TTL) and Alexander Krauss based on statistical analysis, as well
as information collected from a number of background analyses that have been provided by the Ministry of
Education, the Ghana Education Service, Ghanaian and international experts. In particular, Chapter 2 on
student enrollment, transition and completion is based on National Education Sector Annual Reports and
data from the Education Management Information System as well as the Ghana Living Standard Survey.
Prof Albert Akyeampong provided contribution to the chapter on access, Quentin Wodon and George
Joseph provided valuable contributions for the assessment of learning outcomes. The sections on teacher
policy are based on a report by Paud Murphy, maps were created with the help of Peter DeVries, the
section on expenditures and efficiency is based largely on analyses by Michele Savini, the section
management and administration is based on a report by Jesper Steffensen, the section on higher education
is based on a report by James Anyan. Several sections, especially higher education, benefitted from a rapid
sector review by Maurice Boissiere. Discussion on TVET benefitted from a review by co-authored Robert
Palmer and the TTL. Burton Bollag edited the text. Valuable suggestions, feedback and reviewer comments
were provided by Ishac Diwan, Peter Moock, Katherine Bain, Richard Hopper, Ash Heartwell, Eunice
Dapaah, Qaiser Khan, Maureen Lewis, Venkatesh Sundararaman, Aidan Mulkeen, Sukhdeep Brar, Atou
Seck, Peter Materu, Susan Hirshberg, Anke Weber, Hiryouki Hattori and Burton Bollag. Ghana Ministry of
Education officials also provided helpful comments to this report including Charles Aheto Tsegah, Kwame
Agyapong Agyen and Joseph Annan.
Page 5
Table of Content
EXECUTIVE SUMMARY ................................................................................................. i
1. INTRODUCTION, CONTEXT AND ORGANIZATION......................................... 1 A. Demographic and Social Context ..................................................................... 3 B. Historical Evolution of Education .................................................................... 7 C. Organization, Structure and Normative Framework ................................... 10
2. EDUCATIONAL OUTCOMES: ACCESS, LEARNING AND RELEVANCE .... 12
A. Coverage and Access at Various Levels ......................................................... 12 B. Learning Achievement ..................................................................................... 36 C. Relevance........................................................................................................... 49
3. INPUTS AND RESOURCES ................................................................................... 58
A. Physical Resources: Schools, Infrastructure and Textbooks ....................... 59 B. Human Resources: Teacher Supply, Allocation, Policy ............................... 64
C. Public Expenditures on Education ................................................................. 75 4. SECTOR PERFORMANCE ..................................................................................... 91
A. Equity and Disparity in Education Services .................................................. 91 B. Efficiency ......................................................................................................... 121 C. Management Accountability and Social Accountability ............................ 138
5. HIGHER EDUCATION ......................................................................................... 150 6. EDUCATION STRATEGIC PLANNING, POLICY OPTIONS .......................... 164
List of Tables
Table 1-1: Ghana’s Progress towards Selected Millennium Development Goals ....... 4
Table 1-2: Structure of Ghana’s Education System .................................................... 11 Table 2-1: Reasons for children not attending and stopping to attend school, percent
........................................................................................................................................... 14 Table 2-2: Pre-tertiary GER, NER and Completion, by Gender, Region and Quintile
........................................................................................................................................... 14
Table 2-3: Trends in Kindergarten Enrollment ........................................................... 16 Table 2-4: Trends in Primary Education Enrollment, public and private, boys and
girls ................................................................................................................................... 17 Table 2-5: Trends in Primary Enrollment, Private/Public ......................................... 17 Table 2-6: Trends in Primary Enrollment, Admission and Gender Parity Index .... 18
Table 2-7: Primary Education, Completion, Repetition and Dropout ...................... 21 Table 2-8: Progress towards education related MDGs ............................................... 22
Table 2-9: Trends in JHS Enrollment, Private/Public and Boys/Girls ...................... 25 Table 2-10: Trends in enrollment to junior high school education ............................ 25
Table 2-11: JHS Completion, Repetition and Dropout ............................................... 26 Table 2-12: SHS enrollments ......................................................................................... 31 Table 2-13: Enrollment in Technical Training Institutes ........................................... 33 Table 2-14: National Functional Literacy Program .................................................... 36 Table 2-15: Overall NEA Mean Scores, Minimum-competency and Proficiency .... 39 Table 2-16: Overall NEA Gender Comparisons .......................................................... 39
Page 6
Table 2-17: Mean Resource in 2005 and 2007, by Class 6 English Proficiency ........ 42
Table 2-18: Mean Resource, by class 9 BECE English Pass Rate in 2008/09 ........... 45 Table 2-19: Mean Resource, by class 9 BECE Math Pass Rate in 2008/09 ............... 46
Table 2-20: Employment Status and Level of Education in 2008, Female/Male ...... 50 Table 2-21: Level of Education and Occupation in 2008, Male/Female .................... 52 Table 2-22: Level of Education and Teenage Pregnancy/Motherhood, 2008............ 54 Table 2-23: Level of Education and Desire for no more Children, 2008 ................... 55 Table 2-24: Mother’s Education and Early Childhood Mortality Rates, 2008 ......... 55
Table 2-25: Women’s Participation in Decision-Making and Level of Education,
2008................................................................................................................................... 56 Table 3-1: Examples for inputs influencing quality outcomes.................................... 58 Table 3-2: Preschool Facilities ....................................................................................... 60 Table 3-3: Primary School Facilities ............................................................................. 60
Table 3-4: JHS School Facilities .................................................................................... 61 Table 3-5: Trends in English and math textbook distribution ................................... 62
Table 3-6: Indicators on Kindergarten Teachers ........................................................ 65
Table 3-7: Indicators on Primary Teachers ................................................................. 66 Table 3-8: 20 Districts with the Highest and Lowest Primary PTTRs, 2008/09 ....... 68 Table 3-9: Indicators on JHS Teachers ........................................................................ 68
Table 3-10: Number of SHS Teachers, Qualified/Unqualified ................................... 69 Table 3-11: Enrollment in Teacher Training Colleges (TTCs) .................................. 70
Table 3-12: Number of teachers on study leave in relation to output from training
colleges ............................................................................................................................. 71 Table 3-13: Admission in Untrained Teachers Training Program ............................ 71
Table 3-14: Percentage of Trained Teachers............................................................... 72 Table 3-15: Teacher questionnaire responses to management-related statements
(rounded percentages) .................................................................................................... 73 Table 3-16: International Comparative Analysis of Public Spending on Education 76
Table 3-17: Expenditures in million GHc in 2008 prices, 2003 – 2008 ...................... 76 Table 3-18: Total expenditure in million GHc by source and level, 2008 .................. 79 Table 3-19: Recurrent expenditures in million GHc by source and subsector, 2008 79
Table 3-20: Capital expenditures in million GHc by source and subsector, 2008 .... 80 Table 3-21: GET Fund releases in million GHc by type and subsector, 2008 ........... 81
Table 3-22: Comparative Average Unit Costs as a Share of GDP Per Capita by
Level ................................................................................................................................. 81 Table 3-23: Per student recurrent expenditure by level, 2008.................................... 82
Table 3-24: Per student recurrent expenditure by subsector, 2005 - 2008 ................ 82 Table 3-25: Reported Sources ........................................................................................ 83
Table 3-26: Reported years ............................................................................................ 84 Table 3-27: Funding Sources and Budgetary Items .................................................... 84
Table 3-28: Per Child Expenditure in 2008 GHc measured at district level ............. 85 Table 3-29: Sources of information on teachers........................................................... 86 Table 3-30: Payroll numbers GES 2008....................................................................... 86 Table 3-31: Staff in the basic cycle, 2008 ...................................................................... 87 Table 3-32: Median years of service as of 2009 by region ........................................... 89 Table 3-33: Estimated Cost of Trained/Untrained Teachers in Primary 1-3 ............ 90
Page 7
Table 4-1: Enrollment in Secondary and Tertiary Public Schools, by Quintile ..... 100
Table 4-2: Gross and Net Enrollment in Primary and Secondary in 2008, by
Urban/Rural Location .................................................................................................. 114
Table 4-3: Existing Deprived Districts and Those Calculated Using 2008/09 Data 117 Table 4-4: Targeting performance of school lunches using district level allocations
......................................................................................................................................... 119 Table 4-5: Share of the benefits that go to each quintile using CWIQ and admin.
data and education needs in CWIQ ............................................................................ 119
Table 4-6: Share of School Lunch Expenditure by Deprivation Index 1................. 120 Table 4-7: Efficiency in classroom distribution in the Basic Cycle, 2004/05 - 2008/09
......................................................................................................................................... 123 Table 4-8: Primary Pupil Teacher Ratio at the Regional Level ............................... 125 Table 4-9: Percentage of children in districts with sub-standard PCE in 2008 ...... 130
Table 4-10: Percentage of children in districts with substandard PCE at KG level
......................................................................................................................................... 130
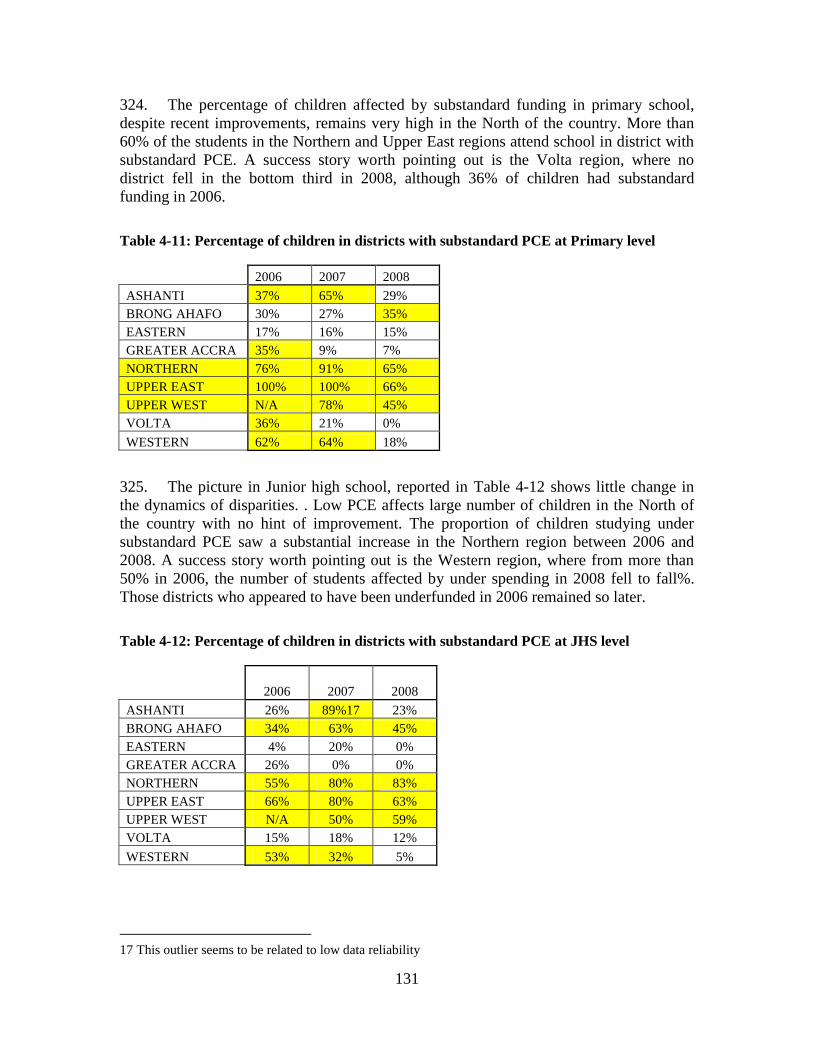
Table 4-11: Percentage of children in districts with substandard PCE at Primary
level ................................................................................................................................. 131 Table 4-12: Percentage of children in districts with substandard PCE at JHS level
......................................................................................................................................... 131
Table 4-13: Percentage of children in districts with substandard PCE at SHS ...... 132 Table 4-14: Per unit expenditure by region and deprived, 2009 .............................. 133
Table 4-15: Share of schools affected by teacher absenteeism in 1988 and 2003, (%)
......................................................................................................................................... 135 Table 4-16: Ghana’s Average Percentages of Time Use, by Primary Grade .......... 136
Table 4-17: Time-on-task for classroom activities ..................................................... 136 Table 4-18: Instructional Time Use in 4 Countries.................................................... 137
Table 4-19: Hours spent in primary and junior high school in past week, percent 138 Table 4-20: Frequency of head-teacher and circuit supervisor activities, 2003
(percent) ......................................................................................................................... 145 Table 4-21: Level of MMDA Discretion...................................................................... 147 Table 5-1: List of Accredited Tertiary Education Institutions as of February, 2009
......................................................................................................................................... 150 Table 5-2: Male/Female Tertiary Enrollment ............................................................ 156
Table 5-3: Graduate Output by Broad Fields of Study, 2001 & 2007 (ISCED 5-6) 158 Table 5-4: Student/Academic Staff Ratios and Norms for Public Universities,
2003/04 and 2007/08 ...................................................................................................... 159
Table 5-5: Countries with the Highest Share of GDP p.c. per Tertiary Student
(2005-2007)..................................................................................................................... 161
Table 6-1: Expected changes in PTR by levels ........................................................... 166
List of Figures
Figure 1-1: African Comparison of Human Development Index, 2007 ....................... 6 Figure 1-2: Sub-Saharan Comparison of GNI per capita and GDP Growth, 2008 .... 7 Figure 1-3: Trends in Share of Trained Teachers in Primary and JHS, 1987-2008 .. 9
Page 8
Figure 2-1: Median Years of Education Completed in 2008, by Female/Male ......... 12
Figure 2-2: Share of the Population without Education in 2008, by Female/Male ... 13 Figure 2-3: Share of children who have never attended school, by background
characteristics .................................................................................................................. 13 Figure 2-4: Trends in Kindergarten Enrollment, Private/Public ............................... 16 Figure 2-5: Capitation grant’s impact on trends in primary net enrollment ............ 19 Figure 2-6: Trends in Primary GER and NER ............................................................ 19 Figure 2-7: Country Comparison in Primary Net Enrollment and Gender Parity,
2007................................................................................................................................... 20 Figure 2-8: Sub-Saharan Comparison of Primary Completion Rate, 2008 .............. 21 Figure 2-9: Public Primary Schools in 2008/09, by Age-grade ................................... 23 Figure 2-10: Share of new entrants to 1st grade who are at least 2 years over-age, by
background characteristics ............................................................................................ 24
Figure 2-11: Enrollment Trend in JHS 1980-2008, by Grade .................................... 26 Figure 2-12: Gross and Net Admission Rates in JHS 1 ............................................... 26
Figure 2-13: Public JHS in 2008/09, by Age-grade ...................................................... 27
Figure 2-14: Student flow in 2008/09 ............................................................................ 29 Figure 2-15: International Comparison in Total Secondary GER and NER, 2006 .. 31 Figure 2-16: International Comparison in Secondary NER and GNI per capita ..... 32
Figure 2-17: Enrollment Trends in Special Education, Male/Female ....................... 35 Figure 2-18: Share of Students with Correct Reading Comprehension, 3rd and 5th
Grade ................................................................................................................................ 37 Figure 2-19: Access and Zones of Exclusion in Primary and Secondary .................. 38 Figure 2-20: Mean NEA scores for both 3rd and 6th grade by gender and by locality
........................................................................................................................................... 40 Figure 2-21: NEA test scores and school lunches ......................................................... 44
Figure 2-22: Regional BECE Pass Rates in 2008/09 .................................................... 44 Figure 2-23:JHS Pupil (Trained-) Teacher Ratio and BECE English Pass Rates, by
District .............................................................................................................................. 47 Figure 2-24: International Trends in Math (left) and Science Scores (right) of
Eighth-graders, 2003/2007 ............................................................................................. 48
Figure 2-25: WASSCE examination results 2005/06 – 2008- 09 ................................. 48 Figure 2-26: Impact of Education on the likelihood of Wage Employment (vs. no
Education) and Non-Agriculture Self-Employment (vs. no Education), Urban ....... 51 Figure 2-27: Wage Regressions and Non-Agriculture Self-Employed Regressions
with Sample Selection, Ghana 1991-2006, Urban ........................................................ 53
Figure 2-28: Level of Education and Fertility Rates, 2008 ......................................... 54 Figure 3-1: Number of Pupils per School at the Basic Level ...................................... 59
Figure 3-2: Trends in Preschools with Toilets and Potable Water ............................ 60 Figure 3-3: Trends in the Number of Pupils per JHS, Public/Private ....................... 61
Figure 3-4: Textbooks per Pupil at Basic Levels.......................................................... 63 Figure 3-5: Trends in Primary Enrollment and Share of Unqualified Primary
Teachers ........................................................................................................................... 64 Figure 3-6: Trends in PTR at the Basic Level, 2001/02-2008/09 ................................ 65 Figure 3-7: International Trends in Trained Primary Teachers and Primary PTRs
........................................................................................................................................... 66
Page 9
Figure 3-8: Trained JHS Teachers in 2008/09, Public/Private and Male/Female .... 69
Figure 3-9: Trend in Expenditure on Education as a Share of GDP ......................... 75 Figure 3-10: Expenditure by level of education, 2004 and 2008 ................................. 77
Figure 3-11: Trends in MOE Expenditure ................................................................... 78 Figure 3-12: Composition of per unit recurrent expenditure from all sources by
subsector, 2008 ................................................................................................................ 83 Figure 3-13: The GES salary scale ................................................................................ 86 Figure 3-14: Per unit annual expenditure by role and subsector, 2008 ..................... 87
Figure 3-15: Distribution over the GES salary scale, 2009 ......................................... 88 Figure 3-16: Distribution of salaries and entry levels, 2009 ....................................... 88 Figure 4-1: Net enrollment at the basic level, by quintile ........................................... 93 Figure 4-2: Mean Age-Grade ‘Delay’ per Pupil, by Household Welfare Quintile ... 95 Figure 4-3: Primary and JHS Completion Rate, by Quintile ..................................... 96
Figure 4-4: Primary PTTR in Districts, by Quintile ................................................... 97 Figure 4-5: NEA learning results in districts for primary 6, by quintile ................... 98
Figure 4-6: BECE English Pass Rate in Districts, by Income..................................... 99
Figure 4-7: Non-attendance and net enrollment in basic education, by quintile .... 100 Figure 4-8: Gender Parity Index in Primary and JHS, by Income .......................... 101 Figure 4-9: Average NEA English scores by region .................................................. 106
Figure 4-10: Primary P(T)TR and Completion Rate, by District in 2008/09 .......... 106 Figure 4-11: Comparison of Mean Age-grade Delay, by Region.............................. 107
Figure 4-12: Portion of Primary Teachers with training, by Region/District, in
2008/09 ........................................................................................................................... 109 Figure 4-13: PTTR in Primary and JHS, by Region in 2008/09 ............................... 111
Figure 4-14: Junior High P(T)TR and Completion Rate, by Region in 2008/09 .... 112 Figure 4-15: Regional distribution of S.H. Schools by type, 2008 ............................ 115
Figure 4-16: Visualizing the disparities: Deprived districts 2006-2008 ................... 117 Figure 4-17: Effect of increased enrollment in junior high schools ......................... 121
Figure 4-18: Senior High Schools Enrollment distribution ...................................... 122 Figure 4-19: Pupils per Classroom and Teacher by school size in Primary, JHS,
2008................................................................................................................................. 123
Figure 4-20: Efficiency in core textbooks distribution in Primary and JH, 2004/05 -
2008/09 ........................................................................................................................... 124
Figure 4-21: Students - Core textbooks scatter plot in the Secondary Cycle 2005/06 -
2008/09 ........................................................................................................................... 125 Figure 4-22: Efficiency in teacher distribution in Primary and JH by deprivation
status, 2004/05-2008/09 ................................................................................................. 126 Figure 4-23: Students - Teachers scatter plot in Primary, 2008/09 .......................... 127
Figure 4-24: Teacher Allocation in Junior High Schools in 2008/09, by District (left)
and by Schools (right) ................................................................................................... 127
Figure 4-25: Pupils - Teachers- Classrooms in SH, 2005/06 - 2008/09 ..................... 128 Figure 4-26: Students - Teachers scatter plot in the secondary cycle 2005/06 -
2008/09 ........................................................................................................................... 128 Figure 4-27: Visualizing the disparities – The districts in 2008 ............................... 129 Figure 4-28: Visualizing the disparities – Between and within regions in 2008 ...... 129 Figure 4-29: Visualizing disparities - Deprived Districts in 2008 ............................. 133
Page 10
Figure 4-30: Expected and Actual Number of Days Students were Engaged in
Learning ......................................................................................................................... 137 Figure 4-31: Education expenditure by source, 2007 ................................................ 139
Figure 4-32: Item 1, GoG Core Budget- PE .............................................................. 140 Figure 4-33: Item 2, GoG Core Budget Administration. .......................................... 141 Figure 4-34: Item 3, Core GoG Budget – Services ..................................................... 141 Figure 4-35: Item 4, GoG Core Budget – Investment. .............................................. 142 Figure 4-36: Capitation Grant ..................................................................................... 142
Figure 5-1: Enrollment in Public Universities and Polytechnics 2001/02-2007/08 . 153 Figure 5-2: Overview of Primary, Secondary and Tertiary GERs, 2006 ................ 154 Figure 5-3: Region of Origin of Undergraduates Students at UG, 2002/3 and 2007/08
......................................................................................................................................... 155 Figure 5-4: Distribution of Tertiary Gross Enrollment Ratios by household Wealth
and Gender, 2006 .......................................................................................................... 157 Figure 5-5: Trends in Enrollments in Public Universities by Broad Fields of Study,
2001/02-2007/08 ............................................................................................................. 158
Figure 5-6:Full-Time Teaching staff in Public Universities by Qualifications and
Gender, 2006/07............................................................................................................. 160
List of Boxes
Box 2-1: Abolition of school fees compensated by capitation grants ......................... 18 Box 2-2: A Case Study of the Causes of School Dropout in Northern Communities 28 Box 4-1: An Outlier in Learning Achievement - Talensi-Nabdam’s success at a
Glance............................................................................................................................... 98 Box 4-2: Reaching the marginalized: the ‘School for Life’ program ....................... 102
List of Maps
Map 2-1: NEA scores of Primary 6 English in 2007, by district................................. 41 Map 2-2: Public Trained Primary Teachers and NEA Math P6 Scores ................... 41
Map 2-3: BECE English and Math Pass Rates, 2008/09 ............................................. 45 Map 3-1: District Level average PTR in Primary Schools, 2008/09........................... 67
Map 4-1: Kindergarten Net Enrollment in 2008/09................................................... 102 Map 4-2: Primary NER in 2006/07 and 2008/09, by District .................................... 103 Map 4-3: Primary Net Admission Rate in 2008/09 .................................................... 104
Map 4-4: Primary Completion Rate in 2008/09 ......................................................... 105 Map 4-5: Primary PTRs in 2006/07 and 2008/09, by Region .................................... 108
Map 4-6: Classrooms Needing Major Repairs and Schools with Potable Water,
2008/09 ........................................................................................................................... 110
Map 4-7: JHS Net Enrollment in 2006/07 and 2008/09 ............................................. 113 Map 4-8: Share of Trained Public JHS Teachers in 2008/09 ................................... 113 Map 4-9: Government’s Identification of Deprived Districts and District Level
Poverty Count................................................................................................................ 116
Page 11
List of Annexes
Annex 1: Political and Administrative System ........................................................... 177
Annex 2: Map ................................................................................................................ 179
Page 12
i
EXECUTIVE SUMMARY
Purpose of the Report
This report is intended to provide a thorough analytical foundation for strategic
planning and sector dialogue among education policy makers, development partners
and civil society representatives at a key turning point in the development of
education in Ghana. During the last decade, access has radically improved. Between
2002/03 and 2009/10 enrollments in primary education grew by 1,284,673 or 50.9
percent. This expansion has outstripped the progress made by virtually all other countries,
and is a testimony to Ghana’s deep commitment to a policy aimed at achieving universal
education.
Pre-primary and Junior High School are the fastest expanding areas. Between
2002/03 and 2009/10, the pre-primary gross enrollment rate went from 21.8 to 97.3
percent (net enrollment, from 19 to 63.6 percent for 2008/09). At junior secondary
school, gross enrollment rose from 64 to 79.5 percent (net, from 30 to 47.8 percent)
during this period. As enrollment and completion have increased at basic levels, demand
for post-basic education has also increased but supply hasn’t followed suit. Only about
35–40 percent of students who finish Junior High School (officially the end of basic
education) go on to enroll in a Senior High School, and even this limited transition would
be lower were it not for the increase in the capacity of private senior high schools (SHSs).
Extensive growth in basic education seems to have reached a point where services
cannot be stretched much further. The gross admission rate to primary education is
now over a hundred percent, gross enrollments are considerably above 90 percent, and
upper secondary enrollments have reached the maximum capacity within the available
infrastructure. The education sector employs about 40 percent of the total civil service
and uses about a third of the public budget.
At the same time, persistent problems (including out-of-school children) and
emerging issues (including persistent disparities and limited learning outcomes)
require new solutions. Meeting the challenges requires a new definition of performance
focusing on more equitable and more efficient services, more informed policies, and
strengthened accountability.
The present analysis is an attempt to bring together key outcomes, resource
allocations, and a deeper look at equity, efficiency and accountability in education
service delivery. The great progress in education made by Ghana in the last decade is
evidenced by (a) coverage expanded to about 84 percent of the relevant age population in
primary, (b) basic services extended to 11 years, (c) expansion of access at secondary and
tertiary levels, and (d) growth of public expenditures both in scale and in the share of
Government expenditures. At the same time, great challenges remain such as: (a) socio-
economic disparities in access and quality; (b) significant and stubborn regional
differences; (c) poor quality of learning; (d) inefficient use of resources; and, (e)
Page 13
ii
insufficient measures to assure that schools and administrators are accountable for
delivering the education services in line with expectations.
Communities, parents and students, especially in poor areas have legitimate
concerns about sub-standard schools, sub-standard supply of human and financial
resources, missing teachers, poor exams, and lacking services. Despite investments,
many classes are still held under trees, many children are turned away from higher levels
of schooling, and many fail comprehensive exams and do not find post-basic schooling
places or job opportunities. It is becoming clear that addressing these challenges and
achieving further progress cannot be achieved through a simple algorithm between
inputs, resources, standards and projected educational outcomes. The source, scale,
allocation and use of resources – physical, human and financial alike – have reached a
level of complexity in which central planning and decision making can no longer
determine how much of these resources are allocated and used, when, where and by
whom. New approaches promoting greater effectiveness and accountability are required.
The dramatic increases in admission and enrollment rates to basic education during
the past decade are due mostly to the elimination of school fees, followed several
years later by the introduction of the capitation grant to help schools make up for
those fees. Ghana’s 1992 Constitution declared that basic education “shall be free,
compulsory and available to all.” The Free Compulsory Universal Basic Education
(FCUBE) reforms of 1996 were designed to push this goal forward. FCUBE was
extended from 6 to 9 years by adding the 3-year JHS level. In 2002, it was extended to 11
years, when the government added two years of pre-primary, since it is seen as a key
element to help prepare children for primary school. However during this period, in the
context of flagging public expenditures on education, many schools found themselves
forced to impose indirect fees, e.g. for registration, uniforms, textbooks, etc. In response,
the government in 2004 introduced capitation grants for 40 deprived districts, extending
the grants to the whole country in 2005.
One effect of these efforts has been a dramatic increase in the willingness of parents
to start their children’s schooling at the appropriate age. As late as 2004, only about a
fourth of 6-year-olds were enrolled in first grade. But by 2009, three fourths of 6-year-
olds were enrolled. Still, almost thirty percent of children are older than the official age
when they start first grade. Being over-age is a prime factor contributing to repetition and
drop out. Many over-age children do not complete the cycle.
Yet the overall rates mask stark disparities. The prospects of children in the poorest
quintile never having gone to school are about 10 times greater than those of
children in the richest quintile. If a child lives in a rural area, his or her chances of not
having attended school are over three times higher than an urban child. A rural girl from
the poorest quintile is 13.9 times more likely to not have attended school than an urban
boy from the richest quintile.
This trend grows sharper further up the education ladder, culminating in very
restricted entry to higher education. A few secondary schools dominate tertiary
intake. A recent survey of 1,500 students in the country’s five oldest public universities
Page 14
iii
confirms that 50% of students came from only 29 of the 493 public senior high schools in
the country.
Gender parity has nearly been achieved at primary level, where girls enroll at
almost the same rates as boys. But at higher levels, girls’ participation drops off
significantly. Poor families often “sacrifice” their girls’ education, and have them work
at home or on the family farm, in order to keep their boys in school. When girls do
manage to attend secondary school, it is not unusual for them to face a hostile
environment of sexual harassment from male students and even some male teachers.
Such harassment may be tolerated by school authorities; in any case it contributes to a
higher female dropout rate. The gender gap is much bigger at the country’s Technical and
Vocational Education and Training (TVET) institutions, which are increasingly seen as
having a key role to play in preparing young people for a vast array of in-demand skilled
jobs. As for children with various handicaps, there is as yet very little special education to
help them develop their potential.
Ghana’s stake in gender parity goes beyond giving girls more opportunities. Greater
education levels among women are closely associated with a delayed start of child
bearing, smaller families and healthier children. For example, women with no
education give birth to about three times more children than women with secondary or
higher (WHO 2008:92). And a mother’s education is also inversely associated with a
child’s risk of dying from disease.
Whatever the difficulties, education has become a core priority for Ghana.
Government expenditures on the sector have reached unprecedented levels,
proportionally double the average for Africa and other developing regions. Ghana’s
education spending hovered around a respectable 5 – 6 percent of GDP since 1990, but
has been steadily rising over the past decade. Spending reached 11 of GDP percent in
2008 -- about 30 percent of the government budget. A number of initiatives have been
established or expanded: the school feeding program; programs for school infrastructure,
textbooks, and uniforms; supplements for teachers; and a high profile annual award for
the best performing teachers. Education has become one of the most frequently discussed
topics of public concern in newspapers, radio and TV programs, next to politics, the
economy and of course sports. The country was among the first in Africa joining the
Education for All movement, subscribing to the EFA Fast Track Initiative guidelines.
Table 1: Trends in key education indicators in Ghana Kindergarten Primary JSS SSS
2002/03 2009/10 2001/02 2009/10 2001/02 2009/10 2003/04 2009/10
GER 21.8 97.3 80 94.9 64 79.5 26.6 36.1
NER 19 63.6** 59 83.6 30 47.8
GAR 88* 101.3 71.6* 86.6 39.4
NAR 24.5* 71.1 10.6* 43.8
GPI 0.98* 0.99** 0.93* 0.96 0.88* 0.92
Note: *refers to data from 2003/04; ** 2008/09.
Source: Calculations based on EMIS.
Page 15
iv
The completion rate in Ghana is relatively high but not high enough to achieve the
Millennium Development Goals (MDG). School census data for the latest year
(2008/09) indicate that the primary completion rate reached 87.1 percent, which
represents a 9.2 percent increase since 2003/04. This is all the more relevant considering
that with primary NER at 83.6 percent, over 16 percent of children never even start
school, representing a NER decline of about 5 percent relative to the academic year
2008/09. Although the enrolment and completion rates are relatively high for Sub-
Saharan Africa (SSA), they also show that achieving universal primary completion
(UPC) is unlikely. As UPC nears, improvements in completion are more and more
difficult. Children living in extreme poverty and in geographically isolated settings tend
to drop out first as they are expected to contribute to household income generation, and
girls in particular are expected to take care of younger siblings and children with special
needs. Being over-age is also a key cause of repetition and dropout. The problem is
exacerbated by classroom overcrowding, which has in turn been worsened by the rapid
enrollment increases of recent years. Drop out is higher in JHS, averaging about 30
percent of students who start the cycle.
On average, children from households in the poorest quintile (largely concentrated
within the three Northern regions) are about three years over the official age in
their respective grade. Children from households in the richest quintile tend to be less
than two years older than the official age for their particular grade. In general, the poorer
the families are, the higher the risk is for having overage pupils in school. (The poorest
quintile tends to be 3 years over age, but the richest are still almost two years over age.)
The phenomenon is due to, for instance, the need to care for younger siblings or to work
during times of harvest, which may lead to postponed entry into primary 1 or frequent
repetition as a result of lost instruction time. The consequences of high age-grade delay
are a straining of the pedagogy process, higher public costs of schooling, reduced
learning results and increased dropout rates. It is essential to provide incentives to, in
particular, poor and rural households, to ensure that children enroll at the official age.
Poorer quintiles have much lower enrollment and completion rates. Students from
economically deprived households have not only fewer chances than their rich
counterparts to be enrolled in school, but those that are have an even smaller probability
of completing a given cycle.
At the same time, there are serious concerns about the quality of education. In
overcrowded classrooms, often instructed by teachers who have not had any pedagogical
training, large numbers of students complete primary education without attaining
functional literacy. Poor learning outcomes mean large numbers of students who gain
little from their time at school and are excluded from the benefits of higher levels of
schooling. Poor educational quality also undermines Ghana’s ability to compete
internationally.
Less than a third of primary school children reach proficiency levels in English or in
Mathematics, according to the National Education Assessment tests of 2005, 2007 and
2009. These tests were conducted on a nationally representative random sample of 3.5
Page 16
v
percent of Ghana’s primary schools (NEA 2007:2). The 2009 results for Primary 3
showed 20 percent of students proficient in English and 25.2 percent in Math
(improvements in both subjects relative to 2005 results). For Primary 6 the results were
35.6 percent proficient in English and 13.8 percent in Math (improvements in both
subjects compared to 2005 results).i
Moreover, there are great geographical disparities in the quality of education, with
students in rural schools, especially in the north of the country, at a big disadvantage.
While access rates between rural and urban areas are already large, the gap in learning
outcomes appears even larger. The highest concentration of 6th graders with low NEA
English scores (38 or below) went to school within districts of the Northern region, while
the highest concentration of students with high scores (44 or above) attended schools in
the districts of Greater Accra. This coincided with other key factors. High performing
schools had over 90 percent trained teachers -- 36.4 percent more trained teachers than
low performing schools. The proportion of high performing schools in urban settings
with over 5,000 residents was 72.2 percent, and among those with electricity was 47.3
percent, while the share of low performing schools in urban areas was 8.5 percent and
among those with electricity was 9.1 percent.
The data show that the districts with the poorest performance on NEA were in the
Northern regions; scores in math were 15 points lower than the national average and
less than half compared to the top scoring districts in the country. These districts had
primary Pupil Trained Teacher Ratios (PTTR) of 150 to 200. In these remote areas,
schools are typically small, with enrollments typically less than 100. This means that
often only every second or third school in the region has a trained teacher. Among other
hardships, more than half of students don’t have access to a treated water source, a
situation linked to higher incidence of disease, including guinea worm infection and
typhoid.
The same pattern holds true for the Basic Education Certificate Examination
(BECE), a comprehensive leaving test at the end of lower secondary school. In
2008/09, the bottom five performing districts on BECE English exams were all found
within the Northern region. BECE performance correlates more strongly with the share of
trained teachers than to the degree to which students have access to school materials and
basic infrastructure.
Human Resources: Teacher Supply and Allocation
The Pupil Teacher Ratio (PTR) at the primary level has remained unchanged
during the past decade, just above 32, despite the sharp increase in enrollments, thanks to efforts to recruit a large number of new teachers, most of them unqualified.
Between 2001/02 and 2008/09 the number of primary teachers grew from 80,552 to
114,421. However, the portion of primary teachers who were untrained grew from 35.1
percent to 52 percent, resulting in more students for each qualified teacher: the primary
Pupil Trained Teacher Ratio (PTTR) rose from 49.3 to 67.5. This has negative
Page 17
vi
implications for the quality of education, since the number of trained teachers is widely
seen as the single most important factor in learning outcomes.
Table 3-8: Indicators on Primary Teachers
2001/02 2002/03 2003/04 2004/05 2005/06 2006/07 2007/08 2008/09
TEACHERS 80,552 80,459 82,833 89,278 88,461 105,257 112,443 114,421
Untrained Teachers 28,238 29,866 32,296 37,608 38,654 49,459 57,266 59,488
% of Private 31.7% 30.0% 39.6% 40.8% 23.1% 20.7% 23.2% 22.2%
% of Untrained 35.1% 37.1% 39.0% 42.1% 43.7% 47.0% 50.9% 52.0%
% of Untrained Public 22.8% 26.5% 26.2% 27.7% 32.9% 37.9% 40.6% 41.6%
% of Untrained Private 83.0% 84.7% 84.5% 85.0% 85.5% 83.6% 87.6% 88.4%
% of Female 32.1 32.8 32.0 31.1 33.9 27.7 33.0 33.9
PTR 32.1 31.4 34 34.9 35.7 33.5 34.1 32.4
PTTR 49.4 49.9 53.2 56.7 62.7 60.3 65.5 67.5
PTR in Private 29 27 27 27 26 26 25 26.3
PTTR in Private 170.3 178.6 174.0 178.3 180.2 157.6 203.7 227.6
PTR in Public 33 32 34 35 38 33 34 34.2
Source: EMIS.
Worse, the distribution of teachers, and especially of trained teachers, is very
unequal. Teachers generally prefer to work in better-endowed urban centers, and
avoid being deployed to schools in remote, impoverished areas, with their poorer
infrastructure and sanitation. Both in the Primary and JH cycles the highest PTR are
more than 30% higher than the lowest. Higher PTRs are found in the North and in the
Greater Accra region, in the latter mainly due to migration patterns: the influx of large
numbers of families from the rural areas.
Disparities in the PTTR are much greater. At the national level, primary level PTTR
in 2008/09 was 67.5. But in about one quarter of the districts, the average PTTR was
around 100. In ten of these districts, all of them located in the Northern, Upper West,
Upper East and Western regions, there were over 155 students for every trained teacher.
Most of these districts are at the same time classified as belonging to the poorest quintile.
Within individual districts, qualified teachers prefer to stay in urban areas, leaving rural
schools with even fewer of their numbers. Also in 2008/09, 75% of the 37,700
kindergarten teachers were unqualified. The proportion of untrained teachers in JHS
increased between 2001 and 2008 from one fifth to over a third while their total number
grew by 160 percent.
Among the approximately 70,000 unqualified teachers employed in Ghanaian basic
schools in 2007: (i) about 22,000 were new university graduates doing one year’s
national service in Ghana’s schools; (ii) about 12,000 more, young and sometimes older,
were people teaching as volunteers under a National Volunteer Scheme and (iii) 9,000
were students in the final year in teachers’ colleges teaching whole-time in schools as
part of their teacher training programs.
Page 18
vii
Efficiency in schools: Absenteeism and Time-on-task
High teacher absenteeism is one of the key inefficiencies in the education sector. It is
more common in rural schools, apparently associated with higher occurrences of a poor
work environment and poor teacher morale. The average teacher absentee rate, as a
survey by the Center for Democratic Development (2008) indicates, was 27 percent.
Teachers in Tunisia and Morocco miss 11.6 days and 13.4 days a year, respectively,
while teachers in Ghana miss 43 days (Abadzi 2007). Among the main underlying
reasons for the high absentee rate are (i) lack of supervision, (ii) sickness/medical care,
(iii) collection of salary at a bank located at a distance, (iv) frequent funeral attendance,
(v) long distances to school, (vi) religious practices (for instance, Friday prayers among
Muslim teachers), (vii) schools lacking facilities, especially sanitation: toilets and potable
water, (viii) schools located far from lorry/bus stations and healthcare facilities, (ix) rural
teachers supplementing their income by engaging in activities related to farming.
Low attendance is compounded by the problem of low instructional time in school,
i.e. low time on task, which appears to be widespread. A simple observation of school
activities provides a good picture of the causes of low time on task. Frequent breaks,
when teachers are separated from students, slow transition to instruction, down time spent
disciplining students, collecting homework etc., all create an illusion of children learning
while in school.
Together, teacher absenteeism, poor ToT and short duration of school year can 4.1
result in the loss of as much as 50-60 percent of teaching time, clearly making this
as a key constraint to learning.
Figure: Expected and Actual Number of Days Students were Engaged in Learning
Source: Based on Abadzi 2007.
Patterns of Resource Allocation
Allocation of teachers
Efficiency in teacher allocation generally decreased between 2005/06 and 2008/09. In
2008/09 only 29, 46 and 55% of teacher presence could be explained by enrollment in
197 190 200 204194 185 195 203
109
171 175 176
76
148126
145
0
50
100
150
200
250
GHANA Tunisia Pernambuco (Brazil) Morocco
Days in School Year Days after Closure No. Days Schools Operated Days Students Engaged in Learning
Page 19
viii
Kindergarten, Primary and Junior High School, respectively. In the primary subsector,
55% of the number of teachers observed in school was related to the number of pupils in
2005/06 (falling to 46% in 2008/09). In other words “randomness” in teacher deployment
increased from 45% to 54% between 2005/06 and 2008/09. Teachers are even less
efficiently distributed in deprived districts, where in 2008/09 “randomness” reached 62%.
Efficiency in teacher deployment has been decreasing in the Junior High subsector
as well. Whilst 63% of teacher presence was explained by enrollment in 2005/06, 55% of
teacher presence could be explained by enrollment in 2008/09. Efficiency in teacher
presence in deprived districts fell by 10% in the last year. In effect, this means that for the
last four years, efficiency of teacher deployment was always lower at all levels in
deprived than in non-deprived schools. Evidently, the Government efforts to assure better
education services to deprived districts have not been effective.
Allocation of Financial Resources
More than 60% of children in the Northern region attend primary school in
districts where the per child expenditure (PCE) is within the bottom third of the
nation. This means that there is negative discrimination: deprived districts benefit less
from public resource allocations than non-deprived districts. The proportion of Junior
High School students suffering from under-spending in the Northern region is even
higher, reaching 83% of the total number of students in the region.
Percentage of children in districts with sub-standard PCE in 2008
KG Primary JHS
ASHANTI 28% 29% 23%
BRONG AHAFO 0% 35% 45%
EASTERN 0% 15% 0%
GREATER ACCRA 17% 7% 0%
NORTHERN 49% 65% 83%
UPPER EAST 59% 66% 63%
UPPER WEST 93% 45% 59%
VOLTA 15% 0% 12%
WESTERN 24% 18% 5%
The conclusion is that a key source of deprivation for the deprived districts is the
allocation of public expenditures. These expenditures, instead of compensating for the
deprivation, exacerbate them by allocating fewer resources per child to the regions where
the majority of deprived districts are located.
Management Accountability -- Fragmented System of Flow of Funds
Education financing is fragmented among a number of sources and among an even
larger number of flows of funds. This is the most fundamental reason why planned
and executed budgets differ. The authority to allocate the key resources are divided
among four agencies: The Ministry of Finance and Economic Planning (MoFEP) is
Page 20
ix
responsible to set the overall budget and to determine (through the Civil Service Agency)
the remunerations; The Ghana Education Trust (GET) Fund is responsible for
investments; Ghana Education Service (GES) is responsible for allocating recurrent
expenditure and to set teacher numbers; and the Ministry of Education (MOE) is
responsible for coordinating donor funds and proposing the annual education budget to
the Government.
A large majority of the public spending on education is channeled through the
budget of the Ministry of Education. However, this budget only covers teachers’
salaries, new school construction and some inputs such as textbooks. A significant
portion of public resources benefitting the education sector is still channeled through the
budgets of other ministries, departments and agencies of the Government, among others,
the Social Investment Fund and the GET Fund. Education funding is also derived from
the budgets of the MoFEP and the Ministry of Local Government. Some of the resources
from the “MP Fund,” allocated to Members of Parliament to promote development in
their constituencies, also support school projects, scholarships and the like.
There are significant delays in several funding flows, particularly for the service
component of the budget, due to various systemic and capacity related factors. There
is inadequate capacity at the Metropolitan, Municipal and District Assemblies (MMDA)
level to account and report in a timely manner for the use of funds. Moreover, these
problems are worsened by the multiple funding flows, planning systems, accounting
procedures, reporting systems, auditing requirements and bank accounts.
With the exception of salaries, fund flow is complex and often leads to fragmented
and unpredictable planning and budgeting in the MMDAs. This has a spill-over
effect on service delivery institutions/schools, which have to face lack delays of funding
for operations and maintenance particularly at the beginning of the financial year.
Capitation grants are supposed to address some of these problems and have improved the
funding for operations of most of the schools.
Division of Roles and Responsibilities
Too many vertical levels ‘blur’ responsibility. MOE represents the sector in strategic
(Government, and Development Partner -- DP) dialogue whereas GES is responsible for
service delivery including deployment of teachers, allocation of textbooks, supervision of
schools and teachers. GES has no mandate to manage the payroll. It does not have
effective tools to assure that teachers who are assigned to one school or even to one
district take the assignments or remain there. Funds and resources to local level flow
through a variety of channels, limiting the capacity of agencies to pursue a coherent
spending strategy. In the meantime, when teachers leave their posts for one reason or
another (such as study leave or relocation) GES has the responsibility of replacing them.
As enrollments have increased in the last decade, the gap between the planned and
executed payroll has widened from about 10 percent to over 35 percent.
Page 21
x
The District Education Department (DED) system is diffused rather than
decentralized, inasmuch as District officials, including the Director are appointed by
GES headquarters and report through regional offices to the center. The DEDs were
created in 1995 when the Ghana Education Service (GES) reviewed its management
structures at headquarters, regional and district levels in order to bring authority and
responsibility for service closer to communities. The strong connections between central,
regional and local levels limit the capacity of locally elected officials to oversee the
sector and confront problems.
Under new legislation, District Education Directors are expected to report to the
MMDAs. This should strengthen local accountability; however, it is unclear how the
standards for curriculum and teaching and other regulations set by the center would be
enforced.
At school level, headteachers are selected from the ranks of serving teachers. Teachers who have reached the level of Principal Superintendent (with at least 12 years
experience) are eligible for consideration. No special training is given. Teachers are
interviewed at district level and appointed to the schools.
Supervision of teachers by circuit supervisors and head teachers is uneven, but can
have a significant positive impact. However, many circuit supervisors don’t observe
and assess teachers during instruction time, but rather visit schools to simply verify
student and teacher attendance figures.
There exist several mechanisms to promote community and stakeholder
involvement and oversight in local schools. Parent Teacher Associations (PTAs) are the
oldest and most widespread, though they have limited powers. School Management
Committees and School Performance Assessment Meetings were established more
recently, but have had trouble gaining a real foothold and tend to operate sporadically.
The most influential form of community involvement typically comes from local
traditional authorities – headed by the local chief. When the traditional authority is
interested and active, it can provide powerful oversight on educational issues, including
whether teachers are present and the extent to which students spend their school time on
task.
The Education Management Information System (EMIS) to date is basically an
annual school census, usually carried out at the end of the calendar year or early in
the following year. This EMIS design is that it maintains a fragmentation between types
and sources of data and that, in turn, limits its usefulness for decision makers.
Tertiary education
Since the early 1990s tertiary education has increased at an exponential rate. Within
a decade (1997/98-2007/08) total enrollment in the public HEIs alone (excluding the
colleges of education) has more than tripled from 40,000 to 132,604. A 104% increase
Page 22
xi
occurred in public universities while polytechnics recorded a 69% increase over the
period 2001/02-2007/08.
The rapid expansion has placed substantial pressures on staffing and on
infrastructure. Also, as a consequence of the growing enrollment numbers, there are
also increasingly more unemployed graduates, some of which eventually seek job
opportunities abroad.
The private higher education institutions are playing a significant role by easing the
social demand for higher education. The number of accredited private HEIs reached 54
in 2009. But, while private enrollment is in fact rising, public enrollments are expanding
at a faster pace and represent a growing share of total tertiary students.
The polytechnics in Ghana had operated as second-cycle institutions until they were
upgraded to tertiary level status in 1993. They are oriented to technical and vocational
education and the training of middle level human resources for national development.
Some Policy Options
Overall, the learning outcomes have some important messages for policy makers:
The educational system is not able to address or overcome the initial differences in
reading comprehension and basic math skills; indeed, these initial differences are further
intensified overtime. The improved access has brought into the system large groups of
children who are now accessing education with various forms of additional challenges
including overage children, children coming from poor families, families where parents
have little educational background and comprehension of the importance of education
and children in poor remote, rural communities and deprived districts where access to
infrastructure, work and services are limited. Many of these children have a high risk of
falling into various zones of exclusion. Meanwhile, the education system has its standards
for transitioning students from one level to the next, there is a strong likelihood that many
of those who gained access to education over the last decade have left limited
opportunities to truly benefit from it.
Even with Ghana’s extraordinary levels of spending on education, it is clear that
public funds cannot cover all minimum needs. Under these conditions, allocations
should be better prioritized and provisions adjusted to local conditions and need. A
key example is in teacher provision. In remote locations the use of various incentives to
attract teachers, especially trained ones, may be more important in affecting learning
outcomes than other resources, like class supplies or the number of classrooms. The
government has been trying to direct more resources to deprived areas. Most of the
efforts have been based on externally financed projects, including the pilot programmatic
scheme by IDA or lately funding for the deprived districts by USAID. But current
administrative structures have often left these efforts unsuccessful. In reality, the
complexity of resource allocation has led in many cases not to neutral allocation, but to
negative targeting, as poorer areas receive not more provisions but less. Therefore,
Page 23
xii
decisions about prioritizing the allocation of resources and the setting up of services will
be most effective when they follow some principles:
they are evidence based, 4.2
they promote policy goals by providing adequate incentives for key 4.3
participants including students, parents, teachers, headteachers, and district
officials, and
they are targeted so that those who need the most get the largest share of 4.4
public resources.
Equity and Disparity in Education Services:
If access is inequitable, it diminishes the performance and compromises the social and
economic benefits. That is why the Ghanaian government has been committed to
equitable access. A number of policies support this goal, including, among others, the
elimination of fees, the provision of capitation grant, textbooks, school feeding and the
delineation of deprived districts. But, by the same token, inequitable services, disparities
in access and in educational inputs could not only compromise the effect of these policies
but also result in greater social inequity and fragmentation.
There are three levels of potential and desirable policy actions in the context of
disparities:
Avoiding negative discrimination: At a minimum, the allocation of resources 4.5
should not discriminate along social, cultural or geographical grounds. If x
amount is available for education per student, the Government needs to assure
that x amount is allocated so that all students see the benefit of the inputs
equal to this amount.
Establishing specific policy incentives to improve supply of services: At a 4.6
higher level, the Government resources should be allocated in a way that it
addresses specific difficulties in education service delivery. If, for instance,
enrollment and attendance is more challenging in some areas, typically in the
rural and poor Northern regions, the Government conceives policies that
address this specific educational problem. For instance, it is important to top
up teacher salaries for those who are willing to teach in remote areas;
accommodations or subsidized transportation can be provided to these
teachers.
Creating positive discrimination to stimulate demand: At a highest level, the 4.7
Government may develop policies that address underlying social and
economic problems by stimulating demand and thus access to education.
These policies may include school feeding, cash transfers or any type of extra
provisions that relieve the burden on families for sending children to school. It
is critical to the success of these measures how they are targeted and
monitored.
Page 24
xiii
Quality of Learning
As overall access to education improves -- especially at primary and basic levels --
the Government and other stakeholders need to pay increasing attention to quality
issues. Even if increasing number of children find ways to gain admission and
increasing proportion of them are enrolled, new forms of exclusion emerge as many
of them simply do not attend classes, learn enough, drop out, repeat, fail to pass exit
exams or fail to transit to post-primary levels. International assessments show that big
disparities in learning outcomes in a country pull down overall performance even if
there are some significant groups that demonstrate impressive achievements, claim
successful academic or professional careers.
Ghana’s commitment to education is shown by its willingness to participate in
international learning assessments, by the national assessments of learning outcomes
and by the numerous innovations that are sponsored and promoted through
Government policies or non-governmental initiatives. These will gradually direct the
public attention and the accountability of education providers to quality outcomes.
This report shows that while the resources for education are impressive, they are not
distributed equitably, targeted according to need and used efficiently. Quality
standards are defined in terms of input with little understanding as to which inputs
and which methods have the most impact on learning outcomes. Among the inputs,
two key items appear to show major impact: the access to quality teaching and quality
teachers and the instructional time.
Based on the findings we identify three levels of potential and desirable policy
actions:
Continue strengthening the Government capacities and increase investment 4.8in monitoring learning outcomes. While there is an impressive array of
innovations and options for policy to improve quality, it is impossible to
assess their effectiveness and scale up the successful ones if learning
outcomes are not measured by using solid international and reliable national
standards and methodologies.
Ensure that resources with strong impact on quality reach the classrooms. 4.9
The available assessments confirm that trained teachers have the biggest
impact on learning. Further, there are indications that high level of
absenteeism, low time on task significantly compromise learning. To
overcome these problems, both the central and local governments as well as
the communities need to be given authority, improve capacity to supervise,
monitor deployment of teachers, attendance and, indeed, classroom activities.
Standards, expectations and regulations need to be stringent to avoid that new
generations of students complete education without effective learning.
Give central support to local innovations. Improving quality in crowded 4.10
urban schools requires different approach than in small rural schools often
with limited infrastructure, facilities shared by different grade levels, poor
communities and local language and cultural conditions. The Government
Page 25
xiv
needs to provide services to schools with a variety of conditions, empower
and motivate local governments, communities and non-governmental agencies
to initiate these innovations and monitor their impact.
Efficiency and Accountability in Education Management and Administration
Resources will have to be better managed if the government wants to achieve
further improvements in access to and quality of education services, given the
already very high overall level of public expenditures. The Government has been
considering some strategic changes at the local, school-level and central levels but
has not fully implemented them.
Local authorities need stronger capacities for decision making, 4.11
supervision and resource allocation to more effectively address the diverse
social and economic conditions of education. These include more consistent
promotion of innovative practices, strengthening the supervision by district
level authorities and strengthening the role of local communities through
improved accountability.
School management needs to be professionalized through training, 4.12
strengthened authority and adjustment of the career patterns in education to
make sure that those become headteachers who are trained and qualified for
the post rather than those who are the most effective or senior teachers
(teaching and school management are two different professions).
District authorities need to be given authority to hire, dismiss and deploy 4.13
teachers and more resources to better supervise their attendance and
performance.
The central Government needs to build capacities to develop and 4.14monitor policies and incentives, assess learning, monitor performance and
guide those responsible for service delivery as it devolves management to
district and school levels.
Improving access to and relevance of higher education
Ghana needs policies to deal with social pressures to increase higher education
enrollment and economic pressures to improve relevance; without these, most social and
economic expectations, and also the Government’s strategic agenda will remain
unfulfilled. Differentiation of the sector is also key to increasing access, widening
participation, increasing relevance, and reducing government spending. It’s also clear that
effective policies require a change in the way higher education is financed and governed,
how institutions and services are managed, and how quality is assured. Already almost
half of the higher education revenues come from non-state resources; it is imperative that
both state and non-state resources are used more strategically. A few policy options may
include the following:
Page 26
xv
Government financing should be more closely linked to performance, 4.15norms, and strategic priorities. The financing of inputs including staff and
other costs based simply on enrollment, and the separation of investments
from recurrent expenditures limit the Government’s ability to stimulate
improved performance or progress along the desired strategic directions.
By the same token, Government financing should also be more targeted to 4.16
meet specific social, economic or other strategic objectives.
Institutions need to have more management authority, responsibility and 4.17
capability to run higher education effectively and efficiently. There are well
tested instruments that can help the improvement of institutional performance
including institutional planning, performance contracts, but also partnerships
with other HEIs or the private sector.
Independent quality assurance, accreditation and performance 4.18monitoring should be established and strengthened, with the participation of
both the academic community and the Government. These processes should
involve members of the international academic community, the business
community, social partners and civil society.
Page 27
1
1. INTRODUCTION, CONTEXT AND ORGANIZATION
1. The purpose of this report is to provide sound analytical foundations for strategic
planning and sector dialogue between education policy makers, development partners and
civil society representatives at a key turning point in the development of education in
Ghana. During the last five years, access has radically improved. As the GOG refines its
economic development and poverty reduction agendas, it has become increasingly clear
that better quality learning and increased educational attainment across the country are
essential part of that agenda. After six years of accelerated growth in the sector, the
Government and the stakeholders have come to the conclusion that an earlier strategic
plan needs to be revised for a number of reasons. Extensive growth seems to have
reached a point after which the scale of education services cannot be stretched too far.
Gross admission rate to primary education is over a hundred percent, gross enrollment
rate at primary level is in the upper 90 percentile, upper secondary provisions reached the
maximum capacity within the available infrastructure, the sector employs about 40
percent of the total civil service and uses about a third of the public budget. In the
meantime, persistent problems (including out-of-school children) and newly emerging
issues (including widening disparities and limited learning outcomes) require new
solutions. Further build-up of the system is unlikely. Attending to the challenges requires
a new definition of performance by focusing on more equitable and more efficient
services, more informed policies and strengthened accountability.
2. The present analysis is an attempt to bring together the key outcomes, the
resource allocations and a strengthened look at equity, efficiency and accountability in
education service delivery. There have been numerous strategic and analytical exercises
about Ghana completed by policy makers, independent experts and development partners.
Most notably, the 2003 Education Strategic Plan was preceded by a wide-ranging sector
review and analysis. Since the ESP, National Education Sector Annual Reports looked at
the sector performance and measured it against benchmarks set in the ESP. These reports
mostly looked at the key outcomes measured through annual school censuses in terms of
enrollment rates, gender parity and inputs including teachers, school infrastructure and
textbooks. However, as noted earlier, further improvements in enrollment, admission
rates, further investments into scaling up education are not possible unless some of the
key challenges are addressed, including equitable and efficient resource allocation and
service delivery, targeted policies and strengthened accountability.
3. Few countries in Sub-Saharan Africa show as much progress in education as
Ghana does. Enrollment has increased sharply; in fact, gross enrollment for primary
education has come to the upper 90 percentile and net enrollment is also near 90 percent.
Enrollment rates at secondary and tertiary levels, although behind the averages of other
continents, are among the top Sub-Saharan averages. Gender parity again at primary level
is almost at the maximum, girls’ education appears to be catching up with boys’. The
public and private investment is unprecedented. A third of the budget, over 10 percent of
the GDP is used for the sector and other progressive policies have been pursued since the
1980s: universal basic education has been gradually extended to cover 6, then 9 and now
11 years including pre-primary years. Fees were eliminated for basic level, a school grant
(“capitation grant”) was introduced to compensate for the fees, school feeding, public
programs for school infrastructure, textbooks, uniforms and supplements for teachers and
Page 28
2
a high profile annual award for the best performing teachers were introduced. The
country was among the first in Africa joining the Education for All movement,
subscribing to the EFA Fast Track Initiative guidelines and developing a long-term
strategy early on that aims to reach the MDG goals by 2015. Education is one of the most
frequently discussed public concern in newspapers, radio and TV programs, next to
politics, the economy and of course sports.
4. Yet, the education sector is under constant pressure from expectations that surpass
the achievements. Budgets are pressured and appear to be out of effective Government
control. Communities, parents and students especially in poor areas have legitimate
concerns with sub-standard schools, missing teachers, botched exams, lacking services.
Despite the investments, many classrooms are still held under trees, many children are
turned away from higher levels of schooling, and many fail completing exams or finding
post-basic or job opportunities.
5. The pressure is well exemplified by the sector’s role and agenda within Ghana’s
poverty reduction strategy, in the Growth and Poverty Reduction Strategy (GPRS) and a
connected multi-donor budget support program (MDBS), which is the major channel for
financial support from external development partners’. As it is universal, and indeed
normal, the education sector has a key role in the GPRS. Also, as expected, the sector’s
MDBS targets are closely linked with the EFA FTI guidelines as well as with the
country’s first EFA-inspired strategy, the 2003 Education Strategic Plan (ESP).
According to the ESP, the education community each year carries out an annual sector
review, looking at the key outcomes, including enrollment and completion rates, gender
parity, the resources used to achieve the outcomes and makes assessment of the sector’s
performance. With connected MDBS, the country has high stakes in this review. If the
country fails to achieve its MDBS triggers, it can lose some critical external funds.
Consequently, each year anxious politicians are watching whether the milestones in
education outcomes, in the resource allocations and in other measures of sector
performance service delivery have been met.
6. The Books, Building and Learning Outcomes, a WB report which was completed
in partnership with the Government in 2004, provided evidence that gains in educational
outputs are directly linked to better school quality, manifested in improved infrastructure
and greater availability of school supplies. It highlighted the importance of textbooks and
school infrastructure in improving test scores and enrollments. Over the last seven years,
since the report was completed, the Government further strengthened its commitment to
Education for All and the Millennium Development Goals and its policy regime through
measures such as the elimination of fees, the capitation grant, further improvements in
infrastructure, textbook supply and in the conditions of teaching, gave rise to a rapid
expansion in enrollment.
7. However, amidst these improvements in inputs and policies and the gradually
increasing demand for education – partly as a consequence of these policies – it is
becoming clear that further progress cannot be achieved by a simple algorithm between
inputs, resources, standards and projected educational outcomes. There are four key
reasons for this development:
Page 29
3
1. Quantitative expansion has brought about persistent and sometimes
worsening quality problems;
2. Aggregate improvements in inputs hide persistent disparities in
resource allocation;
3. Various types of resources have different level of impact in
addressing the disparities in outcomes;
4. The delivery of education services will only improve in the long-
term if services become more equitable, efficient and accountable.
8. Educational outcomes are now also determined by deep-seated social and other
external factors that cannot be easily changed by some short-term well-intended actions
(e.g. gender parity index will not change quickly by carrying out sensitization workshops
or even by distributing bicycles to girls to facilitate commute to schools).
9. Also, the source, scale, allocation and use of resources – physical, human and
financial alike – have reached a level of complexity in which central planning and
decision making can no longer determine how much of these resources allocated and
used, when, where and by whom. Here, too, political, economic and social factors play
roles in where families, students, teachers migrate and where resources move, accumulate
or evaporate.
10. Consequently, sector performance and quality of education service delivery is
driven by complex rules. These rules will require new roles from central and local
decision makers including efficient instruments, new institutional capabilities to make
sure that deep-rooted inequities are addressed, policies and resources are targeted, service
delivery is efficient and those managing services and allocating resources are held
accountable.
11. In the subsequent chapters we address the major challenges facing Ghana in the
service delivery of not only but especially basic education. The report will follow the
following sequence (i) progress in the outcomes during the last decade, with a particular
focus on trends over the period 2001/02-2009/20101, (ii) resources allocated to the sector,
(iii) performance achieved in improving equity, efficiency and accountability, and (iv)
policy recommendations.
A. Demographic and Social Context
12. Projections suggest that the population in Ghana will rise from 23.4 million
people in 2008 to about 29.6 million by 2020, placing large demands on infrastructure
and social services. Demographic trends indicate that over the last 50 years, between
1960 and 2008, Ghana’s population grew on average by 2.6 percent annually. Analysis
1 Upon the completion of the first draft of this report, the Ministry of Education (2010) released aggregate
EMIS data for 2009/10. This data, which is predominately used here in the sections that focus on aggregate
historical trends, shows notable variations on some indicators from previous Government performance
reports and is to be read with caution. However, more comprehensive analysis using disaggregated data
applies 2008/09 data throughout this study.
Page 30
4
conducted by the United Nations Population Division (2009) estimate that Ghana’s
population will exceed 45 million by 2050. In 2008, population growth was approximated
at 2.1 percent. Key determinants of population growth in Ghana are fertility, mortality,
migration and HIV trends – although the prevalence of HIV in Ghana is low compared to
many sub-Saharan countries, affecting 1.9 percent of its population aged between 15 and
49. Ghana’s fertility rate was 4.3 in 2007. About 7.6 percent of all people living in Ghana
are immigrants, some of who emigrated from conflict-ridden countries in the West
African region. In 2007, the number of refugees residing in Ghana reached 35 thousand.
2008 was the first year in which the majority of the world’s population lived in urban
areas. In Ghana, the share of the urban population is estimated at 51.5 percent for 2010,
up from 23 percent in 1960 (UNDP 2009).
13. As in most low-income countries, children and youth represent a very large
proportion of the total population in Ghana. About 40 percent of the total population was
less than 15 years old in 2005. In that year, the median age among the general population
was 19.8 years old. Given the current population structure and growth patterns, this figure
is estimated to reach 21.5 years by 2015. However, Ghana’s development process is
being accompanied by demographic transition, i.e. fertility rates and death rates are
simultaneously falling, as trends since the second half of the last century indicate.
14. Ghana is a politically stable and growing low-income country. Committed to
education, the government has been currently allocating about one-third of public
expenditure to education, and it spends about one tenth of the GDP on the sector. Key
political and economic issues are summarized in the Annex.
15. Prospects of achieving some of the key UN Millennium Development Goals
(MDGs) appear positive. The 1st MDG, which aims primarily to halve 1990 levels of
poverty by 2015, has arguably received the most international attention, technically,
financially and politically. Given favorable political conditions and high economic
growth rates, the number of Ghanaians living under the national poverty line sank from
about half of the population to nearly a quarter, i.e. from 51.7 percent (1992) to 28.5
percent (2006). Thus, current trends in poverty reduction are encouraging and suggest
that Ghana is on track to meet this target by 2015, if not before. The prevalence of
malnutrition among children under 5 years in Ghana is about one in every seven children
(13.9 percent) in 2008, lower than the sub-Saharan average of 26.5 percent and the global
average of 23.1 percent.
Table 1-1: Ghana’s Progress towards Selected Millennium Development Goals 1990 2008
Goal 1: Eradicate extreme poverty and hunger
Poverty headcount ratio, national poverty line (% of population) 51.7 28.5
Poverty headcount ratio at $1.25 a day (PPP) (% of population) 49 30
Poverty gap at $1.25 a day (PPP) (%) 17 10
Income share held by lowest 20% 7.0 5.2
GDP per person employed (annual % growth) -1 4
Employment to population ratio, 15+, total (%) 69 65
Employment to population ratio, ages 15-24, total (%) 40 40
Prevalence of undernourishment (% of population) 34 9*
Malnutrition prevalence, weight for age (% of children under 5) 24.1 13.9
Goal 2: Achieve universal primary education
Page 31
5
Literacy rate, youth female (% of females ages 15-24) .. 76
Literacy rate, youth male (% of males ages 15-24) .. 80
Persistence to last grade of primary, total (% of cohort) .. 83
Primary completion rate, total (% of relevant age group) 61 78
Total enrollment, primary (% net) .. 73
Goal 3: Promote gender equality and empower women
Proportion of seats held by women in national parliaments (%) .. 11
Ratio of female to male enrollments in tertiary education 30 54
Ratio of female to male primary enrollment 84 99
Ratio of female to male secondary enrollment 65 89
Ratio of female to male in primary and secondary education 78.5 95.2
Source: Based on World Bank, World Development Indicators database.
Note: Figures in italics refer to data closest to the year specified; *refers to the year 2005.
16. Although the provision of basic infrastructure and the delivery of social services
are expanding, large gaps in access continue to exist. For instance, one in every five
Ghanaians lacked access to an improved water source in 2006. As a result, twenty percent
of the population remains prone to higher incidences of illness and disease (e.g. typhoid,
Buruli Ulcer and guinea worm infection). Higher disease prevalence is exacerbated by
the fact that the share of the population having access to improved sanitation facilities
was only 10 percent in 2006. Roughly 35 percent of Ghana’s population over 15 is
illiterate and about one in every five children failed to complete the primary cycle in
2008, as data from the World Development Indicators database indicate. Thus, about 20
percent of children fail to acquire the basic competencies which help to lay the
foundation for cognitive development, better economic prospects in life and increase
human capital. Large segments of the population, particularly in rural areas, have
restricted access to markets, a product of the fact that half of all Ghanaians did not have
access to a mobile telephone in 2008 and only about 15 percent of all roads in Ghana
were paved in 2005. Since 1991/92, when less than 30 percent of the population had
access to electricity, accessibility to a power grid line has increased to about 50 percent
by 2005/06 (GLSS). As a consequence, about half of the population lives without
electricity, making it difficult for many children to do homework at night and, among
other things, limiting the efficiency of some agricultural activities (e.g. water irrigation
system).
17. The Human Development Index (HDI) highlights that Ghana has been
progressing and in 2007 ranked 152 out of 182 countries analyzed, placing it thereby as a
country with medium human development (UNDP 2009). Error! Reference source not
found. illustrates that Ghana, with a human development index of 0.53, lies slightly
below the average for the African continent of 0.55. It is important to note that Ghana’s
human development may, in the long-term, be more sustainable than other higher
performing, oil-producing countries such as Equatorial Guinea, Sudan and Angola. In
particular, progress in the education sector offers positive signs for Ghana’s HDI
performance in the short- and long-term.
Page 32
6
Figure 1-1: African Comparison of Human Development Index, 2007
Source: Based on data from UNDP, 2009.
18. With the average person living 56.8 years, Ghana has made substantial progress in
raising life expectancy from about 46 years in 1960 and surpassed the sub-Saharan
average of 52 years in 2008. Improvements in the access and quality of education service,
along with advancements in the health, water and sanitation as well as agriculture sectors,
delivery have played a fundamental role in this progress.
19. The reduction of poverty levels remains a crucial challenge confronting the
Government of Ghana. 51.7 percent of the population lived below the national poverty
line in 1992, but by 2006 the share was nearly reduced in half to 28.5 percent. In contrast,
using international norms, more than half of the population still lives in poverty and
almost a third lives in extreme poverty. The most recent data indicate that 53.6 percent of
Ghanaians live on less than US$2 a day and 30 percent live on less than US$1.25 a day
(UNDP 2009). The highest levels of poverty are heavily concentrated in the three
Northern regions of the country. In the Upper West region, the poverty headcount is such
that about 4 out of 5 people (81 percent) live below the national poverty line, and in the
Upper East region it is about 3 in every four (73 percent) and in the Northern region
slightly more than half of the population (56 percent). In contrast, about 10 percent of the
population in the Greater Accra region lives in conditions below the nationally
established poverty line.
20. Higher incidences of poverty are not only strongly concentrated in the North, but
also in most rural areas of the country, with 39.2 percent of the rural population and 10.8
percent of the urban population living below the national poverty line in 2006.
Geographic as well as socioeconomic disparities pose central challenges in Ghana. In
2006, the poorest 20 percent of the population (lowest quintile) held 5.2 percent of the
country’s income share, whereas the share of the richest quintile reached 48.6 percent.
21. Analysis results throughout this report suggest that the correlates of poverty in
Ghana are closely related to low human capital indicators. Increasing the supply and
demand of education service delivery among poor households could help to promote
social cohesion and economic productivity. However, in the absence of some critical
enabling factors in rural and Northern Ghana, making a greater impact in education
service delivery in these areas will be more difficult.
0.000.100.200.300.400.500.600.700.800.90
Lib
yaS
eyc
helle
sM
aur
itius
Tunis
iaG
abon
Alg
eria
Equa
torial
Gui
nea
Cap
e V
erd
eE
gyp
tB
ots
wan
aN
amib
iaS
out
h A
fric
aM
oro
cco
Sao
Tom
e &
Princ
ipe
Con
go
Com
oro
sS
waz
iland
Ango
la
Mada
gas
car
Keny
aS
uda
nTanza
nia
GH
AN
AC
amero
onM
aur
itania
Djib
outi
Les
oth
oU
ganda
Nig
eria
Togo
Mala
wi
Beni
n
Côt
e d'
Ivoire
Zam
bia
Eritrea
Sene
gal
Rw
anda
Gam
bia
Lib
eria
Guin
ea
Eth
iopia
Moza
mbiq
ue
Guin
ea-B
issa
uB
uru
ndi
Cha
d
Con
go
(DR
C)
Burk
ina F
aso Mali
Cen
tr. A
fric
an
Rep.
Sie
rra L
eon
eN
iger
HIGH MEDIUM LOW
Page 33
7
22. Living standards in Ghana have risen both based on key human development
indicators as well as on levels of income. Gross National Income (GNI) per capita has
increased from US$360 ($470 using PPP) in 1980 to US$670 ($1,430 using PPP) by
2008. While Ghana’s GNI per capita is lower than the sub-Saharan average of US$1,082,
Figure 1-2 illustrates that the level of welfare of the average Ghanaian still surpasses a
number of its sub-Saharan neighbors. Between 1961 and 2008, GDP growth averaged 3.0
percent annually. However, averages are known to hide large economic fluctuations.
Some years the economy retracted such as in 1975, when GDP shrank by 12.4 percent,
while in other years the total market value of all final goods and services produced in
Ghana grew substantially such as in 1970 by 9.7 percent. Since 2000 the gross domestic
product has grown on average by 5.3 percent, reaching 6.2 percent in 2008.
Figure 1-2: Sub-Saharan Comparison of GNI per capita and GDP Growth, 2008
Source: Based on data from the World Development Indicators database.
B. Historical Evolution of Education
23. Ghana has been considered to have had a solid and respected tradition in its
education system in Africa and beyond. Since the 19th
Century, schools had been set up
and run by local communities and the churches, rather than by colonial powers (Foster
1965). A key driver in the expansion of education was the Christian missionary work,
considering the widening of educational access as a prerequisite for missionary activities.
By 1881, approximately 5000 children attended one of the 139 schools. The first plan to
universalize primary schooling goes back to 1945, the year when the colonial
administration put forth a proposal of a 10-year strategy to attain universalization within
a 25 year period on the basis of modest financial projections (Akyeampong 2007). But
the history of free and compulsory basic education only began in 1951. As a direct
consequence, primary enrollment in the sector jumped by more than sevenfold, growing
from 153,360 (1951) to 1,137,495 (1966) primary students over a 15 year time span
(Hayford 1988:35). During this period of rapid expansion, the lesson was that widening
access and improving quality are to be carried out in unity in order to reap the benefits of
education (Akyeampong 2007), still a very valuable imperative in Ghana today.
24. In 1952, five years before full political independence of the country, the Ghanaian
government, by then exercising limited self rule under the British, announced the
introduction of fee-free primary education under an Accelerated Development Plan for
Education. At the time Ghana obtained independence in 1957, it was repeatedly viewed
as a country having a viable educational sector, especially in a regional comparison. In
0
400
800
1200
1600
2000
Leso
tho
Nig
eria
Sudan
Sao T
ome
and
Prin
cipe
Seneg
al
Cot
e d'
Ivoi
re
Kenya
Benin
GHAN
A
Gam
bia, T
he
Tanza
nia
Zambi
a
Guine
a
Com
oros
Burkina
Fas
o
Cha
d
Uga
nda
Mal
i
Mad
agasc
ar
Rwan
da
Ethiopi
a
Mal
awi
Togo
Moz
ambi
que
Sierra
Leo
ne
Cen
tral A
frica
n Rep
ublic
Nig
er
Eritre
a
Guine
a-Biss
au
Burun
di
Libe
ria
GN
I p
er
cap
ita
-2
0
2
4
6
8
10
12
GD
P g
row
th
GNI per capita, PPP (current international $) GDP growth (annual %)
Page 34
8
that era, international institutions such as the World Bank (2004a) and UNESCO
commonly held Ghana’s education system to be the best in Africa. The 1961 Education
Act was introduced to reinforce the commitment to free primary education. However, in
the late 1970’s, the Ghanaian economy and consequently the education system retracted
due to institutional mismanagement and poor economic policy (Akyeampong 2006).
Between 1976 and 1983, the proportion of GDP allocated to the education sector sank
from 6.4 percent to about 1.5 percent (World Bank 2004a). As a result of scarce financial
resources, textbooks and other school materials became in short supply, school
infrastructure deteriorated and the necessary data for strategy planning and policy
purposes were not compiled anymore (Akyeampong 2006). In the years following 1975,
when over 2.3 million children attended primary schooling, sector-wide deterioration led
to a decline in over one million enrolled children by the early eighties (World Bank
2004a). Thousands of Ghanaian teachers were lured to Nigeria by more attractive
wages.(Akyeampong 2007).
25. With support from the World Bank (WB) and International Monetary Fund
(IMF), the Government of Ghana (GoG) in 1983 launched the Economic Reform
Program (ERP). Soon thereafter, in 1987, the Government launched a major reform of
the education system, again with heavy involvement of the WB. The 1987 education
reforms were intended to improve access, raise quality, increase vocational content for
secondary curriculum, lower costs and increase cost recovery for secondary and tertiary
education.
26. In the 1990s, in response to the Jomtien Declaration, GoG launched a new
program focusing primarily on access, the Free, Compulsory and Universal Basic
Education (FCUBE) program. Over the 15-year period from 1987 to 2002, the WB and
other donors provided close to US$ 600 million in soft loan and grant financing to
support the series of reform programs in education. In the mid-1990s, IMF and WB
designated Ghana as a Heavily Indebted Poor Country (HIPC), one of 41 countries
worldwide in need of special assistance to foster economic growth and reduce poverty by
means of channeling debt repayment to key development sectors including education and
health. To qualify for assistance, each HIPC country needed to prepare a Poverty
Reduction Strategy Paper (PRSP). Ghana submitted its “Growth and Poverty Reduction
Strategy” (GPRS), updated four years later as GPRS-II, and began receiving HIPC
funding in 2003, through a series of one-year projects (Poverty Reduction Strategy
Credits, or PRSCs) from WB. Starting in 2007, HIPC funding is being phased out, and a
new “enhanced” modality for debt relief, the Multilateral Debt Relief Initiative (MDRI),
is gradually replacing HIPC funding.
27. As will be seen later, a key factor in education policy as well as in the evaluations
of the sector’s performance is the supply of qualified teachers. In the little over twenty
years since 1987, this supply has showed two different storylines. While between 1987
and 1997 the pupil to trained teacher ratio, the number of students per teacher with formal
qualifications, gradually decreased by about 20 percentage points for primary as well as
for junior secondary (called junior high school since 2007) levels, since then it has lost
more than what it gained, in fact, it lost over thirty percentage points at primary levels.
The underlying logic is that decent economic growth and a reduction of the poverty rate
lured a large number of children into the school system, increasing admission rates
Page 35
9
sharply. The supply of qualified teachers could not keep up with the growth in student
numbers and the Government substituted unqualified teachers for qualified ones. As it
will be seen later, while this substitution maintained a relatively solid trend of improved
access, it negatively affected other performance indicators and increased disparities in
inputs (geographical, social and gender) and in educational outcomes.
Figure 1-3: Trends in Share of Trained Teachers in Primary and JHS, 1987-2008
Source: Based on RECOUP; EMIS. Note: The indicated year reflects the beginning of the academic year.
28. At the same time, the eleven major donors that support education have been trying
to move away from the traditional modality of project support and to assist development
in the country through the provision of budget support within the framework of a rolling
Medium Term Expenditure Framework (MTEF). Ghana’s MTEF is updated annually to
cover the next three-year period. Through an instrument known as the Multi-Donor
Budget Support (MDBS), participating donors release funds when satisfied that certain
key development indicators (“triggers”) have been met. Budget support of this kind is
intended to lower transaction costs, by eliminating the need for multiple reporting
requirements by the government and duplicative supervision activities by the donors.2
29. The other new development of particular relevance for Ghana’s education sector
has been the Catalytic Fund of the EFA Fast Track Initiative (FTI), discussed above. To
qualify for FTI funds, a country has to prepare a credible strategy for achieving EFA
goals by 2015 and demonstrate the existence of a funding gap. Ghana prepared its
Education Strategic Plan (ESP) in 2003. The local donors endorsed the plan and made a
recommendation to the FTI partners for funding. Ghana was given an initial grant of
US$ 33.2 million, disbursement of which began in 2005 and by the middle of 2008 had
reached a cumulative total of US$ 19 million. FTI funding is supposed to be flexible –
2 HIPC, MDRI and MDBS funding have impacted [possible to indicate in a phrase HOW this funding has
impacted the sector? E.g. by providing an incentive for GoG policy makers to do more to meet donor
priorities in the sector?] on Ghana’s education sector, given that about 20 percent of the external funds
flowing to the Government via these mechanisms are notionally earmarked for education. Of course, in a
strict sense, “budget support” comprises money paid into the general revenues of MoFEP and cannot, by
definition, be earmarked, but the real world is generally more complicated. In the case of DFID’s
commitments to MDBS, these flows are, in fact, linked to expenditures on education, and while it is true
that money in the overall budget is fungible, DFID’s MDBS disbursements could be counted as part of
education’s total allocation from the budget. When one of the 2007 MDBS triggers (primary education’s
share of the education budget) had not been met, DFID temporarily suspended its disbursements to GoG
through MDBS.
5760
6469 69
8073
61
6965 63 61
58 5653
49 48
6872
76
87 84
7479 79
75 73 71 7168 65 65
778066 71
777579
65
7274
76
83
0
10
20
30
40
50
60
70
80
90
100
87' 88' 89' 90' 91' 92' 93' 94' 95' 96' 97' 98' 99' 00' 01' 02' 03' 04' 05' 06' 07' 08'
Primary
JSS
Page 36
10
able to respond to demonstrated need. If Ghana can demonstrate effective use of the
funds, additional funding might be made available.
30. As part of the ESP, Ghana established the National Education Sector Annual
Review (NESAR), a regularly scheduled meeting to review performance in the sector.
The Department of Planning, Budgeting, Monitoring and Evaluation (PBME) in MoE
compiles an annual Education Sector Performance Report (ESPR) and presents this at the
review, which is held in about June of each year, to other staff in the Ministry and the
Ghana Education Service (GES), as well as to education donors and other stakeholders,
for discussion and deciding on priorities for the coming year.
31. In a parallel track, largely independent of the ESP (which is arguably a donor-
driven document), in 2001 the new Government (after the elections in 2000) set up an ad
hoc Education Reform Review Committee (ERRC) to re-examine the “goals and
philosophy” of Ghana’s education system. In late 2002, the Committee released its
report, “Meeting the Challenges of Education in the Twenty-First Century.” This led to
the issuance of the “White Paper of the Report of the Education Reform Review
Committee” in 2004, to the establishment of the National Education Reform
Implementation Committee (NERIC) in early 2007, and to the launch of the National
Education Reform Program (NERP) later in 2007. The parallel development of the ESP
2003 and the NERP was finally brought into a coherent track through the 2009 ESP that
defined a single financing plan for 2010-2020.
C. Organization, Structure and Normative Framework
32. The 1992 Constitution of Ghana ensures comprehensive provision to education.
The right of every Ghanaian to education is laid out in Article 25 of the Constitution:
“Basic education shall be free, compulsory and available to all”. However, legislation
needs to be complemented by sustainable and well targeted policies, such as the
capitation grant paid to schools, school feeding program, provision of textbooks and
uniforms, incentives for improved teaching, management and supervision, salary
supplements for teachers and cash transfers to the needy, all of which need to be targeted,
monitored and adjusted as necessary. There is no enforcement of Article 25; when
deciding whether or not to send children to school, families take into account indirect and
opportunity costs such as registration fees, transport expenses and school uniforms,
which are a greater burden for the poor and for the extremely poor in rural, remote
locations. In addition, legislation mandates that all forms of secondary education are to be
made generally available and accessible to all Ghanaians, especially through the
progressive introduction of free secondary education. It is stipulated that higher education
is to be made equally accessible to all Ghanaians based on capacity, and its provision
without fees should be progressively promoted. As regards to functional literacy, the
Constitution specifies that it should be ‘encouraged or intensified’ to the extent this is
possible.
Page 37
11
Table 1-2: Structure of Ghana’s Education System Years Appropriate
Age
Level of
Education
Academic Focus
1 4-5 Kindergarten
Bas
ic E
du
cati
on
(fre
e, c
om
puls
ory
and
un
iver
sal)
2 5-6
3 6-7
Primary Basic Literacy, Numeracy, Science
and Social Studies
4 7-8
5 8-9
6 9-10
7 10-11
8 11-12
9 12-13
Junior High
School
English, Math, Social Studies,
Science,
Technical, Vocational, Agricultural
Courses
10 13-14
11 14-15
12 15-16
Senior High
School Up
per
Sec
ond
ary Specialization in Grammar,
Technical,
Agricultural, Vocational,
Apprenticeship Program
13 16-17
14 17-18
15 18-19
Tertiary
University, Polytechnic, Technical
University, Professional Institutes,
College of
Education, Teacher Education
16 19-20
17 20-21
18 21-22
Source: Based on the content of this report.
33. Structure of the education sector. The structure of the pre-tertiary education
system of 6,4,7 had been replaced by the 1986 education reform program with a 6,3,3
system, in turn reducing pre-tertiary education from 17 to 12 years (World Bank 2004a).
By reducing the duration of pre-tertiary education, these policy reforms led to improved
transition rates and school efficiency. By 2002, the Government adopted a new system
that included two years of pre-primary schooling. As of 2009, the formal school system
in Ghana follows a 2-6-3-3-4 structure: 2 years of kindergarten, 6 years of primary, 3
years of junior high school, 3 years of senior high school and typically 4 years of
university level education. The decision to transfer to a four year senior high system was
taken in September 2008. As a result, the new fourth year of SHS was officially planned
to begin in September 2011. However, as of August 2009 the Ministry of Education made
public that they had plans to readopt the three year SHS system. This planned extension
to a four year system would have caused a roughly one-third increase in enrollment in
senior high school, needing the rise in the recurrent costs of about 30 percent and further
pressures on the already constrained SHS infrastructure.
Page 38
12
2. EDUCATIONAL OUTCOMES: ACCESS, LEARNING
AND RELEVANCE
A. Coverage and Access at Various Levels3
34. According to the Ghana Demographic and Health Survey (2009), the average
Ghanaian female has completed 7.2 years of education, while males completed 8.5 years,
in rural areas females completed 5.1 years and men 7.4 years, in urban areas 8.5 years for
women and 9.3 years for men. Education attainment for urban men is almost fifty percent
more than for rural women. In the Northern region, the education attainment of men is
0.9 years and for women is as low as 0.1 years.
Figure 2-1: Median Years of Education Completed in 2008, by Female/Male
Source: Based on data from Ghana Demographic and Health Survey, 2009. Note: Figures are based on
weights applied by DHS.
35. In the meantime, according to the same survey, 21.2 percent of the female
population and 13.3 percent of the male population have never received education, 30.8
percent of women and 19.9 percent in rural areas and 10.9 percent among women and 5.6
percent among men in urban areas. The share was the highest in the Northern region,
with 65.7 percent of women and 48.4 percent of men with no education; as it is expected,
the share of those without education is the highest at 60 percent among women in the
bottom quintile.
3 If any data is used throughout this report without citation it is administrative data from either EMIS or
ESPR, unless otherwise indicated. National sources of data are derived from:
• Education Management Information System (EMIS);
• Education Sector Performance Reports (ESPR), adjusted data;
• District education expenditure data;
• Payroll data;
• GLSS;
• Demographic and Health Survey.
Any adjustments to administrative data such as in the Education Sector Performance Reports are made by
the MOE, which for instance give non-responding schools district averages. Other sources of data are
referenced respectively.
0
2
4
6
8
10
12
15-2
4
15-1
9
20-2
4
25-2
9
30-3
4
35-3
9
40-4
4
45-4
9
Urb
an
Rur
al
Wes
tern
Cen
tral
Gre
at. A
ccra
Volta
Eas
tern
Ash
anti
Bro
ng A
hafo
Nor
ther
n
Upp
er E
ast
Upp
er W
est
Lowes
t
Sec
ond
Middl
e
Four
th
Highe
stTo
tal
Age Residence Region Wealth Quintile Total
FemaleMale
Page 39
13
Figure 2-2: Share of the Population without Education in 2008, by Female/Male
Source: Data based on Ghana Demographic and Health Survey, 2009.
36. Even though gross enrollment rates in primary are relatively high in Ghana (94.9
percent in 2008/09), the prospects of children in the poorest quintile never having gone to
school are about 10 times greater than those of children in the richest quintile. If a child
lives in a rural area, its chances of not having attended school are over three times higher
than an urban child. A rural girl from the poorest quintile is 13.9 times more likely to not
have attended school than an urban boy from the richest quintile. As enrollment rates
increased rapidly over the last decade, educational disparities have decreased during this
period, strongest in terms of gender inequalities, followed by North-South differences
and then those related to welfare levels, and trends indicate that disparities are likely to
continue decreasing.
Figure 2-3: Share of children who have never attended school, by background
characteristics
Source: Based on data from Ghana Demographic and Health Survey, 2003.
37. Household and school survey data, shown in Table 2-1, support the view that a
large portion of parents (45.9 percent) and head-teachers (78.2 percent) believe that the
(in-)direct and opportunity costs of schooling are the central cause of non-attendance in
school. While nearly half of parents indicate that economic factors influence the decision
to not send their children to school, about a quarter (22.4 percent) state socio-cultural
factors, i.e. they do not value the importance of education especially for girls. About 7
percent of parents point to geographic factors associated with school distance and to low
0
10
20
30
40
50
60
70
15-2
4
15-1
9
20-2
4
25-2
9
30-3
4
35-3
9
40-4
4
45-4
9
Urb
an
Rur
al
Wes
tern
Cen
tral
Gre
at. A
ccra
Volta
Eas
tern
Ash
anti
Bro
ng A
hafo
Nor
ther
n
Upp
er E
ast
Upp
er W
est
Lowes
t
Sec
ond
Middl
e
Four
th
Highe
stTo
tal
Age Residence Region Wealth Quintile Total
Female
Male
14.9 13.6
19.7
6.3
37.8
3.9
0
5
10
15
20
25
30
35
40
Female Male Rural Urban Poorestquintile
Richestquintile
Page 40
14
school quality. Yet nearly all parents who point to costs as the main hurdle to attendance
live in remote and difficult-to-reach areas, underscoring geography as a principal
determinant. Data on parents, who were asked why their children (between ages 6 and
21) stopped attending school, illustrated that: 37.1 percent stated because of not doing
well at school, 35 percent cannot afford school and/or their children need to work at
home, 4.1 percent do not value education, for 3.1 percent of parents school was too far or
the quality too low, and the remaining 20.6 percent indicated ‘other’ reason (World Bank
2004a). Although policies such as the capitation grant4 have been adopted since this data
was collected, it is likely that these causes still largely reflect the barriers facing the
remaining out-of-school population.
Table 2-1: Reasons for children not attending and stopping to attend school, percent
Reason for children’s
non-attendance in school
Reason for children
stopping to attend school
Primary
school head-
teachers
Households
(parents)b
Households
(parents)b
Parents cannot afford/children need to work at home 78.2 45.9 35.0
Parents do not value education 11.3 22.4 4.1
School too far/low quality 2.1 7.1 3.1
Other 8.4 24.5 20.6
Not doing well at school a a 37.1
Total 100 100 100
No. of surveyed 417 289 97
Source: Based on data from World Bank, 2004a. Note: a. The question ‘not doing well at school’ was not
included in the reasons for children’s non-attendance in school, therefore percentages still total 100 percent.
b. Only children aged between 6 and 21.
38. The prototypical, most disadvantaged child would be a girl coming from a very
poor household living in a rural area of the Northern region. In terms of enrollment and
completion, throughout Ghana’s pre-tertiary system geographical inequalities tend to be
the most important barriers, followed by but closely associated with socioeconomic
disparities. Poor students, especially at higher levels of basic schooling, have much fewer
education opportunities. In districts falling into the richest quintile, net enrollment in JHS
(i.e. the ratio of correct-age enrollment to the school age population) averaged 60.5
percent, whereas at the other end of the socioeconomic spectrum, districts in the poorest
quintile had an average junior high NER of 30.9 percent.
Table 2-2: Pre-tertiary GER, NER and Completion, by Gender, Region and Quintile
Percent Indicator
GER NER Completion Rate
Pri
ma
ry
JH
S
SH
S
Pri
ma
ry
JH
S
SH
S
Pri
ma
ry
JH
S
SH
S
National 94.9 80.6 33.9 88.5 47.8 17.7 86.3 75.0
By gender
Boys 97.0 83.9 36.7 89.6 47.9 18.0 89.3 79.7
Girls 92.8 77.0 30.8 87.4 47.7 17.4 83.2 70.1
Parity Index (girls/boys) .96 .92 .84 .98 1.00 .97 .93 .88
4 The capitation grant is analyzed in more details later in the report.
Page 41
15
By region
Ashanti 96.0 84.0 41.8 90.0 43.0 22.6 86.0 84.0
Brong Ahafo 99.0 78.0 33.1 92.0 41.0 15.2 85.0 73.0
Central 1.07 96.0 50.1 96.0 70.0 29.5 99.0 93.0
Eastern 95.0 78.0 47.7 86.0 44.0 26.3 83.0 75.0
Greater Accra 1.05 90.0 21.1 86.0 64.0 12.9 97.0 81.0
Northern 92.0 63.0 25.5 81.0 31.0 10.5 79.0 56.0
Upper East 95.0 69.0 20.3 81.0 27.0 8.3 83.0 62.0
Upper West 99.0 75.0 25.7 79.0 35.0 7.8 84.0 60.0
Volta 93.0 75.0 35.1 86.0 42.0 15.7 83.0 70.0
Western 99.0 84.0 27.4 93.0 47.0 15.2 92.0 75.0
Parity index (North./Central) .86 .66 .51 .84 .44 .36 .80 .60
By level of welfare quintile
Q1 (poorest) 95.0 67.4 80.9 30.9 81.3 58.5
Q2 94.0 70.9 85.5 36.7 79.7 66.4
Q3 99.1 80.1 92.7 43.7 88.1 76.8
Q4 94.7 84.2 88.5 46.4 86.3 81.2
Q5 (richest) 103.5 91.1 90.9 60.5 95.7 84.4
Parity index (poorest/richest) .92 .74 .89 .51 .85 .69
Source: Calculations based on EMIS 2008/09 and GLSS 2005/06.
39. Ghana ranked 102 out of 128 countries analyzed in 2007, which was classified as
low in UNESCO’s (2010) EFA Development Index (EDI). The EDI is calculated using
the arithmetic mean of its four components: primary adjusted net enrollment rate (73.3
percent), adult literacy rate (65 percent), gender-specific EFA Index (89.6 percent) and
survival rate to grade five (88.6 percent). These results confirm that although much
progress has been achieved in the education sector over the past years, Ghana is still
lagging behind internationally.
40. In the following section, we will analyze changes in educational access, transition
and completion, by education levels.
Access to Kindergarten
41. The Government introduced two years of kindergarten, also known as preschool,
on a voluntary basis in 2002. Since 2007, formal basic education encompasses an 11-year
cycle, two years of kindergarten, followed by six years of primary, then three years of
junior high school (GOG 2004). Nationally, gross enrollment in kindergarten has
expanded enormously. Ghana provides now higher pre-primary coverage than the vast
majority of sub-Saharan countries and even several high-income Arab states (UNESCO
2008). Since 2002/03, when only 21.8 percent of children had access to kindergarten
schooling, the gross enrollment rate increased to 97.3 percent by the school year 2009/10,
translating into an annual 10.8 percent growth rate over this period. Yet the net
enrollment rate remains troubling low; only 63.6 percent of children of the official age
group (i.e. 4 and 5 year olds) had access to kindergarten schooling in 2008/09.
Page 42
16
Table 2-3: Trends in Kindergarten Enrollment5
2001/02* 2002/03 2003/04 2004/05 2005/06 2006/07 2007/08 2008/09 2009/10
Total 702,304 769,199 687,643 778,109 1,065,963 1,142,784 1,262,264 1,338,454 1,440,732
GER 21.8% 54.6% 60.1% 85.3% 89.0% 89.9% 92.9% 97.3%
NER 19.0% 34.4% 38.5% 50.0% 55.8% 62.6% 63.6%
Boys 355,385 389,478 320,939 369,019 498,524 552,995 632,421 671,822
Girls 346,919 379,721 316,176 362,312 500,295 551,784 626,062 666,632
Source: EMIS. Note: *GER and NER data are not available for 2001/02.
42. The share of private sector enrollments has declined over the past years, mostly in
parallel with the implementation of the policy which made KG part of compulsory basic
education. However, this trend indicates that the twofold expansion of the public
enrollments was achieved through some private kindergartens becoming public, which
made them eligible for the capitation grants, which were introduced in 2005. Many
private programs were simply attached to public schools. However, these newly public
KG programs are seriously short of publicly paid teachers leading to large disparities in
pupil teacher ratios.
Figure 2-4: Trends in Kindergarten Enrollment, Private/Public
Source: EMIS.
Access to Primary Education
43. Between 2001/02 and 2009/10 enrollments in primary education experienced
sharp growth by about 1,284,673 or 50.9 percent. Yet in spite of this surge in
enrollments, a considerable portion of children don’t attend school, repeat a grade, drop
out before completing or simply don’t make it to junior high schools.
5 Depending on the data source and methodology used, respective data values may vary. In this chapter on
access, EMIS census data is used over the years 2001/02-2002-3, for which no adjustments are made.
EMIS data for 2003/04-2009/10 are derived from administrative performance reports, which are adjusted
such that non-reporting schools receive the district average, which could lead to possible overestimates. It
is also important to note that there is the likelihood that some schools report higher GERs than actual
values as the amount of capitation grant funding received, which is per capita based, is higher for schools
with higher reported gross enrollment rates.
457597516734
453561 482251
807369
896522
10789731016606
244,707 252,084183,554
249,080191,450 208,257 241,877 259,481
0
200,000
400,000
600,000
800,000
1,000,000
1,200,000
2001/02 2002/03 2003/04 2004/05 2005/06 2006/07 2007/08 2008/09
Public Private
Page 43
17
Table 2-4: Trends in Primary Education Enrollment, public and private, boys and
girls 2001/02 2002/03 2003/04 2004/05 2005/06 2006/07 2007/08 2008/09 2009/10
Total 2,586,434 2,524,585 2,686,133 2,929,536 3,122,903 3,365,762 3,616,023 3,710,647 3,809,258
Public 2,113,749 2,121,740 2,196,774 2,328,324 2,647,616 2,824,407 2,990,773 3,041,895 3,099,234
Private 472,685 402,497 489,359 601,212 475,287 541,355 625,250 668,752 710,024
% of Private 22.4% 19.0% 22.3% 25.8% 18.0% 19.2% 20.9% 22.0%
Boys 1,359,150 1,323,518 1,403,913 1,525,548 1,606,178 1,732,162 1,860,289 1,908,232
Girls 1,227,284 1,201,067 1,282,220 1,403,988 1,516,725 1,633,600 1,755,734 1,802,415
% of Girls 47.45% 47.57% 47.73% 47.93% 48.57% 48.54% 48.55% 48.57% 48.7%
% of Girls in Private
48.70% 48.70% 48.80% 48.70% 49.40% 49.30% 49.50% 49.50%
Source: EMIS.
44. Ghana has a consistently high share of private enrollment in primary education.
It is estimated that in sub-Saharan Africa eight percent of all primary students are enlisted
in private schools, compared to about 22 percent in Ghana. The share of the private sector
actually grew to 25 percent by 2004/5, after which private provision dropped to 18
percent from which it gradually increased to the present level of 22 percent. A study in
the Ga district found that school fees on a monthly basis ranged on average from about
US$4 in unrecognized private schools to about US$7 in recognized schools for the early
primary grades (Tooley 2005). The private sector’s expanding coverage area in rural
areas has, as Akyeampong (2008) notes, taken place largely in areas where the majority
are not employed as subsistence farmers who tend to be poorer, but rather employed in
the fishing and trading industries.
Table 2-5: Trends in Primary Enrollment, Private/Public
Source: Based on EMIS data.
Grade specific enrollment trends
45. The following figure also shows changes in enrollment in primary education. The
trend shows sharp increase for first grade in 2005 at the introduction of the capitation
grant, a contraction in 2007 at the same grade at a time when inflation started to
depreciate the grant value. The introduction of the capitation grant, in the meantime, had
no impact for later grades and even negative ones for the 6th
grade. Transition throughout
primary levels and ultimately completion of the primary cycle has not improved over
time and has even gotten worse since the introduction of the capitation grant, suggesting
the grants have not been large enough to cover the costs of educating ever-growing
numbers of pupils, not to mention to improve quality and implement measures (like
smaller classes, tutoring, etc) to improve transition and completion.
2,121,740 2,328,324
3,041,895
472,685 402,497 489,359
475,287541,355
625,250 668,752
2,990,773
2,824,4072,647,616
2,196,7742,113,749
601,212
0
500,000
1,000,000
1,500,000
2,000,000
2,500,000
3,000,000
3,500,000
4,000,000
2001/02 2002/03 2003/04 2004/05 2005/06 2006/07 2007/08 2008/09
Public Private
Page 44
18
Figure 2-5: Evolution of Primary Enrollment 1980-2008, by Grade
Source: Akyeampong 2009 based on EMIS.
46. Enrollment and Admission Ratios: Between 2001/02 and 2009/10, gross
enrollment grew from 80 percent to about 95 percent. During the same period net
enrollment progressed at an average rate of 3.1 percent per year, increasing from 59
percent to 83.6 percent.
Table 2-6: Trends in Primary Enrollment, Admission and Gender Parity Index 2001/02 2002/03 2003/04 2004/05 2005/06 2006/07 2007/08 2008/09 2009/10
GER 80% 75.7% 86.50% 87.50% 92.10% 93.70% 95.20% 94.9% 94.9%
NER 59% 55.9% 55.6% 59.10% 69.20% 81.10% 83.40% 88.5% 83.6%
GAR 89.4% 92.3% 103.2% 107.3% 102.9% 101.3%
NAR 26.2% 61.7% 69.1% 74.3% 72.1% 71.1%
GPI 0.93 0.93 0.93 0.96 0.96 0.96 0.96
Source: EMIS.
Box 2-1: Abolition of school fees compensated by capitation grants
The impact of the ‘Free Compulsory Universal Basic Education’ (FCUBE) reforms
adopted in 1996 was mitigated by the reduction of public funding as schools began
levying indirect school fees, i.e. registration fees, uniforms, textbooks etc. The
government adopted capitation grants in the academic year in 2004 in 40 deprived
districts and scaled up to all regions in 2005. The capitation grant had a significant effect
on first year admissions (see table above on GAR for 2006). However, this increase was
almost fully counterbalanced by increasing dropouts and limits in learning outcomes (to
be discussed later). Altogether, the effect of capitation grant on net enrollment was an
increase of slightly more than 2.2 percent, but the effect on deprived districts was not
significant given the high level dropout and prevalence of overage enrollment.
0
100000
200000
300000
400000
500000
600000
700000
800000
19
80
19
82
19
84
19
86
19
88
19
90
19
92
19
94
19
96
19
98
20
00
20
02
20
04
20
06
20
08
en
rolm
en
t
Year
P1
P2
P3
P4
P5
P6
Page 45
19
Figure 2-5: Capitation grant’s impact on trends in primary net enrollment
Source: UNESCO 2008 based on Fredriksen 2007; Gershberg and Maikish 2008.
47. A Gross admission rate greater than 100 percent (that is, admission into primary
1), together with a relatively low net admission rate underscores a widespread problem of
late entry: about 30% of P1 enrollment is made of children older than the appropriate age
category. As late as in 2004/05, overage children represented more than 70 percent of the
first year admissions.
Figure 2-6: Trends in Primary GER and NER
Source: Based on EMIS data.
48. Official gender parity index has been relatively high and improved to .96 by the
end of the decade. The percentage of girls enrolled has always been high and is even
higher in private schools. Only a select few sub-Saharan countries have reached or nearly
reached gender parity in primary education, among them are Ghana, Namibia, Tanzania
and Botswana (UNESCO 2007).
80% 76%
87% 88% 92% 94% 95% 95%
59% 56% 56% 59%
69%
81% 83% 89%
0%
20%
40%
60%
80%
100%
2001/02 2002/03 2003/04 2004/05 2005/06 2006/07 2007/08 2008/09
GER
NER
Page 46
20
Figure 2-7: Country Comparison in Primary Net Enrollment and Gender Parity,
2007
Note: Gender parity in primary is measured using gross enrollment ratios.
Source: UNESCO 2010:65.
49. However, these indicators do not show some key factors leading to lower girls
participation in junior high school education (to be discussed below), including the high
initial admission but higher dropout and lower survival rate up to P6. Higher incidences
of girls’ non-attendance in schooling tend to be concentrated within rural and
economically deprived areas of the country, a phenomenon strongly affecting the North.
Indicators of internal efficiency: completion, dropout, repetition and the key causes
50. Completion rate in Ghana is relatively high but not high enough for achieving the
MDG goals. School census data on the completion rate for the latest year (2009/10)
indicate that it reached 87.1 percent, which represents a 9.2 percent increase from 77.9
percent in 2003/04.6 Different methodologies also show differing results. According to
6 This report uses the methodology set by the Ministry of Education for calculating the completion rate
based on enrollment into the 6th
grade divided by the 11 year old population. Thus, students who repeat are
not calculated and the share of completers would drop by several percentage points. [UNCLEAR]
Page 47
21
the WDI, 77.7 percent of students completed primary education. Although this is high in
SSA, it still doesn’t make achieving the MDG goal likely.
Figure 2-8: Sub-Saharan Comparison of Primary Completion Rate, 2008
Source: Based on World Bank, World Development Indicators database.
Note: Completion rate is based on the share of the relevant age group.
Table 2-7: Primary Education, Completion, Repetition and Dropout
2001/02 2002/03 2003/04 2004/05 2005/06 2006/07 2007/08 2008/09 2009/10
Total 2,586,434 2,524,585 2,686,133 2,929,536 3,122,903 3,365,762 3,616,023 3,710,647 3,809,258
Completers 998,849 2,305,545 2,360,915 2,695,975 3,091,699
Comp. rate 77.9 78.7 75.6 85.4 88.0 86.3 87.1
Comp. rate girls 74.0 75.1 72.4 79.6 82.4 85.5 84.3
Repeaters 177,330 148,518 152,726 170,777 135,288 197,520 243,625 139,820
Rep. Rate 6.9 5.9 5.7 5.8 4.3 5.9 6.7 3.8
Leavers 130,645 453,214 626,700 472,267 280,699
Dropout Rate 4.9 15.5 20.1 14.0 7.8
Source: EMIS.
51. There has also been significant disparity between boys and girls completion rate.
We note that the radical improvement reflected in girls’ completion rate in 2008/09 is
statistically improbable; this level of improvement would have required more girls to
complete P6 in 2008/09 than the number of girls enrolled in P5 in the previous year. By
2009/10, the share was 84.3 percent.
52. Completion rate, according to the EMIS data, would have to grow by 2.3 percent
annually to reach UPC by 2015. Historical evidence has shown that linear growth
projections may be unrealistic. As UPC nears, improvements in completion are more and
more difficult. Children living in extreme poverty and in geographically isolated settings
tend to drop out first as they expected to contribute to household income generation, girls
taking care of younger siblings, and children with special needs.
111.7
77.7 75.669.0
54.7
37.130.5
0.0
20.0
40.0
60.0
80.0
100.0
120.0
Tanza
nia
GHAN
A
Sao T
ome
and
Prin
cipe
Gam
bia, T
he
Libe
ria
Burkina
Fas
o
Cen
tral A
frica
n Rep
ublic
Page 48
22
Table 2-8: Progress towards education related MDGs
Year
Predicted
for 2015
2003/04 2008/09 Low High
Goal 2: Universal Primary Education
Net enrollment ratio in primary 59.0a 88.5 100 100
Primary completion rate, total 77.9 86.3 91.3 96.4
Primary completion rate, girls 74.0 85.5 92.4 99.3
Adult literacy rate 53.4 62.0c 69.5 77.1
Goal 3: Promote gender equality and empower women
Ratio of girls to boys in primary 93.0 96.0 97.8 99.6
Ratio of girls to boys in lower secondary 88.0 92.0 94.4 96.8
Ratio of girls to boys in upper secondary 76.0b 80.0 84.0 88.0
Ratio of girls to boys in tertiary 47.0 49.0c 50.8 52.5
Note: Predictions for 2015 are based on simple extrapolation, assuming growth rates over the period are
sustained for high scenario and that it is halved for low scenario. a. Indicate data for 2001/02; b. for
2005/06; c. for 2007/08.
Source: Based on EMIS data.
53. In 2005/06, dropout in primary education rose to 20.1 percent as the new
capitation grants allowed schools to accept more students, many of them older and less
prepared to study.
54. Some of the underlying factors were overcrowded classrooms and more pupils per
trained teacher, mostly an impact of the capitation grant being adopted in 2005 and the
subsequent explosive jump in enrollment numbers. By 2007/08, the dropout rate in
primary had reduced to about 7.8 percent. Among the 6-11 year old children who
dropped out of primary, more than 30 percent of these dropouts did so after they
completed the 1st grade, as data from the Core Welfare Indicators Questionnaire indicates
(GSS 2003). While enrollments have been consistently on the rise, a real challenge seems
to be in reducing early drop out, but also overage enrollments and repeaters. To ensure
that fewer children abandon the school system, it is pivotal to get a student into primary
school (but also higher levels) at the appropriate age, since being overage places
incremental pressure on the student to begin working and generating income. Data
collected from household surveys show that in Ghana more than 60 percent of children in
primary are older than the expected age for their given grade (UNESCO, 2008; GDHS,
2003). Girls appear to be dropping out more than boys in deprived districts relative to non
deprived.
55. What are the determinants of dropout? At the primary level, those who drop out
tend to come disproportionately from rural settings and poorer households, and be girls.
As survey data suggest, how well students perform in class, is the most influential
ingredient in completing school. As we will see in more detail throughout this report,
various interlocking risk factors influence the decision to drop out, including late
enrollment, poor teaching and learning outcomes, past short-term withdrawals, repetition,
low attendance, poor school facilities and infrastructure, overcrowded classrooms, early
entry into the labor force, illness and malnutrition, gender, geographic remoteness and
economic deprivation. It is therefore necessary to address both school-specific aspects
Page 49
23
and household and community related issues, in order to reduce drop out but also high
absenteeism and repetition and to tackle other inefficiencies, topics we turn to later.
56. Patterns among primary repeaters. Over the past seven years, the primary
repetition rate has fluctuated between 6.9 percent (2001/02) and 3.8 percent (2008/09),
reaching its lowest point in the last year for which data is available. However, data
reliability is questionable and clear trends are difficult to decipher. For P1 alone, EMIS
data indicate as high as 20 percent for both repetition and dropout rates over the past few
years.
57. Being overage (older than the age corresponding to the grade level) is a key cause
of repetition and dropout. Figure 2-9 shows that the age-grade profile in primary is
considerably wide – especially between 3rd
and 6th
grade. In 2008/09, a large majority of
students in primary 6, about 84 percent, were older than the appropriate age: about 60
percent were 12 to 14 years old (i.e. JHS official age) and about a quarter (24 percent)
were 15-17 years old (i.e. SHS official age). Overage students, who, either begin late,
repeat often or undergo a combination of the two, are the most likely to later drop out,
most commonly due to labor demands in the community.
Figure 2-9: Public Primary Schools in 2008/09, by Age-grade
Source: Akyeampong 2009 based on EMIS.
58. In a comparative analysis of over twenty sub-Saharan countries, Ghana had the
smallest share of new entrants into primary education who were of the normal age in
2005 as the new capitation grants allowed schools to accept more students, many of them
older and less prepared to study. Only about one third of new entrants into primary are
six years olds, less than one third are 1 year over-age and over one third are 2 or more
years older than the normal age Figure 2-10 illustrates that not enrolling at the normal age
is a systemic and pervasive problem facing Ghana’s school system and society, at large.
Survey data indicate that poor rural boys are more likely to be two years over-age or
more when entering primary 1. In contrast, countries such as Mauritius and Tanzania
have been very successful in ensuring enrollment at the normal age (UNESCO 2007:43).
0
.05
.1.1
5.2
.25
De
nsi
ty
5 10 15 20age
P1 P2
P3 P4
P5 P6
Page 50
24
Figure 2-10: Share of new entrants to 1st grade who are at least 2 years over-age, by
background characteristics
Source: Based on the Ghana Demographic and Health Survey, 2003.
59. In addition to completion, dropout and transition rates, school attendance is also a
critical factor in access.. No official administrative data on school attendance exists in
Ghana, for both students and teachers. But case studies suggest that student attendance
rates may be very low. Using household survey data, a study carried out by the World
Bank (2004a) found that primary students attended class on average 82.5 percent of the
instruction time and junior high school students only 78.7 percent. Another investigation
using one year attendance records for more than 100 primary schools reported that
students attended four out of five days (80 percent), (Fobih et al. 1999).
Access to Junior High School Education
60. About 90 percent of primary 6 pupils transition to JHS (grades 7 to 9). Since
basic education is compulsory and seen as an essential part of basic public services, its
fee-free structure has helped in tearing down some but not all of the economic barriers to
accessing education at the level of JHS. Since a selection examination at the end of
primary schooling is no longer mandatory, all students, in principle, completing primary
6 can progress to JHS.
61. Enrollment numbers in JHS are on the rise. JHS has become one of the fastest
growing types of services. Enrollments rose from about 866,000 students (2001/02) to
1,302,000 (2009/10), resulting in a 50.4 percent increase over this period. As a
consequence of rapidly opening access to primary education, JHS enrollment figures will
potentially experience similarly rapid growth in the coming years.
62. The share of private enrollments has slowly increased but their proportion and the
growth rate is slower than at primary level. There hasn’t been a significant increase in the
proportion of girls who, like at primary level, represent a higher proportion of enrollment
in private JHS-s.
42.9 48.3 47.5
41.6
53.7
30.4
47.9 50.5 45.8
0102030405060
Page 51
25
Table 2-9: Trends in JHS Enrollment, Private/Public and Boys/Girls
2001/02 2002/03 2003/04 2004/05 2005/06 2006/07 2007/08 2008/09 2009/10
Public 741,895 740,753 773,982 822,205 883,060 952,151 1,015,489 1,064,088 1,075,036
Private 123,741 124,455 145,352 188,041 157,942 180,167 208,521 221,489 226,906
private % 14.29% 14.38% 15.81% 18.61% 15.17% 15.91% 17.04% 17.23% 17.43%
Total 865,636 865,233 919,334 1,010,246 1,041,002 1,132,318 1,224,010 1,285,577 1,301,940
Boys 468,514 468,934 498,786 548,156 557,261 605,086 652,146 685,099
Girls 397,122 396,299 420,548 462,090 483,741 527,232 571,864 600,478
girls % 45.88% 45.80% 45.74% 45.74% 46.47% 46.56% 46.72% 46.71% 47.0%
% of Girls in Private 48.6 48.6 48.5 48.1 48.6 49.2 49.3 49.3
Source: Based on EMIS data.
63. As fast as the JHS sector has grown, it also reflects some of the most typical and
persistent problems in education in Ghana. These include disparities in access by gender,
geographical location, wastage and inefficient use of resources (to be discussed later).
64. Despite increasing, enrollments in JHS remain relatively low; about one in every
five children in Ghana is excluded from junior high schooling. Gross enrollment in JHS
has increased from 64 percent (2001/02) to 79.5 percent (2009/10), indicating progress
but also that much more focused efforts need to be taken to come closer to the goal of
universal access to basic education. Quite significantly, the net enrollment rate has
contracted since 2004/05. This indicates that the elimination of the fees and introduction
of the capitation grant brought a large number of overage youth back in the system.
Educating these groups brings about its own challenges (as discussed below).
65. Gender parity, although improved, remains persistently low. When very poor and
rural households have to decide between girls’ schooling and their services at home or
their contribution to generate household income, girls’ education opportunities tend to be
“sacrificed.” When girls do remain in school, sexual violence can drive them to drop out.
An analysis of gender violence conducted in Ghana found that many female students
reported that older male students and teachers make sexually aggressive gestures towards
them. It also found that teachers commonly do not question acts of boys’ sexual
harassment towards girls (Leach 2006).
Table 2-10: Trends in enrollment to junior high school education
2001/02 2002/03 2003/04 2004/05 2005/06 2006/07 2007/08 2008/09 2009/10
Total 865,636 865,233 919,334 1,010,246 1,041,002 1,132,318 1,224,010 1,285,577 1,301,940
GER 64% 63.4% 70.2% 72.8% 74.7% 77.4% 78.8% 80.6% 79.5%
NER 30% 36.9% 29.5% 70.3% 74.5% 52.4% 53.0% 47.8% 47.8%
GPI 0.88 0.88 0.93 0.91 0.92 0.92 0.92
Source: EMIS.
Enrollment trends by grade show significant increase in dropout between grades 2 and
grades 3 and a widening of the gap since 2003.
Page 52
26
Figure 2-11: Enrollment Trend in JHS 1980-2008, by Grade
Source: Akyeampong 2009 based on EMIS.
66. The net admission rate to JHS 1 remains very low, even though the gross and net
admission rates have to some extent begun to converge since 2004/05. From that year net
admission has grown from 12.2 percent up to 43.6 percent by 2008/09.
Figure 2-12: Gross and Net Admission Rates in JHS 1
Source: Based on EMIS.
Internal efficiency measures, completion, dropout, repetition.
67. A third of all children fail to complete junior high school. Even though this
represents a rapid improvement over the last six years, it stills keeps universal basic
education, a key Government priority, in the far distance.
Table 2-11: JHS Completion, Repetition and Dropout
2001/02 2002/03 2003/04 2004/05 2005/06 2006/07 2007/08 2008/09 2009/10
Total 865,636 865,233 919,334 1,010,246 1,041,002 1,132,318 1,224,010 1,285,577 1,301,940
Repeaters 35,242 28,156 37,550 47,963 38,051 53,183 54,544 40,233
Rep. Rate 4.1 3.3 4.1 4.7 3.7 4.7 4.5 3.1
Leavers 348,570 356,135 192,010 344,261 340,812
Dropout Rate 37.9 35.3 18.4 30.4 27.8
Completers 533,214 606,148 810,941 734,874 828,654
Comp. Rate 58.0 60.0 77.9 64.9 67.7 75.0 66.0
Source: EMIS.
0
100000
200000
300000
400000
500000
19
80
19
83
19
86
19
89
19
92
19
95
19
98
20
01
20
04
20
07
Total Enrolment inM1/JS1 (Public &Private)
Total Enrolment inM2/JS2 (Public &Private)
Total Enrolment inM3/JS3 (Public &Private)
75.60% 76.60% 77.30% 80.20% 84.60%
84.60%
12.20%
25.30% 28.80%
44.60% 43.60%
0.00%
10.00%
20.00%
30.00%
40.00%
50.00%
60.00%
70.00%
80.00%
90.00%
2003/04 2004/05 2005/06 2006/07 2007/08 2008/09
GAR NAR
Page 53
27
68. As is the case in primary, the trend within junior high classrooms is a wide range
of children of different ages in any given grade. Figure 2-13 reflects the wide age-grade
profile in JHS. Principally due to late primary starters and issues of school inefficiency
and associated high repetition rates, the vast majority of the junior high school age
population (i.e. 12-14 year olds) is attending primary school. In 2008/09, approximately
60 percent of students in primary 6 were between 12 to 14 years old. Also, while trends
over time indicate that gross admission in junior high school is slightly on the rise, net
admission has stagnated at low levels of about 44 percent over the past few years. It is
also important to note that about 85 percent of students in JHS 3 were 15 to 17 years old
(i.e. senior high school official age), of which many are unlikely to start SHS.
Figure 2-13: Public JHS in 2008/09, by Age-grade
Source: Akyeampong 2009.
69. A key factor limiting JHS completion is the high dropout rate. It went from 37.9
percent (2003/04) to 27.8 percent (2007/08), averaging 30 percent over the past years. It
has nonetheless remained constant at around 340 thousand students annually through the
period. Dropout from JH School has a strong gender component. In both deprived and
non-deprived districts girls drop out consistently more than boys. Dropout appears to be a
particularly strong phenomenon in the Northern region, where most deprived districts are.
70. The key to achieving UBC is not only arresting the contraction of net enrollments,
but also controlling repetition and dropout. Some of the factors contributing to attrition
include low learning attainment and high absence rates. Student absenteeism is associated
poverty and the indirect costs of schooling, as well as with geographic conditions such as
distance and difficulty accessing the school. Distance however seems to be slowly
0
.1
.2
.3
.4
Density
10 12 14 16 18 Age
JSS1 JSS2 JSS3
Page 54
28
becoming less of a problem due to the construction of new school buildings and
infrastructure development.
Box 2-2: A Case Study of the Causes of School Dropout in Northern Communities
A study conducted by Ampiah et. al. (2009) surveyed 89 children aged 7-16 who had
dropped out of school within one of six communities in the Savelugu-Nanton district
(Northern region). Nearly half of the examined children (about 47 percent) left school in
primary 1-3 and about a third (35 percent) in primary 4-6, while the remaining children
(18 percent) dropped out in JHS. Hence, about four in every five children examined (82
percent) abandoned the school system while in primary. Study findings show that
multiple and interlinking causes led to the decision to drop out: “Mainly they are factors associated with child labor, poverty, death of parent, fosterage, poor
performance in school, parental lack of interest in formal education, pregnancy, teacher attitudes
to children, distance from school, persistent learning difficulties, corporal punishment, poor
attendance, and repetition” (Ampiah et. al. 2009).
A series of events with several of such interlocking factors increases the likelihood of a
child to drop out of school, more so than one individual incident or factor. These
variables don’t predetermine that a child leaves school, but they increase the probability
that a child is at risk of dropping out. The underlying cause most commonly identified for
dropping out, accounting for about one third of all children examined, was a high
prevalence of poverty and child labor. All of these poor and working children also
indicated several or all of the above cited risk factors. Thus, reducing the indirect costs of
schooling and increasing the pro-poor targeting of subsidies and programs, e.g. the
capitation grant, could help to continue deterring some children from entry into child
labor. In addition, local education authorities could adopt a more flexible school
operation schedule, as Ampiah et. al. (2009) note, in order to adapt to household needs
during agricultural periods, i.e. allow children to provide family assistance on farms
during times of harvest.
Every child surveyed was overage for the respective grade when they dropped out,
strongly emphasizing the need for community sensitization to ensure that parents enrol
their children into primary 1 at the proper age. Nearly all examined students (about 94
percent) cited having difficulties in learning. Children frequently referred to physical
abuse (about 65 percent of those analyzed) as one of the most horrific and reoccurring
incidences in school, in spite of legislation abolishing corporal punishment. What also
unmotivated children is when teachers were absent from class instruction. To that end,
more effective teacher monitoring is needed through PTAs, frequent visits from circuit
supervisors and ensuring head teachers register teacher attendance. Consequently, the key
to reducing the number of children at risk of dropping out seems to be both in adopting
policies and practices by school administration and local governing bodies aimed at
minimizing risk factors, as well as in reducing the opportunity costs of schooling and
raising school demand by increasing the impact of pro-poor targeting schemes (Ampiah
et. al. 2009).
71. For 15-18 year olds who have only completed primary education, the prospects of
transitioning to junior high school become significantly diminished at each higher age,
Page 55
29
given external factors such as increased pressures to generate income. In junior high
schools, only 24 percent of 8th
grade students were the appropriate age (i.e. 13) or below
at the end of the 2000s. Empirical evidence shows that primary students who are at least
3 years overage perform poorer on English examinations in comparison to other students
within the proper age range (Akyeampong 2009a). A wide age-range in a given grade
presents obstacles for teachers trying to mediate core subject matter to children and youth
with large variations in learning capacity, interests and, amongst others, levels of
maturity (see also Akyeampong 2007).
72. Passing four core subjects of the Basic Education Completion Examination
(BECE) is the key requirement of a successful transition from JHS. As shows, out of
those admitted to JH1 (the first year of JHS), about 71 percent reaches the last year, 10
percent doesn’t take the BECE exam and 26% fails at least one subject, leaving about one
third of those admitted to JHS who pass the BECE with eligibility to continue at senior
high school level.
Figure 2-14: Student flow in 2008/09
Source: Illustration based on EMIS data and WAEC examination records. Note: *reflects data from
2007/08; enrolment data is used where no data is available for admission rates.
Primary GAR 102.9% NAR 72.1%
Repetition 3.8
Dropout
7.8*
Completion
rate 86.3%
(no exit exam) 90% of P6 pupils transition to JHS
10% of P6 pupils do not transition
to JHS
Repetition
3.1
JHS GAR 84.6% NAR 43.6%
Reach JH3 - 71%
Take BECE (exit exam) 61%
Pass the 4 core subjects – 35%
Fail at least 1 - 26% Don't - 10%
Don't - 29%
WASSCE (exit exam)
pass rate in the 4 core subjects 74%
SHS GAR 35%
WASSCE
26% don't pass Tertiary GER 6%
Kindergarten GER 92.9% NER 63.6%
Page 56
30
Access to Post-Basic Education: Senior High Schools and Technical Training
Institutes
73. 2.40 Throughout the decade the Government maintained a strategic priority to
expand post-basic education with the dual purpose of improving the livelihood of people
and boosting the human capital to reach middle-income status for the country. However,
this strategic priority is being pursued through two different but somewhat overlapping
agenda:
74. the expansion of formal post-basic school based programs that link basic
education and tertiary education into a coherent school system with appropriate
regulation of curriculum, transition from one level to the next and planning the necessary
resources to meet the goal and the reform and expansion of formal and informal TVET
programs to partly address the social agenda of improving livelihoods while advancing
the economic agenda of providing skills to improve employment and productivity.
Access to Senior High School Education
75. Currently, the transition rate from JHS to SHS is around 35-40 percent. Annually,
approximately 100,000 junior high school students fail the leaving examinations taken by
all students in the third and last year, known as the Basic Education Certificate
Examination (BECE). This has driven many students to repeat or even drop out. Among
those students who pass the BECE -- used also as an entrance examination to continue
onto SHS -- only about half actually go onto to senior high school. While gross
enrollment in JSH reached 79.5 percent, about a third of youth were enrolled in senior
high schools in 2009/10. With an expansion in SHS enrollments from about 328,400
students (2003/04) to about 537,300 (2009/10), upper secondary has been taking in on
average nearly 34,800 new students per year, largely thanks to the increase in private
sector provisions. In terms of cumulative expansion, enrollment in SHS grew 64 percent
since 2003/04, a rate well above that of population growth over this time span. Between
the academic years 2006/07 and 2007/08, the senior high system experienced a decline in
enrollment figures, although it appears to have recovered.
Page 57
31
Table 2-12: SHS enrollments
2003/04 2004/05 2005/06 2006/07 2007/08 2008/09 2009/10
Total 328,426 333,002 384,455 485,742 454,681 490,334 537,332
GER 26.6% 25.6% 29.1% 35.8% 32.2% 33.9% 36.1%
GAR 1 33.3% 31.5% 35.0% 39.4%
Source: EMIS.
76. During 2003/04 and 2009/10 gross enrollments grew annually at a rate of 1.6
percent on average, having increased from 26.6 to 36.1 percent.
77. UNESCO comparative data looks at secondary education and Ghana’s total gross
and net enrollment rates for secondary education are estimated at 49 and 45 percent and
significantly higher relative to sub-Saharan Africa averages (32 and 25 percent
respectively)
Figure 2-15: International Comparison in Total Secondary GER and NER, 2006
Note: Secondary schooling refers to lower and upper secondary education.
Source: Based on UNESCO, 2008.
78. Figure 2-16 shows that among countries with a similar Gross National Income
(GNI) per capita, which have net enrollment data available, Ghana has the highest total
secondary NER at 45 percent (UNESCO 2008), in spite of it being the second income-
poorest country with a GNI per capita of US$670 (World Bank 2009).
76
65
54
50
49
43
35
32
32
32
30
15
11
56
54
42
45
35
26
25
30
9
0 20 40 60 80
Botsw ana
El Salvador
India
Kenya
GHANA
Lao DPR
Comoros
Nigeria
SSA
Benin
Pakistan
Chad
Niger % of Total
Secondary NER% of Total
Secondary GER
Page 58
32
Figure 2-16: International Comparison in Secondary NER and GNI per capita
Note: GNI data is for 2008, while NER data is for 2006. Secondary schooling refers to lower and upper
secondary education.
Source: Based on data from UNESCO, 2008; World Bank, 2009.
79. The increasing demand for SHS education is met with limited supply. The
increasing access to basic education has increased demand for post-basic education,
especially for the senior high school (SHS) programs. In turn, the increasing education
opportunities in SHS tends to boost enrollments at basic level, as the prospects of
accessing SHS serve as incentives. Altogether, there is a relatively high and persistently
increasing demand to access SHS programs. Almost all students successfully passing the
four core subjects of the BECE exam attempt to continue at SHS level, though only half
find a place at SHS.
80. To assure a level playing field, since 2007 admission into SH Schools has been
regulated by a computerized central system by which students are asked to rank their 6
preferred schools and admission is granted or denied according to the student’s BECE
results and the schools’ minimum standards. Applicants are normally expected to enroll
at 15 years of age in the SHS, which is made up of 3 years, and upon successful
completion, to sit the West African Senior Secondary Certificate Examination
(WASSCE. Results of the examination are very important for admission into university
and students with insufficient grades are given the possibility to re-sit the WASSCE in
December.
81. There are only 493 public senior high schools in Ghana, unevenly distributed
across the territory, which can only accommodate 78% of BECE passers, although
entrance also depends on performance on students. The three best served regions:
Ashanti, Eastern and Volta account for close to half of the schools in the country. The
public sector had about half of all senior high schools in urban areas and the other half of
public SHS-s are in rural communities. Meanwhile, 73.4 percent of the private senior
high schools are located in rural areas (26.6 percent in urban areas), trying to fill the gap
in demand and supply there. This is an interesting finding, because it is often the contrary
in other countries.
0
5
10
15
20
25
30
35
40
45
50
0 200 400 600 800 1000 1200 1400
GNI per capita (US$)
Seco
nd
ary
Net
En
rolm
en
t R
ate
Niger
GHANA
Lao DPR
Kenya
Pakistan
SSA
Nigeria
Page 59
33
Access to the Technical and Vocational Training Institutes
82. Ghanaians pursuing technical and vocational education or training can either
attend public programs offered through Technical Training Institutes (TTIs) that extend
from junior secondary through to post-secondary, administered by the Ghana Education
Services, or participate in a broad variety of private and public programs. They can
choose from formal and non-formal, school-based, community-, or enterprise-based
training programs. A new inter-governmental institution, the Council for Technical and
Vocational Education and Training (COTVET) is responsible for creating a coherent
qualification and certification framework that would span the various training forms.
COTVET is also responsible for establishing a coherent database for all training
providers, participants and activities.
83. There are approximately 200 public TVET institutes, including the 26 TTIs under
the Ministry of Education (MoE), 137 other institutions under the Ministry of
Employment and Social Welfare and the remainder under different other ministries. The
26 TTIs under the MoE accounted for about half of total enrollments at public TVET
institutes in 2007/08. With regard to enrollment per institute, the MoE technical training
institutes are far larger than other public training institutes; the average number of
trainees in a TTI was 642, compared to 330 in the Opportunities Industrialization
Centers, 181 in the National Vocational Training Institutes (NVTI), 147 in the
Community Development Vocational/ Technical Institutes and about 70 in both the
Youth Leadership and Skills Training Centers and the Integrated Community Centers for
Employable Skills (ICCES).
84. The majority of the enrollment in public TVET is male trainees; for example only
16.7 percent of the 18,432 TTI trainees are female, and about 26 percent of the 6,710
NVTI trainees are female. However, the Community Development Vocational/ Technical
Institutes and the Opportunities Industrialization Centers have more female than male
trainees: 73% of 3,520 trainees and 55% of 1,010 trainees are females respectively.
85. At all pre-tertiary education levels, the gender gap has been closing in Ghana, but
the gap is still much larger and the pace slower at the TTIs. Female enrollment in TTIs
saw an increase of 32 percent between 2001/02 and 2006/07, while male participation in
TTIs contracted by 13.7 percent over this period. In spite of these evident strides in
closing the gender gap due to diminishing male attendance, female students constituted
less than one in every five students in 2006/07. In addition, the relationship between
levels of welfare and non-attendance in technical and vocational education is such that a
Ghanaian from the poorest quintile is seven times less likely to have vocational education
than a Ghanaian from the richest quintile.
Table 2-13: Enrollment in Technical Training Institutes
2001/02 2002/03 2003/04 2004/05 2005/06 2006/07 2007/08 2008/09 2009/10 % increase
over period
Total 17,934 19,777 18,672 21,424 20,303 18,432 17,210 17,280 20,694 13.3%
Male 15,603 17,060 15,889 18,440 16,933 13,467 -13.7%
Female 2,331 2,717 2,783 2,984 3,370 3,081 32%
% Female 13% 13.7% 14.9% 13.9% 16.6% 16.7% 22%
Parity Index .15 .16 .18 .16 .20 .23 35%
Page 60
34
Source: EMIS.
86. Enrollment in public TVET institutes has been declining over the last few years.
For example, total enrollment in the TTIs was lower in 2006/07 than in 2004/05. In the
NVTI total enrollment 2005-2007 fell by just less than 10% from 7,297 to 6,710.
87. Information on internal efficiency, measured by drop-out and completion rates, is
not routinely collected by the majority of training providers. What evidence there is
suggests that somewhere between 10-30% of trainees drop out of training annually, and
this implies completion rates for a four-year course of between 24% and 65%.
88. The 2008 Education Management Information System (EMIS) report included
629 public and private TVET institutions in its database; if there were 200 public TVET
providers, and then the total number of private providers was approximately 430. Total
enrollment in a partial selection of private TVET institutes in 2007/08 was, according to
EMIS 23,452 trainees; however this only represented the enrollment in 143 private TVET
institutions, covered by the EMIS sample.
89. Most formal public and private TVET providers target lower secondary school
(JHS) graduates and sometimes set a minimum aggregate score at the Basic Education
Certificate Examination (BECE) level as an entry requirement. Among all the public
TVET providers, the ICCES appears to be the most accessible; it does not have official
entry requirements and most trainees are JHS graduates with either poor BECE
aggregates of failure at the BECE level. Of the public providers, GRATIS is slightly
different as it offers a variety of training programs targeted at a variety of individuals
90. While entry requirements varying from none to passing of the BECE and even the
Senior Secondary School Certificate Examination (SSSCE), most formal TVET options –
TTIs, NVTIs, and most other public and private vocational training institutes – require
that entrants have completed basic education, and often specify a minimum aggregate
grade prospective trainees are meant to achieve at the BECE level. This automatically
excludes those who were unable to attain this level; most of whom will be the poor or
poorest. Since educational attainment in Northern communities, in particular, can be very
low, access to formal training by Northern youth is further limited. There are some
exceptions of course in both the public and private sectors; e.g. the public Integrated
Community Centers for Employable Skills (ICCES) as well as some private (non-profit)
vocational training institutes often do not have minimum formal schooling or
examination entry requirements. Even though most trainees in formal TVET programs
have completed basic education, many are still functionally illiterate. Informal
apprenticeship training in some trades attracts more educated, and hence usually less-
poor, youth, while other trades attract poorer, less educated ones.
91. The limited numbers of formal training institutions and the distance of these
institutions to communities impede access to people in these communities. Training
institutes are usually urban based, making it difficult for rural youth – and especially the
poor – to attend. The public ICCES centers and some NGO training centers are the
exception to this, being located in more rural areas.
92. Formal VOCATIONAL AND TECHNICAL training has a strong focus on long
duration (2-4 years) pre-employment courses; this period is far too long for many poor
families to pay the costs associated with training for their child and to pay the opportunity
Page 61
35
cost of their child being out of the labor market. The provision of short or modular
courses by formal INSTITUTIONSs remains very limited.
Access to Special Education
93. According to the Education Sector Performance Report (2009) it is estimated that
5 percent of Ghana’s population has some form of disability. Sight problems are
recognized as the most prevalent at about 59 percent, followed by hearing and speech
impediments. There are significant disparities between rural and urban areas in the
willingness and frequency of recognition of children with special needs and the
facilitation of these children to attend a school.
94. Enrollments in institutions of special education have grown by 87.7 percent from
3,361 students (2001/02) to 6,308 students (2008/09). In 2001/02 there were about twice
as many boys attending school as girls but the share of the female population improved
slightly to 40.4 percent by 2008/09.
Figure 2-17: Enrollment Trends in Special Education, Male/Female
Source: Based on EMIS. Note: *Due to a data discrepancy an adjustment has been made.
95. Various studies generally estimate that at least half of the children with special
needs are out of school and for many of such children who are in school their special
needs remain unrecognized. A simple visit to regular classrooms, especially in remote
areas, reveals that in Ghana there are very few children wearing glasses and none using
hearing aids. In Ghana, there are societal prejudices towards children with disability. The
importance of providing them with an education is typically undervalued by communities
and, they commonly receive less attention from teachers when they attend school. There
is a need for greater awareness among families about these children’s potential in life.
(Ministry of Education 2008a).
Non-Formal Education
96. In Ghana, the adult literacy rate was 62 percent in 2007/08. Non-formal
education’s principal goal in Ghana is to improve adult literacy and gender parity among
graduates of the National Functional Literacy Program. Data on the program in 2003/05,
the last year for which information on graduates and dropouts are available, shows that of
3,361
4,114 4,203 4,4354,722
5,092
5,654
6,308
2,1122,617 2,666 2,821 3,004
3,3153,760
1,2491,497
1,769 1,901 2,0882,339 2,5482,509*
1,694
0
1,000
2,000
3,000
4,000
5,000
6,000
7,000
2001/02 2002/03 2003/04 2004/05 2005/06 2006/07 2007/08 2008/09
Total Male Female
Page 62
36
the 182,037 learners recruited, a total of 141,769 graduated from the program (78
percent), while the remaining 22 percent dropped out. Recruited learners were taught by
about 7,281 facilitators in that same year, most of whom conducted the classes for at least
300-400 hours and the attendance rate among the learners was at least 70 percent of this
time (ESPR 2009). About 202,500 people were recruited for the program in 2006/07,
while 13 percent dropped out. Trends over time (Table 2-14) show that between 140,000
and 250,000 Ghanaians graduate from the Literacy Program on an annual basis, equipped
with necessary literacy tools for many jobs in today’s labor market. Since 1995, the
overwhelming majority of the enrollees, i.e. 78-88 percent, graduate yearly from the
program.
Table 2-14: National Functional Literacy Program
1995/97 1996/98 1997/99 1998/00 2000/02 Feb 03/05 Nov 03/05 Jun 05/Mar
07
Jan 06/Oct 07
Learners Recruited 209,226 219,299 207,325 187,550 196,170 312,907 182,037 272,357 202,500
Graduated 175,431 175,383 180,554 163,781 172,453 249,118 141,769 232,761 176,683
Dropout Rate .16 .20 .13 .13 .12 .20 .22 .15 .13
Source: EMIS.
97. Since 1992, about two million youth and adults have graduated and benefited
from the Literacy Program. It should be stressed that the vast majority of these graduates
have been women, to this effect, aiding to close the gender gap in literacy. With an
estimated increased intake of about one million additional learners to the program
between 2009-2015, the demands on training 40,000 new facilitators will have to be
complementarily addressed (ESPR 2009).
B. Learning Achievement
98. Access, enrollment, completion and transition are important but only intermediary
steps towards an educated society and knowledge-based economy. The real target is
learning, acquiring competencies and skills that help the individuals, the communities
and the society at large. Yet, it is not easy to gain an accurate and reliable picture about
how effective is the education system in achieving desired learning outcomes and achieve
improvements in these from year to year. Ghana’s experience, described below, in line
with a large majority of countries, shows that improvements in access put pressure on
effectively achieving learning outcomes across various social groups and communities. It
is also a more or less universal rule that schools and education are not able to overcome
some initial levels of differences in abilities and learning skills, much of which is
determined in the early childhood environment by such factors as the education and
income levels of parents. Further, schools often inadvertently exacerbate initial
differences, helping good performers strive and letting others fall further behind.
99. International tests repeatedly show that overall performance of education systems
can be measured by the strength of the average achievers, i.e. the proportion of those who
achieve just acceptable level of proficiency as it is defined by national or international
standards. This middle group constitutes a key part of the productive workforce, stable
consumers with regular income, who participate in and often decide elections, and who
maintain social cohesion. While it is almost inevitable and indeed desirable that a
professional and intellectual elite emerges from education, the real challenge for
Page 63
37
education systems is to keep to a minimum the range of underperformers at risk of falling
to the margins of society.
100. The goal is, therefore, to expand the share of those students who achieve average
‘acceptable’ results. 7 If that share is big enough, few students fall through the cracks. On
the other hand, those systems where a good share of the students perform on the top and
another large share of the students perform poorly, typically hide large inefficiencies and
masses of students who are in school but benefit very little from their education.
Education strategies should aim (i) to keep most of the education performers above (even
if just) the minimum level of proficiency and (ii) gradually improve this minimum level
of proficiency without letting more students fall behind. In the Ghanaian context, policy
makers can rely on a number of national and international tests to assess the system’s
performance.
Primary School
101. In a relatively small sample over 1700 3rd
and 5th
grade students in 50 primary
schools were tested on basic reading comprehension and mathematics skills. The test was
tailored to what the students were supposed to know at 3rd
grade. While for instance in
reading comprehension about 40 percent of the students provided correct answers to
about 80 percent of the questions, a similarly large proportion of the 5th
graders provided
less than 18 percent of the answers correctly and only about one third of the students
provided answers between 40 and 80 percent. What this data shows is that while there is
a good number of students on the top and a relatively big number of students on the
bottom, the middle in between is missing. Therefore, the question for Ghanaian policy
makers is what are the characteristics of the groups that have gained access to education
as a result of the last decade of economic growth, decline in poverty and commitment to
education but failed to achieve the learning outcomes that are in line with the country’s
goals to build learned society or at least one where graduates achieve proficiency in basic
skills.
Figure 2-18: Share of Students with Correct Reading Comprehension, 3rd and 5th Grade
7 In international assessments, countries like Singapore, Korea or Finland perform on the top and show the
least internal variations between high and bottom performers.
Page 64
38
Source: World Bank Ghana Survey, 2009. Note: See Annex for key results on the World Bank’s 2009 Ghana Survey.
102. Keith Lewin, of the ‘Consortium for Research on Educational Access, Transitions
& Equity (CREATE), characterizes the phenomenon of students falling through the
cracks by the concept of “zones of exclusion”. These zones include those who don’t get
into the system or drop out early but also those who do not learn and gain access to
further levels of education. According to CREATE, only about 35 percent of all pupils in
primary 1 are not at risk and have secure enrollment, attendance and achievement. By
primary 6 this proportion gradually reduces to about 20 percent, meaning that the
remaining 80 percent of all children are ‘silently excluded’, at risk or have no access at
all. The proportion of Ghana’s youth reaching the 10th
grade who have secure enrollment,
attendance and achievement reduces near to 10 percent.
Figure 2-19: Access and Zones of Exclusion in Primary and Secondary
Source: CREATE 2007.
103. Other learning achievement tests have produced similar outcomes. The National
Education Assessment tests were conducted in 2005, 2007 and 2009 on a nationally
representative random sample of 3.5 percent of Ghana’s primary schools (see NEA
2007:2). To reach the proficiency level, students need to answer correctly to at least 55
percent of the multiple choice questions (from four possible answers). In spite of
progress, learning results remain weak. The proficiency level at primary 3 in 2005 was
16.4 percent in English and 18.6 percent in math. There was an overall increase of 3.6
percent in English proficiency and 6.6 in math proficiency among 3rd
graders over the
period 2005-2009. In 2005, the proficiency level in primary 6 was 23.6 percent in English
and 9.8 percent in math, therefore, registering an improvement of 12 percent in English
and 4 percent in math by 2009. Given the very large overall improvements between 2007
and 2009, concerns may arise about the consistency in methodology of the administered
exams and/or the accuracy of data collection methods.
CREATE Zones of Exclusion
Page 65
39
Table 2-15: Overall NEA Mean Scores, Minimum-competency and Proficiency
2005 2007 2009
Mean Minimum
Competency
Proficiency
Mean Minimum
Competency
Proficiency
Mean Minimum
Competency
Proficiency
English P3 38.1 50.5 16.4 37.6 50.1 15.0 40.2 57.6 20.0
English P6 43.1 63.9 23.6 44.2 69.7 26.1 48.2 76.9 35.6
Math P3 36.6 47.2 18.6 35.0 42.6 14.6 41.8 61.2 25.2
Math P6 34.4 47.2 9.8 35.7 46.2 10.8 39.6 61.9 13.8
Source: NEA 2007; and Ministry of Education 2010.
104. Generally, a country’s education system should strive for 75 percent of children
reaching a minimum competency level (ESPR 2008). However, in the case of Ghana that
benchmark is far from being met. Nearest to the goal is the Greater Accra area; there in
2007, 64.1 percent of primary 6 students achieved minimum competency in mathematics
and 20.2 percent attained proficiency. These two figures at the national level were 46.2
and 10.8 percent, respectively, illustrating the largest regional divide between the Greater
Accra region and all other regions. In Greater Accra, the percentage attaining minimum
competency in English primary 6 was 86.7 percent, while 50.3 percent reached
proficiency in 2007. These two figures at the national level were 69.7 and 26.1 percent.
105. Nationally, girls perform better in English, while boys do so in Math, which is
consistent with most assessment results in other countries.
Table 2-16: Overall NEA Gender Comparisons Primary 3 – English Primary 3 – Mathematics
Mean % % Reaching
Proficiency
Mean % % Reaching
Proficiency
Boys 37.1 14.0 35.4 15.2
Girls 38.1 16.0 34.5 13.9
Primary 6 – English Primary 6 – Mathematics
Mean % % Reaching
Proficiency
Mean % % Reaching
Proficiency
Boys 43.6 24.5 36.1 11.6
Girls 44.8 27.9 35.2 9.8
Source: NEA 2007:17.
106. Disparities in students’ performance based on locality are more pronounced.
While access rates between rural and urban areas are already large, the gap in learning
outcomes appears to be even larger.
Page 66
40
Figure 2-20: Mean NEA scores for both 3rd and 6th grade by gender and by locality
Source: Wodon and Joseph 2010 based on NEA.
107. Children living in more remote, isolated and deprived communities tend to score
lower than their counterparts in urban centers on NEA tests. In addition, 6th
graders in
schools within the Southern areas scored higher on NEA English exams than their
counterparts in more Northern areas. The highest concentration of 6th
graders with low
NEA English scores (38 or below) went to school within districts of the Northern region,
while the highest concentration of students with high scores (44 or above) attended
schools in the districts of Greater Accra. The three districts with the highest NEA English
scores in primary 6 were the Tema district (Greater Accra) with 60 points, the Kumasi
district (Ashanti) with 59 points and the Ga West district (Greater Accra) with 55 points,
while the Saboba district (Northern) with 25 points scored lowest followed by the
Juabeso district (Western) with 26 points and the Zabzugu district (Northern) scoring 27
points.
32
34
36
38
40
42
English Male EnglishFemale
MathematicsMale
MathematicsFemale
NEA Test Score by Gender
3032343638404244464850
English Urban English Rural MathematicsUrban
MathematicsRural
NEA Test Scores by Locality
3032343638404244464850
English UrbanMale
English UrbanFemale
English RuralMale
English RuralFemale
NEA English Test Scores by Locality and Gender
3032343638404244464850
Maths UrbanMale
Maths UrbanFemale
Maths RuralMale
Maths RuralFemale
NEA Mathematics Test Scores by Locality and Gender
Page 67
41
Map 2-1: NEA scores of Primary 6 English in 2007, by district
Source: Based on NEA data.
108. Key resources influencing learning results. A USAID (2009) commissioned study
shows that the strongest relationship between achievement and independent factors are
resource inputs (particularly teachers), location and other school indicators. Table 2-17
shows the proportion of a given resource/input for low, medium and high performing
schools on NEA English assessments of primary 6 in 2007.
109. Hence, high performing schools had over 90 percent trained teachers and 36.4
percentage points more trained teachers than low performing schools. The proportion of
high performing schools in urban settings, with over 5,000 residents, was 72.2 percent
and accessing electricity was 47.3 percent, while the share of low performing schools in
urban areas was 8.5 percent and those with electricity was 9.1 percent.
Map 2-2: Public Trained Primary Teachers and NEA Math P6 Scores
Source: Based on EMIS data from 2008/09 and NEA data from 2007.
Page 68
42
110. Geographic location also appears to be a significant factor influencing
achievement outcomes, since 39.1 percent of high performance schools were within the
four most densely populated districts (Accra, Tema, Takoradi or Kumasi) and only 1.6
percent of low performance schools. In general, primary 6 English students in these four
districts scored 6.3 points higher on the NEA test than their counterparts in the other
districts and the math scores were as much as 15 points higher than the national average
(34). It was also less common among high performing schools for students to dropout
(2.9 percent) than in low performing schools (5.8 percent). In addition, enrollment rates
tended to be greater in high performing schools at 95 percent than in low performing
schools at 66 percent in 2007.
111. As data illustrates, the districts with the poorest performance on NEA, which to
date has only been conducted in 2005 and 2007, were in the Northern regions; scores in
math were 15 points lower than the average and less than half than the top scoring
districts in the country. These districts had a primary PTTR of 150 to 200. In these
remote areas, schools are typically small, with enrollments typically less than 100. This
means that often only every second or third school in the region has a trained teacher.
More than half of students don’t have access to a treated water source, which has been
known to lead to a higher incidence of guinea worm infection and typhoid. The Northern
Savannah, being one of the most deprived areas, affected by droughts, floods and ground
erosion, high transport costs, long distance from markets, low population density. Gender
marginalization remains part of everyday reality. The remoteness of the Northern region
contributes to low teacher motivation to be deployed, compounded with the reality of
major infrastructure deficiencies (as further discussed in the chapter on equity).
Table 2-17: Mean Resource in 2005 and 2007, by Class 6 English Proficiency
Resource/Input
Performance level
2005 2007
LOW MEDIUM HIGH LOW MEDIUM HIGH
Human Resources
Pupil/teacher ratio 41.59 41.76 39.95 36.26 36.99 42.22
% untrained teachers 0.35 0.18 0.16 0.45 0.26 0.09
Physical Resources
Math texts per pupil 0.56 0.58 0.62 0.88 0.91 0.81
English texts per pupil 0.27 0.28 0.40 0.88 0.93 0.81
Seats per pupil 0.83 0.83 0.86 0.88 0.87 0.95
Writing places per pupil 0.84 0.86 0.86 0.89 0.83 0.92
% schools needing major repairs 0.26 0.26 0.15 0.25 0.23 0.18
% schools with meals programs 0.09 0.12 0.13 0.12 0.14 0.08
Library books per pupil 0.59 0.64 0.40 0.76 0.55 0.67
Teacher guides per teacher 3.99 3.65 2.38 2.33 2.57 1.50
% schools with functional toilets 0.52 0.49 0.49 0.54 0.59 0.60
% schools with functional urinals 0.39 0.33 0.35 0.55 0.66 0.58
% schools with accessible drinking water 0.49 0.59 0.52 0.60 0.50 0.64
% schools with electricity 0.09 0.25 0.37 0.09 0.23 0.47
Geographic location
% urban 0.13 0.39 0.69 0.09 0.32 0.72
Page 69
43
% in one of the four largest urban districts 0.01 0.14 0.22 0.02 0.08 0.39
Education Indicator
P6/P1 enrollment 0.85 0.97 1.01 0.66 0.84 0.96
% dropout 0.05 0.08 0.02 0.06 0.04 0.03
Source: Based on data from USAID, 2009.
112. PTR and physical resources had a weak relation to learning, though they do
affect access. In 2007, the pupil teacher ratio was lower within schools performing more
poorly than in higher performing ones (although it is unlikely that the negative
relationship was statistically significant), going against the conventional wisdom that the
lower PTR the better. Indeed, some observers point to negative consequences from hiring
teachers without qualifications. (There is…)“[…] considerable concern among both policy makers and head teachers surrounding
the employment of “untrained” teachers, often individuals hired by District Assemblies, such as
through the National Youth Unemployment Program, or by communities.” (USAID 2009:12).
113. Also, in 2007 low performing schools appeared to have marginally (not
significantly) better access to English and math textbooks per pupil (0.88) than high
performing schools (0.81), although the relationship was the opposite in 2005. Over this
two year time span (2005-2007), the number of mathematics textbooks per student
increased on average from 0.55 to 0.89 and English textbooks per student rose as well
from 0.24 to 0.87. In contrast, according to EMIS, the amount of teacher guides per
teacher declined by nearly 0.5 between these two years.
114. Lower performing schools had almost twice as many teacher guides per teacher as
higher performing schools both years, most likely because of the lack of teachers or the
lack of qualified teachers in these schools. Also, low performing schools disposed of
more library books per pupil (0.76) compared to those with high performance (0.67) in
2007, but also in 2005. Thus, given their relative equal distribution among low- and high-
performing schools, learning and teaching resources overall don’t appear to be directly
related to achievement outcomes.
115. No relation can be observed between schools with functional toilets, potable
water, availability of school furniture and the need of major infrastructure repairs in the
schools on the one hand and improved learning outcomes, on the other. However, some
of these resource indicators have a strong impact on low admission rates and dropout. For
example, schools that lack a water source and sanitation facility are more likely to
adversely affect school participation due to higher prevalence of illness. Therefore, they
also skew the sample of those tested through NEA. In other words, those who would have
performed poorly in the NEA tests because of poor school infrastructure may not have
been in school by the time the tests were carried out as a result of not signing up for
school or being dropped out of school beforehand.
116. The school feeding program’s impact appears to be limited in improving access
and does not seem to lead to increased test scores. One possible reason is that the school
lunches are measured as of 2005 and very few schools had a systematic school meals
program in 2005
Page 70
44
Figure 2-21: NEA test scores and school lunches
Source: Wodon and Joseph 2010 based on NEA.
Junior and Senior High School
117. The Basic Education Certificate Examination (BECE) is a key achievement test in
junior high school, taken by all students in the third and last year and which serves as an
entrance exam to proceed onto SHS. BECE test results are normalized, meaning that the
passing grade is adjusted each year so that roughly 60 percent of examined students pass
the BECE successfully. This also means, that diachronic analysis of BECE results (i.e.
comparing results over more than one year) is not possible. However, variations within a
year and even changes in relative distribution of pass rates by various external factors
(such as geographical location, socio-economic status, gender) are possible.
118. In 2008/09, BECE pass rates were highest in the Greater Accra region (66.9
percent in math and 84.1 percent in English) and the Ashanti region (80.2 percent in math
and 58.8 percent in English). Geographical disparities are significant. The Northern
region had the lowest English pass rate of 39.7 percent, while the Volta region had the
lowest math pass rate of 40.1 percent.
Figure 2-22: Regional BECE Pass Rates in 2008/09
Source: Based on EMIS.
119. In 2008/09, the bottom five performing districts on BECE English exams were all
found within the Northern region. Some external characteristics that schools within these
five poorest performing districts have in common are: remoteness and poor infrastructure,
especially access roads, and scarce postal services, making the region an undesirable
posting choice for teachers.
41.6 41.4 38.6 41.0
35.8 36.6 34.6 35.2
Schoolswith
meals2005
Schoolswithoutmeals2005
Schoolswith
meals2007
Schoolswithoutmeals2007
NEA Test Scores and School Lunches
English
Mathematics
37.1 43.1
35.3 34.8 38.3
44.2
36.2 35.5
NEA Test Scores and School Lunches in P3 and P6 Grades
Schools withmeals 2005
Schools withoutmeals 2005
0.0%
20.0%
40.0%
60.0%
80.0%
100.0%
Math 66.9% 80.2% 65.6% 58.5% 48.4% 47.4% 45.2% 42.8% 41.5% 40.1%
English 84.1% 58.8% 58.0% 60.2% 49.9% 57.5% 50.6% 50.9% 39.7% 54.4%
Science 74.7% 68.9% 59.6% 55.4% 49.3% 52.7% 55.0% 56.0% 50.0% 52.1%
Social Stud. 70.7% 70.6% 61.1% 53.3% 49.6% 52.3% 50.8% 49.1% 40.7% 49.4%
GREATER
ACCRAASHANTI
BRONG
AHAFOWESTERN CENTRAL EASTERN
UPPER
WEST
UPPER
EASTNORTHERN VOLTA
Page 71
45
Map 2-3: BECE English and Math Pass Rates, 2008/09
Source: Based on EMIS data.
120. BECE performance correlates more strongly with the share of trained teachers
than to the degree to which students have access to school materials and basic
infrastructure. BECE results are also not related strongly to the degree of availability of
basic school materials and infrastructure.
Table 2-18: Mean Resource, by class 9 BECE English Pass Rate in 2008/09
JHS Resource/Indicator (National Average)**
Performance level* (BECE pass rate)
LOW (Average
34.8%)
MEDIUM (Average
50.7%)
HIGH (Average
67.0%)
Difference (betw. high
and low)
Human Resources
Pupil/teacher ratio (17.96) 19.34 17.60 16.94 -2.40
Pupil/trained teacher ratio (29.67) 32.96 29.27 26.79 -6.17
% trained teachers (0.63) 0.62 0.62 0.66 0.04
Physical Resources
Core textbooks per pupil (2.08) 2.06 2.16 2.03 -0.03
Seats per pupil (0.79) 0.74 0.83 0.79 0.05
Writing places per pupil (0.77) 0.71 0.80 0.80 0.09
% classrooms needing major repairs (0.24) 0.24 0.23 0.24 0.00
% classrooms needing minor repairs (0.33) 0.36 0.35 0.30 -0.06
% schools with toilets (0.57) 0.49 0.57 0.64 0.15
% schools with accessible drinking water (0.62) 0.58 0.63 0.65 0.07
Education Indicators
GER (0.79) 0.69 0.79 0.88 0.19
NER (0.44) 0.36 0.44 0.52 0.16
GAR (0.83) 0.73 0.82 0.93 0.20
NAR (0.37) 0.29 0.37 0.46 0.17
Completion rate (0.73) 0.65 0.74 0.82 0.17
Repetition rate (0.03) 0.02 0.04 0.03 0.01
Page 72
46
Note: *Of the 138 districts, 46 districts are classified as low performing as to English BECE pass rates
(scoring between 6.6%-44.3%), 46 districts as medium performing (scoring between 44.3%-57.2%) and 46
as high performing (scoring between 57.5%-89.6%). **The indicated national averages are calculated using
district averages and, thus, in some cases may slightly differ from other aggregate data found throughout
this report.
Source: Calculations based on EMIS data.
Table 2-19: Mean Resource, by class 9 BECE Math Pass Rate in 2008/09
JHS Resource/Indicator (National Average)**
Performance level* (BECE pass rate)
LOW (Average
33.44%)
MEDIUM (Average
53.63%)
HIGH (Average
78.27%)
Difference (betw. high
and low)
Human Resources
Pupil/teacher ratio (17.96) 18.70 18.01 17.16 -1.54
Pupil/trained teacher ratio (29.67) 30.15 29.97 28.90 -1.25
% trained teachers (0.63) 0.65 0.64 0.61 -0.04
Physical Resources
Core textbooks per pupil (2.08) 2.03 2.12 2.10 0.07
Seats per pupil (0.79) 0.80 0.79 0.78 -0.02
Writing places per pupil (0.77) 0.77 0.76 0.78 0.01
% classrooms needing major repairs (0.24) 0.24 0.23 0.24 0.00
% classrooms needing minor repairs (0.33) 0.36 0.34 0.31 -0.05
% schools with toilets (0.57) 0.54 0.60 0.56 0.02
% schools with accessible drinking water (0.62) 0.56 0.63 0.68 0.12
Education Indicators
GER (0.79) 0.76 0.77 0.82 0.06
NER (0.44) 0.43 0.44 0.44 0.01
GAR (0.83) 0.80 0.81 0.86 0.06
NAR (0.37) 0.37 0.37 0.38 0.01
Completion rate (0.73) 0.70 0.72 0.78 0.08
Repetition rate (0.03) 0.03 0.04 0.02 -0.01
Note: *Of the 138 districts, 46 districts are classified as low performing as to math BECE pass rates
(scoring between 6.8%-42.3%), 46 districts as medium performing (scoring between 42.9%-63.5%) and 46
as high performing (scoring between 64.5%-99.4%). **The indicated national averages are calculated using
district averages and, thus, in some cases may slightly differ from other aggregate data found throughout
this report.
Source: Calculations based on EMIS data.
121. Students’ pass rate on English BECE examinations tends to be higher in those
districts where the PTR and the PTTR are lower, but the variance is very high. There is
also a positive relationship between the numbers of teachers and students’ pass rates on
BECE math exams.
Page 73
47
Figure 2-23:JHS Pupil (Trained-) Teacher Ratio and BECE English Pass Rates, by District
Source: Based on data from EMIS 2008/09.
122. Ghana is one of the few African countries participating in the Trends in
International Math and Science Study (TIMSS) survey. Its results in the 2003 and 2007
surveys are, by and large comparable to other developing countries, but this also means
scores that are much below international averages. In TIMSS 2003, Ghana performed
second poorest as to average mathematics scores of eighth-grade students with a score of
276 after South Africa with 264, whereas the global average was 466. By 2007, the
improvements were significant, as Ghana’s average improved to 309, although was still
the second lowest to Qatar. Importantly, the international benchmarks appear to be in line
with the NEA standards of mathematics proficiency. Like in the NEA, where the
proportion of those achieving math proficiency was much below 20 percent, in TIMSS
about 17 percent of students aged 16 scored above the low international benchmark. As
only about half of the children aged 16 attended school the day the examination was
administered, this further distorted the sample size and the true national score may have
been lower. Overall, Ghana scored behind countries with a similar GNI in other regions,
despite its relatively high share of public spending on the sector at about 30 percent at the
end of the 2000s.
0.00
0.20
0.40
0.60
0.80
1.00
0 10 20 30 40 50
JHS Pupil Teacher Ratio
BE
CE
En
gli
sh
Pass R
ate
0.00
0.20
0.40
0.60
0.80
1.00
0 20 40 60 80 100JHS Pupil Trained Teacher Ratio
BE
CE
En
gli
sh
Pass R
ate
Page 74
Figure 2-24: International Trends in Math (left) and Science Scores (right) of Eighth-
graders, 2003/2007
Source: Based on TIMSS 2009.
123. At the Senior High School level, the exit exam is the West Africa Senior
Secondary Completion Examination. According to Government data Pass rates increased
substantially in 2008/09 for both sexes, jumping from 36% to 74%. This fast jump calls
for some credible explanation to avoid questions of the reliability of the Government
data. There remains however a substantial gender gap in achievements.
Figure 2-25: WASSCE examination results 2005/06 – 2008- 09
Source: Waec Examination results, EMIS Report 2005/06 – 2008/09.
124. Overall, the learning outcomes have some important messages for policy makers.
First of all, only a minority of students become proficient in basic literacy and
mathematical skills. The educational system is not able to address or overcome the initial
differences in reading comprehension and basic math skills, indeed, these initial
differences are further intensified over time. A lot of the initial challenges and the general
466
605
589
410
406
366
276
500
593
597
420
391
387
380
364
340
309
0 100 200 300 400 500 600 700
Average*
Singapore
Korea, Rep. of
Tunisia
Egypt
Algeria
Colombia
Botsw ana
El Salvador
GHANA
2007
2003
* Average fo r 2003 is inte rna tio nal average; average fo r 2007 is s ca le average .
No 2003 da ta ava ilable fo r Co lo mbia , Algeria and El Sa lvado r.
473
578
558
404
421
365
255
500
567
553
445
408
417
408
387
355
303
0 100 200 300 400 500 600 700
Average*
Singapore
Korea, Rep. of
Tunisia
Egypt
Colombia
Algeria
El Salvador
Botsw ana
GHANA
2007
2003
* Average fo r 2003 is inte rna tio nal average; average fo r 2007 is s ca le average .
No 2003 da ta ava ilable fo r Co lo mbia , Algeria and El Sa lvado r.
WASSCE Examination
0
50000
100000
150000
2005/06 2006/07 2007/08 2008/09
0%
20%
40%
60%
80%
100%
Examinations taken Pass Pass rate
Page 75
49
pressure on quality of learning come from the radically improved access measured by
increased initial admission and overall enrollment rates. The improved access has brought
into the system large groups of children who are now accessing education with various
forms of additional challenges including: overage children, children coming from poor
families, families where parents have little educational background and comprehension of
the importance of education and children in poor, remote, rural communities and
deprived districts where access to infrastructure, employment and services are limited.
Many of these children have a high risk of falling into various zones of exclusion.
Meanwhile, in an education system with its standards for transitioning students from one
level to the next, there is a strong likelihood that many of those who have gained access
to an education over the last decade will end up with very limited opportunities to truly
benefit from it.
C. Relevance
125. While measuring outcomes in access and learning is relatively straightforward,
measuring and monitoring relevance is difficult. Nevertheless, in all societies, policy
makers use a number of proxies to assess the relevance of education and, perhaps more
importantly, to make critical assumptions about the areas where education should have its
desired impact. For the individuals, education can bring improved living standards and
earnings, for enterprises it can result in improved performance and productivity, for the
economy, education can stimulate growth and competitiveness and bring more jobs. For
communities and society at large, education can result in better cohesion and social
inclusion, as well as a number of other benefits. These potential gains are equally critical
for Ghana, which intends to reach middle income status, accelerate and sustain growth,
alleviate poverty and address persistent inequalities between various social and ethnic
groups. In this sense, the present Government has continued its predecessor’s focus on
improving education outcomes and has even strengthened its resolve to assure that these
outcomes are distributed among a wider range of citizens and communities.
General Context: Relevance of Ghana’s Education Sector
126. CREATE expresses the fundamental objective of any education system this way:
“sustained access to meaningful learning that has value is critical to long term
improvements in productivity, the reduction of inter-generational cycles of poverty,
demographic transition, preventive health care, the empowerment of women, and
reduction in inequality” (Akyeampong et al. 2007). A senior official of the Ghana
Education Service stated that most children, who after completing JHS are not able to
continue their education, have difficulties integrating into society. The Government
characterizes unemployed youth who complete 6 years of primary and 3 years of JHS as
“NEET” people, i.e. no education, employment, training. The “NEET” characterization
raises questions about the relevance of basic education and also the condition of the labor
market that provides limited options for this youth.
127. Language of instruction. English is the principal language of school instruction.
However, in the first few years of basic education the local language is used and
gradually becomes phased out as pupils progress through primary. When teachers are
Page 76
50
able to speak the local language, this has shown to improve learning outcomes in the
initial years of schooling (World Bank 2004a). As the instructional language is different
in different areas of the country, some teachers deployed from other regions have been
known to have difficulties communicating with their students. From a strategic
perspective, a long-standing policy of the Ghana Education Service (GES) has been a
bilingual transitional language approach, through which local language would constitute
80% of instruction in primary 1 and English would be the only language of instruction by
primary 4. This policy has been confronted with severe implementation constraints,
partially due to a either a lack of appropriate learning material or a lack of teachers who
speak the local language where they are posted, or a combination of the two.
Economic Externalities
128. A relevant education is pivotal in fostering a smooth transition of young adults
from the education system to the labor force, and in training them to enter a versatile and
competitive labor market, both nationally and internationally. However, much can be
done in Ghana’s education system to improve its skills base. A White Paper, based on the
Ministry’s Education Strategic Plan 2003-2015, made the case for a much stronger and
targeted focus on technical, vocational, and agricultural education and apprenticeships
(MOESS 2004). In the education sector performance review 2006, the Ministry indicated
that evidence exists of a large discrepancy between the outcomes of education institutions
and the needs of the labor market (MOESS 2006). Thus, by increasing education
opportunities to develop needed skills, Ghana will be better equipped with the human
capital needed to advance to middle-income status (World Bank 2008).
129. In Ghana, 74.8 percent of women and 79.7 percent of men age 15-49 are currently
employed, according to the Ghana Demographic and Health Survey, 2009. As data from
the survey shows, being currently employed appears, ironically, to be inversely related to
the level of one’s education, falling from 88 percent among women (96.3 percent of men)
who don’t have any education to about 63 percent among women (73.1 percent of men)
who have secondary education or higher (Table 2-20). In part, this can be explained by
the fact that the majority of the labor force is employed in agriculture, which generally
requires no or only minimal formal education.
Table 2-20: Employment Status and Level of Education in 2008, Female/Male
Employed in the 12 months
preceding the survey
Not employed
in the
12 months
preceding the
survey
Currently
employed
Not currently
Employed Total
Number
of
women/men
Women
No education 88 2.6 9.3 100 1,042
Primary 79.2 2.2 18.7 100 988
Middle/JSS 70.8 2.6 26.6 100 2,039
Secondary+ 62.7 5.4 31.9 100 844
Total 74.8 3.0 22.2 100 4,916
Men
No education 96.3 1.2 2.4 100 540
Primary 76.5 1.5 21.9 100 619
Page 77
51
Middle/JSS 76.1 2.3 21.6 100 1,721
Secondary+ 73.1 4.7 22.2 100 1,167
Total 79.7 2.7 17.6 100 4,568
Source: Based on Ghana Demographic and Health Survey, 2009.
Note: Currently employed is defined as having done work in the past seven days. Includes persons who did
not work in the past seven days but who are regularly employed and were absent from work for leave,
illness, vacation, or any other such reason.
130. Having only a primary or junior secondary education (or less) is generally the
norm among self-employed Ghanaians, while wage workers tend to have made greater
investments into education – based on the Ghana Living Standards Surveys (GLSS)
conducted in 1991/92, 1998/99, and 2005/06. Thus, when controlling for other
background traits, the probability of being a wage worker in an urban area is higher as the
level of education increases, and this appears to be consistent over time. The higher the
level of one’s education, the greater is the likelihood of moving out of the agriculture
sector and into wage or self-employment in services or industry (GLSS 2005/06).
Figure 2-26: Impact of Education on the likelihood of Wage Employment (vs. no
Education) and Non-Agriculture Self-Employment (vs. no Education), Urban
Source: World Bank 2008 based on GLSS 1991/92, 1998/99, and 2005/06.
131. Based on the findings of the GDHS 2009, the vast majority of men (about 84
percent) and women (about 59 percent) who have no education are active in the
agriculture sector, which represents about 40 percent of GDP. For those with at least a
secondary education, about half of women (48.7 percent) were engaged in the sales and
services sector and about a quarter (27.4 percent) had a professional, technical or
managerial occupation. The corresponding proportions for men were 21.3 and 35.1
percent, respectively.
132. Occupation is not only closely linked to education attainment, but also to levels of
income, with Ghanaians in the poorest quintile being principally employed in the
agriculture sector and those in the richest quintile being mainly engaged in sales and
services or professional, technical or managerial activities.
-202468
10121416
Impact of Education on the Likelihood of Wage Employment (vs. no Education), Urban
1991/92
1998/99
2005/06
-1
-0.8
-0.6
-0.4
-0.2
0
0.2
0.4
0.6
Impact of Education on the Likelihood of Non-Agriculture Self-Employment (vs. no Education),
Urban
1991/92
1998/99
2005/06
Page 78
52
Table 2-21: Level of Education and Occupation in 2008, Male/Female
Professional/
technical/
managerial Clerical
Sales
and
services
Skilled
Manual
Un-
skilled
manual
Agri-
culture Missing Total
Number
of women
/men
Women
No education 0 0.1 33.6 6.7 0 58.5 1 100 945
Primary 0.5 0 54.2 11.1 0.2 33 0.9 100 803
Middle/JSS 1 0.3 62.1 14.2 0.1 20.7 1.7 100 1,496
Secondary+ 27.4 11 48.7 7.8 0.5 2.7 1.8 100 575
Total 4.6 1.8 51.4 10.7 0.2 29.9 1.4 100 3,822
Men
No education 0.5 2.1 3.7 8.4 0 84.1 1.2 100 527
Primary 1.7 6.7 8.5 20.4 0.3 58.5 4 100 483
Middle/JSS 3.1 13.1 10.8 30.1 1.2 35.9 5.9 100 1,349
Secondary+ 35.1 7.6 21.3 17.4 1.8 12.7 4.1 100 908
Total 11.4 8.8 12.2 21.6 1 40.6 4.3 100 3,276
Source: Based on Ghana Demographic and Health Survey, 2009.
133. Level of education impacts earnings. In the chapter on disparities, we analyzed
how income levels strongly influence access to education opportunities. This relationship
goes in both directions. Based on the Ghana Living Standards Surveys (GLSS) of
1991/92, 1998/99, and 2005/06, Ghanaians with higher levels of education and training in
both rural and urban settings tend to have higher earnings in all three years analyzed.
Investments in education capital, which increase workers’ productivity and open doors to
more lucrative employment opportunities, have a significant impact on wages and
returns. Higher levels of education bring higher income levels by increasing people’s
cognitive capacities and by making them more attractive to employers. Those who have
primary education and, in many cases even lower secondary education, tend to receive
only slightly higher returns when compared to Ghanaians without education. Basic
education however opens options to transition and continue through the education
system. GLSS data indicate that completing upper secondary or TVET education
translates into considerably higher economic returns, both in rural and urban settings and
for nearly all types of employment. Ghanaians who have tertiary education yield even
higher gains, especially in wage employment (World Bank 2008).
134. Another analysis also using GLSS data supports the view that education yields
positive returns at all levels and is incremental at higher levels. Over the decade between
1987/88 and 1998, the increase in levels of education contributed to about a third of the
increase in per-capita income (Teal 2001). These findings from GLSS data offer strong
economic grounds for further investment in education at all levels.
Page 79
53
Figure 2-27: Wage Regressions and Non-Agriculture Self-Employed Regressions with
Sample Selection, Ghana 1991-2006, Urban
Source: World Bank 2008 based on GLSS 1991/92, 1998/99, and 2005/06.
135. Completing an apprenticeship has gained importance over time, particularly for
women, and is by far the most common way to acquire and develop skills for
employment. Thus, ensuring the quality of apprenticeships remains a critical issue. They
play a key role in widening non-agriculture employment opportunities for youth, and in
increasing prospects of being self-employed, thus they also raise the probability of having
a job. Many businesses -- and self-employed artisans -- train youth by means of
apprenticeships and on-site training, accounting for about 80-90 percent of all basic skills
training in Ghana (Atchoarena and Delluc 2001). Ghanaians who have an apprenticeship
are found holding nearly all forms of employment, although they are most commonly
self-employed in non-agriculture, or wage employed in the informal sector or in the
private formal sector.
136. While 21.9 percent of males and 13.9 percent of females aged 15-30 had
completed an apprenticeship by 1991/92, the practice increased such that 27.3 percent of
males and 26.3 percent of females within this age group had done so by 2005/06 (GLSS).
An analysis carried out in 2006 by the Centre for the Study of African Economies found
that in Ghana’s urban labor market a third of the population aged 16-65 had acquired
some type of training (Monk et al. 2007). In terms of earnings, an apprenticeship is
commonly linked to lower economic returns, when compared to Ghanaians who have no
apprenticeship (i.e. who have had other forms of education). Despite their current
significance in developing skills and opening employment opportunities, formal
apprenticeships are most likely to become less important, given that Ghana is a country
aiming towards middle-income status (World Bank 2008), which will require a workforce
with higher levels of formal education.
-0.5
0
0.5
1
1.5
2
2.5
Wage Regressions with Sample Selection, Ghana 1991-2006, Urban
1991
1998
2005
-1
-0.5
0
0.5
1
1.5
2
Non-Agriculture Self-Employed Regressions with Sample Selection, Ghana 1991-2006, Urban
1991
1998
2005
Page 80
54
Social Impact, Social Relevance
137. Fertility rates are one of the many health indicators strongly related to levels of
education. Women with no education give birth to about three times more children than
women with secondary or higher education. Data from the Ghana Living Standards
Measurement Surveys confirms that the amount of schooling a mother receives is a
strong predictor of how many children she has later in life.
Figure 2-28: Level of Education and Fertility Rates, 2008
Source: Based on data from Ghana Demographic and Health Survey, 2009.
Note: Total fertility rates are for the period 1-36 months preceding the interview.
138. Mother’s education related to share of births attended by a specialist. Among
mothers without any formal education less than a third (only 29.7 percent) gave birth to a
child under the attendance of skilled health personnel, based on demographic and health
survey data. In contrast, about two thirds of mothers (67.9 percent) who reached
secondary or tertiary education had given birth while attended by skilled health personnel
(WHO 2008:92).
139. The median age at which women begin bearing children is also linked to
education attainment, with women who have no education having their first birth on
average at least 5 years earlier than women with secondary or higher education. About 2
percent of households surveyed stated that the reason their child was not enrolled in
junior high school was due to pregnancy or already having a child, based on data from
the Core Welfare Indicators Questionnaire Survey (GSS 2003). As Table 2-22 shows, the
percentage of adolescents who have begun childbearing is many times higher among
those with no education – 30.9 percent – than among those with at least secondary
education – 1.3 percent.
Table 2-22: Level of Education and Teenage Pregnancy/Motherhood, 2008
Percentage who: Percentage
who have
begun
childbearing
Number
of women
Have had a
live birth
Are pregnant
with first child
No education 23.4 7.4 30.9 72
Primary 18.8 7 25.9 222
Middle/JSS 7 2.4 9.5 571
Secondary+ 1.3 0 1.3 159
6.2
9
6
5.6
7.4
4.9
4.5
7.4
3.5
3
4.9
2.1
5.2
7.3
4
0 2 4 6 8 10
Mean number of children everborn to women age 40-49
Percentage of women age 15-49 currently pregnant
Total fertility rate
Total
Secondary+
Middle/JSS
Primary
No education
Page 81
55
Total 9.9 3.4 13.3 1,025
Source: Based on Ghana Demographic and Health Survey, 2009.
Note: Figures refer to women age 15-19.
140. Contraceptive use among married women varies with their level of education:
about 13.6 percent who have no education currently use a contraceptive method and 0.3
percent specifically use a male condom, while 30.4 percent who have secondary or higher
education use a contraceptive method of which 6.2 percent use a male condom.
141. Among women aged 15-49 with no formal education, the mean ideal number of
children was 5.8, while it was 4.3 if they had primary education, and fell to 3.4 children if
they had secondary education or higher. The desire to limit the number of children tends
to be highest among women in urban areas who have secondary or higher education and
come from the richest quintile.
Table 2-23: Level of Education and Desire for no more Children, 2008
Number of living children
0 1 2 3 4 5 6+
Female
No education .. 1 11.3 23.6 34.9 62.8 67.3
Primary .. 0 17.2 32 52.7 63 86.5
JHS .. 2.2 16.5 44 76.8 84.6 88.8
Secondary+ .. 2.9 32.7 46.1 84.7 90.3 100
Total .. 1.7 17.7 36.1 57.5 70.5 76.7
Male
No education 0 0.5 10 9.4 31.3 23.2 39.7
Primary 0 0 21.6 29.6 43 37.7 51.8
JHS 0 4.4 24.1 41.4 56.1 52.1 71.8
Secondary+ 0 4.7 26.4 40.8 64.6 88.2 57.2
Total 0 3.6 22.4 33.7 50.5 47.6 56.6
Source: Based on Ghana Demographic and Health Survey, 2009.
Note: Percentage of currently married women/men age 15-49 who want no more children.
142. A mother’s education is inversely associated with a child’s risk of dying. Among
mothers with no education, there were 61 deaths per 1,000 live births; mother’s with JHS
or with secondary education or higher had 46 and 49 deaths per 1,000 live births
respectively. Under-five mortality sunk from about 10 to 6 percent for mothers with
secondary or higher education compared to those without any exposure to the education
system (Table 2-24).
Table 2-24: Mother’s Education and Early Childhood Mortality Rates, 2008
Neonatal
mortality
Post-
neonatal
mortality
Infant
mortality
Child
mortality
Under-
five
mortality
No education 38 23 61 44 102
Primary 35 20 55 35 88
Middle/JSS 23 23 46 23 68
Secondary+ (38) (11) (49) (15) (64)
Source: Based on Ghana Demographic and Health Survey, 2009.
Page 82
56
Note: Deaths are per 1,000 live births. Numbers in parentheses are based on 250-499 unweighted exposed
persons; an asterisk indicates that a rate is based on fewer than 250 unweighted exposed persons and has
been suppressed.
143. Levels of education are associated with the prevalence of malnutrition among
children under age five in Ghana. Well educated mothers are six times less likely to have
severely underweight children: 3.7 percent of children born to women with no education
are severely underweight compared to only 0.6 percent of children were whose mothers
have secondary education or higher. But of course more educated mothers also generally
come from richer families and hence are more capable to buy more food for their children
(GHDS 2009).
144. GDHS data show that better educated women have a higher tendency to influence
personal and household decision-making, partially due to being able to better inform
themselves and communicate in a more sovereign way. 41.7 percent of women without
education participated in making four specific decisions (on health, daily and major
purchases and visits outside the home), while 56.6 percent of women did, if they had
received at least a secondary education.
Table 2-25: Women’s Participation in Decision-Making and Level of Education, 2008
Specific decisions
Percentage
who
participate in
all four
decisions
Percentage
who
participate in
none of the
decisions
Number
of
women
Own
health
care
Making
major
household
purchases
Making
purchases
for daily
household
needs
Visits to
her family
or
relatives
No education 65.4 56 76 82 41.7 8.1 853
Primary 68.1 60.7 78.5 80.2 45.7 8.3 638
Middle/JSS 69.9 65.3 81.5 84.1 49.5 5.3 1,058
Secondary+ 75 72.1 85.1 90.8 56.6 3.9 325
Total 68.8 62.3 79.6 83.4 47.2 6.6 2,876
Source: Based on Ghana Demographic and Health Survey, 2009.
Conclusions on Quality of Learning
145. As overall access to education improves -- especially at primary and basic levels -
- the Government and other stakeholders need to pay increasing attention to quality
issues. Even if increasing number of children find ways to gain admission and increasing
proportion of them are enrolled, new forms of exclusion emerge as many of them simply
do not attend classes, learn enough, drop out, repeat, fail to pass exit exams or fail to
transit to post-primary levels. International assessments show that big disparities in
learning outcomes in a country pull down overall performance even if there are some
significant groups that demonstrate impressive achievements, claim successful academic
or professional careers.
146. Ghana’s commitment to education is show by its willingness to participate in
international learning assessments, by the national assessments of learning outcomes and
by the numerous innovations that are sponsored and promoted through Government
policies or non-governmental initiatives. These will gradually direct the public attention
and the accountability of education providers to quality outcomes.
Page 83
57
147. This report shows that while the resources for education are impressive, they are
not distributed equitably, targeted according to need and used efficiently. Quality
standards are defined in terms of input with little understanding as to which inputs and
which methods have the most impact on learning outcomes. Among the inputs, two key
items appear to show major impact: the access to quality teaching and quality teachers
and the instructional time.
148. Based on the findings we identify three levels of potential and desirable policy
actions:
a. Continue strengthening the Government capacities and increase
investment in monitoring learning outcomes. While there is an
impressive array of innovations and options for policy to improve quality,
it is impossible to assess their effectiveness and scale up the successful
ones if learning outcomes are not measured by using solid international
and reliable national standards and methodologies.
b. Assure that resources with strong impact on quality reach the
classrooms. The available assessments confirm that trained teachers have
the biggest impact on learning. Further, there are indications that high
level of absenteeism, low time on task significantly compromise learning.
To overcome these problems, both the central and local governments as
well as the communities need to be given authority, improve capacity to
supervise, monitor deployment of teachers, attendance and, indeed,
classroom activities. Standards, expectations and regulations need to be
stringent to avoid that new generations of students complete education
without effective learning.
c. Give central support to local innovations. Improving quality in crowded
urban schools requires different approach than in small rural schools often
with limited infrastructure, facilities shared by different grade levels, poor
communities and local language and cultural conditions. The Government
needs to provide services to schools with a variety of conditions, empower
and motivate local governments, communities and non-governmental
agencies to initiate these innovations and monitor their impact.
Page 84
58
3. INPUTS AND RESOURCES
149. In general, the Government and service providers need to ensure that all necessary
inputs, supply of infrastructure, teaching and learning materials and methodologies, as
well as human resources, are made equally available to all students and schools. There
are general standards and guidelines for most inputs, including standards of school
construction, textbook ratios, teaching methodologies and standards for management.
However, even in the context of Ghana’s extraordinary support for education, planners
struggle to supply even a minimum of inputs to all schools. The challenge is complicated
by the lack of evidence on the effectiveness of various inputs on learning outcomes,
making it hard to to decide where to concentrate limited resources and funding. In
addition, needs are not uniform. For instance, small remote schools in rural areas with
high poverty incidence need a different scale and type of resources than large urban
schools with diverse student populations.
Table 3-1: Examples for inputs influencing quality outcomes
Input Description
Physical infrastructure
Schools Sufficient number of schools so that pupils do not have to walk
large distances to reach school.
Classrooms Sufficient number and size of classrooms and pavilions that can be
used when raining and that have internal walls to reduce noise in
shared classes.
Water and toilets Schools with their own supply of running water and separate
toilets for both girls and boys.
Electricity Access to electricity allows to use light and, increasingly,
technologies like computer and other electrical and electronic aids.
Other facilities These may include teacher quarters, teacher rooms, library, etc.
Materials
Textbooks and learning materials Adequate ratio of core textbooks (e.g. math and English) per pupil
and policies ensuring their usage.
Desks and seats Ratio of seats and writing places per pupil.
Chalkboard Accessibility and quality of chalkboards.
Chalk Access to sufficient chalk.
Teachers and teaching methods
Teacher training Minimum number of teachers and equitable share of trained
teachers.
Methods Ensuring teachers are trained to implement improved, modern and
student-centered teaching methods, and that they demand frequent
homework.
Attendance Measuring attendance and absenteeism among teachers and
students.
Time-on-task Ensuring time spent in school is used for learning.
Curriculum Ensuring locally-relevant curriculum.
Teacher morale Working and living conditions influence level of teacher morale.
Financial Resources
Per Capita Expenditures Expenditures show no disparities, distributed equally to a level
where effective decisions about effective use of funds
Flow of Funds make financial resources available in a timely manner, allowing
pooling resources and efficiency gains
Incentives, programmatic, financing
compensation schemes
Policies are costed, incentives established and financed to
stimulate desired behavior, innovation, accountability
Page 85
59
150. As subsequent sections on resource allocations and resource use will show, public
resources cannot provide each school and each classroom with all necessary inputs at an
acceptable standard. It is inevitable that some schools will enjoy less resources than
others. At the same time, it will be necessary for some resources to be prioritized and
adjusted to local conditions, circumstances and need. For example, various incentives
may be needed to get teachers to agree to being deployed in remote areas. Likewise,
efforts to minimize teacher absence may be more important in improving learning
outcomes, than providing an adequate number of classrooms. Therefore, decisions about
allocating resources, setting up services to education, and establishing priorities need to
be made along the following principles:
a. they have to be evidence based,
b. they have to create adequate incentives for the key participants including
students, parents, teachers, head teachers, and district officials, and
c. they have to be targeted so that those with the greatest need get the
largest share of public resources.
A. Physical Resources: Schools, Infrastructure and Textbooks
151. Basic education is largely provided by small and medium sized schools.
Enrollment in the median KG is 80 (mean 81.4), in Primary school 193 (mean 207.5),
and JHS 112 (mean 125.9). At all three levels, more than half of the schools have below
average enrollment. Junior high schools experienced a significant increase in enrollment
in the past years, a phenomenon that affected disproportionately very small schools, the
proportion of which decreased significantly between 2005/06 and 2008/09.
Figure 3-1: Number of Pupils per School at the Basic Level
Source: Based on EMIS.
152. Prior to systemic efforts by the Government, communities were responsible for
constructing their own schools, the majority of which were made of adobe and had a
short lifespan. A World Bank (2004a) study reported that in 1988 fewer than half of
primary schools (47.6 percent) were able to utilize all their classrooms when it rained, but
improvements in school structures meant that by 2003 more than two-thirds (68.1
percent) could do so. School facilities have a direct impact on enrollment figures and,
although to a lesser extent, their quality is known to affect school performance. Between
1988 and 2003, 4 percent of enrollment growth (about one third of all growth) was
62.9 62.1
167.4 174.8
204.0
112.5 116.1 119.0 125.1
83.7 80.3 81.572.9 68.8
81.4
208.8205.1
169.2 160.7
207.5
125.6114.2 109.9
125.9
0.0
50.0
100.0
150.0
200.0
250.0
2001/02 2002/03 2003/04 2004/05 2005/06 2006/07 2007/08 2008/09
Preschool Primary JSS
Page 86
60
attributed to new and better school facilities, for instance, by shortening distances to
school (World Bank 2004a).
153. The Government has adopted a policy to ensure a preschool facility be attached to
primary schools across the country. Over the last four years, the number of public KGs
grew by 40 percent but, to date, 28.1 percent of preschools are private. This high rate
shows that the Government needs to strengthen its commitment to nationalize
kindergartens in order to improve equity.
Table 3-2: Preschool Facilities
2001/0
2
2002/0
3
2003/0
4
2004/0
5
2005/06
*
2006/07
*
2007/08
*
2008/09
*
Schools 9,634 11,177 10,133 11,781 11,931 13,750 15,449 16,439
w/ toilets 4,903 5,002 5,130 5,978 6,585 7,608 8,839 9,684
w/ potable water 4,760 4,751 4,887 6,305 6,766 8,675 10,599 11,137
average # of pupils per
preschool
72.9 68.8 62.9 62.1 83.7 80.3 81.5 81.4
% which are private 34.4% 32.1% 36.6% 43.4% 27.4% 27.2% 27.9% 28.1%
% w/ Toilets 50.9% 44.8% 50.6% 50.7% 55.2% 55.3% 57.2% 58.9%
% w/ Potable Water 49.4% 42.5% 48.2% 53.5% 56.7% 63.1% 68.6% 67.7%
Note: *KG data used due to lack of preschool data. While preschool population is 0-5yrs, KG population is 4-5yrs.
Source: EMIS.
Figure 3-2: Trends in Preschools with Toilets and Potable Water
Source: Based on EMIS.
154. The average number of pupils per primary school is 207.5, while the number of
pupils per private primary schools is 153. About 19.3 percent of all primary schools were
private in 2001/02, but this share rose to 24.4 percent by 2008/09.
155. Between 2001/02 and 2008/09 the number of primary schools increased from
15,285 to 17,881. This increase represents a large expansion in the supply of education
services, with an average growth rate of 2.4 percent of new primary school constructions
per year. Given the annual population growth is officially estimated at 2.7 percent, the
government’s efforts to construct new schools have not been able to keep pace with
natural growth. As a result, some schools have become overcrowded. Table 3-3: Primary School Facilities
2001/02 2002/03 2003/04 2004/05 2005/06 2006/07 2007/08 2008/09
0%
10%
20%
30%
40%
50%
60%
70%
80%
2001/02 2002/03 2003/04 2004/05 2005/06 2006/07 2007/08 2008/09
0
2000
4000
6000
8000
10000
12000
14000
16000
18000Preschools% of Schools w/ Toilets% of Schools w/ Potable Water
Page 87
61
Total Schools 15,285 15,708 16,046 16,760 15,307 16,410 17,315 17,881
w/ toilets 8,703 7,955 7,819 8,150 7,990 8,745 9,679 10,370
w/ potable water 6,553 6,241 6,472 7,929 8,183 10,004 11,678 11,890
# of pupils per primary school 169.2 160.7 167.4 174.8 204.0 205.1 208.8 207.5
% which are private 19.3% 20.4% 22.4% 25.0% 20.1% 21.5% 23.5% 24.4%
# of pupils per private primary 160.2 125.9 136.1 143.5 154.3 153.4 153.7 153.0
% w/ toilets 56,9% 50,6% 48,7% 48,6% 52,2% 53,3% 55,9% 58.0%
% of private w/ toilets 17.2% 14.7% 16.3% 21.7% 79.8%8 79.4% 81.5% 81.2%
% w/ potable water 42,9% 39,7% 40,3% 47,3% 53,5% 61,0% 67,4% 66.5%
% of private w/ potable water 65.1% 53.2% 56.7% 65.1% 72.4% 77.3% 81.9% 79.9%
Source: EMIS.
156. While the average number of students per private JH school is 86.6, the average
number of students for all JH schools is 125.9. About 15 percent of all junior secondary
schools were private in 2001/02, but this share increased to 25 percent by 2008/09.
Between 2001/02 and 2008/09 the number of JH schools increased from 7,582 to 10,213,
which reflects an annual rate of 5.0 percent. Among all JH schools 62.2 percent have
toilets and 67 percent have access to potable water.
Table 3-4: JHS School Facilities
2001/02 2002/03 2003/04 2004/05 2005/06 2006/07 2007/08 2008/09
Total Schools 7,582 7,875 8,170 8,699 8,749 9,054 9,742 10,213
w/ toilets 4,012 3,973 3,916 4,090 4,875 5,195 5,844 6,348
w/ potable water 3,483 3,388 3,604 4,399 4,736 5,612 6,677 6,845
# of pupils per JHS 114.2 109.9 112.5 116.1 119.0 125.1 125.6 125.9
% which are private 15.4% 16.5% 19.8% 22.6% 18.5% 21.3% 23.8% 25%
# of pupils per private JHS 105.9 95.6 89.9 95.5 97.6 93.3 89.9 86.6
% w/ toilets 52,9% 50,5% 47,9% 47,0% 55,7% 57,4% 60,0% 62.2%
% of private w/ toilet 12.3% 12.2% 14.8% 18.1% 84.9% 85.1% 85.7% 85.9%
% w/ potable water 45,9% 43,0% 44,1% 50,6% 54,1% 62,0% 68,5% 67.0%
% of private w/ potable water 72.3% 63.3% 63.4% 71.5% 74.4% 78.8% 83.2% 81.3%
Source: EMIS.
Figure 3-3: Trends in the Number of Pupils per JHS, Public/Private
Source: Based on data from EMIS.
157. Since the school year 2001/02 the percentage of public junior high schools with
toilets has decreased by 8.3 percent and those with drinkable water have increased by
8 This large jump suggest data reliability problem.
105.995.6 89.9 95.5 97.6 93.3 89.9 86.6
115.7 112.7 118.1 122.2 123.9133.7 136.8 139
0
20
40
60
80
100
120
140
160
2001/02 2002/03 2003/04 2004/05 2005/06 2006/07 2007/08 2008/09
Private
Public
Page 88
62
22.9 percent. As to private junior high schools, those with toilets have sharply risen by
73.4 percent and those with potable water have increased by 10.9 percent.
Textbooks
158. Core textbooks especially for English and mathematics at primary level are
essential components of the Government’s strategic agenda. A comprehensive evaluation
of basic education in Ghana found that widening access to textbooks contributed to
improvements in English and math scores between 1988 and 2003 (World Bank 2004a).
The study reported that in 1988 only 21 percent of primary schools had at least one
English textbook per pupil; by 2003 the share had risen to 72.4 percent (Table 3-5). At
the junior secondary level, the share of schools that had at least one math textbook per
pupil grew from 13 to 71 percent over this period. The World Bank was the main
international provider for textbooks during this 15 year period, responsible for the
provision of nearly 35 million textbooks.
Table 3-5: Trends in English and math textbook distribution
English Mathematics
Primary JHS Primary JHS
1988 2003 1988 2003 1988 2003 1988 2003
Less than one book between two 58.4 11.3 42.1 22.1 35.7 11.0 34.3 5.5
At least one book between two 20.6 16.3 37.3 42.6 32.9 35.7 52.4 23.2
At least one book per student 21.0 72.4 20.6 35.3 31.5 53.2 13.3 71.3
Total 100 100 100 100 100 100 100 100
No. of observations 286 417 233 289 286 417 233 289
Source: Based on World Bank 2004a.
159. During the last decade the textbook per student ratio revolved around two core
textbooks per pupil in primary schools and mildly improved from just below 5 books to
over 6 books for JH schools. The pattern of textbook supply shows slow decline until
sudden improvement in 2005/06 for primary and 2006/07 for JHS after which between
2006/07 to 2008/09, the ratio declined again. During that time, the average number of
textbooks per pupil in primary schools declined more in deprived district than in non-
deprived. There are districts, such as Afram Plains Kwahu North District (Eastern) or
Tolon-Kumbungu District (Northern) that had on average less than 0.80 textbook per
pupil in 2008/09. In 2009, a large number of core textbooks was procured and delivered
after the EMIS census had taken place. This suggests that textbook provisions have a
campaign-like nature with large procurement of textbooks from time to time, likely once
in every four years, but either inefficient distribution or inefficient maintenance of
textbooks.
Page 89
63
Figure 3-4: Textbooks per Pupil at Basic Levels
Source: Based on EMIS.
Ghana School Feeding Program
160. The Ghana School Feeding Program (GSFP) started in 2005 with a pilot in 10
schools, one per region. In 2008, the program reached 560,000 students in all 170
districts, which accounts for about 14.3 percent of total primary school enrollment. Plans
call for expanding the program to reach 1,040,000 students by the end of 2010. The 2008
budget of the program was 43.6 million GH ¢ but actual expenditures reached only 33.0
million GH ¢. The budget for 2009 at 51.1 million GH ¢ was more than 20 percent
higher than the budget for 2008.
161. School level data from EMIS for 2005/06 to 2008/09 show the feeding program
had only a small impact on enrollment – from a 5.86 increase in primary schools after
three years, to a 2.9 percent decrease in JH schools after three years. However, the lack of
more positive effects from the program may be due to initial problems with its
implementation. Studies in other developing and developed countries have shown feeding
programs to be an effective means of boosting both enrollment and student performance.
162. By using school level data from EMIS for 2005/06 to 2008/09 one can examine
whether the Ghana School Feeding Program (GSFP) has had an impact on enrollment.
GSFP had a positive impact on enrollment in the second and third year of its introduction.
In the first year as well as in the fourth year, the effect was positive but not statistically
significant. In schools with meals program for three years, overall enrollment increased
by 5.86 percent. The increase in primary one enrollment was about a percentage point
less.
163. School meals do not have a statistically significant effect on overall JHS
enrollment. The school meals program had a positive impact on enrollment only in the
first year of its introduction in JHS1, of a magnitude of 2.8 percent. In the subsequent
years, the effect was negative in JHS1. In schools with meal programs for three years,
overall enrollment decreases by 2.9 percent while in those with the program for two
years, overall enrollment decreases by around 1.6 percent. It should be noted that in those
schools with both primary and JHS levels, it is possible that school meals are provided
only to the primary level and not JHS. This could possibly explain the results. In addition,
2.2 2.01.7
1.3
3.0
2.1 1.8 1.9
4.8 4.5
3.9
3.0
6.6
7.4
6.86.3
0.0
1.0
2.0
3.0
4.0
5.0
6.0
7.0
8.0
2001/02 2002/03 2003/04 2004/05 2005/06 2006/07 2007/08 2008/09
Primary JSS
Page 90
64
the school meal program has no statistically significant effect on non-promotion in
primary (Wodon and Joseph 2010; Annex.. for regression results).
B. Human Resources: Teacher Supply, Allocation, Policy
164. The Government sets the targets for pupil teacher ratios. According to the 2004
ESP, at kindergarten level, the 2001/02 baseline and the long-term target is 25. However,
the sharp increase in enrollment numbers has placed greater pressure on pupil teacher
ratios in pre-primary, which rose to 35.5 (2008/09). In primary schools, the strategic goal
was 35, whereas the average PTR was 32.4 in 2008/09. According to UNESCO, sub-
Saharan Africa had an average pupil teacher ratio in primary of 45 for the school year
ending in 2006; Ghana’s primary classrooms have on average about 10 students less per
teacher. At the global level, the average share of primary students per teacher was 25 in
2006, and among developed countries it was 14 (UNESCO 2008:118).
165. The primary PTR hasn’t changed during the decade despite sharp increase in
enrollments, thanks to efforts to recruit a large number of new teachers, most of them
unqualified (to be analyzed later). As a result, both the number and proportion of
unqualified teachers grew mostly in line with the large increases in student intake.
Figure 3-5: Trends in Primary Enrollment and Share of Unqualified Primary Teachers
Source: Based on EMIS.
166. The national PTR in junior high schools averaged 17 in 2008/09, considerably
lower than the Government’s target rate of 25 and lower than the 2001/02 baseline of
18.2. As the Figure shows, the PTR for JHS have historically been very low: while this
could be positive in terms of quality, it is extremely expensive. For all three levels, PTR
peaked in 2005/06 and have slowly declined since. For primary and JHS levels, the
present PTRs are below the Government targets, while for KG, it is above target.
3,710,647
3,616,023
3,365,762
3,122,903
2,929,536
2,686,133
2,524,585
2,586,434
35%39%
42% 44%47%
51%52.0%
37%
0
500,000
1,000,000
1,500,000
2,000,000
2,500,000
3,000,000
3,500,000
4,000,000
2001/02 2002/03 2003/04 2004/05 2005/06 2006/07 2007/08 2008/09
0%
10%
20%
30%
40%
50%
60%
Total Primary Enrolment % of Unqualified Primary Teachers
Page 91
65
Figure 3-6: Trends in PTR at the Basic Level, 2001/02-2008/09
Source: Based on EMIS. Note: KG data for 2001/02 and 2002/03 are preschool data.
167. Teachers in Kindergarten. In 2008/09, 75% of the 37,700 kindergarten teachers
were unqualified. In the public sector, about 31 percent of all kindergarten teachers are
qualified, while in the private sector only 7 percent are qualified. The large gap in trained
KG teachers is attributable to its relatively recent introduction. PTR for KG appear to
have stabilized from 2007/08 onwards since KG was declared part of the basic education
cycle and every primary school was deemed to have an attached Kindergarten.
168. As we have seen in the previous chapter, the private kindergartens are more
prevalent in the rural areas where public services are not available, illustrating that the
policy is yet to be implemented successfully. Therefore, these schools can be safely
considered as weak substitution for the higher quality public services. While the pupil
trained teacher ratio (PTTR) in kindergarten averaged 137 at the national level in
2008/09, there were about 457 private preschool attendees for every trained teacher.
Table 3-6: Indicators on Kindergarten Teachers
2001/02* 2002/03* 2003/04 2004/05 2005/06 2006/07 2007/08 2008/09
TEACHERS 27,882 28,382 23,2489 32,712 26,580 34,140 35,736 37,713
% of Private 31.7% 30.0% 39.6% 40.8% 23.1% 20.7% 23.2% 22.0%
% of Untrained 77.8% 78.7% 74.3% 80.3% 72.6% 69.2% 74.7% 74.1%
% of Untrained Public 71.0% 72.5% 62.1% 71.4% 66.9% 64.3% 69.1% 68.7%
% of Untrained Private 92.6% 92.9% 92.8% 93.1% 91.6% 87.8% 92.9% 93.2%
PTR 25.2 27.1 27.4 22.4 37.6 32.8 35.2 35.5
PTTR 113.5 127.0 106.5 113.4 137.2 105.1 139.0 136.9
PTR in Private 28 30 20 19 31 29 29 31
PTTR in Private 373.6 418.0 276.9 272.2 372.5 241.3 410.0 456.8
PTR in Public 24 26 32 25 39 33 37 37
Source: EMIS. Note: *KG data indicated for 2001/02 and 2002/03 illustrates preschool data.
169. Teachers in Primary Schools. As mentioned earlier, between 2001/02 and
2008/09 the proportion of untrained primary teacher grew rapidly, given that the total
number of teachers increased by nearly 42 percent (from about 80,500 to 114,400), while
9 The reasons for the apparent big drops in the teacher numbers in 2003 and in 2005 are unclear, possibly
data error.
0
5
10
15
20
25
30
35
40
-------------------------- Kindergarten, 25
-------------------------- Primary, 35
---------------------------
Junior High School, 25
-- Government target for 2015
2001/0
2
2002/0
3
2003/0
4
2004/0
5
2005/0
6
2006/0
7
2007/0
8
2008/0
9
2001/0
2
2002/0
3
2003/0
4
2004/0
5
2005/0
6
2006/0
7
2007/0
8
2008/0
9
2001/0
2
2002/0
3
2003/0
4
2004/0
5
2005/0
6
2006/0
7
2007/0
8
2008/0
9
Page 92
66
the total number of unqualified teachers more than doubled between the same period
(from about 28,200 to 59,500). The proportion of untrained primary teachers was 35.1
percent in 2001/02 and worsened to 52 percent in 2008/09; 42 percent in the public
schools and 88 percent in the private schools.
Table 3-7: Indicators on Primary Teachers
2001/02 2002/03 2003/04 2004/05 2005/06 2006/07 2007/08 2008/09
TEACHERS 80,552 80,459 82,833 89,278 88,461 105,257 112,443 114,421
Untrained Teachers 28,238 29,866 32,296 37,608 38,654 49,459 57,266 59,488
% of Private 31.7% 30.0% 39.6% 40.8% 23.1% 20.7% 23.2% 22.2%
% of Untrained 35.1% 37.1% 39.0% 42.1% 43.7% 47.0% 50.9% 52.0%
% of Untrained Public 22.8% 26.5% 26.2% 27.7% 32.9% 37.9% 40.6% 41.6%
% of Untrained Private 83.0% 84.7% 84.5% 85.0% 85.5% 83.6% 87.6% 88.4%
% of Female 32.1 32.8 32.0 31.1 33.9 27.7 33.0 33.9
PTR 32.1 31.4 34 34.9 35.7 33.5 34.1 32.4
PTTR 49.4 49.9 53.2 56.7 62.7 60.3 65.5 67.5
PTR in Private 29 27 27 27 26 26 25 26.3
PTTR in Private 170.3 178.6 174.0 178.3 180.2 157.6 203.7 227.6
PTR in Public 33 32 34 35 38 33 34 34.2
Source: EMIS.
170. Ghana has not been able to hire enough qualified teachers to keep up with the
rapid expansion of enrollments and has had to rely on many new teachers without
training. Ghana now lags behind the Sub-Saharan average of 85 percent trained teachers.
While the PTR is in Ghana is significantly lower than the SSA average, the PTTR is
higher.
Figure 3-7: International Trends in Trained Primary Teachers and Primary PTRs
Source: Based on data from UNESCO, 2008.
171. Disparities in pupil per trained teacher ratios (PTTR) within Ghana are even more
significant. While the national PTTR for primary level in 2008/09 was 67.5, in about one
quarter of the disctricts, the average PTTR was 100 and within ten of these districts there
were over 155 students for every trained teacher. All of the these were located in the
72
50
27
59
8585868792949699100
53
40
21
40 40
24
31
4539
63
4437
35
0
1020
30
4050
60
70
8090
100
Tanza
nia
Ken
ya
Vietn
am
El S
alva
dor
Nig
er
Bot
swana
Lao DPR
S
SA
Pak
ista
n
Ben
in
GHAN
A
Nig
eria
Chad
% o
f T
rain
ed
Pri
mary
Teach
ers
0
10
20
30
40
50
60
70
Pri
mary
PT
R 0
6'
% of Trained Primary Teachers 06’ Primary PTR 06’
Page 93
67
Northern, Upper West, Upper East and Western regions. On the opposite end, 12 districts
with a public primary PTTR of 35 or below were found, all within the Eastern, Volta and
Ashanti regions. A glance at Map 3-1 verifies that the strongest deployment and retention
of trained teachers is found in these three regions and the Greater Accra area.
172. There is significant unwillingness among trained teachers to except postings in
more rural areas, for instance, in the Northern region, where 5 of the 10 districts with
public primary PTTRs of 155 or greater are located. In 2008/09, the district-level pupil
trained teacher ratio in public primary schools ranged widely from 23 to 390. Trained
teachers are not inclined to accept postings in many of the districts afflicted with diverse
infrastructure deficiencies as well as socio-cultural and geographic hurdles. Trained
teacher retention is particularly low in communities affected by poor infrastructure,
whereby many teachers lack basic access roads to commute to remote schools. They are
less motivated to instruct in environments with a low prevalence of accessible drinking
water. They have fewer incentives to reside in communities with limited and in some
cases no access to a functioning grid line or with long distances to a hospital or police
services. Especially in areas of the North, the fact that many teachers have scarce access
to communication facilities helps to deter their retention and, to a larger extent, hinders
their initial deployment. The Northern region’s Gushiegu district, where only 21.4
percent of primary teachers had formal qualifications in 2008/09, is known as a conflict
zone that consequently experiences many difficulties in attracting qualified – and even
unqualified – teachers.
Map 3-1: District Level average PTR in Primary Schools, 2008/09
Source: Based on EMIS.
Note: Data is for public schools.
Page 94
68
The following table shows the districts with the highest and lowest primary PTTRs.
Table 3-8: 20 Districts with the Highest and Lowest Primary PTTRs, 2008/09
Districts with Highest Primary PTTR Districts with Lowest Primary PTTR
1 Bia, WESTERN 450.9 1 Ho, VOLTA 26.6
2 Karaga, NORTHERN 219.9 2 Akwapim North, EASTERN 28.9
3 Amenfi West, WESTERN 203.4 3 Asuogyaman, EASTERN 34.6
4 Saboba-Chereponi, NORTHERN 200.7 4 Hohoe, VOLTA 35.0
5 Wa West, UPPER WEST 182.0 5 Yilo Krobo, EASTERN 35.3
6 Yendi, NORTHERN 181.8 6 South Dayi, VOLTA 36.1
7 Gushiegu, NORTHERN 175.7 7 North Dayi, VOLTA 36.6
8 East Gonja, NORTHERN 175.4 8 East Akim, EASTERN 38.3
9 Garu-Tampane, UPPER EAST 171.7 9 Akwapim South, EASTERN 39.1
10 Juabeso, WESTERN 169.9 10 Adaklu-Anyibe, VOLTA 39.6
Source: Based on EMIS. Note: Data includes both public and private schools.
Teachers for Junior High School Education
173. The proportion of untrained teachers in JHS increased between 2001 and 2008
from one fifths to over a third while their total number grew by 160 percent indicating
that as enrollment grows, so does the share of untrained teachers. Their proportion is
three times larger in private JH schools than in public JH schools.
Table 3-9: Indicators on JHS Teachers
2001/02 2002/03 2003/04 2004/05 2005/06 2006/07 2007/08 2008/09
TEACHERS 47,445 49,270 51,419 55,958 56,485 67,005 73,656 75,409
Unqualified Teachers 10,138 12,585 13,807 16,380 16,565 21,692 25,653 26,427
% of Private 15.7% 15.7% 19.0% 22.4% 18.9% 19.1% 20.8% 21.5%
% of Untrained 21.4% 25.5% 26.9% 29.3% 29.3% 32.4% 34.8% 35.0%
% of Untrained Public 12.5% 16.5% 15.8% 16.4% 18.9% 22.8% 23.6% 23.3%
% of Untrained Private 69.1% 73.9% 74.0% 73.7% 74.0% 73.1% 77.6% 78.0%
PTR 18.2 17.6 18.6 19.0 19.4 17.6 17.4 17.0
PTTR 23.2 23.6 24.4 25.5 26.1 25.0 25.5 26.2
PTR in Private 17 16 15 15 15 14 14 13.7
PTTR in Private 53.9 61.6 57.3 56.8 57.0 52.3 60.7 62.2
Source: Based on EMIS.
174. There are also significant regional variations in the share of trained JHS teachers.
The Greater Accra region had by far the highest concentration of qualified teachers in
public junior high schools; 93.7 percent of male teachers and 98.1 percent of female
teachers were trained. In contrast, the Upper East had the lowest proportion of public
instructors with formal qualifications, where 64.6 percent of male teachers and 77.5
percent of female teachers had acquired teacher training. It is also noticeable that among
female teachers, the share of trained teachers is higher and in some deprived regions,
such as the Upper East and to some extent in the North, the share of trained teachers in
private schools relative to the share in public schools is much higher than in the rest of
the country.
Page 95
69
Figure 3-8: Trained JHS Teachers in 2008/09, Public/Private and Male/Female
Source: Based on EMIS.
175. At the senior high school level, 18 percent of teachers are untrained (14 percent at
public and 42 percent at private schools). Both the share of untrained teachers and the
pupil trained teacher ratio have declined in the last four years. Meanwhile, while
efficiency of teacher distribution has declined, it is much higher than at various levels of
basic education.
Table 3-10: Number of SHS Teachers, Qualified/Unqualified
2005/06 2006/07 2007/08 2008/09
Total Teachers 15,658 20,055 21,449 22,521
Qualified Teachers 12,150 16,413 17,674 18,765
Unqualified Teachers 3,508 3,642 3,775 3,756
% of Unqualified 22% 18% 18% 16.7%
% of Unqualified Public 20% 15% 14% 13.2%
% of Unqualified Private 44% 42% 42% 42.2%
PTR 24.6 24.2 21.2 21.8
PTTR 31.6 29.6 25.7 26.1
Source: EMIS.
The Challenge of Getting Teachers Trained, Deployed and Motivated
176. A large number of unqualified teachers, about 71,000 in 2006-2007 and 81,000
the following year, are teaching in Ghanaian basic schools. These include (i) about
22,000 new graduates doing one year’s national service in Ghana’s schools; (ii) about
12,000 more, young and sometimes older, people teaching as volunteers under a National
Volunteer Scheme and (iii) 9,000 students in the final year in teachers’ colleges teaching
full-time in schools as part of their teachers’ course. In addition, qualified teachers are
not deployed where they are needed and urban areas and richer districts benefit more than
poorer, rural areas.
177. The Teacher Education Department (TED) of the GES manages and funds 38
teacher training colleges in different regions; they offer 2-year single-subject and 3-year
dual-subject courses. These courses lead to the award of the Teachers’ Certificate A. In
2005, each of these colleges began to offer a full-time 3-year Diploma in Basic
Education. Again, one of these years (the final year) is spent as a teacher-in-training in a
school. The Diploma is intended to qualify graduates to teach in basic education
0.0%
20.0%
40.0%
60.0%
80.0%
100.0%
Public M 93.7% 76.9% 66.6% 75.7% 71.5% 57.3% 77.0% 63.0% 61.7% 64.6%
Public F 98.1% 92.8% 90.9% 89.1% 89.1% 87.4% 85.3% 80.0% 79.0% 77.5%
Private M 28.4% 20.1% 23.7% 18.0% 14.0% 12.9% 14.2% 32.0% 16.0% 47.2%
Private F 39.9% 21.3% 26.7% 16.8% 19.4% 19.9% 15.5% 30.0% 0.0% 57.1%
GREATER
ACCRAASHANTI CENTRAL EASTERN
BRONG
AHAFOWESTERN VOLTA NORTHERN
UPPER
WEST
UPPER
EAST
Page 96
70
institutions (K1 to JHS3) and is accredited by the Institute of Education, University of
Cape Coast (UCC). Applicants should have the equivalent of an aggregate score of 24 in
six subjects (English, mathematics, science and three others) in the Senior Secondary
School Certificate Examination.
178. The 38 public colleges of education graduate about 9,000 teachers each year for
primary and junior high schools and from 2009 will provide graduates for kindergarten
also. Given the current rates of teacher attrition, estimated at 5 percent, and the
population growth, this should be sufficient to maintain the current ratios. The two
education universities are graduating more than 3,000 young people annually in
education and these are qualified to teach in senior high schools.
Table 3-11: Enrollment in Teacher Training Colleges (TTCs)
2002/2003 2003/2004 2004/2005 2005/2006 2006/2007 2007/08
Intake
Total 8,167 8,980 8,989 8,538 9,401
% Female 45 43.90 42 42.60 46.60
Enrollment
Total 19,764 23,999 25,116 25,534 26,025 26,100
% Female 36 40.50 45 42.10 46.30 47.08
Teachers Produced 7,115 7,532 8,300 8,321
Source: Education Sector Performance Report 2008.
179. There are 6 public and 8 private universities in Ghana. Two of the public
Universities, the University of Education, Winneba, and the University of the Cape Coast
(UCC) specialize in education and UCC certifies the qualifications of the 38 teacher
colleges at diploma level. Each of these 2 universities offers degrees in education. In
addition, graduates from other universities can take a postgraduate certificate in
education, qualifying them to teach. In 2008, UCC graduated 1,728 students from its
whole-time education programs.
180. There are four channels teachers can use to improve their professional
competence. First, “Certificate A” teachers can apply for paid study leave and upgrade to
diploma or degree status. Second, the current “Certificate A” teachers can enroll in a
sandwich program to upgrade to Diploma level. Third, unqualified teachers can enroll in
a four-year distance teacher training program to obtain a diploma or degree qualification.
A fourth channel available to all teachers is one-off in-service training to support the
introduction of a new curriculum or a new topic within an existing curriculum, such as
ICT.
181. Study leave has been available to Ghanaian teachers since 1997. At any one time,
up to 15,000 teachers are enrolled in universities full-time to study for degrees. This is
highly valued by teachers and their unions. The expectation is that teachers will return to
teaching following the award of the degree and the Ghana National Association of
Teachers (GNAT) insists that numbers returning are high. However, there is some
dispute about the numbers that actually do return. The scheme is expensive as teachers
continue to be paid their salaries for the duration and Government pays all fees and
accommodation allowances. Table 3-12 shows the numbers on study leave to 2004.
Since 2001 the numbers have been falling; in 2008, 3,000 teachers were awarded study
leave and in all 12,000 teachers were out of their classrooms on paid study leave.
Page 97
71
Table 3-12: Number of teachers on study leave in relation to output from training colleges
Year No. graduating
from TTCs in July
No. approved for
study leave from
Sept.
% Equivalent of
TTC output
approved for study
leave
Pool of Available
TTC graduates
1997/98 6114 3149 52.0 +2965
1998/99 6858 4411 64.3 +2447
1999/2000 6417 6343 98.8 +74
2000/2001 6596 10103 153.0 -3507
2001/2002 6362 6247 98.2 +115
2002/2003 6955 6076 87.4 +879
2003/2004 4676 5000 107 -324
Average Addition to Teaching Service Each Year 378
Source: Akyeampong.
182. Sandwich program. The sandwich program for the Diploma in Basic Education is
open to all currently practicing “Certificate A” teachers. It takes two years and consists
of two 6-week semesters each year, with one semester for 6 weeks over the long vacation
and the second in two 3-week periods over the Christmas and Easter vacations. It is
managed and overseen by the Teacher Education Department of MOESS and delivered
by and in a number of the colleges of education. The Institute of Education, UCC
accredits the course. Since the inception of the program in August 2007, 10,950 teachers
have been enrolled and were expected to complete the upgrading program by May 2009.
It is estimated that there are approximately 60,000 “Certificate A” teachers who are
expected to upgrade their qualification to Diploma by 2013.
183. Untrained teachers in-service training The upgrading program for non-
professional teachers takes four years, and terminates with the award of a Diploma in
Basic Education. The Diploma is the same as that offered full-time in the colleges of
education. However, the program uses mainly distance education methods with teachers
continuing to teach in schools and provided with printed modules to study at the
weekends and in the evenings. Participants attend a one-week induction course and three
3-week residential courses each year. Participants are also supported as they stud4y by
district support cadres who work with teams of 20 trainees holding tutorials at regular
intervals.
184. The program began in 2005 with an enrollment of 5,000 untrained teachers from
the Northern Regions and has now reached nationwide coverage of 27,183 teachers.
Table 3-13 shows the number enrolled in recent years.
Table 3-13: Admission in Untrained Teachers Training Program
Phase Start Date Total
1 - 3 Northern Regions and Afram Plains District 2005 5,119
2 - Ashanti and Brong Ahafo Regions 2006 7,627
3 - Central, Western and Eastern Regions 2007 8,994
4 – Volta and Greater Accra Regions 2008 5,439
Total 27,183
Page 98
72
185. Cluster-based in-service training. Since 2006, The Japan International
Cooperation Agency (JICA) has been assisting TED to pilot a new national mode of
school-based and cluster-based in-service training. This has operated successfully in ten
districts (one in each region) and it is intended to extend it to a further 71 districts in 2009
and to all districts in 2010. The new modality is demand-centered and involves one
Cluster Leader (CL) in each school (chosen by the head-teacher and receiving training at
district level). The CL brings together all teachers in each school twice a term. Schools
are linked in clusters of three to five schools and the teachers in a cluster meet once a
term. At district level there is a district in-service training committee and a district
teacher support team
186. At basic education level, teacher numbers are determined nationally based on
enrollment in each district. Teachers are assigned to districts on the basis of one teacher
and one assistant for 45 pupils at kindergarten and one teacher for 35 pupils at primary
level. However, class size is not expected to exceed 45 at either kindergarten or primary
levels and when the number exceeds 45 an additional teacher may be appointed. All
teachers are deployed by the district and then assigned to schools. Data are aggregated at
regional and national levels and this information guides the assignment of newly
qualified teachers and of national service and volunteer teachers. At junior high school
level teachers are appointed on the basis of five teachers (including the head-teacher) for
three classes and class size is expected not to exceed 40.
187. At senior high school level teacher numbers are determined nationally and
allocated to schools. The basis of the allocation is one teacher for every 25 students.
Teachers are recruited directly by the school. Again, demand is determined at district,
regional and national levels and vacancies are advertised. New graduates seek posts in
schools with vacancies and the schools interview and appoint. As was described the two
main teaching universities, University of Education, Winneba, and University of the Cape
Coast, offer a wide range of education degrees and graduate over 3,000 each year. These
are sufficient to take up the necessary vacancies.
188. At the primary level, the percentage of trained teachers in public schools has
decreased over recent years both nationally and for the 53 deprived districts. The
disparities between the deprived districts and the national averages have been increasing
over the same period. The same has occurred at the JHS level. These trends can at least
partially be explained by the increased number of national youth employment placements
in schools. The increase in the number of youth employment teachers is higher than the
rate at which trained teachers are graduating and existing teachers are upgrading.
Table 3-14: Percentage of Trained Teachers
2003/04 2004/05 2005/06 2006/07 2007/08
Kindergarten 35.3 42.9
Primary National 73.9 72.4 70.8 62.1 59.4
Primary Deprived 55.3 53.2 55.9 42.8 37.2
Junior High National 84.2 83.5 85.5 77.2 76.4
Junior High Deprived 75.9 73.9 77.7 64.2 62.9
Source: Education Sector Performance Report 2008.
Page 99
73
189. The ten districts with the lowest percentages of trained teachers are all deprived
districts. Paradoxically, MOE efforts to post national service teachers to deprived
districts drive the trained teacher share down. No national service teacher is trained as
they have just completed a first degree. Clearly, it is important that deprived districts
have sufficient numbers of teachers and assigning national service and volunteers helps.
Equally clearly, the ideal is to deploy qualified teachers to these districts.
190. Student teachers must receive an endorsement from a district before they are
admitted to teachers’ colleges. The deprived districts have a larger quota than other
districts. When students complete their course work, it is anticipated that they will be
assigned to the endorsing district. However, this has only been applied in recent years
and it is difficult to determine impact. In addition, national service and volunteer
teachers are assigned to deprived districts in accordance with vacancies and the success
of this effort is reflected in the overall number of teachers assigned to these districts and
within the district in the share of unqualified teachers.
191. The current national PTR averages at each level of education do not provide a
great deal of guidance for policy makers. First, as seen before, the national average is
different from regional averages and these in turn are very different from district and
school averages. Second, the ratios do not show the share of untrained teachers. Third,
there is a strong argument that the current average ratios are lower than is necessary for
the system and lower than is affordable for Ghana now.
192. Headteachers, also known as principals in other countries, are selected from the
ranks of serving teachers. Teachers who have reached the level of Principal
Superintendent (with at least 12 years experience, see section on pay later) are eligible for
consideration. No special training is given. Teachers are interviewed at district level and
appointed to the schools. They receive a modest allowance for their work as head-
teacher. Headteachers in one-stream schools teach half-time. Headteachers in two-
stream schools have a deputy head and do not teach. Headteachers in three-stream
schools do not teach and have two Deputies. In addition to managing the school and its
resources, headteachers are expected to support teachers in their work. In addition,
inspectors visit schools and work with teachers; circuit supervisors at primary level and
subject inspectors at high school level.
Table 3-15: Teacher questionnaire responses to management-related statements (rounded
percentages)
STATEMENT
RURAL URBAN
Agree Disagree Not
sure Agree Disagree
Not
sure
The head teacher of this school leads by
example 82 9 9 79 7 14
Teachers salaries are usually paid on time 50 36 14 57 14 29
School inspectors regularly visit this school 77 9 14 85 4 11
The impact of HIV/AIDS on teachers at this
school has not been serious 50 9 41 51 21 18
Our head teacher regularly observes classes 87 9 4 85 4 11
Our head teacher is often away from school on 0 95 5 11 75 14
Page 100
74
Source: Akyeampong and Asante
193. Whilst rural school heads seem generally happy with the behavior of their
teachers, urban heads complained that teachers were increasingly becoming rude and
difficult to manage. They attributed this to general apathy, especially among older
teachers. It may be that older teachers having experienced the frustrations in teaching for
longer are becoming less concerned about maintaining their sense of professionalism.
The school survey also showed that dismissals rarely occur, which could mean one of
two things: either the majority of teachers are professionally well-behaved or, more
likely, the general laxities in the Ghanaian occupational culture makes enforcement of
teacher regulations difficult (Hedges 2002). Most primary headteachers, as one union
official pointed out, “lack the authority that goes with being a head”, and therefore are
unable to initiate disciplinary measures against teachers.
194. Teachers’ pay compared to international norms. In real terms, teachers’ salaries
have increased consistently since 1990. Average median annual salary (at mid-point of
level 13) is US$3,600, which is roughly 5 times the per capita GDP. The average
cumulative in EFA FTI countries is 3.5 times the per capita GDP. However, the purchase
power parity in Ghana is roughly one third lower than in the rest of the EFA community,
which could serve as a justification for higher teacher salaries. In short, salaries are
higher because prices are higher in Ghana. (See the next chapter on education
expenditures for the analysis of the payroll)
195. The Best Teacher Award scheme is a nation-wide competition attracting publicity
at district, region and national levels. The national level awards are extremely valuable
and Ghanaian firms are given the opportunity to show their appreciation for the teacher
(and gain welcome publicity). In addition, Ghana has two teacher Unions and each of
these is active in pedagogy and advocacy. Discussions with teachers and Government
indicate that the unions are consulted on education reforms as well as on the conditions of
their members. While it is often difficult for Governments to meet expectations on
teacher pay, it is critical that discussions take place and that the power of the Unions to
contribute to education is realized. It appears that this is happening in Ghana.
196. Ghana’s national service scheme prioritizes education. Every Ghanaian student in
Ghanaian universities has his/her fees paid and is provided with an allowance for
accommodation, food and books. In return, all graduates must provide one year of
national service. This scheme prioritizes education and two-thirds of all graduates teach
for one year in schools. In addition, the scheme is targeted to deprived districts and helps
ensure that these districts and the deprived schools within them have some minimum
number of teachers in place. Separately, Ghana also runs a national volunteer scheme,
again targeted to education. Young and older people interested in making a contribution
to their countries development can volunteer to teach in schools.
private business
Our head teacher is often away from school on
official duties 41 59 0 29 64 7
Teacher transfers are managed well and fairly 50 27 23 50 25 25
Teachers sometimes come to school hungry 36 41 23 50 43 7
Teacher absenteeism is not a problem at this
school 86 9 5 68 18 14
Teachers at this school come to work on time 77 18 5 86 7 7
Page 101
75
C. Public Expenditures on Education
197. This review of public expenditures on education covers five areas: the sources of
education expenditures, the flow of funds, the aggregate trends in expenditures, the
geographical disparities, and the trends in teacher salaries.
Overall Expenditure trends10
198. Between 1976 and 1984, Government spending on education plummeted from 6.4
percent of GDP to 1.5 percent considerably constraining physical and human resources
and creating challenges in maintaining quality. From 1990 onwards, this share has
fluctuated between 5 and 6 percent of GDP. Throughout the last decade, spending
gradually increased in parallel with the enrollment increase. In 2008, government
spending on education reached about 11 percent of the GDP and about 30 percent of the
government budget.
199. Since 2003 total expenditure on education nearly doubled. Internal funding has
increased by 40% , and external support has almost quadrupled. Table 3-17 on
expenditures in million GHc in 2008 prices presents the series of spending in 2008 prices.
Education expenditure in terms of GDP is high. It was 6% in 2003 and reached 11% in
2008, well above the average in Sub Saharan Africa, demonstrating significant
commitment to education
Figure 3-9: Trend in Expenditure on Education as a Share of GDP
Source: Based on EMIS and UNESCO data.
200. Internationally, Ghana allocates a significantly larger share of its GDP to the
education sector than do other countries. For example, low income countries in sub-
Saharan Africa invest on average less than half the share of GDP on education that Ghana
does.
10 All financial information reported in this chapter is expressed in 2008 constant prices using the IMF
GDP deflator series for Ghana.
6.2% 7.3% 7.5%
8.2% 9.1%
11%
0.0%
2.0%
4.0%
6.0%
8.0%
10.0%
12.0%
2003 2004 2005 2006 2007 2008
Education Expenditure as a % of GDP UNESCO target of 6% of GDP
Page 102
76
Table 3-16: International Comparative Analysis of Public Spending on Education
Public spending on
education as % of
GDP
Total public
spending
as % of GDP
Public spending on
education as % of total
public spending
Ghana 2007 8.9 31 29
Low-income countries (i)
Sub-Saharan Africa 4.3 25 17
Other regions 4.3 31 14
Middle-income countries (ii)
Sub-Saharan Africa 5.7 35 16
Other regions 4.2 25 17
High-income OECD 5.6 45 12
Source: Preliminary Education Sector Performance Report, MOESS (2009) based on data from UNESCO
Institute of Statistics. Total public spending (middle column) is computed using the other two columns.
Note: (i) Countries eligible for lending from IDA. (ii) Countries eligible for lending from the IBRD. Table
does not include: i) countries in the World Bank's Europe & Central Asia region, and ii) countries, mostly
island states, with population less than approximately 300,000.
Expenditure trends by Funding Source
201. In the six years, 2003-2008, the total domestic funding for education doubled,
including a near doubling of Government support, a near tripling of funding from the
Ghana Education Trust fund, and a 60 percent growth in internally generated support.
The GoG budget also includes about 10 percent externally financed budget support.
Beyond the budget support, direct external financing of the sector has grown 4.5 times.
Given the sharp increase in economic growth, a doubling of the domestically funded
spending on education has increased the share of education within the GDP by 50
percent.
Table 3-17: Expenditures in million GHc in 2008 prices, 2003 – 2008
2003 2004 2005 2006 2007 2008
Domestic
GoG 667 677 729 863 1014 1219
GET Fund 79 95 107 153 192 213
IGF 0 91 104 136 129 164
SIF 0 0 7 5 0 0
Total 746 862 947 1157 1335 1596
External
Donor Agency 36 73 93 30 90 96
EFA Catalytic 0 0 5 4 12 4
Debt Relief 22 47 47 59 52 47
HIPC 22 47 47 59 47 23
MDRI 0 0 0 0 5 24
Total 81 191 253 226 347 385
Total (Domestic + External 827 1053 1200 1383 1682 1981
GDP (IMF data) 13064 13794 14603 15541 16423 17618
Domestically funded spending on
education as % of GDP 6% 6% 6% 7% 8% 9%
Total expenditure on education as % of
GDP 6% 8% 8% 9% 10% 11%
Source: Education Sector Performance report 2009. Note: All figures are reported in million GHc in 2008
prices.
Page 103
77
202. Expenditure trends by level. The significant increases in the budgets and in the
sources caused surprisingly little changes in the structure of expenditures by levels and
types of programs. The share of expenditure allocated to KG education decreased
between 2004 and 2008 from 5.4 to 4.5 percent, which shows a significant incongruence
between the official policy of making KG part of basic education and public financing.
There has been significant pressure on the Government to increase the share of primary
education in line with the EFA FTI guidelines. However, the increasing volume of
education expenditures meant such an increase has been unneeded. Consequently, the
portion of total expenditure assigned to primary education has fluctuated over the period;
it sunk from 39.2 to 35.3 percent between 2004 and 2006, then increased by 8.1
percentage points by 2008 to reach a share of 43.4 percent of the total public spending on
education. Primary education, hence, almost constitutes half of the entire education
budget, which is consistent with the EFA FTI norms. However, this share makes per
student spending on primary education relative to the per capita budget almost double of
the SSA average. The problems with using the EFA FTI norm in Ghana are several: First,
it doesn’t take into account the economic growth and subsequent growth in public budget.
Second, the Government budget in Ghana includes internally generated funds, thus
distorting the true picture of how the Government priorities are reflected in the
allocations. Basically, an increase in IGF in the form of more fees at tertiary level
decreases the share of the budget allocated to primary education. Third, using the
international norm doesn’t help the focus on the key problem in primary spending, i.e. the
regional disparities (to be discussed later).
203. The proportion of expenditure allocated to junior high school remained near the
20 percent mark, while the portion disbursed to senior high dropped from 13 to 8.8
percentage points since 2004. Overall trends indicate that as primary’s and tertiary’s
share of total government spending on education increased by 4.2 and 2.0 percentage
points, respectively, these additional funds to a large extent were reallocated from senior
high school, which shrunk by roughly 4.2 percentage points as a share of total education
expenditure.
Figure 3-10: Expenditure by level of education, 2004 and 2008
Source: Based on EMIS.
204. Expenditure trends by Categories: Since 2004 around 93-96 percent of
expenditure through the Ministry of Education has been allocated to personnel
0.054
0.392
0.196 0.130
0.006
0.006
0.051
0.013
0.148
0.004
2004 Pre-School
Primary
JHS
SSS
NFED
SPED
Teacher Education
TVET
Tertiary
Subvented Agencies& Management
0.045
0.434
0.202 0.088
0.005
0.006
0.041
0.011
0.168
0.000
2008 Pre-School
Primary
JHS
SSS
NFED
SPED
Teacher Education
TVET
Tertiary
Subvented Agencies& Management
Page 104
78
emoluments. The remaining 4-7 percent is distributed among administration, service and
investment. Between 2004 and 2008, the share of expenditure allotted to administration
rose from 2.2 to 3.6 percentage points, but has been declining after peaking in 2005, and
the portion distributed to service sunk by 2 percent from 2.4 to 0.4 percentage points over
this period. The proportion allocated to investment reduced from 0.9 to 0.1 percentage
points during this time span, however, most of the investments into education are covered
through various statutory funds, especially through the GET Fund and are not counted in
this data. As the proportion of administration, service and investment expenditure has
been sinking since 2005, public funding is being reallocated into personnel emolument
costs.
Figure 3-11: Trends in MOE Expenditure
Source: Based on data from EMIS.
205. Total Expenditure trends by sources and by level. Total expenditure on the sector
in 2008, as seen in Table 3-18, was GHc1,744 million, 6 percent of which from donor
funds. Adding HIPC and MDRI funds, classified under “Other” rather than under
“Donor” in the MoE ESPR, donor funds reach 10% of the total expenditure. Table.. show
that recurrent expenditures in 2008 was GHc 243 million, 3% of which was donor
funded, and Capital expenditure (table..) was GHc183 million, 20% of which was donor
funded. These figures do not include expenditures from the MPs fund, DACF and all off
budget donor spending on education. It therefore does not represent the full education
sector spending. Spending on Primary Education constitutes 43% of total government
spending on education and 63% of total government spending on the basic cycle.
94.4% 93.2% 93.6% 94.3% 96.0%
2.2%
1.3% 1.3%
0.4%
0.9%0.6%
3.6%
5.0%4.7% 4.6%
2.4%
0.7%
0.1%
0.4% 0.4%
0.0%
10.0%
20.0%
30.0%
40.0%
50.0%
60.0%
70.0%
80.0%
90.0%
100.0%
2004 2005 2006 2007 2008
Pers
on
nel
Em
olu
men
ts (
PE
)
0.0%
1.0%
2.0%
3.0%
4.0%
5.0%
6.0%
Ad
min
ist.
/Serv
ice/I
nvest.
PE Administration Service Investment
Page 105
79
Table 3-18: Total expenditure in million GHc by source and level, 2008
GoG % Donor Other11 Total %
Basic education
Kindergarten 54.28 4% 6.02 5.60 66 4%
Primary 529.45 43% 50.59 33.62 614 35%
Junior High 245.98 20% 25.59 20.85 292 17%
Second cycle
Senior High 106.99 9% 6.70 57.37 171 10%
TVET 13.55 1% 1.24 3.52 18 1%
Special education 6.88 1% - 3.79 11 1%
Non-formal Ed. 6.33 1% - - 6 0%
Teacher Education 50.34 4% 0.32 4.61 55 3%
Tertiary education 204.97 17% 7.39 166.25 379 22%
Mgt & Subv. 0.26 0% 1.48 128.27 130 7%
HIV AIDS - 0% 1.33 - 1 0%
Total 1,219.03 100% 100.65 423.89 1,744 100%
Percentage 70% 6% 24% 100%
Source: Education Sector performance report 2009. Note: Others include: HIPC, GET Fund, IGF, MDRI.
206. Recurrent expenditures by source and by level: Table 3-19 shows the amounts
and shares of recurrent expenditures by source and level. The Government recurrent
expenditures are mostly used to pay salaries. Primary, JHS and Tertiary levels take as
much as 80 percent of the total Government recurrent expenditures. Even though KG is
part of the basic education cycle, the Government spends very little on KG salaries at 4
percent -- just over 54 million GHc -- leading to high PTR, large disparities and
inequitable distribution of KG, discriminating against poor and remote areas of the
country (as will be discussed in the next chapter on performance). The relatively low
percentage of SHS relative to the JHS recurrent reflects the low transition rate between
basic and post-basic education. Donor funds represent a relatively low level of
contribution, however, most (2/3rd
) of donor funding to education comes indirectly
through budget support. Other funds include large allocations to tertiary and to sector
management.
Table 3-19: Recurrent expenditures in million GHc by source and subsector, 2008
GoG % Donor Other Total %
Basic education
Kindergarten 54.28 5% 3.23 2.89 60 4%
Primary 529.45 43% 28.20 17.32 575 38%
Junior High 245.98 20% 14.51 12.70 273 18%
Second cycle
Senior High 106.67 9% 0.57 16.82 124 8%
TVET 13.49 1% 1.24 - 15 1%
Special education 6.83 .5% - - 7 0%
Non-formal Ed. 6.33 .5% - - 6 0%
11 Other sources include statutory funds and others that are not directly planned under the sector budget.
Page 106
80
Teacher Education 50.27 4% 0.32 - 51 3%
Tertiary education 204.92 17% 0.53 78.70 284 19%
Mgt & Subv. - 0% 0.31 114.43 115 8%
HIV AIDS - 0% 0.70 - 1 0%
Total 1,218.22 100% 49.62 242.86 1511 100%
Percentage 81% 3% 16% 100%
Source: Education Sector performance report 2009. Note: Others include: HIPC, GET Fund, IGF, and
MDRI
207. Investments to education: The MoE from its own sources spends very little on
investment and most of the MOE investment expenditures are externally funded (and
made part of the MOE budget) and concentrated in the Senior High cycle. A substantial
amount of investment – GHc150 million in 2008 – takes place through the Ghana
Education Trust Fund (the GET Fund), a statutory fund constituted of 2% of VAT
receipts. Although there are complex formulas regulating GET Fund spending, they are
rarely used, and the GET Fund tends to operate on an ad hoc basis. The GET Fund
disbursements in 2008 by type and subsector are presented in Table 3-21. Approximately
70% of GET Fund releases are in capital investment, the largest receiver of GET Fund
investment is the Tertiary subsector, followed by Senior High School and Primary.
Table 3-20: Capital expenditures in million GHc by source and subsector, 2008
GoG % Donor Other Total %
Basic education
Kindergarten - 0% 2.79 2.72 6 2%
Primary - 0% 22.38 16.30 39 17%
Junior High - 0% 11.08 8.15 19 8%
Second cycle
Senior High 0.32 40% 6.12 40.55 47 20%
TVET 0.05 6% - 3.52 4 2%
Special education 0.05 6% - 3.79 4 2%
Non-formal Ed. - 0% - - 0 0%
Teacher Education 0.07 9% - 4.61 5 2%
Tertiary education 0.05 6% 6.86 87.55 94 41%
Mgt & Subv. 0.26 32% 1.17 13.84 15 7%
HIV AIDS - 0% 0.63 - 1 0%
Total 0.81 100% 51.03 181.03 233 100%
Percentage 0% 22% 78%
Source: Education Sector performance report 2009. Note: Others include: HIPC, GET Fund, IGF, and
MDRI
208. GET Fund investment expenditures More than half of GET fund expenditures
continue to go to tertiary education including pre-service teacher education and less than
20 percent goes to regular basic education. This creates distortion for both: The
significant investment to tertiary education distorts that subsectors budget and sector
performance for two key reasons. The full spending on tertiary does not calculate the
recurrent implications of investments often resulting in low maintenance and low use of
new infrastructure. Secondly, not enough is being spent on improving the human
resources and creating incentives for young professionals to join the teaching force. The
Page 107
81
low level of investment in basic education perpetuates the difficulties with service
delivery especially in areas such as KG services in remote rural schools. It also limits the
Government’s ability to react to natural disasters, such as, for instance the 2007 floods in
the North, which destroyed over 150 schools and damaged many more. Despite
significant budget sources, the Government relied heavily on external funding to re-
establish the damaged infrastructure but to this date many classes are being held under
the trees in the North.
Table 3-21: GET Fund releases in million GHc by type and subsector, 2008
Basic education Recurrent Capital Total %
Kindergarten 1.39 2.72 4.10 2%
Primary 8.32 16.30 24.62 11%
Junior High 4.16 8.15 12.31 5%
Second cycle
Senior High 2.36 26.80 29.17 18%
TVET - 3.52 3.52 2%
Special education - 3.79 3.79 3%
Non-formal Ed.
Teacher Education - 4.61 4.61 3%
Tertiary education 19.54 72.77 92.30 48%
Mgt & Subv. 25.87 12.26 38.12 8%
HIV AIDS
Total 61.63 150.91 212.54
% 29% 71% 100%
Unit costs and Per Student expenditures
209. Table 3-22 compares unit costs across countries by level of education. It shows
that among sub-Saharan countries Ghana has the highest share of unit costs in primary.
Also JHS unit costs are higher than the Sub-Saharan African average, whereas SHS and
HE unit costs are marginally below the SSA averages. From an EFA perspective, these
allocations are considered to be progressive. However, without taking into account the
disparities among sub-groups within Ghana (to be discussed below), these averages do
not provide an accurate picture.
Table 3-22: Comparative Average Unit Costs as a Share of GDP Per Capita by Level
Country
Prim Unit
Cost
LS/JH
Unit
Cost
US/SH
Unit
Cost
HE Unit
Cost
GHANA 19% 35% 55% 297%
Sub-Saharan Africa Average 11% 29% 57% 314%
Burkina Faso 17% 19% 63% 244%
Gambia, The 16% 26% 47% 253%
Burundi 15% 64% 136% 363%
Nigeria 14% 20% 25% 111%
Benin 13% 11% 32% 134%
Mali 11% 26% 117% 187%
Guinea-Bissau 11% 17% 31% 124%
Page 108
82
Togo 10% 19% 32% 148%
Liberia 9% 21% 26% 98%
Sierra Leone 9% 29% 30% 340%
Rwanda 8% 51% 63% 790%
Cameroon 7% 32% 37% 80%
Guinea 6% 11% 9% 153%
Chad 5% 19% 25% 420%
Cote d'Ivoire 5% 19% 19% 220%
Source: Based on World Bank Data, 2008 and Ministry of Education.
210. Per child recurrent expenditure (PCE) on the primary cycle was GHc188 in 2008.
This includes the administrative overheads, but not expenditure on management and
subverted agencies. PCE for tertiary students is more than 10 times the PCE for primary
students. PCE has been on the rise in real terms since 2005 in all subsectors except senior
high school, where it decreased from GHc502 to GHc281.
Table 3-23: Per student recurrent expenditure by level, 2008
Source: Data from Education Sector Performance Report 2009. Note: All figures in 2008 GHc, * calculated
from 2007 data.
211. Table 3-24 below shows the evolution of the per student recurrent expenditures.
Primary education is likely the most reliable source given that over 95 percent is salary
(PE) and per teacher recurrent expenditure (PTE) hasn’t changed significantly.
Accordingly the almost 100 percent increase in recurrent expenditures over three years
reflects increases in average salaries. KG shows significant underfunding, lack of
publicly paid teachers and very low PTE. JHS is relatively higher than Primary. The
recurrent expenditure is pushed upwards by the low PTE. SHS is the only level where per
student recurrent expenditures declined showing that teacher supply couldn’t keep up
with the enrollment increase.
Table 3-24: Per student recurrent expenditure by subsector, 2005 - 2008
2005 % 2006 % 2007 % 2008 %
Pre School 43 46
Primary 97 100 113 116% 155 160% 188 194%
JHS 186 100 207 111% 215 116% 255 137%
SHS 502 100 333 66% 238 47% 281 56%
0
500
1000
1500
2000
2500
Pre School Primary JHS SHS TVET* Tertiary
Page 109
83
TVET 395 100 616 156% 566 143%
Tertiary 1588 100 1536 97% 1763 111% 2143 135%
Source: Data from the Education Sector Performance report 2009
All figures in 2008 GHc
212. Salaries constitute more the 80% of per unit recurrent expenditure in the entire pre
tertiary cycle, as shown in Figure 3-12.
Figure 3-12: Composition of per unit recurrent expenditure from all sources by subsector,
2008
Disparities in PCE
213. This section will present an estimate of the district level per capita expenditures.
The district offices are the smallest spending bodies in the administrative chain for which
records are available. Although a more accurate estimate of the disparities between per
student expenditures would be obtained by calculating the school level per unit
expenditure, there is no systematic record keeping of financial information at the school.
214. Actual expenditures classified by subsector, budgetary item and source were
collected from all districts for the financial years 2005 to 2009. These expenditure
figures by no means capture the entire spending on the education sector but capture the
lowest level for which records are available, removing the overheads from the upper
layers of administration. Thus, these unit costs provide (i) a closer picture of what the
actual per unit expenditures are, and (ii) a previously unexplored dimension of the
geographic variation in education expenditure.
Table 3-25: Reported Sources
GOG IGF DFID PPS OTHER
ASHANTI X X X X
BRONG AHAFO X X X
CENTRAL
EASTERN X
GREATER ACCRA X
NORTHERN X X X X X
0%
20%
40%
60%
80%
100%
Services 4.92 15.56 26.40 40.65 463.00
Administration 1.03 2.96 4.59 10.95 209.34
P.E. 40.48 170.51 225.74 229.51 1,470.55
KG Primary JHS SHS Tertiary
Page 110
84
UPPER EAST X X X X
UPPER WEST X X X
VOLTA X X X
WESTERN X X X X X
Note: OTHER includes HIPC, DONATIONS, GET Fund, and Unspecified
Table 3-26: Reported years
2005 2006 2007 2008 2009*
ASHANTI X X X X
BRONG AHAFO X X X X X
CENTRAL
EASTERN X X X X X
GREATER ACCRA X X X X X
NORTHERN X X X X X
UPPER EAST X X X X X
UPPER WEST X X
VOLTA X X X X X
WESTERN X X X X X
Note: For the year 2009, only the first 3 financial quarters were reported
215. Different funds are allocated across different budgetary items depending on the
nature of the funds. Personal Emoluments are exclusively covered by Government funds
and constitute the quasi totality of District Education Office (DEO) expenditures.
Administration, Services and Investment, on the other hand, tend to be covered by a
variety of other sources, mainly internally generated revenues and Donor Support. Donor
funds tend to cluster on Items 3 and 4.
Table 3-27: Funding Sources and Budgetary Items
Source
Item 1:
PE
Item 2:
ADMIN
Item 3:
SERVICE
Item 4:
INVESTMENT
Internal
GOG X X X X
IGF X X X
External
DFID X X
PPS X X
OTHER X X X
Note: OTHER includes HIPC, DONATIONS, GET Fund, and Unspecified
216. Per child expenditures12 (PCE) increase over the education cycle, with PCE in
the SHS cycle being approximately four times higher the in the Basic cycle. The average
12 The PCE is calculated as GOG expenditures – excluding investment – in a given subsector divided by
enrollment in the given subsector12.
Page 111
85
expenditure on a primary school child, measured at the district level, is GHc125. With
respect to the primary cycle: the lower secondary cycle receives 50% more and
Kindergarten only about 60% less.
217. The median PCE are consistently lower than the average PCE, indicating that a
more than half of the districts spend less than the average PCE. The high standard
deviation reported in district PCE indicates a substantial amount of cross district
variation. Table 3-28 highlights the value that demarcates the bottom third of the
distribution of PCEs in 2008, which is artificially chosen here as the largest acceptable
level of disparity between average and low PCEs. This already indicates a significant
disparity for KG compared to other levels, as the bottom third in KG is 50 percent of the
average PCE whereas it revolves around 70 percent for the other levels. This choice is in
line with the definition of deprived district – chosen to be the bottom third performing
district under a series of education indicators. PCE below the indicated value are referred
to as substandard in this section.
218. It is important to note that per child expenditures calculated from recurrent
expenditures aggregated at the national level presented in Table 3-24 are lower than
average per child expenditures calculated from district level recurrent expenditures
presented in Table 3-28. There may be several reasons behind such a discrepancy. Firstly,
expenditure aggregated at the national level may contain administrative overheads that
are not present in district level data. Secondly, districts may have poor book-keeping on
expenditures which may lead to under reporting of expenditures. Finally, there might be
leakages along the funding flow. Only a full audit of government expenditures can shed
light on the nature of such a discrepancy.
Table 3-28: Per Child Expenditure in 2008 GHc measured at district level
Teacher Payroll
219. This section will present a description of the structure of the Ghana Education
Service (GES) payroll and analyze the variations in teacher remuneration across
subsectors and geographical areas. Information on teachers for the purpose of this study
is available from three only partially overlapping sources as summarized in Table 3-29.
Full information is available but had to be forgone due to time constraints. This section
will draw from Payroll information from 2008 and 2009.
KG Primary JHS SHS
Average 47.04 125.24 196.23 511.96
Median 36.74 117.53 172.23 462.29
bottom third 23.48 90.09 134.02 363.07
bottom third/average 50% 72% 68% 71%
Standard Deviation 38.88 67.4 120.25 332.03
Min 5.16 11.52 20.35 16.09
Max 224.35 396.34 589.64 1,910.11
Page 112
86
Table 3-29: Sources of information on teachers
EMIS Payroll 2008 Payroll 2009
Subsector X X
Salary X X
Geographical area X X
The GES payroll
220. The GES payroll is made up of a 22-grade scale with a number of steps in each
for a total of 211 different salary points, known as the Ghana Universal Salary Scheme
(GUSS). This was based on the principle of equal pay for work of equal value. There are
four entry points to the payroll. Unqualified teachers with GCE O levels begin at Level 5
(GHc 1279 p.a.). Unqualified teachers with A levels enter at Level 7 (GHc 1719 p.a.).
Qualified teachers with a Certificate A begin at Level 10 (GHc 2678 p.a.). Over their
career, such teachers can move up to Level 16 (GHc 8237 p.a.). Graduate teachers
commence further up the scale at level 14 (GHc 4837 p.a., [US$3,720]). The salary scale,
with the correspondent salaries is plotted in Figure 3-13.
Figure 3-13: The GES salary scale
221. The GES payroll in 2008 counted approximately 250.000 individuals, classified
as teaching and non teaching. Teaching staff constitute 85% of the total and absorb 91%
of the total expenditure. 146,000 people, mainly teachers and headteachers, are paid for
by GES in kindergarten, primary and junior high schools and these take about 63 percent
of all GES salary costs. In addition, at least 30,000 are paid by the National Service fund
and a smaller number are paid by the Youth Employment Agency. At senior high school
level, GES pays for 33,500 staff, of whom about 19,250 are teachers. It is also of interest
to note that 12,650 teachers were on study leave in 2008 and these cost the Government
more than the total cost of all 138 district education offices.
Table 3-30: Payroll numbers GES 2008
Cost centre Number of staff Total wage bill ‘000 Ghcedis Share of wage bill
Headquarters 676 3301 0.4
District Education offices 10309 51262 5.6
Regional Education Offices 780 3967 0.4
Educational Units 1428 510 0.1
Study leave 12650 52376 5.6
Page 113
87
Trainees 22689 24492 2.7
Training college staff 3371 14721 1.6
Senior High schools 33512 148038 16.1
Technical schools 2161 9328 1.0
Special schools 1162 4696 0.5
Newly trained 11806 24499 2.7
Basic schools 146710 578912 63.0
Total 247254 921103 100
Source: Financial Controller, GES
222. Two thirds of the total teaching and non-teaching staff is employed in the basic
cycle, receiving approximately two thirds of the total expenditure. Within the Basic
cycle, 95% of staff is classified as teaching. Primary education employs 60% of the total
staff, Kindergarten 10% and Junior High 30%. Per unit expenditure on teaching staff are
highest in JHS, followed by primary and KG (Table 3-31). Teachers in the upper
secondary cycle are, as expected, better paid than those in the basic cycle. Figure 3-14
plots per unit expenditures by role and subsector, including per unit expenditure on
teachers on study leave. In 2008, there were 13,993 teachers on study leave; total salary
expenditure on them was GHc51 million.
Table 3-31: Staff in the basic cycle, 2008
Source: 2008 payroll. Note: Expenditure in million GHc, All figures in 2008 GHc.
Figure 3-14: Per unit annual expenditure by role and subsector, 2008
Source: Payroll 2008
223. Figure 3-15 overlays the active GES payroll in 2009 (red dots) to the relative
frequency with which each salary point is found in the 2009 payroll (blue line). The
Number Expenditure Per unit expenditure
kg
teaching 13711 39.37 2,871.09
non teacching 756 1.64 2,172.68
primary
teaching 86923 299.57 3,446.42
non teacching 4191 9.72 2,319.46
jhs
teaching 41907 164.88 3,934.35
non teacching 2991 7.32 2,446.94
basic
teaching 142541 503.82 3,534.53
non teacching 7938 18.68 2,353.51
-
1,000
2,000
3,000
4,000
5,000
6,000
7,000
Basic SHS TVET TTC Admin Study
leave
teaching
non teaching
Page 114
88
peaks in the blue curve indicate point on the salary scale with a higher concentration of
individuals. There are three major salary classes: unqualified, qualified and graduate.
Figure 3-15: Distribution over the GES salary scale, 2009
224. Figure 3-16 reproduces the relative frequency of salary points against the entry
points. The first salary class, covering approximately 35% of the total number of staff, is
made of staff entering the payroll with low qualifications. The second salary class,
covering approximately 42% of the total staff, is made of staff entering the payroll with
Certificate A, and the last salary class, approximately 21%, is made of graduate teachers.
Figure 3-16: Distribution of salaries and entry levels, 2009
Source: 2009 Payroll
Page 115
89
225. The difference in per unit expenditure is driven, as shown in Table 3-32, by
seniority. Teachers in Greater Accra have on average 4 years of service more than in the
rest of the country.
Table 3-32: Median years of service as of 2009 by region
Source: 2009 Payroll.
226. The GES payroll is very large and has a fairly complicated structure. With the
introduction of the Single Spine Salary Structure (SSSS) the GES payroll will have to be
suitably adapted. Remunerations on average are within internationals standards, although
there are large numbers of untrained teachers on relatively low salaries. An important
factor shown in table 3-33 is the substantially higher salary and number of years of
service of teachers in the Greater Accra region. It would appear that teachers tend, over
the course of their career to converge towards Greater Accra. Teachers in deprived areas,
conversely, are less paid and less experienced. An analysis of non teaching staff is
beyond the scope of this section, but the large number of non teaching/ auxiliary staff
cannot be overlooked.
years of service
in 2009
ASHANTI 8
BRONG AHAFO 9
CENTRAL 8
EASTERN 8
GREATER ACCRA 12
NORTHERN 7
UPPER EAST 6
UPPER WEST 7
VOLTA 8
WESTERN 10
Total 8
non deprived 9
deprived 7
Page 116
90
Table 3-33: Estimated Cost of Trained/Untrained Teachers in Primary 1-3
Source: J-PAL and IPA 2009.
Conclusion: Inputs and Resources
227. Even with Ghana’s extraordinary levels of spending on education, it is clear that
public funds cannot cover all minimum needs. Under these conditions, allocations should
be better prioritized and provisions adjusted to local conditions and need. A key example
is in teacher provision. In remote locations the use of various incentives to attract
teachers, especially trained ones, may be more important in affecting learning outcomes
than other resources, like class supplies or the number of classrooms. The government
has been trying to direct more resources to deprived areas. Most of the efforts have been
based on externally financed projects, including the pilot programmatic scheme by IDA
or lately funding for the deprived districts by USAID. But current administrative
structures have often left these efforts unsuccessful. In reality, the complexity of resource
allocation has led in many cases not to neutral allocation, but to negative targeting, as
poorer areas receive not more provisions but less. Therefore, decisions about prioritizing
the allocation of resources and the setting up of services will be most effective when they
follow some principles:
a) they are evidence based,
b) they promote policy goals by providing adequate incentives for key
participants including students, parents, teachers, headteachers, and
district officials, and
c) they are targeted so that those who need the most get the largest share of
public resources.
Table 1. Estimated Number and Cost of Trained and Untrained Teachers in Primary Grades 1-3 55%All figures in Cedis, unless otherwise specified
Number of
Teachers
Cumulative
PTR
estimates
Annual
salary per
Teacher
Estimated
Salaries
% of
Salaries
% of
Teachers
Avg Cost
per
Student
GES (Primary) 48,947 2,060 183,337,663 81% 61% 112
Trained Teachers 28,597 59 2,892 150,371,554 66% 36% 92
Untrained Teachers 20,349 34 1,620 32,966,109 15% 26% 21
NSS 17,600 3,960 33,660,000 15% 22% 21
Recent University Graduates 12,100 28 1,800 21,780,000 10% 15% 14
Volunteers (NVP) 5,500 25 2,160 11,880,000 5% 7% 7
0%
NYEP 13,200 640 15,364,800 7% 17% 10
Masters degree holders 1,320 25 3,000 3,960,000 2% 2% 2
University Graduates 2,640 24 1,800 4,752,000 2% 3% 3
High school Graduates 9,240 21 720 6,652,800 3% 12% 4
0%
TOTAL 79,747 2,914 232,362,463 100% 100% 143
Page 117
91
4. SECTOR PERFORMANCE
228. A variety of reasons can contribute to threats to -- and even decline in -- the
quality of learning. In urban classrooms this may include overcrowding; in remote areas
lacking access to qualified teachers, inadequate teaching methods that are not adjusted to
local conditions. The most critical issue for the Government is to identify those groups
and localities which are for one reason or another at risk of low attainment, high dropout
and low learning results and assign the available resources to address these potential
disparities.
229. As the previous chapters have shown, improvements in access have been the
result of a long period of sustained commitment to education both on the supply and on
the demand side. In addition, important external factors have played a role, including
economic and political stability, a reduction of poverty, and the recognition that
improvements in educational attainment bring about improvements in living standards
and earnings. But, we have also seen, improved access measured in admission and
enrollment has brought about new challenges in learning and education. Importantly,
subsequent Governments have maintained a strong commitment to education that had
been expressed in improved resources, investments into the physical infrastructure,
expansion of the teaching force, efforts to provide qualifications to teachers and
mobilizing a variety of financial resources.
230. Education has become the biggest public enterprise in Ghana, taking about 11
percent of the GDP, a third of the public budget, 40 percent of the civil service and
enrolling about a quarter of the population in schools and other education services.
Education has become a key part of the basic services, everybody has and most people
claim the right to receive quality education and expect that this will result in improved
living standards and job opportunities. This is good news: it lays the foundation of a
knowledge-based economic and social development. In the meantime, it makes education
a high risk business for politicians, policy makers, administrators, operators and
managers of education service delivery. How can exclusion, dropout, and repetition be
minimized, while learning is maximized? How can resources be used more efficiently?
How could the sector’s performance be improved? It is clear that paying teachers,
providing the capitation grant, printing textbooks, investing in infrastructure and school
feeding, maintaining services, information systems, administration, and records are all
important. But it is becoming clear that these are not enough. There are persistent and
also newly emerging challenges and new demands. Existing resources need to be used
more efficiently, policies need to be realigned and services need to be provided more
equitably. Also, the increasing number of stakeholders expects better accountability from
the providers. This chapter suggests using some of these expectations to measure the
performance of the sector and of the delivery of education services.
A. Equity and Disparity in Education Services
231. Education is considered to be among the great social equalizers, creating
opportunities for young people to improve their living standards, become upwardly
mobile, and break out of poverty that perhaps their parents’ generation was mired with.
Page 118
92
However, education can also be a key factor in reproducing or even strengthening
existing social inequities. If services are not accessible at the same levels to unprivileged
or disenfranchised groups, they likely fall further behind and risk not only sustained
deprivation but also social fragmentation. Access to quality learning has to be provided to
all children on equal terms.
232. Equitable education services usually indicate better sector performance, high
attainment, strong learning results on a massive scale, strong skills and strong relevance.
If access is inequitable, it diminishes the performance and compromises the social and
economic benefits. That is why the Ghanaian government has been committed to
equitable access. A number of policies support this goal, including, among others, the
elimination of fees, the provision of capitation grants and textbooks, school feeding and
the designation of deprived districts. But, by the same token, inequitable services,
disparities in access and in educational inputs could not only compromise the effect of
these policies but also result in greater social inequity and fragmentation.
There are three levels of potential policy actions in the context of disparities:
233. avoiding negative discrimination: At a minimum, the allocation of resources
should not discriminate along social, cultural or geographical grounds. If x amount is
available for education per student, the Government needs to assure that x amount is
allocated so that all students see the benefit of the inputs equal to this amount.
234. establishing specific policy incentives to improve supply of services: At a higher
level, Government resources can be allocated in a way that addresses specific difficulties
in education service delivery. If, for instance, enrollment and attendance is more
challenging in some areas, typically in the rural and poor Northern regions, the
Government conceives policies that address this specific educational problem. For
instance, teacher salaries can be topped up for those who are willing to teach in remote
areas, and accommodations or subsidized transportation can be provided to these
teachers.
235. Creating positive discrimination to stimulate demand: At the highest level, the
Government may develop policies that address underlying social and economic problems
by stimulating demand and thus access to education. These policies may include school
feeding, cash transfers or any type of extra provisions that relieve the burden on families
of sending children to school. Critical to the success of these measures is how they are
targeted and monitored.
236. In this section, we’ll analyze the equities and disparities in accessing education
services by income, gender and geographical location.
Household Income
237. A household’s level of welfare is a good predictor of whether a child is enrolled
in school. Although research results point to geography as the strongest determinant of
non-participation in basic education, it is closely interrelated with low income levels. The
three Northern regions are the most geographically isolated, have lower population
density, higher infrastructure and transport costs and a number of other geographic
factors that hinder development. Accumulatively this contributes to lower levels of
Page 119
93
welfare. The real challenge of meeting the Millennium Development Goals (MDG) is in
improving the education service delivery and incentive packages for the most poor and
rural children.
238. In Ghana, the poorest 20 percent of the districts based on household income, earns
roughly three times less than the richest. All districts falling into the poorest group are
located within the borders of the Upper East, Upper West and Northern regions,
representing a very strong link in Northern Ghana between physical remoteness and
income marginalization.
239. Although basic education in Ghana is free, compulsory and universal,
socioeconomic inequities help to explain performance of key education indicators, but so
do geographic disparities and, to a lesser degree, differences in gender. In terms of out-
of-school children, the poorest group of districts accounts for the vast majority. in the
negative influence of socioeconomic status increases incrementally with every higher
grade. Notwithstanding, the parity index (the ratio of the poorest to richest districts) in
primary net enrollment was 0.89.
240. The parity index in household income at the district level was considerably lower
at the JHS level, in relation to gross enrollment (.74) and net enrollment (.51). Thus,
youth of the appropriate junior high school age, reflected by net enrollment data, were
twice as likely to be enrolled in a junior high school if they resided in one of the districts
falling into the top group of districts compared to those in the bottom group of districts.
Not only do household income levels strongly influence access to education
opportunities, but the level of education one receives also tends to determine earnings
later in life. What the data in Figure 4-1 illustrates, is that the private costs of going to
school persist as a financial barrier for the most disenfranchised, so that targeted
measures to decrease school costs can make a difference.
Figure 4-1: Net enrollment at the basic level, by quintile
Source: Estimates based on GLSS 2005/06 and EMIS 2008/09.
241. Poverty as the most cited explanation for non-attendance. The most common
reason given for why children were not in primary school was that the costs were too
high, 41.5 percent of all reasons given, based on data from the Core Welfare Indicators
Questionnaire Survey (GSS 2003). The second most frequent cause was that school was
85
44 46
61
93 88 91
81
3731
20
30
40
50
60
70
80
90
100
Q1
(poorest)
Q2 Q3 Q4 Q5
(richest)Average Level of Welfare
NER Prim.
NER JHS
Page 120
94
considered unnecessary or uninteresting, with 34.6 percent of those examined believing
that the curriculum content and overall school relevance were limited in real life and
employment. Another study found that the indirect costs of schooling are such that they
were most commonly given as the primary cause for not being able to attend school
(Oduro 2000). Among the most prevalent and, for very poor households, burdensome
school expenses are the registration fees, school levies and costs associated with lunches
and uniforms (Oduro 2000). Registration fees, according to a study by Transparency
International (2009a), were reported being paid by 9 percent of surveyed parents. Within
classrooms, acquiring school supplies such as notebooks and textbooks can pose
challenges for poor children.
242. Outside classrooms, transport costs can contribute to the economic barriers. In
addition, according to a study by Transparency International (2009a), 48 percent of
households in Ghana indicated that they pay additional fees for private tutoring.
243. Wealth influences enrollment incrementally at each higher grade.
Socioeconomics incrementally gains significance at each higher level of education,
resulting in senior high students and, most profoundly, tertiary students coming generally
from the top quintile. Therefore, higher education has been characterizes as an institution
that tends to exclude the most economically marginalized segments of society, but other
factors add to this reality. Residing in urban environments strongly contributes to the
background characteristics determining tertiary enrollment, although males are also about
twice as likely to be enrolled in tertiary institutions as females. The gender parity index in
tertiary has been stagnate and has even declined in recent years, dipping to 0.49 in
academic year 2007/08.
244. A child from the poorest quintile is on average 3 years over grade-relevant age.
On average, children from households in the poorest quintile, which are strongly
concentrated within the three Northern regions, are about three years over the normal age
in their respective grade. Within the richest districts, children tend to be less than two
years older than the official age for their particular grade. The causes of being overage in
school are closely associated with income-poverty due to, for instance, the necessity to
help family members care for younger siblings or during times of harvest (i.e. child
labor), which may lead to postponed entry into primary one or frequent repetition as a
result of lost instruction time. The consequences of high age-grade delay are likely to
raise the public costs of schooling, strain the pedagogy process, reduce learning results,
and increase dropout rates and early labor force integration. It is essential to provide
incentives to, in particular, poor and rural households to ensure that children enroll at the
official age.
Page 121
95
Figure 4-2: Mean Age-Grade ‘Delay’ per Pupil, by Household Welfare Quintile
d)
Source: Based on GLSS5.
245. Poorer quintiles have much lower completion rates. Students from economically
deprived households have not only fewer chances than their rich counterparts to be
enrolled in school, but those that are have an even smaller probability of completing a
given cycle.
246. While some children drop out and don’t complete as a result of monetary
obstacles, other children come to school late and leave early due to local economic
activities such as farming and fishing above all in rural and poor-urban communities. A
survey assessing the extent of child labor on cocoa plantations in Ghana and Côte
d’Ivoire reported cases of children having to use toxic pesticides, work in conditions of
very high temperatures and use dangerous implements (Payson Center for International
Development 2008).
247. Data in Figure 4-3 illustrate the higher probability of students completing basic
education, if they come from districts with higher levels of welfare. On average, about
four in every five students complete primary school, if they attend schools in one of the
poorest 20 percent of the districts. In contrast, 96 percent of children complete the
primary cycle, who go to schools located in districts of the top quintile. Thus, data
disaggregated by levels of income paint a clearer picture of the education landscape. If
the wealthiest 20 percent of Ghanaians constituted their own country, it would have
nearly achieved universal completion in primary. In junior high schools, the likelihood of
a student completing averaged between 84 percent for those residing in one of the
districts falling into the richest quintile and 58 percent for students in one of the districts
of the bottom quintile, all of which are located within the three Northern regions of
Ghana.
01
23
4
mea
n 'd
elay
' in
year
s
1 2 3 4 5
Mean Age-Grade 'Delay' Per Pupil by Household Welfare Quintile
welfare quintile
Page 122
96
Figure 4-3: Primary and JHS Completion Rate, by Quintile
Source: Estimates based on GLSS 2005/06 and EMIS 2008/09.
248. Trained primary teachers are almost twice as scarce in the poorest districts. The
degree of inequity in the distribution of trained teachers throughout the education system
is significant, as illustrated earlier in terms of inter-regional variations and displayed in
Figure 4-4 as to disparities across quintile levels. Within districts classified into the
poorest quintile, there were about 127 students per trained teacher in primary schools in
2008/09, while the primary PTTR reduced approximately to half in the fourth and fifth
richest quintiles. Of the 138 districts in Ghana, one finds that 10 of the 20 districts with
the highest PTTRs also fall into the group of districts within the bottom quintile, all of
which are located within the Northern (7), Upper West (2) and Upper East (1) regions.
249. It is critically important to mobilize trained teachers into such districts afflicted
with the poorest conditions in the country, since they tend to be accompanied by severe
infrastructure deficiencies and have by and large more difficult living conditions. This is
where hardship allowances, offering free housing accommodations, mobilizing newly
graduated teachers and other innovative enticements can play a crucial role in
incentivizing trained teachers to accept difficult-to-fill postings.
81 80
8886
96
58
66
77
8184
50
60
70
80
90
100
Q1
(poorest)
Q2 Q3 Q4 Q5
(richest)Average Level of Welfare
Primary
JHS
Page 123
97
Figure 4-4: Primary PTTR in Districts, by Quintile
Source: Estimates based on GLSS 2005/06 and EMIS 2008/09.
250. Poorest performers come from poorest quintile. As a result of their inferior
learning conditions, children from poorer households acquire fewer competencies in the
core subjects of English and math, arguably the epicenter of primary schooling. Children
residing in the economically most affluent 20 percent of the districts, measured by
household income levels, answered an average of 46 percent of the questions on NEA
English exams in 2007 correctly, compared to only 37 percent among the children
coming from the 20 percent of the income-poorest districts. As to NEA math results, the
learning gap between the richest and poorest quintile was nearly as wide, so that the top
quintile answered a total of 37 percent of the questions correctly, whereas the bottom
quintile averaged 31 percent. 7 of the 20 districts with the poorest results on NEA English
and 11 of the 20 lowest performing districts on NEA math assessments are located within
the three Northern regions. This link is also consistent in the top quintile, in which many
of the income-wealthiest and highest performing districts on both NEA English and math
are disproportionately concentrated within and near the borders of the Greater Accra and
Eastern regions. Large disparities not only exist across quintiles but also between districts
themselves.
0.0
50.0
100.0
150.0
200.0
250.0
Q5
(richest)
Q4 Q3 Q2 Q1
(poorest)
PTTR Avg. 67 58.6 95.1 106.9 126.6
Ho district (Volta) 26.8
Karaga district
(Northern) 219.9
Note: Bia District
(Western), as an outlier
with a PTTR of 450.9, is
not illustrated.
Page 124
98
Figure 4-5: NEA learning results in districts for primary 6, by quintile
Source: Estimates based on GLSS 2005/06 and NEA 2007. Box 4-1: An Outlier in Learning Achievement - Talensi-Nabdam’s success at a Glance
General trends in learning outcomes appear to be consistent with background factors such
as welfare levels, although some outliers do exist. Among them, the most profound is the
Talensi-Nabdam District (Upper East), with average learning results on NEA math exams
in 2007 making it the country’s leader. Talensi-Nabdam, ranks as the 18th poorest district
in Ghana, and it’s learning success is difficult to explain. In 2008/09, its gross enrollment
in primary was significantly below the national average of 95 percent, reaching merely 79
percent. And only 66 percent completed. The pupil teacher ratio at the primary level was
43.2 (nationally, 32.4) and the PTTR was 128.1 (nationally, 67.5). Only 34 percent of the
teacher work force was trained (nationally, 48%). In some respects, marginalization of
girls and women persists in the Northern areas of Ghana, although gender parity in
primary is on the rise in Talensi-Nabdam, reaching 0.89 in 2008/09, but lagging behind
the national mean of 0.96. Indicators show that the district tends to perform overall
poorer than the national average in key areas, although variations from Ghana’s mean are
smaller in terms of school materials and facilities. The district did, however, have slightly
more core textbooks per pupil and a greater percentage of schools with access to potable
water. On NEA English assessments the district also performed better than the national
mean in 2007 (41) with a score of 45. What then helps to explain its high learning
outcomes? In part, its status as a deprived district has helped in securing additional
resources to improve its schools infrastructure and performance. It appears also that
district administrators and head teachers place a stronger emphasis on acquiring core
mathematic competencies, as is the case in many Ashanti districts. Talensi-Nabdam
shows that in spite of geographic, economic and demographic obstacles as well as other
development hindrances, income-poor districts can still break the ‘low performance trap’.
251. As data results indicate, location and affluence are very important predictors of a
student’s performance, with one’s prospects for educational achievement being
10
20
30
40
50
60
70
Q5
(richest)
Q4 Q3 Q2 Q1
(poorest)
Q5
(richest)
Q4 Q3 Q2 Q1
(poorest)
English Avg. Math Avg.
46 42 41 40 37 37 34 33 32 31
Tema District (Greater Accra) 60
Mamprusi East District (Northern) 21
Saboba-Chereponi District (Northern) 25
Talensi-Nabdam District (Upper East) 49
Page 125
99
influenced in good measure by one’s place of residence and one’s household background.
On NEA English exams in 2007, 6th
graders who scored on average highest resided in the
Kumasi district (Ashanti) and the Tema district (Greater Accra), with students answering
59 and 60 percent of the questions correctly, respectively. In contrast, 6th
grade students
in the poorest performing districts, the Saboba-Chereponi district (Northern) and the
Juabeso district (Western), were only able to answer on average 25 and 26 percent of the
questions correctly, respectively.
252. Northern region is poorest as to income and JHS learning results. Differences in
learning achievement are significant across regions as well as across quintiles and,
although to much lesser extent, also in terms of gender, mainly in math results. On
average, about 63 percent of students going to schools located in districts of the top
quintile passed the BECE exams in 2008/09, whereas only 40 percent of students who
resided in the districts of the poorest quintile passed, the outcome of which is a parity
index of 0.63.
Figure 4-6: BECE English Pass Rate in Districts, by Income
Source: Based on data from GLSS, 2005/06; EMIS, 2008/09.
253. For social cohesion it will be important to tackle large inequities. Viewing the
parity indexes, if the Government of Ghana has the intention of strengthening demand-
side targeting to the children of the poorer or poorest quintiles to reduce socioeconomic
disparities, it would seem more sensible from a policy perspective to ensure that the pupil
per trained primary teachers ratio (.53 parity index) is reduced by deploying more trained
teachers in districts with the lowest income levels.
254. Figure 4-7 shows the distribution across wealth quintiles of children not attending
school, as well as those attending primary and secondary. While 33 percent of Ghanaians
in the poorest quintile have not attended a primary school, the corresponding share was 8
percent in the richest quintile. Based on 2008 data from GDHS, net enrollment shares
among students in the bottom quintile were 59.1 percent in primary and 22.2 percent in
secondary, whereas these figures in the top quintile were 85.9 percent in primary and
60.7 percent in secondary.
0.00
0.10
0.20
0.30
0.40
0.50
0.60
0.70
0.80
0.90
1.00
- 1,000,000 2,000,000 3,000,000 4,000,000Level of Household Income (old cedis, 2006)
BE
CE
En
gli
sh
Pass R
ate
Districts in the Northern region: Gushiegu, Karaga,
Bunkpurugu-Yunyooa, Nanumba South and Central Gonja.
Page 126
100
Figure 4-7: Non-attendance and net enrollment in basic education, by quintile
Source: 2003 data on not attending school: Harttgen et al. 2008; 2008 data on primary and secondary
school: Ghana Demographic and Health Survey, 2009.
Note: Secondary school includes both junior and senior high schools.
255. Income-levels determine access to tertiary. As mentioned, a household’s level of
welfare strongly helps to understand why some children have access to higher levels of
education, while others don’t. In essence, levels of income determine an individual’s
accessibility to tertiary institutions, with 9.6 percent of all pubic tertiary students coming
from the poorest two quintiles and 66.9 percent coming from the richest quintile in
2005/06.
Table 4-1: Enrollment in Secondary and Tertiary Public Schools, by Quintile
Quintile Secondary (2005/06) Tertiary (2005/06)
Poorest quintile
2nd
quintile
3rd
quintile
4th
quintile
5th
quintile
Richest to poorest
12.1
17.2
23.7
23.3
23.8
2.0
1.8
7.8
9.4
14.1
66.9
37.2
Source: Based on GLSS 2005/06.
256. Identifying new deprived districts based on education performance and income.
In terms of policy formulation, there are options for the Ministry of Education to be able
to link the promotion of the national development objective of poverty reduction with the
improvement of key education indicators. This could be attained by targeting measures to
the income-poorest districts that at the same time have the poorest results on key
education indicators in the country. Thus, making gains on pro-poor growth and income-
poverty alleviation can be combined with achieving education targets, a political
aspiration of many developing countries. Meeting economic and education goals
simultaneously and with greater impact can be achieved by reducing the number of
deprived districts, both in terms of income and education performance, from 53 in 2010
to a significantly smaller number .
33
59.1
22.2
27
71.9
34.9
19
76.5
41.7
13
81.8
51.3
8
85.9
60.7
0 20 40 60 80 100
Not attendingschool
Primary school
Secondaryschool
Highest
Fourth
Middle
Second
Lowest
Page 127
101
Gender Parity, Gender Equity
257. Studies have shown that the persistent factors affecting girls’ enrollment and
retention patterns include domestic obligations, sexual harassment in school, pregnancy
and early marriage, and traditional attitudes, especially in some communities in Northern
Ghana, regarding the importance of girls’ education and the role of girls within
communities and families.
258. The Northern region presents the lowest ratio of girls to boys in primary school.
This is also the case in junior high school. About twice as many boys are enrolled as girls
in several districts within the Northern region, where the gender parity index in junior
high school only reached 0.50 in Tolon-Kumbungu, followed by Nanumba South with
0.51 and Savulugu Nanton with 0.56. The figure below shows that while income rises, so
does gender equality, other social and cultural aspects also have an effect.
Figure 4-8: Gender Parity Index in Primary and JHS, by Income
Source: Calculations based on GLSS 2005/06 and EMIS 2008/09.
259. While policies addressing the issue, such as sensitization, community outreach,
and hiring more female teachers, are very important, the Government also has some
effective economic and educational instruments that can help break major gender
barriers. The first issue is to recognize the age and grade where interventions are most
needed. When girls in Ghana drop out, they typically do so following the fourth grade or
else following the end of primary education. Gender parity significantly drops at JHS
level. Key concerns for families at this age is hygiene and security. Separate toilets, for
instance, have proven to be an effective incentive. Girls are considered from age 12 or 13
to be needed on family farms. Take-home food portions, in addition to school lunches,
have proven to be effective incentives to keep girls in school. Similarly the more
effective measure of cash transfers to the poorest families for keeping girls in school may
be an option for policy makers.
Geographical Inequities
260. In parallel with rapid enrollment growth in KG, inequities in access have also
grown between the Northern regions and the rest of the country. In 18 of the 25 districts
in Northern Ghana the net enrollment rate is 50 percent or below. KG, which has become
0.00
0.20
0.40
0.60
0.80
1.00
1.20
- 1,000,000 2,000,000 3,000,000 4,000,000
Level of Household Income (old cedis, 2006)
Rati
o o
f G
irls
to
Bo
ys in
Pri
mary
Districts in the Northern region:
Gushiegu, Karaga, Savulugu-
Nanton and Tolon-Kumbungu.
Page 128
102
part of basic education is in fact far from being part of it in the deprived territories.
Infrastructure is non-existent, teachers are under qualified if they are present at all, and
pupil teacher ratios are typically 80 or above. KG has become part of the basic cycle with
the purpose of giving children a head-start during the early childhood years. This head-
start is especially important to the poor given that they don’t have the necessary home
environment (educated parents, books, electricity) that helps provide a leg up. Yet,
precisely these at risk children, families and communities are the ones that fall further
behind in absence of adequate KG provisions.
Map 4-1: Kindergarten Net Enrollment in 2008/09
Source: Based on EMIS.
261. A UNESCO (2010:161) report focusing on the marginalized, identified the
Northern region as the most educationally deprived, with 61.6 percent of its population
living in education poverty, i.e. having less than four years of education. The share of the
Northern region’s population living in extreme education poverty, measured as having
fewer than two years of education, was 16.6 percent: 12.1 percent of men and 20.4
percent of women. Among the population aged 7 to 16, about half (52.5 percent) of all
rural girls from the poorest quintile in the Northern region, who tend to be systematically
the most disadvantaged, have not had any education. It is important to reiterate that, as
Ghana aspires to reach universal access to primary, progress will be contingent on how
successful the government and non-government organizations are in focusing efforts on
these marginalized groups.
Box 4-2: Reaching the marginalized: the ‘School for Life’ program
As a means to widen access to marginalized children, School for Life is a program led by
non-governmental organizations that target the needs of hard-to-reach children in the
North. This nine-month literacy program aims to facilitate the re-entry of 8 to 14 year old
children into primary schooling. It provides an intensive and relevant course that takes
seasonal labor demands into account when preparing the school calendar. A distinct
aspect is its orientation towards the community. Courses are given in the local language
Page 129
103
and are taught by instructors, many working on a voluntary basis, all of whom have been
locally recruited. A particularly relevant component for the rural poor is that children do
not need uniforms and are provided with free textbooks, thereby decreasing central
indirect costs of schooling.
Having reached a total of about 85,000 children between 1996-2007, the scope of the
School for Life program has been wide within its eight targeted districts. A study found
that more than 90 percent of students graduated from the program, about four out of five
students (81 percent) had attained third grade literacy and numeracy levels and 65 percent
went on after completion to (re-)enter the formal schooling system. Graduates who
transition into the formal system tend to outperform their counterparts in both English
and math (UNESCO 2010).
262. At the district level, the prevalence of a net enrollment rate in primary below 60
percent fell from ten districts in 2006/07 to only one in 2008/09, illustrating strong
enrollment growth among the educationally most deprived districts. In 2008/09, the only
district in Ghana with primary net enrollment below 60 percent, as Map 4-2 indicates,
was the Wa East district in the Upper West region (59.4 percent). Among the 17 districts
where less than three fourths of the children in the appropriate age group had access to
primary schooling, more than half are found within the Northern, Upper West and Upper
East regions. At the other end of the spectrum, the number of districts with net enrollment
in primary as high as 90 percent or higher more than doubled over this time span,
increasing from 27 to 61 districts. Of these 61 districts, 57 are located outside of the three
Northern regions, underling the North’s geographic isolation, higher incidence of
poverty, child labor demand and thus lower participation in schooling as well as the
common unwillingness of trained teachers to accept postings in remote communities.
Map 4-2: Primary NER in 2006/07 and 2008/09, by District
Source: Based on EMIS.
Page 130
104
263. Primary Net Admissions Rates (NAR) is lowest in Northern Ghana. As Map 4-3
indicates, eight of the eleven districts with the lowest primary net admission (50% or
below) were found within the three Northern regions – i.e. the Upper West, Upper East
and Northern regions. The Wa district and Wa East district in the Upper West had the
lowest primary net admission rates, averaging only 41.2 and 37.5 percent, respectively.
Given that the aggregate primary NAR in Ghana reached 72.1 percent in 2008/09,
geographic disparities are pervasive. While 31 districts within 7 regions had a primary net
admission rate greater than 90 percent, 55 districts throughout all 10 regions had a
primary NAR less than 70 percent. This suggests that though inter-regional disparities in
primary NAR are large, they become much more accute when disaggregated at the
district level.
Map 4-3: Primary Net Admission Rate in 2008/09
Source: Based on EMIS.
264. Districts along the coast tend to have the highest concentration of students who
complete primary, while those in more Northern and rural areas tend to have the lowest.
In fact, in six districts of the Northern region less than 70 percent of primary students
completed. Nearly two thirds of all districts with a primary completion rate of seventy
percent or lower are found within or bordering the Upper West, Upper East or Northern
regions. The Karaga district (Northern region) had the lowest primary completion rate at
48.4 percent, followed by the Afram Plains district (Eastern region) at 52.3 percent and
the Gushiegu district (Northern region) at 54.6 percent. To meet Universal Primary
Completion (UPC) by 2015, it will be essential to target efforts to the most disadvantaged
and poorest performing districts, particularly in the off-road rural communities and
impoverished areas of the North.
Page 131
105
Map 4-4: Primary Completion Rate in 2008/09
Source: Based on EMIS.
265. Inter-regional disparities in primary quality and learning. The parity index in
NEA results can be calculated by dividing the lowest scoring region in English and math,
in this case the Northern region, by the region performing highest, i.e. Greater Accra.
Thus, the parity index of NEA scores, 0.70 in English and 0.69 in math, illustrate
inequities across geographic lines in learning achievement within these core subjects. In
explaining these regional disparities in learning one must look at factors contributing to
the higher concentration of trained teachers in Greater Accra and to lack of desire to be
posted in “bush schools” within off-road rural settings, considering migration patterns to
urban centers, but also that distances to schools in urban areas tend to be shorter and thus
attendance rates higher. When asked, why children were not in primary school, about 5
percent stated that the distance to school was simply too far, according to data from the
Core Welfare Indicators Questionnaire Survey (GSS 2003). Many districts suffer from a
chronic shortage of (trained-) teachers, with some of these districts being located in the
Northern region where on average only 27 percent of primary teachers possessed formal
qualifications.
Page 132
106
Figure 4-9: Average NEA English scores by region
Source: Wodon and Joseph 2010 based on NEA.
266. Relationship between primary P(T)TR and completion. At the regional level,
2008/09 data does not directly support the assumption that higher PTRs in primary
impact completion rates in an adverse way. When looking at the pupil per trained teacher
ratio in primary, there seems to be a slight, but not very significant relationship. This is to
some extent explained by lower levels of efficiency and equity in the distribution of
trained teachers in comparison to all teachers in general. In primary, the Western region
had the highest pupil per trained teacher ratio of 145.5, but was able to reach a
completion rate of 92 percent, about 6 percent higher than the national average. The
Eastern region had the lowest pupil per trained teacher ratio of 54.9, while only reaching
a completion rate of 83 percent, about 3 percent lower than the national average. This
unexpected association appears even stronger in junior high school.
Figure 4-10: Primary P(T)TR and Completion Rate, by District in 2008/09
Source: Based on data from EMIS.
267. Using the parity index as a potential policy tool. With the intention of closing
geographic disparities, the Government could use parity indexes as a means to measure
the inter-regional inequity between the poorest and highest performers, and then channel
resources to the given input that has the lowest parity and target measures to those
corresponding regions and districts with the poorest performance on the respective
indicator. For instance, table 4-10 indicates that among the two key indicators illustrated,
the parity index is lowest – thus the regional disparity largest – in terms of the pupil per
0.0
20.0
40.0
60.0
Average NEA English Test Scores by Region
English 2005
English 2007
0
20
40
60
80
100
120
140
160
180
200
220
0.40 0.50 0.60 0.70 0.80 0.90 1.00Primary Completion Rate
Pu
pil (
Tra
ined
) T
each
er
Rati
o
PTR
PTTR
Page 133
107
trained teacher ratio. (The flat PTR line shows almost no relationship between PTR and
completion rates. The downward slope of the PTTR line shows a small relationship, and
hence a lower parity index. Thus, measures aimed at reducing the primary PTTR would
aid in closing some of the largest geographic disparities in Ghana’s education system. In
addressing this issue, newly trained teachers would need to be deployed particularly in
outlier districts with high PTTRs within, for example, the Western (145.5), Northern
(140.3), Upper East (113.5) and Upper West (106.6) regions.
268. Students in the North tend to be about 3 years over-age. One cannot stress enough
the importance of children beginning the primary cycle at the official age and keeping
repetition rates to a minimum, in order to raise the chances of completion. However,
Ghana’s education system faces challenges both in timely enrollment and transition.
Children in schools within the three Northern regions tend to be about three years older
than the official age in a particular grade, while in the Greater Accra and Ashanti regions
the average actual age of students is about two years older than the appropriate age. Such
high age-grade delay places pressures on schools in terms of higher costs, increased
strains on the pedagogy process due to differences in students’ learning capabilities,
preferences and maturity levels, reduced learning results, higher rates of drop out and
increases in the likelihood of early entry into the labor market, discussed in greater detail
in chapter 2 on access and enrollment.
Figure 4-11: Comparison of Mean Age-grade Delay, by Region
Source: Akyeampong 2009 based on GLSS 5.
269. In general, primary-age boys living in rural areas within the Northern or Upper
West regions of the country tend to have the highest probability of repeating or dropping
out. The largest share of children tend to repeat the first grade, while no clear patterns
seem to exist in the frequency of dropout at different levels of primary education.
270. Inequitable teacher deployment in pre-tertiary. Nationally, there was a slight
decline from 33.5 to 32.4 pupils per teacher (PTR) between 2006/07 and 2008/09.
However, at the district level there was a total of 40 or more students per public teacher
in 11 districts in 2006/07, rising to 25 districts by 2008/09, mostly lying within the Upper
West, Upper East and Northern regions, due mainly to the rapid expansion of admissions.
Although high teacher intake growth has been taking place, rising geographical inequities
01
23
4
mea
n 'd
elay
' in
year
s
western
centra
l
greate
r acc
ravo
lta
eastern
ashanti
brong a
hafo
northern
upper east
upper west
Mean Age-Grade 'Delay' by Region
Page 134
108
could undermine the impact of the sector’s growth. In 2008/09, out of the 33 districts
with a primary PTR of 30 or below, 25 of these districts are found within three regions –
the Volta, Eastern, and Ashanti regions.
271. Over time and geography, inequities in PTRs continue to reflect to a large degree
Ghana’s underlying economic inequalities. The rural and socioeconomically most
marginalized districts and regions tend by and large to have the highest PTRs and
especially PTTRs in the country. Data suggests that regional variations in PTRs exist
across the country and across all pre-tertiary education levels. Overcoming such
disparities and teachers’ unwillingness to work in such areas is achievable through
targeted measures that (i) recruit, train and deploy teachers locally, (ii) provide teachers
with monetary and in-kind incentives to relocate and retain them in hard-to-place
communities and, amongst others, (iii) enforce legislation that obliges all new teachers to
be posted in such communities the first few years.
Map 4-5: Primary PTRs in 2006/07 and 2008/09, by Region
Source: Based on EMIS. Note: PTRs represent public schools.
272. Severe discrepancies in trained teacher distribution. Not only do large trans-
regional disparities in the share of trained primary teachers exist, but also intra-regional.
Among districts within the same region, significant inefficiencies in trained teacher
distribution emerge primarily due to the urban-rural divide. In the Western region there is
a variation of over 60 percent in the share of trained teachers among its districts, meaning
that the difference ranges from the Shama-Ahanta East District where 69.3 percent of
teachers are qualified to the Bia district with 8.2 percent qualified.
Page 135
109
Figure 4-12: Portion of Primary Teachers with training, by Region/District, in 2008/09
Source: Based on EMIS.
273. Many schools need major repairs and lack clean water. In the Upper West and
Upper East regions, where poor infrastructure and remoteness are characteristically
critical barriers, nearly 30 percent of public primary classrooms need repairs, while
several districts in the other regions classroom infrastructure is even worse, with 30
percent or more of classrooms needing repairs. Thus, despite large education deprivation
in the Upper West and Upper East, classrooms and schools seem to be in overall better
condition than in other regions. The Volta region has many districts with 40 percent or
more of public primary classrooms in need of major repairs, in spite of the region having
one of highest percentages of trained primary teachers and having high learning
achievement results, for instance, on NEA.
274. In terms of public primary schools with access to drinking water, districts with 40
percent or less of schools having access tend to be more highly concentrated in the
Northern areas, while those with 80 percent or more access to potable water tend to be
located in the Southern regions, although some exceptions exist. Thus, while 14 of the 24
districts with at least 80 percent access to potable water were located in the Western and
Ashanti regions, 13 of the 23 districts with schools that have 40 percent or less access to
drinking water were located within the Upper West, Northern and Brong Ahafo regions.
Given that schools in only 24 districts have on average 80 percent or more access to
potable water, clean water scarcity may continue to lead to a higher prevalence of
disease, such as guinea worm infection, and deter teachers from coming to such
communities.
0.0%
10.0%
20.0%
30.0%
40.0%
50.0%
60.0%
70.0%
80.0%
90.0%
100.0%
ACCRA
EASTE
RN
ASHANTI
VOLT
A
CENTRAL
BRONG A
HAFO
WESTERN
UPPER W
EST
UPPER E
AST
NORTH
ERN
Bia district (Western) 8.2%
Ho district (Volta) 87.2%
Akwapim North district (Eastern) 76.9%
Karaga district (Northern) 13.8%
Page 136
110
Map 4-6: Classrooms Needing Major Repairs and Schools with Potable Water, 2008/09
Note: Both maps refer to public primary schools. Source: Based on EMIS.
275. Regional variations in pupil per (trained) teacher ratio. Only analyzing primary
pupil teacher ratios, the lowest being in the Eastern region (28.6) and the highest in the
Upper East (47.6), doesn’t always offer an accurate picture of the teacher work force.
When examining PTTRs one can see much larger regional disparities. In primary schools,
the average classroom in the Eastern region had about 55 students per trained teacher,
however, the primary PTTR was nearly three times higher in the Northern (140.3) and
Western (145.5) regions. To date, the Ministry of Education has not been able to develop
a solid policy scheme to overcome institutional inefficiencies of mobilizing trained
teachers, especially to communities of Northern Ghana, but also to the most rural areas of
the Western region. In terms of junior high school, while the number of students per
teacher ranged from 15.2 in the Eastern region to 24.3 in the Upper East, the geographic
gap in PTTRs varied more widely from 22.4 in the Eastern region to 43.4 in the Western
region. Distributing trained teacher more equitably in Ghana has evolved into a central
policy challenge, as discussed in the chapter on quality.
Page 137
111
Figure 4-13: PTTR in Primary and JHS, by Region in 2008/09
Source: Based on EMIS.
276. JHS access and completion is lowest in the North. Geography matters at all levels
in the access to and quality of education. Variations in enrollment and participation at the
regional level are such that about 70 percent of children are not enrolled in junior high
school in some parts of the country, more specifically in the Northern region. The nature
of small communities in rural settings does not necessarily support high enrollment
patterns particularly due to living settlements that are small, sparsely populated and
extensively spread out. The goal of attaining universal basic education by 2015 confronts
serious challenges in the rural and Northern areas of Ghana. The parity index in net JHS
enrollment is 0.38, implying a nearly threefold gap between net enrollments in the
Central region at 70 percent and the Upper East at 27 percent.
277. The Central region has not only been most successful in bringing the appropriate
age children into junior high schools. It was also able to ensure that 93 percent of them
completed the basic education system in 2008/09. However, in Northern regions the
probability that a JHS student completes the three-year course of study is significantly
lower than the national average; in 2008/09 only 62 percent in the Upper East, followed
by the Upper West with 60 percent and 56 percent in the Northern region.
278. Extensive inter-regional variations in JHS learning. Given that the parity index
of BECE pass rates was 0.41 in English and 0.53 in math, the junior high system appears
to be plagued with considerable geographical inequities in learning results. On BECE
English exams, it was more than twice as likely for a junior high school student to have
passed, if he resided in Greater Accra (81% pass rate) than in the Northern region (33%
pass rate). As to BECE math assessments, the regional divide is most extensive between
the Ashanti region with the highest pass rate of 79 percent and the Northern and Volta
regions with the lowest pass rates of 43 and 42 percent, respectively. This illustrates that
the education administrators of the Ashanti region place a stronger emphasis on math
curriculum at the JHS level, while Greater Accra is by far the highest performer in
English. However, at the primary level the Greater Accra region clearly outperforms
every other region in both English and math, based on the NEA results of 6th
graders.
279. The Northern regions are not only the poorest performers on NEA English and
math exams, but as a regional average they also had the overall weakest pass rates on
54.9 59.166.8 71.1
82.7 84.1
106.6113.5
145.5
22.4 24.5 25.8 24.7 27.3 29.2 32.138.7 35.1
43.4
140.3
0
20
40
60
80
100
120
140
160
Eas
tern
Volta
Acc
ra
Ash
anti
Cen
tral
Bro
ng A
hafo
Upp
er W
est
Upp
er E
ast
Nor
ther
n
Wes
tern
Primary JHS
Page 138
112
BECE assessments. It is important to rethink potential targeted measures to improve the
learning results of students residing in the Northern regions. One can’t sufficiently stress
the point that geography is a strong (maybe the strongest) determinant of learning results
throughout the basic system. However, the inter-regional divide tends to conceal other
underlying variables, among others, the fact that trained teachers are concentrated in
cities, where social goods and services tend to be more accessible, work productivity is
higher and walking distances to schools tend to be much shorter.
Figure 4-14: Junior High P(T)TR and Completion Rate, by Region in 2008/09
Source: Based on data from EMIS.
280. Very large district-level disparities in JHS net enrollment. In aggregate terms,
data on net enrollment in JHS suggest that a 3.2 percent decline took place between
2006/07 (51%) and 2008/09 (47.8%). Net enrollment trends in JHS, representing some of
the largest inequities across districts in basic education, are not positive and the gap
appears to be widening. Deterioration in net access has translated into a jump from 19
districts with net enrollment of 33 percent or lower (2006/07) to a total of 37 districts
(2008/09). Eighteen 18 districts regressed to a junior high NER of 33 percent or below;
they were located in the regions of the Upper West (3), Upper East (3), Brong-Ahafo (4),
Ashanti (4), Eastern (3) and Volta (1).
281. While the number of districts with very low net enrollment in JHS increased, the
total amount of districts with a NER of 70 percent or higher rose from 9 to 14 districts
over this time span, all five of which were located in the Central and Western regions.
Geographically, there seems to a strong comparative advantage in net access for junior
high school students located in or near the coastal areas. While the Awutu-Efutu-Senya
district (Central) and the Ga East district (Greater Accra) nearly achieved universal net
enrollment in JHS at 99 and 96.8 percent, respectively. The Wa East District (Upper
East) and the Sene district (Brong-Ahafo) have been least successful in widening net
access, reaching only 12.2 and 14.2 percent, respectively, of the appropriate age
population.
0
5
10
15
20
25
30
35
40
45
50
0.50 0.60 0.70 0.80 0.90 1.00
Completion Rate
Pu
pil
(T
rain
ed
) T
ea
ch
er
Ra
tio
PTR
PTTR
Western
Upper East
Northern
Upper West Brong Ahafo
Volta Greater Accra
Ashanti
Central
Eastern Northern
Upper West
Upper East
Brong Ahafo Western
Volta Eastern
Greater Accra
Ashanti
Central
The 3 Regions
in the North
Page 139
113
Map 4-7: JHS Net Enrollment in 2006/07 and 2008/09
Source: Based on EMIS.
282. In Ghana, about 65 percent of junior high school teachers have received formal
qualifications. At this lower secondary level, while a total of 56 districts had a share of
qualified teachers above 75 percent, there were 75 districts with a 50-75 percent qualified
teacher work force and in 7 districts less than 50 percent of teachers had formal
qualifications. Thus, the Western region, where four of the seven districts with less than
50 percent of qualified teachers are found, is home to the largest share of unqualified JHS
teachers in Ghana.
Map 4-8: Share of Trained Public JHS Teachers in 2008/09
Source: Based on EMIS.
Page 140
114
283. Urban-rural divide. As Table 4-2 indicates, net enrollment of children in primary
varies widely, depending upon if a child resides in a rural area (69.8) or in a urban area
(80.3). In secondary schooling, disparities in enrollment are typically larger, with about
half of the official secondary-school-age population enrolled in urban areas (51.9)
compared to about one third in rural areas (34.5).
Table 4-2: Gross and Net Enrollment in Primary and Secondary in 2008, by Urban/Rural
Location
Gross enrollment rate Net enrollment rate
Male Female Total GPI Male Female Total GPI
PRIMARY SCHOOL
Urban 110.2 108.9 109.5 0.99 81 79.5 80.3 0.98
Rural 107.1 105.9 106.6 0.99 68.8 70.8 69.8 1.03
SECONDARY SCHOOL
Urban 72.8 63.6 67.8 0.87 53 50.9 51.9 0.96
Rural 51.1 44.6 48.1 0.87 34.3 34.9 34.5 1.02
Source: Ghana Demographic and Health Survey, 2009.
Note: Secondary school includes both junior and senior high school.
284. Overall SHS access, quality and resources are lowest in the North. As is the case
in many other sub-Saharan countries, SHS enrollment in Ghana is both low and highly
inequitable. In the Central region, roughly half of all youth are enrolled in senior high
school (51.1%), but only about one in every five youth have access in the Upper East
region (20.3%). As most Senior High schools are equipped with boarding facilities and it
is common to be enrolled in school outside the region of residence, GER and GAR are
therefore imperfect indicators of how well the population from a region is served by the
schools within that region. As a vital actor, the private sector helps to close the national
and inter-regional gap in enrollment, extending service delivery disproportionately to
harder-to-reach areas. At the SHS level, only 26.6 percent of private schools are in urban
areas and the rest, 73.4 percent, serve the rural population. Public high schools are more
evenly divided with 48.6 percent in urban locations. Not surprisingly the distribution of
SH schools shows low school numbers in the three Northern regions. In Greater Accra,
the relatively low number of public SHS schools are compensated by a high number of
private ones.
Page 141
115
Figure 4-15: Regional distribution of S.H. Schools by type, 2008
Source: EMIS Report 2008/09.
285. Across the country, the education sector is characterized by considerable
variations in SHS learning results and in the percentage of SHS trained teachers. Viewed
nationally, the Greater Accra region had the highest average English pass rate of 92.9
percent on WASSCE assessments and, at the same time, had the highest share of trained
SHS teachers, i.e. 94.1 percent, with the vast majority of teachers in the region being
employed in the public sector. The direct impact of such essential inputs on achievement
outcomes also tends to be consistent at the other end of the performance spectrum. The
Northern region, classified as having the most severe difficulties in attracting trained
public teachers in senior high school (only reaching 75.2 percent), had the lowest pass
rates on WASSCE exams in both English (71.6%) and Math (37.7%) in 2008/09. As to
basic pedagogy infrastructure, existing disparities across Ghana are not trivial,
particularly between the Central region, where nearly every senior high school student
has their own desk (.94) and seat (.92), and the Upper West region, where only about half
of SHS students are taught in classrooms with their own desk (.46) and seat (.47).
Targeting Policies, Demand Side Interventions
Deprived District Policy
286. As has been consistently shown, there are significant geographical disparities in
Ghana, mostly in line with other social and economic factors. Since 1999, the
Government of Ghana has classified roughly one third of the districts (originally it was
40 and gradually it increased to 68 as the district mapping was redrawn) as deprived
based on various education outcome and resource indicators including GER in primary,
gender parity, seats and core textbooks per pupil, share of schools needing major repairs,
BECE pass rates both in English and math, per student budget in primary, PTR in
primary and the share of qualified primary teachers. The plan was that by allocating
Regional Distribution of SH Schools
0
10
20
30
40
50
60
70
80
90
100A
shanti
Bro
ng A
hafo
Centr
al
Easte
rn
Gre
ate
r
Accra
Nort
hern
Upper
East
Upper
West
Volta
Weste
rn
Public
Private
Page 142
116
proportionately more funds to these disadvantaged districts, the Government would
effectively address education deprivation. However, it is important to emphasize that the
identification of deprived districts is based strictly on education indicators and not on
indicators external to the sector i.e. poverty or economic production. This caused some
level of overlap but also some incongruence between “educationally” deprived and, for
instance “socially” deprived districts as it is illustrated below.
Map 4-9: Government’s Identification of Deprived Districts and District Level Poverty
Count
Source: EMIS on Deprived Districts, Wodon 2009 on poverty count based on GLSS 2005/06 and CWIQ
2003.
287. Several factors co-determine geographical deprivation. Most of these districts are
remote rural areas with limited economic opportunities and limited access to social
services. This leads to persistent poverty, which in turn diminishes demand for education.
Low interest, low-level access and low level supply are creating a self-perpetuating
general deprivation. The rationale for Government intervention has been that providing
extra support to improve supply will increase demand, and better education helps break
the cycle of poverty in which families and communities are trapped.
288. Have Government policies been successful in dealing with geographical
education deprivation? At first look the Government policies appear to have achieved
some success in some districts. In 10 years some 12 districts out of the then 53 districts
designated as deprived, have managed to improve their educational indicators, and move
out of their deprived status. However, it remains unclear whether this was the result of
improved supply. In the meantime, 15 districts that had originally been classified as non-
deprived fell into the deprived category.
Page 143
117
Table 4-3: Existing Deprived Districts and Those Calculated Using 2008/09 Data
Deprived Districts using 2008-09 data and
old index
Deprived
Districts
using existing
index
Not
deprived Deprived Total
Not
deprived 70 15 85
Deprived 12 41 53
Total 82 56 138
Source: Wodon 2009.
289. More importantly, the logic of Government intervention has been to target
additional resources to the deprived districts. Two important findings indicate that the
Government has not been successful in this effort. Most of the deprived districts are in
the three Northern regions and actual per student expenditures are below standard and the
median per student expenditures have remained below the median per student
expenditures of non-deprived districts. Only recently has the Per Child Recurrent
Expenditure (PCE) in deprived districts increased in the primary and JH cycles, but even
now they remain lower than in non deprived districts.
Figure 4-16: Visualizing the disparities: Deprived districts 2006-2008
290. Similarly, the key input that assures both enrollment and better learning outcomes
is the trained teacher and here, too, per teacher salaries, a good proxy for qualification
and outcome, are between 10 and 40 percent lower in the three regions than in better
funded regions like Greater Accra or Ashanti.
291. Overall, the Government has not been successful in effectively addressing the
geographical disparities; in fact per student expenditures and median salaries show that
the social and economic disparities may have been further exacerbated by substandard
education expenditures and by the supply of untrained and inexperienced teachers.
292. Evidence in this chapter points to the fact that the central obstacle confronting
Ghana in its efforts to attain education for all is how it can open and maintain attendance
Page 144
118
among very poor households in remote, isolated and deprived communities. Educational
deprivation appears to be principally caused by low income, vulnerability, rural locality
and poverty. However, the single most pressing characteristic of the Ghanaian context,
impacting nearly every education indicator, seems to be the geographic divide, i.e.
between the South and the three Northern regions. The central challenge here is to reduce
the indirect and opportunity costs to families, of sending their children to school.
Struggling to incorporate the remaining pockets of the hard-to-reach population into the
school system, policies that focus on both supply and demand driven aspects may be
more appropriate. Since rural and impoverished children are at the centre of low school
participation, it is crucial to better target them. To this effect, increasing the capitation
grant funding and closing in on its target population could increase educational demand.
Capitation Grant Policy
293. The Capitation Grant (CG) was introduced in 2004 as a result of the 2003
Education Strategic Plan in response to the elimination of school fees. The CG was
initially financed by Education Sector Project (World Bank) and targeted to the 40, then
53 Deprived Districts. The initial allocations were 3000 (old) Cedis (equivalent with
3Ghc) per student at primary and JHS levels. In 2005, the CG was scaled up to the whole
country and was paid from HIPC funds. The law eliminating the fees and introducing the
CG nationwide had major impact, especially on primary admission, which jumped that
year. Initially, the impact on the Deprived Districts and, in general, low enrollment areas
were more significant than in other areas, as the economic burdens of the school fees
were especially hard on the poor.
294. By 2008, however, the initial enthusiasm subsided, growth in enrollment and in
gender parity leveled out and by this time, dropout and even some learning outcomes had
started to decline as the first post-CG generations started to reach 3rd
and then 4th
grade.
This was the result of the large influx of poor students whose parents started to feel
negative economic consequences, and overage students, who have had some difficulty
staying in school. There has been some slowdown in initial admissions and inflation has
also started to erode the value of the CG. In 2008, the Government increased the CG to
4.5Ghc.
Demand-side Interventions: Programs Targeting the Poor
295. LEAP as best targeted program in Ghana. A benefit incidence conducted by the
World Bank reveals that among a number of subsidies and programs in various sectors,
LEAP (Livelihood Empowerment Against Poverty) is the best targeted social program in
Ghana. 57.5 percent of the benefits of LEAP reach the poor (Wodon 2009). LEAP is a
program carried out by MESW to provide a Conditional Cash Transfer (CCT) to
households living in extreme poverty that is contingent not only on school enrollment,
but also regular health visits. In 2009, LEAP allocated about 7.5 million GHC, resulting
in a transfer per household of 8-12 GHC (about US$5-8 per month).
Ghana School Feeding Program reaching 21.3% of the poor.
296. It is estimated that the Ghana School Feeding Program (GSFP), providing school
lunches to students in participating public primary schools, does not have as large of a
Page 145
119
pro-poor impact as LEAP and its targeting mechanism may be in need of remodeling.
Only 21.3 percent of the poor are benefiting from the program, in spite of the GSFP using
a wide range of prerequisites to target recipient schools, among them road,
telecommunication and potable water inaccessibility, unavailability of a power grid,
health facilities located outside a 15km radius, areas affected by conflict or prone to
floods, as well as low enrollment rates and poor school infrastructure. According to a
World Bank study, if the GSFP that aims to reach the poor improved its pro-poor
targeting along the scheme designed for the free school uniforms, the antipoverty impact
could be more than twice as high (Wodon 2009).
297. Administrative data on the benefits provided to 170 districts were transformed in
order to obtain data for 138 districts for which we have poverty data. The total 2009
outlays to the districts indicated in the administrative data available to us amount to 26.3
million GH ¢. This is below the level of spending for 2008, at 33.0 million GH ¢. The
poor, who represent 28.5 percent of the population, benefit from only slightly more than a
fifth of the school lunches. The profile by quintile shows that the targeting performance
for the top quintiles are twice as high as for those for the bottom quintiles (Table 4-4).
Table 4-4: Targeting performance of school lunches using district level allocations
Program
Share of
population
benefiting Q1 Q2 Q3 Q4 Q5 Poor
Total
Expenditure
School lunch expenditure 2.77 3,449.6 4,618.7 5,235.1 6,182.0 6,789.4 5,597.1 26,274.9
Share of benefits 13.1% 17.6% 19.9% 23.5% 25.8% 21.3%
Source: Wodon and Joseph 2010.
298. Targeting Performance of School Lunches based on Child Needs Index as per the
Core Welfare Indicators Questionaire (CWIQ). Then, instead of applying district level
poverty rates, we estimated an index-based household level child needs using CWIQ. The
following variables are included to estimate the household level index of child needs:
proportion of children of the primary school age who are not enrolled, share of children
below age five who are stunted, share of children who are underweight, ability of the
household to cope with shocks and manage future shocks, household level food
insecurity, and household calorie intake. When examined the targeting performance of
school lunch expenditure in 2008 at the district level based on this index, we found that
the targeting performance was slightly better than before.
Table 4-5: Share of the benefits that go to each quintile using CWIQ and admin. data and
education needs in CWIQ
Program Q1 Q2 Q3 Q4 Q5 Poor Total
School lunch expenditure 5,220.50 4,875.40 4,980.30 5,829.00 5,369.70 5,597.10 26,274.90
Share of benefits 19.87% 18.56% 18.95% 22.18% 20.44% 21.30% 100%
Source: Wodon and Joseph 2010.
299. It should be pointed out that on a needs basis, the targeting performance of school
lunches as estimated using district level data would be even weaker than suggested in
Table 4-6. This is because the poorest quintiles of the population tend to have more
Page 146
120
children, and among the poor, children are more likely to go to public schools than
private schools. No adjustments have been made here for differences in needs.
300. Estimating deprivation using school level data. Using school level data from
EMIS, a school level deprivation index is calculated using the following variables: text
book to pupil ratio, whether the school has classrooms that need major repairs,
percentage of qualified teachers, student teacher ratio, pass rate in primary, and girls’
enrollment rate.
Table 4-6: Share of School Lunch Expenditure by Deprivation Index 1
National Q1 Q2 Q3 Q4 Q5 Poor
Total enrollment 2,606,512 344,942 436,174 512,147 577,893 735,356 522736
Total students receiving school meals 372,372 26,484 48,832 63,116 74,583 159,357 45791
Total students receiving capitation grants 2,273,722 289,647 377,870 455,176 508,159 642,870 443828
Percentage of students receiving school
meals 100 7.11 13.11 16.95 20.03 42.80 12.30
Percentage of students receiving
capitation grants 100 12.74 16.62 20.02 22.35 28.27 19.52
Source: Wodon and Joseph 2010.
Conclusion: Equity and Disparity in Education Services
301. If access is inequitable, it diminishes the performance and compromises the social
and economic benefits. That is why the Ghanaian government has been committed to
equitable access. A number of policies support this goal, including, among others, the
elimination of fees, the provision of capitation grant, textbooks, school feeding and the
delineation of deprived districts. But, by the same token, inequitable services, disparities
in access and in educational inputs could not only compromise the effect of these policies
but also result in greater social inequity and fragmentation.
302. There are three levels of potential and desirable policy actions in the context of
disparities:
a) Avoiding negative discrimination: At a minimum, the allocation of
resources should not discriminate along social, cultural or geographical
grounds. If x amount is available for education per student, the
Government needs to assure that x amount is allocated so that all students
see the benefit of the inputs equal to this amount.
b) Establishing specific policy incentives to improve supply of services: At a
higher level, the Government resources should be allocated in a way that it
addresses specific difficulties in education service delivery. If, for
instance, enrollment and attendance is more challenging in some areas,
typically in the rural and poor Northern regions, the Government
conceives policies that address this specific educational problem. For
instance, it is important to top up teacher salaries for those who are willing
to teach in remote areas; accommodations or subsidized transportation can
be provided to these teachers.
Page 147
121
c) Creating positive discrimination to stimulate demand: At a highest level,
the Government may develop policies that address underlying social and
economic problems by stimulating demand and thus access to education.
These policies may include school feeding, cash transfers or any type of
extra provisions that relieve the burden on families for sending children to
school. It is critical to the success of these measures how they are targeted
and monitored.
B. Efficiency
303. In this section, we seek answers to questions on the degree of sectoral efficiency
and in particular how efficiently physical, human, and financial resources are allocated
throughout the country to maximize the benefits. This gives rise to the question: to what
extent are allocations driven by Government policy or, alternatively, by spontaneous,
unintended factors?
School sizes
304. Basic education is largely delivered in small and medium sized schools.
Enrollment in the average KG is 90, in the average Primary school 225, and in the
average JHS 138. A key challenge is that most small schools in remote rural and poor
areas where the school size often affords only one teacher who may or may not be
qualified. Affording one qualified teacher to each school would lower pupil teacher ratios
and inflate salary expenditures. Figure 4-17 illustrates the effect of increased enrollment
in junior high schools, a phenomenon that affected disproportionately very small schools,
the proportion of which decreased significantly between 2005/06 and 2008/09., thus
increasing slightly the efficiency of JHS in terms of school size.
Figure 4-17: Effect of increased enrollment in junior high schools
Page 148
122
305. Senior High Schools tend to be large -- half of SH schools had more than 850
students in 2008/09 -- and are becoming larger. The distribution of SHS enrollment has
changed significantly in the past 4 years, shifting from a high concentration of medium
schools to a high concentration of medium to large schools.
Figure 4-18: Senior High Schools Enrollment distribution
306. 94% of Kindergartens have three or fewer classrooms, almost 50% have just two
and the large majority of rural schools have only one KG class. 88% of Primary schools
have six or fewer classrooms and 47% have exactly six, a lot of them built based on
central construction standards.. Similarly, 94% of Junior high schools have six or fewer
classrooms and 63% only have three. Only 20, 40 and 46% of the variation in number of
classrooms between schools can be explained by school level enrollment in KG, Primary
and JHS respectively. This is not surprising given the complexity in funding of school
construction.
307. Class size in basic education is relatively large, especially in KG, but the size has
not increased significantly, indicating that new classrooms were constructed in line with
Page 149
123
the increased enrollments. In four years efficiency13 improved in primary schools but
declined in KG and JHS levels. At SHS level, the average classes are significantly bigger,
indicating overcrowding and the need to build new SHS facilities.
Table 4-7: Efficiency in classroom distribution in the Basic Cycle, 2004/05 - 2008/09
2005 2006 2007 2009
Kindergarten
Median number of pupils per classroom 44.67 43.00 44.25 43.50
Efficiency in distribution 0.213 0.284 0.300 0.204
N 5341 6943 7496 7974
Primary School
Median number of pupils per classroom 34.83 34.42 35.17 35.17
Efficiency in distribution 0.32 0.45 0.42 0.40
N 9335 10222 10489 10428
Junior High School
Median number of pupils per classroom 31.33 31.33 33.33 33.83
Efficiency in distribution 0.52 0.57 0.53 0.46
N 5101 5642 5790 5957
Senior High Schools
Pupil – Classroom 44.6 44.5 43.4 46.5
Efficiency 0.65 0.71 0.73 0.69
N 338 394 398 403
Source: Author's calculation from EMIS 2004/05 to 2008/09 Census data. Unadjusted.
Note: Schools with Pupil - Classroom ratio >200 excluded
N indicates the number of observations used to compute the coefficients
Note: Data is not adjusted for non responses
Figure 4-19: Pupils per Classroom and Teacher by school size in Primary, JHS, 2008
Source: Author's calculation from EMIS 2008/09 Census data. Unadjusted.
Textbooks
308. Between 2005/06 and 2008/09 the average number of textbooks per pupil in
primary schools declined more in deprived districts than in non-deprived. There appears
to be no such trend in JH School. Too few schools however report correctly on the
number of textbooks in deprived district to calculate sensible estimates of the efficiency
in textbooks distribution.
13 Measured by the extent changes in the number of classrooms followed the changes in the number of
students.
0
10
20
30
40
50
60
1 2 3 4 5 6 7 8 9 10 11 12 13 14 15 16 17 18
number of classrooms in the school
pupils per classroom
pupils per teacher
0
5
10
15
20
25
30
35
40
45
1 2 3 4 5 6 7 8 9 10 11 12 13
number of classrooms in the school
pupils per classroom
pupils per teacher
Page 150
124
Figure 4-20: Efficiency in core textbooks distribution in Primary and JH, 2004/05 - 2008/09
2005 2006 2007 2008
Primary School
Average number of Core textbooks per child 1.54 1.64 1.44 1.45
Efficiency in distribution 0.69 0.68 0.72 0.63
N 6193 6250 6446 6598
Junior High School
Average number of Core textbooks per child 2.06 2.16 1.96 1.93
Efficiency in distribution 0.60 0.62 0.56 0.47
N 6193 6250 6446 6598
Senior High School
Core Textbooks - Pupil 1.15 3.21 3.28 3.11
Efficiency 0.45 0.45 0.44 0.41
N 358 422 425 432
Source: Calculation based on EMIS 2004/05-2008/09. Unadjusted
N indicates the number of observations used to compute the coefficients
Note: Data is not adjusted for non responses
309. Core subjects in SHS are Mathematics, English, Sciences and Social studies. The
number of textbooks in schools increased threefold between 2005/06 and 2008/09
passing from 1 to 3 per student. While this is a significant improvement, it means that the
average student is missing 1 out of the 4 core textbooks. Furthermore, averages hide great
disparities in textbook distribution. Only about 45% of the number of textbooks
encountered in schools can be explained by enrollment (while a large number of students
remain with no textbooks at all).
310. A large number of textbooks were procured and distributed in 2009. These
textbooks reached schools after the 2008/09 census had taken place and are therefore not
captured in this analysis. If efficiently distributed these textbooks would be sufficient to
bring the Pupil-Core textbook ratio to 1: 4 at the senior high level.
Page 151
125
Figure 4-21: Students - Core textbooks scatter plot in the Secondary Cycle 2005/06 -
2008/09
Source: Author's calculation from EMIS 2004/-5 to 2008/09 Census data. Unadjusted
Efficiency in teacher deployment
311. National aggregates of PTRs hide significant disparities between schools, districts
and regions. Both in the Primary and JH cycles the highest PTR is more than 30% higher
than the lowest. Higher PTRs are found in the North and in the Greater Accra region, in
the latter many due to migration patterns.
Table 4-8: Primary Pupil Teacher Ratio at the Regional Level
2003/04 2004/05 2005/06 2006/0714 2007/08 2008/09
Ashanti 32.5 32.9 35.9 33 33 32
Brong Ahafo 30 30.4 34.5 30 32 32
Central 34 35.7 39.3 36 37 36
Eastern 29.3 29.7 33.3 30 30 30
Greater Accra 36.8 36.6 39.6 39 40 40
Northern 38.6 40.1 40.5 34 33 33
Upper East 59 57.4 53.3 43 46 48
Upper West 46 49 45.6 34 39 42
Volta 30 30.5 34.1 29 29 30
Western 34.1 36.1 38.9 34 36 37
National 34 34.8 37.8 33 34 34
Source: EMIS.
312. How efficiently are teachers deployed? Efficiency in teacher deployment
generally decreased between 2005/06 and 2008/09. In 2008/09 only 29, 46 and 55% of
teacher presence could be explained by enrollment in Kindergarten, Primary and Junior
14 It is unclear what accounts for the big drop (i.e. improvement) in 2006/07, in the whole country?
Page 152
126
High School, respectively. In the primary subsector, the number of teachers whose
presence in school was related to the number of pupils was 46% in 2008/09, down from
55% in 2005/06. In other words “randomness” in teacher deployment increased from
45% to 54% between 2005/06 and 2008/09. Teachers are even less efficiently distributed
in deprived districts, where in 2008/09 “randomness” reached 62%.
313. Efficiency in teacher deployment has been decreasing in the Junior High
subsector, too. Whilst 63% of teacher presence was explained by enrollment in 2005/06,
only 55% of teacher presence could be explained by enrollment in 2008/09. Efficiency in
teacher presence in deprived districts fell by a further 10 percentage points in the last
year. In effect, this means that for the last four years, efficiency of teacher deployment
was always lower at all levels in deprived than in non-deprived schools. Evidently, the
Government efforts to assure better education services to deprived districts have not been
effective.
Figure 4-22: Efficiency in teacher distribution in Primary and JH by deprivation status,
2004/05-2008/09
Source: Calculation from EMIS 2004/-5 to 2008/09 Census data. Unadjusted.
Figure 4-23 below shows the variations between PTEs by schools at primary level,
showing how widely teacher allocations scattered around a linear regression line that is
set at the national average of about 35 pupil teacher ratio.
Primary School - Effciency in Teacher
Deployment
0.00
0.10
0.20
0.30
0.40
0.50
0.60
0.70
2005 2006 2007 2009
Deprived Non Deprived National
Junior High School - Effciency in
Teacher Deployment
0.00
0.20
0.40
0.60
0.80
2005 2006 2007 2009
Deprived Non Deprived National
Page 153
127
Figure 4-23: Students - Teachers scatter plot in Primary, 2008/09
314. As is the case in primary schools, the district-level distribution of junior high
school teachers appears equitable, with allocations to districts generally being efficient
while allocations to schools within districts being inefficient. The figures below illustrate
this phenomenon at the JHS level.
Figure 4-24: Teacher Allocation in Junior High Schools in 2008/09, by District (left) and by
Schools (right)
Source :EMIS
y = 16.899x + 79.108 R² = 0.9786
0
20000
40000
60000
80000
100000
0 1000 2000 3000 4000 5000 6000
Nu
mb
er
of
Pu
pils
Number of Teachers
Accra district (Greater Accra)
Kumasi district (Ashanti)
Page 154
128
Figure 4-25: Pupils - Teachers- Classrooms in SH, 2005/06 - 2008/09
315. In contrast to primary and JHS schools, teacher distribution in SH schools is
relatively efficient. Close to 80% of the distribution of teachers across schools can be
explained by variations in enrollment. Efficiency has declined slightly since academic
year 2005/06 due to increased enrollment against unchanged number of teachers in small
schools.
Figure 4-26: Students - Teachers scatter plot in the secondary cycle 2005/06 - 2008/09
Source: Author's calculation from EMIS 2004/-5 to 2008/09 Census data. Unadjusted
Efficiency in Allocating Expenditures
316. Child expenditures are plotted in Figure 4-27, where every line is a district. The
vertical red line cutting across the others demarcates the bottom third of the per capita
expenditure. Any district on the left of the red line falls within the bottom third. It is
important to note how (i) the three regions in the North fall almost entirely below the red
line, and (ii), in all other regions there is a wide variation in district PCE.
Page 155
129
Figure 4-27: Visualizing the disparities – The districts in 2008
317. Figure 4-28 helps in summarizing these two important features of the raw data.
Noticeably higher per capita spending tends to go with higher disparities: in regions
where the median PCE is higher there still exist districts with very low spending.
Figure 4-28: Visualizing the disparities – Between and within regions in 2008
318. In blue, Figure 4-28 plots the median district in every region15
. It is important to
note the difference between the regions and in particular how much lower the median
PCE is in the three regions in the North. In Red, the Figure plots the Inter-Quartile Range
(IQR), which is a measure of disparity between the districts in a region16
.
319. In order to give a dimension of the impact of low per child expenditures, Table
4-9 reports the percentage of children affected by sub-standard PCE, i.e. funding that falls
within the bottom third of the per capita expenditures in the country. Regions where more
than 30% of the children suffer from sub-standard spending are highlighted. A very large
amount of under spending is recorded in the three regions in the North. More than 60% of
children in the Northern region attend primary school in districts where the PCE is below
15 The median district is the district below which lie 50% of the districts in the region and is therefore a
useful representation of the level of per capita expenditure in the region.
16 Specifically the IQR measures the difference between the top and the bottom 25% of the districts.
Page 156
130
the bottom third of the nation. The proportion of Junior High School students suffering
from under spending in the Northern region is even higher, affecting 83% of the total
number of students in the region.
320. In the Senior High cycle, Greater Accra Northern and Upper East are the only
regions with less the 30% of the districts falling in the bottom third of the nation. This is
probably due to the low levels of enrollment in such regions, where NER is below 15%.
Table 4-9: Percentage of children in districts with sub-standard PCE in 2008
KG Primary JHS SHS
ASHANTI 28% 29% 23% 58%
BRONG AHAFO 0% 35% 45% 49%
EASTERN 0% 15% 0% 31%
GREATER
ACCRA 17% 7% 0% 18%
NORTHERN 49% 65% 83% 26%
UPPER EAST 59% 66% 63% 30%
UPPER WEST 93% 45% 59% 53%
VOLTA 15% 0% 12% 36%
WESTERN 24% 18% 5% 40%
321. The conclusion is that a key source of deprivation for the deprived districts is the
allocation of public expenditures itself. These expenditures, instead of compensating for
the deprivation, exacerbate them by allocating fewer resources per child to the regions
where the majority of deprived districts are located.
322. Having provided a cross sectional snapshot of the disparities across regions in
PCE, this subsection will present the evolution of PCE from 2006 to 2008. The figures
reported present large year-to-year fluctuations. It has to be kept in mind that as one
district crosses the established threshold, all children is such district are counted above
the threshold. It is therefore normal to see large fluctuations in the percentages.
323. Per capita expenditure in KG are very low: the national average is GHc47, with
variations ranging from GHc5 to GHc220.
Table 4-10: Percentage of children in districts with substandard PCE at KG level
2006 2007 2008
ASHANTI 13% 40% 28%
BRONG AHAFO 0% 16% 0%
EASTERN 10% 5% 0%
GREATER ACCRA 39% 0% 17%
NORTHERN 38% 63% 49%
UPPER EAST 73% 63% 59%
UPPER WEST N/A 82% 93%
VOLTA 15% 20% 15%
WESTERN 21% 19% 24%
Page 157
131
324. The percentage of children affected by substandard funding in primary school,
despite recent improvements, remains very high in the North of the country. More than
60% of the students in the Northern and Upper East regions attend school in district with
substandard PCE. A success story worth pointing out is the Volta region, where no
district fell in the bottom third in 2008, although 36% of children had substandard
funding in 2006.
Table 4-11: Percentage of children in districts with substandard PCE at Primary level
325. The picture in Junior high school, reported in Table 4-12 shows little change in
the dynamics of disparities. . Low PCE affects large number of children in the North of
the country with no hint of improvement. The proportion of children studying under
substandard PCE saw a substantial increase in the Northern region between 2006 and
2008. A success story worth pointing out is the Western region, where from more than
50% in 2006, the number of students affected by under spending in 2008 fell to fall%.
Those districts who appeared to have been underfunded in 2006 remained so later.
Table 4-12: Percentage of children in districts with substandard PCE at JHS level
2006 2007 2008
ASHANTI 26% 89%17 23%
BRONG AHAFO 34% 63% 45%
EASTERN 4% 20% 0%
GREATER ACCRA 26% 0% 0%
NORTHERN 55% 80% 83%
UPPER EAST 66% 80% 63%
UPPER WEST N/A 50% 59%
VOLTA 15% 18% 12%
WESTERN 53% 32% 5%
17 This outlier seems to be related to low data reliability
2006 2007 2008
ASHANTI 37% 65% 29%
BRONG AHAFO 30% 27% 35%
EASTERN 17% 16% 15%
GREATER ACCRA 35% 9% 7%
NORTHERN 76% 91% 65%
UPPER EAST 100% 100% 66%
UPPER WEST N/A 78% 45%
VOLTA 36% 21% 0%
WESTERN 62% 64% 18%
Page 158
132
326. There has been a general improvement in funding of SHS over the years.
Particularly so in the Greater Accra, Northern and Upper East regions where now less
than 30% of students study in districts with substandard PCE. It is however important to
note that in the rest of the country, where NERs are above 15%, PCEs remain low. A
noticeable exception is the Upper West region, where NER is only 8% yet 53% of
students are below the bottom third of per capita expenditure. In simpler words, 53% of
the very few students in the Upper West region receive substandard PCE.
Table 4-13: Percentage of children in districts with substandard PCE at SHS
2006 2007 2008
NER
2008/09
ASHANTI 72% 95% 58% 23%
BRONG AHAFO 59% 89% 49% 15%
EASTERN 100% 44% 31% 26%
GREATER ACCRA 100% 3% 18% 13%
NORTHERN 100% 97% 26% 11%
UPPER EAST 65% 59% 30% 8%
UPPER WEST N/A 83% 53% 8%
VOLTA 51% 71% 36% 16%
WESTERN 100% 70% 40% 15%
327. Figure 4-29 depicts the PCE in every district classified according to their
deprivation status. Every blue bar in the picture depicts a district, while the red line
cutting across demarcates the bottom third. From the pictorial representation, it emerges
that:
328. Deprived districts have on average lower PCEs than non deprived district. In
2008, deprived districts spent about GHc50 less on every primary student and GHc60 less
on every JH student than non deprived districts did. There are two potential explanations
to this finding: either the targeting is purely nominal and no substantial resources have
been allocated to the deprived districts, or only donor funds have been allocated to the
deprived districts crowding out government spending.
329. There are a number of deprived districts well above the minimum acceptable PCE
as well as a number of non-deprived districts below it. In 2008 primary PCE was above
the minimum standard in 44% of deprived districts and below standard in 19% of non-
deprived. Similarly PCE on JH students was above standard in 50% of deprived districts
and below standard in 23% of non-deprived.
Page 159
133
Figure 4-29: Visualizing disparities - Deprived Districts in 2008
330. The secondary cycle presents a very different set of challenges. Per capita
expenditure in this cycle is significantly higher than in the basic cycle, and the definition
of minimum standard adopted in this chapter might be ill suited to such levels of PCE.
Nevertheless, the analysis reveals strong regional disparities, with regions with the
highest enrollment level struggling to secure sufficient funding for their students. A
special case is presented by the Upper West region, where despite the low levels of
enrollment funding remains low.
331. Geographic disparities. There is a degree of disparity in per unit expenditures
across regions. Per unit expenditure18 in Greater Accra is almost 30% higher than the
national level; in the Northern region it is 10% lower. Teachers in deprived districts
receive 16% less then teachers in non-deprived districts as reported in Table 4-14.
Table 4-14: Per unit expenditure by region and deprived, 2009
Source 2009 Payroll.
18 Government recurrent expenditures per student
Annual Per unit
expenditure
% difference from
the national average
ASHANTI 3573 6%
BRONG AHAFO 3216 -5%
CENTRAL 3478 3%
EASTERN 3486 3%
GREATER ACCRA 4305 28%
NORTHERN 3042 -10%
UPPER EAST 3129 -7%
UPPER WEST 3257 -4%
VOLTA 3513 4%
WESTERN 3143 -7%
NATIONAL 3376
non deprived 3550 5%
deprived 3009 -11%
Page 160
134
Efficiency in schools: Absenteeism and Time-on-task
332. High teacher absenteeism is one of the key inefficiencies in the education sector.
It is a major problem in rural schools; poor teacher morale and poor work environment.
The average teacher absentee rate for Ghana, as a survey by the Center for Democratic
Development (2008) indicates, was 27 percent. Teachers in Tunisia and Morocco, by
comparison, miss 11.6 days and 13.4 days a year, respectively, The common reasons for
the high absentee rate in Ghana are (i) sickness, visits to health facilities, (ii) collection of
salary at a bank some distance away, (iii) frequent funeral attendance, (iv) religious
practices (for instance, Friday prayers among Muslim teachers), and (v) rural teachers
engaging in activities related to farming (CDD 2008; World Bank 2004a; Abadzi
2007:26). But there are underlying reasons contributing to high absenteeism: (i) lack of
supervision, (ii) long distances to school (schools far from bus/lorry stations as well as
from healthcare facilities), especially in rural areas, (iii) scare resources, such as toilets
and potable water, at schools.
333. Another study that examined 120 schools in rural Ghana reported that on average
teachers attend schools four days a week, implying that 5.5 instructional hours are lost
each week. The day that researchers visited the schools, nearly twenty percent of the
teachers were absent (EARC 2003). In 2003, an evaluation conducted by the World Bank
in Ghana established that in basic education almost 13 percent of the teacher workforce
was absent in the month prior to the survey due to reasons other than sickness, a stark
deterioration from about 4 percent reported in 1988 (World Bank 2004a). Survey results
from the same study indicate that the incidence of absenteeism is worsening, with 15
percent of schools faced with the problem in 1988 rising to 39 percent by 2003 (Table
4-15). . In other words, 85 percent of schools were not affected by teacher absenteeism in
1988, but this share had dropped to 61 percent by 2003, with 13 percent of schools
having more than one third of teachers absent in the last month for reasons other than
sickness. As data in table 4-15 confirm, the phenomenon of teacher absenteeism is
endemic, but affects rural schools more than urban, and public schools more than private.
This is explained in part by rural teachers having to travel further distances to schools as
well as to collect pay, and being occupied in seasonal farm activities more so than their
urban counterparts (World Bank 2004a). The data also suggest that absenteeism is more
common in schools suffering from poor infrastructure, located in poorer districts, and
providing service delivery to children from households with lower levels of income
(UNESCO 2008).
334. Since approximately 28.2 percent of the government’s entire budget is allotted to
teacher salaries and teachers are absent between 20-27 percent of the time, as various
studies suggest, one can conclude that roughly 5.6-7.6 percent of the government’s total
budget is lost to teacher absenteeism.
Page 161
135
Table 4-15: Share of schools affected by teacher absenteeism in 1988 and 2003, (%)
1988 2003 Disaggregated data, 2003
Frequency Urban Rural Public Private
None .85 .61 .61 .61 .56 .80
Up to a third of schools .11 .26 .27 .23 .29 .14
Between one to two thirds of schools .3 .9 .9 .10 .11 .4
More than two thirds of schools .1 .4 .2 .7 .5 .1
Number of observations 518 706 451 255 568 138
Source: Based on data from World Bank 2004a.
335. A USAID study (2003) that randomly sampled 720 classrooms in 120 mainly
rural Ghanaian schools found that 22.3 percent of teachers were absent on the day the
survey was conducted. An additional approximately 25 percent of teachers – 157 out of
the total 668 teachers – were present but engaged in other activities not involving
teaching. Nine percent were present but idle. Over a quarter of teachers (28.8 percent)
who were present at school had arrived late, on average by about half an hour, and 1.5
percent left early.
336. While teachers holding a university diploma in basic education were least absent,
those holding a certified A level were absent almost half the time (47 percent). Also,
teachers aged 50 and above tend to be absent less frequently. Common reasons
explaining these poor teacher attendance patterns are: study leave with pay, attendance at
workshops, preparation of events, teacher exodus to universities.
337. Improvements to reduce the problem of absenteeism include providing on-or-
near-site salary collection, especially as 28 percent of teachers reported not being able to
collect their salaries on time (World Bank 2004a). Also helpful would be ensuring access
to local health clinics and basic medical services. The CDD study (2008), shows that
enhancing effective supervision as well as strengthening evaluation have proven effective
measures in considerably increasing teacher attendance, in particular, in public schools.
The Brookings Institution (2007) underlines that the degree of parental involvement can
greatly influence the absence patterns of teachers at a minimal financial cost. One
measure would be to enlist PTAs in helping with this task. In principle, nearly all schools
have a PTA, i.e. 99 percent of public and 95 of private basic schools (World Bank
2004a). Studies have also shown that rigorous and frequent school visits by circuit
supervisors, though uncommon, play an essential management role (see chapter on
management). Improving the teacher supervision structures and offering teachers
incentives tend to directly decrease teacher absenteeism and lateness (Akyeampong et al.
2007). Where favorable working conditions and low pupil teacher ratios in schools exist,
teachers are more likely to have regular attendance.
338. Various studies indicate that time on task is estimated to be between 33 to 39
percent. In Ghana, the phenomenon of low attendance rates is compounded by the
problem of low instructional time in school, i.e. low time on task, which appears to be
widespread. A simple observation to school activities can provide a good picture of the
causes of low time on task. Frequent breaks, when teachers are separated from students,
slow transition to instruction, down time spent disciplining students, collecting home-
work, etc, all create an illusion of children learning while in school. The following table
Page 162
136
is based on classroom observations on time use in Ghanaian schools by grade in primary
schools.
Table 4-16: Ghana’s Average Percentages of Time Use, by Primary Grade
Grade 1 2 3 4 5 6
Interactive 71.1 58.6 50 57.5 50.2 62.4
Reading 14.4 10.4 8.8 16.3 4.1 6.7
Instruction 16.7 18.8 16.3 11.3 17 22.4
Discussion 20.6 21.4 22.5 26.3 24.2 27.6
Practice Drill 16.7 7.3 2.5 3.8 4.1 5.2
Passive 4.4 10.5 8.8 17.5 14.3 9.6
Seatwork 3.9 7.4 2.5 11.3 11.6 7.1
Copying 0.6 3.1 6.3 6.3 2.8 2.6
Total Engaged Time 75.5 71.1 58.8 75 64.5 72
Management 23.3 29 38.8 25 33.1 26.1
Student Off Task 19.7 24.7 26.5 21.3 23.8 16.6
Source: Abadzi 2007.
339. An alternative means of measuring instruction time spend on learning activities is
to ask teachers themselves. A teacher questionnaire by the World Bank found that time-
on-task reflects one-third of class time using a narrow definition and 72 percent based on
a broader definition, although large deviations from the average exist. Regression results
indicate that the inputs that are the strongest determinants of higher time-on-task are, in
order of importance: visits from circuit supervisors, head teacher supervision, and teacher
training (World Bank 2004a).
Table 4-17: Time-on-task for classroom activities
Mean Minimum Maximum
Total class time (minutes) 51 25 120
Of which (percent)
Preparing for class 21 0 68
Disciplining students 7 0 48
All students engaged copying etc 33 0 73
Dealing with student 1-to-1 13 0 68
Addressing whole class 26 0 80
Memo: time on task
Broad definition 72 29 100
Narrow definition 33 0 73
Source: World Bank 2004a.
340. In addition to wastage during the instructional time, the length of instruction is
also a factor. In an international comparison, only 76 days were devoted to learning tasks
in Ghana of the 197 days officially available, whereas, by comparison, for Tunisian
students a total of 148.1 days of the 190 available were dedicated to learning. In
Morocco, 145 of 204 days in the school year were allocated to engaging students in
learning. Consequently, time on task for students in both Tunisia (77.9%) and Morocco
(71.1%) was nearly double that of the time their Ghanaian counterparts spent learning
Page 163
137
(38.7%), as seen in Table 4-18. Sustaining internationally competitive learning and
quality outcomes is not feasible in Ghana’s school system, when students spend merely
39 percent of their time learning. On international assessment tests, Tunisia for instance
scores substantially higher than Ghana (TIMSS 2009).
Figure 4-30: Expected and Actual Number of Days Students were Engaged in Learning
Source: Based on Abadzi 2007.
341. Together, teacher absenteeism, poor ToT and short duration of school year can
result the loss of as much as 50-60 percent of teaching time, clearly making this as a key
constraint to learning.
Table 4-18: Instructional Time Use in 4 Countries
Ghana Tunisia Brazil* Morocco
School Year (Days after Closure) 193.83 184.85 195.21 202.62
Teacher Absence (Days) 43.01 11.55 12.76 13.36
Teacher Delays 39.75 1.27 5.5 6.94
Early Class Dismissals 2.43 1.22 2.31 6.68
Time on Task (Days) 76.3 148.1 125.9 145.1
School Year, % of Time on Task 38.7% 77.9% 63.0% 71.1%
Students Absence (Days) 9.04 3.35 7.82 4.30
Student Delays (Number of Times) 10.61 2.63 5.64 5.19
Note: *Data for Brazil is for the region Pernambuco. Source: Abadzi 2007:23.
342. Learning is compromised by high level of student truancy. In 1988, about 59
percent of primary and lower secondary students reported that they attended school on
average four hours or less per day in the week prior to taking the household survey. The
increase of school time in 2003, illustrated in Table 4-19, is primarily a result of the
policy reform increasing the four-hour school day to five hours but it also reflects
additional classes and longer hours in private schools (World Bank 2004a).
197 190 200 204194 185 195 203
109
171 175 176
76
148126
145
0
50
100
150
200
250
GHANA Tunisia Pernambuco (Brazil) Morocco
Days in School Year Days after Closure No. Days Schools Operated Days Students Engaged in Learning
Page 164
138
Table 4-19: Hours spent in primary and junior high school in past week, percent
Source: World Bank (2004a) based on GLSS data.
C. Management Accountability and Social Accountability
343. The previous chapters have shown that there are impressive overall outcomes in
education, but there are also great variations and disparities both in attainment and in
learning. Moreover, resource allocations show similar disparities explaining to some
extent the variations in outcomes. Overall, there are strong indications of inequity and
inefficiency, which underline the need for strengthening management and information
systems, better structuring the division of roles and responsibilities, and decentralizing
some functions including resource management and service delivery.
344. Effective education management and administration has to assure that the
outcomes, including enrollment, learning and participation are maximized, resource use
is efficient and schools, teachers and administrators are held accountable. Accountability
also assures that individuals, households and communities, even the poorest ones,
increase their expectations and their participation in education. The objective of this
section is to see how the flow of funds and management of resources, the division of
roles and responsibilities, accountability measures, information systems, planning and
policy-making all contribute to the effectiveness of education service delivery.
Fragmented System of Flow of Funds
345. Education financing is fragmented among a number of sources and among an
even larger number of flows of funds. The authority to allocate the key resources is
divided among four agencies: The Ministry of Finance and Economic Planning (MOFEP)
is responsible for setting the overall budget and determining Civil Service Agency (CSA)
the remunerations; the Ghana Education Trust (GET) Fund is responsible for
investments; Ghana Education Service (GES) is responsible for allocating recurrent
expenditure and to set teacher numbers; the Ministry of Education (MOE) is responsible
for allocating donor funds (totaling 6% of direct education expenditures, although donor
contributions to the state budget bring donor support considerably higher) and proposing
the annual budget to the Government. This fragmentation of budgetary responsibilities is
the most fundamental reason why planned and executed budgets differ.
346. The large majority of the budget is channeled through the budget of the Ministry
of Education. However, this budget only reflects teachers, new school construction and
some inputs such as textbooks. A still significant portion of public resources benefiting
the education sector is channeled through the budgets of other ministries, departments
and agencies of the Government, among others, the Social Investment Fund and the
Ghana Education Trust Fund. Education funding is also derived from the budgets of the
1988 2003
public private
20 or less 58.7 16.3 23.1
20-30 39.1 55.3 30.1
More than 30 2.2 28.4 46.9
Total 100 100 100
No. of observations 3464 1158 286
Page 165
139
MoFEP and the Ministry of Local Government. Some of the resources from the “MP
Fund,” allocated to Members of Parliament to promote development in their
constituencies, also support school projects, scholarships and the like.
347. A significant proportion of (non-sectoral) Heavily Indebted Poor Country (HIPC)
funds are used on education. HIPC funds are transferred directly to the Metropolitan,
Municipal and District Assemblies (MMDAs) with involvement of Local Government
(MoLG), which screens and monitors the funds. There are various non-sector-specific
district support programs as well and several off-budget funding arrangements (sourced
by NGO-, Community Based Organizations (CBO)- and donor-funded projects).
348. Size of the funding flows for basic education. Figure 4-31 below provides an
overview of the various main funding streams to Basic Education. It should be noted that
while Basic Education expenditures are directly classified under the budget lines for: Pre-
school, Primary and Junior Secondary levels, they usually do not, but should include: a
proportion of the administration budget for schools and regional services related to Basic
Education (these expenditures are not broken down in the public accounts), off-budget
donor support, e.g. from NGOs, the educational share of non-sectoral donor funds, funds
for Basic Education funded from the HIPC initiative through MMDAs (MLGRD
screening of proposal), and other sources such as some of the expenditure on special
education, of which most of the expenditure are for Basic Education.
Figure 4-31: Education expenditure by source, 2007
Source: RECOUP.
349. The systems vary greatly across the sources, ranging from: funding routed directly
from the central ministry to the contractors (e.g. school books), GET-funds directly to the
contractors (e.g. vehicles and equipment), direct payment from CAGD for services
(teachers’ salaries), funds controlled through the MoFEP/MOE and passed through the
DEOs (GOG funded services and investments), funds channeled through the MOES/GES
Expenditure by Source
GoG, 68.10%
Donor, 6.00%
IGF, 8.70%
GETFund, 12.90%
HIPC, 3.20%
EFA Catalytic Fund, 0.80%
MDRI, 0.30% GoG
Donor
IGF
GETFund
HIPC
EFA Catalytic Fund
MDRI
Page 166
140
CAGD through
instructions to the Bank
of Ghana- BOG
Teachers’ Bank
Accounts
MOF informs
Personnel Emoluments
headquarters to the MMDAs, where the MMDAs function more or less as “post offices”
(some construction funds and the HIPC funds), funds from the CAGD directly to the
MMDAs Treasury (administration – new flow), funds from various sources directly to
the MMDAs for local priorities (non-sectoral grants such as DACF, part of the HIPC-
MMDA non-sectoral funds) and funds from the GES routed through the DEOs’ accounts
to the schools’ accounts (capitation grants).
350. The most important funding flow is the GOG-funded salaries, followed by a
number of significant fund flows from the GET-Fund, HIPC and DACF. Salaries are paid
entirely from the GOG PE budget component, but the other budget components,
particularly the investments, have several sources.
351. A good example of the complexity of financing is classroom construction, which
is funded by a great number of sources including: GOG investment budget, Donor
support (on-budget), GET-Fund, HIPC- MoE budget funds, HIPC-MMDA funds, DACF
non-sectoral funds, various targeted education programs such as the Pilot Programmatic
Scheme being implemented with WB funding support, and, non-sectoral district support
programs e.g. the CIDA-supported DWAP. Provision of textbooks is another area of
diverse financing with numerous funding sources (GOG, GET-Funds, HIPC and donor
funds) and transfer schemes, although most of the textbooks are purchased directly by
MOES.
352. The general picture of the funding of Basic Education shows a complex flow of
funds and involvement of many authorities (GES, MoF, Regional Authorities and
MMDAs). The existing system is one of fragmented planning, budgeting and
accounting, which hinders the establishment of a comprehensive and consolidated
overview of all inputs and the outputs measured against these inputs. The current funding
system also reduces the possibilities for efficient programming and monitoring of the
various schemes. The flow charts below (without all the details) provide a general
overview of release path of the core GoG budgetary items (Item 1 – Personnel
Emoluments, Item 2 – Administration, Item 3 – Services, Item 4 – Investment), and of
the Capitation Grant. In all charts a bold arrow indicates a flow of fund and a dashed
arrow indicates the issue of a warrant/authorization or just information flow.
Figure 4-32: Item 1, GoG Core Budget- PE
Source: Steffensen 2006.
Page 167
141
GOG - Services
MOES/GES HQ CAGD instructions to the
BOG
MOF
Checks to the DEO
Accounts
GOG - Administration
(cost of running an office)
MDA/MMDA
Treasury
Accounts
CAGD through
instructions to BOG MOF
DEO
353. Upon instruction from MoF administration is transferred from the Controller and
Accountant General Department (CAGD), directly to the MDA/MMDAs. Reliability and
timeliness of funds is reported to have improved since 2006 when funds started being
transferred directly and not through MoE/GES.
354. Teacher salaries are paid directly to commercial banks. Teachers in remote rural
areas often experience delays in receiving their salaries through the banks. Newly
qualified teachers also experience long delays – sometimes a whole year -- in getting
their names onto the payroll system. Late payment of salaries is one of the major causes
of teacher absenteeism and lateness especially at the end of the month when teachers take
time off to chase salaries.
Figure 4-33: Item 2, GoG Core Budget Administration.
Source: Steffensen 2006.
355. Services were, at the time of the study transferred from CAGD to the DEOs
through the MoE/GES. Funds were reported to be very unpredictable and significantly
delayed. After 2006, however, plans were in place to route Service funds directly through
the DEOs, similarly to Administration funding. No study of funding flows has taken
place since 2006 and it is therefore not possible to tell whether an improved path has
effectively been established.
Figure 4-34: Item 3, Core GoG Budget – Services
Source:Steffensen 2006.
Page 168
142
GOG - Investments
REC
CAGD through
instructions to
the BOG
MOF
Contractors
DEO
Capitation Grant
DEO Special Account GES HQ Account
CAGD through BOG
School Accounts for Grants
356. Investment funds are released from CADG to the DEOs, while informing the
regional authorities of the process.
Figure 4-35: Item 4, GoG Core Budget – Investment.
Source: Steffensen 2006.
357. The Capitation Grant is sourced from the HIPC fund and the Social Impact
Mitigation Levy (SIML) and released to the schools from the CAGD through the GES
and DEO accounts. The PER reports funds to arrive quite reliably to the DEO accounts,
but the transfer between the DEO and the school is poorly documented and generally
unreliable. The results are cases of significant discrepancies in the actual per child grant
received by the schools. Figure 4-36: Capitation Grant
Source: Steffensen 2006.
358. Investment expenditures are separated from sector planning. Ghana Education
Trust Fund is responsible for allocation of expenditures that totaled about 13 percent of
the overall Government education budget for the fiscal year 2007. However, decisions are
made independently by the GET Fund Board. It is unclear what proportion of the GET
Page 169
143
Payment to the
Contractors
GETFund
Vehicle/Equipment to
Schools
Fund allocations go for what level or target which geographical location or how the
decisions at the onset are linked with the priorities of the Education Sector Strategy. On
the other hand, in theory, annual budgets (developed by the MOE based on GES
estimates) would be expected to account for the recurrent implications of investments
(including items 1 to 3).
Chart 1: Statutory Funds
e)
f)
Source: Steffensen 2006.
359. Delays, Predictability and Budget Cuts. There are serious delays in several
funding flows, particularly for the service component of the budget due to various
systemic and capacity related reasons. There is inadequate capacity at the MMDA level
to account and report in a timely manner on the use of funds. Moreover, these problems
are worsened by the multiple funding flows, planning systems, accounting procedures,
reporting systems, auditing requirements and bank accounts.
360. With the exception of salaries, fund flow is complex and often leads to a
fragmented and unpredictable planning and budgeting in the MMDAs. This has a spill-
over effect on service delivery at institutions/schools, which have to face lack of funding
for operations and maintenance particularly at the beginning of the financial year.
Capitation grants are supposed to address some of these problems and have improved the
funding for operations of most of the schools.
Roles and Responsibilities in Planning and in Service Delivery
361. The Ministry of Education (MOE) is the Government ministry responsible for
policy and strategy for education in Ghana. The Ghana Education Service (GES) is the
body responsible for overall implementation of that policy. Within GES, key departments
include the departments of Basic and Secondary Education; Planning, Budget,
Monitoring and Evaluation; Finance; Human Resources; and Teacher Education. GES is
supported by a range of different agencies, including the West Africa Examinations
Council and the Ghana Education Staff Development Institute.
362. The MOE organizes annually an Education Sector Review (ESR) and reports to
interested stakeholders - including donors - on progress in and performance of the sector.
In preparation for the ESR, MOE produces an annual performance report and this is
discussed in detail at the review. In 2007,2008 and 2009, Regional Education Sector
Page 170
144
Annual Reviews (RESAR) were conducted in all the ten regions in preparation for the
annual review.
363. MOE represents the sector in strategic (Government and Development Partners--
DP) dialogue whereas GES is responsible for service delivery including deployment of
teachers, allocation of textbooks, supervision of schools and teachers. Too many vertical
levels blur responsibility; for example, in the context of leakages in the allocation of the
capitation grant.
364. GES has no mandate to manage the payroll. It does not have effective tools to
assure that teachers who are assigned to one school or even to one district take the
assignments or remain there. Funds and resources to the local level flow through a variety
of channels, limiting the capacity of agencies to pursue a coherent spending strategy.
365. In the meantime, GES has the mandate to assure that schools have the appropriate
number of teachers. When teachers leave their posts for one reason or another (such as
study leave or relocation) GES has the responsibility of substitution. As enrollments
increased in the last decade, the difference between the planned and executed payroll has
increased from about 10 percent to over 35 percent.
366. As the flow charts in the previous section illustrate, funding for basic education
has a complex financial arrangement encompassing a number of authorities at different
levels (GES, MoF, Regional Authorities and MMDAs).
367. Presently, the District Education Department system is de-concentrated rather
than decentralized, inasmuch as District officials, including the Director are appointed by
GES headquarters and report through regional offices to the center. The DEDs were
created in 1995 when the Ghana Education Service (GES) reviewed its management
structures at headquarters, regional and district levels in order to bring authority and
responsibility for service closer to communities. Yet the predominant role that the central
authorities continue to play limits the capacity of locally elected officials to oversee the
sector and confront problems.
368. Under the new legislation District Education Directors are expected to report to
the Metropolitan, Municipal or District Assemblies (MMDAs). This would strengthen
local accountability; however, it is unclear how the standards for curriculum and teaching
and other regulations set by the center would be enforced.
369. District Education Oversight Committees (DEOC), were introduced in 1993 to
enhance broader stakeholders participation in the management, supervision and general
governance of schools by the communities. These comprise stakeholders in education at
the district level and represent the Ghana Education Service Council at the Community
level.
370. In a school survey conducted by Akyeampong and Asante, headteachers were
asked about the general behavior of their staff. Whilst rural school heads seem generally
happy with the behavior of their teachers, urban heads complained that teachers were
increasingly becoming rude and difficult to manage. They attributed this to general
apathy, especially among older teachers. It may be that older teachers having
experienced the frustrations in teaching for longer are becoming less concerned about
maintaining their sense of professionalism. The school survey also showed that
Page 171
145
dismissals rarely occur, which could mean that the majority of teachers are professionally
well-behaved but given the previously described rate of absenteeism, more likely, the
general laxities in the Ghanaian occupational culture makes enforcement of teacher
regulations difficult. Most primary headteachers, as one union official pointed out, “lack
the authority that goes with being a head”, and therefore are unable to initiate disciplinary
measures against teachers.
371. School work, educational plans, classroom work and teaching are supposed to be
overseen by District Circuit Supervisors and by the Headteachers. District Circuit
Supervisors are responsible for overseeing school operations, education service delivery
on behalf of the District, whereas the ultimate responsibility for service delivery rests
with the head-teacher. However, supervision of teachers by circuit supervisors and head
teachers is uneven, but has a significantly positive impact. About one in twenty teachers
(5 percent) reported not having a head teacher regularly review their lesson plans. 44
percent of teachers do not have direct contact with circuit supervisors, even though the
majority of schools are visited by them.
372. Many circuit supervisors don’t observe and assess teachers during instruction
time, but rather visit schools to simply verify student and teacher attendance figures
(World Bank 2004a). Although attendance is a fundamental prerequisite for learning,
such an input-based approach to supervision will have little if any impact on achievement
outcomes. According to the CDD (2008) study, less than 6 out of 10 teachers (57 percent)
said circuit supervisors visit their schools at least once a month. Over time, visits from
circuit supervisors have become slightly more frequent: when the number of visits
averaged about six per year in 1988, this number increased to about nine per year in
primary and slightly lower in junior secondary by 2003 (World Bank 2004a). An analysis
of EMIS data indicates that in 2008 circuit supervisor visited schools more than once a
year in only 77 percent of schools.
Table 4-20: Frequency of head-teacher and circuit supervisor activities, 2003 (percent)
Sits in
on class
Looks at a
sample of
students’ work
Looks at
lesson plans
Discusses
lesson plans
Discusses
career
development
Head-
teacher
Circuit
Superv.
Head-
teacher
Circuit
Superv.
Head-
teacher
Circuit
Superv.
Head-
teacher
Circuit
Superv.
Head-
teacher
Circuit
Superv.
Never 10.6 58.6 8.2 56.4 2.3 48.7 10.9 58.3 42.8 72.6
Less than weekly 28.1 38.4 39.4 41.6 2.4 49.2 43.4 40.3 48.7a 22.0a
At least weekly 49.4 2.5 46.4 1.7 95.4 2.2 45.7 1.5 8.5a 5.5a
Daily 11.9 0.4 6.0 0.2 .. .. .. .. .. ..
Total 100 100 100 100 100 100 100 100 100 100
Schools sampled 3013 3120 3009 3119 3011 3121 3007 3097 3005 3114
Note: Schools sampled also include a small share of schools that are part of USAID and DFID programs
(i.e. Quality Improvement in Schools [QUIPS] and Whole School Development [WSD]), which had
virtually no impact on variations of the frequency of visits. a. Indicates per month and not weekly.
Source: World Bank 2004a.
373. In Ghana there exist several mechanisms to promote community and stakeholder
involvement and oversight in local schools. The Parent Teacher Associations (PTAs) are
the oldest and most widespread, thought they have limited powers. School Management
Committees and School Performance Assessment Meeting were established more
Page 172
146
recently, but have had trouble gaining a real foothold and tend to operate sporadically.
The most influential form of community involvement typically comes from local
traditional authorities – headed by the local chief. When the traditional authority is
interested and active, it can provide powerful oversight.
374. In basic education, virtually every school in Ghana has a PTA: 99 percent of
public and 95 of private schools (World Bank 2004a). When parents are actively involved
in their children’s schools through productive and effective PTAs, parental oversight can
have a direct impact, for instance, on teacher attendance patterns (CDD, 2008; Brookings
Institution, 2007). However, a study by Transparency International (2009a) found that
parental knowledge of local school structures varies, with 97 percent of parents knowing
about a PTA but only 44 percent about another community oversight structure, a School
Management Committee. Survey results have shown that the degree of community
support for PTAs is strongly linked to its level of income such that financial support for
PTAs in schools located within wealthier areas is on average tenfold that of schools in the
poorest areas (World Bank 2004a). Although funding cannot determine the quality of
PTAs, a minimal finance threshold exists in order to function properly.
375. As part of the 1993 decentralization, School Management Committees (SMCs),
were introduced and charged with the responsibility to rekindle the community spirit in
improving education, especially at the basic education level, and to analyze their own
schooling problems and adopt and internalize their strategies towards the improvement of
teaching and learning. As with PTAs, the presence of SMCs will not necessarily have a
positive impact on schools unless they are run efficiently. Among primary and junior
secondary schools surveyed, four out of five (80 percent) had SMCs set up and
functioning, with the figure reaching 90 percent within primary schools. A study found
that school management committees met in the month previous to the survey within only
about 50 percent of schools at the basic level (World Bank 2004a). The School
Management Committees practice some level of community oversight, but their focus is
limited to overseeing the use of the capitation grant and does not extend to educational
issues, including whether teachers are present and whether students spend their school
time on task.
376. The School Performance Assessment Meeting (or SPAM), which 92 percent of
public primary schools have but only 6 percent of surveyed households attend, is a type
of supervision mechanism that provides a forum to agree on action plans (World Bank
2004a).
Decentralization
377. Since as early as 1951, local councils have had responsibility for providing and
maintaining educational facilities while central government provided teachers’ salaries.
This was reinforced in 1961 when Government “reaffirmed local authority control and
management of primary education” (CREATE, 2007) and further reinforced by the Local
Government Act of 1988 which made each district or community responsible for
providing and maintaining basic school infrastructure. In 1993 devolution was legislated
Page 173
147
and 22 Government departments, including the Ghana Education Service were
decentralized19.
378. The 2007 reforms specify that “Metropolitan, Municipal and District Assemblies
shall be responsible for the infrastructure, supervision and monitoring of Basic and
Senior High Schools”. Currently, Ghana has 10 Regions and 138 districts (though these
were increased to 154 in 2009).
379. Presently, the Metropolitan, Municipal and District Assemblies (MMDAs) are not
fully autonomous in most expenditure decisions, especially in the areas of teacher
management, remuneration (salaries and allowances), investment budget (classroom,
school buildings, teachers' houses etc.) and textbooks provision (Steffensen 2006).
Table 4-21: Level of MMDA Discretion
Expenditure Degree of Discretion C\omments
Salaries No discretion Handled by the central payroll system and hiring/firing is performed
centrally
Administration and
Service components
No discretion Disbursement controlled centrally.
GOG funded
Investments within
Education
Limited discretion Most investments are distributed centrally and heavily controlled.
MMDAs have limited influence on the priorities. In theory,
MMDAs are in charge of school construction, but in reality they do not fully control this function, which is managed by various funding
(GES/GET/Donors etc.).
Investments from
HIPC for Education
Limited discretion Controlled by the center – MOES/GES – MMDAs function as “post
– offices”
Investments from
HIPC for MMDAs
Some discretion within four
core sectors (Education,
Sanitation, Health and Water) to make cross sectoral
priorities.
MLGRD has a say in the screening process
DACF Significant discretion for the largest share of the funds
DACF is a non-sectoral grant, but there are earmarked budget lines, which limits the discretion of MMDAs to some extent.
GETFund Limited discretion Controlled by the GETFund and MOES/GES, vertical lines of
reporting and accountability.
Capitation grants Discretion for the schools The new capitation grant provides the schools with some flexibility to cover the most urgent operational costs. Allocations are made
fixed as per pupil enrolled and it does not involve the DEOs and/or
the MMDAs.
Donor funds
Some discretion This varies greatly from source to source. The DWAP and the PPS provide the MMDA with a significant flexibility within a set menu
(funds to finance work-plans, excluding salaries), others are
involved in direct purchases of classrooms and text books.
Source: Steffensen 2006.
Education Information Systems, Monitoring
380. Education Management System has Limited Scope and Relevance
381. The Education Management Information System (EMIS) has been built up
throughout the decade. The capability was strengthened following the ESP 2003 and
since then, an annual performance review exercise has been carried out based largely on
EMIS data. But, the EMIS to date is basically an annual school census, usually carried
19 Arguably, this should be considered deconcentration rather than decentralization, given that District
Office staff is appointed by the Center, reports to the Region and uses centrally defined operational
guidelines and standards.
Page 174
148
out at the end of the calendar year or early of the following year. All data in the EMIS
relies on school responses to a detailed questionnaire and the definitions in the sector
performance reports are dependent on the data collection methodology. For instance,
primary completion rate in Ghana is equal with GER at 6th
grade. Given the reliance on
school responses, and considering the lack of IT at many schools, data collection is not
computerized.
382. The reliance on an annual school-based census is not unique, but it limits the
EMIS reliability and timeliness for decision making. A key concern with this EMIS
design is that it maintains a fragmentation between types and sources of data and that, in
turn, limits its usefulness for decision makers. This report has indicated some of the key
challenges in the education sector, but very few of them can be addressed through the
EMIS data collection:
383. Children and student based information: The report has shown so far that key
concerns with outcomes include out-of-school children, overage students and migrations.
Even if statistics were collected on these, EMIS is not linked up with such information
and it doesn’t collect data on the age of children in schools.
384. The private sector has become a key provider of services at all levels, especially
at the lowest levels of basic education. Yet, EMIS has a limited reach to private schools.
Learning outcomes, test results: We have seen the challenges in competence, proficiency
measured by tests. EMIS does not integrate these results.
385. Teacher qualification, teacher payroll. Information about these are part of the
payroll data and the two are not integrated. Expenditures, sources and use of funds: EMIS
is not integrated with the diverse sources of financial information. Schools have no
information about expenditures and financing.
386. A key concern of EMIS has been that it was a hierarchical and highly centralized
data collection, serving essentially the annual sector performance review process. For the
last three years, however, the annual reviews included regional reviews based on district
level information. These reviews have shown the importance of performance review at
local level and also the limitations of the centralized EMIS. Information at the regional
reviews, based on district feedback has often used data that was incongruent with the
centralized EMIS-based statistics. Also, the limited response from private schools has
created a dilemma for the MOE: whether to adjust the data to estimate the likely trends in
non-responding schools or leave key statistics, such as enrollment and admission rates,
and gender parity unadjusted and distorted.
Limited Information about the Quality of Education Services
387. The report has shown some of the most critical factors in determining equity and
efficiency in education. These included the inefficient system of teacher deployment,
disparities in qualified teachers and in per child expenditures as well as wastage in
services caused by absenteeism, and low ToT. These likely are the key reasons for some
of the major challenges in education service delivery. Yet, information about teachers,
funding, and attendance is sporadic and is not available at local levels where social
accountability is critical.
Page 175
149
Data is not collected in time for key management decisions
388. Some of the key decisions include annual budget planning, investment decisions
(GET fund), deployment or redeployment of teachers. Information is not adequately
available for users at local levels, especially for the MMDAs, which appear to have some
level of authority to use non-regular resources to improve education services.
Conclusion: Efficiency and Accountability in Education Management and
Administration
389. Resources will have to be better managed if the government wants to achieve
further improvements in access to and quality of education services, given the already
very high overall level of public expenditures. The Government has been considering
some strategic changes at the local, school-level and central levels but has not fully
implemented them.
a) Local authorities need stronger capacities for decision making,
supervision and resource allocation to more effectively address the diverse
social and economic conditions of education. These include more
consistent promotion of innovative practices, strengthening the
supervision by district level authorities and strengthening the role of local
communities through improved accountability.
b) School management needs to be professionalized through training,
strengthened authority and adjustment of the career patterns in education
to make sure that those become headteachers who are trained and qualified
for the post rather than those who are the most effective or senior teachers
(teaching and school management are two different professions).
c) District authorities need to be given authority to hire, fire and deploy
teachers and more resources to better supervise their attendance and
performance.
d) The central Government needs to build capacities to develop and
monitor policies and incentives, assess learning, monitor performance and
guide those responsible for service delivery as it devolves management to
district and school levels.
Page 176
150
5. HIGHER EDUCATION20
390. Higher education (HE) in Ghana began when the then British Colonial
Administration upon the recommendation of the Asquith Commission on Higher
Education established the University College of the Gold Coast in 1948. When the
country attained independence in March 1957, it became known as the University
College of Ghana and until it gained a full university status as University of Ghana (UG)
in 1961 was affiliated to the University of London which supervised its academic
programs and awarded external degrees to its graduates (UG, 2007; Manuh et al., 2007).
391. As of 2009, the National Accreditation Board (NAB) had accredited 126 public
and private institutions as HEIs. There are 8 public universities. Private institutions, most
of which are affiliated to other autonomous institutions since only 4 have been granted a
charter to award their own degrees, are accredited for a period ranging from two to five
years. The growth in the number of public institutions is largely attributable to the
upgrading of the 38 Teacher Training Colleges which were under the Teacher Education
Division of the Ministry of Education, into Colleges of Education in September, 2007
and placed under the National Council for Tertiary Education (NCTE). All the Colleges
of Education are affiliated to the University of Cape Coast, which awards the Diploma in
Education to graduates (NAB, 2009). Hitherto, students who enrolled in the Teacher
Training Colleges were awarded the Three-Year Post-Secondary Teacher’s Certificate
‘A’.
Table 5-1: List of Accredited Tertiary Education Institutions as of February, 2009
Type of Institution Total Number
Public Universities 6
Other Public Tertiary Institutions 2
Chartered* Private Tertiary Institutions 4
Private Tertiary Institutions 45
Polytechnics (all public) 10
Public Teacher Training Colleges** 38
Private Teacher Training Colleges 1
Public Nursing Training Colleges 14
Private Nursing Training Colleges 4
Total 124
* Granted Presidential authority to award qualifications.
** Now Colleges of Education
Source: NAB 2009.
392. Ghana has made considerable progress in widening access to and promoting the
subject diversity of tertiary education. In a constantly changing global market, this
improvement should be accompanied by a persistent reanalyzing of curriculum relevance.
As of 2010, there were a total of six public universities, encompassing three older and
well established ones – University of Ghana, University of Cape Coast, Kwame Nkrumah
University of Science and Technology – and three more recently established ones –
20 This section on higher education is based on a background study by James Anyan.
Page 177
151
University of Education at Winneba, University of Development Studies and University
of Mines and Technology. As to private universities, the total number is uncertain, even
thought they are required to register with the National Accreditation Board. Thus,
adequate data on private tertiary institutions, which are vital for national development,
are currently lacking. In terms of the public polytechnics, all 10 of these institutions
acquired university accreditation per 1992 legislation (PNDC Law 321). Other public
institutions also exist, such as institutes of professional studies and languages (e.g.
focusing on accounting, translating, journalism, media communications).
393. Tertiary enrollment has grown thirteen-fold since 1990. The estimate of the
transition rate from senior high school to the first year of tertiary is about 10 percent
(Boissiere 2008). Since the early 1990’s tertiary education has expanded at an
exponential rate. Before 1992 when only three institutions (UG, KNUST and UCC) in the
country were regarded as institutions of higher learning; total enrollment stood at 14,500.
Following the upgrading of the polytechnics in 1993 to HEIs, total enrollment in the
tertiary sector more than doubled within a year from 14,500 in 1993 to 30,000 in 1994.
By the 1997/98 academic year, the sector had witnessed a further spike in enrollment of
about 33% from the 1994 figure to 40,000. Within a decade (1997/98-2007/08) total
enrollment in the public HEIs alone (excluding the colleges of education) has more than
tripled from 40,000 to 132,604 (Chambas, 1998: 3; NCTE, 2008b: 1). This represents a
232% increase in enrollment within a decade, or a thirteen-fold increase since 1992. A
glance at three year trends in tertiary enrollment between 1990 and 1995 illustrates that
access to tertiary has experienced a tremendous development: 9,997 students in 1990,
15,500 in 1993, 24,500 in 1996, 46,500 in 1999, 86,570 in 2002, and 121,390 in 2005
(Adu-Orivel 2006). In 1995, a total of only 171 students attended tertiary institutions in
Ghana, owing to a year-long strike among teachers. Since the academic year 2003/04,
enrollment growth averaged 10,000 new students per year. A 104% increase occurred in
the public universities while the polytechnics recorded a 69% increase over the period
2001/02-2007/08. With regard to polytechnics, in Ghana none existed in 1990; currently,
there are over 18,000 students enrolled in ten public polytechnics. Of all tertiary students,
71 percent are enrolled in universities, 26 percent in polytechnics and 3 percent in
professional institutions.
394. Such rapid expansion has placed substantial pressures on the supply side, in
particular, in terms of new faculty members and adequate infrastructure. Adding to the
stresses of the enrollment influx and resource demands, governance structures in tertiary
institutions have not adapted and basically have remained unchanged over the past years
(Boissiere 2008). As a consequence of the growing enrollment numbers, there are also
increasingly more unemployed graduates, some of which eventually seek job
opportunities abroad (ESPR 2009:15). The principal determinants of the rapid enrollment
growth were, firstly, tertiary institutions capacity to levy fees, in turn, allowing for
‘natural expansion’ and consequently more revenue and, secondly, the GETFund
provided resources to expand infrastructure (Boissiere 2008). Moreover, the analysis
conducted by the Country Economic Memorandum using household and employment
surveys demonstrates that in Ghana the rate of return on tertiary education is considerably
high (Boissiere 2008), thus justifying past and further growth in the sector.
Page 178
152
395. A burgeoning private sector. The emergence and the increasing number of private
HEIs in Ghana in the last decade is in sync with similar developments in the sub-region.
The number of accredited private HEIs reached 54 in 2009. The private higher education
institutions are playing a significant role by easing the social demand for HE. As of
December 2008, there were 36 unaccredited institutions listed on NAB’s website as
compared to 54 accredited ones. While 26.3 percent of all tertiary students (about 24,300)
were enrolled in private institutions in 2003/04, 20.5 percent of students (about 28,700)
were enrolled in such institutions in 2006/07, which corresponds to a 5.8 percent decrease
as a share of the total over these years. In other words, while private enrollment is in fact
rising, public enrollments are expanding at a much faster pace and represent a growing
share of total tertiary students.
396. Polytechnics. The polytechnics in Ghana operated as second-cycle institutions
under the Ministry of Education until they were upgraded to tertiary level status in 1993
and brought under the supervision of the NCTE following the promulgation of the
Polytechnics Law (Provisional National Defence Council [PNDC] Law 321 in 1992
(Ministry of Education, Science and Sports, 2008). Since the law, they are more oriented
to technical and vocational education and the training of middle level human resources
for national development, and mandated to award the Higher National Diploma (HND) to
graduates who have successfully completed the three-year polytechnic education.
397. It is worth mentioning that the NAB has accredited five of the ten polytechnics:
Cape Coast, Takoradi, Accra, Ho and Sunyani to award the more advanced B-Tech.
degree in specified programs (NAB, 2009). The emerging academic drift in Ghanaian
HE, as evidenced by the increasing tendency of the polytechnics to be like the
universities, is a threat to differentiation and defeats the purpose of establishing them to
widen the scope of student choice and to develop middle-level human resources for
socio-economic development. As the NCTE (2008a:10) puts it,”...diversity in tertiary
education could be hampered by duplication of academic programs in public universities
and the increasing concentration of polytechnics on business programs rather than
applied science and technology”.
Page 179
153
Figure 5-1: Enrollment in Public Universities and Polytechnics 2001/02-2007/08
Source: Based on NCTE 2008b.
398. The phenomenal growth in student numbers in Ghana, is not a deviant case when
viewed from the context of similar developments in HE both at the regional (SSA) and
global levels. As far as tertiary enrollment growth is concerned, SSA has been leading the
world during the last four decades. Although the region enrolled less than 200,000
students in 1970, enrollment increased more than 20-fold to approximately 4 million by
2007 (UNESCO-UIS, 2009a:1).
ISSUES/CHALLENGES
399. Tertiary Gross Enrollment Ratio remains rather low. Despite the huge increases
in student numbers over the years, gross enrolment in tertiary education was 6 percent as
of 2007. This figure however shows that participation in HE has doubled since 2002 (3%)
according to UNESCO-UIS (2009c: 2). The 6% GER is similar to the average for SSA,
although the global average stands at 26% based on UNESCO data. Countries whose
participation rates exceed the regional average include South Africa (15.4%), Mauritius
(14.0%), Nigeria (10.2%), Cape Verde (8.9%), Côte d’Ivoire (7.9%), Senegal (7.7%) and
Cameroon (7.2%). Other countries such as the Central African Republic (1.1%), Chad
(1.2%), Mozambique (1.5%), United Republic of Tanzania (1.5%) and Burundi (1.9%)
have rates considerably below the average for SSA (UNESCO-UIS, 2009a:1). According
to the Government’s ‘Education Sector Performance Report’ (2010a), the tertiary gross
enrolment rate increased to 9.7 percent by the academic year 2008/09. Considering the
fact that Ghana’s GER for the secondary level grew from 38% in 2002 to 49% in 2007
and the Net Enrollment Rate (NER) from 32% to 45% for the same period, it is evident
that pressure will continue to mount on HEIs, especially the public ones for admissions.
400. Globally, the tertiary gross enrollment averaged around 17 percent while the
average for developed countries was around 67 percent in 2006. This illustrates how far
Ghana still has to go to equitably widen tertiary access.
2001/02
2002/03
2003/04
2004/05
2005/06
2006/07
2007/08
Univ. 46,184 53,895 63,576 73,408 84,078 88,445 93,973
Poly. 20,44 23,11 24,35 24,98 24,66 28,69 34,44
Total 66,626 77,012 87,929 98,391 108,74 117,14 128,42
0
20,000
40,000
60,000
80,000
100,000
120,000
140,000
Stu
den
ts
Figure : Enrollment in Public Universities and
Polytechnics 2001/02 - 2007/08
Page 180
154
Figure 5-2: Overview of Primary, Secondary and Tertiary GERs, 2006
Note: Variations between EMIS and UNESCO data may arise due to differing methodologies applied.
Source: Based on UNESCO, 2008.
401. Access and equity. Access to HE, by and large, remains one of the greatest
challenges of the HE system in Ghana. As noted earlier, the country’s secondary level
NER of 45% for 2007 compared with the tertiary GER of 6% means that all things being
equal, the number of secondary graduates seeking admissions to the tertiary level far
outweighs the capacity of the HEIs to absorb them. Despite the huge increase in student
enrollment in recent times, available data indicate that access has not necessarily
broadened and opportunities for HE have been lopsided and unevenly distributed.
Analyses of student enrollment with respect to students’ socio-economic status (SES);
gender, places of origin, previous secondary schools, family income among others prove
this point. Indeed, “it is at the entry point of tertiary education, that the compound effects
of inequalities in access to and completion of basic education, and progression through
secondary education become most visible” (UNESCO, 2008: 90). The problem of
inequities in the distribution of opportunities in education goes beyond HE. But HE sums
up the disparities at the lower levels of education.
402. A few secondary schools dominate tertiary intake. The secondary school
background of an applicant to the public universities in Ghana greatly influences their
admission, and to which program of study. In a study of demography, social background
and admissions into tertiary institutions in Ghana, Addae-Mensah (2000) found that over
70% of the country’s future doctors, scientists, engineers, architects, pharmacists,
agriculturists, and other professionals emerged from just about 10% of the schools, with
almost 50% emerging from less than 4% or only 18 of Ghana’s 504 Senior Secondary
Schools. In fact, the study also revealed that 70% of admissions in the Humanities and
91% in the Sciences including Medicine and Agriculture for the 1999/00 academic year
at UG were accounted for by the top 50 secondary schools, constituting 9.9% of
secondary schools in Ghana. The situation at KNUST was no different. A recent survey
of 1,500 students in the country’s five oldest public universities confirms that there has
been little variation in this pattern of admissions as it emerged that 50% of students had
come from only 29 schools in the country (Manuh et al., 2007).
403. Geographic Distribution of Tertiary Enrollment. Alongside the influence of
students’ secondary schools on the admission process, geography has also been found to
be a strong determinant of who gets into a particular HEI in Ghana. Residence impacts
112107 106
98 96 96 95
54
76
50 49
32 32 32
125 3 6 10
5 5
0
20
40
60
80
100
120
India Botswana Kenya GHANA Nigeria Benin SSA
Primary GER 06’ Total Secondary GER, 06’ Tertiary GER 06’
Page 181
155
who gets a slot in Ghana’s HE. The results of the survey cited above revealed that 75% of
students in the public universities came from five of the ten administrative regions in
Ghana; namely Ashanti, Eastern, Central, Volta and Greater Accra. The Eastern Region
is ranked the highest with over 18%. The other five regions had enrollments ranging
between 4-6%. Again, approximately 70% of students in the five oldest universities
reside in only three regions – Ashanti, Eastern and Greater Accra -- implying that
students from these regions stand a better chance of making it to the university relative to
those from the rest of the regions. Not only do these regions (Ashanti, Greater Accra and
Eastern) have the highest population densities in Ghana respectively, they are also home
to most of the well-endowed SHS in the country.
Figure 5-3: Region of Origin of Undergraduates Students at UG, 2002/3 and 2007/08
Source: Based on data from the Planning Management and Information Systems Directorate (PMISD) of
UG, 2008.
404. While the regions that are historically privileged in the distribution of students
extended their domination, the disadvantaged ones grew worse off during the period
under review with the exception of the Brong Ahafo which saw a very slight increase.
Whereas in 2002/03 Ashanti, Central, Greater Accra, Eastern and Volta had almost 82%
share of undergraduate students at UG, in 2007/08 the five regions’ share of students had
increased to 85%. ,During the same period the other five regions saw their share decrease
from 18% 2002/03 to 15% in the 2007/08 academic year.
405. Gender-Based Equity: Women still under-represented. Despite government policy
aimed at achieving gender parity in Ghanaian HE, this target is far from being achieved.
Moreover, the portion of female students has barely budged in recent years. Recognizing
that the gender imbalance in favour of males starts well before HE, Government has
created a Girl Child Education Division in both the Ministry of Education and the Ghana
Education Service to tackle the problem from both the basic and the secondary levels.
More action however, is required to achieve the target of 50:50 enrollments which is
0
5
10
15
20
25
Stu
de
nts
(%
)
Figure: Region of Origin of Undergraduate Students at UG,
2002/03 and 2007/08
2002/03
2007/08
Page 182
156
currently the world average and has been exceeded by other SSA countries like
Mauritius, Lesotho and South Africa.
406. In 2003/04, 31.8 percent of students in Ghana’s tertiary sector were female,
compared to and 33 percent in 2007/08, signifying that the gender gap narrowed
minimally over the past few years. The 2007/08 gender parity equaled 0.49 -- about two
males for every female enrolled. According to data from the World Development
Indicators (World Bank), gender parity has subsequently improved to 0.54 at the tertiary
level.
Table 5-2: Male/Female Tertiary Enrollment
2003/04 2004/05 2005/06 2006/07 2007/08 2008/09
Tertiary 92,530 103,222 121,390 139,768 132,604 167,346
Male 63,076 69,179 79,475 91,827 88,836
Female 29,454 34,043 41,915 47,941 43,768
Gender Parity index .47 .49 .53 .52 .49
Source: EMIS.
407. Socio-economic equity. The influence of one’s socio-economic background such
as family income and occupation of parents on access, participation and success in HE is
well documented. In South Africa for example, 70% of students who drop out after the
first year in the university come from low income families. In the Ghanaian context, a
survey conducted by the NCTE in 2002 on the socio-economic status of students in HE
showed that enrollment is skewed in favour of students with white-collar parentage over
those with blue-collar parents. HE in Ghana is disproportionately ‘consumed’ by the
richest 20% of the population. Male students from the highest income quintile (Q5) are
more than seven times more likely to enter and successfully complete HE than those from
the poorest quintile (Q1). The situation is even more precarious for the female category
where students come from only the richest 40% of the population.
Page 183
157
Figure 5-4: Distribution of Tertiary Gross Enrollment Ratios by household Wealth
and Gender, 2006
Source: Based on data from Ghana Multiple Indicator Cluster Surveys (MICS) 2006, World Bank-EdStat.
408. Responses to Access and Equity Problems. It is noteworthy that KNUST
pioneered a quota-based admission system which allows students from deprived schools
categorised by the Ghana Education Service (GES) as Less Endowed Schools (LESs) to
enroll as long as they have met the basic entry qualification, even if they do not achieve
the competitive ‘cut-off’ points required for entry into the various programs. This
initiative has been replicated by the UG and UCC. The latter has reserved 200 admission
slots for this category of students (Morley et al. 2007). In the 2007/08 academic year for
example, a total of 243 students comprising 183 males and 60 females were offered
admissions at KNUST through the LES representing 3.5% of total admissions (6,868) for
the year (Adarkwa, 2007). Apart from the quota system for the deprived schools, the
public universities have also adopted affirmative action for female enrollment. Female
applicants to the UG are admitted one point lower than their male counterparts while the
UDS admits all female applicants with the basic entry qualifications into all programs. At
the UCC, the Joint Admissions Board according to Morley et al. (2007) is poised to keep
female enrollment at levels not below 35% of total enrollment. A ‘dual-track’ tuition
policy (fee-paying) window is also available for applicants who possess the basic entry
qualifications but cannot get into the various academic programs due to the competitive
‘cut-off’ points to enrol in the public universities.
409. Relevance: the changing role and new demands on HEIs. HE is expected to
justify the public investments it receives by helping to raise the appropriate human capital
to deal with the socio-economic challenges confronting countries and to position them to
effectively survive, compete and succeed in the knowledge economy.
410. However, the 60:40 enrollment policy goal for programs in Science &
Technology and Arts & Humanities respectively, for the public HEIs is far from being
realised. In fact, enrollment in Science & Technology in the public universities averaged
36% during the 2001/02-2007/08 period, while Arts & Humanities accounted for 64%
during the period under review.
0
2
4
6
8
Q1(Poorest)
Q2 Q3 Q4 Q5(Richest)
Male 0.11 0.90 1.23 2.63 7.84
Female 0.00 0.00 0.00 1.81 7.31
Gro
ss A
tten
da
nc
e (
%)
Figure: Distribution of Tertiary Students by
Household Wealth and Gender, 2006
Page 184
158
Figure 5-5: Trends in Enrollments in Public Universities by Broad Fields of Study,
2001/02-2007/08
Source: Data based on NCTE (2008b:iv).
411. Graduate Output and the Labor Markets. Tertiary education attainment rate for the
25-64 age groups has increased from 2.6% in 1991 to 7.6% in 2005 yet unemployment
among well-educated urban youth (6.1% in 2005 according to one very narrow measure)
is a persistent problem despite the country’s appreciable economic growth rate and
poverty reduction compared to other SSA countries in the past 15 years, a stable labor
force participation of 89% (age 25-64) and a reduction in the general unemployment rate
from 2.7% in 1991 to 2.3% in 2005, according to one very narrow measure (World Bank
2009).
Table 5-3: Graduate Output by Broad Fields of Study, 2001 & 2007 (ISCED 5-6)
Field of Study 2001 2007
Total MF % F %F Total % F %F
Education 1,122 8 288 26 2,917 13 1,219 42 Hum.& Arts 3,984 28 1,255 32 6,921* 30 2,737 40 SSBL 4,147 29 1,145 28 5,748 25 1,900 33 Science 1,399 10 346 25 2,418 10 705 29 EMC 2,248 16 254 11 3,116 13 313 10 Agriculture 480 3 104 22 1,059 5 247 23 Health & Welfare 591 4 163 28 628 3 223 36 Services 492 3 357 73 496 2 415 84 Total 14,463 100 3,912 x 23,303 100 7,759 Notes: SSBL=Social Science, Business and Law. EMC= Engineering, Manufacturing and Construction.
*Figure may include some Social Science graduates. Percentages have been rounded up and may exceed or be lower than 100 in some cases.
Sources: Data from UNESCO Institute for Statistics (UIS) database for 2001, NCTE data for 2007
category.
412. As expected, graduates from Ghana’s HEIs increased by 61% between 2001 and
2007. In general, female graduate output nearly doubled (98%) during the period under
review from 3,912 in 2001 to 7,759 in 2007. Whereas in 2001 Science and Technology
fields produced 26% of graduates in 2001 compared to 74% for the other fields, by 2007
the share of the former had fallen to 23% and that of the latter increased to 77%. Clearly,
however, employers are not just looking for ‘graduates’ but ‘value-added graduates’.
0
20,000
40,000
60,000
80,000
Stu
de
nts
Figure: Trends in Enrolments in Public Universities by Broad Fields of Study,
2001/02-2007/08
Arts/Hum. Sci./Tech.
Page 185
159
Over time, employers’ demand for graduates with computer and analytical skills, as well
as other personal attributes has increased considerably, making the trend away from
science and technologies studies even more troubling.
413. Internal efficiency: human resources. Here the quality of institutional
management in HE is examined, with particular emphasis on resource mobilisation and
allocation, the so-called productive efficiency. The ability of HEIs to mobilise and
allocate human, material and financial resources in pursuance of the trinity of mission –
teaching, research and community service in a manner that maximises output and reduces
‘production costs,’ and assures quality determines the level of efficiency.
414. Graduate studies, particularly, those which lead to the award of a PhD Degree,
impact positively on the faculty strength and quality of any HEI. However, Ghanaian
HEIs have not fared well in attracting, retaining and graduating individuals with PhDs to
augment the stock and quality of academic staff for teaching and research activities. A
fundamental problem with the low production of PhDs in Ghanaian Universities is
attributable to poor ‘throughput’, which is an element of internal efficiency determined
by the rate as well as the speed of completion of degrees, retention and survival rates
(Salmi & Hauptman, 2006). Data available at UG’s School of Research and Graduate
Studies show that of the 38 PhD candidates enrolled in the Arts and Sciences full-time in
2000, only 16 had graduated by 2007 although even part-time students had a maximum
of seven years to complete the PhD (UG, 2007: 52).
Table 5-4: Student/Academic Staff Ratios and Norms for Public Universities,
2003/04 and 2007/08
Academic
Year
Field of
Study
Student
Enrollment
No. of
Staff Student/Staff
Ratios
NCTE
Norms
2003/04
Science 18,726 755 25:1 12:1 Medicine 2,013 307 7:1 8:1 Humanities 36,009 763 47:1 18:1 Pharmacy 602 34 18:1 12:1 Education 6,226 76 82:1 15:1 Total 63,575 1,935 33:1
2007/08
Science 30,615 1,051 29:1 12:1 Medicine 4,138 342 12:1 8:1 Humanities 41,833 776 54:1 18:1 Pharmacy 648 38 17:1 12:1 Education 16,739 276 61:1 15:1 Total 93,973 2,483 38:1
Sources: NCTE, 2004; 2008b.
415. In 2007/08, there were on average 38 students per teacher (STR) in public
universities. The STRs for all the fields of study exceeded the norms of the NCTE for
both 2003/04 and 2007/08 academic years, excepting Medicine whose STR of 7:1 in
2003/04 was slightly below the norm (8:1) for all the public universities.
Page 186
160
Figure 5-6:Full-Time Teaching staff in Public Universities by Qualifications and
Gender, 2006/07
Source: Data based on NCTE, 2007.
416. Female teachers in Ghana’s universities are grossly underrepresented: 15%
compared to 85% male representation. Moreover women tend to be concentrated in the
lower ranks of teaching staffs. Approximately, a third of teaching staff in the country’s
public universities had a Ph.D. in 2006/07. The recruitment of First Degree holders
(BSc/B.A.) into teaching positions in the universities reveals the extent of academic staff
shortages in the public universities. The Ghanaian Government has taken steps to
improve remuneration to attract and retain teaching staff in the universities.
Remuneration increased by 80% in real terms from 2001-2005 (Adu & Orivel, 2006).
417. Internal efficiency: financial resource mobilization and allocation. Public HE in
Ghana is funded from four principal sources: annual budgetary allocations from the
Government of Ghana (GoG), allocations from the Ghana Education Trust Fund
(GETFund) for the development of infrastructure as well as research and staff, funds
generated internally by the HEIs, and student fees. GoG allocations account for 65% of
recurrent expenditure of the public HEIs with the remaining 35% borne by funds from
private sources. Through the so-called “Akosombo Accord” in 1997, it was agreed that
government or the taxpayer takes 70% of the costs of HE, while the remaining 30% is
borne equally from three sources: students (tuition fees), institutions (IGFs) and private
donations (Manuh et al., 2007). Consequently, students in the country’s public HEIs were
required to pay Academic Facility User Fees (AFUF) and Residential Facility User Fees
(RFUF) in addition to other ancillary fees for such services as examination, transcripts
and technology service, and as a penalty for late registration. Tuition remains free for
students whose grades are competitive enough to get them into the government-
subsidised admission slots, the so-called regular students.
418. Per student costs. Per student cost of HE in Ghana , is 297% of Gross Domestic
Product per capita (GDP p.c.) compared to 19% and 55% for primary and secondary
(senior high school) education, correspondingly. Thus, per student costs at the tertiary
level are about 16 times the costs of primary and five times that of secondary. The SSA
average is 314% of GDP p.c. (World Bank; MOE, 2008).
0
500
1000
1500
2000
No.
of
Sta
ff
Figure: Full-Time Teaching Staff in Public
Universities by Qualification and Gender, 2006/07
Male
Female
Page 187
161
Table 5-5: Countries with the Highest Share of GDP p.c. per Tertiary Student
(2005-2007)
GDP
per
capita,
tertiary
Tertiary
NER
Ratio of
Tertiary
to Pry.
Ratio of
Tertiary
to Sec.
Lesotho 1141.5 3.6 45.6 22.9
Ethiopia 785.5 2.7 62.7 87.9
Botswana 449.6 5.1 27.9 10.9
Rwanda 372.8 2.6 36.6 10.6
Niger 371.4 1.0 13.0 8.1
Burundi 363.1 1.9 18.2 4.7
Chad 348.2 1.2 49.3 11.9
Swaziland 337.6 4.2 21.3 8.4
Central African Rep. 305.2 1.1 40.8 -
Ghana 297.0 - 15.6 5.4
Burkina Faso 236.5 3.0 6.6 10.1 Source: World Bank- EdStats, 2009; World Bank, 2008 data.
419. Suggestions and recommendations: access and equity. Available evidence, thus
far, indicates that demand for HE in Ghana will continue to rise. One indication of this is
that with a secondary NER of 45% and tertiary GER of 6%, applications for admissions
can be expected to outstrip supply by the HEIs. Measures to diversify the sector and take
the pressure away from the university sector should be strengthened. The polytechnic
sub-sector could be made attractive for students as a viable and alternative option to
university. Steps should be taken to halt the academic drift of the polytechnics by
ensuring that the sub-sector focuses on its core mission of training technicians and
professionals at an intermediate level of HE.
420. The lifelong learning option could be explored further, developed, and made more
appealing by government and the HEIs to allow non-traditional students whose
qualifications may not get them into HE as traditional students, to access HE.
Professional experience, age and similar attributes should be given greater weights in
such admissions. Distance education initiatives by the HEIs go in the right direction;
government should encourage the HEIs by investing in modern educational technologies
and study centers. Cross-border distance education should be encouraged and handled in
a manner that does not compromise quality or discourage investments. In particular,
investments that foster foreign collaboration with Ghanaian HEIs should be encouraged,
since such initiatives stand to give students, teaching and research staff international
experience and exposure.
421. Differentiation of the sector is key to increasing access, widening participation
and reducing government spending in Ghana’s HE. In spite of the increase in enrollment
in Ghana’s HE, the 6% GER is still not the optimum for a country aspiring to middle-
income status as evidence from other SSA countries shows. Requisite human capital and
skills development is a sine qua non for the attainment of such a status and to make the
country competitive in the knowledge economy. Diversifying the sector, ensuring that
Page 188
162
academic programs respond to socio-economic needs will make graduates not just job-
seekers but job-creators, which should help reduce the problem of graduate
unemployment.
422. In terms of efforts to help incorporate marginalized groups, setting quotas would
be an important step to enable the Government to do more in the area of policy-making
and monitoring to ensure that efforts are properly coordinated and harmonized. The
Government should revisit the policy of ensuring that each district has at least one well-
endowed senior high school to address the gross underrepresentation of graduates of the
majority of the senior high schools in the HEIs. Again, improving information
dissemination about opportunities in HE, fee-rebates, scholarships etc., especially to rural
students who in most cases have had no relatives who have enrolled in or completed HE,
would go a long way to demystify HE and reduce debt-aversion for students with low
socio-economic status. Public subsidies for HE should also be targeted at such minority
groups since benefit incidence analysis has revealed that HE in Ghana is
disproportionately being ‘consumed’ by the rich and urban dwellers.
423. Suggestions and recommendations: relevance. The Government policy goal of
60:40 enrollments for Science & Technology, compared to Humanities & Arts (and other
fields) is gravely off-track. Enrollments from 2001/02 to 2007/08 averaged 36% and 64%
correspondingly. Worse, the number of graduates in the Sciences took a down turn during
the same period. This has far-reaching implications for Government’s vision of “[...]
aspiring to build a knowledge-based economy within the next generation” (MOEYS,
2004: 3). Here again, Government should look beyond HE to address this challenge. The
teaching and learning of science-based courses, especially at the secondary level should
be given a boost to attract and sustain the interests of students. At the tertiary level,
interventions should include the creation of science-based programs other than Medicine
which would lead to employment opportunities and thereby be attractive to many
students. It is not uncommon to find science students abandoning the field for programs
in Business and Management at both the undergraduate and postgraduate levels because
such fields are deemed to hold better job prospects for graduates in Ghana. It is important
to note that training human resources for today’s labor markets may not be the best long-
term option due to the volatile nature of the labor markets; hence the need for both job-
specific and broad liberal arts education accompanied by the development of universal
skills and aptitudes that will make the graduate adaptable in the labor market.
424. Suggestions and recommendations: internal efficiency. At the heart of the issue of
high STRs and an ageing faculty in the public HEIs is the low throughput from graduate
studies and the cumulative effect of poor teacher remuneration and other inferior
conditions of service in the past. The best and brightest first degree holders from the
universities tend to enroll in graduate studies abroad as that is typically perceived as
superior to graduate study in Ghana. Inadequate scholarships and other funding
opportunities for graduate studies also account for this. Neither can departments with few
faculty members holding PhDs effectively mount PhD programs nor supervise PhD
candidates. Urgent steps must be taken at both the system and institutional levels to
improve quality and restore confidence in graduate education and research training in the
country’s HEIs. Some rationalization of non-academic staffing in both the public
universities and polytechnics is required to keep them within the limits set by the NCTE.
Page 189
163
The underrepresentation of females within academic staffs in the HEIs is an outcome of
the gender imbalance in female enrollment in Ghana’s HE. The majority of female
academics are Master’s Degree holders and at the rank of Lecturer. As female enrollment
in the HEIs improves it will have a positive influence on the stock of female academic
staff in the HEIs.
Conclusions: Improving access to and relevance of higher education
425. Ghana needs policies to deal with social pressures to increase higher education
enrollment and economic pressures to improve relevance; without these, most social and
economic expectations, and also the Government’s strategic agenda will remain
unfulfilled. Differentiation of the sector is also key to increasing access, widening
participation, increasing relevance, and reducing government spending. It’s also clear that
effective policies require a change in the way higher education is financed and governed,
how institutions and services are managed, and how quality is assured. Already almost
half of the higher education revenues come from non-state resources; it is imperative that
both state and non-state resources are used more strategically. A few policy options may
include the following:
a) Government financing should be more closely linked to performance, norms,
and strategic priorities. The financing of inputs including staff and other costs based
simply on enrollment, and the separation of investments from recurrent expenditures
limit the Government’s ability to stimulate improved performance or progress along the
desired strategic directions.
b) By the same token, Government financing should also be more targeted to meet
specific social, economic or other strategic objectives.
c) Institutions need to have more management authority, responsibility and
capability to run higher education effectively and efficiently. There are well tested
instruments that can help the improvement of institutional performance including
institutional planning, performance contracts, but also partnerships with other HEIs or
the private sector.
d) Independent quality assurance, accreditation and performance monitoring
should be established and strengthened, with the participation of both the academic
community and the Government. These processes should involve members of the
international academic community, the business community, social partners and civil
society.
Page 190
164
6. EDUCATION STRATEGIC PLANNING, POLICY OPTIONS
The Need to Revise the Education Strategic Plan (ESP) 2003
426. The 2003 Education Strategic Plan was established to project the funding and
policy requirements of reaching the EFA and MDG sector goals. The policy goals of the
ESP were the following:
1. Increase access
2. Improve quality
3. Extend and improve TVET
4. Promote health/ sanitation in institutions
5. Improve planning and management
6. Expand science and technology education
7. Improve academic quality and research
8. Expand pre-school education
9. Promote programs to prevent HIV&AIDS
10. Provide equal opportunities
427. The ESP accordingly helped establish some key milestones, policies, funding and
operational frameworks and monitoring arrangements. Five years later, it was clear that
the Plan had to be fundamentally revised for the following reasons:
428. Financial gap: From the very beginning, there was a funding gap within the plan.
A 2005 funding projection indicated that by 2010, the gap would grow up to 80 percent
of the basic education budget.
429. Changing External Factors: Over the last ten years, economic growth has
accelerated, thanks to solid governance and positive changes in global markets. This
brought about higher state revenues, but also caused inflation and radical increases in the
wage bill. The latter affected heavily the sector given that 70 percent of the entire system
and over 90 percent of basic education expenditures are used to pay salaries; 40 percent
of the entire civil service is teachers. So, both the budget and the payroll have radically
expanded especially over the last five years.
430. Competing priorities: Also, from the onset, competing education policy priorities
were defined in ESP and in the White Paper, also dated in 2004. The latter has put much
stronger emphasis on post-basic education.
431. Emerging new challenges: By 2008, it had become clear that improvements in
access had slowed down, learning results shown low quality and there were persistent
equity and efficiency problems in the sector, including those that create major obstacle to
achieving the goals defined in the ESP.
432. The Government, in strong cooperation with the Development Partners launched
in 2009, the new Education Strategic Planning process for 2010-2020. The new ESP was
to be completed by the Fall of 2010. It is unclear what the status of the ESP is, to what
extent the new targets and benchmarks were endorsed and to what extent budgeting is
Page 191
165
affected by the plan. However, it is very likely that the plan will provide a framework for
monitoring the sector performance for the coming decade.
Positive Trends in the ESP 2010-2020
433. The ESP drew up the following lessons (ESP 2010-2020 p.12)
a) Improvements in 1st and 2nd cycle enrolments and gender parities,
primary completion, transition to JHS and initiatives in complementary education
are achievements that must be maintained and built upon.
b) The improvements in equity and access (above) now need to be reflected
in comparable improvements in delivery of quality education.
c) Effective means of measuring and subsequently improving education
quality are required - necessitating regular national assessments of literacy and
numeracy rates at P6 level, with greater emphasis on qualitative performance
reporting.
d) Enrolment growth in the 1st cycle has placed a strain on the provision of
trained teachers for kindergarten, primary and JH schools, leading in turn to
reduced capacity for delivering quality education.
e) (…) non-formal education (including various forms of NGO-supported
complementary education that have demonstrably improved literacy and enabled
out-of-school children to join mainstream classes) is good value for money and
should be supported in the ESP.
f) Retention of pupils in JHS needs to be improved in the next decade.
g) PTRs in JHS are very low, leading to inefficient teaching and high costs –
staff rationalization and deployment in this subsector need to be addressed.
h) In terms of examination success and skills development, the rate of returns
at second cycle level, particularly in SHS, is poor.
i) The issues of boarding and student accommodation at 2nd and 3rd cycle
levels, with their high levels of public expenditure and corresponding inequities,
need to be addressed.
j) Escalation in tertiary enrolment has skewed public expenditure (away
from basic education), distorted government training targets for science and
technology, and contributed to graduate unemployment.
k) Official and unofficial leave is expensive and takes people (particularly
teachers) away from their place of work, invariably at public expense, at a cost for
the delivery of quality in the workplace.
l) Decentralization, while an undoubted opportunity, will place strain on
management capacity and public resources during the first five years of the ESP.
Page 192
166
434. There seems to be a strong concurrence between these lessons drawn in the ESP
and the findings of the present report, especially in some key areas, including on access
where there is a slow-down in aggregate terms, in quality, which needs significant
overhaul, in efficiency, relevance -- especially at post-basic level -- and in management.
435. A key advantage of the new ESP is that it recognizes the importance of efficiency
gains to finance the long-term development agenda. Accordingly, the ESP targets the
following efficiency objectives:
a) elimination of inequitable subsidies
b) reduction in non-productive staff in District and Regional Offices and
in tertiary institutions
c) reduction in absenteeism
d) effective staff utilization
e) effective reporting on use of financial and other resources
436. As part of the effective staff utilization, the ESP recommends increasing the PTRs
(with the exception of KG where the PTRs are already extremely high). Table 6-1 below
shows the expected changes in PTR by levels:
Table 6-1: Expected changes in PTR by levels
2007
(baseline) 2010 2012 2015 2020
KG 74 67 63 56 45
Primary 34 37 38 41 45
Junior Sec 24 27 28 31 35
Senior High 19 22 23 26 30
437. The new ESP also intends to strengthen management through gradually
decentralizing some areas but also building stronger central institutions, including a
National Inspectorate Board and strengthened, multilevel monitoring and evaluation as
well as a better EMIS system.
Remaining Challenges
438. While it is unquestionable that the ESP is comprehensive and that it addresses
some of the most pressing issues in access, quality, efficiency and appropriate
institutional/management issues, an effective policy agenda needs to cover some further
issues that can create stubborn obstacles for achieving the long-term goals. This report
will call the attention to five of these issues:
Intrinsic inefficiencies
439. Some of the inefficiencies stem from uneven distribution of student population.
The median size of basic schools is low and it is very difficult to provide quality
education to all especially in small rural schools in poor communities without some
innovative policies and practices. These may include new pedagogical approaches, like
Page 193
167
multi-grade teaching, decentralizing key decisions on service delivery and resource
deployment to local levels, reliance on private and non-formal delivery and creating
school clusters and using new technologies in delivery and in teacher training. Such ideas
will have to be properly priced and incentivized.
Stubborn disparities
440. Despite the commitment by subsequent Governments, resources are not targeted
to deprived areas; instead such areas are short-changed as qualified teachers are not
deployed effectively and other resources are leaked before they reach the classroom.
Even if the Government increases PTR to a level that appears to be sustainable on an
aggregate level, the disparities in PTR and in PTTR are so significant that the uneven
service delivery dwarfs any efficiency gains. In the last five years, the efficiency of
resource allocations has declined in all areas. The Government needs to strengthen its
monitoring capacity, policy arsenal and resolve to address these disparities.
Social inequalities requiring better targeting
441. Deprivation can be clearly located through educational outcomes and in the
geographic mapping of the country, but deprivation is fundamentally originated in
underlying social and economic position of families and communities. Better educational
services can overcome the social inequalities but only if these services are better targeted.
These may include better targeting of school feeding, programmatic schemes to
compensate the educational handicap of poor communities (i.e. to assure improved access
to KG education) or scaled up version of LEAP. But such measures require much more
effective targeting to the poor.
Coherent financing
442. While more and more resources are used for education, those who could use the
resources effectively are not empowered to do so. Instead, resources remain fragmented,
each serving a variety of agendas and clients. Typically, the key source of investment, the
GET fund is not linked to the Sector’s long-term strategy nor to the decisions of those
who are ultimately responsible for service delivery. Education financing needs to be
decentralized at a level, where effective decisions can be made, efficiency gains can be
achieved.
Institution building for service delivery
443. The ESP recognizes the challenges with decentralization and correctly identifies
some of the central capacities to be built. However, ultimately education will be delivered
at the level of districts and schools. These levels need to have mechanisms, tools and
capacities to allocate resources, supervise staff performance, measure and monitor
outcomes and report on the results to the stakeholders. Without these capacities not only
decentralization will fail, but also education service delivery will stagnate.
Programmatic financing
444. Addressing persistent and emerging new challenges requires well informed and
well targeted policies as well as programmatic financing that assigns clearly
Page 194
168
responsibilities to agencies in charge of service delivery. Such a programmatic financing
was adopted by the Ministry of Education in 2008, but this was never implemented
during the budget preparation process in any of the subsequent budget years.
Page 196
170
References
Abadzi, Helen. 2007. Absenteeism and Beyond: Instructional Time Loss and
Consequences. Washington DC: World Bank.
Adarkwa, K. K. (2007, September). Matriculation address. Delivered at the 41st
Matriculation Ceremony of KNUST. Retrieved March 9, 2009 from,
http://www.knust.edu.gh/news/speeches/speech7Speech%20for%2041st%20Matricul
ation.pdf
Addae-Mensah, I. (2000). Education in Ghana: A tool for social mobility or social
stratification? Delivered at the J.B. Danquah Memorial Lectures. Accra: Ghana
Academy of Arts and Sciences.
Adu, K. & Orivel, F. (2006). Tertiary education financing strategy in Ghana. Report to
the National Council for Tertiary Education. Accra, Ghana.
Akyeampong, Kwame, Pryor, John and Ampiah, Joseph Ghartey. 2006. A vision of
successful schooling: Ghanaian teachers' understandings of learning, teaching and
assessment. Comparative Education, 42:2, 155-176.
Akyeampong, Kwame et al. 2007. Access to Basic Education in Ghana: The Evidence
and the Issues. Country Analytic Report. CREATE. June 2007.
Akyeampong, Kwame. 2008. Public Private Partnership in the Provision of Basic
Education for Poor and Disadvantaged Groups in Ghana and Rwanda: Possibilities
and Constraints. Brighton, UK, University of Sussex, Sussex School of Education,
Centre for International Education, unpublished paper.
Akyeampong, Kwame. 2009. Access and Educational Equity in Ghana. Brighton: Centre
for International Education, University of Sussex, commissioned by the World Bank
for this Country Status Report, unpublished.
Akyeampong, Kwame. 2009a. Revisiting Free Compulsory Universal Basic Education
(FCUBE) in Ghana. Routledge, Comparative Education, 45:2, 175-195.
Amaral, A. & Magalhặes, A. (2007). Implementation of higher education policies: A
Portuguese example. In A. Gornitzka, M. Kogan & A. Amaral (Eds.), Reform and
change in higher education: Analysing policy implementation, pp. 117-134.
Dordrecht: Springer.
Ampiah, Joseph Ghartey and Adu-Yeboah, Christine. 2009. Mapping the incidence of
school dropouts: a case study of communities in Northern Ghana. Comparative
Education, 45:2, 219-232.
Anyan, James. 2010. Higher Education in Ghana: A Diagnostic Review. Accra, Ghana:
commissioned by the World Bank for this Country Status Report, unpublished.
Annor, J. 2002. Implementing government policy for supporting technology use by
persons with disability. Center on Disabilities Technology and Persons with
Disabilities Conference 2002, California State University.
Anthony, J. 2009. Access to education for students with autism in Ghana: Implications
for EFA. Background paper for EFA Global Monitoring Report 2010.
Atchoarena, David and Andre Marcel Delluc. 2001. Revisiting Technical and Vocational
Education in Sub-Saharan Africa: An Update on Trends, Innovations, and
Challenges. IIEP/Prg.DA/1,320. Paris: International Institute for Educational
Planning.
Page 197
171
Bennell, P. and Akyeampong, K. 2006. Is There a Teacher Motivation Crisis in sub-
Saharan Africa and South Asia? Key Findings and Recommendations of an
International Research Project, Knowledge and Skills for Development. Brighton,
UK, Knowledge and Skills for Development.
Brookings Institution. 2007. Review of Trends in Public Spending for Education and
Health in Ghana (2002-2006). Transparency and Accountability Project.
Bruneforth, M. 2006. Interpreting the distribution of out-of-school children by past and
expected future school enrollment. Background paper for EFA Global Monitoring
Report 2007.
CDD (Center for Democratic Development). 2008. TRACKING LEAKAGE OF PUBLIC
RESOURCE IN THE EDUCATION SECTOR: A pilot investigation of teacher
absence in public primary schools in Ghana. In collaboration with: the Transparency
and Accountability Project/ Brookings Institution. Ghana.
Chambas, I. M. (1998). Higher education in the twenty-first century: Vision and action.
Volume V- plenary .Ghana. Paper presented at the World Conference on Higher
Education. Paris: UNESCO.
Daily graphic. 2009. Educational woes. Accra: Daily Graphic Press. 2nd
November, 2009,
cover article.
De Walque, D., 2004: How does the impact of an HIV/AIDS information campaign vary
with educational attainment? Evidence from rural Uganda. Working Paper March.
Washington DC: World Bank, Development Research Group.
Dunne, Máiréad, Leach, F., Chilisa, B., Maundeni, T., Tabulawa, R., Kutor, N., Forde, L.
and Asamoah, A. 2005. Gendered School Experiences: The Impact on Retention and
Achievement in Botswana and Ghana. Education Series Research Report No. 56.
London, DfID.
EARC. 2003. Teacher Time on Task. United States Agency for International
Development, Grant No. 641 G-00-03-0055 unpublished report. Educational
Assessment and Research Center, 35 Dabebu Rd. Osu, Ghana.
Education Policy and Data Center. 2008. 2008 series of education projections to 2015
and 2025. Background paper for EFA Global Monitoring Report 2009.
EER. 2009. Ghana: Education Expenditure Review; Component of External Review of
Public Finance Management (ERPFM). ….
Education Management Information System (EMIS). EMIS school census database and
administrative WAEC data. Accra: Ministry of Education.
Fentiman, A., Hall, A. & Bundy, D. 2001. Health and cultural factors associated with
environment in basic education: a study in rural Ghana. Social Science and
Medicine, 52, pp. 429-439.
Fobih, D., Akyeampong, K. A. and Koomson, A. 1999. Ghana Primary School
Development Project: Final Evaluation of Project Performance. Accra: Ministry of
Education.
Foster, Philip J.1965. Education and Social Change in Ghana. Chicago: University of
Chicago Press.
Fredriksen, B. 2007. School Grants: One Efficient Instrument to Address Key Barriers to
Attaining Education for All. Capacity Development Workshop 'Country Leadership
and Implementation for Results in the EFA FTI Partnership', Cape Town, South
Africa, 16–19 July.
Page 198
172
Freedom House. 2009. Freedom in the World 2009. Washington DC: Freedom House.
Gershberg, A. I. and Maikish, A. 2008. Targeting education funding to the poor:
universal primary education, education decentralization and local level outcomes in
Ghana. Background paper for EFA Global Monitoring Report 2009.
Ghana Demographic and Health Survey. 2009. Ghana Demographic and Health Survey
2008. Accra, Ghana: Ghana Statistical Service, Ghana Health Service, and ICF
Macro.
Ghana Education Service. 2008. INSET National Guidelines. Second Edition, GES,
Accra, Ghana.
Ghana Education Service, 2007. INSET Sourcebook: District Guidelines and Operational
Manual for District Level INSET. GES, Accra, Ghana
Ghana Education Service and University of Cape Coast (Institute of Education) 2007.
Two Year Diploma in Basic Education Brochure. Teacher Education Department,
GES, Accra, Ghana
Ghana Education Service and Ghana National Association of Teachers. 2000. Conditions
and Scheme of Service and the Professional Code of Conduct for Teachers. GESC
and GNAT, Accra, Ghana
Ghana National Association of Teachers, 2000. Manual on GNAT. GNAT, Accra, Ghana
Ghana National Commission on Children (GNCC). 2000. Ghana's children: the child's
perspective. Accra: GNCC.
Ghana Statistical Service (GSS). 2003. Core Welfare Indicators Questionnaire.
Accra: Ghana Statistical Service.
Government of Ghana (GoG). 2004. White Paper on the Report of the Education
Review Committee. Accra: Government of Ghana.
Government of Ghana. 2009. Underserved Areas in Ghana, A study on Teacher
Placement. Accra: Government of Ghana.
Harttgen, K., Klasen, S. and Misselhorn, M. 2008. Education for All? Measuring pro-
poor educational outcomes in developing countries. Background paper for EFA
Global Monitoring Report 2009.
Hashim, I. 2005. Exploring the Linkages between Children’s Independent Migration and
Education: Evidence from Ghana. Working Paper T-12, Brighton: Sussex Centre for
Migration Research.
Hayford, B. K. (ed.).1988. Social Studies for JSS. Accra: Curriculum Research and
Development Division (CRDD).
Hedges J. 2000. The importance of posting in becoming a teacher in Ghana MUSTER
discussion paper No. 13. University of Sussex, UK
JICA, 2008. Final Report on Project to support the operationalization of the In-Service
Training Policy. JICA, Accra, Republic of Ghana.
J-PAL and IPA. 2009. An [Emergency] Primary School Quality Initiative. Jameel
Poverty Action Lab (JPAL) and Innovations for Poverty Action (IPA).
Leach, F. 2006. Researching gender violence in schools: methodological and ethical
considerations. World Development, Vol. 34, No. 6, pp. 1129–47.
Lewin, Keith M. 2009. Access to education in sub-Saharan Africa: patterns, problems
and possibilities. Comparative Education: 45:2, 151-174.
Page 199
173
Manuh, T., S. Gariba & J. Budu (2007). Change & transformation in Ghana’s publicly
funded universities: A study of experiences, lessons & opportunities. Oxford: James
Curry Ltd., Accra: Woeli Publishing Services.
Ministry of Education and Sports/EMIS. 2002. Policy Analysis Brief (1). Accra: Ministry
of Education.
Ministry of Education, Youth and Sports. 2004. White Paper on the Report of Education
Reform Review Committee. Accra: Ministry of Education, Youth and Sports.
Ministry of Education, Youth and Sports. 2006. Preliminary Education Sector
Performance Report 2006. Accra: Ministry of Education, Youth and Sports.
Ministry of Education. 2008. Policy, Budget, Monitoring and Evaluation Unit. March,
2008. Accra: MOESS.
Ministry of Education. 2008a. Education Sector Performance Report. July 2008. Accra:
MOESS.
Ministry of Education. 2008b. Trends in International Mathematics and Science Study:
TIMSS 2007 – Ghana Report. Accra: Adwinsa publications.
Ministry of Education Science and Sport, 2008. Basic Teaching and Community
Practices for the Teacher: A compendium of useful information for the practicing
teacher. MOESS, Accra, Ghana.
Ministry of Education. 2009. Education Sector Performance Report. Accra: Ministry of
Education.
Ministry of Education. 2010. Basic Education Comprehensive Assessment System:
Report Summary 2009 National Education Assessment Primary 3 and Primary 6,
English and Mathematics. Accra: Ministry of Education, Assessment Services Unit,
June.
Ministry of Education. 2010a. Draft Education Sector Performance Report. Accra:
Ministry of Education, unpublished version for internal circulation and development
partner discussion.
Monk, Courtney, Justin Sandefur, and Francis Teal. 2007. Apprenticeship in Ghana.
Centre for the Study of African Economies, Department of Economics, University of
Oxford, (processed).
Montgomery, M. Kouamé, A and Oliver, R. 1995. The Tradeoff between Number of
Children and Child Schooling: Evidence from Cote d'Ivoire and Ghana: Ghana
Living Standards Measurement Study. Washington DC: World Bank.
Morley, L., F. Leach, R. Luggs, J. Opare, E. Bhalalusesa, L.D. Forde & R. Mwaipopo
(2007). Widening participation in higher education in Ghana and Tanzania:
Developing an equity scorecard. An ESRC/DfID Poverty Reduction Programme
funded Research Project.
Murphy, Patrick. 2009. Teachers in Ghana; Summary and Observations. Washington
DC: World Bank, unpublished.
National Education Reform Implementation Committee. 2007. Education Reform 2007
At a Glance. NERIC Secretariat. Accra, Ghana
National Accreditation Board. (2009, February). Accredited tertiary institutions as at
February 2009. Retrieved April 27, 2009, from
http://www.nab.gov.gh/nabsite/List%20of%20accreditation%20Tertiary%20Instit
ution%20as%20at%20February%202009.pdf
Page 200
174
National Council for Tertiary Education [NCTE]. (2007). 2006/2007 statistical digest of
publicly funded universities, IPS and GIJ. Accra: NCTE.
NCTE (2008a). Tertiary education policy: Investing in human capital; securing our
future. Accra: NCTE.
NCTE (2008b). Summary of basic statistics on public tertiary education institutions
2007/2008. Accra: NCTE.
NEA (National Education Assessment). 2008. 2007 NATIONAL EDUCATION
ASSESSMENT. Accra, Ghana: Ministry Of Education, Science and Sports.
Nii Moi Thompson and Leslie Casely-Hayford (RECOUP). 2008. The Financing and
Outcomes of Education in Ghana. RECOUP Working Paper Series, Cambridge, UK.
Nti, Benjamin. 2007. Report on Monitoring of Teaching and Learning at Debibi Circuit.
July 2007. Accra, Ghana.
Obeng, C. 2007. Teacher’s views on the teaching of children with disabilities in
Ghanaian classrooms. International Journal of Special Education, 22 (1), pp.96-102.
Oduro, A. D. 2000. Basic Education in Ghana in the Post-Reform Period. Accra: Centre
for Policy Analysis.
OECD. 2008. A profile of Immigrant Populations in the 21st Century: Data from OECD
Countries. Paris: Organization for Economic Co-operation and Development.
Payson Center for International Development. 2008. Second Annual Report. Oversight of
Public and Private Initiatives to Eliminate the Worst Forms of Child Labor in the
Cocoa Sector in Côte d'Ivoire and Ghana. New Orleans: Tulane University Law
School, Payson Center for International Development.
Perry C. 2007. MoESS/GES Staff Supply/Demand Forecasting Model, Final Report.
Minisry of Education Science and Sports, Accra, Ghana
Salmi, J.& Hauptman, A. M. (2006). Innovations in tertiary education financing: A
comparative evaluation of allocation mechanisms. Education Working Paper Series,
No. 4, Washington D.C: The World Bank.
Steffensen, Jesper. 2006. Study on Improving Basic Education through a more
Transparent, Equitable and Better Financial and Performance Management: Review
of the Funding Flows in Basic Education. Nordic Consulting Group, June.
Teacher Education Division, Ghana Education Service. 2000. Teacher Trainees
Handbook: 3 year diploma in basic education for teacher training colleges. GES,
Accra, Ghana
Teal, Francis. 2001. Education, incomes, poverty and inequality in Ghana in the 1990s.
Working paper WPS/2001.21. Oxford: CSAE, University of Oxford.
te Velde, D. W. et al. 2009. The Global Financial Crisis and Developing Countries:
Synthesis of the Findings of 10 Country Case Studies. London, UK Overseas
Development Institute, Investment and Growth Program. ODI Working Papers, 306.
Thurman, M. S. 2003. A study on Children with Disabilities and Special Education in
Ghana: Key Findings. Washington DC: USAID.
TIMSS. 2009. Trends in International Mathematics and Science Study. Washington DC:
IES, http://nces.ed.gov/timss/index.asp
Tooley, James. 2005. Private Schools for the Poor. Education Next, Winter 2005, pp.22-
32.
Transparency International. 2009. Corruption Perceptions Index 2009. Berlin:
Transparency International Press.
Page 201
175
Transparency International. 2009a. Africa Education Watch. Berlin: Transparency
International Press.
UNDP. 2009. Human Development Report (HDR) 2009. New York: United Nations
Development Program, in: http://hdr.undp.org/en/statistics/data/ [1.12.2009].
UNESCO. 2006. EFA Global Monitoring Report 2007: Strong foundations Early
childhood care and education. Paris: UNESCO Publishing, in:
http://unesdoc.unesco.org/images/0014/001477/147794e.pdf [10.08.2009].
UNESCO. 2007. EFA Global Monitoring Report 2008: Education for All by 2015; Will
we make it? Paris: UNESCO and Oxford publishers, in:
http://www.unesco.org/education/gmr2008/press/Full-report.pdf [11.08.2009].
UNESCO. 2008. EFA Global Monitoring Report 2009; Overcoming Inequality: Why
Governance Matters. Paris: UNESCO,
http://unesdoc.unesco.org/images/0017/001776/177683e.pdf
UNESCO. 2010. EFA Global Monitoring Report; Reaching the Marginalized. Paris:
UNESCO; and, Oxford: Oxford University Press.
UNESCO-UIS (2009a). Trends in tertiary education: Sub-Saharan Africa. UIS Fact
Sheet, July 2009, No.01. Retrieved September 2, 2009 from
http://www.uis.unesco.org/template/pdf/ged/2009/Fact_Sheet_2009_SSA.pdf
UNESCO-UIS (2009c). UIS statistics in brief: Education in Ghana. Retrieved September
2, 2009, from
http://stats.uis.unesco.org/unesco/TableViewer/document.aspx?ReportId=289&IF_La
nguage=eng&BR_Country=2880&BR_Region=40540
United Nations Population Division. 2009. World Population Prospects: The 2008
Revision. Population Division of the Department of Economic and Social Affairs of
the United Nations Secretariat, http://esa.un.org/unpp.
University of Education, Winneba, Ghana. September 06. Ghana: The Country Analytic
Review, CREATE Country Analytic Reviews, Sussex, UK
University of Ghana (2007). Report of the Visitation Panel to the University of Ghana.
Legon: University of Ghana.
USAID. 2003. Teacher Time on Task. Conducted by Educational Assessment and
Research Center, Ghana. Sponsored by USAID grant no. 641-G-00-03-0055.
USAID. 2009. Basic Education Quality in Ghana; Basic Education in Ghana: Progress
and Problems. June 2009. Washington DC: USAID.
Wodon, Quentin. 2009. Improving the Targeting of Social Programs in Ghana. October
2009. Development Dialogue on Values and Ethics. Washington DC: World Bank.
Wodon, Quentin; George Joseph. 2010. School Level Analysis, School Lunch Analysis
and NEA Analysis in Ghana. Accra, Ghana: commissioned by the World Bank for
this Country Status Report, unpublished.
World Bank. 1989. Basic education for self-employment and rural development.
Washington, DC: World Bank.
World Bank, 2002: Opening Doors; Education and the World Bank. Washington, DC:
World Bank.
World Bank. 2004. World Bank Project Assessment Report (Report No.: 29581). July
2004. Washington DC: World Bank.
World Bank. 2004a. Books, Buildings and Learning Outcomes: An impact evaluation of
World Bank support to basic education in Ghana. Washington, DC: World Bank.
Page 202
176
World Bank. 2008. Ghana: Job Creation and Skills Development – Draft Report.
Volume 1. Washington DC: World Bank.
World Bank. 2009. Gross national income 2008, Atlas method. Washington DC: World
Bank. http://siteresources.worldbank.org/DATASTATISTICS/Resources/GNI.pdf
World Bank. 2009a. Ghana job creation and skills development. Volume 1: Main Report.
Document of the World Bank.
World Bank Ghana Survey Data. 2009. Ghana Survey Data. Chris Reinstadtler.
Washington DC: World Bank, unpublished.
World Health Organization (WHO). 2008. World health statistics 2008. Geneva: WHO
Press.
Page 203
177
Annex 1: Political and Administrative System
Ghana at a Glance
Geography. Ghana is a small country located on the coast of West Africa. It borders
the Gulf of Guinea to the South, Côte d’Ivoire to the West, Burkina Faso to the North
and Togo to the East, three French-speaking countries (see map below). It covers an
area of 238,540 square kilometres (92,085 square miles) and its coastline stretches
along 540 kilometres. Ghana’s Lake Volta is created by a hydroelectric dam in the East
and is the largest manmade lake in the world. Due to its proximity to the Equator,
Ghana has a warm and tropical climate, supporting crops such as cocoa, maize, cassava,
sorghum, millet, yam and rice. It is also endowed with natural resources such as gold,
timber, diamond, bauxite and manganese. Commercial quantities of oil were discovered
in 2007 containing up to 3 billion barrels, and explorations and findings continue.
People. As of 2009, Ghana had a population of about 24 million people, consisting of
over 100 ethnic groups, who speak over 250 languages. Although the vast majority of
Ghanaians speak a minimum of one local language, English is the official language and
the most common language in administration, schooling and commerce. As census data
from 2000 indicates, about 69 percent of Ghanaians practice Christianity, 16 percent
Islam and 15 percent traditional beliefs.
Politics. Internationally, Ghana has been and continues to be recognized as one of the
most peaceful countries in Africa. It was the first sub-Saharan country in colonial
Africa to gain independence, declared on March 6th
, 1957. In that year Ghana was
founded as a sovereign parliamentary democracy, led by Kwame Nkrumah. In
subsequent decades, power alternated between civilian and military rule of the
government. With the adoption of the 1992 Constitution, the division of powers laid the
political framework to help consolidate one of the most stable democracies on the
continent.
Administration. The administrative structure divides the country into 10 regions and
170 districts. Every district has its own District Assembly. Districts are subdivided into
town, area and zonal councils, and unit committees at the lowest level. Accra, the
executive, legislative and judicial capital city, is located within the Greater Accra
region, and is home to over two million Ghanaians. Having won the 2008 presidential
and parliamentary elections, the National Democratic Congress is the current ruling
party.
Economy. In Ghana, a country rich in natural resources, the economy depends strongly
on exports of cocoa, gold, timber, manganese ore, diamonds, aluminium, bauxite,
horticulture and tuna. Worldwide, Ghana is one of the leading producers of gold and
the second largest cocoa producer. In 2008, the labor force in Ghana constituted about
11.5 million people, the majority of whom were employed in the agricultural sector,
representing about 40 percent of GDP. Thus, many Ghanaians are heavily dependent on
agriculture and are subsistence farmers. In 2006, more than a quarter of Ghanaians
Page 204
178
(28.5 percent) lived below the national poverty line. Gross National Income (GNI) per
capita reached US$670 in 2008 ($1,430 using PPP), below the sub-Saharan average of
US$1,082. While GDP growth in 2008 reached 6.2 percent, Ghana’s GNI totalled
US$15.7 billion in that year ($33.4 billion using PPP). In 2008, nearly two thirds of
GDP represented imports of goods and services (63.2 percent), resulting in only about
one third of GDP from exports (36.8 percent). In Ghana, official development
assistance flows constituted US$1.2 billion in 2007 (US$49 per capita), net foreign
direct investment averaged US$970 million in 2007, and remittances and employee
compensation totalled US$128 million in 2008. The total debt serviced in 2007 was 3.1
percent of all exports of goods, services and income.
Political and Administrative System
The 1992 Constitution founded the Fourth Republic of Ghana. Since that year the country
has undergone two peaceful democratic transitions, in 2000 and 2008. The constitution
supports a hybrid presidential regime, with the president elected by an absolute majority.
The two major political parties in Ghana are the New Patriotic Party (NPP) and the
National Democratic Congress (NDC). As leader of the NDC, President Atta Mills has
held office since January of 2009. Internationally, Ghana’s elections are widely
recognised as credible and transparent. Based on a number of political indicators, Ghana
is internationally classified as a free country (Freedom House 2009). With the high
degree of political freedom its citizens enjoy, Ghana is a strong outlier in sub-Saharan
Africa. Transparency International’s Corruption Perceptions Index (2009) ranked Ghana
69th
out of 180 analyzed countries, thereby ranking better than about 62 percent of the
countries examined. However, only 11 percent of seats in Ghana’s parliament are held by
women (World Bank). In contrast, in many other sub-Saharan countries the share of
women holding parliamentary seats is significantly higher, such as in Mozambique (35
percent), Angola (37 percent) and Rwanda (51 percent) (UNDP 2009). In Ghana, the
parliament is elected every four years, there is an independent judiciary, and the media is
known to be one of the most vibrant in West Africa.
Page 205
179
Annex 2: Map
Map: Ghana and Bordering Countries, with Main Cities and Regions
Source: Ghana, Political Map 1995.
All Annex graphs, figures and tables are in the separate document titled “CSR Annex” in the folder:
“Ghana Education CSR 2009”
Table: Selected Economic and Infrastructure Indicators in Ghana Indicator Value Value
(Macro-)Economic
GNI per capita, Atlas method (current US$), 2008 670
GNI per capita, PPP (current international $), 2008 1430
GNI, Atlas method (current US$), 2008 15.7 billion
GNI, PPP (current international $), 2008 33.4 billion
GDP (current US$), 2008 16.1 billion
GDP growth (annual %), 2008 6.2
Inflation, GDP deflator (annual %), 2008 18.0
Imports of goods and services (% of GDP), 2008 63.2
Exports of goods and services (% of GDP), 2008 36.8
Merchandise trade (% of GDP), 2008 99.5
Services, etc., value added (% of GDP), 2008 41.7
Official development assistance and official aid (current US$), 2007 1.2 billion
Foreign direct investment, net inflows (BoP, current US$), 2007 970,380,000
Workers' remittances and compensation of employees, received (current US$), 2008 128,000,000
Page 206
180
Time required to start a business (days), 2008 34
Infrastructure Access
Roads, paved (% of total roads), 2005 14.9
Electric power consumption (kWh per capita), 2006 311.9
Energy use (kg of oil equivalent per capita), 2006 424.4
Other indicators
Renewable internal freshwater resources per capita (cubic meters), 2007 1324.8
Military expenditure (% of GDP), 2008 0.7
Source: World Bank, World Development Indicators database.
Note: Value indicated is for the latest year with available data.
i The scale of reported improvements between 2007 and 2009 raises questions about the consistency in the
methodology of the subsequent tests and/or the reliability of data collection and reporting.