124
i REPUBLIC OF KENYA MINISTRY OF ENVIRONMENT AND MINERAL RESOURCES KITUI DISTRICT ENVIRONMENT ACTION PLAN 2009-2013

i
REPUBLIC OF KENYAMINISTRY OF ENVIRONMENT AND MINERAL
RESOURCES
KITUI DISTRICTENVIRONMENT ACTION PLAN
2009-2013

i
EXECUTIVE SUMMARY
The Environmental Management and Coordination Act 1999 provides for the formulation of the
District Environment Action Plans every five years. This is the first District Environment Action
Plan (DEAP) for Kitui District. The preparation of the DEAP was undertaken through a
participatory process both in the public, private and civil sectors. Further, this document has
incorporated salient issues from the Divisions.
The DEAP highlights priority environmental issues requiring action to mitigate increasing
environmental degradation for the District to achieve sustainable development. The report is
divided into eight chapters. Chapter one gives the challenges of sustainable development and also
describes the rationale for and preparatory process of the DEAP. It presents the district’s main
profile covering the physical features, demographic and agro-ecological zones.
Chapter two describes the District’s Environment and Natural Resources of Land, Water,
Biodiversity, rare, threatened and invader species, wetlands and agriculture, livestock and fisheries.
For each resource, major environmental issues, challenges and proposed interventions have been
identified.
Chapter three entails the human settlements and infrastructure in Kitui District covering situation
analysis, challenges and proposed interventions. Environmental challenges addressed include;
waste management, sanitation, pollution, diseases, land use, demand for water, energy, materials
for construction, land and wetlands degradation, policy and legislation..
Chapter four addresses environmental aspects in trade, industry, tourism and services sectors. The
key issues under this chapter are high pollution levels from production and consumption sectors
including weak enforcement of relevant legislations.
Chapter five discusses environmental hazards and disasters. The major hazards covered include
those related to climate/weather and drought, flood, fire, galleys, disease outbreaks like malaria,
and invasive species. Mitigations measures have been proposed for implementation.
Environmental information, networking and technology are discussed in chapter six. It emerges
that environmental information and networking technology have continued to receive scanty
attention. In order to achieve sustainable environmental management, it is necessary to focus on
raising awareness and enhancing public participation at all levels.

ii
Governance, Policy and Legal Framework as well as Institutional arrangements are covered in
chapter Seven. The key issues addressed include, noncompliance with environmental regulations,
Conflicting laws and regulations, delays in approving EIA/EA, high cost of environment impact
assessment and audit experts for small projects, weak enforcement of environment laws, lack of
environment standards and regulations, inactive District Environment Committee. Chapter eight
is the implementation Matrix.

iii
FOREWORD
The 1992 Earth Summit held in Rio de Janeiro came up with various recommendations, among
them Agenda 21, a Global Environmental Action Plan. The theme of the Summit focused on
how nations could attain sustainable development. The Government of Kenya embraced this idea
by developing the first National Environment Action Plan (NEAP) in 1994.
Since independence, Kenya has continued to demonstrate her commitment to environmental
management through various initiatives, among them the National Development Plans of 1974
and the National Environment Action Plan of 1994. Further, there have been a number of sectoral
policies on environment in fields such as Agriculture, Livestock, Water, Energy, Food, Land,
Wildlife, Forest, Industry, Trade, Arid Lands, Disaster Management and the Draft Sessional Paper
No. 6 of 1999 on Environment and Development.
The Environmental Management and Coordination Act (EMCA, 1999) provides for the
integration of environmental concerns in national policies, plans, programmes and projects. In this
regard, EMCA 1999 provides for the formulation of National, Provincial and District
Environment Action Plans every five years.
Environmental Action Planning is a tool that aims at integrating environmental concerns into
development planning. The process followed in preparing this DEAP was participatory, involving
various stakeholders from institutions and sectors, including the public, private, Non-
Governmental Organizations (NGOs) and local communities at District and Provincial levels.
These consultative meetings provided the basis also for formulation of the Provincial
Environmental Action Plans (PEAPs) and finally the National Environment Action Plan
(NEAPs).
The DEAP addresses environmental issues from various sectors in an integrated manner and
discusses their significance in development planning. It proposes a strategy for achieving
sustainable development in line with Kenya’s quest to meet the Millennium Development Goals
(MDGs) Vision 2030 and Medium Term Plan (MTP). The Plan has brought out a number of
proposed interventions, legal and institutional framework to be incorporated into sectoral
development plans and programmes. Its implementation will be monitored by the District
Environment Committee (DEC) and will be monitor though State of the Environment (SoE)
Reporting

iv
The preparation of the DEAPs for Eastern Province owes much to the technical and financial
assistance provided by the NEMA This support, which included innovative community and civil
society consultations, facilitation of DEC meetings, as well as final publication costs, is gratefully
acknowledged
I wish to underscore that the 2008-2012 DEAP report is a broad-based strategy that will enable
the District attain sustainable development as envisaged in Vision 2030.
Dr. Ayub Macharia (PhD)
DIRECTOR GENERAL (Ag),
NATIONAL ENVIRONMENT MANAGEMENT

v
ACKNOWLEDGEMENT
On behalf of the National Environment Management Authority (NEMA), I would like to thank
the Kitui District Commissioner, who is also the chairman District Environment Committee
(DEC) for spearheading the preparation process for this District Environment Action Plan
(2009-2013). I also wish to thank most sincerely the District Environment Committee and the
District Environmental Action Plan Technical Committee for their invaluable inputs and
approval of this environmental action plan.
I acknowledge the insights and dedication to this process by the Provincial Director of
Environment (Eastern) and the District Environment Officer.
Last but not least, I extend my gratitude to all those who contributed towards the finalization of
this District Environmental Action Plan in one-way or another.
Dr. Kennedy I. OndimuDIRECTOR, DEPARTMENT OF ENVIRONMENTALPLANNING & RESEARCH CO-ORDINATION

vi
TABLE OF CONTENTSEXECUTIVE SUMMARY.................................................................................................................................... IFOREWORD....................................................................................................................................................... IIIACKNOWLEDGEMENT ....................................................................................................................................VLIST OF TABLES .............................................................................................................................................VIIILIST OF ACRONYMS........................................................................................................................................IXCHAPTER ONE ................................................................................................................................................... 11.0 INTRODUCTION .......................................................................................................................................... 11.1 PREAMBLE ....................................................................................................................................................... 11.2 CHALLENGES OF SUSTAINABLE DEVELOPMENT................................................................................................ 21.3. EMCA, 1999 PROVISION ON ENVIRONMENTAL PLANNING.............................................................................. 31.3.1 DEAP METHODOLOGY ................................................................................................................................. 31.3.2 OBJECTIVES OF DISTRICT ENVIRONMENT ACTION PLANS ............................................................................ 41.3.3 KITUI DEAP SCOPE ...................................................................................................................................... 41.4 DISTRICT PROFILE ............................................................................................................................................ 41.4.1 GEOGRAPHICAL LOCATION SIZE AND ADMINISTRATIVE UNITS .................................................................... 41.5 CLIMATE AND PHYSICAL FEATURES ................................................................................................................. 71.5.1 ALTITUDE ..................................................................................................................................................... 71.5.2 CLIMATE ....................................................................................................................................................... 71.6 ECOLOGICAL ZONE .......................................................................................................................................... 71.7 POPULATION SIZE AND DISTRIBUTION .............................................................................................................. 81.7.1 POPULATION GROWTH .................................................................................................................................. 81.7.2 POPULATION DISTRIBUTION.......................................................................................................................... 81.8 ECONOMIC SOCIAL AND CULTURAL CHARACTERISTICS.................................................................................. 101.8.1 ECONOMICAL CHARACTERISTICS................................................................................................................ 111.8.2 SOCIAL CHARACTERISTICS ......................................................................................................................... 11CHAPTER TWO ................................................................................................................................................ 152.0 ENVIRONMENT AND NATURAL RESOURCES .................................................................................... 152.1 SOILS AND LAND USE ..................................................................................................................................... 152.1.1 SOILS .......................................................................................................................................................... 152.1.2 SOIL TYPE LAND USE .................................................................................................................................. 152.1.3 LAND AND LAND USE CHANGES .................................................................................................................. 162.2 LAND USE POTENTIAL.................................................................................................................................... 192.3. DRYLANDS.................................................................................................................................................... 222.4 AGRICULTURE, LIVESTOCK AND FISHERIES .................................................................................................... 252.4.1 AGRICULTURE ............................................................................................................................................ 262.4.2 LIVESTOCK PRODUCTION ............................................................................................................................ 272.4.3 FISHERIES RESOURCES................................................................................................................................ 292.5 WATER SOURCES ........................................................................................................................................... 322.5.1 MAIN CATCHMENT AND DRAINAGE............................................................................................................ 322.5.3 REGULATIONS AND MANAGEMENT ARRANGEMENT ................................................................................... 332.6 FORESTRY...................................................................................................................................................... 362.6.1 VEGETATION TYPES .................................................................................................................................... 362.6.2 REGULATORY AND MANAGEMENT ARRANGEMENTS .................................................................................. 372.6.3 EXPLOITATION OF FOREST RESOURCES BOTH FOR TIMBER AND NON TIMBER PRODUCTS ......................... 372.7 WILDLIFE RESOURCES.................................................................................................................................... 422.7.1 TYPES OF WILDLIFE AND AREA UNDER WILDLIFE ........................................................................................ 422.7.2 TRENDS AND STATUS OF WILDLIFE RESOURCES .......................................................................................... 422.7.3 REGULATORY AND MANAGEMENT ARRANGEMENTS ................................................................................... 432.7.4 EXPLOITATION OF WILDLIFE RESOURCES BOTH CONSUMPTIVE AND NON-CONSUMPTIVE ............................ 432.8 BIODIVERSITY CONSERVATION ...................................................................................................................... 442.8.1 BIODIVERSITY DATA AND INFORMATION.................................................................................................... 442.9 UNSUSTAINABLE NATURAL RESOURCE USE PRACTICES.................................................................................. 47CHAPTER THREE............................................................................................................................................. 503.0 HUMAN SETTLEMENT AND INFRASTRUCTURE................................................................................ 503.1 HUMAN AND ENVIRONMENTAL HEALTH ....................................................................................................... 52

vii
3.2 COMMUNICATION NETWORKS ........................................................................................................................ 553.3 WATER SUPPLIES ........................................................................................................................................... 563.4 SANITATION................................................................................................................................................... 573.5 ENERGY ......................................................................................................................................................... 583.5.1 SOURCE OF ENERGY SUPPLY IN THE DISTRICT............................................................................................ 583.5.2 ENERGY SECTOR ......................................................................................................................................... 59CHAPTER FOUR............................................................................................................................................... 644.0 INDUSTRY, TRADE AND SERVICES ...................................................................................................... 644.1 INDUSTRIAL SECTOR ...................................................................................................................................... 644.2 TRADE SECTOR .............................................................................................................................................. 644.2.1 TYPES OF TRADE IN THE DISTRICT ............................................................................................................... 654.2.2 TRENDS AND TRADING PATTERNS ............................................................................................................... 654.3 SERVICES SECTOR .......................................................................................................................................... 664.4 TOURISM........................................................................................................................................................ 684.4.1 TYPE OF TOURISM, ATTRACTION AND POTENTIAL...................................................................................... 684.4.2 TYPES OF TOURISM ATTRACTION AND POTENTIAL ...................................................................................... 694.4.3 TRENDS IN TOURISM ATTRACTION ............................................................................................................. 694.5. MINING AND QUARRYING ............................................................................................................................. 714.5.1 TYPES OF MINERALS AND METHOD OF EXTRACTION.................................................................................. 714.5 2 SAND HARVESTING AND QUARRYING .......................................................................................................... 714.5.3 REGULATORY AND INSTITUTIONAL ARRANGEMENT.................................................................................... 724.5.4 SAND HARVESTING..................................................................................................................................... 734.5.5 TRENDS IN SAND HARVESTING .................................................................................................................... 73CHAPTER FIVE ................................................................................................................................................ 755. 0 ENVIRONMENTAL HAZARDS AND DISASTERS ................................................................................ 755.1 INTRODUCTION .............................................................................................................................................. 755.2 EXTEND AND TRENDS OF ENVIRONMENTAL HAZARDS AND DISASTERS .......................................................... 76CHAPTER SIX................................................................................................................................................... 806.0 ENVIRONMENTAL EDUCATION, INFORMATION AND TECHNOLOGY ......................................... 806.1 STATUS OF ENVIRONMENTAL EDUCATION..................................................................................................... 806.1.1 THE NON- FORMAL EDUCATION PROGRAMMES ........................................................................................... 826.2 TECHNOLOGIES .............................................................................................................................................. 836.2.1 TRADITIONAL WATER FILTER..................................................................................................................... 836.2.2 IMPROVED COOKING STOVE ....................................................................................................................... 846.2.3 WATER MICRO-CATCHMENT ...................................................................................................................... 846.3 ENVIRONMENTAL INFORMATION SYSTEMS .................................................................................................... 876.3.1 TYPES AND SOURCES OF ENVIRONMENTAL INFORMATION .......................................................................... 876.3.2 STATUS OF ENVIRONMENTAL INFORMATION MANAGEMENT SYSTEMS ...................................................... 876.4 INDIGENOUS KNOWLEDGE (IK)...................................................................................................................... 886.4.1 TYPES OF IK, KEY PLAYERS AND CHALLENGES ......................................................................................... 89CHAPTER SEVEN............................................................................................................................................. 907.0 ENVORONMENTAL GOVERNCE AND INSTITUTIONAL FRAME WORKS ...................................... 907.1 STATUS OF ENVIRONMENTAL GOVERNANCE AND INSTITUTIONAL ARRANGEMENTS....................................... 917.2 TYPES OF REGULATORY AND MANAGEMENT TOOLS ..................................................................................... 927.2.1 MULTILATERAL ENVIRONMENTAL AGREEMENTS MEA’S .......................................................................... 93CHAPTER EIGHT ............................................................................................................................................. 958.0 IMPLEMENTATION STRATEGY ............................................................................................................. 958.1. STAKE HOLDERS’ INVOLVEMENT .................................................................................................................. 958.2 IDENTIFICATION OF STAKE HOLDERS ............................................................................................................. 958.3 MONITORING AND EVALUATION .................................................................................................................... 96APPENDIX 1.................................................................................................................................................... 111

viii
LIST OF TABLES
Table 1: Administrative units by Division ................................................................................ 6Table 2 : Population projection by division.............................................................................. 8Table 3: Fertilizers and Pesticides .......................................................................................... 27Table 4 Types and status of livestock production systems bond. ....................................... 28Table 5: Types and Status of Fisheries Production Systems ................................................ 31Table 6: Water Catchment and Drainage ............................................................................... 33Table 7: Sources and Status of Water Resources ................................................................... 34Table 8: Forest Type and Coverage ........................................................................................ 40Table 9: Types and Status of forests ....................................................................................... 41Table 10: Priority Issues and Interventions ............................................................................ 43Table 11: Type extent, status, trends of biodiversity.............................................................. 45Table 12 Types of Utilization and Major Beneficiaries ......................................................... 46Table 13 Land tenure systems and area (ha) in the district .................................................. 50Table 14: Planned urban areas................................................................................................. 51Table 15 Percentage of households with access to water and sanitation services............... 51Table 16: Disease Trends 1993 - 2004 ...................................................................................... 53Table 17 Type and Trends in Industrial Development ......................................................... 64Table 18: Type and Impact of Trade on Environment .......................................................... 65Table 19 Type of Trade and Impact on Environment ........................................................... 66Table 20: Services Sector Linkages to Environmental Degradation .................................... 67Table 21: Types of Tourism ..................................................................................................... 69Table 22: Types of minerals and methods of extraction ....................................................... 71Table 23: Trends in Extent of Mines ...................................................................................... 72Table 24: Methods of Sand Extraction ................................................................................... 73Table 25 : Type of Hazards and Occurrence trends 1960 to 2005 ......................................... 76Table 26 Type of Disasters and their Impacts ....................................................................... 77Table 27 Sector Specific Disaster Occurrence and Severity .................................................. 77Table 28 Sector Capacities for Disaster Preparedness and Response .................................. 78Table 29: Status of Environmental Programmes in Schools ................................................. 81Table 30: Status of Environmental Programmes in the District .......................................... 83Table 31: Priority Issues and Interventions ............................................................................ 85Table 32: MEAs supported Programmes in the District ....................................................... 93

ix
LIST OF ACRONYMS
ASAL Arid and Semi Arid Lands
CBOs Community Based Organizations
CDM Clean Development Mechanism
CDTF Community Development Trust Fund
DDPs District Development Plans
DEAP District environmental Action Plans
DEC District Environment Committee
DEOs District Environment Officers
DIDC District Information and Documentation center
EMCA Environmental Management and Coordination Act
EMS Environmental Management system
ERSW & EC Economic Recovery Strategy for Wealth and employment creation
F.F.S Farmers Field School
GDP Gross Domestic Product
GIS Geographical Information system
HA Hectares
IK Indigenous Knowledge
Km Kilometers
MDGs Millennium Developmental Goals
M.E.A Multilateral environmental Agreements
MENRMinistry of environment and Natural Resources
MOH Ministry of Health
NDPS National Development plans
NEAP National Environment Action Plan
NEAPC National Environmental Action Plan Committee
NEMANational Environmental Management Authority
NEPAD New Partnership for Africa Development
NGOS Non-Governmental Organizations
PDEs Provincial Directors of Environment
PEAPs Provincial Environment Action Plans

x
PEC Provincial Environment Committee
PPO Provincial Planning Officer
PRSP Poverty Reduction Strategy Paper
SKNP South Kitui National Reserve Park
TENP Tsavo East National Park
UNCED United Nations Conference on Environment and Development
UNDP United Nations Development Programme
WC Water Closet
WHO World Health Organization
WSSD World Summit on Sustainable Development

1
CHAPTER ONE
1.0 INTRODUCTION
1.1 Preamble
The United Conference on Environment and Development (UNCED) held in Rio de Janeiro in
1992 had a double mandate of finding ways to protect the global environment, while ensuring that
economic and social concerns are integrated into development planning. The Conference
underscored the need to developing modalities for integrating environmental concerns into
developing policies, plans, programs and projects. It agreed on the guiding principles and a global
plan of action for sustainable development commonly called Agenda 21.
The Government of Kenya is committed to achieving sustainable development in accordance with
the Principles of Rio Declaration and Agenda 21.In this connection, the Government developed the
National Environment Action Plan (NEAP), in 1994, and subsequently enacted the Environmental
Management and Coordination Act (EMCA) no.8 of 1999.EMCA created the National
Environment Management Authority (NEMA) to be the principal agency of government in
coordinating all matters relating to the management of the environment. This includes the
preparation of a State of Environment (SoE) report every year. The SoE report for 2003 was the
first one under the Act.
The World Summit on Sustainable Development (WSSD) held in Johannesburg in 2002, reaffirmed
the commitments of the International community to the principles of sustainable development
contained in Agenda 21 and the Millennium Development Goals (MDGs) of 2000.
Sustainable development is commonly defined as “development that meets the needs of the present generation
without compromising the ability of future generations to meet their own needs”. Development is also sustainable
if it meets ecological, economic and social needs. This calls for the integration of environmental
considerations at all levels of decision making in development planning and implementation of
programs and projects.
The 9th National Development Plan (2002-2008) states that “The full integration of environmental concerns
in development planning process at all levels of decision making remains a challenge to the country, and the need to
integrate environmental concerns in development activities should be given high priority.

2
The Environmental Management and Coordination Act (EMCA) of 1999 provides for the
integration of environmental concerns into the national development process. The National
Environment Management Authority (NEMA) is mandated to implement the Act and in particular
coordinate the preparation of Environmental Action Plans (EAPs) at the District, Provincial and
National levels.
1.2 Challenges of sustainable development
Kitui District economy primarily depends on natural resources where over 95% of the population
live in rural areas and derive their livelihoods mainly from these resources. Economy activities
derived from the natural resources include agriculture, small-scale industry, energy, water, trade
and mining. The environment and natural resources have in the recent years been under threat
due to increased dependence on natural resources to meet basic needs. The situation is
aggravated by the rising poverty levels from 53% in 1994 to 59% in 2002 and is currently
estimated to be over 65% the situation is even worse within the rural population. The population
growth rate has over time become higher than the economic growth rate hence pressure on these
resources. This has also leaded to increase in – migration in urban center and over utilization of
fragile ecosystem.
The immigration into marginal areas from high potential area has contributed to unsuitable land use
practices often resulting to resource use conflicts especially water and pasture. Poverty often leads to
over –use and destruction of the environment where short-term development goals and practices are
passed at the expense of long-term environmental sustainability. Once the resources base is
degraded, poverty is aggravated because the capacity of the resource base to support the same
population even with unchanged demand will have diminished. Therefore there is a close link
between poverty and environm
Rapid urbanization coupled with increased unplanned settlements due to population increased and
persistence drought have resulted to loss of environmental quality and health deterioration, water
pollution, loss of biodiversity, Encroachment of fragile ecosystems and urban decay. In both rural
and urban areas access to safe drinking water and basic sanitation is a critical environmental and
health concern. The widespread accumulation of solid wastes and liquid wastes in urban areas is also
an environmental hazard culminating in air and water pollution and increased incidences of
respiratory and water borne diseases.

3
The climate of the district is generally hot and dry for the most of the year and characteristic of arid
and semi-arid land with very unreliable and erratic rainfall. While subsistence agriculture is the main
economic stay and source of income for 80% of the population. Only 2% of the district is high
potential and can support meaningful agriculture, while 32% is medium potential.
Livestock keeping constitute the major economic activities given the arid climate of the district.
However the district is a food deficit area due to the recurrent drought. Due to this the ecosystems
are fragile and susceptible to degradation. Climatic vulnerability further reduces the capacity of land
to support existing and emerging livelihoods thus further aggravating environmental degradation.
This is evidenced by increased reduction in pasture and vegetation cover, soil erosion, food
insecurity, increased conflicts and insecurity – all contributing to increased poverty.
1.3. EMCA, 1999 provision on environmental planning
The EMCA provides that every District Environment Committee shall every five years prepare a
District Environment action plan in respect of the district for which it’s appointed and shall submit
such plan to the chairman of the provincial environment action plan committee for incorporation
into provincial environment action plan as proposed under section 39. As it has been appended to
the report (see appendix) attached.
1.3.1 DEAP Methodology
The process started by holding regional workshops, which the DEAP Secretariat was appointed by
the Director General in 2004. That comprised of a District Water Officer, District Development
Officer (DDO) and District Environment Officer (DEO) to attend an induction course on the
DEAP methodology. The District Environment Committee (DEC) members gazette in 2003 were
further requested to form a District Environment Action Planning Committee (Technical
Committee comprising lead agencies and representatives from other stakeholders), chaired by the
DDO and the DEO is the secretary. Once the draft DEAP is prepared, the DEC approves and
submits to the Provincial Environment Committee for inclusion in the Provincial Environment
Action Plan.
The District Environment Action Planning Committee spearheaded the preparation of the
Kitui DEAP. The committee requested for sectoral environment reports from the lead agencies and
compiled the DEAP.

4
1.3.2 Objectives of District Environment Action Plans
To determine the major environmental issues and challenges facing the district
To identify environmental management opportunities.
To create synergy and harmony in environmental planning
To integrate environmental concerns into social economic and development planning.
To formulate appropriate environmental management strategies.
1.3.3 Kitui DEAP Scope
The preparation of the Kitui DEAP has been realigned with Vision 2030, Midterm Plan 2008-2012
as directed by the government. The current DEAP covers the period of 2008-2012 and as per
EMCA shall be revised after every five years. The DEAP will be monitored by the annual
preparation of the State of Environment Reports. The environmental indicators that have been
developed in the implementation matrix will be monitored by the respective lead agencies on an
annual basis and incorporated in the annual State of Environment Report. The National Steering
Committee and the National Environment Action Planning Committee have approved the
indicators. The DEAP has been subjected to stakeholder meetings at District level.
1.4 District profile
This section gives the physical description of Kitui district in terms of its location area of
administrative divisions and main physical features.
1.4.1 Geographical Location Size and Administrative Units
This section provide information on the administrative set up of the district, geographic and physical
description of the district in terms of climate, rainfall, soil and natural resource endowment.
5
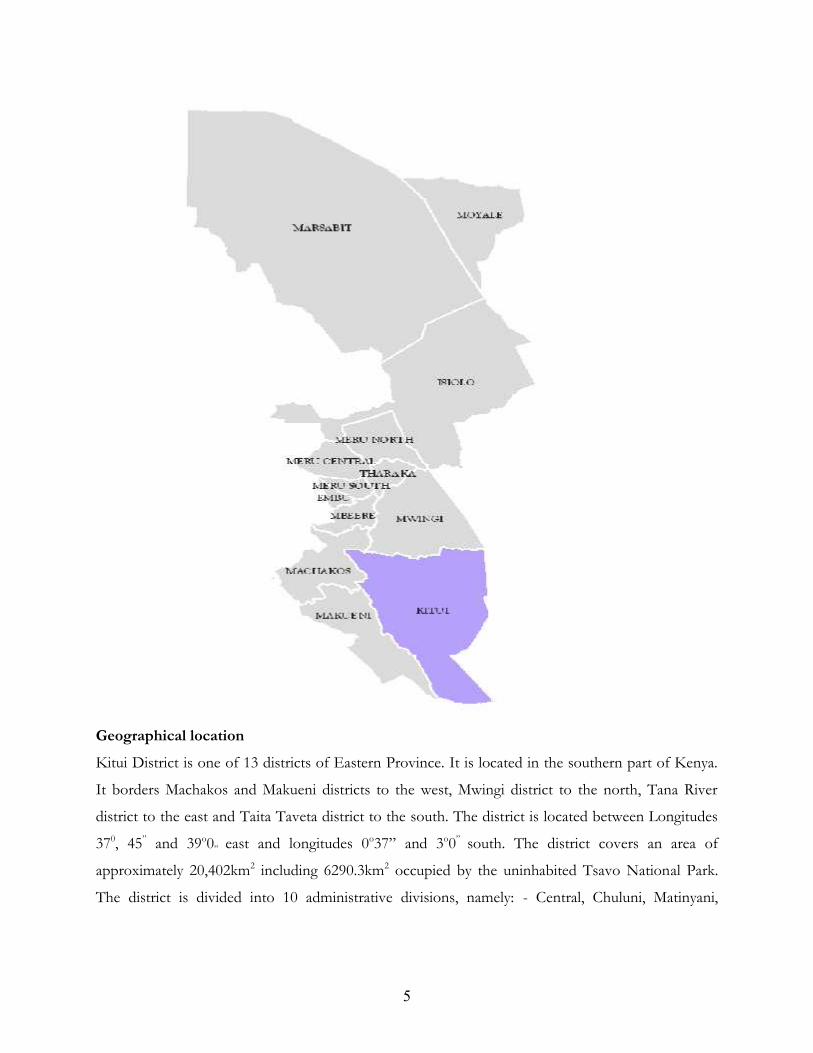
Geographical locationKitui District is one of 13 districts of Eastern Province. It is located in the southern part of Kenya.
It borders Machakos and Makueni districts to the west, Mwingi district to the north, Tana River
district to the east and Taita Taveta district to the south. The district is located between Longitudes
370, 45” and 39o0” east and longitudes 0o37” and 3o0” south. The district covers an area of
approximately 20,402km2 including 6290.3km2 occupied by the uninhabited Tsavo National Park.
The district is divided into 10 administrative divisions, namely: - Central, Chuluni, Matinyani,

6
Mwitika, Mutitu, Ikutha, Yatta, Mutonguni, Mutomo and Mutha. The divisions are further divided
into 57 locations and 187 sub-locations, as shown in table 1
Table 1: Administrative units by Division
Source: Kitui District Development Plan 2002-2008Mutha division is the largest while Matinyani and Mutonguni divisions are the smallest. Central
division which hosts the district Headquarters has the largest number of locations and sub-locations
while Mutitu division has the lowest; this is as per table 1 given above.
There are 4 parliamentary constituencies in the district. These are Central, Kitui West, Mutitu and
Kitui South. Kitui Central constituency comprises of Central and Chuluni Divisions; Kitui West
constituency comprises of Yatta and Mutonguni divisions, Kitui south constituency comprises of
Mutomo, Ikutha and Mutha division; and Mutitu Constituency comprises of Mutitu and Mwitika
Divisions.
Kitui district has two local Authorities namely Kitui County Council and Kitui Municipal Council.
The County Council has 44 wards while Kitui Municipal Council has 16 wards all represented by
elected Councilors.
Kitui south and west constituencies have the largest number of county council wards with 15 and 14
respectively. Central constituency has the least number of wards. The Municipal Council wards are
Division Area Km2 Location Sub-LocationCentral 808.6 8 30
Chuluni 521.5 6 16
Matinyani 308.6 7 19
Mutonguni 359.2 8 20
Yatta 1175.0 6 14
Mutomo 803.9 4 17
Yatta 1417.5 5 18
Mutomo 837.2 3 12
Mwitika 3426.1 4 16
Mutha 4454 6 25
Tsavo East N/Park 6290.3 - -
Total 57 187

7
only in Kitui Central and Kitui west constituencies with the former having the largest number of
wards
1.5 Climate and physical features
1.5.1 Altitude
The altitude of the district ranges between 400m and 1800m above the sea level. The central part of
the district is characterized by hilly ridges separated by wide low lying areas and has slightly low
elevation of between 600m and 900m above the sea level to the eastern side of the district, the main
relief feature is the Yatta plateau, which stretches from the North to the South between rivers Athi
and Tana. The plateau is almost plain with wide shallow spaced valleys. The highest areas in the
district are Kitui Central, Mutitu hills and Yatta plateau. Due to their high altitudes they receive more
rainfall than other parts in the district and are the most productive areas.
1.5.2 Climate
The climate of the district is arid and semi-arid with very erratic and unreliable rainfall. Most of the
areas are generally hot to dry leading to high rate of evaporation. This combined with unreliable
rainfall; limits intensive and meaningful land use and related development activities. The annual
rainfall ranges between 500 -1050mm with 40 percent reliability. The long rains come in April/May
and short rains in November/December. The short rains are more reliable while long rains are
usually unreliable. The periods falling between June to September and January to March are usually
dry. The topography of the landscape influences the amount of rainfall received. The high- land
areas of Central hills in Kitui and Mutitu in the Eastern parts of the district receive between 500-
760mm of rainfall per year. The Endau hills receive 500-1050mm per year while the drier eastern
and southern areas receive less than 500mm.
The district experiences high temperatures throughout the year, which ranges from 160c to 340c. The
hot months are between June and September and January and February. The minimum mean annual
temperatures are 280c in the western part and 220c in the eastern parts. Maximum mean annual
temperatures on other hand are 28oC in the western part and 32o C in the eastern part.
1.6 Ecological zone
66% of the district falls under AEZ IL5 and IL6 that is classified as range lands. This is mainly in
Ikutha, Mutha, Mwitika and lower Yatta. 32% of the district falls under AEZ LM4 and LM5- which
is Agri-marginal areas. This covers the area of Mutomo Chuluni (Lower), upper Yatta and Mutitu

8
division. Meanwhile 2% of the district falls under AEZ UM4 and LM3 which is regarded as suitable
for agricultural production and include Central Upper Chuluni, Matinyani and Mutonguni Divisions.
Although according to land suitability classification UM3 UM4, LM5 millet and cotton zone a mixture
of all the above crops and livestock have been pushed in these areas including the rangeland. In this
zone various crops (Maize, Sorghum, Millet Beans, Cowpeas, Pigeons peas, green grams and cotton)
are mixed on the same place of land, mostly with no defined rotational pattern.
1.7 Population size and distribution
Kitui District has had a relatively high population growth since independence. Population size
increased from 216,547 persons in 1969 to 303,960 in 1979, 412528 in 1989 and 515,422 in 1999. It
was projected that by year 2002 the figure should have exceeded 550678 persons. These projections
are based on the 1999 population census and assume a growth rate of 2.23 per cent. This trend is
likely to create a negative impact on the environment and economic welfare, with over 60 per cent
of the people who are currently living below the poverty line.
1.7.1 Population Growth
High population growth rate implies stress in potential arable land. This leads to inadequate
environmental goods and service worsening the fragile environmental resource. The end result is
depletion of Natural resource. 96 percent of district population lives in the rural areas with only 4 %
per cent in urban areas.
1.7.2 Population Distribution
The Population of the district is youthful with 59.4 percent being 21 years and below.
Table 2 : Population projection by division
Division 1999 2002 2004 2006Central 123742 132205 138169 144401
Chuluni 72341 77289 80774 84417
Matinyani 40898 43632 45600 47656
Mutonguni 58898 62927 65764 68729
Yatta 41646 44494 46501 48599
Mutitu 23860 25494 26644 27845
Mutomo 45787 48918 51123 53429

9
Mwitika 25701 27459 28697 29991
Mutha 39139 41817 43704 45673
Ikutha 43470 46443 48537 50726
Total 515422 550678 575512 628591
Source: District planning unit-Kitui (2005)
Table 2 above implies that Central Division has the highest population of 138,169 while Mutitu and
Mwitika Divisions had the lowest population of 26,644 and 28 697 respectively as per projection of
1999 population census. Other demographic features are given in tables 3, 4 and 5 below.
Table.3: POPULATION SIZE AND DISTRIBUTION (DENSITY)
NO YEAR POPULATION DENSITY
1 1962 177,677 9
2 1969 217,573 11
3 1979 296,362 11
4 1989 412,528 20
5 1999 512,422 25
6 2000 526,916 26
7 2001 538,666 26
8 2002 550,678 27
9 2003 562,958 28
10 2004 575,512 28
11 2005 588,346 29
12 2006 601,466 29
13 2007 614,879 30
14 2008 628,591 31
15 2009 642,609 31
16 2010 656,939 32
17 2011 671,589 33
Source: District Statistics Office 2006.
10
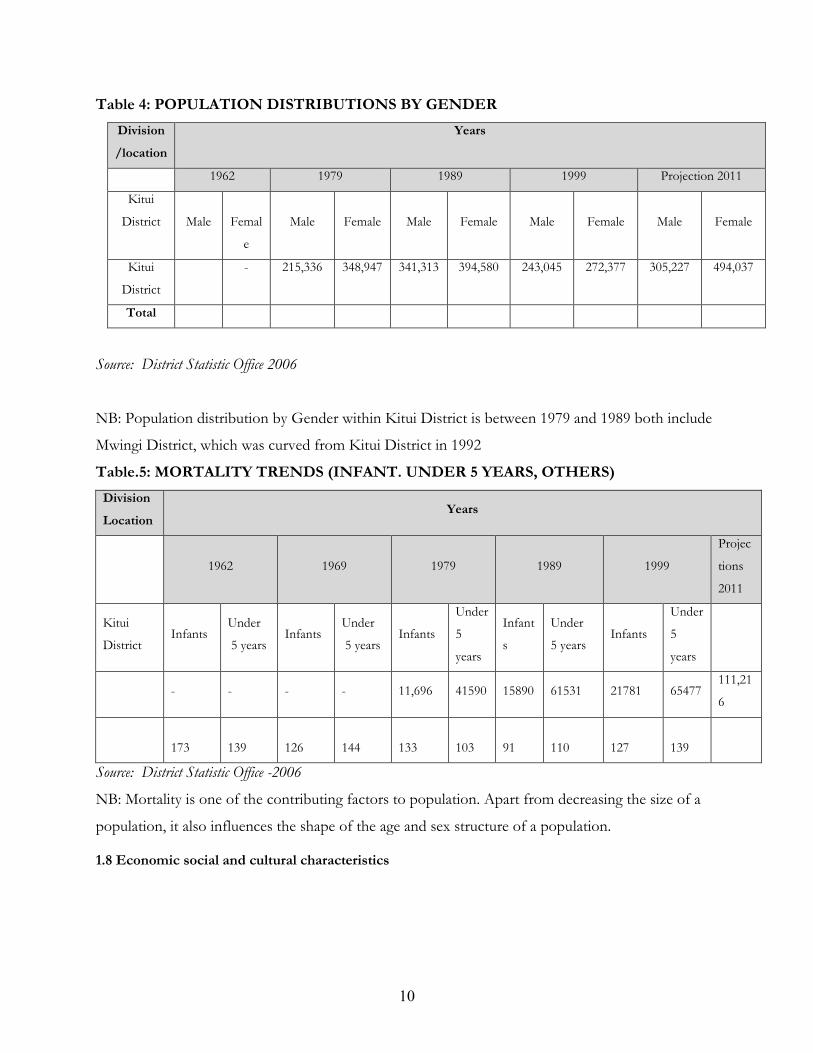
Table 4: POPULATION DISTRIBUTIONS BY GENDERDivision/location
Years
1962 1979 1989 1999 Projection 2011
Kitui
District Male Femal
e
Male Female Male Female Male Female Male Female
Kitui
District
- 215,336 348,947 341,313 394,580 243,045 272,377 305,227 494,037
Total
Source: District Statistic Office 2006
NB: Population distribution by Gender within Kitui District is between 1979 and 1989 both include
Mwingi District, which was curved from Kitui District in 1992
Table.5: MORTALITY TRENDS (INFANT. UNDER 5 YEARS, OTHERS)DivisionLocation
Years
1962 1969 1979 1989 1999
Projec
tions
2011
Kitui
DistrictInfants
Under
5 yearsInfants
Under
5 yearsInfants
Under
5
years
Infant
s
Under
5 yearsInfants
Under
5
years
- - - - 11,696 41590 15890 61531 21781 65477111,21
6
173 139 126 144 133 103 91 110 127 139
Source: District Statistic Office -2006
NB: Mortality is one of the contributing factors to population. Apart from decreasing the size of a
population, it also influences the shape of the age and sex structure of a population.
1.8 Economic social and cultural characteristics

11
1.8.1 Economical Characteristics
Agricultural development in Kitui just as in other marginal lands is problematic due to low rainfall
and the menace of wildlife and pests. In the District crop production has been made quite
unreliable and unevenly distributed in the recent years the district has been experiencing crop failure
of almost 90% thus rendering the majority of people in the district destitute and in dear need of
food.
The people of Kitui are engaged in various economic activities for their livelihoods. Whereas the
majority is engaged in agriculture, livestock keeping still remains the income earner in the district
and especially in the drier area. People practice mixed farming because livestock acts as a buffer
during poor rain seasons. Most of what is harvested is consumed domestically, and there is hardly
any net surplus. The District is famine-prone; whatever is produced has to be supplemented with
external food aid to avert starvation.
Major commercial activities like wholesale, retail shop keeping process of food products, honey
farming harvesting and refining are other economic activities taking place in urban centers and
market places. Not to be underrated in their capacity to absorb the labor force are the Jua–kali
workshops spread out in all towns and markets centers. Cotton ginning, formerly a major
commercial activity has greatly declined due to worsening climatic conditions, while charcoal
burning and sales has gone up considerably.
There are several financial institutions in the District, most of these Micro-enterprises make
acquisition of credit to small-scale business people and farmers possible and has been a great boost
to the people in the district as they strive to fight and alleviate poverty. Self-help groups have also
increased in number in the district and have become a great source of income for the members. The
groups, which are registered at the department of Social Services and the department of culture, are
involved in many income generating activities which include Bee-keeping, poultry keeping water –
kiosks, basketry, merry go round and small loans to members among other activities.
1.8.2 Social Characteristics
As indicated above poverty level in the district is very high. Several factors have contributed to this
trend; the most dominant ones are poor and unreliable rainfall, persisted drought and famine,
illiteracy and lack of employment opportunities. Generally the overall welfare of the people of Kitui
is not good and this can be gauged by use of several indicators including mortality rate, child

12
mobility and malnutrition, occurrence of common Diseases like Malaria, Diarrhea, Tuberculosis,
HIV/Aids, School enrolment to mention but a few.
Food availability and nutrition per capita calories and protein intake are other measures of the
welfare of a given society. The climatic conditions in Kitui are such that the District is always
deficient in food supply. It has been estimated that the District faces serious crop failure five out of
every eight seasons. The incidence of destitute and families on famine relief are social welfare
indicators. The District relies on famine relief almost on a yearly basis. Education in the District is
also affected by the recurrent famine and quite a number of them have to be assisted through
bursaries and food –for fees programs that are sometimes have to be used to keep students in
school. Several organizations and children homes set up by churches and other organizations also
help destitute children. The catholic Diocese of Kitui is a good example that maintains quite a
number of destitute institutions.
Due to the climatic condition of District, the greatest potential is for livestock keeping, and indeed
there are large numbers of livestock. The livestock include goats, cows, donkey, sheep, bees and
poultry. These are kept in large numbers with the resultant destruction of vegetation of the land.
This encourages soil erosion and desertification in lands that are already arid. These animals die of
starvation and lack of water when drought strikes; this is a waste that should be curbed through
rearing of manageable herds and provision of water. Charcoal burning has also greatly contributed
to the destruction of the environment and should be curbed.
The government departments have being in the forefront in trying to better the lives of the people.
It has been networking with various local NGOs, bilateral and multilateral organizations to promote
the welfare of the people of Kitui. Such organizations include the Danida (Kitui agricultural Project
which completed its projects in June 2005), JICA, ADRA, USA Peace Corps among others.
The activities include projects in water harvesting and venturing, into poultry keeping, tree seedling,
bee keeping, merry go-round and social welfare, loans to members, small scale business, and small
scale farming among others. The Department gives grants to groups to boost their activities for
increased production and profit. Groups are encouraged to write proposals for funding on their
activities and these are used while disbursing the fund.

13
The Kitui Agricultural Project was especially active and helpful in identifying the needs of the people
and funded many projects especially in helping the small –scale farmers and groups through FFS
(Farmers field school) a number of between 30 to 40 FFS were formed and aided in the District.
It also helped the community in accessing water, capacity building of groups in leadership, marketing
and selling of products.
Table 6No. of groups in the district by year 2003 -2004
Year Number of registered groups Membership
2000 253 1,227
2001 214 1018
2003 310 1952
2004 291 1890
2005 321 2215
Source: District Social Development Officer - 2006
Table.7:No. of groups given grants and amount by year 2003-2004
Year No KSH
2003 10 200,00
2004 12 300,000
Source District Social Development Office 2006
1.8.3 Cultural Characteristics
Culturally, the people of Kitui are mainly Kamba, and the language mostly spoken is Kikamba.
There are also other communities like Swahili, Kikuyu, Asians, Embu and Meru. Other languages
also spoken include Kiswahili, Kikuyu Ki-mbeere and other Swahili is the main language especially
in town centers that have a variety of tribes. The major religion in Kitui is Christianity, followed by
Muslim.
The Kamba people in Kitui are mostly farmers although due to adverse weather conditions this
brings very little if any products. Crops mainly grown in Kitui include Maize , beans cowpeas ,
pigeon peas , sorghum , millet finger , sweet potatoes , cassava , fruits include mangoes , oranges,
lemons, passion fruit ,avocadoes , among others vegetable are also grown along the river backs and
these include lettuce, cabbages , tomatoes, green peas , capsicum and onions.

14
Due to these poor weather conditions most plants do not do so well except the traditional foods
plants that is drought resistant. These include sorghum, millet, finger millet, cassava and sweet
potatoes .The department of culture tries to encourage the planting and consumption of these foods
for food security, but these are only for domestic consumption. If adapted this trend could reverse
the drastic effects of famine. Several food security groups have been established and they are
encouraged to plant and use traditional food plants. Traditional food festivals have also been held
where the public is sensitized on the need to plant and consume these traditional foods.
Shifting cultivation – The local community are known to practice cultivation, which has adverse
effect on environment. They use fire to clear
the vegetation, which is followed by land tillage
without proper soil conservation structure.
After first two seasons, the land productivity is
affected thus cause environmental degradation.
This is mostly happening within hilltops,
sloppy areas and natural protected areas, as
shown in the in photograph.
Bee Keeping – practicing traditional bee
keeping using long hives knows The Kambas
people. The bee keeping is done in areas where natural vegetation is intact. The most preferred tree
species are of acacia type. In areas where bee keeping is done the beekeepers discourage human
activities, which threatened the vegetation, thus enhance bi-diversity conservation.
Hunting and Wood Curving – Among other major activities that, the local community uses to
supplement income-generating activity are hunting and wood curving. Currently hunting and wood
curving is major contributor to loss of bio-diversity due to commercialization. The most affected
wild life species are Dalbegia melanoxylon, Terminalia brwonii and combretum schumanii, small animals e.g.
Antelopes and birds. The most affected areas are protected forest and natural reserves.

15
CHAPTER TWO
2.0 ENVIRONMENT AND NATURAL RESOURCES
2.1 Soils and land use
2.1.1 Soils
Soil is an important non-renewable natural resource that supports life, and is especially significant
because of their importance of agriculture. Soil patterns are influence by geology, land forms altitude
and climate. The Map below shows soil type and distribution within Kitui and Mwingi districts.
There are four (4) major soil types in the central part of the district. Two (2) of which are found in
the central part of the District The distribution of soil types in different ACZS provide information
that may facilitate planning of that use and management. Soils vary in their physical and chemical
characteristic, being either saline or sordic or both.
2.1.2 Soil Type Land use
Main soil types are alfisols (Acrisols, luvisols and ferralsols with some pockets of vertisols. These
soils are generally friable clay, sandy clay, loams and loamy sandy. The soils have a high tendency to
cap under the raindrop impacts, thus resulting/vulnerable to soil erosion. These soils are relatively
coarse, low in organic matter and generally shallow in depth.
Apart from the Yatta Plateau, and the range of hills in the central part of the district, the topography
is undulating And gives way to plains toward the east. Various gneisses of the Basement System are
the bedrock and are exposed in the hills east of Kitui and Mutomo, and northeast of Endau.
The soils of the hills are usually shallow and stony. Occasionally they may be somewhat more fertile.
On the associated foothills, the soils are of moderately low to high fertility.
The uplands in the western part of the district carry soils characterized by an increase of clay with
depth of low fertility and low to moderate fertility. South of Kangondi there is some areas with soils
of moderate to high fertility.
The major part of the central district is non-dissected sedimentary plain. These soils have natural
fertility. Soils having hardpan and of low natural fertility occur near the eastern district boundary.
These soils are often found with soils of low to moderate fertility. Along the major water courses on
the flat river terraces, soil of moderate, to high fertility occur Most of the soils in the plains are of

16
low to moderately low fertility and show a sodic / salinity hazard. In some areas in the east of the
district “badlands” are found with poor soils rich in sodium.
2.1.3 Land and land use changes
The central part of Kitui District consists of an undulating plateau about 1100 m in altitude,
surmounted by ridges and hills, which rise to 1700 m. There are only two short rainy seasons with 60
% rainfall reliability during the growing period of 250-390 mm and 280-490 mm, divided by two
distinct arid seasons. The total annual average is between 750 and 1150 mm. In view of the
evaporation and the water requirement curves of the leading crops, the rainfall is just enough for the
agro-ecological zones class 4, UM4 = Sunflower-Maize Zone in the Upper Midland and LM4 =
Marginal Cotton Zone in the Lower Midlands. Due to a localized, unfavorable anomaly of
temperature, cotton can only be grown up to 1080 m here, compared to 1250-1500 m further west.
On the other hand, Zone UM4 starts at such a low altitude that pigeon peas still grow and are widely
planted, more so than sunflower, so that the name “Maize-Pigeon Pea Zone” would actually be
more suitable.
The highest hills catch some clouds from the southeast trade winds after the first rains, enabling
coffee trees to survive on certain favorable locations. This is therefore a mixed Zone, UM3-4.
Downhill towards the lower Midlands, the climate is too dry for a cotton zone and even the
Marginal Cotton Zone (LM4), which is also the driest for successful maize cultivation, is fairly
restricted. Therefore, the main areas of the District, the pen plain around the central Upper
Midlands, belong to the Livestock-Millet Zone (LM5) where early maturing bulrush millet, proso and
foxtail millets should be the leading grain varieties. Very early maturing sorghum is also possible
there. At present, maize is still widely planted, with subsequent crop failures and the risk of famine.
For especially dry years in which the rains are insufficient even for sorghum and millet, new
perennial crops like buffalo gourds (from Arizona) and marama beans (from Kalahari) may be
advisable. They have edible seeds rich in protein and form nutritious tubers after a few rainy
seasons. As a cash crop, jojoba, the wax plant, looks promising.
In the Ranching Zone (IL6), the annual rainfall is between 350 and 550 mm; the 60 % rainfall
reliability during the first rains is only 80-100 mm, during the second rains 130-150 mm.

17
Land tenure
Kitui district has total area of about 20402 Km2 and annual populations grow of about 4.6%. This
has led to population increase resulting to change of land use and increase demand for land. Only
40% of the land has been demarcated and registered under free hold system while the rest is held
under clan ownership or trust land. This inhibits investments on the land such as soil and water
conservation, tree planting and conservation of grazing land and water harvesting for crop
production.
Land tenure categories
Category area HaUrban land 9600
Settlement schemesAdjudicated trust land 129,402
Un-adjudicated trust land 1,192,969
Gazetted forest 17,703
Parks /reserves 705,400
Other water bodies 500
Totals 2,055,574Source Kitui District Forest Master Plan
Land use in Kitui district is arbitrary dished out with no regard environment considerations. Human
settlement and population increase has led to high rate of land sub division in some parts of the
district. This mode of cultivation has lead to increased soil erosion and land degradation. Most of
the households whenever they want to open new land for cultivation use fire since they claim that it
saves on time, money and energy. But fire destroys both fauna and flora thus degrading the
environment further.

18

19
Fig.1: Soil Map of Kitui and Mwingi Districts
Fig.2: Agro-ecological Map of Kitui and Mwingi Districts
2.2 Land use Potential
Agro-ecological Zone (AEZIV –AEZV) which is Marginal to medium dry land the Potential land
uses are crop production, Forest Ranching and wildlife conservation the area covers over 79,700
(ha) extending all divisions district wide (Central division Chuluni division, Mutonguni Division part
of Mutitu and Yatta Division). The figure 2 above indicates the agro-ecological zones of Kitui
district.

20
Key Environmental Issues
-Soil erosion -Declining soil fertility -Loss of biodiversity -Land subdivision into small uneconomic size -Pests and diseases out break -River bank erosion -Limited credit given to agriculture -Poor infrastructure development -Commodity price fluctuation -Inadequate policy legal and institutional frame work leading to unsustainable production
patternsProposed interventions
-More training of farmers on better farming skills -More training farmers on poor harvest -Empower gender to access credit facilities for agricultural production -Ensuring that an early warning system -Access market information to farmers more efficiently.

21
Table 8: Land Use PotentialEZ IV-V Dry zone
forest
intensified
social forestry
Forest
development
-Indigenous forest
conservation
-Wood lot
establishment
-Communal
forestry
development and
management
Gazetted hills
Trust land hills
individual wood
lot
District wide
18816.9 Deforestation due to
change of land use
Destruction of water
catchment areas
Loss of bio diversity
-Promote use of
alternative source at
energy
-Soil and water
conservation programs
to be intensified
-Promote use of energy
saving jikos
-Establishment of
village tree nursery
AEZVRanching
potential for
tourism
Breeding
ground for
improved
livestock
breed
Charcoal
production
livestock charcoal
Dormant
Dormant
Mwakini yatta
Ukai yatta
GASP Enziu
athoni
Nguu nyumu
kilawa
5,000
55,960
5,000
2,000
72,600
120
142
150,201
-Poor roads net work
within the ranches
-Poor management of
the ranches resulting to
soil erosion
-Persistence drought
leading to loss of
animals
-Loss of biodiversity
due to over stoking
-Provide good and all
wealth roads within he
ranches.
-Build capacity of
management team on
ranches
-Establish and
maintain stocking
capacity
-Improve range
management practices
AEZV-National park
and reserve
-Honey
gathering
-Biodiversity
conservation
area
-Tourists
attraction
areas
-Grazing areas
during
drought time
-Protect and
reserved area for
wildlife
conservation
-Grazing areas
-Source of cultural
social materials by
the local
communities e.g.
thatching grass
razing / pasture
honey gathering
Tsavo east
national park &
Kitui south
game reserve
630,901
113,300
Biodiversity loss due to
human activities wood
poaching meat
poaching human
wildlife conflict to
resource competition
e.g. water pasture
-Expansion of land for
agriculture toward
game reserve
-Formation of grazing
committee
-Provision and
development f more
water source both in
and outside game
reserve
-Encourage
afforestation activities
within house holds
Source: District Forest Master Plan – 2000

22
2.3. Drylands
Land Classification according to ecological zonesThe district falls between moisture availability zones, 11 and V1 with the following distribution (r is
average annual rainfall in mm and EO is average potential evaporation, so r//EO gives the degree
of aridity as %.
Zone Classification r r /EO11 Sub-humid 1000-1600 65-80
111 Semi-humid 800-1400 55-65
1V Semi-humid to Semi-arid 600-1100 40-50
V Semi-arid 450-900 25-40
V1 Arid 300-550 15-25
Land Tenure SystemsLand tenure systems in Kitui district is classified into the following:-
Trust Land
This land is held under trusteeship by County Council of Kitui e.g. of this kind of ownership are
ranches and Forest hilltops.
Free Hold
This is the greatest interest in land – a person can have and gives the person (landowner) absolute
ownership of the land. Most of the land in Kitui district falls under this category.
Lease hold
Land given for define term of years and may be granted to free holders usually subject to the
payment of a fee or rent, and subject with attached define conditions which should be observed.
Most of the land in Kitui town falls under this category.
Reservation
This included land set for either Government use or trust land to government
Ministries/department/local/authority

23
Regulatory and Institutional Arrangements
Land in the district falls under trust land vested in trust of Kitui County Council, Private and
Freehold and group ranches land, land policy and including land adjudication Act Cap 284 are
applied in order to ascertain rights and interest on landowners.
Status and Land use Systems
The climate of district is hot and in most part of the year, characterized by unreliable and erratic
rainfall pattern. This hinders intensive land use and other related development activities.
The total area of land under Agricultural production is 79,700 ha of which is intensified within
Central, Chuluni, Matinyani and some parts of Mutonguni divisions.
Grazing /pasture area - cover about 522,116 ha which is mostly spread within Eastern and
Southern parts of the district. Forest woodland covers about 758,507 ha and located within the hilly
parts of the district.
Major Causes of Land Degradation
Basically the main human activities which cause land degradation are change of land use due to
increase of human population which leads to encroachment of forests and nature reserve for
cultivation, human settlement, grazing, shifting cultivation and poor farming methods accelerates
these valuable ecosystems. The major causes of degradation are as flows:
Low incomes among the residents of the district cause the over reliance on charcoal as a
source of income thus degrading the environment.
Failure of the community to plant drought of plant/crops.
Lack of clear land ownership (title deeds) decreases extent of tree planting, as this is a long-
term activity.
The area under dry land biodiversity is slowly declining as a result of increasing demand of
Land use from the increasing population.

24
Key Environmental issues
Protected areas – These include forested hills and national Reserves whereby loss of
biodiversity species and genetic level is on the increase in the district due to continued loss
and alternation of the natural tropical habitat.
Grazing field ranches – livestock being major economic activity in the district, pastures and
water for animals last only a few months leaving the animals with virtually no grazing fields.
Proposed Intervention
Among the poverty reduction strategies there is the introduction of high value tree species,Mukau, Mpingo and quick maturing grafted Mangoes on the farm.
Increase the uptake of farmer’s innovations and new technology options combatingdesertification and encouraging income generation activities.
Increase planting materials to increase on-farm forage production. Increase tree coverage and protection of environment. To ensure promotion of Biodiversity conservation.
Table 9: Land use systemsEcological
Zone Land Tenure
Land Use Type Percentage of
District area
Challenges
/Constraints
Proposed Interventions
AEZV Private
individual
Agriculture 34.2
Loss of soil fertility,
soil erosion, adverse
climatic condition
Soil & water conservation
measure to be intensified.
Ensuring that early warning
systems are functional
EAZVI Private/indivi
dual
Pasture 26.2
Overgrazing, loss of
biodiversity change of
land use, increase land
degradation
Improve Capacity building
amongst the community on
how to deal with issues
related to animal health,
folder. Challenges
/Constraints encountered in
pasture establishment &
improve tree planting,
conservation & range
rehabilitation, Challenges
/Constraints water pan
construction

25
EAZV Trust land
public land
Forest Wood
land
39.3
Encroachment, loss of
biodiversity, increase
land degradation
Gazettement of conservation
areas.
Promote use of alternative
source of energy. Increase
tree base in district. Improve
level of tree management
skills in the district
EAZV Other 0.3
Change of land use,
loss of vegetation
cover
Review by-laws, reviewhousing legislation,construction of decenthouses, promote recreationamenities, and promoteinvestment in middle & lawcost housing in towns whereslum development is inincrease.
Source: District Development Plan 2004-008 (Abstract)
Land degradation and desertification is the net result of natural and human induced processes. It
amounts to reduction of land capacity to satisfy a particular use. It manifests itself in loss or
degradation of soil fauna, flora, water and biological productivity in area under ecological stress
(table 9 above).
The Government’s initiatives that relate to soil conservation and management include the
establishment of the Kenya soil survey project, the arid lands resource management project, the
National agricultural and livestock extension programme, seasonal paper No 6 off 1999 on
environment and development, national action programme to combat desertification 2002, the
national environment action plan (NEAP) of 1994, the enactment of environmental management
and co-ordination Act 1999, the 8th National development plan (NDP) 2002-2008), the agricultural
Act CAP 318 ) the water act 2002 and the Revised Forest Act.
2.4 Agriculture, livestock and fisheries
Agriculture and livestock are the main source of livelihoods for the rural populations three board
production systems are crop cultivation livestock rearing and fisheries. Each of the production
system has the potential to significantly affect human and environmental health.

26
2.4.1 Agriculture
Over 80% of the population in this district depends on subsistence agriculture. Two percent of the
district is high potential whereas 32 percent is medium potential for crop production basically 70,
percent of the farm families depend on livestock economies. Because of this narrow and uncertain
socio-economic livelihood coupled with unreliable rainfall patterns, the district has remarried a food
deficit one
Crop production trendTable 10: Annual crop production
Crop Total hectares Total production Tones
Maize
Sorghum
Millet
Beans
Cowpeas
Green grams
Pigeon peas
Cassava
Sweet potato
Cotton
Sunflower
Tobacco
70,000
6,700
4,750
23,640
18,200
53,900
22,750
200
50
2,000
35
100
12420
2070.0
1508.0
5400.0
6859.0
17400
4095.0
2000
500
1120
105
200
Status and Trends of Agricultural DevelopmentLivestock is a major economic activity in the district, pastures and water for animals last only a few
months leaving the animals with virtually no grazing fields. The vagaries of the climatic condition are
further compounded by poor farming implement in adequate supply of drought resistant seeds and
lack of alternative sources of income as well as dependence on subsistence farming.
The district is hot and dry for the most part of the year, characterized by unreliable and erratic
rainfall pattern. This hinders intensive land use and related development activities. There is evident
low agricultural production due to unproductive traditional farming method ,low soil fertility poor
extension services , high cost of inputs and in adequate seeds this his made the district to be
perpetual net importer of food and reliant on famine relief .

27
Table 3: Fertilizers and PesticidesCrop Fertilizer Pesticides
Legumes -Do- Folimat , dimethoate bestox
Maize sorghum and millet -Do- Bull dock granules
Cotton and tomatoes -Do- Synthetic
Pyrethoids
Kales -Do- Xentan sherpa
Maize -Do- Actellic supper sumi combi mortein doom
Agro forestry trees and maize -Do- Furadan ,confidor
Citrus -Do- White oil
Pawpaw’s and cotton -Do- Miticides
NB: The amount and type of fertilizer used in the district remain minimal due to the nature of soil
The cereal-grain-legume system
Some areas farmlands in Kitui consist of cereal-grain-legume systems. Production is mainly for
subsistence. However, surplus food crops are sold for cash. Cotton, sunflower, and sisal have
potential as cash crops, but marketing is still poor. The main constraints are low crop yields due to
poor management and crop failure due to unreliable rainfall. Grazing lands are degraded due to
overgrazing and poor management, and soil erosion is a problem on sloping land.
Trees along soil conservation structures to make them more permanent, trees on boundaries and
scattered trees in cropland are potential technologies for increased wood production and as a
support to agricultural production. Hedgerows of leguminous shrubs may be less feasible due to the
risk of moisture competition with crops. Woodlots have a role to play in wood production, and
young stock and draught animals need fodder trees as a supplement. More fruit trees of improved
varieties could also be grown, both for domestic consumption and for sale.
2.4.2 Livestock production
The livestock-cereal system
While others farmlands in Kitui consist of livestock-cereal systems. Ideally, only drought tolerant
crops should be grown in this system, but due to subsistence requirements, the main food crops are
28
still maize and beans. Other crops are pigeon peas, cowpeas, sorghum and millet. Livestock are an
important component.
Constraints to crop production are moisture limitation and little use of manure or fertilizers, which
results in poor soil fertility. Serious degradation of grazing land due to overstocking and poor land
management is common throughout these areas. There is also a shortage of poles and timber.
Improvement of soil fertility is much needed, and trees and shrubs could play a role if combined
with water harvesting. However, consideration must be given to the risk of moisture competition
with crops. Planting of more fodder trees, the establishment of fodder lots and better management
of grazing areas would increase fodder availability, which would benefit both livestock and crop
production (through draught animals being in better condition).
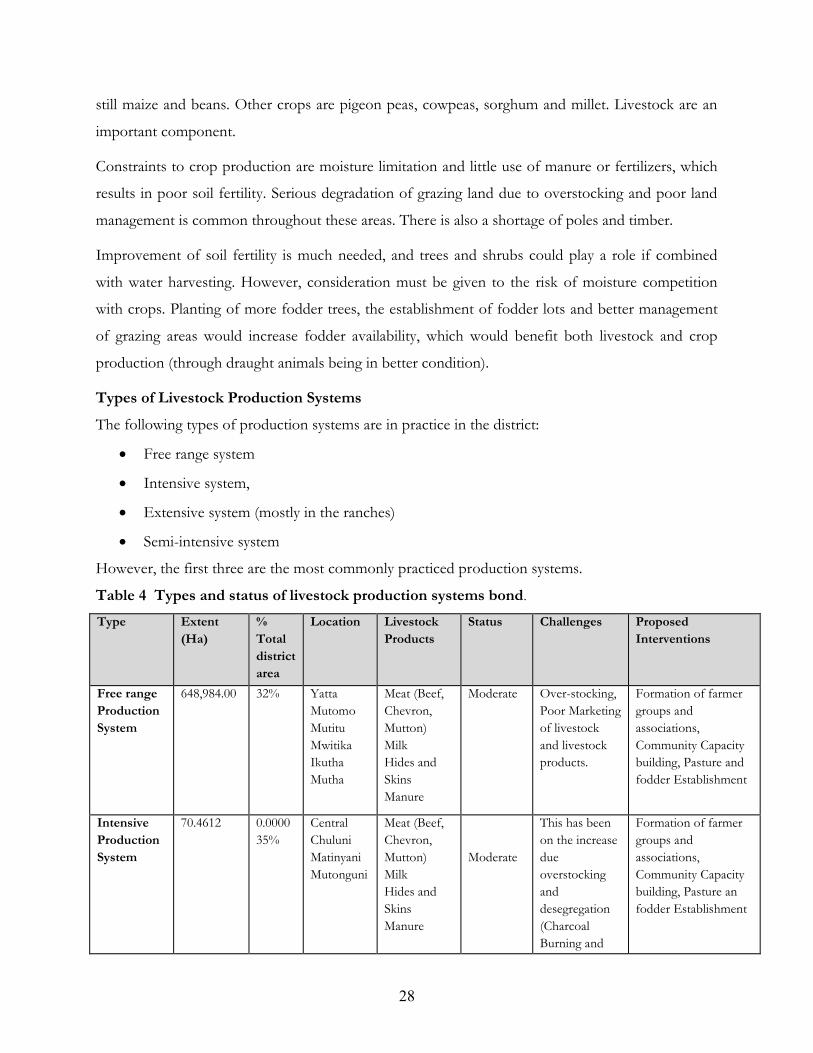
Types of Livestock Production SystemsThe following types of production systems are in practice in the district:
Free range system
Intensive system,
Extensive system (mostly in the ranches)
Semi-intensive system
However, the first three are the most commonly practiced production systems.
Table 4 Types and status of livestock production systems bond.
Type Extent(Ha)
%Totaldistrictarea
Location LivestockProducts
Status Challenges ProposedInterventions
Free rangeProductionSystem
648,984.00 32% YattaMutomoMutituMwitikaIkuthaMutha
Meat (Beef,Chevron,Mutton)MilkHides andSkinsManure
Moderate Over-stocking,Poor Marketingof livestockand livestockproducts.
Formation of farmergroups andassociations,Community Capacitybuilding, Pasture andfodder Establishment
IntensiveProductionSystem
70.4612 0.000035%
CentralChuluniMatinyaniMutonguni
Meat (Beef,Chevron,Mutton)MilkHides andSkinsManure
Moderate
This has beenon the increasedueoverstockinganddesegregation(CharcoalBurning and
Formation of farmergroups andassociations,Community Capacitybuilding, Pasture anfodder Establishment

29
opening up ofland for arablefarming)
ExtensiveProductionSystem
648,984.00 32% YattaMutomoMutituMwitikaIkuthaMutha
Meat (Beef,Chevron,Mutton)MilkHides andSkinsManure
Low Over-stocking,Poor Marketingof livestockand livestockproducts
Formation of farmergroups andassociations,Community Capacitybuilding, Pasture andfodder Establishment
Semi-Intensive
8,308.9 0.004% CentralChuluniMatinyaniMutonguni
Meat(Beef,Chevron,Mutton)MilkHides andSkinsManure
Moderate Over-stocking,Poor Marketingof livestockand livestockproducts
Formation of farmergroups andassociations,Community Capacitybuilding, Pasture andfodder Establishment
Source: District Range 0ffice Annual Report2006
NB: All the production systems are in practice throughout the district
2.4.3 Fisheries Resources
Types of fisheries production systems Earth dam fisheries
Riverine fisheries – Athi River
Fish pond culture
Ornamental fisheries
Status and trends of fisheries development
Concerted effort was done to stock with fish most of the permanent earth dams dotting the district
in various divisions. Most of the dams were stocked with Tilapia species while others with mixed
stock of tilapia and catfish. This is referred to as monoculture and poly-culture systems respectively.
Frequent occurrences of drought have negatively affected fish production especially where some of
the dams have dried up wiping out fish stocks.

30
Athi River Fisheries: The River is one of the richest fish resource base in the district. It provides
food supplements to communities bordering the river from Yatta to Ikutha Divisions. Also fish
from the river reaches markets as for as Kitui and other towns. It has Tilapia species and other
indigenous fish like the cells, catfish barbar and labeo
Pond Culture: This is a system, which depends solely on permanent sources of water.
Most of the springs, rivers, streams and wells in the district are seasonal. However there are few
farmers who have reliable springs and wells and have initiated small fish projects.
The extension of the Masinga water project has made it possible for anybody interested in culturing
fish for domestic use in a small scale with minimal costs. We have fish demonstration ponds towards
that cause in our office.
Ornamental fisheries: This is a system where some fish species special for decorative or
ornamental use are cultured in Aquariums (glass walled containers) that use generators. They can be
kept in living rooms or business premises. Several business people have adopted this concept in the
town.
Some fish is imported from outside the district and the main sources are Lake Victoria, Naivasha
and the Tana River dams. The types of fish are mainly Nile Perch, Omena and Tilapia species.
Fish Production
Earth dams / ponds produce about 4,220 kg while river fisheries produce 6,000kg per annum.
This figure fluctuates due to accessibility of some of the areas hampers the collections of
production. Not all areas are well covered due to shortage of manpower and scarcity financial
resource.
Alien Species and Threats to Habitants
There are no species that have been introduced in the district or that has been recorded in our
waters. The catfish introduced in the dams has a population control effect of the fast breeding
Tilapia species.
Regulatory and institutional arrangements

31
Fishing industry is controlled by the Fisheries Act 1989 and fisheries (general) regulations of 1999.
This regulates all fisheries activities in the district namely: Fishing, trade in fisheries products,
movement of fish and products, processing, fishing period and all aspects involving fisheries.
The fisheries department has the mandate to enforce the Act and regulate, manage and develop the
fisheries resources.
Table 5: Types and Status of Fisheries Production Systems
Type ofproductionsystem
Location Status
Current
production
level
Potential
production
level
Challenges Proposed interventions
Earth dams
/Fish
ponds
Central,
Kyuluni ,
Mutonguni ,
Kabati , Yatta
Mutito
4,220kg per
annum
12,960kg per
year
. -Proper fish gears
-Negative attitude
towards fish diet
-Poor brood stock
-Poor fish husbandry
due to conflict of
interests water
consumers.
- Purchase and accessibility
of fishing years
-Sensitization of the
communities
-Introduction of new
broad stock
-Stocking of more dams
River line
fisheries
Athi river 6,000kg per
annum
12,000kg per
year
-Proper monitoring and
patrol of the river
-Proper fishing gears
Availability of funds fuel
and transport and
purchases of gears
-Additional man power
Source: Fisheries Officer - 2005 Annual Report.
Key Environmental issuesIt should be noted that fish is part of the environmental heritage, which should be preserved and
guarded, and especially the river line fisheries. The Athi is home to some of the rare indigenous fish
species.
Aquaculture especially dam fisheries enhances healthy environment in the water resources fish in the
earth dams has an added advantage consuming spawning in the dams are consumed by fish
therefore checking the spread of Malaria.
It has observed that there is an increase of toxic materials from industrial wastes and chemicals
released from flower farms and industries Nairobi and Machakos unchecked release of toxic the
materials into waters habitants affects fish stocks.

32
However there are no hazardous activities in the district warranting attention except the lack of
sewage system in Kitui town that has seen most of the sewage wastes being released in Kalundu
River and other streams.
Proposed intervention
Monitoring of the fisheries habitats
Control of water pollution
Monitor of fishing activities
2.5 Water sources
Water sustainability resolves around quality and quantity issues. Increasing demand place an
increasing strain on natural water bodies. Water resources depletion and pollution is a threat to
environmental degradation and thus social –economic conflicts deterioration and hence poverty
propagation.
Due to limited rainfall received surface water sources are very scarce. The major sources of surface
water are seasonal rivers that form during the rainy seasons and dry up immediately after the rains.
River Athi is the only perennial river in the district and flows along the border with Machakos and
Makueni Districts. The district has no lake but has several dams and pans that play a significant role
in providing water. Most of the dams dry up during the dry season due to the high evaporation rates
of between1800 -2000mm/year. Spring water is generally found in the hilly areas of the district
namely Mutitu hills, Endau hills and Mutha hills. The springs vary in their flow regimes and some
dry up during extended drought period. Underground water sources supplement the scarce surface
water sources through drilling boreholes.
2.5.1 Main Catchment and Drainage
Kitui district is mainly formed of two distinct catchment areas defined by the ridges which forms
part of great Mozambique belts. .The upper catchments area with altitude of 1200m a.s l forms the
main water catchments to the lower area whose altitude is averagely 500m a.s.I.

33
Table 6: Water Catchment and Drainage
Main Water Catchment Major Drainage
Mutitu ,Ndau ,Mutha ,Mutulani ,Kiongwe,Miambani and
Ikoo valley
Mutonguni ,Kavonge,Kiima,Musengo and Museve
Thua
Tiva
2.5.2 Identified Status / Trend of Water ResourcesThe major water sources could be classified into surface water and ground water.
The status and trends of the water resources are analyzed below:-
Table 14: Status of Water Quality and Quantity
Water Resource Status Trends
Boreholes Fair Decrease in yield
Dams Poor Increase in siltation
Rivers Moderate Increase in pollution/decrease in quantity
Springs Fair Decrease in yield
2.5.3 Regulations and Management Arrangement
The Water Act provides for the management, conservation, use and control of water resources and
for the acquisition and regulation of rights to use water. The Act is provided by the following
responsibilities:
Development principles, guidelines and procedures for the allocation of water resources;
Monitor, and reassess the national water management strategy;
Receive and determine applications for permits for water use, and monitor and enforce
conditions attached to water permits for use;
Regulate and protect water resources and quality for adverse impacts;
Management and protect water catchment and liaise with other bodies for better regulation
and management of water resources;
To gather and maintain information on water resources and regularly publish forecasts,
projections and information on water resources.

34
Table 15: Identified main water usesUSE UTILIZATION REMARKS
Domestic 75% Utilization is limited to domestic due to scarce
Industrial 1% No major industries
Irrigation 10% Irrigation accessible along river lines
Livestock 14% High number of livestock though use is limited to availability
Table 16: Impacts of water use and demand on environment and natural resourceUSE IMPACTS REMARKS
Domestic Increased demand Development of more sources
Irrigation Depletion Over utilization
Livestock Pollution Uncontrolled watering
General Agriculture Siltation -Serious erosion
-River bank cultivation
Source: District Water and Irrigation Officer – 2006
Table 7: Sources and Status of Water ResourcesSource Status Usage Management Challenges
threatsProposedinterventionsPiped water
Systems: -
Quantity Quality
1. Borehole Average Good Domestic Committee Running costs Increase
boreholes
2. Springs Low Good Domestic Committee Catchment
destruction
Running cost &
low
distribution
Gazettement of
catchments
3. Masinga P/L High Good Domestic Gazetted supply Network Increased
distribution
network
Ground water
sources:-
1. S/wells
Average Fair Domestic/irr
igation
Individual/
supply
Low yield Development of
more wells
Surface water
sources
1. Dams Low Poor Domestic/irr
igation
Groups Drought ,
siltation
Catchment
protection

35
Source Status Usage Management Challengesthreats
Proposedinterventions2 rivers Low Poor Domestic/Ir
rigation &
livestock
Non Drying river
beds
-Formation of
catchment
committees &
regulation
gathering river
line activities
-Construction of
harvesting
structures along
river beds
3. Rocks Low Fair Domestic Groups
committees
Changing
weather
condition/cost
involvement
-Construction of
viable sites.
Rain water
harvesting
1. Roof / C ranks
Low Good Domestic Individual -Changing
weather
condition , cost
involvement
-Construction of
more tanks

36
Table 18: Priority environmental issues and interventionsNo. Prioritized issues /challenges Proposed intervention
1 -Conservation of catchment areas
-Construction of conservation structures
-Capacity building
-Resource mobilization
-Sensitization
-Agro-forests/re-afforestation /afforestation
-Identification and selection of viable sites for
conservation structures
-Conservation of reservoirs at catchment base
2 River banks protection
-Flooding /flow control
-Sensitization
-Defining of river line
-Capacity building
-Construction of harvesting structures
Defining
Source: District water officer Kitui -2006
2.6 Forestry
2.6.1 Vegetation types
The Gazetted and non-gazetted forest land in the district covers 18,816 ha. Total gazetted forestland
is 16,691km2 and 95% is composed of natural forest while the remaining 5% consists of mainly
Cypress, Pines and Eucalyptus among others
Forests in the district mainly serve as water catchment areas and most of the rivers originate from
the forest areas. There are about 400 (ha) of forest land planted with exotic trees plantations to
provide timber and wood fuel. The trees are also used as folder for livestock, herbal medicine,
beekeeping, birds and animal sanctuary.
Table 19: Shows the distribution of forests and their status.Forest Name Area ( Ha) Ownership Status
Mutitu 1958.7 GoK Gazetted
Engamba 3,222.3 GoK Gazetted
Makongo 3431.8 Trust land Gazetted
Endau 6717.8 GoK Gazetted
Kavonge 31.0 Trust land Un -Gazeted

37
Forest Name Area ( Ha) Ownership Status
Kyawea 63.0 Trust land Un Gazetted
Museve 48.2 Trust land Un Gazetted
Mutuluni 596.1 Trust land Un Gazetted
Mutha 1361 Trust land Gazetted
Nzoani 1387 Trust land Un GazettedTotal 18,816.9Source: Kitui District Forest Master Plan- 2000
2.6.2 Regulatory and Management Arrangements
Issuance of Forest products movement permits was introduced in the year 2005 as a measure of
control to the wanton cutting of indigenous trees for charcoal. The process of getting a movement
permit has to be ascertained by various departments represented in the environment committee, a
long process that would only leave the very genuine cases of tree cutting. This mechanism also
enables forestry department to monitor areas where cutting is taking place and ensure the same is
replanted.
Environment committees have been launched in every division and have the responsibility of
inspecting and authorizing the cutting of trees in their respective divisions before any person is
issued with a movement permit. The committees authorize cutting of trees only cases where the
owners of land are clearing land for agricultural expansion purposes.
The communities are being empowered through training and seedlings production at the farm level
to ensure sustainability of afforestation efforts by the departments Forest extension services.
The new approach by the department to involve the adjacent communities neighboring forests in
the management of state forests through Participatory forest management will not only ensure
protection but also sustainable management.
2.6.3 Exploitation of Forest Resources both For Timber and Non Timber Products
Exploitation of mainly Melia volkensii and eucalyptus for timber and poles is ongoing within the
district and especially in Central, mutitu, mwitika mutha and Mutomo division. All the local
conversion of timber is done using chainsaws to shape frames. This is very wasteful as chainsaws
can only yield about 25% of the original wood.

38
According to results of the survey carried out in 2001 on charcoal trade, an average of 255,229 bags
of charcoal leaves the district, each year, mostly to Nairobi. At 35 kg a bag, this makes 8933T.
Converted into solid wood, it makes 8933 / 0.10 * 1.4 = 125065m3 per year. However, there is
currently an upsurge in exploitation of wood for charcoal production in the district now estimated at
400,000 bags per year.
Kitui district is endowed with a vast resource of essential non-wood forest and tree products e.g.
aloes, medicinal plants, resins, oils and gums, honey production and other insects e.g. silkworms,
butterflies etc all which can be harnessed, improved and commercialized to industrial levels. The
exploitation of these products is however very minimal.
There is need for certain tree species for special income generating activities in the district. These
include woodcarving and processing of herbal products. Species like Dalbergia melanoxylon for
carving are on the verge of extinction and alternatives need be identified and propagated to meet the
needs of this industry. Neem (Azadratchta indica), Moringa Oleifera, Prunus african and olea species are
on demand for herbal medicine production
Key Environmental issuesLoss of biodiversity through expansion of agricultural land is common everywhere, and in Kitui the
area under agriculture is expected to increase, at the expense of areas under bush land used for
pasture and wood production. In the year 2000, about 65% of the district area was still under
pasture, forest & woodland, with agriculture taking the remainder of 35% or some 670,000 ha. In
twenty-five years’ time, it is projected that it will have changed to 60% and 40%, respectively or a
decrease of 140,000 ha of land under pasture and wood production (an average of 5,600 ha loss per
year).
Uncontrolled charcoal burning and wanton destruction trees within trust land and private land is a
major threat to environment conservation in Kitui District. There is also a lot of encroachment by
the neighboring communities for farming; overgrazing and cutting of vegetation cover hence soil
erosion and degradation.
Exploitation of wetlands both for agricultural farming and as water sources without conserving their
catchments is threatening the sources of the very scarce water resource in the district.
Proposed InterventionsThe forestry sector’s contribution to Kitui district overall development will be effected by the
following strategies:

39
Promotion of on-farm tree planting by introduction and strengthening the existing on-
farm tree nurseries for increased tree products like poles, fuel wood, timber and improved
agricultural yields and fodder for livestock.
Awareness creation through training, barazas, and exchange tours, demonstration plots,
schools, adult education classes. The community will be sensitized on issues of
environmental concerns like deforestation, soil erosion, species selection, need to increase
wood biomass on farms, fodder availability and management of common resources e.g.
dams, riversides and hills.
Establishment and management of exotic and indigenous plantations on the hills by
involving the communities and other stakeholders. These will aim at eliminating the existing
timber, poles and fuel wood deficit, improve soil and water conservation, leading to increase
food and fodder production, and raise living standards through job creation.
Promotion of public utility conservation and management programs like riverbanks
and dam and water catchment protection, and encouragement of eco-tourism to benefit the
communities. Promotion of amenity tree planting to improve the aesthetic aspects of the
urban centers.
Improvement of existing charcoal production technology by replacing the traditional
earth mound by improved casamance mound will ensure efficiency in wood biomass
conversion. These coupled with improved collection of chess money by the County Council
and eventually bring back some of the money through Forest Department for afforestation
programs will ensure sustainability in charcoal production.
Promotion of production, processing and marketing of non-wood forest productsand support sources of income generation. The dry lands are endowed with a vast
resource of essential non-wood forest and tree products erg aloes, medicinal plants, resins,
oils and gums, honey production and other insects e.g. silkworms, butterflies etc all which
can be harnessed, improved and commercialized to industrial levels. The planners should
therefore put into account strategies that will go towards exploiting these resources

40
Table 8: Forest Type and Coverage
DivisionTotal Area(ha) Agriculture
Pasture &woodlands
Forests &Hills
National Parks& Reserves Other
Central 76,548 62,000 6,026 7,400 - 1,122
Chuluni 53,920 29,000 10,150 14,364 - 406
Ikutha 611,302 89,370 52,890 39,180 428,401 1,461
Mutha 653,342 297,830 115,257 37,605 202,500 150
Mutitu 61,445 24,676 14,186 22,533 - 50
Mutomo 77,900 49,000 16,460 9,900 - 2,540
Mutonguni/
Matinyani79,569 57,300 6,400 15,300 - 569
Mwitika 324,935 32,000 256,000 36,600 - 335
Yatta 116,614 45,600 65,400 5,214 - 400
TOTAL (ha) 2,055,575 686,776 542,769 188,096 630,901 7,033
TOTAL (%) 100 33 26 9 31 0.34

41
Table 9: Types and Status of forestsType offorest
Extent(ha)
Dist.(% oftotal
Loc. Forest uses Status Proposed intervention
Pasture
woodlands
542,769.0 26% District
wide
Pasture 40% Introduction and promotion of
high
Value tree species and quick
maturing grafted fruits trees
geared toward farming
programme to provide a source
of income as well as ensure
proper natural resource
utilization
Game
reserves
705,400.0 31% Mutha
Ikutha &
division
Biodiversity
conservation
630,901 113,300 10% Formation of partnership with
appropriate stakeholders and
build their capacity and
knowledge on wildlife /human
conflict resolution
Development mean full
incentives which will encourage
the community /
stakeholders/partners to
support biodiversity
conservation effort
Forests &
Hills 188,096.0
9% District
wide
Water
conservation
17,088.7
1
5% To improve sustainable
forestry resources
management, tree planting of
indigenous high value tree
species, promote utilization of
indigenous trees for both
domestic consumption and
income generation as well as
commercialization of activities
such as tree planting
-Community involvement in
forest management as a
communal resource
Others 7,033.0 0.34% Integrated approach –
afforestation and conservation
of forest is linked to increased
water supply. Sustainable
agricultural production

42
2.7 Wildlife resources
2.7.1 Types of wildlife and area under wildlife
The area is a suitable habitat for a wide diversity of fauna some of which attract tremendous
conservation interest. According to the International Union for the Conservation of Nature (IUCN)
Red Data Book threatened large mammals found in the Mt. Kenya forest include; leopard, Eastern
bongo, Giant forest hog, Black rhino, Africa elephant and Black fronted duiker. Other wildlife that is
commonly encountered in the area include Cape buffalo, black and white colobus, Skye’s monkey, olive
baboon, eland, Zebra, reedbuck, spotted hyena, serval, genet, and mongoose. Notable smaller and rare
mammals reportedly include the Mt. Kenya mole shrew, mole rat, thicket rat, highland musk shrew and East
African rock hyrax. Mt. Kenya is an important bird area and home to the threatened and little-known
Abbot’s starling. Fifty three out of Kenya’s 67 African Highland biome bird species are found here. At
least 35 forest specialist species and six of the eight species from Kenya Mountains Endemic Bird
Area reportedly occur on Mt Kenya.
2.7.2 Trends and status of wildlife resources
The status of wildlife in Kitui district has been relatively stable unless in cases when there is wild
fires and the animals migrate.

43
2.7.3 Regulatory and management arrangements
The wildlife management is carried on under the provisions of the wildlife (Management and
Conservation) Act Cap. 376. In 1989, the act was amended to create the KWS to replace the
Department of Wildlife management that was in charge of implementing the provisions of the act. The
act prohibits a range of activities within a national park or reserve. These include hunting; residing;
cutting or setting fire to vegetation; knowingly introducing animal or vegetation; clearing; cultivating or
breaking up land for cultivation; and fishing.
2.7.4 Exploitation of wildlife resources both consumptive and non-consumptive
Exploitation of wildlife in Mt. Kenya region is strictly prohibited as it has been declared as one of the
world’s conservatory sites.
Types and status of WildlifeThe National reserve which has an area of 1833 Km2 and is located in South Kitui support ecotourismactivities in the district. The main threats to wildlife are poaching, charcoal burning, encroachment andhunting as well as logging (table 20 below).
Table 10: Priority Issues and InterventionsChallenges Proposed intervention Remarks
Security in the reserve Patrols by KWS.Council to recruit and train rangers
Proposal is underway for thesupport of this recruitment andtraining
Encroachment into the reserve Flushing out those already in the reserveEstablish an outpost out at Enyai
Integrated management plan isunder way detailing thisintervention
Poaching of small game meat Community management Committee alreadytraining organizedContinue empowering the managementcommittee through training and educational tours
Training has been organized andtours
Logging for timberPatrols in and outside the reserveInitiate group tree nurseries to reduce competitionfor timber
Police AdministrationNeeds to wake up
Charcoal burning Awareness through barazasInitiate group tree nurseries to reduce comp. forindigenous
Police Administration /Personnelneeds to wake up
Encroachment into theSanctuary
Beaconing of the sanctuaryDevelopment of dilapidated infrastructure
Beaconing has been done.
Over harvesting of some treespecies
-Regulate and control harvesting of forestproductsCapacity build the community in afforestation
Afforestation and diversificationtree planting

44
Challenges Proposed intervention RemarksprogrammeRegulate and control harvesting of forest productsCapacity build the community in afforestationprogramme
Inadequate energy source Encourage community involvement in seedlingproduction and afforestation programsPromote tree planting as income generatingactivity-Enhance use other source of energy-Promote use of energy saving devices
Intensive afforestation and re-forestation of Trust land
Highly degraded land due toover stocking, Livestock andopening up new land for cropproduction.
Promote use of alternative source of energy andencourage use of energy saving devices-Continue promotingCommunal forest management system.
Promote planting of indigenous trees forenvironmental conservation
Encourage and supportfarmers Field Schools
2.8 Biodiversity conservation
2.8.1 Biodiversity Data and Information
Type, extent, status, trends of biodiversity and environmentally significant areasForest typeThis type of vegetation is found in the high altitude areas of Kitui town and its surrounding. It is
characterized by species such as Croton macrostachyus, Croton megalocarpus, Dombeya spp., Combretum collinum,
Combretum molle melia volkensii. Other species are Vitex doniana, Euphorbia spp., Sclerocarya birrea among
others. In this type of vegetation exotic species such as Eucalyptus species, Grevillea robusta, Mangifera
indica and occasionally bananas are seen on valley bottoms.
Woodlands
This type of vegetation comprises of species such as Commiphora baluensis, Terminalia brownii, T. spinosa,
T. orbicularis, T. prunoides, Delonix elata, Balanites aegyptiaca and Acacia spp. A number of the species shed
leaves in the dry season as a survival mechanism.
Bush land and Shrub land

45
This can be seen as vegetation of a height between 2 and 10 m combining trees and shrubs with a
woody cover of 10 – 30%. Species include Commiphora africana, C. schumanii, Combretum molle, Acacia
mellifera, A. brevispica, A. horrida, A. bussei, Boscia coriacea, Steganotaenia spp, Bridelia microcantha, Indigofera
spp., Terminalia prunoides, Combretum exalatum and Osyris lanceolata. This vegetation type is mainly within
the plains where some massive hills are standing out e.g. Mutitu, Makongo, Endau, Egamba, Mutha,
Nzoani. On the higher elevations of those hills, species such as Albizia, Newtonia, Tamarindus, Croton,
Olea, Vitex are observed.
Dwarf Shrub grasslands
This type of vegetation has grass and shrubs covering more than 80% and with shrubs of up to 7 m,
mainly found in the Eastern and Southern Lowlands. Species found in this vegetation type are: Croton
dichogamus, Bauhinia spp, Muevia spp, Acacia mellifera, Adansonia digitata, Combretum shrubs, and Acacia
nilotica among others.
Table 11: Type extent, status, trends of biodiversity
Key Environmental Issues Land use change –conversion of grazing lands to cultivate land and sub sequent human
invasion to ranches.
Deforestation and biodiversity loss is due to forest fire, charcoal burning, shift cultivation or
over grazing.
Degradation of the habitant – Encroachment by livestock, wood poachers in nature reserve and
conservation areas. Changing land use practices whereby people are moving to drier areas to
cultivate has exacerbated degradation of the habitant.
Type Extent ( Ha) Status Trends
Game Reserve 705,400 Trust Land Encroachment by human activities
Forested hills and
water catchments
7,703
1111.9
Gazetted & Protected
Un Protected Trust land
Threatened ecology due to invasion by
farmers for charcoal burning,
cultivation & grazing
Ranch 150,021 Privately Own Invaded by squatters & over stocking
leading to environmental degradation
Sanctuary 50 Trust land Proposed for development to enhance
eco-tourism

46
Table 12 Types of Utilization and Major BeneficiariesSPECIES
Timber poles Mellia Volkensii, Eucalyptus Timber
Post Grevellia robusta, Commiphora baluensis, Accacia’s
spp
Marchants & bulders
Fire wood Land Owners, Forest
Charcoal Acacia spp Traders
Commiphora spp Farmers
Non wood Tamarindus, guavas Farmers
Produce Baobab seeds Wood carvers
Carvings Dalbergia combretum, Lelanoxylon vitex doniana Agriculture
The main human activities that threaten environmental significant areas and bio-diversity conservation
are cultivation grazing and poverty, which is due to frequent drought occurrence. This is due to lack of
pasture to sustain the livestock and more so, shift cultivation and poor farming method which lead to
soil erosion resulting to degradation of those valuable ecosystem.
Major Threats to Biodiversity:
Encroachment/human settlement: Settlement in the reserve occurs on the lower parts of the south
Kitui national reserve mainly to the north at Maliluni and Enyali and Northwest at Kyeni. This is
attributed to the availability of water from Thua river which transverses East to West of the reserve.
Clearing along river banks have been made to create land for subsistence farming A primary school at
Kyeni had been constructed inside the reserve but abandoned after frequent raids from bandits.
Over grazing and the advancement of deserts conditions: The depletion of ground cover in the
north and north East region is so high that the drastic changes in biodiversity is evidenced of
progressive arid and desert situation. The Ormans who have lived inside the reserve and some time
they keep on moving, further and further into the reserve due to the pressure of banditry attacks.
Subsistence and commercial poaching: There is both small scale (subsistence) and commercial
poaching in the area .Commercialization of traditional subsistence hunting has dealt a crippling blow
to traditional Kamba wildlife management system. Traditional taboos that enhance wildlife
conservation through sustenance use by regulating small scale hunting (species type and age and level
of off take) are currently loosely adhered to. In Kitui District 25.1% bush meat consumed is purchased

47
and a substantial illegal trade industry occurs. Of bush meat hunter in Kitui, commercial trade
motivates 32% while the remaining 68% of hunting is motivated for subsistence consumption. The
trade of bush meat in Kitui is a well developed informal industry that affects many inhabitants with
172 traders reporting sale of 82.2 metric tons of dressed bush meat from 24 species during 1997
(Barnett, 2000).
2.9 Unsustainable natural resource use practices
With absolute and food poverty at 64.9% and 63.2% respectively, Kitui District ranks high in the
national rankings of districts with lowest per capital income. The harsh climatic conditions in the
district sometimes translate to prolonged drought and thereby famine. The reserve has as such reserved
as a source of food, timber, fuel and other non-timber forest products such as honey. This has created
an open access regime in the reserve where the extraction of resource is highly unsustainable with the
resultant being destruction of wildlife habitat, loss of biodiversity and desertification (table 24 below).
Key Environmental Issues
Land use change –conservation of pastoral lands to cultivate land and sub sequent human
invasion to ranches.
Deforestation and biodiversity loss due to forest fire charcoal burning, shift cultivation or over
grazing.
Degradation of the habitant – Encroachment by livestock, wood poachers in nature reserve
conservation area. This has been exacerbated by changing land use practices whereby people
are moving to drier area to cultivate
Overstocking of wildlife, which might be more than the carrying capacity of the national park
or reserve
Proposed Interventions
Control of wildlife to prevent human/wildlife conflict
Involve the neighboring communities and create awareness to control poaching and destruction
of wildlife
Construction of more and close protection camps both for KWS and FD guards
Facilitation of the guards (plants and equipment)
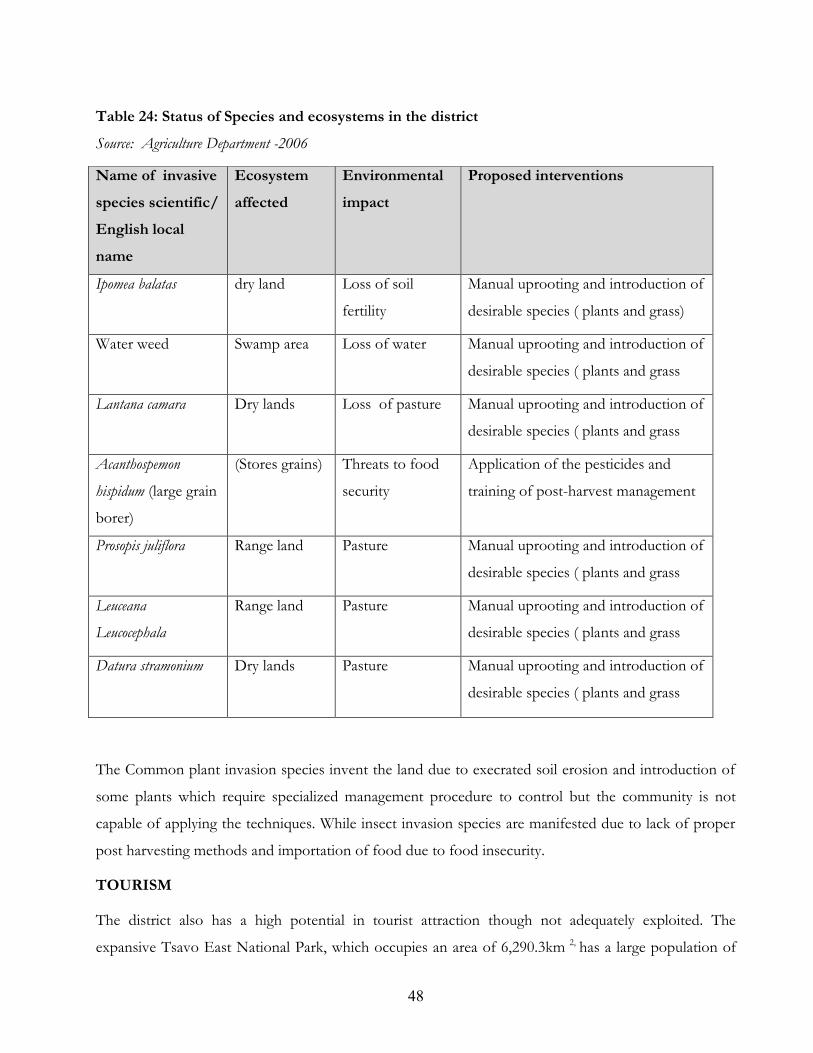
48
Table 24: Status of Species and ecosystems in the districtSource: Agriculture Department -2006
The Common plant invasion species invent the land due to execrated soil erosion and introduction of
some plants which require specialized management procedure to control but the community is not
capable of applying the techniques. While insect invasion species are manifested due to lack of proper
post harvesting methods and importation of food due to food insecurity.
TOURISM
The district also has a high potential in tourist attraction though not adequately exploited. The
expansive Tsavo East National Park, which occupies an area of 6,290.3km 2, has a large population of
Name of invasivespecies scientific/English localname
Ecosystemaffected
Environmentalimpact
Proposed interventions
Ipomea balatas dry land Loss of soil
fertility
Manual uprooting and introduction of
desirable species ( plants and grass)
Water weed Swamp area Loss of water Manual uprooting and introduction of
desirable species ( plants and grass
Lantana camara Dry lands Loss of pasture Manual uprooting and introduction of
desirable species ( plants and grass
Acanthospemon
hispidum (large grain
borer)
(Stores grains) Threats to food
security
Application of the pesticides and
training of post-harvest management
Prosopis juliflora Range land Pasture Manual uprooting and introduction of
desirable species ( plants and grass
Leuceana
Leucocephala
Range land Pasture Manual uprooting and introduction of
desirable species ( plants and grass
Datura stramonium Dry lands Pasture Manual uprooting and introduction of
desirable species ( plants and grass

49
wildlife, which attracts tourists in the Country. Generally the National Park has no economic gain in the
district because the revenue collected is not ploughed back to the district. Also tourist infrastructural
facilities such as lodges, water and other tourist’s related amenities need to be developed in south and
north reserves as well as National Parks
MINING
The district is endowed with some minerals and materials that are exploited on commercial basis.
Building sand found in abundance and is exploited on commercial basis. At the moment, there are
several sand harvesting sites namely, river Nzeeu, Tiva, Mutendea Mwitasyano and Kauwi near Kitui
town. Other small sand harvesting sites are spread throughout the district. Due to absence of
consolidated volcanic ash and other forms of buildings rocks, bricks are locally made of clay materials
found in the district.
.

50
CHAPTER THREE
3.0 HUMAN SETTLEMENT AND INFRASTRUCTURE
Human settlements and infrastructure Influence the location of investment, which provides
employment, generate revenue for and creates demand for materials and services. This includes
education, commercial, industrial, recreational residential , agriculture public utility (services include
supply of water ,waste disposal ,sanitation telephone ,power services include supply of water, sewers )
public purpose will include (religious institutions) and protected land (public parks, national parks and
reserves, forests ) transport (roads railways ,airways lake/sea ports) These activities can have negative or
positive impacts on the environment.
Factors Influencing Settlement Patterns
Land potential largely determines the population density between divisions, climatic conditions also
influence the settlement patterns and also infrastructure and security also determine population density
of any division central, Matinyani and Mutonguni divisions have the highest densities of 153,151, and
148 person per km2 respectively while Ikutha, Mwitika and Mutha division have the lowest population
densities of 6.0 8.0 and 9.0 person per km2 respectively. Tables 24, 25 and 26 show some social
indicators related to land tenure, urban planning and access to water.
Table 13 Land tenure systems and area (ha) in the districtTenure type Area (ha) Remarks
1960 1970 1980 1990 2000 2005Leasehold 20 40 150 180 210 260 Most of the trust land has
been allocatedFreehold 9000 8960 8900 8870 8850 8800 Agriculture land has been
subdividedTrust land 90 77 50 40 94 35Others (gazettedforest parks &reserve
Threaten by humanactivities
Total 9110 9077 9100 9090 9154 9099Source: Municipal Council of Kitui – 2006

51
Table 14: Planned urban areasCity/Municipality
Local plan Regional plansRegional Plans
Municipality 1960 1970 1980 1990 2000 2005 1960 1970 1980 1980 1990 2000 2005Kitui township
1 1 1 1 1 1 -- -- -- -- -- -- --
Matinyanimarket
-- -- -- 1 1 1 -- -- -- -- -- -- --
Katulanimarket
-- -- -- 1 1 1 -- -- -- -- -- -- --
Source: Municipal Council of Kitui 2006
Table 15 Percentage of households with access to water and sanitation services
Source: District Public Health Office -2006
Key Environmental Issues
Increased land demand lead to encroachment of human to protected area (parks, reserved and
gazetted forests)
Loss of biodiversity cover
Overgrazing lead to soil erosion and desertification.
Destructions of water catchment areas
Reduce soil fertility and destructions of aesthetic value of land.
Loss of wildlife habitat.
About sixty per cent (60% ) of the district area is range land (grazing are) most of this land has
been degraded mainly through overgrazing thus leading to low vegetation cover with
approximately 10% ground cover and 15% canopy cover.
Location Water Dams Sanitation Remarks
PipedB/hole
WellBoreHole
River DamsOthers
Connectedto
sewerWC
Pitlatrine
Flyingtoilets
Other
Kitui10,000 8,000 20,000 5,000 1,000
Nil 1,000 30,000 Nil 13,000
KituiDistrict
40% 5.8% 2% 80% 8.2% NIL 4% 56% 1%39%
LowCoveragefor bothitems

52
Proposed interventions Accelerated land adjudication to ascertain existing rights and interests of individuals overland.
Sub division of group ranches and co-operatives farms to facilitate insurance of individual titles
to their respective members
Promote afforestation programs within public, private trust land and individual farms.
To sensitive the community on importance of preserving conserving and protecting
environmental significant areas (Forested hills, water catchment and river bank areas) to
enhance environmental goods and services.
Improve animal breeding to increasing livestock products thus reducing the number of
livestock.
3.1 Human and Environmental Health
The district experiences a number of diseases which affect the people. Some of the diseases areinfluenced by environmental factors which range from poor waste management to use of pollutedwater. The table 30 below shows trend in disease manifestation in the district over a number of years.Common diseases influenced by environmental factors Malaria Intestinal worms
Skin infection
Diarrhea
URTI
T.B
Eye infection
Amoebiosis
Bilharziasis
Typhoid fever
Status and Trend of Common Environmental Diseases
Malaria is on the increase due to new strains of malaria parasites resistant to common anti-
malarial drugs.
T.B is on the increase but is related to HIV/AIDS.
Typhoid fever is on the decrease due to effective treatment and increased awareness on
preventive measures.

53
Amoeba is on the decrease due to improved environmental sanitation and increased awareness
URTI –fluctuates with season. It is more during dry period and cold season.
Eye infection is on the decrease due to high awareness leading to the sick seeking medical
attention and improved health care system
Skin infection is on the increase due to HIV/AIDS.
Bilharzia cases are decreasing due to improved water and sanitation and improved awareness.
Intestinal worm decreasing due to improved sanitation.
Table 16: Disease Trends 1993 - 2004Year
Type
Of
Disease
1993 1994 1995 1996 1998 1999 2000 2001 2002 2003 2004
Malaria 38612 4416 99539 105980 85747 114018 101263 137359 197836 211199
Intestinal
Worms5401 2720 1392 13772 792 10787 12618 10803 13785 20756 26935
Skin
Infection16864 1887 6060 17484 839 14571 11025 14068 18809 20769 33424
Diarrhoeal
Diseases19922 10479 3729 18591 10012 12384 10580 10664 12533 20713 26901
Urti 33932 8438 7973 141 40394 456106991
61179 95870 11842
Pneumonia 2406 7276
Eye
Infection4130 293 94 3712 443 3865 3979 3864 3957 4919 6640
Dental
Carrier-- -- -- -- -- -- -- -- -- 3701 --
T.B 97 158 179 190 343 1786 2094
Intervention Measures Increased awareness level and training of groups on hygiene’s and environmental health.
Increased inter-sectoral collaboration
Improved water and sanitation measures
Increased Donor funds to the communities
54
Capacity building of the trained personnel
Increase health facilities and medical equipment
Improved infrastructure
Pollution and Waste Generated From Human SettlementThe solid wastes generated by household and business (agricultural and products) are mainly disposed
of through burning about 40% is dumped in the neighborhood and 20% is dumped in the drains
Therefore is need to address the issue of solid waste management since improved drains mean creation
of dumping site which will improve discharge of effluent. Solid waste generated from the
neighborhood is only a fraction that is managed in all the areas in KITUI Town thus creating dump
sites within residential areas. This caused a lot of pollution and the dump files are an eye sore and
danger to the people.
Major Sources of Pollution on land, water and air
Solid waste –residential, commercial and market areas.
Liquid waste – from residential, eating) places, car wash, lodgings, commercial places, schools.
Chemical waste /Agriculture waste – generated from Agricultural areas, schools, hospitals.
Industrial waste – from Jua Kali garages and petroleum on-lets.
Special hospital waste – Pharmaceutical and Agro-vet shops, health facilities.
Air pollution – caused by emission into air of gas from burning waste and moving vehicles.
Air Pollution
Smoke
Toxic/ hazardous gases
Industrial fumes
Key Environmental Issues Blockage of drains
Littered neighborhood
Loss of aesthetic value
Diseases out break
Proposed Interventions
Proper solid and liquid management
Use of biodegradable chemical in farms.

55
Provision of adequate solid waste infrastructures and facilities
Proper design of sewerage systems
Public participation in solid and liquid waste management
Enforcement of laws and regulations.
3.2 Communication networks
RoadsThe present road transport network in Kitui ranges from feeder roads to highway. The system is
divided into classified and unclassified roads with a total network of 1854km.
Out of the 361.8 km classified road network 75.8 km are of bitumen standard, 286 km gravel standard
and the rest are earth stand.
Telephone line/postal servicesThe land line telephone service are accessible to all major towns and 8 divisional headquarters that is
Central, Matinyani, Mutonguni, Chuluni, Mutomo, Ikutha, Mutitu, Mutha except Yatta and Mutonguni.
Mobile telephony has been introduced and is growing very fast all over the district.
Key Environmental Issues
Clearing of vegetation and prime agricultural land to make room for road
Increase air/noise pollution
Increase the rate of soil erosion
Emission of gaseous pollutants
Proposed Interventions
Routine maintenance of feeder roads opening up new feeder road.
Build bridges, drifts or culverts at strategic river crossing points.
Community programmes on development and maintenance of feeder roads.

56
3.3 Water supplies
Water sources in the settled areas are rivers, springs, dams and wetlands as shown in the table 28
below. The quality of the water varies from source to source as shown in table 29 below.
Table 28: Identified Key Water ResourcesWater
ResourceSURFACE WATER
RIVERS Springs Lakes Dams /reservoir WetlandsHill C/ment
Permanent(1) Athiriver
Seasonal1. Tiva2. Thua
Streams50 No
1.Mutitu2. Kiima3. Endau4.Mutha5. Kitho6. Musengo
N/A 150NO.Along rivers andstreams
1. Mutitu2. Kiia3.Mutitu4. Mutonguni5. Mutonguni6. Along rivers
GROUND WATERShallowWells
Borehole
200No. 100No
Table 29: Access to Safe Drinking WaterSOURCE PERCENTAGE REMARKS
Piped water/borehole
50% From borehole/ Masinga pipeline safest source
Springs
2% Piped and un piped sources. Threat to catchment
destruction. Irrigation accessible along river lines
River bed scooped wells 40% Pollution ,siltation
Dams
8% Prone to pollution
Key Environmental issues
Loss of vegetation cover around the water draw points
Spread of water borne diseases.
Pollution of the land
Loss of biodiversity near the water source (environmental degradation).

57
Proposed Interventions
Ensure that environmental impact Assessment/ Audit is done to assist in conserving and
protecting the area
Control pollution
Enforcement of relevant legislations and regulation
3.4 Sanitation
Safe sanitation includes the use of flush toilets (to sewer/septic tank), covered pit latrine and
ventilated improved pit (VIP) latrine for waste disposal. Unsafe sanitation includes the use of
pan/bucket, uncovered pit latrine and other “other” means of waste disposal. Unsafe sanitation also
includes households having no toilet since, in principle; the category includes use of the bush as a
means of waste disposal. Some aspects of sanitation in the district area as follows:
The urban centers in the District do not have sewerage facilities. Planning of these facilities
is considered to be important as population continues to increase and waste disposal is
increasingly becoming a challenge
Proportion of people with sanitation facilities 58%
Density Population of Kitui – 80 persons /Km2
Land area 20402sq km
Number of market with sewage system –none

58
Key Environmental Issues
Intestinal worms
Diarrhoea diseases
Skin infection
Eye infection
Malaria
Proposed intervention
improvement of sanitation
improved provision of water quality
3.5 Energy
3.5.1 Source of Energy Supply in the District
Firewood provide energy which is used by 90% of the rural households in Kitui for cooking, heating,
warming, lighting and is mainly sources from Agro forestry plots, trust land and gazetted forests.
Charcoal is a semi-refined wood fuel which is used by 34% of house hold in the district. However
charcoal is mainly used in urban center of which over 90% of the house hold use charcoal for cooking,
heating, ironing and come business. Source charcoal is private land, trust land, gazetted forest.
L.P.G (Liquid Petroleum Gas). There is low use of L.P.G in rural areas. However, L.P.G is used in hotel
industry in urban center and few individuals in town center for cooking and lighting. Kerosene- widely
used in urban population than in rural house hold for lighting and cooking about 95% of population use
Kerosene.
Electricity – locally produced from hydro-power Geo-thermal and oil source. Only 3.8% of households
in the district are connected electricity.
Key Environmental Impacts
loss of biodiversity,
soil erosion,
depletion of water catchment areas and the resultant
Increase in suspended particulate matters, they constitutes the indoors air pollutants affecting
particularly women and children.

59
The combustion of fossil fuels gives out large quantities of sulphur and nitrogen oxides, heavy metals
hydrocarbons, particulates and carbon monoxide.
3.5.2 Energy sector
Energy SectorThe district has immense potential for renewable energy sources while almost. The figures below show
energy situation in the district.
Biomass Energy Situation(a) Kitui District accessible Biomass Yield (Tons / Yr.)
Energy source Yield/Year
Closed forest - 342
Wood kind - 32,375
Bush land - 219,530
Wooded artisan - 3940
Grassland - 7
Farm land - 1,098,985
Plantation - Nil
Total wood (m3) - 1,365,178
Total wood (Tons) - 948,625
Wood waste - Nil
Total supply - 974,258
(b) Biomass Energy Balances (Tons / yrs)District demand - 1,011,745
Total Biomass supply - 974,528
Deficit - 37,488
% Deficit - 3.71%
Specific Biomass demandThe total fuel wood demand is over 421,115 tons, charcoal over 39,244 tons i.e. over 594,960 tons wood
fuels for charcoal per year. The rest are by farm residue of wood waste.

60
Key environmental issues in the energy sectorFirewoodFirewood widely used as a source of energy by many Kitui households. Over 90% of Kitui households
use firewood for various purposes including of cooking, heating, warming, lighting and house business.
The firewood mainly comes from three areas.
Agro forestry – includes boundary/ fences, crops lands, woodlots, roadside and neighbors.
Trust land – rangelands or common lands.
Gazetted forest – state owned lands forests
CharcoalCharcoal is a semi-refined wood fuel made by carbonization of wood in limited air. Recovery efficiency
in charcoal making for the best kilns is about 30% while in the traditional earth, kilns commonly used in
Kenya, recovery ranges from 10% to 20% indicating that considerable amount of energy is wasted.
However because charcoal does not smoke and it has twice calorific value per unit of wood, it is
convenient to use indoors and is thus preferred by many town dwellers. Use of charcoal as a source of
energy supply for cooking, heating, ironing etc constitutes 34% of households in Kitui district.
Farm Residue:
The most common crop residue being used in Kitui is maize cobs, stalks and sorghum stalks, millet,
cassava, beans and cotton. Despite the low calorific value, farm residue comprises an important fuel in
areas suffering fuel wood scarcity especially in poor households. Statistically 29% of rural households use
farm residue for cooking, water heating, ironing, lighting and home business.
Wood waste:This energy source includes timber off-cuts and rejects, wood shavings and saw dust from wood used in
construction and other industrial purposes. If not used on site the wood by product may be collected by
households for free or purchase at a small fee. The consumption in low it potential agro-ecological zones
e.g. Kitui is possibly a reflection of availability i.e. more tree plantations and saw mills occur in better
environment.
Kerosene:Kerosene is widely used by the urban population than in the rural households for lighting and cooking.
Presently 95% of rural households use kerosene. As with other petroleum – based fuels kerosene is
marketed by the multi-national oil companies and by smaller private companies. Unlike other petroleum
fuels however, there are numerous kerosene retailers who buy the kerosene for re-sell and consequently it
is available in most urban and rural areas.

61
L.P.G Liquid Petroleum Gas:There is a general low use of LPG in rural areas and therefore Kitui due to the low income per capita of
families. This is attributed to the high cost of LGP appliances (cylinders & cookers).
Electricity:Electricity is a versatile energy source locally produced from hydro-power, Geo-thermal and oil sources.
Nationally only 3.8% of households in rural areas have electricity. The limited access mainly due to the
high upfront costs of expanding the national grid and where accessible, the relatively high wiring costs
retail prices. In Kitui only paltry- or of the population have access to this energy source.
Solar:The solar energy use in Kitui is minimal though quite attractive. This potential has been impeded by
financial constraints and un-affordability and by lack of personnel to give maintenance and advice.
Biogas:The uptake of biogas has remained low in Kitui due to the high capital cost for not only the plant but
also the maintenance and management. Lack of adequate water supplies which is normally added in a
value between one and three parts water to one feedstock has been an impediment.
Batteries:Dry cell and vehicle batteries are also used at the household levels as sources of energy in Kitui. Mainly
they are used for flash lights, radio –cassette, players and clocks. The use of batteries is growing as
households in the low income brackets and generally in rural areas acquire electronic equipment.
Wind Energy:
The wind energy tried out is mainly for communal water supply. This source of energy is Under-
developed in Kitui. While infrastructure costs are high technical advances are expected to open new areas
to development.
Coal:
Coal in Kitui is a non-renewable energy source being mined for exploration to ascertain the quantity and
quality and in effect the economic benefits. The resource has been found to exist in a belt running from
Mui- Zombe to Mutito.
Mini/micro hydro systems:
The potential to use mini/micro hydro system of energy exist to especially pump water from dams and
rivers for irrigation purposes. This is a source which is not in use due to lack of perennial rivers in Kitui.

62
Factors Influencing Trend
The energy consumption pattern, demand and supply are determined by the needs of the various groups,
and individuals. It is therefore important to identify the energy needs which could be categorized into:-
End use – domestic end uses, agriculture post-harvest transport etc.
End user group – economic class, gender age etc. i.e. beneficiary
End user requirements – i.e. knowledge in operations of the different energy sources/
equipment.
Factors influencing generationThe main issues affecting availability, access and use of energy would therefore be:-
Fuel availability and constraints.
Alternative or competing uses of fuel.
Socio-economic status of end user.
The trends in energy distribution, spatial distribution and supply types are determined by:-
End user importance.
End user group – different priority for different groups.
End user requirement – technical requirements etc.
Availability.
Alternative competing fuels and
Institutional capabilities i.e. Dissemination, extension, credit, supports materials.
Regulatory and Institutional ArrangementThe efforts for sustainable energy supply and use may be exemplified by the establishment of Kitui
Energy center charged with the role of assisting community in mitigating measures, information and
training including dissemination of new and renewable sources of energy.
Management ChallengeDue to the increasing population the land use patterns have changed such that areas that were previously
left as trust lands i.e. range lands or common lands have been invaded by the communities in pursuit of
energy sources especially firewood and charcoal, most of these lands have now been grazed and trees
harvested leading to bare around which is very susceptible to environmental degradation.
The fact-that many regions of Kitui have not been demarcated also contributes negatively to the
establishment of agro forestry, tree nurseries and even wood-lots.

63
The commercialization of energy supply e.g. the use of Eucalypt is progressing well but mainly the tree is
being planted for poles and timber production with only off-cuts and saw-dust being used as a source of
wood fuel.
The unexploited and underutilized energy resources in Kitui include of solar, biogas, wind & coal. The
main reason for under development is the initial capital costs followed by the maintenance requirements.
Efforts in place to tap utilized energy sources include the ongoing coal exploration by the ministry of
energy in the Mui- Zombe, Mutito belt
Key environmental Issues
Soil erosion Greenhouse effect
Soil infertility increased
Indoor air pollution
Greenhouse effect
Low energy conversion which affects its use
Proposed Interventions
Proper management of indigenous trees to yield increased fuel wood products.
Promotion of commercial fuel wood plantations on large scale farms by private sector.
Strengths forestry on small scale farms throughout the district.
Improve the percentage of house hold using improved jikos (to 80%)
Increase the number of people using improved kuni mbili and other stores (49, to 15%)
Support exhibitions, seminar on improved cook stoves & jikos.
Efficiency of earth kiln to improve from 15% to 20% through intensive training of charcoal
producers.

64
CHAPTER FOUR
4.0 INDUSTRY, TRADE AND SERVICES
4.1 Industrial sector
Industries, Trade and services can benefit a lot by adapting environmental management systems that not
only address production process but also promote waste minimization.
The sector, particularly trade contributes significantly to the income generated in the district. The growth
of industries in the district will provide employment opportunities to the local people thus leading to
increased incomes. The agro based industries will provide ready markets for locally available raw
materials. The district has mineral deposits such as coal, which are not exploited. Once exploited, they
will be a source of the income to the district and hence sustain economic growth.
The Jua Kali sub-sector will provide employment and cheap agricultural inputs. The major stakeholders
in the sector include the government, private sector NGOS and CBO’s. The government will continue to
provide enabling environment, especially for the private sector to conduct business both in industry and
trade, NGO’s CBO other stakeholders will provide entrepreneurial skills. Other stakeholders will
facilitate in providing infrastructure and financial services
Table 17 Type and Trends in Industrial DevelopmentNo Type of industry 1991-1995 1996-
20002001-2005
Projectionsfor 2010
Remarks
1 Kitui Ginnery 1 1 1 1 Fluctuation of raw
material and market is
the hindering factor.
Poor infrastructures
development
Source: District Trade Office -2006
4.2 Trade sector
The sector particularly trade contributes significantly to the income generated in the district. The growth
in the district provides employment opportunities to the local people thus leading to increased incomes.
The trading patterns in the district revolve around trading in agro-based goods and other products from
the informal sector which includes activities such as carpentry, masonry, mat making, tailoring, shoe
shining and bicycle repairs

65
4.2.1 Types of trade in the district
Retail , whole sale butcheries, bar/restaurants hair salon, carpentry, posh mill , blacksmith dealers hide
/skin private health providers agro-vet services pharmaceutical services, Jua kali, mineral exploration and
exploitation ,provision of credit facilities telecommunication services hotels and lodging services
4.2.2 Trends and trading patterns
The trade in agro-based products will continue to provide ready markets for locally available raw-
materials, while jua-kali sub sector will continue to provide employment and cheap agricultural inputs
luck of proper marketing strategies coped by lack of credit facilities and high interest rates, poor
infrastructure will hinder manful development of small scale industries and trade.
Key Environmental Impact
Improper disposal of garbage resulting pollution of land and water
Transportation services lead to air pollution or land and water
Destruction of ecosystem due to logging of valuable and endangered species( Mellia volkensii and
Osyris lanceolata.)
Deforestation ,soil erosion, air, noise and water pollution
Dumping of substandard goods.
Table 18: Type and Impact of Trade on Environment
No Type of trade Raw
materials
Product No. of
people
employed
Wastes
(solid,
liquid
and
gaseou
s
Key
environme
ntal
impacts
Mitigation
measures
Food
preparation
Farm
products
Charcoal
Gas
Food Many All Air
pollution
Land
Proper
disposal
and proper
managemen
t
Source: District Public Health Office 2006

66
Table 19 Type of Trade and Impact on Environment
Type of tradeLinkages (impacts) to environmentaldegradation
Proposed interventions
Retail wholesale Production of solid waste e.g. polythene
bags & waste papers
Provide container to keep waste generated
Patrol filling
station
Spillage of oil, water and a mission of
bad smell production of used containers
tins and plastic bags etc
Ensure that these facilities are subjected to
environmental impact assessment/Audit
Hotels ,
butcheries lodging Bones , waste water ash , food remains,
waste papers , smell, etc
Ensure that they have proper soak pit & septic
tanks as per Public Health Act & building code
Groceries & farm
produces
Agricultural waste e.g. rotten cabbage,
kales and banana leafs spoil farm
produce
Encourage recycling of waste to generate
organic fertilizer manure
Transport posh
mill jua kali sector
Emission of gas, oil spillage, noise
pollution production of non-bio-
degradable metallic materials.
Proper compliance of safety & hygiene &
Environmental regulations
Wood curving
charcoal business
Threaten extinction of tree speciesLoss of biodiversityDeforestation
Enforcement of forest law, afforestation to be
enhanced, alternative source of IGA
Source: Public Health -2006
4.3 Services sector
The services sector plays an important role in creating and supporting an enabling environment that
facilitates private sector investment, growth and job creation. The provision of adequate services, coupled
with macroeconomic stability and long-term development strategy, are essential preconditions for
sustainable economic and social development. The sector also greatly contributes to the degradation of
the district’s environment. Though the roads are in moderate to poor condition, they serve as a channel
for transporting natural resources from the district, both legally acquired and contraband. Runoff water
from the roads causes erosion as it finds the natural course to watercourses. Servicing of vehicles that ply
these roads results to oils and grease polluting our soils and water
Major Service Sectors in the DistrictEnergy House hold with electricity connection - 0.4%
Town (trading centers) with electricity Connection - 24%
Transport facilities Total kilometer of roads - 1867km

67
Bitumen standard roads - 62.2km
Gravel - 1137.5km
Number of airstrips - 2
Education facilities Pre-primary school - 789
Primary school - 627
Secondary school - 90
Main training institution
Polytechnic - 36
Medical training school – 1
Health facilities
They are 182 in totalCommunications Mobile coverage (safaricom &Zain) - 2
Posts /sub post 16
Trade Commerce and Industry Registered hotels restaurants - 433
Petrol filling station - 5
Banking & Financial services Banks - 3
Micro-finance institution - 4
Insurance broker – 3
Table 20: Services Sector Linkages to Environmental Degradation
ServicesLinkages (impacts) toenvironmental degradation
Proposed interventions Remarks
Transport andcommunication
Emissions of hydrocarbons carbonmonoxide oxides of nitrogen andparticulate matter radioactive rays e-pollutantsDisposal of rechargeable batteriesDisposal of the mobile phonescratch cards
Research to come up withproper disposal method/encourage adaptation ofcleaner productiontechnology
Disposal of mobilescratch cards &used batteries iscausing majorconcern in thedistrict
Hospitalityservices (lodges &hotels )
Production of waste water in theenvironment polythene bagscondoms, noise pollution generationof waste both solid and effluent inthe environment
Proper design of buildingand provision of adequatefacilities to handle thewaste generated
Generally thedevelopers don’tfollow thedevelopment planthus result failure to

68
provide essentialfacilities like soakpit or idea septictank
Health facilities Presence of sharps used linenexpired drugs laboratory wasteddetergent & soap packaging material, smudgeChemical plasticsRadioactive waste dischargeemission of air pollutant in anappropriate ground disposal ofwaste
Construction of wastedisposal. Use of cleanproduction technology.
Management of thehazardous waste isvery important
Source: District Environment Office – 2005 State of Environment
Key Environmental issues
Solid waste management
Lack of capital to start industries such as honey, processing capacity building small scale trade
Proposed intervention
Collection & disposal of waste
Provision of appropriate infrastructures,
establishment of Agro-based industries,
Create enabling environment,
Provision of credit facilities
Establishment of district loan bond
4.4 Tourism
4.4.1 Type of Tourism, Attraction and Potential
Unlike the other districts in the republic of Kenya, Kitui district is very potential in Wildlife conservation
for tourism. Kitui South National Reserve is not fully utilized though very potential full of all wild species
needed by tourists. The south Kitui National Reserve (SKNR) borders Tsavo East National Park
(TENP) and acts as its dispersal area in the dry season seasonal migrations from T.E.N.P into the SKNR
in the dry season are said to have reduced in volume largely due to insecurity over years. It is therefore an
important ecosystem to the conservation effort of the Tsavo.
The Biodiversity conservation impact in the larger ecosystem likely to be achieved is high. This is so
owing to the large size of the reserve i.e. 1833km2 Kitui district is among the poorest district in the

69
country and any interaction of its people with environment has resulted to massive environmental
degradation due to unsustainable resource used use practices either for subsistence or commercial
reasons. Sustainable resource use practice and the need to introduce poverty alleviation strategies dictate
that such a resource be utilized to improve the livelihoods of the community through employment,
benefits sharing and introduction of sustainable income generating activities.
The reserve also unique scenery such as rock outcrops planar topography and unique river line vegetation
amidst dry land shrubs.
4.4.2 Types of Tourism attraction and potential
Kitui District has 6 potential conservation sites covering almost of the district land area with large variety
of animals, plants and unique land forms. However the potential of these sites is not fully achieved due to
lack of development and implementation of integrated management plan and this has over the year’s
resulted to rampant wildlife habitat degradation, poaching, logging, overgrazing and encroachment. Types
of tourism attractions are elaborated in the table 40 below.
Table 21: Types of TourismNo Type of tourism No. of facilities Geographical location
1 Forest nature
walking
Mutomo plant sanctuary,
KyaweaMuseve ,Endau Kabonge , Mululina
Mutha hills
Mutitu , Mutha and central
divisions
2 Wildlife safari South Kitui national reserve not fully developed Ikutha division
3 Cultural tourism Nzambani, ikutha , Mutomo Mutha and Mutitu Chuluni Division
Mutomo division
4 Hiking , camping
trails
Nzambani Rock, Thatha hills , Endau hills ,
Mutitu
Central division
Mutha division ,Mutitu
5 Private ranches
tourism
Kanyonyo , Nziu Kilawa Yatta division
Mutitu Division
Source: County Council of Kitui -2006
4.4.3 Trends in Tourism Attraction
Kitui South National Reserve (KSNR) the site is not well development and very few visitors come to the
area. The sites are as follows:
Mutomo Plant Sanctuary: This is very strategically positioned for cultural center activities. It can be the
center for all curving of K.S.N.R traditional dancer if opening and development of tourism infrastructure
with K.S.N.R for tourism is done.

70
Nzambani Rock: Can be turned camp site, rock climbing, and tourists if the Kitui south National
reserves is developed.
Kanyonyoo Ranching area: This place has high potential for tourists and visitors as well as for game
drive for visitors from Thika, Embu, Nairobi, Isiolo, Meru Mwingi and Garissa. The ranch has very many
species of wildlife and more can be Tran located to the area if need be slighting that if road from
Kangonde to Kibwezi is tarmac many people will be using this road and might stop for wildlife (Game
drive).
Thatha hill camping site: This can be viable for visitors and tourists on transit to Mt Kenya region.
Other ranches: Kanyonyoo, Nziu in Mutitu, Kilawa Ngali Kanziku, Ngunyumu many of these ranches
bounder the reserve beside kilawa and kanyonyoo. These can be turned to private sanctuaries some act as
dispersal areas of wildlife species.
Key Environmental Issues
Encroachment by human settlement. Settlements in the reserve occur on the lower parts of
the reserve to the north at Mililani and Enyali and North West at Kyeni. This is attributed to
availability of water from Thua river which traverses east to west of the reserve.
Over grazing and the advancement of desert conditions The depletion of ground cover in
the northern and north east regions is so high that the drastic changes in biodiversity is evidence
of progressive and desert situation. Also vegetation clearing along the river banks has been made
to create land for subsistence farming.
Unsustainable natural resources use practices: Kitui district with absolute poverty and food
scarcity at 64.9% and 63.3% gives it the lowest per capital income. The harsh climatic conditions
in the district sometimes translate to prolonged drought and there by famine.
The reserve has such served as a source of food timber, fuel and other non-timber forests by
products such as honey .This created an open access regime in the reserve where the extraction
of resource is highly unsustainable with the resultant heightened destruction of wildlife habitat
loss of biodiversity and desertification.
Subsistence and Commercial Poaching There exists both small scale (subsistence and
commercial poaching in the area commercialization of the traditional subsistence hunting has
dealt a crippling blow to traditional Kamba wildlife management system.

71
Proposed intervention
Preparation of an integrated management plan
Undertake resource mapping of the reserve
Enrichment planting of both grass & fodder trees
Intensify introduction of reliable grass and tree spp also to improve animal breed
4.5. Mining and quarrying
4.5.1 Types of Minerals and Method of Extraction
Mining is an activity that involves excavation of the earth’s surface and subsurface for the purpose of
exploiting and processing minerals for economic and industrial development. Types of mining include
underground and cast methods. Informer, vertical, inclined or horizontal methods of excavation and
extraction are involved. The open cast method involves open quarries pits and trenches. Some of the
minerals currently being mined in Kitui district are vermiculite, gypsum, limestone magnetite and various
gemstones including green garnet, sapphire and ruby. Exploration for coal in the Mui basin has been in
progress. Several companies are involved in quarrying and sand harvesting. Quarrying materials are used
for ballast aggregate and building stones. Minerals being exploited include sand and limestone.
4.5 2 Sand harvesting and quarrying
Sand harvesting is carried out under the authority and permission of municipal council of Kitui and Kitui
county council. It pays very little respect to environmental aspects. The activity continuous to expand due
to increased demand for construction raw materials discussed quarries and mines are often left un-
rehabilitated and thus unsafe to inhabitants and animals living around (Timboni case).
Table 22: Types of minerals and methods of extractionNo Type of mineral Method of
miningLand tenureown ship
Geographicallocation/Name ofmine
Size ofquantitymine ha
Wasteproduct
1 Lime stone Open cast Lease Kenze - Dust soil2 Gemstone Open cast
methodIndividual Kavovoni - -do-
3 Iron ore Undergroundhorizontal
Lease Kenze Timboni-
Dust stonesoil.
Source: District Environment Office- 2004

72
Table 23: Trends in Extent of MinesType of
mineral1991 -1995 1996-2000 2001-2005 Projection for
2010Mitigationmeasure
Iron ore A trench ofmore than 1km notrehabilitate
A trench of more than onekilometer not rehabilitated
A trench of morethan 1 km remainun rehabilitated
Remain the sameRestoration orderis required
Limestone 4 acres remainun rehabilitated
Same size More size due tomining is stillgoing on
Enforcecompliant withEMCA throughEIA&EA
Gemstone Done byindividual andhard to quantitythe extend
More size due tomining is stillgoing on
Consult MinegeologyDepartment toensurecompliant.
Source: District Environment Office – 2004 State of Environment Report
Key environmental issues in mining sector
Losses of biodiversity
Noise and airborne dust emission
Dust pollution land scars soil and water contamination from mined area
Increased soil erosion
Damage to wildlife habitant
Remove of vegetation
4.5.3 Regulatory and institutional arrangement
Mining activities are regulated by the mining Act (1987) the forest Act (385) the wildlife Conservation
and management Act and EMCA. The mining Act is silent on what should be done with abandoned
mines. But EMCA emphasizes that all new mining projects should be subjected to environmental impact
assessment (EIA’S) while ongoing projects should undergo environmental audit local authority and
municipal council should be involved in enforcing safe sand harvesting quarrying and all minerals or
materials covered by their licenses .

73
4.5.4 Sand Harvesting
Sand harvesting is carried out under authority and permission of various local government authorities. It
pays little respect to environmental aspects.
Sand harvesting along the rivers has degraded the environment by lowering the riverbed, steepening and
destabilizing riverbanks thereby causing erosion and river channel wandering Besides it is expected that
the environmental degradation in form of bed load. Some of the impacts of sand harvesting are noted in
the table 43 below.
Table 24: Methods of Sand ExtractionSource ofsand
Method ofsandharvesting
Geographicallocation/nameof site
Size of site Quantityextractedannual
Regulatoryagency
Environmentalimpacts
River Manualscooping
River Kalundu 2.5-3.km2 5,000 tones Municipalcouncil
River bank erosionLoss of water
River Manualscooping
River Nzeeu 0.1-0.6km2 7560 Municipalcouncil
Water pollution bysoil Drying ofswallow wellsRiver bank erosion
River Manualscoopingmechanicalscooping
River Tiva 0.01-0.1km2 7560 Municipalcouncil
Drying of watersourceBank erosion soilerosion
River Manualscooping
River Mutendea -- 7560 -- Drying of watersourceSoil erosionRiver bank erosion
River Manualscooping
RiverMwitasyano
-- 7560 CountyCouncil
-do-
River Scooping River Kauwi -- 7560 -do-
Source: Kitui County Council – 2006
4.5.5 Trends in sand harvesting
Building sand is the major material found in abundance and is exploited on commercial basis.

74
The major sand harvesting sites are Nzeeu , Kalundu, Tiva , Mwitasyano, Mutendea, Kaayo and Kauwi
rivers within and surrounding municipal council of Kitui . Many other smaller sites are widespread
throughout the district.
Generally the trend of sand harvesting within Kitui district is carried out under the authority and
permission of local councils and they do not have any environmental management plan,
This business of commercialized sand harvesting has degraded the environment and threatening the
existing infrastructures within our major roads.
Environmental Issues
Land degradation
reduced water supply,
river bank erosion
soil erosion
Proposed intervention
Determine sand harvesting sites
Develop regulations to ensure no over harvesting
Regulate harvesting of sand

75
CHAPTER FIVE
5. 0 ENVIRONMENTAL HAZARDS AND DISASTERS
5.1 Introduction
Most environmental disasters are climate weather and tectonic movements related disasters can be
natural or manmade which my lead to destruction of environment (land degradation) life (epidemics and
property). The causes are invader species, droughts, accidents, fire, diseases outbreaks, technological,
disaster and other disasters. Disasters have a tendency to retard and erode gains made in building
meaningful livelihood and economic development. Kitui district is very vulnerable to various hazards and
these have had far-reaching application to development. The major hazards faced in the district include
the following-
Drought
Kitui District being and semi-arid are is prone to frequent and prolonged droughts. The end results are
crop failure and lack of pasture for livestock thus treachery food security efforts. Water catchment areas
and sources dry up meaning people have to spend longer man hours looking for water. Water borne
diseases outbreaks are quite common during such times because of use of contaminated water. Land
degradation is usually made worse due to lack vegetative cover.
Floods
A greater part of the district particularly the eastern and central parts are low lying making them
vulnerable to flooding during heavy rains. These results in earth roads becoming impassable and outbreak
of diseases both human and livestock and soil erosion.
Forest fires
These are either accidental or caused by farmers while clearing the farms and trust lands. The problem is
compounded by uncontrolled charcoal burning and overgrazing in private farms and country council
forests. The effects of these hazards have compounded the problem of destruction of indigenous forests
particularly on hilltops loss of water catchments are and serious soil erosion in deforested areas.

76
HIV/AIDS
The government of Kenya has declared the HIV/AIDS pandemic as a national disaster. The prevalence
of HIV/AIDS has increased rapidly in the district. Urban centers have in the past reported the highest
infection rates as compared to rural. Currently the number of HIV/AIDS orphans is over 3000 while the
number of people who have tested positive for HIV is daily increasing. The disease has weakened the
economically productive population. The most affected age group is between 15 and 49 who constitute
the majority of the work force.
The scourge has contributed significantly to high incidences of poverty.
5.2 Extend and trends of environmental hazards and disasters
The common environmental hazards and disasters are as follows:
Drought
Land degradation and denudation as a result of de-vegetation and overstocking
Loss of pasture on grazing lands
Disease epidemics e.g. New Castle Disease (NCD) in poultry, Foot and Mouth Disease,
Contagious Bovine Pleural-pneumonia (CBPP) in Bovines and Contagious Caprine Pleuro-
pneumonia (CCPP) in Goat
The tables 44, 45 and 46 show some aspects of hazards in the district.
Table 25 : Type of Hazards and Occurrence trends 1960 to 2005Year 1960s 1970s 1980s 1990s 2000
s2005 Remarks
Disaster type
Drought 1961 1974 1984 1994 N/A 2005The trend has shown an occurrenceof drought after every five years
LandDegradation
This hasbeen on theincrease - - - -
This has been on the increase dueoverstocking and de-vegetation(Charcoal Burning and opening up ofland for arable farming)
LanddenudationHIV/AID lossof Pasture
The impactis on theincrease
- - - - -
This has been on the increase dueoverstocking and de-vegetation(Charcoal Burning and opening up ofland for arable farming)

77
Table 26 Type of Disasters and their ImpactsYear 1960s 1970s 1980s 1990s 2000s 2005 Remarks
Drought1961 (severe) 1974
(severe)1984(verysevere)
1990Moderate - 2005
The 2000s droughtshave not had a bigimpact on livestock
Landdegradation
Poor qualitypasture andfodder.
- - - - -The impact of landdegradation willcontinue being felt notunless correctivemeasures are put inplace
HIV/AID &landdenudation
The impact ison the increasedue tooverstocking
- - - - -There is need for Soiland Waterconservationprogrammes
Table 27 Sector Specific Disaster Occurrence and SeverityType ofdisaster
Number ofdeaths/injured
EnvironmentalDamage
Severity Interventions Remarks
Drought
No records are
available on the
number of animals
that died
Deforestation
gully format.
Loss of
biodiversity
The 1974 and
1984 droughts
were very severe
to both livestock
and humans in
the district
Promotion of
drought tolerant
pasture and fodder
species, Water
harvesting
technologies, range
rehabilitation
practices
There is need
to introduce
drought
monitoring
systems and
build the
capacity of the
technical staff
on the ground
as well as the
community
Land
Degradation
No records are
available on the
number of animals
that died
Loss of pasture,
Siltation of dams,
Gully formation,
denuded land
The severity of
land degradation
has been on
increase
Range rehabilitation
programmes, Soil
and water
conservation
programmes and
de-stocking of
livestock
There is need
for initiating
income
generating
activities so as
to divert
people from
charcoal
burning which

78
Type ofdisaster
Number ofdeaths/injured
EnvironmentalDamage
Severity Interventions Remarks
has turned out
to be a way of
life for the
majority of
people in the
lower area of
the district
Land
denudation
/desertificati
on
No records are
available on the
number of animals
that died
Loss of
biodiversity
The severity of
soil erosion has
been on increase
Range rehabilitation
programmes, Soil
and water
conservation
programmes and
de-stocking of
livestock
Reinforcement
of policies
related farming
methods and
indiscriminate
felling of trees
needs to be
enhanced.
Source: Participatory Appraisal Reports for Itoleka and Katulani Sub-locations
Status of Early Warning SystemsDetails of the early warning systems in the district are shown in the table 47 below.
Table 28 Sector Capacities for Disaster Preparedness and ResponseType ofDisaster
HumanResource
TechnicalEquipment
Financial Coordinating Mechanism(Logistics)
Lead Agency
Drought Inadequate None Inadequate Stakeholder Forums, FieldMonitors and Questionnaires
Office of the President(Arid Lands ResourceManagement Project)
LandDegradation
Inadequate Inadequate Inadequate Community Sensitizationthrough training of farmersand community resourcepersons, Public barazas, fielddemonstrations.
Ministry of Agricultureand Ministry ofLivestock and FisheriesDevelopment and otherDevelopment agenciesoperating within thedistrict

79
Soil Erosion Inadequate Inadequate Inadequate Community Sensitizationthrough training of farmersand community resourcepersons, Public barazas, fielddemonstrations
Ministry of Agricultureand Ministry ofLivestock and FisheriesDevelopment and otherDevelopment agenciesoperating within thedistrict
Source: District Development Office -HIV/Aid sections 2006
Environmental Issues Drought
Land Degradation
Land denudation (desertification)
Enhanced poverty
Proposed Interventions Relief food and livestock feed (hay) Distribution.
Restocking
Sensitization on sustainable utilization of environmental resources e.g. proper stocking rates
Development of water points,, and Sustainable tree harvesting
Range rehabilitation Practices, Fodder tree planting and Community sensitization
Sensitization on sustainable utilization of environmental resources e.g. proper stocking rates and
Sustainable tree harvesting
Training of community and community Resource persons and Laying of Soil Conservation
Structures ,Reseeding, Campaign on proper stocking rates
Enhancing Policy Reinforcement and Sensitizing Community on proper utilization of
environmental resources

80
CHAPTER SIX
6.0 ENVIRONMENTAL EDUCATION, INFORMATION AND TECHNOLOGY
6.1 Status of Environmental Education
There is both formal and non-formal environmental education in the district. Formal education is mostly
done in schools and through NGOs mainly engaged in agro-forestry activities with the communities
under their training. Non formal type is mostly cultural and relates to flood control and activities that
affect their livelihood such as food production and fishing – the need to protect breeding grounds
The types of environmental programmes in the district include;
Eco -Schools
Wildlife Clubs
4K Clubs
Environmental Awareness and Management Project for Schools
Types of environmental educationThere exists different form of environmental education in the District. These include tree planting
afforestation) tree labeling, beekeeping tree nursery establishment and management, soil & water
conservation (Horticulture & animal husbandry) flower garden and rabbit keeping, fish rearing, and
drama and arts. Exchange visit and ecotourism are another form of this aspect of environmental
education.
Challenges schools face in implementing environment projectsSchools face various problems in implementing environmental projects in schools (table 48 below). Such
problems are as follows:-
Lack of water: Kitui is a semi-arid district where water is a major problem. Most schools do not
have boreholes and water harvesting facilities. So to establish a tree planting projects is a
challenge to many schools. Pupils are forced to carry water from their homes.
Lack of tools: Working tools is also another challenge because schools do not have the tools to
implement some of the conservation activities
Lack of enough time: School programmes are so tight such that time allocated to clubs is very
little.

81
Lack of funds: Some projects require funds to be implemented e.g. bee keeping project .So to
undertake such projects is a challenge to students because they do not have money.
Lack of support from institutions: In same schools the head teachers do not support the
efforts of students hence kill their morale. Students need to be supported financially and
materially.
Guiding materials: Other projects require guiding materials to be implemented more effectively.
Lacks of these materials have resulted to poor implementation and management of the projects.
Lack of incentives: Student’s morale needs to be boosted, this will encourage them to work
harder Stakeholder should come with prize giving programme for the clubs.
Proposed Interventions
Support its members (Environmental clubs) with technical expertise on how to carry out theprojects in schools
Encouraging them to start water harvesting techniques by building gabions, roof catchments andwater tanks
Provide them with guiding materials, (guide books) on environmental projects organizeeducational tours
Table 29: Status of Environmental Programmes in SchoolsNo No. schools
PrimarySecondary Tertiary Types of environmental
programmesRemarks
66 - 4k club fruit tree nurseriesvegetable growing rearing ofsmall stockTree planting
4k clubs have become dormant andother dropped out due to lack of fundsand limited transport-Water problems in most schools
28 8 Young farmers club most ofinstitution take agriculture asa course offered in theircurriculumThese project improve soilfertility and conserve waterand soil management
Inadequate security of the project undertaken by the clubs Funds and transportare the major limitation for rural youth
Young farmers clubsSource: District Education Office2006
The environmental topics taught in schools and tertiary institutions enhance awareness on the
importance of sustainability of the environmental and USE OF natural resources to the learners, and
enlisting public support toward environmental management and prevention or abatement of
environmental degradation. This is mainly achieved through undertaken practical work on forestation
programme, agriculture, participation of learners in environmental commemoration day’s barazas

82
sensitization and public holidays. The knowledge acquired during school and College (training time) is
also applied practically by the students and pupil when they complete their studies.
Tree nursery started in their institution also produces tree seedlings which are planted in their
institutional compound and the rest given to pupils / student to plant at their home. These enhance
afforestation in the district.
6.1.1 The non- formal education programmes
The non- normal education programmes in the district are registered with the department of culture and
social service. They are also known as farmers field school (FFS) depending on objective of the groups.
Both FFS and SHG) are formed in order to reach large crowd at minimal cost while the subjects taught
are done in a systematic manner. The key players in no-formal environmental programmes in the district
include the government of Kenya bilateral organization (JICA, Belgium, Danida and KAP) and also some
NGO’S and CBO’S are involved in non-formal environmental programme together with community.
Various environmental issues have being integrated in non-formal programmes and basically includes
agro forestry and agro-pastoralist also Beekeeping environmental health (sanitation & hygiene) groups
dynamics which will assist the community to manage resource effectively and efficiently
(Management Committees e.g. water source and supplies)
Benefits of non-formal programmes
Improving the capacity of people to address environment and development issues.
Promote sustainable development
Educate and enhance public awareness
Assist the people to meet their basic needs as well as alleviate poverty.
Main Conservation Activities
Afforestation Programmes within government, trust land and private and individual farms
Training of farmers on better farming skills and organize gender awareness campaigns
Train farmers on improved water harvesting techniques and improved farm water harvesting
techniques
Training of more health workers as TBA& family planning HIV AID home cares thus improving
health services delivery mechanism to rural areas
Initiative income generating activities to cater for the needs of disadvantages group or gender.
(Aged, HIV/AIDS victims and Aids orphans

83
Table 30: Status of Environmental Programmes in the DistrictEnvironmental
ProgrammesKey players Challenges Proposed interventions
Soil conservation,fertility managementand run-off harvestingconservation, throughfarmers Field Schools(FFS)
Agriculture dept Kituidevelopment center ,AdraKenya KARI Catholicdiocese of Kitui
Acute staff shortage , the unreliablerainfall and occasional droughtThe level of funding affectfacilitation of planned activitiesLow literacy level among thecommunityPoverty level
Promote private sector serviceprovider e.g. terrace markers,grafters, A.H.C.APromote effective use of ox-ploughPromote agro forestryUse of farmers field schools (FFS)as extension method
Energy efficienttechnologies
Forest deptRenewable energy centre,Kenya forestry researchcentre agriculturedepartment
The adaptation rate is very lowThe cost to acquire the materialPoverty levelCultural value of the tradition fireplaceLimitation of extension staff &funds
Demonstration on use of fueleconomy stove fireless cookers ,charcoal coolersTraining of local artisan to producethe stove and fireless cookersEncourage use of other energysource
Health and sanitation Amref , public healthdepartment waterdepartment , agriculture
Limitation of human resources andfinanceIgnoranceHigh poverty level
Training farmers on how to makedish racks, rubbish and VIPLatrine
Community capacitybuilding
Ukambani Christiancommunity based servicesNEMA provincialadministration otherstakeholders
Low level of awareness onenvironmental issues,Low literacy level, poverty
Farmer Associations(Kitui Dairy GoatFarmers Associationand Kitui BeekeepersAssociation
Community, GoK, FARMAfrica, Kitui AgriculturalProject (KAP), KituiDevelopment Centre andAgri-businessDevelopment (ABD)
Funding, Infrastructure, Transportand Personnel
Encouraging Group approach inTechnology Dissemination
Source: District Development Office -2006
6.2 Technologies
6.2.1 Traditional Water Filter
To improve the quality of the drinking water a simple bucket water filter that utilizes stones, gravel
charcoal and sand to eliminate most impurities is used. This combined with boiling of the filtered water
renders water safe for drink.

84
6.2.2 Improved Cooking Stove
Fuel conservation in the dry area remains an important strategy of preserving ever decreasing natural
wood resources. An improved cooking stove” Enzaro Jiko” has been promoted among homesteads in
Kitui.
One disadvantage of Enzaro Jiko does not promote the Social aspect of story felling in the evening,
which was an important past time activity of passing information from one generation to the other as
people warm themselves.
6.2.3 Water Micro-Catchment
Water harvesting structures such as Micro-catchment enhance the performance of trees by collecting
surface run-off and concentrating it around the roof zone of planted trees. There are different types of
Micro-catchments V. shaped, W-shape, Circular shaped catchment and bottle watering basically used
during drought when it is necessary to water some young trees to ensure survival.
Evaporative charcoal cooler
High temperature leads to reduce shelf life of perishable food staff in the dry land. A simple charcoal
cooler has been used effectively to reduce the temperature considerably thus increasing the self-life of
perishable commodities.
Tumbukiza
This is a system of fodder establishment especially, Napier grass where several splits of cane are planted
in round pits measuring 2* 2 feet or rectangular pits of 2*2*2 feet or furrows 2-3 feet wide and 2 feet
deep. It is most suitable in low to medium attitude areas where moisture stress often limits Napier
growth.
Introduction of improved breeds of livestock
This refers to the introduction of improved breeds of livestock such as the dairy cows and goats that are
more productive and require more intensive management in terms of housing, feeding and diseases
control aspects. Such animals are kept under Zero grazing units and under cut and carry method of
feeding thus limiting their movement into the field where they would otherwise cause gullies along the
trucks to the watering points and also loosen the soil encouraging soil erosion.

85
Range rehabilitation techniques
This is an integration of several activities in rehabilitation of denude lands. It involves bush clearing,
construction of soil and water conservation structures and reseeding.
Water harvesting techniques
Example of this is the Semi-circular bunds which are diamond shaped Micro-catchments enclosed by
small earth bunds, with infiltration pit at the lower corner. They are most preferred as they trap runoff
water that would be lost and increase moisture storage in the soil.
Terraces
The normal Fanya Juu terraces that are meant for soil and water conservation on both farm and range
lands they are meant for soil and water conservation.
Zai Pit (planting holes)
These are the planting holes commonly practiced in fruit tree and fodder tree production. They are
Micro-catchments for runoff harvesting and conservation.
Modern Langstroth beehives
These are box kind of hives that can be utilized in migratory beekeeping systems to assist in crop
pollination process, hence increase in crop yields. Bees in Langstroth are more docile due to the increased
frequency of farmer visits. The management aspects i.e. watering and supplementation feeding are easily
executed, hence making them more docile to the surrounding. Planting of drought resistant pasture and
fodder that would do perform better in the district and enhance soil and water conservation within
grazing lands.
Table 31: Priority Issues and InterventionsPrioritized issues/
challengesProposed intervention Responsible
institutionRemarks Estimate coast
An awareness creation Hold awareness Barazaworkshops to sensitizecommunity onenvironmental conservation
Districtenvironmentoffice, culture andsocial servicesand adulteducation offices
this will ensure peopleat grass root level areinvolved in environmetal managements
10 workshop at acost 50,00/=total500,000 /=

86
Prioritized issues/challenges
Proposed intervention Responsibleinstitution
Remarks Estimate coast
Capacity building offield officer e.g. CDASAdult education teachersofficials of C.B.Osgroups herbalists andbotanist organizations
Enhance Capacity buildingworkshops onenvironmental conservationand management
Environment,culture, socialservices, adulteducation
This will enhance theperformance of thestaff on the ground onthe issues ofenvironment
5 capacitybuildingworkshop at acost 50,000/=total 250,000
Documentation ofindigenous knowledgeavailable in the districtfor dissemination to thepublic to enhanceenvironmentalmanagement
Data collection on IKData analysis and storageData dissemination
D.E.O and thedistrict culturalofficer
This will provide themuch neededindigenousinformation onenvironmentalconservation
250,000/=
Promotion ofindigenous food plansfor food security
Sensitize the public onproduction preservation andconsumption of indigenousfood plants and herbs forfood security
D.E.O &department ofculture,Agriculture andLivestock
This will alleviate theconstant foodshortage situation inthe district throughthe increased use ofdrought resistant foodcrops
Yearlysensitization at acost 50,000/=per year.
Source: Culture Department - 2006

87
6.3 Environmental information systems
6.3.1 Types and sources of environmental information
The table 51 below gives details of the types and forms of environmental information in the district and
its accessibility.
Table 51: Information and Data types in DistrictSector Type
information/types
Form GIS/maps/reports/electronically,book)
Institutions Accessconditions/ policy
Users System of updating
Livestock
& Vet
Livestock statistics
range trend and
conditions livestock
marketing
Reports prints Livestock
office
Free of
charge
G.O.K staff
community and
other development
agency
Monthly
Quarterly and
annual
Agr Crop statistics
arable land trend
and condition
Reports Agriculture
Office KARI
Free of
charge
G.O.K
Staff Community
and other
development agency
Monthly
Quarterly and
annual
D.P.U Projects
programmes &
plans
Maps
Books
Magazines
Newsletter,
pamphlets
District
Documentatio
n
And
information
Centre
D.D.O
Free of
charge
G.O.K Staff,
Community
development
partners
Projects
Reports
Quarterly
Annual
Magazine/New
letter
Natural
resources
statistics
trends &
condition
Natural resource
statistics trends &
conditions
Reports Videos
Print CDS
Electronic
Pamphlets
District forest
office
ALRMP II
Office
KEFRI-Kitui
Free of
charge
G.O.K
Staff
Community
development
agencies
Review report
Quarterly
Monthly
Annual
Source: District Plan Unit – 2006
6.3.2 Status of Environmental Information Management Systems
Information sharing and communication mechanism is an important aspect of information management.
In the district after some evaluation carried out late 1990’s it was realized that the district technology
transfer and information mechanism was inadequate especially among the G.O.K, NGO’S, C.B.OS and

88
other development agencies in the district. Therefore though dept of planning, Danida embark on
establishing District information and documentation centre (DIDC) . This office is manage by a staff
from planning department although it is not adequate stocked due to lack of find to acquire necessary
materials
The objectives of the DIDC
Develop and implement information flow /communication systems plan
Enhance corporate communications and public relations
Enhance information management for research and extension at district level.
Institutional skills in information management
No adequate staff that is versed information management
The information is not frequently updated
Constraints in data collection and dissemination
In adequate funding
In adequate co-ordination in information by the various stakeholder agencies at district level
Inability to access information from other source (electronic)
Proposed interventions
Increase funding for information management and data collection systems
Joint data collection and management ventures
Frequent information exchange at the district level.
Improve access systems telephone infrastructure and efficiency.
6.4 Indigenous knowledge (IK)
Kitui district is very rich in indigenous knowledge especially on traditional herbs and medicine. `
Traditional carving and wood work, traditional weaving and basketry and knowledge on plant and tree
names, rivers, shrines and languages in general. The department has been promoting this knowledge and
preserving it for posterity because those who are old and knowledgeable are passing on and die with
knowledge. A committee on this has been established where old people act as a reservoir of this
knowledge and pass it on to younger generation.
Herbal medicine is also an area where Kitui district is very rich. Promotion of herbal medicine is in the
forefront for the department and an association is formed for the same. Many indigenous tree species are

89
endangered through improper harvesting and the department encourages tree species are endangered
through improper harvesting and the department encourages establishment of botanical gardens and
preservation and conservation of the same. Hills like the Endau are a catchment area for the district and
it is also very rich in indigenous and endangered tree species. The communities around these hills are
encouraged to protect and preserve these trees.
6.4.1 Types of IK, Key Players and Challenges
The Indigenous Knowledge in livestock production revolves around use of herbs i.e. herbal medicine in
treatment of some livestock diseases. The main challenge in herbal medicine is that the knowledge is with
a few individuals within the community and they are the key players.

90
CHAPTER SEVEN
7.0 ENVORONMENTAL GOVERNCE AND INSTITUTIONAL FRAME WORKS
Environmental Governance entails the formulation of comprehensive environmental policies, and the
enactment of supportive legislative regimes. These should be complemented by strong and well-
coordinated environmental institutions. The institutions would then draw up and enforce
environmental regulations and standards, to ensure sound environmental management. The public and
civil society organizations should be facilitated to access and use information on environmental policies
and legislations. An informed society will have an enhanced ability to make decisions and fully participate
in sustainable development issues. The achievement of sustainable development in semi-arid areas will
mainly depend on the empowerment and capacity of the public and civil society to complement the
government efforts in environmental management. And this can only achieved, If everyone will have
capacity to localize / domesticate and take advantage of the technical and financial facilities provided for
in various MEA’S
The increasing human population and associated consumption patterns have threatened the environment
and natural resources. Population has also impacted on the quality of environment especially in aspects
related to settlement and urbanization.
The environmental governance consists of the legislation, standards regulations and institutions to
control activities damaging the environment. The enactment of EMCA (1999) and the current national
policies on the environment have been influence by a series of developments both at the national and
international level,
Environmental management in the district should have a bottom up approach if it is to be realized. The
trend in the past has been that NGO s and other bilateral and multilateral organizations come with the
projects and try to impose them to the group. This approach has failed because the people needs and
aspiration are not inco-operated fully during planning Stage of the project. So the role of local
communities in decision –making and implementation environmental programmes is of outmost
importance. Organized groups and CBOs can be used in these programmes. This will ensure good
implementation and sustainability of these programmes. The community if involved will also benefit and
feel to be part of the process so they will support the efforts. Traditionally; the environment was
managed through communal responsibility and it was the responsibility of every member of the
community to ensure a clean environment and safeguard trees and plants from extension. Through IK

91
systems like stories , songs proverbs and riddles information on the environment was passed including
names and plants with nutritional and medicinal value so that these trees would not be destroyed.
7.1 Status of environmental governance and institutional arrangements
Collaborating Government Departments. Office of the President, Forest Department, Agriculture and
Livestock departments, Vet. department, Culture and Social Services and Ministry of Health guide on
policy uses, and provide technical back-up
Environmental, NGO’s CBO’s/Private sector active in the district.
Environmental, NGO’soperating in the district includes the follow AMREF .SASOL ADRA-KENYA
.K.D.C TARDA . SASOL. Their main activities include supplement government effort in development
activities.
C.B.O’s
CBOs mobilize the community to provide free labour to address common environmental problems
within their locality. They also create awareness and sensitize the community, become entry point to a
given community and Capacity to build the community (empowerment).
Examples of some of the CBOs in the district include the following:
Mathima integrated development –
Mutha Division
Mwendaandu CBO-Central Division
YARD C.B.O-Yatta Division
Kwaka C.B.O Kabati division
Yike wikwe C.B.O –Central
Kyamatu wazee C.B.O Mwitika
Division
Rudi CBO –Mutomo Division
Itambya C.B.O Central Division
Manya takwa tuthi C.B.O –Mutomo
Division
Smile rotary club C.B.O –Ikutha
Division
K.U.D.P –District wide
Rumatao C.B.O –Central
Kasuma C.B.O Mutitu Division
Makongo C.B.O –Mwitika Division
Kilaa C.B.O –Mwitika Division
Yiuku C.B.O Mwitika Division
Kavumbuni C.B.O –Kyuluni Division
Friends of Nature – Central division
92
7.2 Types of Regulatory and Management Tools
Environmental management and co-ordination Act (EMCA) 1999To ensure implementation of NEAP, the environmental policy of 1999 was formulated. This was
followed by enactment of environmental management and co-ordination Act (EMCA) of 1999.
EMCA provides an appropriate legal and institutional frame work for the management of the
environment. It is also an umbrella legislation that provides the guidance, Co-ordination and
harmonization of all environmental laws in the country.
EMCA (1999) institutions
National environment council (NEC): responsible for policy formation, setting goals and
objectives and determining priorities for the protection of the environment.
National Environment management authority (NEMA): principal instrument of government in
supervision, co-ordination and implementation of all policies relating to the environment.
NEMA management board: Mandated to control supervise and administer the asset of the
authority.
Provincial and District environment committee (PECS and DEC: Responsible for the proper
management of the environment
Environmental action plan (NEAP) committee: NEAP Committees facilitates the integration of
environmental consideration into policies plans Programmes and projects.
EIA Technical advisory committee (TAC): reviews / assess and advises on EIA document
reports / requests comments received by the authority.
Public complaints committee (PCC); to investigate any allegation against any person or against
the authority in relation to the condition of the environment EMCA does not replace hitherto
existing laws, which deal with specific sectors or components of the environment. It is applied
alongside the existing legislation governing the different sectors or components of the environment.
It is applied alongside the existing legislation governing the different sectors of the environment.
Legislative reforms continue to be undertaken alongside institutional reforms in order to facilitate
implementation of policies environmental conservation and management will be better coordinated
under this enabling environment.

93
7.2.1 Multilateral Environmental agreements MEA’S
MEA’S are legal instruments to enhance the global responsibility in management of the environment
and natural resources. In Kitui multilateral Environmental Agreement that is being implemented in
the district includes the following.
Activities to combat desertification under the United Nations convention (UNCCD), implemented
through different CBO’S in Zombe. These were adopted at the 2000 millennium declaration that
committed all countries represented to do all they can to eradicate poverty, promote human dignity
and equity and achieve peace, democracy and environmental sustainability. Kenya as a country has
taken the necessary measures to enable the country to achieve the MDG’S in health and sanitary
issues and environmental sustainability.
Constraints in Implementation of MEA’S & MDGS
In adequate capacity to implement the MEA’S & MDGS
In adequate institutional and legal frame works to implement.
Inadequate financial resources
Lack of Intersect oral co-operation
Lack of linkage of activities gears towards MDC’S & MEA’S
Recommendations
Develop register of on activities target all MEA’S and MDG’S
Sources for adequate financial resources
Develop adequate Institutional and legal frame work
Build human resource capacity to implement MEA’S & MDG’S
Table 32: MEAs supported Programmes in the DistrictProgrammes/Project/ Activities
Start date Duration Source ofFunding
Actors Remarks
GoK/ Asal BasedRural LivelihoodSupport Project
July 2005 6 years GoK/AfricanDevelopment Bank
GoK Staff,ILRI andKARI
There is need for enhancedcollaboration amongstakeholders
Arid Lands ResourceManagement Project
2003 6 years GoK/World Bank
GoK Staff There is need for enhancedcollaboration amongstakeholders
Kitui DevelopmentCentre(KDC)
2003 2 years(ButRenewable)
Various KDC Staffand GoKstaff
There is need for enhancedcollaboration amongstakeholders

94
AgribusinessDevelopment (ABD)
July 2005 15 years DANIDA GoK andPrivateSector
There is need for enhancedcollaboration amongstakeholders
ASP (DASS) July 2005 15 years DANIDA GoK Staff There is need for enhancedcollaboration amongstakeholders
FARM Africa July 2005 2 years (Butrenewable)
EuropeanUnion
GoK Staffand FARMAfrica Staff
There is need for enhancedcollaboration amongstakeholders
AdventistDevelopment andRelief Agency
2002 5 years (Butrenewable)
USAID ADRA Staffand GoK
There is need for enhancedcollaboration amongstakeholders
Source: District Livestock & Production Office 2006
Key Environmental Issues
Land use planning increased pressure for land cultivation
Improve pasture Mgt & feed conservation
Environmental degradation around water points & catchment area
Poor Mgt of water resources
Proposed Interventions
Increase tree coverage & protection of environment
Gazette hills, plant sanctuary, forests watershed
sensitization/awareness creation on change on land use
Increase planting material to increase on farm forage production
Discourage human settlement in catchment’s areas
Rehabilitation of degraded catchment indigenous vegetation.
Create awareness on need to conserve indigenous vegetation
Capacity building of the water resource Mgt
Construct & protect water resource
95
CHAPTER EIGHT
8.0 IMPLEMENTATION STRATEGY
The District Environment Action Plan (D.E.A.P) Provincial Environment Action Plan (P.E.A.P)
and National Action (N.E.A.P) preparation and implementation is guided by National priorities as
contained in major policy documents including the ERSWEC, the National Development Plans,
Vision 2030 and the District Development Plans. The objective of this Environmental Action Plans
is to integrate environmental concerns in the development planning and implementation as outlined
in chapter one of this document.
Environmental concerns are cross cutting in nature and their impacts are felt at the village, location,
divisional and district level. Their integration in development process at tall levels is essential hence
the preparation of the District Environment Action Plans (DEAPS). The preparation and
implementation is a statutory requirement under Section 38 of EMCA 1999.
8.1. Stake holders’ involvement
The Implementation strategy of Environment Action Plan should involve many stake holders as
possible. These include all government departments, agencies, state cooperation and any other organ
of government as were as civil so organizations, private sector and individuals.
8.2 Identification of Stake holders
At the village, location and sub-location levels, environment management committees in conjunction
with project management committees will carry out the programmes and also monitoring and
evaluation. Project management committees will oversee the day-to day implementation of the
projects and the exercise will be continuous. At the divisional level, the divisional implementation
team will be composed of the District Officer, divisional departmental heads and the relevant
NGOs representatives. The implementation will be owned by the project management committee
through the communities.

96
8.3 Monitoring and evaluation
In order to ensure that implementation of the plan is undertaken by all stake holders. It is important
to ensure monitoring and evaluation of district Environment Action Plan is developed from village
level to the district level.
The monitoring and evaluation of the implementation of D.E.A.P will be carried out using the
participatory approaches where project committee together with technical team will be
Involved.
Monitoring will mainly be undertaken on continues basis through meetings and field visits. Reports
will be prepared and reviewed. Evaluation will be undertaken periodically after the end of every
financial year.
The purpose of monitoring and evaluation of D.E.A.P is to ensure there are efficient and effective
implementation as well as ensuring that environmental concerns have been addressed and integrated
in development process. It will involve documentation of cross cutting issues.
There are a number of cross cutting issues which if documented would help to halt and reverse
environmental degradation and reduce human vulnerability to the environmental excesses. These
issues may result to action which includes:-

97
Table 52; Kitui DEAP Implementation MatrixDivision Location Issue
CategoryProblemStatement
ActionNo.
Actions Needed Stakeholders Timeframe2009-2013
District
Wide
District
Wide
Air Air pollution 1 Control burning
garbage
Min. of
Public Health
and
Sanitation,
Local
Authorities
2 Promote recycling of
waste
Local
Authorities
3 Apply and enforce
Public Health and
Sanitation Act on
disposal of dead
animals
Min. of
Public Health
and
Sanitation,
Local
Authorities
4 Sensitize
communities on
waste management
Min. of
Public Health
and
Sanitation,
Local
Authorities
5 Afforestation and
Reforestation
KFS
High
prevalence of
T.B
6 Improve housing
ventilation
Min. of
Public Health
and
Sanitation,
Local
Authorities
7 Conduct air
pollution monitoring
Min. of
Public Health
and
Sanitation,
Local
Authorities
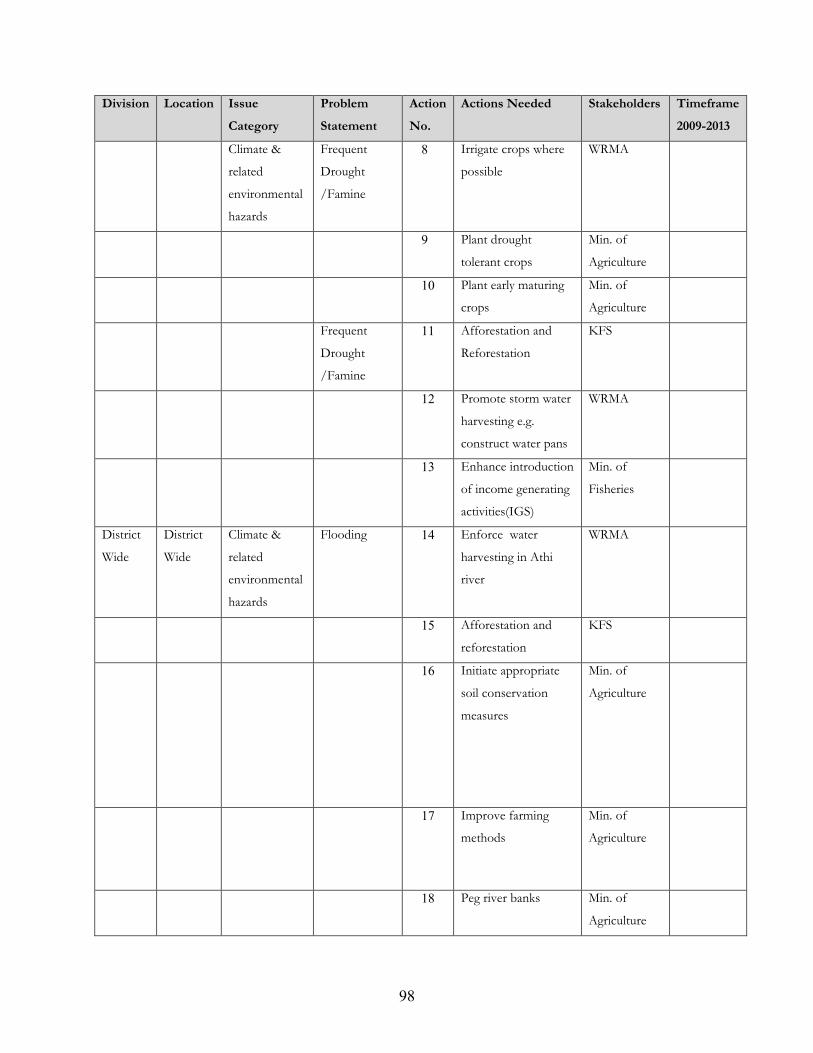
98
Division Location IssueCategory
ProblemStatement
ActionNo.
Actions Needed Stakeholders Timeframe2009-2013
Climate &
related
environmental
hazards
Frequent
Drought
/Famine
8 Irrigate crops where
possible
WRMA
9 Plant drought
tolerant crops
Min. of
Agriculture
10 Plant early maturing
crops
Min. of
Agriculture
Frequent
Drought
/Famine
11 Afforestation and
Reforestation
KFS
12 Promote storm water
harvesting e.g.
construct water pans
WRMA
13 Enhance introduction
of income generating
activities(IGS)
Min. of
Fisheries
District
Wide
District
Wide
Climate &
related
environmental
hazards
Flooding 14 Enforce water
harvesting in Athi
river
WRMA
15 Afforestation and
reforestation
KFS
16 Initiate appropriate
soil conservation
measures
Min. of
Agriculture
17 Improve farming
methods
Min. of
Agriculture
18 Peg river banks Min. of
Agriculture

99
Division Location IssueCategory
ProblemStatement
ActionNo.
Actions Needed Stakeholders Timeframe2009-2013
19 Regulate sand
harvesting in the
district
Min. of
Agriculture
20 Introduce cash crops
such as cotton
Min. of
Agriculture
Crop
Production &
Soils
High rate of
soil erosion
21 Initiate appropriate
soil conservation
measures
Min. of
Agriculture
22 Afforestation and
Reforestation
KFS
23 Construct Check
dams and sand dams
WRMA
24 Construct proper
drainage on roads
Min. of Roads
25 Build gabions Min. of
Agriculture
26 Plant cover crops Min. of
Agriculture
27 Promote roof water
catchment
Min. of
Agriculture
28 Promote use of
mulching
Min. of
Agriculture
Poor crop
yields
29 Promote use of
certified seeds
Min. of
Agriculture
30 promote timely land
preparation and
planting
Min. of
Agriculture
31 Initiate appropriate
soil conservation
measures
Min. of
Agriculture
32 Plant early maturing
crops
Min. of
Agriculture
District
Wide
District
Wide
Crop
Production &
Soils
Poor crop
yields
33 Enhance farmers
Field schools for
extension purpose
Min. of
Agriculture

100
Division Location IssueCategory
ProblemStatement
ActionNo.
Actions Needed Stakeholders Timeframe2009-2013
34 Practice crop rotation Min. of
Agriculture
35 Plant drought
tolerant crops
Min. of
Agriculture
36 Promote use of farm
yard manures
Min. of
Agriculture
37 Promote irrigation
along developed
water sources
Min. of
Agriculture,
WRMA
38 Promote Agro-
forestry
Min. of
Agriculture
39 Promote indigenous
crops
Min. of
Agriculture
40 Sensitize
communities to use
certified seeds
Min. of
Culture and
social Services
41 Conduct frequent soil
sampling
Min. of
Agriculture
42 Encourage use of
machine to prepare
farmland /dry
planting.
Min. of
Agriculture
43 Diversify crops Min. of
Agriculture
Energy Shortage of
wood fuel
44 Promote planting of
quick maturing trees
KFS
45 Promote use of
energy saving devices
Min. of
Energy
46 Promote use of
alternative sources of
energy e.g. biogas,
solar
Min. of
Energy

101
Division Location IssueCategory
ProblemStatement
ActionNo.
Actions Needed Stakeholders Timeframe2009-2013
Environmental
Education &
Awareness
Low level of
awareness on
environmental
education
47 Educate the public
through electronic
and print media,
drama and songs
Min. of
Information
District
Wide
District
Wide
Environmental
Education &
Awareness
Low level of
awareness on
environmental
education
48 Promote public
participation in
environmental plans,
programmes and
activities
Min. of
Public Health
and
Sanitation,
Local
Authorities
49 Sensitize
communities/opinion
leads to abandon
cultural beliefs that
inhibit environmental
conservation
Min. of
Culture and
social Services
50 Disseminate
environmental
information
Min. of
Public Health
and
Sanitation,
Local
Authorities
51 Integrate
environmental issues
in Schools &
Adult/Public
Institutions and
literacy Centres
Min.
Education
52 Increased awareness
on environmental
laws through Barazas,
seminars, workshops
Min. of
Public Health
and
Sanitation,
Local
Authorities
District
Wide
Fish &
Fisheries
Shortage of
fish
53 Promote on farm fish
farming
Min. of
Fisheries

102
Division Location IssueCategory
ProblemStatement
ActionNo.
Actions Needed Stakeholders Timeframe2009-2013
54 Afforestation and
reforestation
KFS
55 Rehabilitate and
restore water
catchment areas
WRMA, Min.
Agriculture
District
Wide
District
Wide
Forests &
Trees
Deforestation 56 Promote on farm and
off forestry
/afforestation
KFS
57 Promote agro
forestry
KFS
58 Conserve herbal
medicinal plants
KFS
59 Promote use of
energy saving devices
Min. of
Energy, Min.
of Agriculture
District
Wide
District
Wide
Forests &
Trees
Deforestation 60 Regulate charcoal
burning
KFS&, Local
Authorities
61 Promote community
education and
awareness on good
forestry practices
KFS
62 Plant drought
tolerant crops
Min. of
Agriculture
63 Gazette existing
forests
64 Enforce the Forest
Act
KFS
65 Promote public
awareness on the
need to conserve and
protect forests and
catchments
KFS
66 Establish tree
nurseries
KFS

103
Division Location IssueCategory
ProblemStatement
ActionNo.
Actions Needed Stakeholders Timeframe2009-2013
67 Identify hilltops
prone to soil erosion
and rehabilitate
them
KFS, Min. of
Agriculture
Health Prevalence of
waterborne
diseases
68 Apply and enforce
Public Health and
Sanitation Act
Min. of
Public Health
and
Sanitation,
Local
Authorities
69 Promote treatment of
drinking water
WRMA
70 Protect water sources WRMA, Min.
Agriculture
71 Apply and enforce
waste management
regulations
Min. of
Public Health
and
Sanitation,
Local
Authorities
72 Construct a proper
drainage and
sanitation facilities
Min. of
Public Health
and
Sanitation,
Local
Authorities
District
Wide
District
Wide
Health Prevalence of
waterborne
diseases
73 Construct latrines Min. of
Public Health
and
Sanitation,
Local
Authorities
74 Create awareness on
proper hygiene
Min. of
Public Health
and
Sanitation,

104
Division Location IssueCategory
ProblemStatement
ActionNo.
Actions Needed Stakeholders Timeframe2009-2013
Local
Authorities
75 Develop and Protect
water sources
Min. of
Public Health
and
Sanitation,
Local
Authorities
Aflatoxicosis 76 Create awareness onproper food storage
Industry &
Other
Business
Activities
77 Apply and enforce
Water quality and
Waste management
regulations
Min. of
Public Health
and
Sanitation,
Local
Authorities
78 Enforce air control
regulations
Min. of
Public Health
and
Sanitation,
Local
Authorities
79 Promote use of
environmentally
friendly sources of
energy
Min. of
Energy
80 Promote use of
cleaner production
technologies
Min of
Industry
81 Recycle polythene
materials
Local
Authorities,
Min of
Industry
82 Promote use of EFB Min of

105
Division Location IssueCategory
ProblemStatement
ActionNo.
Actions Needed Stakeholders Timeframe2009-2013
Industry
83 Protect springs WRMA, Min.
Agriculture
District
Wide
District
Wide
Livestock &
Grazing
Low livestock
productivity
84 Control animal
diseases
Min of
Livestock
Livestock &
Grazing
Low livestock
productivity
85 Upgrading of
indigenous cattle
breeds/crossbreeding
Min. of
Livestock
86 Undertake research
on Ticks control
Min. of
Livestock
87 Train the
communities
diagnosis of animal
disease and
prevention methods
Min. of
Livestock
88 Train farmers on
good animal
husbandry
Min. of
Livestock
89 Plant fodder
crops/trees
Min. of
Livestock
90 Construct water
points
Min. of
Livestock
91 Make hay for use
during the dry season
Min. of
Livestock
92 Reduce the stocking
rate
Min. of
Livestock
93 Promote zero grazing Min. of
Livestock
Mining &
Quarrying
High
incidences
accident
occurrences
94 Rehabilitate and
restore mined areas
Mines and
Geology
Dept. Local
Authorities
Open mining
pits
95 Fence mining areas
and pits
Mines and
Geology
Dept. Local

106
Division Location IssueCategory
ProblemStatement
ActionNo.
Actions Needed Stakeholders Timeframe2009-2013
Authorities
Settlements &
Infrastructure
Diseases 96 Construct latrines Local
Authorities
97 Apply and enforce
waste management
regulations
Min. of
Public Health
and
Sanitation,
Local
Authorities
District
Wide
District
Wide
Settlements &
Infrastructure
Diseases 98 Promote community
education on good
hygiene and
sanitation
Min. of
Public Health
and
Sanitation,
Local
Authorities
99 Apply and enforce
Public Health and
Sanitation Act
Min. of
Public Health
and
Sanitation,
Local
Authorities
Unplanned
settlements
100 Improve existing
roads
Local
Authorities
101 Promote land use
planning
Min of lands
102 Prepare urban
development plans
Min of Lands,
local
Authorities
103 Apply and enforce
Physical Planning Act
and Council Bylaws
Min. of
Public Health
and
Sanitation,
Local
Authorities

107
Division Location IssueCategory
ProblemStatement
ActionNo.
Actions Needed Stakeholders Timeframe2009-2013
104 Construction of
sewerage system
Min. of
Public Health
and
Sanitation,
Local
Authorities
105 Construct pit latrines Min. of
Public Health
and
Sanitation,
Local
Authorities
Poor
sanitation
106 Apply and enforce
waste management
regulations
Min. of
Public Health
and
Sanitation,
Local
Authorities
107 Designate waste
disposal sites
Min. of
Public Health
and
Sanitation,
Local
Authorities
108 Apply and enforce
Physical Planning Act
and Council byelaws
Min. of Lands
District
Wide
District
Wide
Water
Resources
Inadequate
clean drinking
water
109 Afforestation &
Reafforestation of
water catchments
including hill tops
WRMA, KFS
110 Treat drinking water WRMA
111 Dig
boreholes/shallow
wells
WRMA

108
Division Location IssueCategory
ProblemStatement
ActionNo.
Actions Needed Stakeholders Timeframe2009-2013
112 Protect and conserve
water sources
WRMA
113 Promote roof water
catchments
WRMA
114 Regulate river water
abstractions
WRMA
115 Construct pit latrines Local
Authorities,
Min of Public
Health and
Sanitation
Water
pollution
116 Undertake Public
education on good
hygiene
Local
Authorities,
Min of Public
Health and
Sanitation
117 Promote proper
waste management
Local
Authorities,
Min of Public
Health and
Sanitation
118 Promote proper
application of
agrochemicals
Min. of
Agriculture
District
Wide
District
Wide
Water
Resources
Water
pollution
119 Undertake
appropriate soil
conservation
measures
Min. of
Agriculture
120 Divert run offs far
from the boreholes
Min. of
Public Works,
WRMA
121 Construct sewage
systems
Local
Authorities,
122 Designate waste
disposal sites
Local
Authorities,

109
Division Location IssueCategory
ProblemStatement
ActionNo.
Actions Needed Stakeholders Timeframe2009-2013
Min of Public
Health and
Sanitation
123 Protect water sources WRMA
Drying of
water sources
124 Plant trees on the
water catchment
areas
KFS/WRMA
125 Provide piped water WSB
126 Regulate sand
harvesting activities
Wetlands Degradation
of wetlands
127 Regulate the usage of
wetlands resources
WRMA, Min.
Agriculture
128 Educate communities
on the importance of
conserving wetlands
WRMA, Min.
Agriculture
129 Draw management
plans for wetlands
WRMA, Min.
Agriculture,
Min of Lands
130 Map and protect
wetlands
WRMA, Min.
Agriculture,
Min of Lands,
Min of
Fisheries
Wildlife,
Biodiversity &
Tourism
Human –
wildlife
conflict
131 Develop roads within
game reserve
KWS
132 Establish wildlife
buffer zones
KWS
District
Wide
District
Wide
Wildlife,
Biodiversity &
Tourism
Human –
wildlife
conflict
133 Strengthen District
Compensation
Committee
KWS
134 Sensitize
communities to
appreciate the
KWS

110
Division Location IssueCategory
ProblemStatement
ActionNo.
Actions Needed Stakeholders Timeframe2009-2013
importance of
conserving wildlife
135 Involve the
communities in
wildlife management
KWS
Loss of
biodiversity
136 Plant indigenous
trees
KFS
137 Preserve indigenous
tree species
KFS
138 Protect natural
ecosystems
KFS, KWS
Untapped
eco-tourism
potential
139 Carry out an
inventory of
existing/potential
tourism sites
Min. of
Tourism
140 Apply and enforce
EMCA
Min. of
Tourism
141 Promote and market
existing eco-tourism
activities
Min. of
Tourism
142 Use media to
promote local
tourism
Min. of
Tourism, Min
of
Information

111
APPENDIX 1
PART IV OF THE ENVIRONMENTAL MANAGEMENT ANDCOORDINATION ACT (1999)ENVIRONMENTAL PLANNING(Extract from EMCA)37. National Environment Action Plan Committee
1. There is established a committee of the Authority to be known as the National Environmental
Action Plan Committee and which shall consist of:
a) The Permanent Secretary in the Ministry for the time being responsible for national economic
planning and development who shall be the chairman;
b) The Permanent Secretaries in the Ministries responsible for the matters specified in the First
Schedule or their duly nominated representatives;
c) Four representatives of the business community to be appointed by the Minister;
d) Representatives of each of the institutions specified in the Third Schedule;
e) Five representatives of non-governmental organizations nominated by the National Council of
Non-Governmental Organizations;
f) Representatives of specialized research institutions that are engaged in environmental matters as
may be determined by the Minister; and
g) A Director of the authority who shall be the secretary.
2. The National Environment Action Plan Committee shall, after every five years, prepare a national
environment action plan for consideration and adoption by the National Assembly.
38. Provisions of the National Environment Action PlanThe national environment action plan shall:
a) Contain an analysis of the natural resources of Kenya with an indication as to any pattern of
change in their distribution and quantity over time;
b) Contain an analytical profile of the various uses and value of the natural resources incorporating
considerations of intergenerational equity;
c) Recommend appropriate legal and fiscal incentives that may be used to encourage the business
community to incorporate environmental requirements into their planning and operational
processes;
d) Recommend methods for building national awareness through environmental education on the

112
importance of sustainable use of the environment and natural resources for national development;
e) Set out operational guidelines for the planning and management of the environment and natural
resources;
f) Identify actual or likely problems as may affect the natural resources and the broader environment
context in which they exist;
g) Identify and appraise trends in the development of urban and rural settlements, their impacts on
the environment, and strategies for the amelioration of their negative impacts;
h) Propose guidelines for the integration of standards of environmental protection into
development planning and management;
i) Identify and recommend policy and legislative approaches for preventing, controlling or mitigating
specific as well as general adverse impacts on the environment;
j) Prioritise areas of environmental research and outline methods of using such research findings
k) Without prejudice to the foregoing, be reviewed and modified from time to time incorporate
emerging knowledge and realities; and
I) be binding on all persons and all government departments agencies, state corporations or other
organs of Government upon adoption by the National assembly
39. Provincial Environment Action PlansEvery Provincial Environmental Committee shall, every five years, prepare a provincial environment
action plan in respect of the province for which it is appointed, incorporating the elements of the
relevant district environment action plans prepared under section 40 and shall submit such plan to
the chairman of the National Environment Action Plan Committee for incorporation into the
national environment action plan.
40. District Environment Action PlansEvery District Environmental Committee shall, every five years, prepare a district environment
action plan in respect of the district for which it is appointed. and shall submit such plan to the
chairman of the Provincial Environment Action Plan committee for incorporation into the
provincial environment action plan proposed under section 39
41. Contents of Provincial and District Environmental action Plans.
Every provincial environment action plan and every district environment action plan prepared under
section 30 and 40 respectively shall contain provisions dealing with matters contained in section 38
(a), (b), (c), (d), (e), (t), (g), (h), (i), and (j)in relation to their respective province or district.

113
REFERENCEBiodiversity Conservation Programme (BCP) for south Kitui National reserve.
Demonstration Guide ISFP Technical series No.1.
DEO. (2005). Draft NEAP/DEAP Manual (November 2005). Nairobi: GoK.
Environmental Impact Assessment Report – Nyumbani village Home Kitui.
GoK. Annual reports from the following Departments of: Agriculture, Forestry, Water, Lands,
Fisheries,Livestock, Energy, Health, education. Nairobi: GoK.
GoK. (2005). Environmental Management Plan (DASS 2005-2010). Nairobi: GoK.
GoK. (2002). KITUI District Development Plan (2002-2008). Nairobi: GoK.
GOK. ( 2000). KITUI District Forestry Master Plan (draft report may 2000). Nairobi: GOK.
GOK. ((2001-2004)). KITUI District PRSP consultation Report. Nairobi: GOK.
GoK. (2004). KITUI District State of Environment Reports for the years 2003& 2004. Nairobi:
GoK.
GoK. (2003). KITUI District State of Environment Reports for the years 2003& 2004,
2004)TIVA Forests . Nairobi: GoK.
GoK. (2005). KITUI District Vision and Strategy: Natural Resources Management 2005-2015.
Nairobi: GoK.
GoK. (2005). KITUI District Vision and Strategy: Natural Resources Management 2005-2015,
2005). Nairobi: GoK.
KITUI District Drought Contingency Plan.
NEMA. (2005). National Environment Management Authority (strategic plan 2005-2010).
Nairobi: GoK.


