36
Republic of Malawi Ministry of Health National Malaria Control Program Supervision Report for Monitoring ACT and Malaria Control Activities November 2008

Republic of Malawi Ministry of Health National Malaria Control Program Supervision Report for Monitoring ACT and Malaria Control Activities November 2008

Program Supervision Report for Monitoring ACT and Malaria Control Activities
ii
The supervision activity and this report are made possible by the generous support of the American people through the U.S. Agency for International Development (USAID), under the terms of Cooperative Agreement #GHN-A-00-07-00002-00. The contents are the responsibility of Management Sciences for Health and do not necessarily reflect the views of USAID or the United States Government. About SPS The Strengthening Pharmaceutical Systems (SPS) Program strives to build capacity within developing countries to effectively manage all aspects of pharmaceutical systems and services. SPS focuses on improving governance in the pharmaceutical sector, strengthening pharmaceutical management systems and financing mechanisms, containing antimicrobial resistance, and enhancing access to and appropriate use of medicines. Recommended Citation This report may be reproduced if credit is given to SPS. Please use the following citation. 2008. Republic of Malawi Ministry of Health National Malaria Control Program Supervision Report for Monitoring ACT and Malaria Control Activities
Strengthening Pharmaceutical Systems Center for Pharmaceutical Management
Management Sciences for Health
4301 North Fairfax Drive, Suite 400 Arlington, VA 22203 USA Telephone: 703.524.6575
Fax: 703.524.7898
E-mail: [email protected] Web: www.msh.org/sps.org

iii
ACKNOWLEDGMENTS The National Malaria Control Program would like to thank the supervisors who committed to the supervisory visits and provided technical support to the health facilities. They are—
• Deputy Zonal officers: Mrs. E. Chirwa, Mr. M. Msadala
• NMCP malaria officers: Mr. S. Ndau, Mr. J. Sande
• Case management trainer: Mrs. R. Chikumbe
• District malaria coordinators and pharmacy technicians from Karonga, Rumphi, Nkhata Bay, Mzimba, Kasungu, Nchisi, Dowa, Nkhotakota, Salima, Mchinji, Lilongwe, Dedza, Ntcheu, Mangochi, Balaka, Machinga, Phalombe, Mulanje, Zomba, Blantyre, Mwanza, Nsanje, and Neno Districts
• USAID|DELIVER: Ms. J. Waweru, Mr. M. Msefula
• MSH/SPS: Ms. C. Kamtengeni, Ms. J. Wang We would particularly like to express our appreciation to MSH/SPS for the organization of the supervisory activities and data analysis, as well as to USAID for the financial support. Special thanks go to the District Health Officers and the visited facilities that fully supported the supervisory activities and cooperated with the supervisors.

iv
CONTENTS
Executive Summary .................................................................................................................. vi Discussions and Recommendations ...................................................................................... vi
Introduction ................................................................................................................................ 1 Methodology .......................................................................................................................... 2 Findings .................................................................................................................................. 3 Training and Communications ............................................................................................... 3 Case Management .................................................................................................................. 3 Case Management and Patient Awareness ............................................................................. 7 Drug Management .................................................................................................................. 9
Discussions and Recommendations ......................................................................................... 25
Annex 1. Supervisors for the Supervisory Visits ..................................................................... 27
Annex 2. Facilities Visited March 10–20, 2008 ...................................................................... 28

v
ACRONYMS ACCESS Access to Clinical and Community Maternal, Neonatal and Women’s Health Services ACT artemisinin-based combination therapy ADR adverse drug reactions CHAM Christian Health Association of Malawi CMS Central Medical Stores DH District Hospital DHO District Health Officer DNs Delivery Notes HC Health Center HSAs Health Surveillance Assistants IEC information, education, and communication IPT intermittent preventive treatment ITNs insecticide-treated nets LA lumefantrine-artemether MG Malawi Government Mg milligram MSH Management Sciences for Health NMCP National Malaria Control Program RMSs Regional Medical Stores RMS-C Regional Medical Stores-Central RMS-N Regional Medical Stores-North RMS-S Regional Medical Stores-South SP sulfadoxine-pyrimethamine SPS Strengthening Pharmaceutical Systems USAID U. S. Agency for International Development
vi
EXECUTIVE SUMMARY The new malaria treatment policy that calls for using lumefantrine-artemether (LA) 20 milligram (mg)/120 mg (Coartem®) for the treatment of uncomplicated malaria was officially launched in Malawi in December 2007. To support the health facilities on the implementation of the new malaria treatment policy and to routinely monitor implementation progress, quarterly supervision visits were scheduled for 2008. The first supervisory visits were conducted on March 10–20, 2008. Supervisory teams included malaria officers from National Malaria Control Program (NMCP), zonal medical officers, members from U. S. Agency for International Development (USAID)/DELIVER, Management Sciences for Health’s (MSH) Strengthening Pharmaceutical Systems (SPS) Program, case management trainers, and district malaria coordinators, and district pharmacy technicians. Forty-four facilities in 23 districts in the 5 zones were visited. These included 14 government District Hospitals, 1 rural hospital, 12 health centers, and 9 Christian Health Association of Malawi (CHAM) hospitals and 8 CHAM health centers. Discussions and Recommendations
In summary, there are some challenges to implementing new malaria treatment as observed from the supervision —
• Poor documentation on health management information system (HMIS), stock cards, and dispensing registers which might affect LA quantification and procurement
• Late monthly reporting of some facilities affected the whole district which then affected the timely drug supply
• Rationed supply by RMS due to short stock caused the further rationing and delay of the supply from DHOs to the facilities
• Diagnostic tools (microscopes) were not available in most of the health centers
• Some untrained health workers were prescribing or managing LA
• Communication with patients on how to use LA was compromised mainly due to high workload

Executive Summary
vii
• Shortage of staff and the lack of interest in drug management of the relief-duty staff negatively impacted the drug management in some facilities
Proposed recommendations to address the challenges are as follows.
• Provide training and orientation in— o Case management, including the auxiliary workers that perform dispensing
o Drug management and the documentation of stock cards, dispensing registers, delivery notes, and related documents o Monthly reporting
• Strengthen the recording of LA in the dispensing registers outside the pharmacy such
as in wards, outreach clinics, and any peripheral units
• Make diagnostic tools available and training lab assistants for the health centers
• When quantifying LA, take under-recording of malaria cases and the increasing referrals from communities into consideration
• Strengthen the information flow for routine monitoring and evaluation for drug management
• Introduce performance evaluation and recognition system to improve implementation
• Improve data collection procedures once the HMIS is strengthened

Program Supervision Report for Monitoring ACT and Malaria Control Activities
viii
1
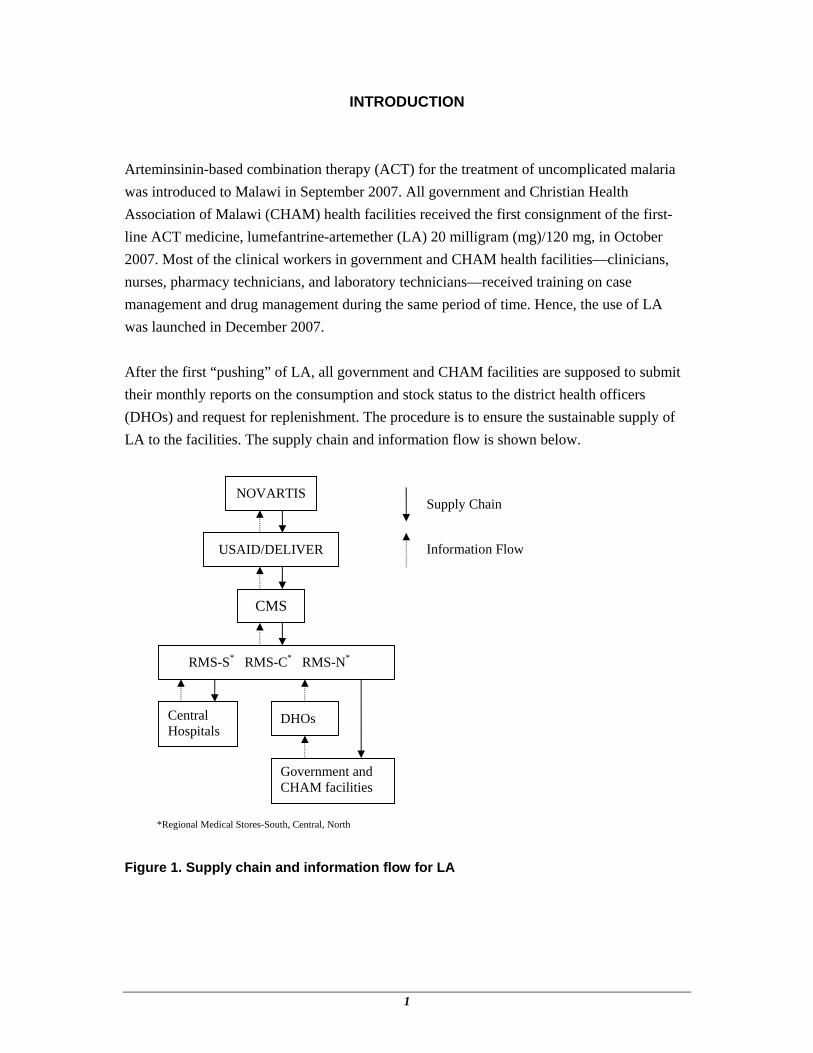
INTRODUCTION Arteminsinin-based combination therapy (ACT) for the treatment of uncomplicated malaria was introduced to Malawi in September 2007. All government and Christian Health Association of Malawi (CHAM) health facilities received the first consignment of the first-line ACT medicine, lumefantrine-artemether (LA) 20 milligram (mg)/120 mg, in October 2007. Most of the clinical workers in government and CHAM health facilities—clinicians, nurses, pharmacy technicians, and laboratory technicians—received training on case management and drug management during the same period of time. Hence, the use of LA was launched in December 2007. After the first “pushing” of LA, all government and CHAM facilities are supposed to submit their monthly reports on the consumption and stock status to the district health officers (DHOs) and request for replenishment. The procedure is to ensure the sustainable supply of LA to the facilities. The supply chain and information flow is shown below.
Figure 1. Supply chain and information flow for LA
NOVARTIS
USAID/DELIVER
CMS
RMS-S* RMS-C* RMS-N*
DHOs
Government and CHAM facilities
Central Hospitals
Supply Chain
Information Flow
*Regional Medical Stores-South, Central, North

Report for Monitoring ACT and Malaria Control Activities
2
To better document LA dispensing, a dispensing register was introduced and given to the DHOs to further distribute to the facilities in their districts in February 2008. The use of dispensing register will capture the flow of LA from drug store to the patients and keep the detail of the treatment records. It will provide the information on how the medicines were used and the information for quantification. The supervision aims to support the facilities on the implementation of the new malaria treatment and to assess health care workers’ and the patients’ level of understanding of the new treatment. A supervision orientation meeting was held in February to review the supervisory tool and plan the schedule for the supervision visits. Quarterly visits were scheduled and facilities were selected to be visited. The supervisory teams include two members from Central level—National Malaria Control Program (NMCP), zonal offices, and partners Management Sciences for Health’s (MSH) Strengthening Pharmaceutical Systems (SPS) Program and U. S. Agency for International Development (USAID)/DELIVER, as well as two members from the districts, the district malaria coordinators, and pharmacy technicians. The first supervisory visits were conducted March 10–20, 2008. Forty-four facilities in 23 districts of 5 zones were visited. Methodology
A check list was used as a supervisory tool for the activity. It was developed through a consultative process and was reviewed and revised in the supervisory orientation meeting. Supervisors were divided into five teams for the five zones. Each team comprised two central members and two district members. When the central members arrived in the district, one district malaria coordinator and pharmacy technician joined the team. Two facilities were visited in each district in one day. While at the facility, the team divided to two subgroups, case management and drug management. Feedback was given to the in-charge of the facilities at the end of the visits. Originally, 54 facilities in 27 districts were to be visited; however, 44 facilities in 23 districts were actually visited because of Easter holiday. The facilities visited include 14 government District Hospitals, 1 rural hospital, and 12 health centers, and 9 CHAM hospitals and 8 CHAM health centers. The supervisors are listed in Appendix 1 while the facilities visited are listed in Appendix 2..

Introduction
3
Findings
The presentation of the findings are in four categories (based on supervisory tool)—
1. Training and communication 2. Case management 3. Drug management 4. IPT and ITN
Training and Communications
The number of health care workers trained in ACT in the visited facilities and 7 districts was 1,760 while the number of untrained was 346. All the facilities have at least one staff on duty trained in ACT except one CHAM facility, Mlowe Health Center in Rumphi District, which has been served by different staff for short-term relief duty due to lack of personnel. With regard to information, education, and communication materials, 21 of 44 (48 percent) facilities received patient posters and 15 (34 percent) facilities received leaflets, but the posters were only visible in 14 (32 percent) facilities and leaflets in 11 (25 percent) facilities. Case Management
Malaria Cases
The complete data of malaria cases were available in 36 (82 percent) of 44 facilities. Data was unavailable in Ncheu District Hospital, and incomplete in the following facilities: Nkhata Bay, Karonga, Mchinji, Dedza District Hospitals, Mkhuzi Health Center in Nchisi, Dwanbazi Health Center in Nkhotakota, and St. Lukes Hospital in Zomba. The number of malaria cases from December 2007 to February 2008 for each facility was collected and presented in figures 1–5. Total number of malaria cases in the 43 facilities December 2007–February 2008 was 203,055 (tables 1 and 2). It is observed that high malaria cases were mainly in children under the age of five (51 percent) and in southern zones where 20 facilities contributed to 68 percent of malaria cases of 43 facilities.

Report for Monitoring ACT and Malaria Control Activities
4
Table 1. Malaria Cases in 43 Facilities by Age Groups, Dec. 2007–Feb. 2008
December 07 January 08 February 08 Total Under 5 years of age 32,385 (52%) 36,817 (53%) 33,975 (48%) 103,177 (51%) Over 5 years of age 30,407 (48%) 31,839 (47%) 34,738 (52%) 96,994 (49%) Total malaria cases 62,792 70,023 70,240 203,055
Table 2. Malaria Cases in 43 Facilities by Zones, Dec. 2007–Feb. 2008
Zone (No. of facilities provided data)
Northern Zone (8)
Central East Zone (10)
Central West Zone (5)
Southern East Zone (12)
Southern West Zone (8)
Under 5 years of age 9,939 12,641 9,574 41,326 29,697 Over 5 years of age 10,066 15,148 7,286 36765 27,729 Total malaria cases 20005 27,789 16,860 78,091 57,426
Note: Data was incomplete in Nkhata Bay and Karonga District Hospitals
Figure 2. Malaria cases in Northern Zone facilities, Dec. 2007–Feb. 2008
Introduction
5
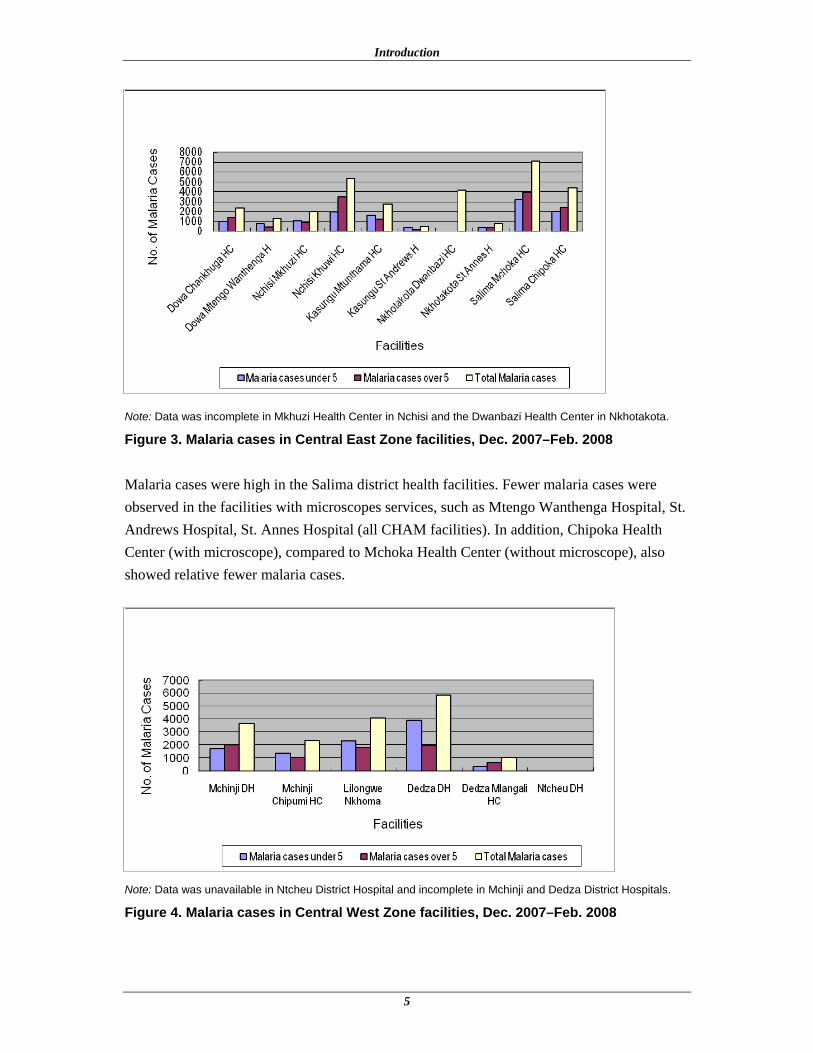
Note: Data was incomplete in Mkhuzi Health Center in Nchisi and the Dwanbazi Health Center in Nkhotakota.
Figure 3. Malaria cases in Central East Zone facilities, Dec. 2007–Feb. 2008
Malaria cases were high in the Salima district health facilities. Fewer malaria cases were observed in the facilities with microscopes services, such as Mtengo Wanthenga Hospital, St. Andrews Hospital, St. Annes Hospital (all CHAM facilities). In addition, Chipoka Health Center (with microscope), compared to Mchoka Health Center (without microscope), also showed relative fewer malaria cases.
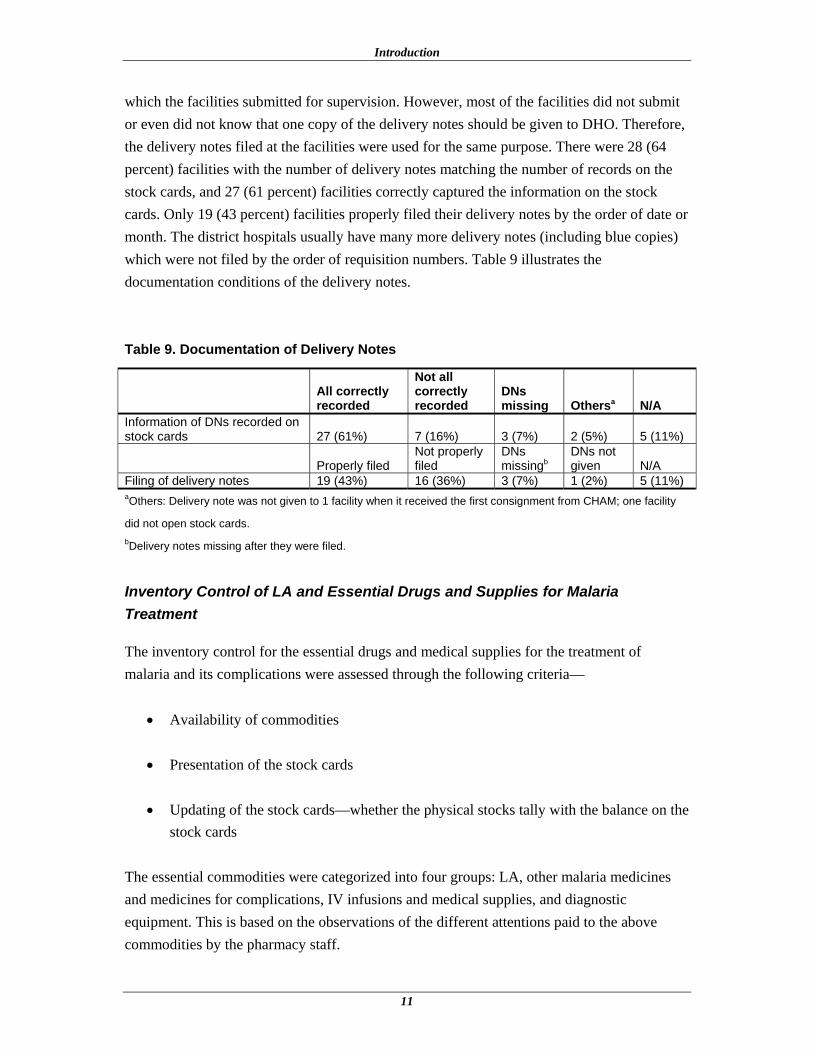
Note: Data was unavailable in Ntcheu District Hospital and incomplete in Mchinji and Dedza District Hospitals.
Figure 4. Malaria cases in Central West Zone facilities, Dec. 2007–Feb. 2008

Report for Monitoring ACT and Malaria Control Activities
6
Note: High malaria cases in Machinga and Mangochi District Hospitals. Data incomplete in St. Lukes Hospital.
Figure 5. Malaria cases in Southern East Zone facilities, Dec. 2007–Feb. 2008
Note: High malaria cases in Mwanza and Nsanje District Hospitals.
Figure 6. Malaria cases in Southern West Zone facilities, Dec. 2007–Feb. 2008 High numbers of malaria cases were reported in Mangochi (17,328), Machinga (18,243), Mwanza (21,713), and Nsanje (17,602) District Hospitals, all in the Southern zones. The

Introduction
7
malaria cases in these 4 hospitals accounted for 37 percent of all cases reported. Both the Khuwi Health Center in Nchisi District and Mchoka Health Center in Salima District in Central East Zone also had high numbers of malaria cases—5,364 and 7,097 cases, respectively. Suspected Treatment Failure and Adverse Reactions
There were 26 facilities indicating suspected treatment failures. Although 15 facilities provided exact numbers indicating that 59 patients switched to quinine, there was no direct evidence of the treatment failure. There were eight facilities that observed suspected adverse reactions. Table 3 indicates the reactions and the number of cases. None of the reactions was reported to NMCP because most of the skin reactions were mild enough that they were not regarded as adverse reactions, and there is no direct evidence that LA was the cause of the reactions. In addition, the report form for reporting adverse reactions was not available, and the facilities were not aware how to report the adverse reactions. Table 3. Suspected Adverse Reactions Observed in 44 facilities, Dec. 2007–Feb. 2008
Reactions Urticaria Skin rash Hypersensitivity Palpitation Dizziness Number of cases 3 3 1 2 1
Case Management and Patient Awareness
Only 26 (59 percent) facilities, including 24 hospitals and 2 health centers, have laboratories or microscopes for malaria testing. However, clinical symptoms are used for the diagnosis of malaria in almost all the facilities. Only 4 (9 percent) respondents indicated that only lab tests were used for malaria diagnosis. Rapid diagnostic testing was not available in all facilities. Observation on how prescribers (clinicians or nurses) manage malaria cases was conducted in all facilities except 5 facilities where no malaria patients were found during the time of visit. Thirty-six (90 percent) of 39 prescribers used treatment guidelines while prescribing. Table 4 summarizes the observations for case management.

Report for Monitoring ACT and Malaria Control Activities
8
Table 4. Summary of Case Management Observations
Descriptions Yes No The patient’s body weight was indicated on the prescriptions 24 (62%) 15 (38%) The correct doses were prescribed 35 (90%) 4 (10%) The prescribers communicated all the key messages when prescribing/giving LA 17 (44%) 22 (56%)
Some patients’ body weights were at the lower margin of the band and the prescribers prescribed the dosage of the lower band for them. Most of the prescribers did not communicate all the key messages to the patients partly because the drug was given at the dispensary. However, most of the medicines are dispensed by pharmacy attendants who may not be able to communicate the medicine information or respond to inquiries properly. Seventy-five patients who were prescribed LA were interviewed at 39 facilities, including 30 (40 percent) caretakers for sick children, 19 (25 percent) female adults, and 26 (35 percent) male adults. When they were asked if they understand how to use the drug, 80 percent of them were able to correctly indicate the regimen and 79 percent of them indicated that they will complete the three-day course. There is slight difference among the caretakers, female adults, and male adults (table 5) on awareness about LA use. It shows that the children’s caretakers are more careful about how to use the medicine than female and male adult patients. However, it may not prove that there is significant difference because the sample size is small. Table 5. Awareness on the Use of LA among Caretakers and Adult Patients
Care takers
Female adults
Male adults Total
Correctly indicated number of times and tablets taken per day 25 (83%) 15 (79%) 20 (77%) 60 (80%) Correctly indicated that 3-day course will be completed 24 (80%) 15 (79%) 20 (77%) 59 (79%) Number of the interviewees (Denominators) 30 19 26 75
When they were asked if they saw the education posters and understand the message on the posters, 20 had seen the posters, and only 15 (75 percent) understood the message (table 6), 2 glanced at the message without reading it, and 1 was unable to read it because of illiteracy. Since there were only 14 facilities with visible posters, the usefulness of the posters is questionable.

Introduction
9
Table 6. Results of Reading and Understanding the Education Posters
Care takers
Female adults
Male adults Total
Number of interviewees who saw posters 8 4 8 20 Number of interviewees who understood message 7 2 6 15 (75%)
Drug Management
Reporting and Medicine Supply
To improve facilities’ timely monthly reporting, a reporting calendar was given to the facilities together with the first consignment of LA. The calendar is supposed to be made visible to serve its function. However, it was only visible in 9 (20 percent) of the 44 facilities. Pushing of LA was only applied for the first consignment. Facilities were asked to order LA after the first supply (pulling). All the government and CHAM facilities, except Central Hospitals, are supposed to submit their monthly report for LA to the corresponding District Health Officers (DHOs) by the fifth of each month regardless of whether they were ordering LA or not. There are two monthly report forms—LMIS01A or LMIS01B and original (white) copies of dispensing register. Government health centers and CHAM hospitals and health centers should fill out LMIS01A form while district hospitals fill out LMIS01B, which are now incorporated with the list of LA. After receiving the monthly reports from the facilities, the district pharmacy technicians will compile the reports using the tracking form, which is a programmed spread sheet in Supply Chain Manager, and the data will be translated to an ordering form for ordering LA. The pharmacy technicians will then fill the requisitions manually and submit the requisitions together with LMIS01A, LMIS01B, white copies of dispensing registers, tracking forms, and ordering forms to RMS to order LA by the tenth of each month. RMS will deliver LA and other supplies directly to the facilities by end of the month. The lead time is almost one month or could be longer if some facilities did not send their reports in time. Among the 44 facilities, only 22 (50 percent) facilities reported that they are aware of the forms and the procedures for reporting and ordering. Most of the facilities did not know that the white copies of dispensing registers must be submitted for reporting. Some facilities were given the LMIS01A form without the list of LA and some CHAM facilities were not even given the LMIS01A form or did not know how to fill out and submit the report. Since the dispensing register books were delivered in February, the facilities have not yet submitted white copies for monthly reports. Table 7 shows that 33 facilities (75 percent) had submitted their report for January 2008, 24 were government facilities (55 percent), and 18 percent of

Report for Monitoring ACT and Malaria Control Activities
10
the CHAM facilities did not submit the report compared to 7 percent of the government facilities. Table 7. Reporting Status of Facilities
Government Facilities
CHAM Facilities Total
No. and % of the facilities submitted LA report for Jan 2008 (Denominator: 44)
24 (55%)
9 (20%)
33 (75%)
No. and % of the facilities did not submit LA report for Jan 2008 (Denominator: 44)
3 (7%)
8 (18%)
11 (25%)
Twenty (45 percent) facilities submitted reports for January 2008 on time, only 18 (41 percent) facilities ordered LA because the other 2 facilities had adequate stock, and 13 (30 percent) facilities reported late. Table 8 indicates the response of RMS. Sixteen (36 percent) facilities received the second or third consignment of LA by the day of visit, 15 of them have reported for January 2008. One did not submit the report was supplied, which might be supplied by the DHO for the emergency order. Table 8. Supply Status for Jan. 2008 Report
Government Facilities
CHAM Facilities Total
No. and % of the facilities submitted report and ordered LA for Jan 2008 timely (denominator: 44)
13 (30%)
5 (11%)
18 (41%)
Those ordered timely were supplied by the day of visit (denominator: 18)
8 (44%)
0 (0%)
8 (44%)
No. and % of the facilities submitted report and ordered LA for Jan 2008 late (denominator: 44)
10 (23%)
3 (7%)
13 (30%)
Those ordered late were supplied by the day of visit (denominator: 13)
7 (54%)
0 (0%)
7 (54%)
All those ordered were supplied by the day of visit (denominator: 31)
15(48%)
0(0%)
31(100%)
Ten of the 15 facilities supplied after their January report are District hospitals. Because of the shortage in RMS, supplies were rationed; only DHOs were supplied and it was expected that the DHOs would supply the health centers and CHAM facilities. Record Keeping for Delivery Notes
Delivery notes (DNs) were used to check against the stock cards for the received consignments. The district pharmacy technicians were requested to bring the delivery notes
Introduction
11
which the facilities submitted for supervision. However, most of the facilities did not submit or even did not know that one copy of the delivery notes should be given to DHO. Therefore, the delivery notes filed at the facilities were used for the same purpose. There were 28 (64 percent) facilities with the number of delivery notes matching the number of records on the stock cards, and 27 (61 percent) facilities correctly captured the information on the stock cards. Only 19 (43 percent) facilities properly filed their delivery notes by the order of date or month. The district hospitals usually have many more delivery notes (including blue copies) which were not filed by the order of requisition numbers. Table 9 illustrates the documentation conditions of the delivery notes. Table 9. Documentation of Delivery Notes
All correctly recorded
Not all correctly recorded
DNs missing Othersa N/A
Information of DNs recorded on stock cards 27 (61%) 7 (16%) 3 (7%) 2 (5%) 5 (11%)
Properly filed Not properly filed
DNs missingb
DNs not given N/A
Filing of delivery notes 19 (43%) 16 (36%) 3 (7%) 1 (2%) 5 (11%) aOthers: Delivery note was not given to 1 facility when it received the first consignment from CHAM; one facility
did not open stock cards. bDelivery notes missing after they were filed.
Inventory Control of LA and Essential Drugs and Supplies for Malaria Treatment
The inventory control for the essential drugs and medical supplies for the treatment of malaria and its complications were assessed through the following criteria—
• Availability of commodities
• Presentation of the stock cards
• Updating of the stock cards—whether the physical stocks tally with the balance on the stock cards
The essential commodities were categorized into four groups: LA, other malaria medicines and medicines for complications, IV infusions and medical supplies, and diagnostic equipment. This is based on the observations of the different attentions paid to the above commodities by the pharmacy staff.
Report for Monitoring ACT and Malaria Control Activities
12
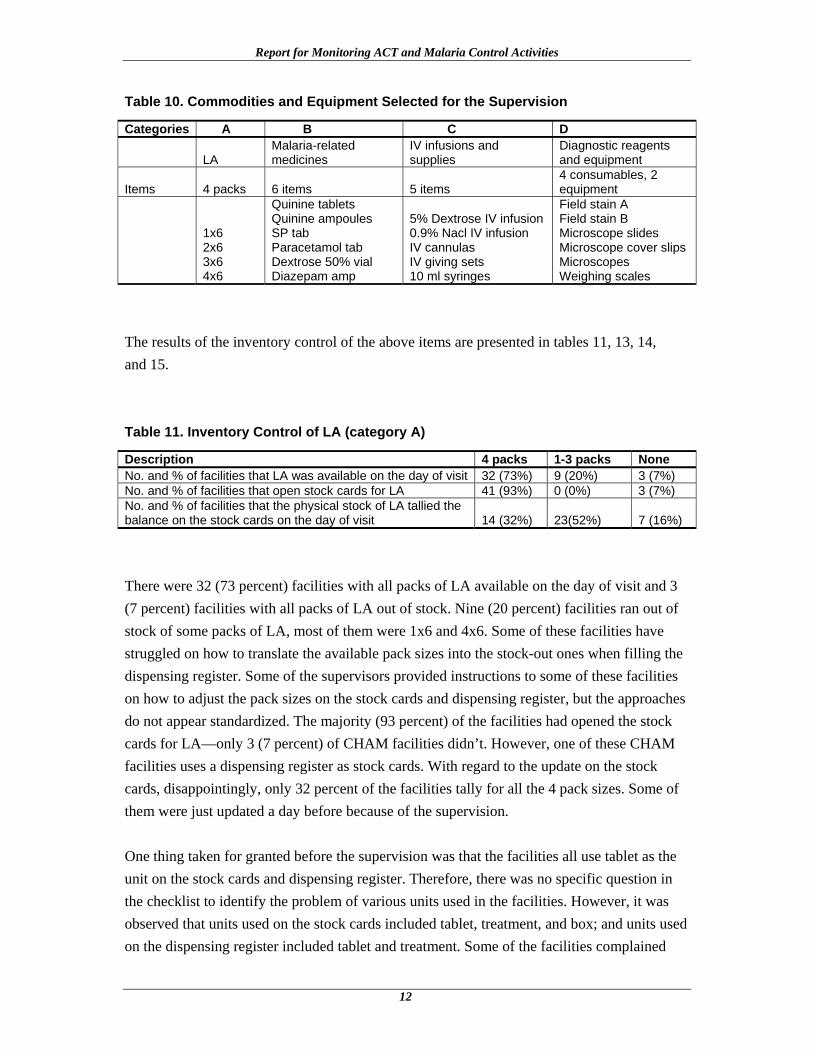
Table 10. Commodities and Equipment Selected for the Supervision
Categories A B C D
LA Malaria-related medicines
IV infusions and supplies
Diagnostic reagents and equipment
Items 4 packs 6 items 5 items 4 consumables, 2 equipment
1x6 2x6 3x6 4x6
Quinine tablets Quinine ampoules SP tab Paracetamol tab Dextrose 50% vial Diazepam amp
5% Dextrose IV infusion 0.9% Nacl IV infusion IV cannulas IV giving sets 10 ml syringes
Field stain A Field stain B Microscope slides Microscope cover slips Microscopes Weighing scales
The results of the inventory control of the above items are presented in tables 11, 13, 14, and 15. Table 11. Inventory Control of LA (category A)
Description 4 packs 1-3 packs NoneNo. and % of facilities that LA was available on the day of visit 32 (73%) 9 (20%) 3 (7%) No. and % of facilities that open stock cards for LA 41 (93%) 0 (0%) 3 (7%) No. and % of facilities that the physical stock of LA tallied the balance on the stock cards on the day of visit 14 (32%) 23(52%) 7 (16%)
There were 32 (73 percent) facilities with all packs of LA available on the day of visit and 3 (7 percent) facilities with all packs of LA out of stock. Nine (20 percent) facilities ran out of stock of some packs of LA, most of them were 1x6 and 4x6. Some of these facilities have struggled on how to translate the available pack sizes into the stock-out ones when filling the dispensing register. Some of the supervisors provided instructions to some of these facilities on how to adjust the pack sizes on the stock cards and dispensing register, but the approaches do not appear standardized. The majority (93 percent) of the facilities had opened the stock cards for LA—only 3 (7 percent) of CHAM facilities didn’t. However, one of these CHAM facilities uses a dispensing register as stock cards. With regard to the update on the stock cards, disappointingly, only 32 percent of the facilities tally for all the 4 pack sizes. Some of them were just updated a day before because of the supervision. One thing taken for granted before the supervision was that the facilities all use tablet as the unit on the stock cards and dispensing register. Therefore, there was no specific question in the checklist to identify the problem of various units used in the facilities. However, it was observed that units used on the stock cards included tablet, treatment, and box; and units used on the dispensing register included tablet and treatment. Some of the facilities complained

Introduction
13
that using the unit of tablet is very burdensome since it takes time to calculate and is prone to mathematical errors since most of the facilities do not have calculators, in particular in the district hospitals where large quantities are managed. Information collected from Central East Zone and Northern Zone (18 facilities) (table 12) indicates that slightly more facilities use the unit of treatment than use the tablet unit, so as the number of the facilities whose physical stock of all LA packs tally the balances on the stock cards. However, the small sample size may not allow this conclusion to apply to all country facilities. This requires further investigation and discussion with the people working in the pharmacy and filling dispensing registers. Table 12. Unit Used on Stock Cards and Dispensing Registers
Descriptions Tablet Treatment Box Mixed No. and % of facilities using the indicated units on the stock cards (denominator–18) 7 (39%) 8 (44%) 2(11%) 1 (6%) No. and % of facilities using the indicated units on the dispensing register (denominator–18) 6 (33%) 5 (29%) N/A 7 (39%) No. and % of facilities that the physical stock of all pack sizes of LA tallied the balance on the stock cards on the day of visit (denominator–18) 1 (6%) 3 (17%) 0 0 N/A = nonapplicable
Tables 13 and 14 demonstrate that the facilities paid less attention to the management of essential medicines and sundries, particularly the IV infusions and medical supplies. Quinine tablets and injectables were out of stock in many facilities. Although quinine tablets are not eligible to be stocked in health centers, most of the health centers did have this medicine. The unit of dextrose 50 percent also caused confusion to many facilities since the volume of the bottle changed from 20 milliliter (ml) to 50 ml. The information in table 14 implies that the management of IV infusions and medical supplies needs more attention of the districts’ management team. Some facilities did not open stock cards for IV infusions and medical supplies, and some of the supplies were seen mixed or stored in bad conditions such as in a leaking store or in a store mixed with expired commodities.

Report for Monitoring ACT and Malaria Control Activities
14
Table 13. Inventory Control of Essential Medicines (category B) Related to Malaria Treatment
Descriptions 6 items 1-5 items NoneNo. and % of facilities that these items were available on the day of visit 20 (45%) 24 (55%) 0 (0%) No. and % of facilities that open stock cards 34 (77%) 7 (16%) 3 (7%) No. and % of facilities that the physical stock of items tallied the balance on the stock cards on the day of visit 10 (23%) 32 (73%) 2 (4%)
Table 14 Inventory Control of IV Infusions and Medical Supplies (category C)
Descriptions 5 items 1-4 items None
No. and % of facilities that these items were available on the day of visit 20 (45%) 24 (55%) 0 (0%) No. and % of facilities that open stock cards 17 (39%) 22 (50%) 5 (11%) No. and % of facilities that the physical stock of these items tallied the balance on the stock cards on the day of visit 7 (16%) 29 (66%) 8 (18%)
As previously described, only 26 facilities have microscopes to use for malaria diagnosis. However, shortage of the reagents or slides might hamper the services. Table 15 presents the stock status of the consumables for microscopes. Most of these items were kept in the lab but most of the lab technicians or assistants do not know how to manage inventory. Table 15. Inventory Control of Consumables for Microscopes (category D)
Descriptions 4 items 1-3 items NoneNo. and % of facilities that these items were available on the day of visit 15 (58%) 11 (42%) 0 (0%) No. and % of facilities that open stock cards 13 (50%) 5 (19%) 8 (31%)No. and % of facilities that the physical stock of these items tallied the balance on the stock cards on the day of visit 9 (35%) 6 (23%) 11 (42%)
Data on the availability of weight scales was incomplete, 13 facilities did not provide the information, and 4 facilities showed that they do not have any weight scales that function. Stock-out of LA and Essential Medicines, Dec. 2007–Feb. 2008
Most of the facilities started using LA in December 2007. By end of February 2008, the wide-spread complaints of stock-out had negatively affected how the implementation of the new malaria treatment was perceived. The data in Table 16 and 17 provide a better picture of
Introduction
15
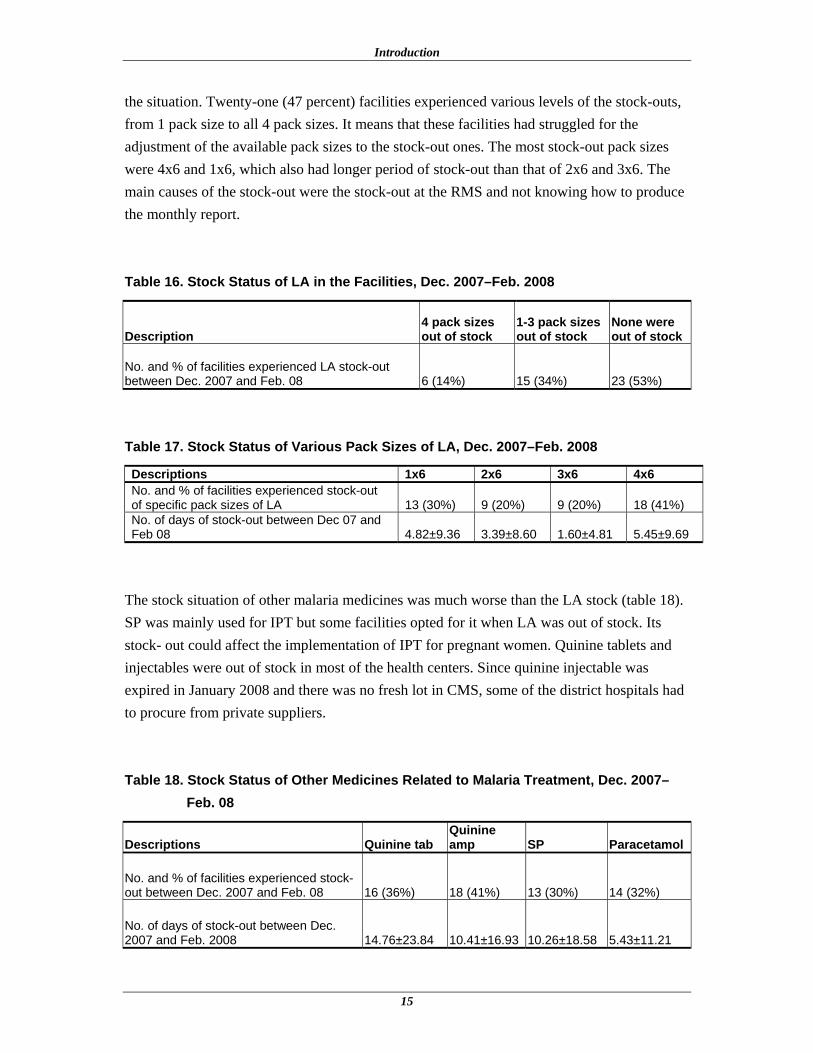
the situation. Twenty-one (47 percent) facilities experienced various levels of the stock-outs, from 1 pack size to all 4 pack sizes. It means that these facilities had struggled for the adjustment of the available pack sizes to the stock-out ones. The most stock-out pack sizes were 4x6 and 1x6, which also had longer period of stock-out than that of 2x6 and 3x6. The main causes of the stock-out were the stock-out at the RMS and not knowing how to produce the monthly report. Table 16. Stock Status of LA in the Facilities, Dec. 2007–Feb. 2008
Description 4 pack sizes out of stock
1-3 pack sizes out of stock
None were out of stock
No. and % of facilities experienced LA stock-out between Dec. 2007 and Feb. 08 6 (14%) 15 (34%) 23 (53%)
Table 17. Stock Status of Various Pack Sizes of LA, Dec. 2007–Feb. 2008
Descriptions 1x6 2x6 3x6 4x6No. and % of facilities experienced stock-out of specific pack sizes of LA 13 (30%) 9 (20%) 9 (20%) 18 (41%) No. of days of stock-out between Dec 07 and Feb 08 4.82±9.36 3.39±8.60 1.60±4.81 5.45±9.69
The stock situation of other malaria medicines was much worse than the LA stock (table 18). SP was mainly used for IPT but some facilities opted for it when LA was out of stock. Its stock- out could affect the implementation of IPT for pregnant women. Quinine tablets and injectables were out of stock in most of the health centers. Since quinine injectable was expired in January 2008 and there was no fresh lot in CMS, some of the district hospitals had to procure from private suppliers. Table 18. Stock Status of Other Medicines Related to Malaria Treatment, Dec. 2007–
Feb. 08
Descriptions Quinine tab Quinine amp SP Paracetamol
No. and % of facilities experienced stock-out between Dec. 2007 and Feb. 08 16 (36%) 18 (41%) 13 (30%) 14 (32%)
No. of days of stock-out between Dec. 2007 and Feb. 2008 14.76±23.84 10.41±16.93 10.26±18.58 5.43±11.21
Report for Monitoring ACT and Malaria Control Activities
16
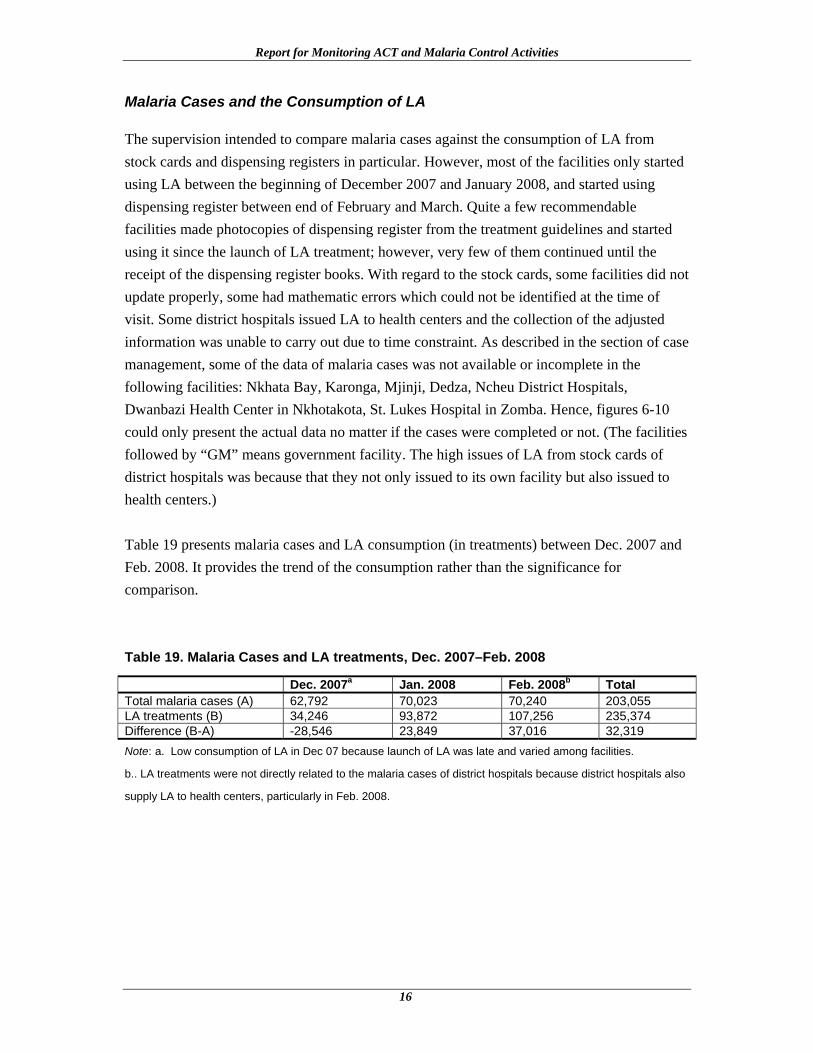
Malaria Cases and the Consumption of LA
The supervision intended to compare malaria cases against the consumption of LA from stock cards and dispensing registers in particular. However, most of the facilities only started using LA between the beginning of December 2007 and January 2008, and started using dispensing register between end of February and March. Quite a few recommendable facilities made photocopies of dispensing register from the treatment guidelines and started using it since the launch of LA treatment; however, very few of them continued until the receipt of the dispensing register books. With regard to the stock cards, some facilities did not update properly, some had mathematic errors which could not be identified at the time of visit. Some district hospitals issued LA to health centers and the collection of the adjusted information was unable to carry out due to time constraint. As described in the section of case management, some of the data of malaria cases was not available or incomplete in the following facilities: Nkhata Bay, Karonga, Mjinji, Dedza, Ncheu District Hospitals, Dwanbazi Health Center in Nkhotakota, St. Lukes Hospital in Zomba. Hence, figures 6-10 could only present the actual data no matter if the cases were completed or not. (The facilities followed by “GM” means government facility. The high issues of LA from stock cards of district hospitals was because that they not only issued to its own facility but also issued to health centers.) Table 19 presents malaria cases and LA consumption (in treatments) between Dec. 2007 and Feb. 2008. It provides the trend of the consumption rather than the significance for comparison. Table 19. Malaria Cases and LA treatments, Dec. 2007–Feb. 2008
Dec. 2007a Jan. 2008 Feb. 2008b Total Total malaria cases (A) 62,792 70,023 70,240 203,055 LA treatments (B) 34,246 93,872 107,256 235,374 Difference (B-A) -28,546 23,849 37,016 32,319 Note: a. Low consumption of LA in Dec 07 because launch of LA was late and varied among facilities.
b.. LA treatments were not directly related to the malaria cases of district hospitals because district hospitals also
supply LA to health centers, particularly in Feb. 2008.

Introduction
17
Note: Data of malaria cases was incomplete in Nkhata Bay and Karonga District Hospitals. Data of LA issues
from stock cards was incomplete in Rumphi district hospital. Figure 7. Comparison of malaria cases and LA issues in Northern Zone, Dec. 2007–
Feb. 2008
Note: Data of malaria cases was incomplete in Dwanbazi Health Center (GM) in Nkhotakota district. Mtango
Wanthaga Hospital used dispensing registers as stock cards.
Figure 8. Comparison of malaria cases and LA issues in Central East Zone, Dec. 2007–Feb. 2008

Report for Monitoring ACT and Malaria Control Activities
18
Note: Data of malaria cases was not available or incomplete in Mchinji, Dedza, and Ncheu District
Hospitals.
Figure 9. Comparison of malaria cases and LA issues in Central West Zone, Dec. 2007–Feb. 2008
Note: Data of malaria cases was incomplete in St. Lukes Hospital in Zomba. Higher LA issues in dispensing
registers than malaria cases reported in Machinga District Hospital.
Figure 10. Comparison of malaria cases and LA issues in Southern East Zone, Dec. 2007–Feb. 2008

Introduction
19
Note: Data of LA issues from dispensing register in Mlambe Hospital was incomplete. Chididi Health Center did
not open stock cards for LA.
Figure 11. Comparison of malaria cases and LA issues in Southern West Zone, Dec. 2007–Feb. 2008
The Holy Family Hospital in Phalombe (Southern East zone) presented a better idea of the relationship of the data among malaria cases, issues from stock cards, and from dispensing register since the difference between the issues from stock cards and dispensing registers was as small as possible, which is the hoped for outcome. Those facilities with higher issues of LA than malaria cases and with a big difference between the issues from stock cards and dispensing registers need to be further investigated. IPT and SP Consumption
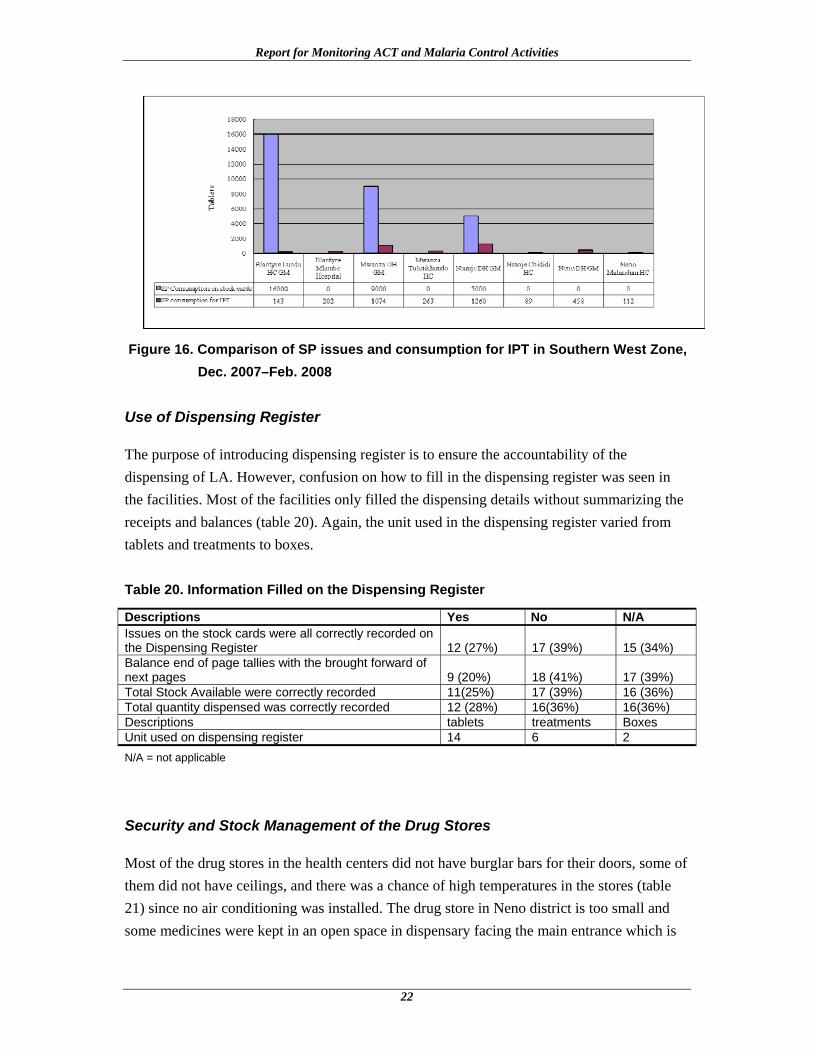
High consumption of SP in some facilities was observed during the supervision. Apart from being used for IPT, some SP was used before the new treatment was launched and while LA was out of stock. The district hospitals also supplied SP to the facilities if necessary. The extremely high consumption of SP in certain health centers implied the need for investigation and close supervision. Since SP is mainly used for IPT for pregnant women, figures 11 to 15 attempted to compare the issues of SP from stock cards against its consumption for IPT. The difference between the two may imply that SP was used for general malaria cases, and if compare to the consumption of LA and malaria cases, it might again highlight the problems of under-recording of malaria cases or over-consumption of the medicines. Jenda Health Center in Mzimba district (figure 11) and Mtengo Wanthenga Hospital (figure 12) provide a good picture of how SP is issued for IPT. Special attention should be paid to Nkhotakota St. Annes Hospital (figure 12); Lilongwe Nkhoma Hospital (figure 13); Phalombe Migowi Health Center and Holy Family Hospital (figure 14); and Blantyre Lundu Health center (figure 15).

Report for Monitoring ACT and Malaria Control Activities
20
Figure 12. Comparison of SP issues and consumption for IPT in Northern Zone, Dec. 2007–Feb. 2008
Figure 13. Comparison of SP issues and consumption for IPT in Central East Zone, Dec. 2007–Feb. 2008

Introduction
21
Figure 14. Comparison of SP issues and consumption for IPT in Central West Zone,
Dec. 2007–Feb. 2008
Figure 15. Comparison of SP issues and consumption for IPT in Southern East Zone,
Dec. 2007–Feb. 2008
Report for Monitoring ACT and Malaria Control Activities
22
Figure 16. Comparison of SP issues and consumption for IPT in Southern West Zone,
Dec. 2007–Feb. 2008
Use of Dispensing Register
The purpose of introducing dispensing register is to ensure the accountability of the dispensing of LA. However, confusion on how to fill in the dispensing register was seen in the facilities. Most of the facilities only filled the dispensing details without summarizing the receipts and balances (table 20). Again, the unit used in the dispensing register varied from tablets and treatments to boxes. Table 20. Information Filled on the Dispensing Register
Descriptions Yes No N/A Issues on the stock cards were all correctly recorded on the Dispensing Register 12 (27%) 17 (39%) 15 (34%) Balance end of page tallies with the brought forward of next pages 9 (20%) 18 (41%) 17 (39%) Total Stock Available were correctly recorded 11(25%) 17 (39%) 16 (36%) Total quantity dispensed was correctly recorded 12 (28%) 16(36%) 16(36%) Descriptions tablets treatments Boxes Unit used on dispensing register 14 6 2 N/A = not applicable
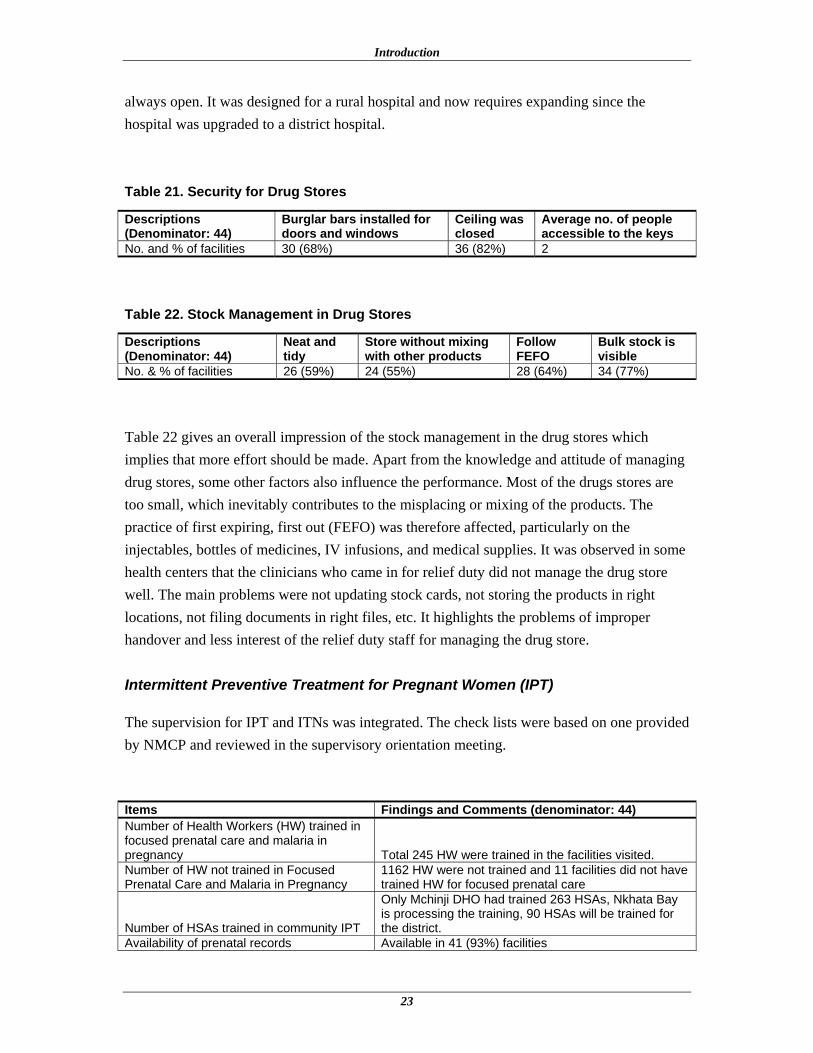
Security and Stock Management of the Drug Stores
Most of the drug stores in the health centers did not have burglar bars for their doors, some of them did not have ceilings, and there was a chance of high temperatures in the stores (table 21) since no air conditioning was installed. The drug store in Neno district is too small and some medicines were kept in an open space in dispensary facing the main entrance which is
Introduction
23
always open. It was designed for a rural hospital and now requires expanding since the hospital was upgraded to a district hospital. Table 21. Security for Drug Stores
Descriptions (Denominator: 44)
Burglar bars installed for doors and windows
Ceiling was closed
Average no. of people accessible to the keys
No. and % of facilities 30 (68%) 36 (82%) 2
Table 22. Stock Management in Drug Stores
Descriptions (Denominator: 44)
Neat and tidy
Store without mixing with other products
Follow FEFO
Bulk stock is visible
No. & % of facilities 26 (59%) 24 (55%) 28 (64%) 34 (77%)
Table 22 gives an overall impression of the stock management in the drug stores which implies that more effort should be made. Apart from the knowledge and attitude of managing drug stores, some other factors also influence the performance. Most of the drugs stores are too small, which inevitably contributes to the misplacing or mixing of the products. The practice of first expiring, first out (FEFO) was therefore affected, particularly on the injectables, bottles of medicines, IV infusions, and medical supplies. It was observed in some health centers that the clinicians who came in for relief duty did not manage the drug store well. The main problems were not updating stock cards, not storing the products in right locations, not filing documents in right files, etc. It highlights the problems of improper handover and less interest of the relief duty staff for managing the drug store. Intermittent Preventive Treatment for Pregnant Women (IPT)
The supervision for IPT and ITNs was integrated. The check lists were based on one provided by NMCP and reviewed in the supervisory orientation meeting. Items Findings and Comments (denominator: 44) Number of Health Workers (HW) trained in focused prenatal care and malaria in pregnancy Total 245 HW were trained in the facilities visited. Number of HW not trained in Focused Prenatal Care and Malaria in Pregnancy
1162 HW were not trained and 11 facilities did not have trained HW for focused prenatal care
Number of HSAs trained in community IPT
Only Mchinji DHO had trained 263 HSAs, Nkhata Bay is processing the training, 90 HSAs will be trained for the district.
Availability of prenatal records Available in 41 (93%) facilities

Report for Monitoring ACT and Malaria Control Activities
24
Availability of DOT equipment
Available in 33 (75%) facilities. However, there was no supervision for DOT. Some facilities did not have cups, hence using drug containers.
Availability of IEC materials Available in 29 (66%) facilities. It was not displayed at Mkhuzi health center in Nchisi district.
No. of pregnant women who received first dose of SP 14,834—Incomplete data No. of pregnant women who received second dose of SP 11,024—Incomplete data
NMCP checklist for insecticide-treated nets (ITNs)
Items Findings and Comments (denominator: 44)
No. and % of facilities had the ITNs in stock on the day of the visit
31 (70%) facilities
No. and % of facilities had stock-outs of the ITNs for one week or more within past 3 months
27 (61%) facilities
Number of ITNs received in the past 3 months
31,986 ITNs were received in 40 facilities. Mkhuzi HC (Nchisi), St Andrews hospital (Kasungu), Tulonkhondo HC (Mwanza), and Mtandani HC did not receive any nets in the past 3 months. Mtandani HC had old stock and did not request more nets. Machinga DHO only received 450 nets and estimated 1,000 to satisfy the need. St. Andrews hospital requested a supply of nets; the malaria coordinator will take up the issue.
No. and % of facilities had ITNs available for under one and pregnant women 33 (75%) facilities
Number of health workers trained in ITNS
681 HCW in 8 districts: Nkhata Bay, Karonga, Rumphi, Nkhotakota, Mjinji, Balaka, Machinga, Mulanje; 158 in rest of the facilities visited
No. and % of facilities had Client Register
41 (93%) facilities had client register. St. Andrews hospital did not have ITN service and requested to provide the service. Nkhoma hospital had the service but did not have client register.
No. and % of facilities correctly filled the clients registers 39 (87%) facilities had correctly filled the records. No. and % of facilities had ITNs guidelines Only 17 (39%) facilities had ITN guidelines.
No. and % of facilities had ITNs Stock Cards
40 (91%) facilities had ITN stock cards. It was observed that Chididi HC and Dedza DHO did not update the stock cards, and Namandanje HC did not use the stock cards. Nkhoma hospital did not have stock cards though provided services.

25
DISCUSSIONS AND RECOMMENDATIONS
In summary, there are some challenges facing the implementation of new malaria treatment as observed from the supervision—
• Poor documentation on HMIS, stock cards, and dispensing registers; these documents provide important information on epidemiology and drug management which will be used to understand the disease burden and to plan for drug supply.
• Late monthly reporting of some facilities affected the whole district that, in turn, affected the timely drug supply. Some facilities, particularly CHAM facilities, have struggled to understand the reporting procedures.
• Supplies were rationed by Regional Medical Stores because or short stock which caused the further rationing and delay of supply from DHOs to the facilities.
• Diagnostic tools (microscopes) were not available in most of the health centers. It was observed in Central East Zone that the facilities with microscopes had fewer malaria cases.
• Some untrained health workers were prescribing or managing LA. Most of them were newly recruited and yet to be identified for training.
• The communication with patients on how to use LA was compromised mainly because of to high workload
• Shortage of staff and the relief- duty staff’s* lack of interest in drug management negatively impacted the drug management in some facilities. Interruption of record keeping at the drug store was often observed during the time that permanent staff was on leave and relief duty staff took over the responsibility.
* Relief-duty staff are the health care workers (mainly clinicians and nurses) who are on leave from their posted
health facilities and part-time assist other facilities on locum basis.
Report for Monitoring ACT and Malaria Control Activities
26
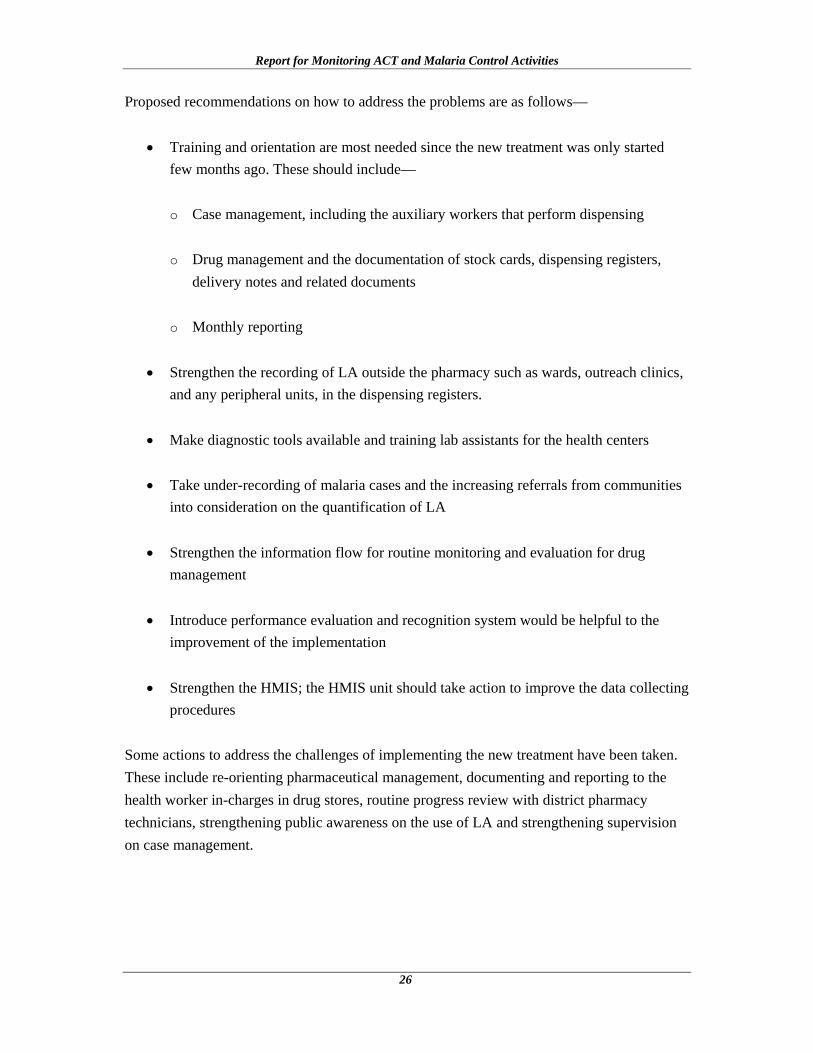
Proposed recommendations on how to address the problems are as follows—
• Training and orientation are most needed since the new treatment was only started few months ago. These should include— o Case management, including the auxiliary workers that perform dispensing
o Drug management and the documentation of stock cards, dispensing registers,
delivery notes and related documents
o Monthly reporting
• Strengthen the recording of LA outside the pharmacy such as wards, outreach clinics, and any peripheral units, in the dispensing registers.
• Make diagnostic tools available and training lab assistants for the health centers
• Take under-recording of malaria cases and the increasing referrals from communities into consideration on the quantification of LA
• Strengthen the information flow for routine monitoring and evaluation for drug management
• Introduce performance evaluation and recognition system would be helpful to the improvement of the implementation
• Strengthen the HMIS; the HMIS unit should take action to improve the data collecting procedures
Some actions to address the challenges of implementing the new treatment have been taken. These include re-orienting pharmaceutical management, documenting and reporting to the health worker in-charges in drug stores, routine progress review with district pharmacy technicians, strengthening public awareness on the use of LA and strengthening supervision on case management.
27
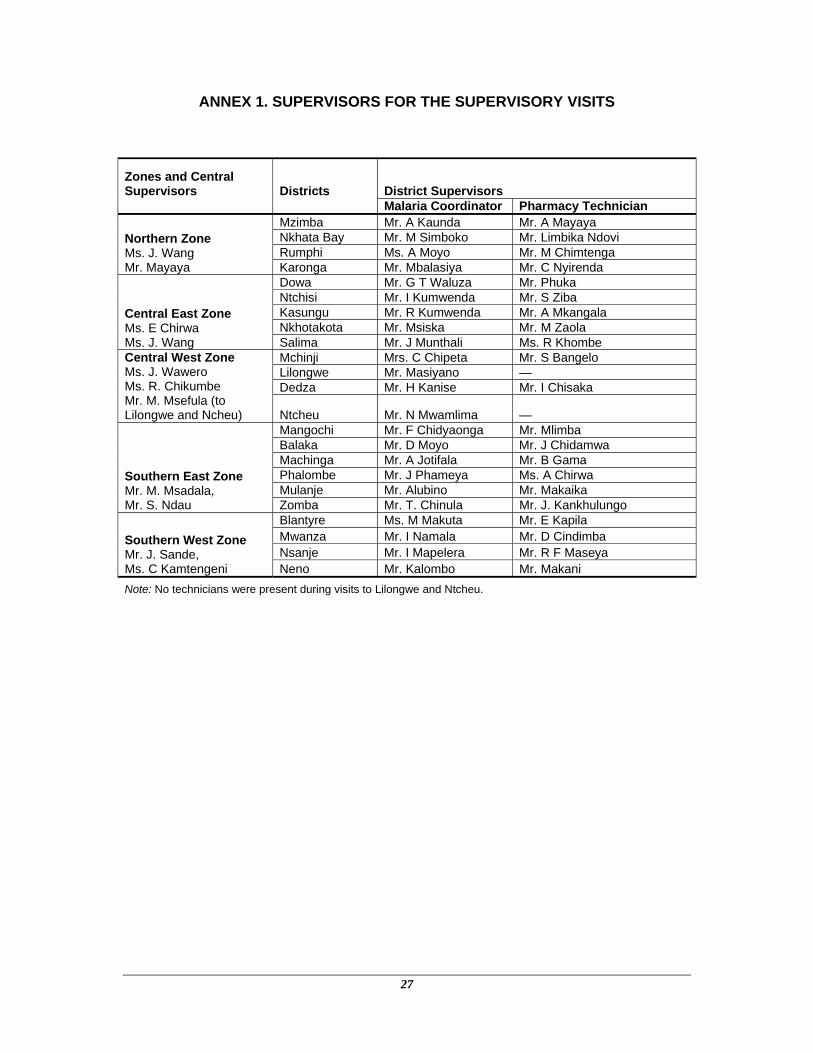
ANNEX 1. SUPERVISORS FOR THE SUPERVISORY VISITS
Zones and Central Supervisors Districts District Supervisors Malaria Coordinator Pharmacy Technician
Northern Zone Ms. J. Wang Mr. Mayaya
Mzimba Mr. A Kaunda Mr. A Mayaya Nkhata Bay Mr. M Simboko Mr. Limbika Ndovi Rumphi Ms. A Moyo Mr. M Chimtenga Karonga Mr. Mbalasiya Mr. C Nyirenda
Central East Zone Ms. E Chirwa Ms. J. Wang
Dowa Mr. G T Waluza Mr. Phuka Ntchisi Mr. I Kumwenda Mr. S Ziba Kasungu Mr. R Kumwenda Mr. A Mkangala Nkhotakota Mr. Msiska Mr. M Zaola Salima Mr. J Munthali Ms. R Khombe
Central West Zone Ms. J. Wawero Ms. R. Chikumbe Mr. M. Msefula (to Lilongwe and Ncheu)
Mchinji Mrs. C Chipeta Mr. S Bangelo Lilongwe Mr. Masiyano — Dedza Mr. H Kanise Mr. I Chisaka
Ntcheu Mr. N Mwamlima —
Southern East Zone Mr. M. Msadala, Mr. S. Ndau
Mangochi Mr. F Chidyaonga Mr. Mlimba Balaka Mr. D Moyo Mr. J Chidamwa Machinga Mr. A Jotifala Mr. B Gama Phalombe Mr. J Phameya Ms. A Chirwa Mulanje Mr. Alubino Mr. Makaika Zomba Mr. T. Chinula Mr. J. Kankhulungo
Southern West Zone Mr. J. Sande, Ms. C Kamtengeni
Blantyre Ms. M Makuta Mr. E Kapila Mwanza Mr. I Namala Mr. D Cindimba Nsanje Mr. I Mapelera Mr. R F Maseya Neno Mr. Kalombo Mr. Makani
Note: No technicians were present during visits to Lilongwe and Ntcheu.

28
ANNEX 2. FACILITIES VISITED MARCH 10–20, 2008 Zones Districts Government Facilities CHAM Facilities
Northern
Mzimba District Hospital Jenda HC Nkhata Bay District Hospital Luwazi HC Rumphi District Hospital Mlowe HC Karonga District Hospital St. Annes Hospital
Central East
Dowa Chankhuga HC Mtango Wanthenga Hospital
Nchisi Mkhuzi HC Khuwi HC Kasungu Mtunthama HC St Andrews Hospital Nkhotakota Dwanbazi HC St Annes Hospital Salima Mchoka HC Chipoka HC
Central West
Mchinji District Hospital Chipumi HC Lilongwe Nkhoma Hospital Dedza District Hospital Mlangali HC Ntcheu District Hospital
Southern East
Mangochi District Hospital St Martins Hospital Balaka District Hospital Phalula HC Machinga District Hospital Namandanje HC Phalombe Migowi HC Holy Family Hospital Mulanje District Hospital Namasalima HC Zomba Domasi RH St Lukes Hospital
Southern West
Blantyre Lundu HC Mlambe Hospital Mwanza District Hospital Tulonkhondo HC Nsanje District Hospital Chididi HC Neno District Hospital Matandani HC


