61
REPUBLIC OF UGANDA Population Secretariat Ministry of Finance, Planning and Economic Development 1
| Date post: | 15-Dec-2015 |
| Category: |
Documents |
| Upload: | alanis-fraser |
| View: | 223 times |
| Download: | 1 times |

REPUBLIC OF UGANDA
Population SecretariatMinistry of Finance, Planning and
Economic Development
1

2
UgandaUganda:: Population Factors & Population Factors & National DevelopmentNational Development
October 2009J. Owen-Rae / USAID

Outline
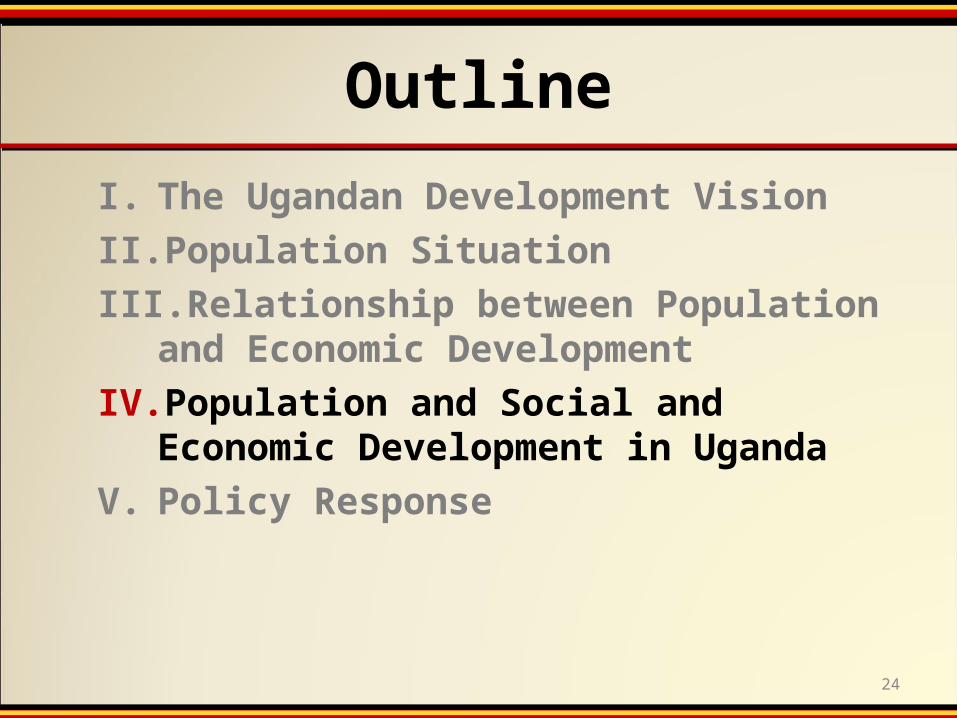
I. The Ugandan Development VisionII. Population SituationIII.Relationship between Population
and Economic DevelopmentIV.Population and Social and
Economic Development in UgandaV. Policy Response
3 3

Outline
I. The Ugandan Development VisionII. Population SituationIII.Relationship between Population
and Economic DevelopmentIV.Population and Social and
Economic Development in Uganda V. Policy Response
4
Despite notable progress, Uganda remains among the poorest countries in the world . . .

Uganda's Development Vision
6
A transformed Ugandan society from a peasant to a modern and prosperous
country within 30 years

7
What is the importance of population factors to the ability of Uganda to achieve its national vision in coming decades?

Outline
I. The Ugandan VisionII. Population SituationIII.Relationship between Population
and Economic DevelopmentIV.Population and Social and
Economic Development in UgandaV. Policy Response
8

Population growth
6.59.5
12.6
16.7
24.2
31.2
5.0
0.0
5.0
10.0
15.0
20.0
25.0
30.0
35.0
1948 1959 1969 1980 1991 2002 2009
Mil
lio
ns
of
peo
ple
9

Fertility rate
10
Uganda’s fertility rate is 6.7 children per woman
Source: Uganda Demographic and Health Survey 2006
© 2008 Dave Blume

Comparative fertility rates
6.76.2 6.1 6.0 5.7
4.6
0
1
2
3
4
5
6
7
8
Uganda(2006)
Zambia(2007)
Rwanda(2005)
Malawi(2004)
Tanzania(2004)
Kenya(2007)
11

12
Uganda has a very young population . . .
About half the population is under the age of 15-25% -20% -15% -10% -5% 0% 5% 10% 15% 20% 25%
Male Female
80 +75-7970-7465-6960-6455-5950-5445-4940-4435-3930-3425-2920-2415-1910-14
5-90-4
01520 10 5
Ag
e in
yea
rs
15 2010525 25Percent of the population

Fertility rate assumptions . . .
6.36.7 6.0
4.4
2.2
0
1
2
3
4
5
6
7
2007 2012 2017 2022 2027 2032 2037
Nu
mb
er o
f b
irth
s p
er w
om
an
High fertility Declining fertility
13

Uganda’s population will grow rapidly with continued high fertility . . .
50.9
29.0
88.8
0
20
40
60
80
100
2007 2012 2017 2022 2027 2032 2037
Po
pu
lati
on
(m
illi
on
s)
High fertility
14

However, the population will grow more slowly if fertility declines in coming decades . . .
88.8
31.1
50.9 62.4
46.5
0
20
40
60
80
100
2010 2012 2017 2022 2027 2032 2037
Po
pu
lati
on
(m
illi
on
s)
High fertility Declining fertility
15

Outline
I. The Ugandan Development VisionII. Population SituationIII.Relationship between Population
and Economic DevelopmentIV.Population and Social and
Economic Development in Uganda V. Policy Response
16

17
Two Major Messages . . .
1) Slower population growth creates the potential to increase the pace of aggregate economic growth
2) Rapid fertility decline at the country level helps create a path out of poverty for many families
Source: Population Matters: Demographic Change, Economic Growth, and Poverty in the Developing World and Population Dynamics and Economic Development: Filling the Research Gaps.
Photo credit: K. Burns / USAID.

18
Africa looks to learn from the East Asian countries the best ways of achieving fast economic growth.

The Asian Tigers achieved unexpectedly rapid development
19

Thailand emerged as a middle-incomecountry in a single generation . . .
317384
516602
796
956
1,462
0
200
400
600
800
1,000
1,200
1,400
1,600
1960 1965 1970 1975 1980 1985 1990
GD
P P
er
Ca
pit
a
(co
ns
tan
t 2
00
0 U
S$
)
Source: The World Bank. World Development Indicators, February 3, 2008. 20

Thai fertility moved from high to low levels . . .
6.4 6.15.4
4.4
3.32.6
2.2
0
1
2
3
4
5
6
7
8
1960 1965 1970 1975 1980 1985 1990
Bir
ths
per
wo
man
Source: The World Bank. World Development Indicators, February 3, 2008. 21

22
Declining fertility a key factor in the Asian economic “miracle” . . . Greater emphasis on the quality of the
population rather than sheer numbers
More and better educational opportunities
More investment in modern agriculture
Higher levels of savings and investment with lower dependency ratios

Uganda aspires to become a strong middle-income economy in Africa . . .
23
Outline
I. The Ugandan Development VisionII. Population SituationIII.Relationship between Population
and Economic DevelopmentIV.Population and Social and
Economic Development in UgandaV. Policy Response
24

© 2007 David Sasaki
Urbanisation
Population affects social and economic development in Uganda
Education
K. Burns / USAID
Agriculture
© 2005 Laura Darby
Economy© 2008 Maisha Elonai© 2008 Maisha Elonai
Environment
© 2004 Louris Yamaguchi© 2004 Louris Yamaguchi
Health
© 2006 AMREF, Courtesy of Photoshare
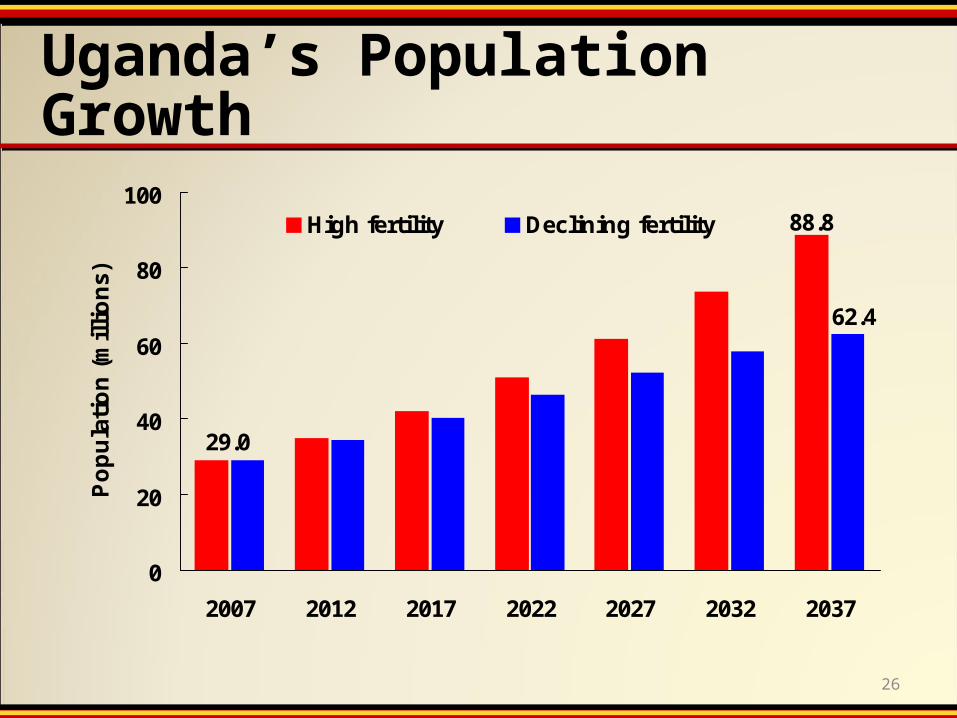
Uganda’s Population Growth
29.0
88.8
62.4
0
20
40
60
80
100
2007 2012 2017 2022 2027 2032 2037
Po
pu
lati
on
(m
illi
on
s)
High fertility Declining fertility
26

Education Education

Number of primary students,
2007-2037
18.4
7.5
10.2
0
5
10
15
20
2007 2012 2017 2022 2027 2032 2037
Pri
mar
y st
ud
ents
(m
illi
on
s)
High fertility Declining fertility
28

Number of primary teachers required, 2007-2037
459.8
152.0
253.9
0
100
200
300
400
500
2007 2012 2017 2022 2027 2032 2037
Pri
ma
ry t
ea
ch
ers
(th
ou
sa
nd
s) High fertility Declining fertility
29

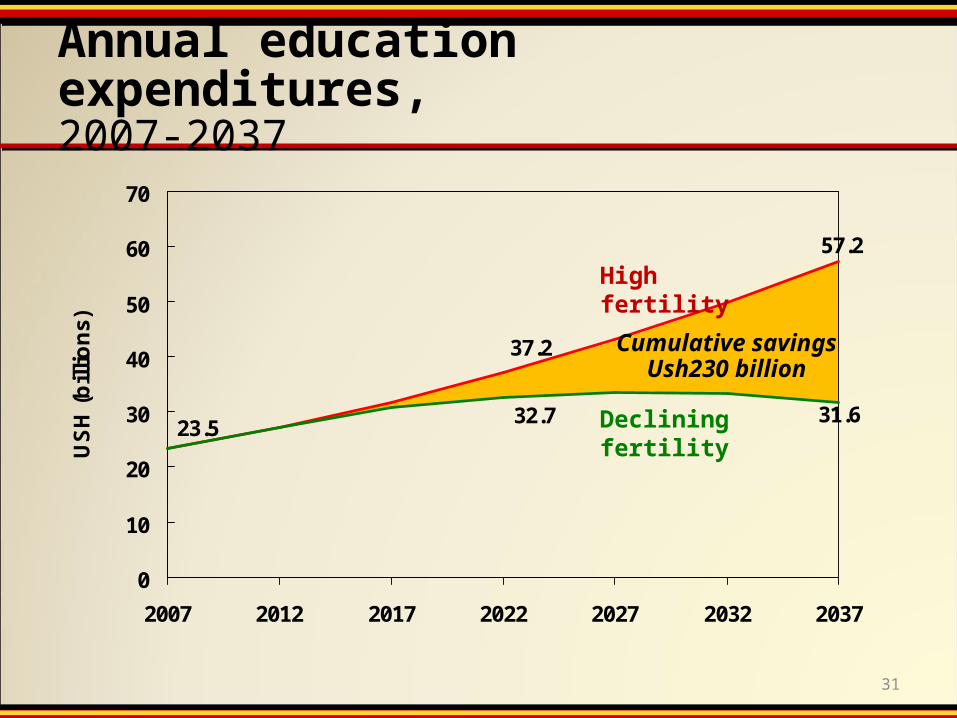
Annual education expenditures, 2007-2037
57.2
37.2
23.531.632.7
0
10
20
30
40
50
60
70
2007 2012 2017 2022 2027 2032 2037
US
H (
bill
ion
s)
High fertility
Declining fertility
30
23.5
37.2
57.2
32.7 31.6
0
10
20
30
40
50
60
70
2007 2012 2017 2022 2027 2032 2037
US
H (
bil
lio
ns)
Annual education expenditures, 2007-2037
High fertility
Declining fertility
31
Cumulative savings Ush230 billion
Health Health
32© 2008© 2008

Number of nurses required,
2007-2037
7,700
21,400
88,800
19,500
62,400
0
20,000
40,000
60,000
80,000
100,000
2007 2012 2017 2022 2027 2032 2037
Nu
mb
er o
f n
urs
es
High fertility Declining fertility
33

Number of health centres required, 2007-2037
5,340
9,320
3,045
6,550
4,880
0
2,000
4,000
6,000
8,000
10,000
2007 2012 2017 2022 2027 2032 2037
Nu
mb
er o
f H
ealt
h C
entr
es
High fertility Declining fertility
34

Annual health expenditures, 2007-2037
0.24
1.42
2.49
1.30
1.75
0.0
0.5
1.0
1.5
2.0
2.5
3.0
2007 2012 2017 2022 2027 2032 2037
US
D (
bil
lio
ns)
High fertility
Declining fertility
35
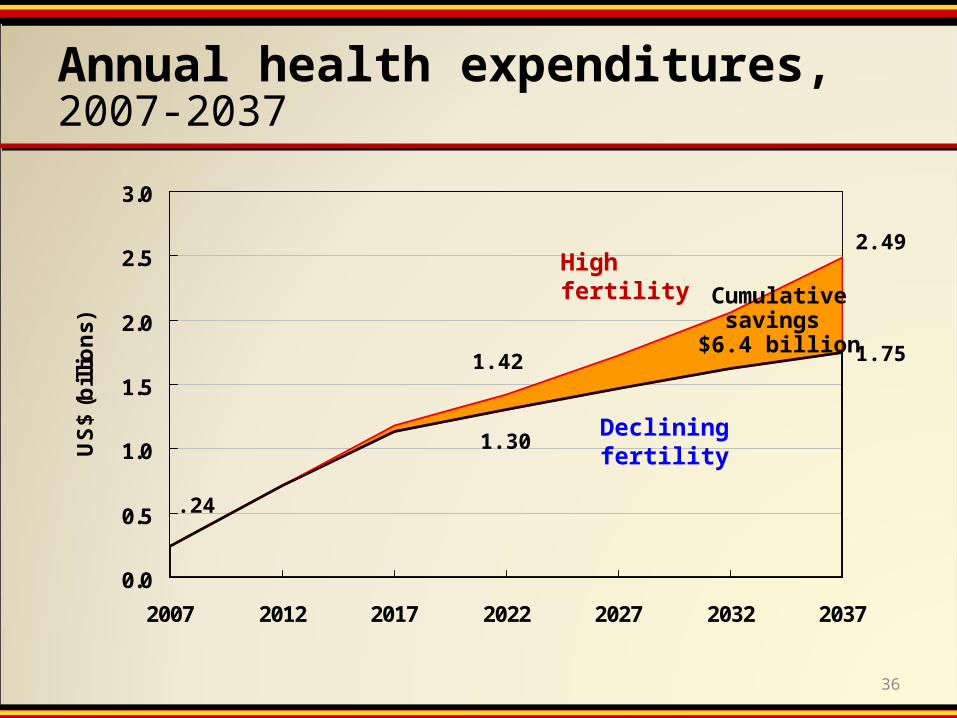
Annual health expenditures, 2007-2037
36
0.0
0.5
1.0
1.5
2.0
2.5
3.0
2007 2012 2017 2022 2027 2032 2037
US
$ (b
illi
on
s)
High fertility
Declining fertility
Cumulative savings
$6.4 billion
.24
1.42
2.49
1.30
1.75

Birth spacing improves child health
120
5654
76
0
20
40
60
80
100
120
140
<2 years 24-36 months 36-48 months 48 months ormore
Months since last birth
Infa
nt
dea
ths
per
100
0 li
ve b
irth
s
Source: UDHS, 2006 37

Agriculture & Environment
© 2006 Rob & Ale Youngrobv© 2006 Rob & Ale Youngrobv

Plan for the Modernisation of Agriculture
K. Burns / USAID

Rapid population growth works against modernisation . . .
40
In many parts of the country, rapid population growth in the rural areas has led todeforestationsoil erosionland degradationsmallholding fragmentation
http://www.flickr.com/photos/plant-trees/3595014598/sizes/m/
Source: Trees For The Future

New rural households, 2007–2037
41 41
2,732,187
1,704,557
3,479,342
5,017,649
0
2,000,000
4,000,000
6,000,000
8,000,000
10,000,000
High fertility Declining fertility
New
ru
ral h
ou
seh
old
s
2007-2022 2023-2037
8,496,990
4,436,743

Minimum food requirements*, 2007-2037
37.3
21.3
65.1
45.7
34.1
0
10
20
30
40
50
60
70
2007 2012 2017 2022 2027 2032 2037
Fo
od
req
uir
emen
t (i
n m
illi
on
to
nn
es)
High fertility Declining fertility
*Assumes production per capita stays at 2007 levels.Source: 2009 Statistical Abstract. 42

Environmental degradation has reached alarming proportions in parts of Uganda
43 43
The country’s forests are under tremendous pressure, with wood harvesting for fuel and timber and the clearance of agriculture and human settlement being some of the primary causes. USAIDUSAID

Wood fuel consumption, 2007-2037
27.5
18.9
39.5
27.825.1
0
5
10
15
20
25
30
35
40
45
2007 2012 2017 2022 2027 2032 2037
Wo
od
fu
el c
on
sum
pti
on
(in
mil
lio
n t
on
nes
)
High fertility Declining fertility
Source:PEAP (2004/5-2007/8), p. 77. 44

EconomyEconomy
K. Burns / USAIDK. Burns / USAID© 2005 Leila Darabi, Courtesy of Photoshare © 2005 Leila Darabi, Courtesy of Photoshare
© 2006 Walter Wafula/ Daily Monitor, Courtesy of Photoshare© 2006 Walter Wafula/ Daily Monitor, Courtesy of Photoshare
K. Burns / USAIDK. Burns / USAID
K. Burns / USAIDK. Burns / USAID K. Burns / USAIDK. Burns / USAID

GDP growth rate, 2001-2008
8.8
7.16.2 5.8
10.0
7.0
8.2 8.3
0
2
4
6
8
10
12
2001 2002 2003 2004 2005 2006 2007 2008
GD
P g
row
th r
ate
46 46Source: 2009 Statistical Abstract

47 47
953
1,505
591
1,043
2,142
0
500
1,000
1,500
2,000
2,500
2007 2012 2017 2022 2027 2032 2037
Co
ns
tan
t Y
ea
r 2
00
2 U
SH
(0
00
s)
High fertility Declining fertility
GDP per capita(Assumes 7% annual economic growth rate)
Middle-income status

48 48
591
1,157
843
1,647
923
0
500
1,000
1,500
2,000
2,500
2007 2012 2017 2022 2027 2032 2037
Co
nst
ant
Yea
r 20
02 U
SH
(00
0s) High fertility Declining fertility
GDP per capita(Assumes 6% annual economic growth rate)
Middle-income status

49 49
1,365
3,264
591
1,494
4,645
0
500
1,000
1,500
2,000
2,500
3,000
3,500
4,000
4,500
5,000
2007 2012 2017 2022 2027 2032 2037
Co
nst
ant
Yea
r 20
02 U
SH
(00
0s) High fertility Declining fertility
GDP per capita(Assumes 10% annual economic growth rate)
Middle-income status

Annual New Job Requirements,2007-2037
862
476
1,521
812854
0
500
1,000
1,500
2,000
2007 2012 2017 2022 2027 2032 2037
New
Jo
bs
(th
ou
san
ds)
High
Low
50 50

Urbanisation Urbanisation
51
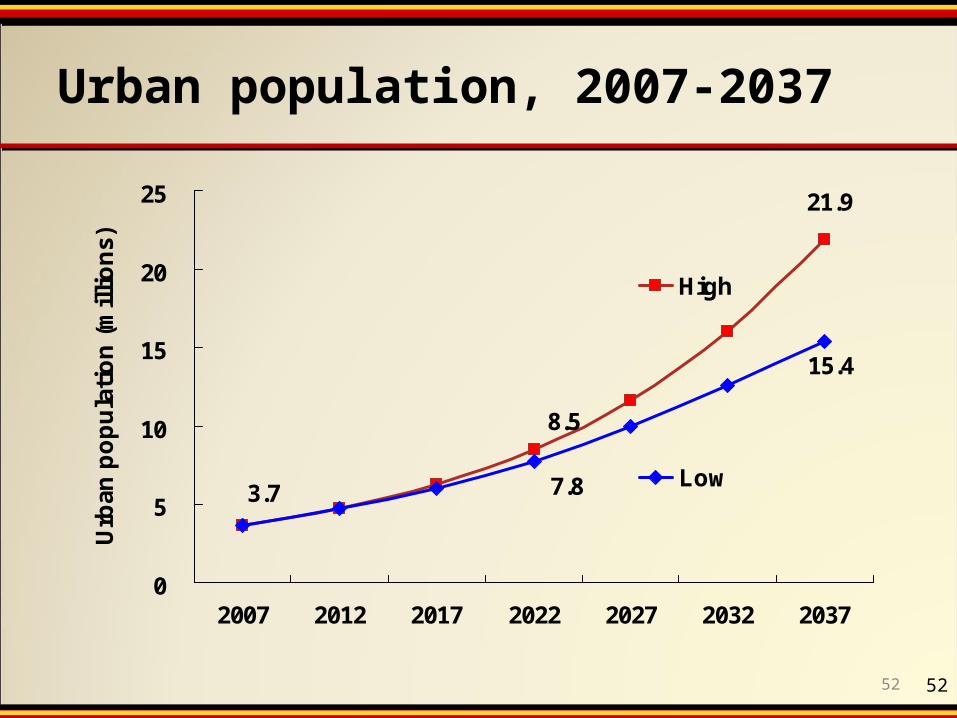
Urban population, 2007-2037
21.9
3.7
8.5
15.4
7.8
0
5
10
15
20
25
2007 2012 2017 2022 2027 2032 2037
Urb
an p
op
ula
tio
n (
mil
lio
ns)
High
Low
52 52

53
Rapid growth puts increasing pressure on urban infrastructure.
Credit: © 2005 Richard Niyonzima, Courtesy of Photoshare Caption: A river of refuse and waste passes through a congested slum in Namuwongo, Kampala City, Uganda. Ninety percent of the Kampala population lives in slums like this one, risking contracting diseases like dysentery and cholera.

Required new urban housing units, 2007-2037
54 54
1,141,369 966,112
3,183,355
1,809,798
0
1,000,000
2,000,000
3,000,000
4,000,000
5,000,000
High fertility Declining fertility
Ho
us
ing
un
its
2007-2022 2022-2037
4,324,724
2,775,910

Contraceptive Use
55 55
Modern contraceptive prevalence rate is 17.9 percent of married women of reproductive age.
Credit: © 2006 Alfredo L. Fort, Courtesy of Photoshare Caption: Clients wait for services in a family planning/maternal health clinic in Mukono, Uganda
Source: UDHS, 2006

Comparative modern contraceptive prevalence rate
31.5
28.226.5
20.017.9
0
5
10
15
20
25
30
35
Kenya Malawi Zambia Tanzania Uganda
56 56
Zimbabwe (2005/06) – 58.4Kenya (2003) – 31.5%Malawi (2004) – 28.2%Zambia (2007) – 26.5%Tanzania (2004/05)) – 20.0%Uganda (2006) – 17.9%

A very large unmet need for family planning already exists...
40.6% of married women want to space or limit births but are not using contraceptives
57

Unmet need for family planning
40.6
27.6 26.524.5
16.6
0
5
10
15
20
25
30
35
40
45
Uganda Malawi Zambia Kenya Tanzania
Pe
rce
nt
of
wo
me
n in
un
ion
of
rep
rod
uc
tiv
e a
ge
58 58

59
To satisfy unmet need, a realistic strategy is to ensure that all Ugandan couples who want to space or limit their births have access to quality reproductive health services, including a full range of RH commodities
consistently available
at affordable prices.© Dylan Walters© Dylan Walters

If Uganda moves toward satisfying current unmet need by 2025, it will be on track to achieve a fertility transition in a generation . . .
6.7
4.4
2.2
0
1
2
3
4
5
6
7
2007 2012 2017 2022 2027 2032 2037
Nu
mb
er o
f b
irth
s p
er w
om
an
Declining fertility
60

What we need is….
Sustained commitment and support from leaders at national and district levels
Improved quality and access to affordable services
Increased private sector/NGO participation Contraceptive security Improved district management Expanded IEC Sustained donor support
61


