Imagine the result Request A1: Rijksinstituut voor Volksgezondheid en Milieu (National Institute for Public Health and the Environment; RIVM) What Defines Nanomaterials? TENDER EU 2011/S 120-199032 COMPANY NO. 4410000004 5 October 2012
Transcript
Imagine the result
Request A1: Rijksinstituut voor Volksgezondheid en Milieu (National Institute for Public Health and the Environment; RIVM)
What Defines Nanomaterials?
TENDER EU 2011/S 120-199032
COMPANY NO. 4410000004
5 October 2012
Request A1: What Defines Nanomaterials?
Christopher Hassinger Staff Scientist Kathleen Sellers, PE Principal Environmental Engineer
Prepared for:
National Institute for Public Health and the Environment (RIVM)
Prepared by:
ARCADIS NEDERLAND BV Utopialaan 40-48 P.O. Box 1018 5200 BA ’s-Hertogenbosch The Netherlands www.arcadis.nl
Our Ref.:
B0036258
Date:
5 October 2012 This document is intended only for the use of the individual or entity for which it was prepared and may contain information that is privileged, confidential and exempt from disclosure under applicable law. Any dissemination, distribution or copying of this document is strictly prohibited.
http://team/clients/rivm/shared documents/a1 - what defines nanomaterials/report/rivm_a1_final report.doc i
Table of Contents
List of Tables iii
List of Figures iii
List of Appendices iii
Executive Summary 1
1 Introduction 4
2 Defining Critical Physicochemical Properties 6
2.1 Identifying Critical Properties 6
2.2 Screening for Physicochemical Properties 6
2.3 Literature Search 14
3 Results 15
3.1 Surface Morphology 16
3.2 Crystalline Structure 17
3.2.1 Basis for Evaluation 18
3.2.2 Change in Lattice Parameters with Particle Size 20
3.2.2.1 Lattice Contraction 20
3.2.2.2 Lattice Expansion 21
3.2.3 Stability of Different Crystalline Structures at Different Particle Sizes 23
3.2.4 Effect of Particle Size on Phase Transformation 24
3.2.5 Formation of Otherwise Unstable Structures at Nanoscale 24
3.2.6 No Change in Lattice Structure with Particle Size 25
3.2.7 Summary 25
3.3 Water Solubility 26
3.3.1 Increased Rate of Dissolution 26
3.3.2 Effect on Equilibrium Solubility Concentration 28
3.3.3 Summary 30
http://team/clients/rivm/shared documents/a1 - what defines nanomaterials/report/rivm_a1_final report.doc ii
Table of Contents
3.4 Reactivity 30
3.4.1 Iron Oxides 31
3.4.2 Cobalt 32
3.4.3 Palladium 34
3.4.4 Gold 34
3.4.5 Platinum 35
3.4.6 Other Substances 37
3.4.6.1 Metals 37
3.4.6.2 Metal Oxides 38
3.4.6.3 Carbon 39
3.4.7 Summary 39
3.5 Photocatalytic Reactivity 40
3.5.1 Titanium Dioxide 40
3.5.2 Cadmium Sulphide 41
3.5.3 Gold–Titanium Dioxide and Other Gold Nanoparticles 41
3.5.4 Summary 42
4 Discussion 43
4.1 High Priority Properties 43
4.2 Lower Priority Properties 45
4.3 Recommendations 45
4.3.1 Adequacy of Data with Respect to Common Nanomaterials 45
4.3.2 Adequacy of Data with Respect to Parameters Characterised 48
5 Conclusions 50
6 References 53
http://team/clients/rivm/shared documents/a1 - what defines nanomaterials/report/rivm_a1_final report.doc iii
Table of Contents
List of Tables Table 1. Physicochemical Properties with Potential Size Thresholds 7
Table 2. Physicochemical Properties Not Selected in Screening Evaluation 12
Table 3. Catalogue of Relevant Papers 15
Table 4. Observations of Lattice Contraction and Expansion and Phase Change 26
Table 5. ‘Bright Line’ Thresholds Identified in the Literature Review 44
List of Figures Figure 1. Size Distribution of Particles Studied 16
Figure 2. Nanomaterials Found Most Frequently in Consumer Products 47
Figure 3. Number of Studies Reviewed for Each Substance 48
List of Appendices A. Literature Search
B. Copy of Database
http://team/clients/rivm/shared documents/a1 - what defines nanomaterials/report/rivm_a1_final report.doc 1
Request A1: What Defines Nanomaterials?
ACKNOWLEDGMENT
This study is the result of a project commissioned by the Dutch National Institute for Public Health and the Environment (RIVM) under contract reference EU 2011/S120-199032 Request A1. In addition to the financial support, we thank RIVM for the valuable scientific discussions and contributions.
http://team/clients/rivm/shared documents/a1 - what defines nanomaterials/report/rivm_a1_final report.doc 2
Request A1: What Defines Nanomaterials?
Executive Summary
The aim of this project is to determine which physicochemical properties make a nanomaterial different from a ‘conventional’ material and at what size these properties are changed to ‘nanospecific’ properties. These size thresholds can then be used to prepare the Dutch input into the foreseen review of nanomaterial definition.
This work is being done within the context of the European Commission (2011) definition of “nanomaterial”, which is:
A natural, incidental or manufactured material containing particles, in an unbound state or as an aggregate or as an agglomerate and where, for 50% or more of the particles in the number size distribution, one or more external dimensions is in the size range 1 nm to 100 nm.
In specific cases and where warranted by concerns for the environment, health, safety or competitiveness the number size distribution threshold of 50% may be replaced by a threshold between 1 and 50%.
By derogation from the above, fullerenes, graphene flakes and single wall carbon nanotubes with one or more external dimensions below 1 nm should be considered as nanomaterials.
The work began with the selection and prioritisation of physicochemical parameters that were thought to be particularly relevant to nanomaterials and to the regulation of chemical substances under the European Community Regulation on chemicals and their safe use (EC 1907/2006) Registration, Evaluation, Authorisation and Restriction of Chemical substances (REACH). This report focuses on the following parameters, judged to be of highest priority: surface morphology and crystalline structure, water solubility, reactivity, and photocatalytic reactivity. A summary of the research on each of these parameters follows. More detailed descriptions of published research are provided in the body of this report and in an appended database.
Surface morphology was included in the literature review based on initial information that surface morphology may affect the rate of dissolution and equilibrium solubility and that morphology can depend in part on size for very small nanoparticles. However, the literature search identified few papers that discussed size-related effects on morphology. While these papers suggest that in some cases the shape and structure of an inorganic particle may depend upon its size, the data are too few to draw general conclusions about the size dependence of morphology or its relevance to the definition of a nanomaterial. Additional information is available regarding the effect of size on crystalline structure, a specific aspect of morphology.
http://team/clients/rivm/shared documents/a1 - what defines nanomaterials/report/rivm_a1_final report.doc 3
Request A1: What Defines Nanomaterials?
Several aspects of the crystallinity of metals and metal oxides may vary with particle size. With changes in particle size the unit cell can contract or expand, as represented by changes in lattice parameters. Particles of two different sizes can also assume different crystalline phases. While many studies have demonstrated size-related effects, no simple conclusions can be drawn to inform the definition of nanomaterial.
Decreasing the particle size can increase the rate at which a substance dissolves and can also increase the equilibrium solubility concentration. The former phenomenon is well known in the pharmaceutical industry, where poorly-soluble drugs are often “nanosized” to increase their bioavailability. No clear distinction of a threshold size-related effect exists to support a definition of nanomaterial, however. The increase in the equilibrium solubility concentration with decreasing particle size has a basis in thermodynamics theory. Some experimental data with silver (5 to 80 nm), titanium dioxide (ca. 10, 30 nm), zinc oxide (26, 216 nm), and zinc sulphide (1 to 3 nm, bulk) do show an increase in solubility for nanoscale particles relative to the corresponding bulk material. However the data do not suffice to inform the definition of a nanomaterial.
The literature on reactivity generally centres on the use of metal and metal oxide nanoparticles as catalysts. Almost all studies reporting a size effect noted an inverse relationship between size and catalytic reactivity. Maximum catalytic activity generally occurred at particle sizes below 15 to 20 nm, with a sharp change in reactivity below approximately 5 nm in some cases. Many of the studies focused on particles below 100 nm and, because the European Commission definition sets an upper size limit for nanomaterials of 100 nm, such studies do not provide direct perspective on the definition of a nanomaterial.
Researchers have studied the effect of particle size on the photocatalytic reactivity of certain metal oxides and sulphides. The studies summarised herein generally showed that photoreactivity increased with decreasing particle size. In some cases the behaviour of the material changed at a particle size of approximately 5 to 10 nm.
In summary, most of the studies described in this report indicate that the physical chemical parameters evaluated do depend on particle size at the nanoscale. The particle size at which effects occur can vary with the property, the material tested, and the experimental conditions. Researchers are beginning to elucidate the thermodynamic and quantum mechanical basis for these effects. However, neither the experimental data nor the theoretical explanations for those data currently suffice to define the size at which these properties are changed to ‘nanospecific’ properties.
http://team/clients/rivm/shared documents/a1 - what defines nanomaterials/report/rivm_a1_final report.doc 4
Request A1: What Defines Nanomaterials?
1 Introduction
The aim of this project is to determine which physicochemical properties make a nanomaterial different from a ‘conventional’ material and at what size these properties are changed to ‘nanospecific’ properties. These size thresholds can then be used to prepare the Dutch input into the foreseen review of nanomaterial definition.
This work is being done within the context of the European Commission (2011) definition of “nanomaterial”, which is:
A natural, incidental or manufactured material containing particles, in an unbound state or as an aggregate or as an agglomerate and where, for 50% or more of the particles in the number size distribution, one or more external dimensions is in the size range 1 nm to 100 nm.
In specific cases and where warranted by concerns for the environment, health, safety or competitiveness the number size distribution threshold of 50% may be replaced by a threshold between 1 and 50%.
By derogation from the above, fullerenes, graphene flakes and single wall carbon nanotubes with one or more external dimensions below 1 nm should be considered as nanomaterials.
The European Commission (2011) also notes that:
Technological development and scientific progress continue with great speed. The definition including descriptors should therefore be subject to a review by December 2014 to ensure it corresponds to the needs. In particular, the review should assess whether the number size distribution threshold of 50% should be increased or decreased and whether to include materials with internal structure or surface structure in the nanoscale such as complex nanocomponent nanomaterials including nanoporous and nanocomposite materials that are used in some sectors.
Certain physicochemical properties depend on particle size. This effect generally results from three phenomena:
• Decreasing the particle size increases the proportion of atoms or molecules on the surface of the particle. Consequently, for example, the rate of dissolution increases and the relative rate of reactivity can increase.
• Atoms at the surface of a particle experience a different local environment than do atoms in the bulk of the material. Each of the atoms on the particle surface is surrounded by fewer atoms than it would be if it were located in the middle of the particle. As a result, the energy associated with those atoms, known as the
http://team/clients/rivm/shared documents/a1 - what defines nanomaterials/report/rivm_a1_final report.doc 5
Request A1: What Defines Nanomaterials?
“surface free energy” differs from the free energy associated with atoms in the centre of the particle. This effect becomes significant in particles at the nanoscale (Dingreville et al., 2005). The energetic condition at the surface of the particle can also reflect, in part, the strain associated with the curvature of the surface, which becomes more pronounced as the particle diameter decreases; this surface stress can be especially pronounced in particles on the order of a few nanometers (Ma et al., 2012). The surface free energy associated with nanoparticles can affect such fundamental physical properties as the melting point, heat capacity, and equilibrium solubility.
• For certain of the smallest particles, such as quantum dots,1 the nanoscale results in quantum confinement. That is, when the diameter of the particle is of the same magnitude as the wavelength of the electron wave function (or in other words, when the electrons and electron holes in the crystal are squeezed into a dimension that approaches the “exciton Bohr radius”), the electrical and optical properties of the particle differ substantially from those of the bulk counterpart.
Parameters that are either required to characterise chemical substances under REACH and/or identified by authorities as important for characterising nanomaterials were identified and evaluated with respect to their dependence on particle size. Wherever possible, the characteristics of particles at sizes less than 100 nm were compared to the characteristics of the “bulk” material. For the purpose of this study, “bulk” material comprised particles > 100 nm in size. Some researchers have defined “bulk” using other criteria, such as > 1000 nm in size. Where this report cites such work, the relevant “bulk” particle size is indicated.
A literature search identified relevant papers, which were obtained, summarised, and evaluated with respect to the weight of evidence indicating the size dependence of physicochemical properties.
1 Quantum dots are semiconductor nanocrystals of various sizes and compositions, typically comprising a CdSe, CdTe, ZnSe, or PbSe core surrounded by a zinc or cadmium sulfide shell. For some applications, they are encapsulated with amphiphilic polymers. A quantum dot can be on the order of 4 to 20 nm, depending on the size of the crystal and the surface coating. (Mahendra et al., 2008)
http://team/clients/rivm/shared documents/a1 - what defines nanomaterials/report/rivm_a1_final report.doc 6
Request A1: What Defines Nanomaterials?
2 Defining Critical Physicochemical Properties
2.1 Identifying Critical Properties
The objective of this task was to identify the physicochemical properties that are considered to be important for risk assessment of nanomaterials (i.e., those properties that potentially influence hazard and exposure, both for humans and the environment), which may be influenced by particle size. ARCADIS surveyed the following sources of information to identify these properties:
• Recommendations from government agencies, non-governmental organisations (NGOs) or committees/task forces (authoritative recommendations) regarding critical properties:
• Compilations of information on the behaviour of nanomaterials
• Scientific literature on the behaviour of nanomaterials.
Specific sources are indicated below (Tables 1 and 2).
Properties identified by any of these sources as being important for the risk assessment of nanomaterials were recorded for prioritisation as described below.
2.2 Screening for Physicochemical Properties
The next step was to prioritise the physicochemical properties identified in the previous step. Three categories of priority were established: low, medium and high.
Parameters that are either required to characterise chemical substances under REACH and/or identified by authorities as important for characterising nanomaterials were identified and evaluated with respect to their dependence on particle size. Properties which are the most likely candidates for which size thresholds can be found were categorised as low/medium/high priority and were considered further in the screening evaluation (Table 1). Categories were assigned to each property by evaluating the overall importance of the property for risk assessment and the possibility of size-dependence as determined by the literature search and expert judgment.
Properties that are not relevant to nanoparticles or else do not appear to be size dependent were not selected in the screening evaluation (Table 2).
http://team/clients/rivm/shared documents/a1 - what defines nanomaterials/report/rivm_a1_final report.doc 7
Request A1: What Defines Nanomaterials?
Table 1. Physicochemical Properties with Potential Size Thresholds
Endpoint Screening Evaluation Priority for Literature Search Reference
Appearance/ physical state/colour
The colour of certain materials can change as the particle size decreases. This parameter does not relate directly to risk assessment, but colour change is an easily-observed indicator of quantum effects resulting from size change. The shape of a nanomaterial can also affect its toxicity, although the physical appearance of a nanomaterial will not be observable simply by looking at the material.
Low
Expert judgment
Melting point/freezing point
The melting point of certain nanoparticles (e.g., metallic species) can be lower than bulk counterparts. For example, Luo et al. (2008) found that for nanosilver particles, the melting point decreased from approximately 1180 K for a 20-nm particle to 1000 K for a 5-nm particle. While this may be an important characteristic in certain circumstances, it is unlikely to be relevant under the ambient conditions typically considered in risk characterisation.
Low Luo et al. (2008)
Boiling point While the free energy associated with phase change can be affected by particle size, this parameter is not likely to be relevant to solid particles under the ambient conditions typically considered in risk characterisation.
Low Expert judgment
Particle size distribution (granulometry)
Critical property that reflects particle size, but not a consequence of particle size per se. Analysts use different techniques to determine particle size, which can affect the measurements.
Low
(relates to particle size; not used as an independent search term)
Expert judgment
http://team/clients/rivm/shared documents/a1 - what defines nanomaterials/report/rivm_a1_final report.doc 8
Request A1: What Defines Nanomaterials?
Endpoint Screening Evaluation Priority for Literature Search Reference
Partition coefficient (octanol/water)
The n-octanol/water partition coefficient (Kow) is defined as the ratio of the equilibrium concentrations of a dissolved substance in a two-phase system comprising n-octanol and water (ECHA, 2008). It does not characterise the behaviour of particles suspended in a solution. SCENIHR (2009) concluded that Kow could be an important parameter for soluble nanomaterials, citing work on fullerenes.
Low
(not relevant to particles in suspension, although may be important for soluble nanomaterials; sorption behaviour of suspended particles described by DLVO2 theory rather than by Kow, which pertains to dissolved materials)
Expert judgment;
Hansen et al. (2011)
SCENIHR, 2009
Solubility in organic solvents/ fat solubility
By analogy to water solubility, may vary with particle size. May also be affected by the particle coating.
Not directly linked to risk assessment, however; the fat solubility has essentially been replaced by the octanol water partition coefficient in the characterisation of chemicals.
Low Expert judgment
2 Derjaguin and Landau, Verwey and Overbeek (DLVO) theory describes forces between charged surfaces contained in a liquid medium.
http://team/clients/rivm/shared documents/a1 - what defines nanomaterials/report/rivm_a1_final report.doc 9
Request A1: What Defines Nanomaterials?
Endpoint Screening Evaluation Priority for Literature Search Reference
Relative surface area
Related to particle size, shape, and porosity. As the size of a particle decreases, the ratio of surface area to volume increases or, in other words, the proportion of the atoms on the surface of the particle increases. Important with respect to rate of reaction, dissolution, and adsorption. Specific surface area appears to be relevant for a number of parameters for toxicological and ecological risk assessment. It will dictate the surface charge density in cases where nanomaterials are surface functionalised, which has direct consequences on (a) nanomaterial interaction (i.e., agglomeration) with other naturally occurring particulate matter (i.e., contaminant vectors); (b) route of exposure as a function of surface ligand-biological interface (i.e., bioaccumulation pathway, bioavailability); and (c) mechanisms of toxicity (OECD, 2010). Highlighted in European Commission (2011) Recommendations as metric that may be used to characterise nanomaterials in future.
Low (Although surface area is an important property for risk assessment, it is directly related to particle size and, therefore, is not used as an independent search term.)
SCENIHR (2007,2009,2010)
EDF/DuPont (2007)
U.S. EPA (2007a,2007b)
OECD (2009a, 2010)
JRC (2011)
BAUA (2007)
ENRHES (2009)
NICNAS (2010)
U.S. FDA (2010)
NIOSH (2009)
Dustiness This parameter refers to the propensity to generate airborne dust during handling. Data provide a basis for estimating the potential health risk due to inhalation exposure. The ability to generate dust depends on particle size and density (thereby buoyancy).
Low OECD (2009a,2010)
EDF/DuPont (2007)
Flammability Flammability may be related to particle size Medium Expert judgment
Auto flammability The relative self-ignition temperature is defined for solids as the minimum temperature at which a certain volume of a substance will ignite under defined conditions. For solids the self-ignition temperature will also depend on the particle size (ECHA, 2008).
Medium Expert judgment
Explosiveness Explosiveness can be related to particle size. In general dust explosions may occur when the particle diameter is smaller than 1 to 0.1 mm. The combustion rate increases with smaller particle sizes with an optimal combustion at particle diameters of approximately 10 to 15 μm (Eckhoff, 2003, as cited in Pronk et al., 2009).
Medium, with respect to defining nanomaterial but an important parameter when establishing physical hazards.
Expert judgment
http://team/clients/rivm/shared documents/a1 - what defines nanomaterials/report/rivm_a1_final report.doc 10
Request A1: What Defines Nanomaterials?
Endpoint Screening Evaluation Priority for Literature Search Reference
Oxidising properties
An oxidising substance is one that may cause or contribute to the combustion of other materials as an oxygen donor. For the majority of substances, oxidising properties are not a concern; it may be of concern for certain metal oxides, for example. (ECHA, 2008). While reactivity may be increased with decreasing particle size, this parameter was not judged to be a priority for the literature search and may be reflected in the search regarding “reactivity”.
Medium Expert judgment
Magnetism A magnetic attraction between certain materials, such as nano-zerovalent iron, can contribute to agglomeration (U.S. EPA, 2011) and thus influence net particle size and behaviour. May be related to size (Park et al., 2007).
Medium SCENIHR (2007)
Park et al. (2007)
Crystalline structure
The crystalline phase refers to how molecules are physically arranged in space (OECD, 2010). Many materials with the same chemical composition can have different lattice structures, and exhibit different physicochemical properties. Several structural investigations on inorganic nanoparticles indicate that also the crystal lattice type may have an important role on the overall bulk lattice. The size reduction may create discontinuous crystal planes that increase the number of structural defects, as well as disrupt the electronic configuration of the material, with possible toxicological consequences (ENRHES, 2009). In short, decreasing particle size can affect the crystalline structure (Gilbert et al., 2004; Auffan et al., 2009). The crystalline structure can affect the toxicity of certain nanomaterials (Auffan et al., 2009).
High
(although only relevant to certain types of nanomaterials capable of crystalline ordering)
ENHRES, 2009
Gilbert et al. (2004)
Auffan et al. (2009)
See also:
EDF/DuPont (2007)
OECD (2010)
U.S. EPA (2007a)
SCENIHR (2007, 2010)
U.S. FDA (2010)
Water solubility The rate of dissolution of soluble materials increases with decreasing particle size. Further, the Ostwald-Freundlich equation predicts that equilibrium solubility should increase with decreasing particle size. Experimentally, this is often not the case due to non-ideal behaviour. Water solubility also depends upon the solution characteristics and can depend on the particle coating.
High Borm (2006)
http://team/clients/rivm/shared documents/a1 - what defines nanomaterials/report/rivm_a1_final report.doc 11
Request A1: What Defines Nanomaterials?
Endpoint Screening Evaluation Priority for Literature Search Reference
Surface morphology
Surface morphology may affect rate of dissolution and equilibrium solubility (Borm et al., 2006). Morphology can be affected by particle size (Auffan et al., 2009).
High
(potential to affect fundamental physical/chemical properties that pertain to behaviour in the environment)
Borm et al. (2006)
Auffan et al. (2009)
Reactivity (including redox activity and ability to generate Reactive Oxygen Species)
Decreasing particle size affects surface free energy. Reactivity is further increased due to surface atoms being less stable and the ability to form bonds increases with decreasing size, due to the higher surface free energy (JRC, 2011). “Nanosizing” can markedly affect reactivity. For example, gold, which is inert at bulk scale, becomes an effective oxidation catalyst when the particle size is reduced to a few nanometers (Auffan et al., 2009).
High JRC (2011)
Auffan et. al. (2009)
See also:
SCENIHR (2009)
EDF/DuPont (2007)
JRC (2011)
BAUA (2007)
OECD (2010)
FOPH/FOEN (2011)
NICNAS (2010)
U.S. FDA (2010)
U.S. EPA (2007b)
Photocatalytic activity (photo-activation)
Photoactivity refers to the generation of electron-hole pairs by nanomaterials exposed to light. These electron-hole pairs can produce free-oxygen radicals, which results in oxidation or reduction of molecules in contact with their surfaces (U.S. EPA, 2011). Recent data have indicated that some nanoparticles may, by virtue of their relatively large surface area and reactive potential, become activated by light (SCENIHR, 2009). Photocatalytic activity is highly material dependent. Within materials, it is size dependent (SCENIHR, 2010).
High SCENIHR (2009,2010)
U.S. EPA (2011)
See also:
JRC (2011)
OECD (2010)
http://team/clients/rivm/shared documents/a1 - what defines nanomaterials/report/rivm_a1_final report.doc 12
Request A1: What Defines Nanomaterials?
Table 2. Physicochemical Properties Not Selected in Screening Evaluation
Endpoint Screening Evaluation Comments References
REACH Endpoints
Density Not anticipated to vary with particle size Does not depend on particle size
Expert judgment
Vapour pressure Typically used to characterise liquids and not significant for particles except for those (e.g., naphthalene) which sublime. Unlikely to be relevant to the most common nanomaterials. A nano QSAR model used to predict the toxicity of metal oxides found that ΔHMe+ (which is a function of the enthalpy of sublimation) is related to toxicity; however, the researchers determined that ΔHMe+ was not related to the size of the studied nanoparticles (Puzyn et al., 2011).
Not relevant to nanoparticles under ambient conditions; thought not to relate to particle size
Puzyn et al. (2011)
Surface tension Property of liquids and solutions of soluble surface-active solids in the context of REACH. Not relevant to particles per se. In solids, surface tension is related to the surface free energy (Luo et al., 2008).
Not relevant to nanoparticles
Expert judgment
Flash point Liquid property, not relevant to particles Not relevant to nanoparticles
Expert judgment
Stability in organic solvents and identity of relevant degradation products
There are rare occasions when it is important to have information on the stability of a compound in an organic solvent, to increase confidence in the results of physicochemical or toxicity tests. However, for many substances, stability in organic solvents will not be critical and testing need not be conducted (ECHA, 2008). This property is not likely to be relevant to most nanomaterials, although it is increasingly apparent that the tendency of nanomaterials to agglomerate during storage and testing can affect experimental results.
N/A ECHA (2008)
Dissociation constant
Property characterises acidity or alkalinity of dissolved substances.
Not relevant to nanoparticles
Expert judgment
Viscosity Liquid property, not relevant to particles Not relevant to nanoparticles
Expert judgment
http://team/clients/rivm/shared documents/a1 - what defines nanomaterials/report/rivm_a1_final report.doc 13
Request A1: What Defines Nanomaterials?
Endpoint Screening Evaluation Comments References
Other Properties
Agglomeration state
Agglomeration increases the net particle size, thereby changing the size-dependent characteristics and behaviour of the original nanomaterial (U.S. EPA, 2011). Dependent in part on solution characteristics. Agglomeration can also reportedly be influenced by particle size, as increasing the particle surface area can enhanced the collision frequency between particles and lead to a higher degree of agglomeration (Suttiponparnit et al., 2011).
Directly related to particle size; not an independent variable
SCENIHR (2007,2009)
EDF/DuPont (2007)
U.S. EPA (2007a)
OECD (2009a,2010)
BAUA (2007)
ENRHES (2009)
FOPH/FOEN (2011)
NIOSH (2009)
Dispersibility (ability to dis-aggregate)
Dispersibility refers to the relative number (or mass) of primary particles in a suspending medium in comparison to agglomerates. Not clear that the ability of an insoluble substance to evenly distribute in a solvent is directly related to decreased particle diameter; cited by multiple authoritative sources.
This parameter initially thought not to depend strongly on particle size. During the course of the project, identified one report indicating size dependence.3
SCENIHR (2007,2009)
JRC (2011)
EDF/DuPont (2007)
OECD (2010)
FOPH/FOEN (2011)
Porosity This parameter measures the fraction of the particle that is devoid of material. A material's porosity affects its fate in the environment by affecting particle density and colloidal stability and may permit a nanomaterial to act as a vector for other constituents (OECD, 2010). While this parameter may relate to the degree of agglomeration, it does not depend on primary particle size.
Does not depend on particle size
RIP-oN 1 (JRC, 2011)
EDF/DuPont (2007)
U.S. EPA (2007a)
SCENIHR (2007)
ENRHES (2009)
OECD (2010)
3 Suttiponparnit et al. (2011) tested TiO2 nanoparticles at 6 sizes between 6 and 104 nm, and found that particle size influenced the zeta potential, dispersion isoelectric point (defined by zeta potential equal to zero), and average hydrodynamic diameter of the particles (i.e., agglomeration state). A sharp change in zeta potential occurred between particle sizes of 6 and 16 nm.
http://team/clients/rivm/shared documents/a1 - what defines nanomaterials/report/rivm_a1_final report.doc 14
Request A1: What Defines Nanomaterials?
Endpoint Screening Evaluation Comments References
Surface charge (Zeta potential)
Any surface charge on nanoparticles causes electrostatic repulsion between particles of like charge that can counter the tendency to agglomerate. The zeta potential represents surface charge. (U.S. EPA, 2011). Zeta potential is an abbreviation for electrokinetic potential in colloidal systems. From a theoretical viewpoint, zeta potential is the electric potential in the interfacial double layer (DL) at the location of the slipping plane versus a point in the bulk fluid away from the interface. In other words, zeta potential is the potential difference between the dispersion medium and the stationary layer of fluid attached to the dispersed particle (OECD, 2010). The zeta potential can be related to the stability of colloidal dispersions. The zeta potential indicates the degree of repulsion between adjacent, similarly-charged particles in dispersion. For molecules and particles that are small enough, a high zeta potential will confer stability, i.e., the solution or dispersion will resist aggregation. When the potential is low, attraction exceeds repulsion and the dispersion will break and flocculate. In nanotoxicology, zeta potential (surface charge) plays a key role in determining (1) the degree of colloidal interaction which is itself a function of the pH and ionic strength of the bulk solution; and (2) bioavailability of a compound when considering mass transport through charged membranes as related to exposure. Zeta potential is not measurable directly but it can be calculated using theoretical models and an experimentally-determined electrophoretic mobility or dynamic electrophoretic mobility (OECD, 2010).
This parameter initially thought not to depend strongly on particle size. During the course of the project, identified literature report indicating size dependence for TiO2 (Suttiponparnit et al., 2011).
EDF/DuPont (2007)
OECD (2009a,2010)
U.S. EPA (2007a,2007b)
SCENIHR (2007)
ENRHES (2009)
NICNAS (2010)
U.S. FDA (2010)
NIOSH (2009)
2.3 Literature Search
The Dialogue® database, which consists of 58 individual databases, were queried with index search strings based on the selected properties. Appendix A documents that process. References either initially or ultimately determined to be relevant for this project were entered into the literature database. Appendix B contains a copy of the database. Much of the information in that database is quoted directly from the references cited.
http://team/clients/rivm/shared documents/a1 - what defines nanomaterials/report/rivm_a1_final report.doc 15
Request A1: What Defines Nanomaterials?
3 Results
Relevant papers identified in the literature search, as indicated in Table 3, were reviewed to determine whether the experimental results for a given substance indicated a size-related effect on the property being examined. Then the results were combined to evaluate whether the weight of evidence indicated whether each physicochemical property could make a nanomaterial different from a ‘conventional’ material and at what size, if any, these properties are changed to ‘nanospecific’ properties.
Table 3. Catalogue of Relevant Papers
Endpoint/Property Number of Papers Summarised
Surface morphology 2
Crystallinity 46
Water solubility 9
Reactivity 52
Photocatalytic activity 13
The experimental design of many of the studies presented a challenge with respect to the project objectives. As shown in Figure 1, many of the studies only examined size-related effects at relatively small particle sizes. Relatively few studies compared the properties of bulk material and particles between 1 and 100 nm.
Finally, most of the research described herein pertains to nanoparticles of metals or metal oxides and not to organic substances. That appears to be related in part to the parameters evaluated, and in part to the commercial uses of metals or metal oxides that motivate much of the research.
http://team/clients/rivm/shared documents/a1 - what defines nanomaterials/report/rivm_a1_final report.doc 16
Request A1: What Defines Nanomaterials?
Figure 1. Size Distribution of Particles Studied
3.1 Surface Morphology
OECD (2009) suggested that the basic characterisation of a nanomaterial should include the particle form and structure, or morphology: “a high level description of the morphological nature of the intended nanomaterial must be provided. For example, is the material amorphous or crystalline? Are the particles spherical, rods, plates?”
This parameter was included in the literature review based on information in two review papers, which indicated that surface morphology may affect the rate of dissolution and equilibrium solubility (Borm et al., 2006), and that “the size dependence of the morphology…cannot be ignored in the case of very small nanoparticles” (Auffan et al., 2009). However, the literature search identified only a few papers that discussed size-related effects on morphology. Those papers are included in the database in Appendix B and described below. Far more papers were identified regarding the size-
http://team/clients/rivm/shared documents/a1 - what defines nanomaterials/report/rivm_a1_final report.doc 17
Request A1: What Defines Nanomaterials?
dependence of crystalline structure, a specific aspect of morphology, as discussed in Section 3.2 of this report.
Oezaslan et al. (2012) examined the morphology of platinum-cobalt and platinum-copper alloy particles ranging in size from 3 to 100 nm. The particles were prepared by “dealloying”, an electrochemical leaching process used to prepare highly active fuel cell catalysts. The particles were generally spherical in shape. The study investigated how morphology and particle composition depended on the particle size of dealloyed Pt−Co and Pt−Cu alloy nanoparticle precursor catalysts. The researchers indicated that:
Our results indicate the existence of three distinctly different size-dependent morphology regimes in dealloyed Pt−Co and Pt−Cu particle ensembles: (i) The arrangement of Pt shell surrounding a single alloy core (“single core−shell nanoparticles”) is exclusively formed by dealloying of particles below a characteristic diameter dmultiple cores of 10 to 15 nm. (ii) Above dmultiple cores, nonporous bimetallic core−shell particles dominate and show structures with irregular shaped multiple Co/Cu rich cores (“multiple cores−shell nanoparticles”). (iii) Above the second characteristic diameter dpores of about 30 nm, the dealloyed Pt−Co and Pt−Cu particles start to show surface pits and nanoscale pores next to multiple Co/Cu rich cores. This structure prevails up to macroscopic bulk-like dealloyed particles with diameter of more than 100 nm.
Rockenberger et al. (2010) focused on both stabilised and non-stabilized cadmium sulphide (CdS) nanoparticles, studying the morphology of particles between 1.2 and 14 nm in diameter. After synthesizing the particles, they treated the particles electrochemically to mimic the dealloying process used to manufacture certain catalysts. They found that the size dependence of the mean Cd-S distance depended in part on the capping/stabilisation agent. Static disorder increased sharply above 3 nm compared to bulk CdS particles. The authors indicated that the particles between 3 and 14 nm comprised nanocrystalline powders and particles below 3 nm were essentially single crystals.
While these papers suggest that in some cases the shape and structure of an inorganic particle may depend upon its size, the data are too few to draw general conclusions about the size dependence of morphology. Additional information is available regarding the effect of size on crystalline structure, a specific aspect of morphology.
3.2 Crystalline Structure
The crystalline structure of a material can affect its physicochemical properties and may influence its toxicity. The literature search identified 46 papers that examined
http://team/clients/rivm/shared documents/a1 - what defines nanomaterials/report/rivm_a1_final report.doc 18
Request A1: What Defines Nanomaterials?
size-related effects on crystalline structure. Thirty-two of the papers indicated that crystalline structure depended in some way on particle size. Transition sizes, when observed, ranged from 11.7 to 100-200 nm. However, from the literature reviewed one cannot draw broad, definitive conclusions regarding a sharp property transition related to a specific particle size.
The results of relevant papers are summarised in the database in Appendix B and described briefly below. Other papers reported in the database (Appendix B) pertained less directly to the objectives of this study4 or were not conclusive and so are not described here.
3.2.1 Basis for Evaluation
These studies shared a fundamental basis. The work generally focused on metals and metal compounds prepared via bottom-up synthesis,5 using techniques that allowed the research teams to control particle size formation and/or to segregate materials by particle size. Often, the differences in particle size resulted from calcining the material at different temperatures during synthesis. The researchers examined the crystalline structure of particles at various sizes, often recognizing the interrelationship between calcination temperature, particle size, and crystalline structure. Few studies compared the properties of nanoscale and bulk (i.e., > 1000 nm) particles. Most compared the characteristics of particles within the nanoscale range.
The authors sometimes characterised their results by referring to the unit cell or lattice parameters of the particles. In short, the unit cell is the building block of a crystal: the smallest repeating unit of the three-dimensional crystal structure. A unit cell is characterised by its length(s) of the edges of the cell and the angles between the edges of the cell. In a cubic unit cell, for example, the edge lengths are equal, and the angles between the edges are all 90 degrees. Other unit cells require more complex descriptions, which are given by the following parameters. The lattice parameters (a, b and c), typically measured in Angstroms, represent the edge lengths
4 For example, several research teams examined the effect of particle size on the temperature at which phase transition from (e.g., solid to liquid) occurred, sometimes working outside typical environmental temperatures (Mayo, 2003; Luo et al., 2008). 5 Synthesis of a nanomaterial can begin from the “bottom up”, assembling nanomaterials from their components, for example by chemical synthesis or phase change processes. Other manufacturing methods begin with bulk materials, reducing their size via mass change processes to create nanomaterials from the “top down”. (Sellers et al., 2009)
http://team/clients/rivm/shared documents/a1 - what defines nanomaterials/report/rivm_a1_final report.doc 19
Request A1: What Defines Nanomaterials?
of the crystal or, put another way, the distances between unit cells in a crystal lattice. Unit cells are also characterised by the angles (α, β, γ) between the edges.6
Researchers studying the relationship between particle size and crystallinity have observed several different phenomena. With changes in particle size the unit cell can contract or expand. In some cases this expansion or contraction is asymmetrical; one lattice parameter may change and another may not. This kind of asymmetrical change can distort the a/c ratio. In the most extreme type of distortion, particles of two different sizes will assume different crystalline phases. For example, the unit cell may be tetragonal at bulk scale, but cubic below a certain particle size. Such phase changes may influence the reactivity or toxicity of a particle.
One model of the thermodynamics of phase transition (Mayo et al., 2003) helps to explain the dependence of crystallinity on particle size. In this model, the free energy of phase transition comprises three components:
• Term due to volume free energy (a parameter that relates to the bulk of the material, i.e., to the material chemistry and lattice bonds of the system surfaces or interfaces);
• Term due to surface free energy; and
• Term due to elastic compression of the solid under the pressure exerted by the curved surface (i.e., the LaPlace pressure, which equals the surface free energy times the particle curvature).
As discussed in the introduction to this report, the surface free energy varies with particle size. Intuitively, the curvature of the surface also varies with particle size, increasing with decreasing particle size. While this model has not been used to precisely or absolutely relate crystallinity to particle size for all nanomaterials, it does provide a useful conceptual framework for considering the research described below.
Research by Navrotsky et al. (2010) illustrates the effect of surface free energy on phase stability. They used calorimetric data on surface energies for several transition metal oxide nanoparticles to show that surface energy strongly influences the phase stability of the particles. As the size of the particles decreases, the surface free energy of the particles increases due to large increases in the surface area; however, systems
6 Many references illustrate the available crystal structures and graphically indicate the parameters that characterise the crystalline structure (i.e., a, b, c, α, β, γ). For an illustration from college-level course materials, for example, see http://www.seas.upenn.edu/~chem101/sschem/solidstatechem.html.
http://team/clients/rivm/shared documents/a1 - what defines nanomaterials/report/rivm_a1_final report.doc 20
Request A1: What Defines Nanomaterials?
favour phases with lower surface free energy and, therefore, will react to form crystalline phases with lower surface free energy.
The research described in this report generally explored the following types of size-related effects on crystallinity:
• Lattice parameters
• Stability of different crystalline structures
• Transformation between different crystalline phases
• Formation of otherwise unstable structures
Papers on these topics, as well as a study that showed no effect on crystallinity with particle size, are summarised below.
3.2.2 Change in Lattice Parameters with Particle Size
Literature reports indicate that changing the particle size can result in either lattice contraction or lattice expansion as the particle size decreases. No overarching conclusions can be drawn.
3.2.2.1 Lattice Contraction
Lattice parameters decreased with particle size (lattice contraction) in the experimental work reported below on oxides of nickel, cerium, titanium, barium, and other metals.
Zhang et al. (2009) found that lattice contraction occurred for anatase TiO2 as the particle size decreases, particularly below 5 nm for lattice parameter a. Tsunekawa et al. (2000) reported lattice contraction of the lattice parameter c for barium titanate (BaTiO3) nanoparticles as the particle size decreased from 250 to 15 nm; in another study on BaTiO3, Hoshina et al. (2006) reported a gradual decrease in the lattice parameter c as the particle size decreased from 1000 nm (bulk) to 20 nm.
A slight decrease in the lattice parameters occurred with decreasing size for nickel oxide (NiO) nanoparticles 25 to 16 nm. (Karthik et al., 2011) Lamber et al. (1995) found that palladium clusters (contained within a plasma polymer matrix) had a decreasing lattice parameter a as the particle size decreased from 5 to 1.4 nm. They found that the relative lattice parameter (Δa/a, where a is the Pd bulk lattice parameter) decreases linearly as a function of the reciprocal of the particle diameter.
Working with CeO particles from 26 to 55 nm in size, Morris et al. (2006) determined that lattice contraction occurred as a function of decreasing particle size in a linear relationship; the lattice parameter has also been found to significantly increase with
http://team/clients/rivm/shared documents/a1 - what defines nanomaterials/report/rivm_a1_final report.doc 21
Request A1: What Defines Nanomaterials?
decreasing particle size for CeO when the particle size is smaller than 20 nm (Zhang et al., 2002).
For Lanthanum (0.5) Calcium (0.5) Manganese (VI) oxide (La0.5Ca0.5MnO, LCMO), the lattice parameter, cell volume and the asymmetry parameter decreased in a systematic way with a decrease in the particle size from approximately a few microns to ca. 30 nm (Sarkar et al., 2007).
Shetty et al. (2002), working with BiFeO3, showed that the lattice structure was generally more symmetrical and the unit cell volume decreased with decreasing particle size. Finally, Selbach et al. (2007) determined that size effects on the lattice parameters of BiFeO3 become pronounced at particle sizes below 30 nm and cited work that found that size effects became significant for PbTiO3 below 50 to 150 nm, and for BaTiO3 below 0.15 to 1 μm.
3.2.2.2 Lattice Expansion
In contrast to the results described above, some research has indicated an increase in at least one lattice parameter as the particle diameter of a nanometal oxide or alloys decreases.
Ayyub et al. (1995) studied the effect of particle size on the crystalline structure of partially covalent metal oxides, including oxides of iron, aluminium, lead/titanium, lead/zirconium, and other substances. With a decrease in particle size, these substances became increasingly ionic and the crystals tended to form more symmetric structures. (However, the authors cite work by others showing that the structure of strongly covalent materials such as Si or Ge is independent of particle size down to a particle size of 10 nm.) A decrease in particle size also changed the oxygen stoichiometry in some of the metal oxides. Finally, their work showed a fundamental change in the crystalline structure of the materials studied. The unit cell volume (UCV) (normalised to the number of formula units per unit cell) increased with decreasing size for each phase. The authors noted that “the deviations from bulk properties related primarily to the changes in the size and symmetry of the unit cell” and ultimately concluded that “though the size-induced lattice distortions are relatively small in magnitude, they lead to profound changes in many physical properties ….we observe large deviations in [magnetic properties] and related properties with respect to the corresponding bulk solid when the size is decreased to 10 to 100 nm.”
Li et al. (2004a) reported an increase in the lattice parameter of rutile titanium dioxide (TiO2) with decreasing size between 26.4 and 5.2 nm, and proposed a surface defect dipole model to explain this phenomenon. According to this model, as the particle size decreases an increasing number of Ti atoms appear on the surface and thus have a
http://team/clients/rivm/shared documents/a1 - what defines nanomaterials/report/rivm_a1_final report.doc 22
Request A1: What Defines Nanomaterials?
lower coordination number7. Reactive molecules such as H2O may sorb to these Ti atoms, forming hydration layers which create significant distortion surrounding the surface Ti atoms. This has an electrochemical effect on the entire particle, shifting the negative charge toward the interior of the particle and leaving the surface increasingly positive. It is expected that this shift in charge will create large repulsive dipole-dipole interactions that will affect the crystallinity of the rutile nanocrystals.
Huang et al. (2007) studied BaTiO3 nanoparticles; the lattice parameters a and c both increased with decreasing particle size from bulk (~1000 nm) to nanoparticulate sizes, and within the nanoparticulate size range from 140 to 30 nm. Although Tsunekawa et al. (2000) identified a lattice contraction for parameter c, as described above, they reported a monotonic increase of the lattice parameter a for BaTiO3 nanoparticles as the size increased from 15 to 250 nm. Also testing BaTiO3, Hoshina et al. (2006) reported a gradual increase in the lattice parameter a as the particle size decreased from 1000 nm (bulk) to 20 nm.
Akdogan et al. (2005) reported that the lattice parameter c decreased with decreasing particle size of lead titanate (PbTiO3) while the lattice parameter a increased with decreasing particle size over the range ca. 25 to ca. 150 nm. The c/a ratio decreases with increasing particle size and approaches the bulk value. The authors propose that the bonding characteristics of PbTiO3 may change at sizes < 100 nm such that Ti-O bonds possess increasingly ionic character. Therefore decreasing the particle size to < 100 nm would elongate Pb-Ti bonds and increase electrostatic repulsion and expansion of these bonds, ultimately leading to an increase in the cubic lattice parameter and changing the crystalline structure.
Gamarnik (1994) observed an increase in the lattice parameter a observed for NiO nanoparticles as they decreased in size from 14 to 2.3 nm.
Sharma et al. (2009) reported an increase in the lattice parameters a and c of tin oxide (SnO2) with decreasing particle diameter from 35.2 to 1.9 nm and state that “this is an [sic] agreement with earlier reports that the lattice expands in oxide nanoparticles due to the presence of oxygen ion vacancies or due to the variation in ionicity of the metal oxide semiconductors.”
Multiple studies (Spanier et al., 2001; Zhang et al., 2002; Tsunekawa et al., 2000; Tsunekawa et al., 2004) have examined the effect of particle size on the crystallinity of cerium oxide (CeO2) and identified lattice expansion with decreasing particle size. This substance has been shown to transition from the 4+ to 3+ valence state at a size of 7 The coordination number is defined as the number of points of attachment (i.e., bonds) for a central atom or ion.
http://team/clients/rivm/shared documents/a1 - what defines nanomaterials/report/rivm_a1_final report.doc 23
Request A1: What Defines Nanomaterials?
ca. 1.4 nm (i.e., CeO2 transitions to Ce2O3). The change in valence state (which itself relates to particle size) results in an expansion of the effective ionic radii and thus lattice expansion (Tsunekawa et al., 2004).
In Duan et al. (2005), lattice expansion was reported to occur for the perskovite structure La0.7Sr0.3MnO3 as the particle diameter decreased from 47 to 16 nm. The authors explain this by the increased lattice distortion of surface atoms resulting from the decreased coordination of surface atoms with decreasing size.
Finally, Nowakoski et al. (2008) found a large increase in the lattice parameter a between ruthenium dioxide (RuO2) particles sized 250 nm and 8 to 16.5 nm (i.e., increased with decreasing particle size).
3.2.3 Stability of Different Crystalline Structures at Different Particle Sizes
Various studies have found that different crystalline structures (or phases) occur at different particle sizes.
Zhang and Banfield (2000) reported that the most stable phase transforms from rutile to brookite to anatase as the size of TiO2 nanoparticles decreases from 35 to < 11 nm.
A study of BaTiO3 particles between 30 and 140 nm and bulk BaTiO3 particles (i.e., > 1000 nm) found that with decreasing particle size the crystals were decreasingly tetragonal (i.e., increasingly cubic, the c/a ratio approached the value for bulk BaTiO3 particles) and the cell volume increased (Huang et al., 2007). Several other research teams studying BaTiO3 have also found that with decreasing particle size the crystalline structure changes from tetragonal to cubic, at a threshold measured variously as 120 nm (Uchino, 1989), 100 to 200 nm (Yamamoto, 1993), 80 nm (Tsunekawa et al., 2000), 70 nm (Yan et al., 2006) or 30 nm (Hoshina et al., 2006).
At particle sizes ranging from ca. 150 to ca. 30 nm, PbTiO3 exists in the tetragonal phase; from ca. 30 to ca. 15 nm, in the cubic phase, and below ca. 15 nm, in the paraelectric8 cubic phase (Akdogan et al., 2005). Ishikawa et al. (1996) reported that below a critical size of 11.7 nm, the cubic (ferroelectric9) phase exists for lead titanate (PbTiO3). Above this critical size, the tetragonal phase exists (the c/a ratio approaches 1.0635, the value for bulk particles).
8 The paraelectric phase is defined as unaligned, crystalline phase having a spontaneous, reversible polarisation. 9 The ferroelectric phase is defined as one having a permanent electric polarisation that is spontaneously reversible by application of an external electric field.
http://team/clients/rivm/shared documents/a1 - what defines nanomaterials/report/rivm_a1_final report.doc 24
Request A1: What Defines Nanomaterials?
Antimony clusters were found to transition from an amorphous to crystalline structure above an approximate particle diameter of 120 nm (Kirmse et al., 2003).
Working with 0.5Bi0.8La0.2FeO3–0.5PbTiO3 (BLF-PT) particles of sizes between 80 and ca. 1500 nm, Wei et al. (2010) found that the crystalline structure changed from tetragonal symmetry to rhombohedral for particle sizes of approximately 150 to 400 nm.
Working with LiIn(WO4)2 Hermanowicz et al. (2008) examined particles between 570 and 18 nm and noted that tungstate underwent two size-induced phase transitions at 100 and 30 nm.
Zhang et al. (2006) found that for amorphous zirconium dioxide (ZrO2), the tetragonal phase is thermodynamically favourable (lower surface energy, lower Gibbs free energy) < 13 nm while for particles > 13 nm and < 31 nm, the monoclinic phase is favourable (lower Gibbs free energy).
3.2.4 Effect of Particle Size on Phase Transformation
Other researchers have examined the effect of particle size on the transformation between phases, or different crystalline structures. In experiments with particles between 12 and 23 nm in size, the smaller anatase TiO2 particles had a lower phase transition onset temperature and activation energy for transformation to the rutile form than did larger particles (Li et al., 2004b). Zhang and Banfield (2005) also examined the transformation from the rutile form of TiO2 to the anatase form. With decreasing particle size (21 to 8 nm), the anatase-to-rutile phase transformation rate increased while the required activation energy increased slightly. Ghosh et al. (2003) also found that the stability of anatase TiO2 is size dependent. Experiments with heating TiO2 showed that as the size of nanoparticles decreased from 35 to < 11 nm, the most stable phase changed from rutile to brookite to anatase; particle size determines the thermodynamic phase stability. If particle sizes of the three nanocrystalline phases are equal, anatase is most thermodynamically stable at sizes < 11 nm, brookite is most stable for crystal sizes between 11 and 35 nm, and rutile is most stable at sizes > 35 nm (Zhang and Banfield, 2000).
Singh and Mehta (2005) studied the transformation of In(OH)3 to In2O3 as a function of particle size between 8 and 15 nm. They found that the phase transformation temperature decreased with decreasing particle size.
3.2.5 Formation of Otherwise Unstable Structures at Nanoscale
Some crystalline forms that cannot exist or are not stable at larger particle sizes can exist at nanoscale. Below 13 nm, zirconium particles are stable in the otherwise-
http://team/clients/rivm/shared documents/a1 - what defines nanomaterials/report/rivm_a1_final report.doc 25
Request A1: What Defines Nanomaterials?
unstable tetragonal phase (Xu and Barnard, 2008). Srivastava et al. (2011) were able to synthesize crystalline silver-nickel particles at a size < 7 nm; at larger particle sizes, attempts to mix the two substances resulted in a two-phase structure rather than a crystalline form.
3.2.6 No Change in Lattice Structure with Particle Size
Ma et al. (2012) studied silver nanoparticles in aqueous solution, in contrast to the solid-state studies described above. They did not observe changes in the lattice structure with particle size: Ag-Ag bond lengths and lattice parameters did not vary between particles of 5.5, 26.3, and 80 nm in size, nor did the values measured for these nanoparticles vary significantly from measurements for bulk materials. Ma et al. (2012) attributed this to the fact that they worked with particles in suspension, rather than solid-state systems, and to the theoretical prediction that significant strain would occur only for silver particles smaller than 5 nm.
3.2.7 Summary
Several aspects of the crystallinity of metals and metal oxides may vary with particle size. With changes in particle size the unit cell can contract or expand, as represented by changes in lattice parameters. Particles of two different sizes can also assume different crystalline phases. While many studies have demonstrated size-related effects, no simple conclusions can be drawn to inform the definition of nanomaterial.
In some cases, different experiments with the same material found different results with respect to lattice contraction or expansion. Table 4 indicates those materials and the particle sizes tested. It also indicates the different phases (crystalline structures) observed at different particle sizes. This comparison illustrates the difficulty in drawing broad conclusions about the effects of particle size on crystallinity.
http://team/clients/rivm/shared documents/a1 - what defines nanomaterials/report/rivm_a1_final report.doc 26
Request A1: What Defines Nanomaterials?
Table 4. Observations of Lattice Contraction and Expansion and Phase Change
Substance Particle Sizes at
which Lattice Expansion
Observed (nm)
Particle Sizes at which Lattice Contraction
Observed (nm)
Particle Sizes at which Different Phases Observed at constant T
(nm)
TiO2 < 5 5.2 – 26.4 The most stable phase transforms from rutile – brookite – anatase as the size of TiO2 nanoparticles decreases from 35 to <11 nm.
BaTiO3 * 15 – 250
20 – 1000
15 – 250
20 – 1000
30 – 1000
With decreasing particle size crystals are decreasingly tetragonal and increasingly cubic, with a threshold variously measured as between 30 and 200 nm.
PbTiO3 * 25 – 150 25 – 150 Tetragonal phase at larger particle sizes and cubic phase at lower particle sizes; threshold measured as ca. 30 nm and as ca. 12 nm.
CeO2 < 20
26 – 55
2 – 8
2 – 15
5 – 80
6 – 5000
No studies identified
NiO 16 – 25 2.3 – 14 No studies identified
* As noted above, one study noted an expansion of one lattice parameter and contraction of another with decreasing particle size.
3.3 Water Solubility
Decreasing the particle size can increase the rate at which a substance dissolves and can also increase the equilibrium solubility concentration. Each of these phenomena is discussed below.
3.3.1 Increased Rate of Dissolution
The increased rate of dissolution with reduced particle size is well known, particularly in the pharmaceutical industry, where “nanosizing” increases the bioavailability of poorly-soluble drugs.10 As the United States Food and Drug Administration has noted (2010),
10 For example, see Ambrus et al., 2009; Basa et al., 2008; Dai et al., 2007; Devalapally et al., 2007; Fakes et al., 2009; Hu et al., 2004; Jinno et al., 2006; Kesisoglou, 2007; Kipp, 2004;
http://team/clients/rivm/shared documents/a1 - what defines nanomaterials/report/rivm_a1_final report.doc 27
Request A1: What Defines Nanomaterials?
“’Nanosizing’ is a term developed in the pharmaceutical industry to describe how some previously approved products with particle sizes > 100 nm are being produced with smaller particle sizes, in order to change certain physical and performance characteristics, such as pharmacokinetic profile (i.e., the rate and extent of absorption and clearance from the body).”
Much of the literature on the size dependence of solubility reflects work on pharmaceutical substances. Since the impetus of this project was the European Commission definition of “nanomaterial” within the context of REACH, the literature search did not investigate the pharmaceutical literature on nanosizing but rather includes papers on the dissolution of various non-pharmaceutical substances.
One study examined the dissolution of various metals from airborne particulate samples segregated by size and ranging in size from 57 to 1000 nm (Niu et al., 2010). These samples contained incidental nanoparticles from air pollution rather than manufactured nanoparticles. The research team extracted the samples at neutral pH for 2 hours, analysed the extract for selected metals, and compared the mass in the extract to the total metal in the sample to determine the potentially bioaccessible amount of each metal. No information on the loading rate of the tests was reported. They found that bioaccessibility (or solubility) generally increased with decreasing particle size. Some elements showed a steep increase in solubility as particle size decreased from fine to nano (e.g., V, Fe, Mo, Sn, and Pb); other elements (e.g., Mn, Cu, and Zn) showed little change in solubility with particle size under the test conditions.
Several other studies of metals or metal compounds have found that dissolution rates increase with decreasing particle size. One study found that the rate of dissolution of nanosilver particulate (21 and 111 nm) was up to three times greater than the rate for Ag microparticulates (800 to 3000 nm, 10 to 2000 nm) (Choi et al., 2011). This study tested a single loading rate of 20 mg/L. In an early study, Meulenkamp (1998) found that the dissolution rate of ZnO increased by a factor of 5 when the particle size decreased from 4.3 to 3.15 nm. (Meulenkamp did not discuss the precision and accuracy of the analytical techniques used to distinguish between these particle sizes.)
Barton et al. (2012), studied the dissolution of Fe2O3 (hematite) in the presence of desferrioxamine-B (DFOB), a substance released by aerobic microorganisms in the environment. The ZnO nanoparticles were tested at a single loading rate of typically 2.5 mM. Researchers observed an initial rapid release of Fe in the first few hours
Merisko-Liversidge and Liversidge, 2008; Muller and Peters, 1998; Shikov et al., 2009; Sigfridsson et al., 2009; Tanaka et al., 2009; Takano et al., 2008; Vogta et al., 2007.
http://team/clients/rivm/shared documents/a1 - what defines nanomaterials/report/rivm_a1_final report.doc 28
Request A1: What Defines Nanomaterials?
followed by steady state dissolution that increased the concentration in solution linearly during the 48 hour test. At pH 7, the dissolution rates, normalized to particle surface area (micromole Fe per square meter per hour), were as follows: 0.016 for 3.6 nm particles; 0.018 for 8.6 nm particles, and 0.001 for 40 nm particles. (Note that particle sizes were measured.) The steady state dissolution rates did not vary significantly at pH 3 or 5. Their control experiments, without DFOB, showed that after 24 hours at pH 3 the release of iron ions decreased with increasing particle size; the concentration of Fe ions in the testing medium was ∼6.3, 3.6, and 1.0 μM for 3.6-, 8.6- and 40-nm particles, respectively. Liu et al. (2009a) found that under anoxic conditions at pH 3 the dissolution rate of aggregated PbS crystals varied as a function of particle size and aggregation state. The researchers measured dissolution rates (normalised to surface area) of 4.4×10⁻⁹ mol m-2 s-1 for dispersed 14-nm nanocrystals; 7.7×10⁻¹⁰ mol m-2 s-1 for dispersed 3.1-μm microcrystals; and 4.7×10⁻¹⁰ mol m-2 s-1 for aggregated 14-nm nanocrystals. No information on the loading rate of the PbS nanocrystal aggregates was provided. The authors attributed the difference in dissolution rates to differences in nanotopography and the crystallographic faces present on the ZnO nanoparticles.
3.3.2 Effect on Equilibrium Solubility Concentration
The literature search identified four papers that described experiments to determine the effect of particle size on the equilibrium solubility concentration (i.e., the concentration of the dissolved substance at equilibrium). Those studies demonstrated a size-related effect as described below.
The Ostwald-Freundlich equation predicts that equilibrium solubility should increase with decreasing particle size. While this may not always be the case due to non-ideal behaviour (Borm, 2006), some experimental data do show this effect. The theoretical relationship and available data are described below.
The Ostwald-Freundlich equation relates the solubility of a spherical nanoparticle of radius r (Sr) to the solubility of the bulk form of the substance (Sbulk)11 as follows (Ma et al., 2012).12
Sr = Sbulk * exp ([2γ x Vm] / [R x T x r])
Where γ is the surface tension of the particle (J/m2) Vm is the molar volume of the particle (m3/mol), R is the ideal gas constant, and T is the temperature (K). This
11 Sbulk is defined as the solubility of the bulk form of Ag, which essentially has a flat particle surface compared to the more pronounced surface curvature of a nanoparticle. 12 This simplified form of the equation incorporates the assumption that rbulk >>> rnanoparticle.
http://team/clients/rivm/shared documents/a1 - what defines nanomaterials/report/rivm_a1_final report.doc 29
Request A1: What Defines Nanomaterials?
equation can be applied when surface strain is negligible and γ is independent of particle size, thus it does not apply to the smallest of nanoparticles.13
Ma et al. (2012) examined the dissolution of silver particles between 5 and 80 nm in size and found that solubility increased as the particle size decreased. The experiments were performed in such a way that the availability of oxygen did not limit oxidative dissolution. Further, the experiments continued long enough (for a period of months) to establish steady-state conditions. The authors concluded that under the experimental conditions, solubility correlated well with particle size as measured by transmission electron microscopy, and was not affected by the synthesis method and coating as much as by their size. The results for particles in the range of 5 to 40 nm fit the Ostwald-Freundlich equation (R2 = 0.993). If the data simply reflected an increased rate of dissolution due to the relative increase in the surface area to volume ratio, then the measured release of silver ions per unit surface area would have been constant; however, it was not. The researchers also determined that there was no change in surface tension with decreasing particle size and the particles did not reflect surface strain, regardless of size. Ag-Ag bond lengths and lattice parameters did not vary between particles of 5.5, 26.3, and 80 nm in size.
In another study (Schmidt and Vogelsberger, 2006), different types of industrially produced TiO2 nanoparticles and a precipitated TiO2 were dissolved in aqueous NaCl solutions to study solubility as a function of time (up to 3000 hours), crystalline structure, and particle size. They found a steep increase in the dissolved concentration immediately (approximately in the first hour) followed by a concentration decrease to a value nearly constant over time. The solubility was greater for G5 nanoparticles (9.7 nm, 100% anatase) than for DT51D (23.9-nm diameter, 100% anatase) or P25 (24.4 to 29.7 nm, 86% anatase/14% rutile) nanoparticles.
Wong et al. (2010) measured the solubility of bulk (216 nm) and nano (26 nm) ZnO particles in seawater to support aquatic toxicity testing. The nano ZnO particles tended to form aggregates in the micrometre range (2.3 ± 1.6 μm), which were larger than those formed by the bulk particles (1.7 ± 1.2 μm; t = 4.183, p < 0.01). The authors concluded that nano ZnO had a higher solubility in seawater (3.7 mg/L) than did bulk ZnO (1.6 mg/L) at equilibrium (after 72 hours).
13 Further, this form of the equation does not reflect the potential influence of surface charge. A modified form of the equation, the Ostwald-Freundlich-Knapp equation, accounts for surface charge. That equation predicts that maximum solubility is seen at a critical radius, below which the solubility again decreases (DeVilliars et al., 2009).
http://team/clients/rivm/shared documents/a1 - what defines nanomaterials/report/rivm_a1_final report.doc 30
Request A1: What Defines Nanomaterials?
Another study examined the solubility of ZnS nanoparticles in a basic ethylenediaminetetraacetic acid (EDTA) sodium salt solution (Zhang et al., 2010). As would be expected, the study showed that solubility depended in part on the presence of the chelating agent EDTA and pH. The researchers found that “within the pH range 9 to 10, the lower the pH and the smaller the particles, the higher the conditional dissolution equilibrium constant and hence the higher the solubility of ZnS [nanoparticles].” While these experiments tested nanoparticles (1 to 3 nm) and bulk material, the results do not indicate a “bright line” concentration effect.
3.3.3 Summary
Most data from the studies reported here and with respect to poorly-soluble pharmaceuticals indicate that the rate of dissolution increases with decreasing particle size. However, no clear threshold of a size-related effect exists to support a definition of nanomaterial.
In addition, some experimental data suggest that the equilibrium solubility concentration of a substance originating from a nanoparticle may be greater than the equilibrium concentration resulting from dissolution of a larger particle. Thermodynamic considerations suggest that the solubility varies with the exponent of the particle size diameter.
3.4 Reactivity
The literature search primarily identified studies on metals and metal oxides, not surprisingly given the use of many such materials as catalysts. The literature search identified 52 relevant papers pertaining to reactivity, of which 85% indicated a dependence on particle size. Almost all studies reporting a size effect noted an inverse relationship between size and catalytic reactivity. Maximum activities generally occur below 15 to 20 nm, with a sharp change in reactivity sometime occurring below 5 nm. However, many of the studies focused on particles below 100 nm in size and therefore do not provide direct perspective on the definition of nanomaterial. The results are summarised in the database in Appendix B, and described briefly below.
Some of the literature on the catalytic properties of nanomaterials refers to two parameters: specific activity and mass activity. These terms are used in the summaries below. Specific activity is defined as the catalytic activity normalised to surface area or number of active sites; within the context of fuel cells (Srinivasan, S. [Ed.] 2006) it is the current density relative to the catalyst surface area. Mass activity, as the name implies, is relative to the particle mass.
http://team/clients/rivm/shared documents/a1 - what defines nanomaterials/report/rivm_a1_final report.doc 31
Request A1: What Defines Nanomaterials?
3.4.1 Iron Oxides
Chernyshova et al. (2010) sought to explain the reactivity of hematite (Fe2O3), indicating that:
The dependence of its (bio)chemical reactivity on [nanoparticle] size is observed at sizes larger than 10 nm, i.e., in the size range where neither the quantum confinement (QC) nor surface curvature effects are expected. Hence, the reason for this dependence is likely to be size-induced changes of the [nanoparticle] structure.
They characterised hematite particles between 7 and 120 nm with respect to their size, surface area, crystalline structure, UV-vis absorption spectra, and valence electron population, and found that the band gaps14 decreased with increasing size. Decreasing the band gap with increasing size can increase the particle reactivity. To paraphrase the authors, the decrease in the band gaps and lower energy of the valence band15 edges with increasing particle size imply a higher electron affinity of larger hematite nanoparticles (i.e., larger hematite nanoparticles are stronger electron acceptors than smaller particles). Along with the lower mobility of charge carriers, this effect causes a decrease in the oxidative catalytic activity of hematite with decreasing size. The nanoparticle-driven destabilization of energy of the conduction16 and valence bands observed in this study is also consistent with the degradation of photocatalytic properties of hematite with decreasing particle size.
Chernyshova et al. (2011) then studied the effect of size on the catalytic oxygenation of Mn(II) in the presence of hematite (α-Fe2O3) particles 7 to 150 nm in size. The normalised pseudo-first order reaction rate constant increased with increasing particle size. A large linear increase in this rate constant was observed between 38 and 150 nm hematite particles. The authors postulate that the unexpected increase in reactivity with increasing particle size could be explained by an electrochemical reaction (rather than a chemical reaction) which became more efficient at larger particle sizes due to the difference in electronic states between nano and bulk particles. They distinguish between chemical reaction and electrochemical reaction as follows:
14 The band gap is defined as the difference in energy between the top of the valence band of electrons and the bottom of the conduction band and is measured in electron volts (eV). 15 The valence band is defined as the highest range of energies containing electrons at absolute zero. 16 The conduction band is defined as the range of energies required to free an electron from the valence band of the atomic orbital so that it is free to move within the atomic lattice.
http://team/clients/rivm/shared documents/a1 - what defines nanomaterials/report/rivm_a1_final report.doc 32
Request A1: What Defines Nanomaterials?
The NP size-induced changes in the catalytic redox properties of ferric (hydr)oxides have previously been discussed exclusively within the chemical paradigm in terms of variations in crystallographic facets, aggregation, surface hydration, basicity of the NPs, and surface texture (relative concentration of weakly and strongly adsorbed complexes). This paradigm considers that both the reduction and oxidation half-reactions take place at the same adsorption site or two neighbouring adsorption sites and neglects semiconducting properties of the NPs…. A specific feature of the alternative, electrochemical mechanism is the spatial separation of the oxidation and reduction half reactions, which are electrically coupled by charge transfer within either the interior or surface of the catalyst.
Anschultz and Penn (2004, 2005) studied the oxidation of hydroquinone by various iron oxides, including 6-line iron oxyhydroxide ((Fe3+)2O3.0.5H2O) nanoparticles ca. 3.5 nm, ferrihydrite nanoparticles ((Fe5HO8.4H2O)3, 4 to 6 nm), and goethite rods (α-FeOOH, 5.3 x 64 nm and 22 x 367 nm). They concluded that reactivity increased with decreasing particle/rod size and that the rate of redox reaction, using iron oxyhydroxide nanoparticles as the reducing agent, is strongly particle size and phase dependent.
Strongin et al. (2005) investigated the size-dependent surface reaction rate of iron oxyhydroxide ([Fe3+]2O3.0.5H2O) using particles 2 to 6 nm in diameter and found that the rate of surface reactions that led to the production of adsorbed sulphur oxyanions increased with decreasing particle size.
Vikesland et al. (2007) synthesised 9- and 80-nm magnetite particles (Fe3O4) and tested the rate at which these particles catalysed the reductive dechlorination of carbon tetrachloride. The surface area-normalised degradation rate constant was an order of magnitude greater for the 9-nm catalyst than the 80-nm catalyst.
3.4.2 Cobalt
Several studies have examined the effect of particle size on cobalt catalysts used in Fischer-Tropsch reactions, which are used to produce hydrocarbons from the reaction of hydrogen and carbon monoxide.
Bakhmutskya et al. (2011), exploring the reported decrease in the efficiency of Co catalysts in Fischer-Tropsch synthesis at particle sizes < ca. 7 nm, compared the values for certain thermodynamic parameters for bulk and nanoparticle Co at elevated temperatures. They found that particle size does not affect the redox thermodynamic properties to any significant degree for particles larger than 4 nm.
Another study examined the role of particle size in cobalt-carbon nanofibre catalysts on the Fischer-Tropsch reaction at 1 bar or 35 bar of pressure (Bezemer et al., 2006). At
http://team/clients/rivm/shared documents/a1 - what defines nanomaterials/report/rivm_a1_final report.doc 33
Request A1: What Defines Nanomaterials?
1 bar, the catalyst performance was independent of cobalt particle size for catalysts with sizes between 6 nm and 27 nm with a slight increase in hydrogenation activity near 6 nm. As the Co particle diameter decreases from 6 to 2.6 nm both the activity and the turnover frequency17 (TOF) decrease rapidly. At 35 bar, the activities were dependent on particle size while the TOF was found to be independent of size at particle diameters ranging from ca. 15 to 8 nm with a rapid decrease in TOF as particle size decreases from 8 to 2.6 nm. In an attempt to explain the decrease in activity below sizes 6 to 8 nm, the authors propose a minimal Co particle size required to stabilize surface domains containing the active sites for CO absorption. Below this size (i.e., 6 to 8 nm), the active sites are unstable or they contain a non-optimum ratio of the different active sites.
den Breejen et al. (2010) investigated the role of the cobalt particle size distribution in the Fischer–Tropsch reaction for supported Co catalysts. Their research group tested the reactivity of Cobalt / carbon nanofibre (Co/CNF) catalysts between 2.4 and 11.3 nm and Cobalt / silica (Co/SiO2) catalysts between 4.6 and 15.8 nm in diameter. The catalytic activity of Co/CNF nanoparticles reached a maximum at 5.7 nm and decreased with both increasing and decreasing particle size. The catalytic activity for Co/SiO2 nanoparticles increased with decreasing particle size.
Prieto et al. (2009) examined the effect of particle size on Co3O4 catalysis. They experimented with Co3O4 supported on spherical SiO2 using particles between 5.9 and 141 nm in size. Under realistic Fischer–Tropsch synthesis conditions (493 K, 2.0 MPa) the TOF increased from 1.2×10⁻³ to 8.6×10⁻³ s-1 when d(Co0) was increased from 5.6 to 10.4 nm, and then TOF remained constant up to a particle size of 141 nm.
Strongin et al. (2005) reported an increase in the rate of surface reactions of cobalt oxide (CoO) nanoparticles 2 to 3 nm with decreasing particle size.
Finally, a study on the influence of nanoparticle size on the activity of the inverse spinel CoFe2O4 for CO oxidation measured the temperature at which 50% catalytic conversion was achieved for catalysts ranging in size from ca. 6 to 30 nm and incorporating various capping agents. As the particle diameter increased, the temperature required for 50% conversion of the CO to CO2 within the sample increased; based on data obtained at the same temperature, conversion was much more effective for smaller catalyst particle sizes (Evans et al., 2008).
17 Turnover frequency is defined as the maximum number of molecules of substrate that a catalyst can convert per catalytic site per unit time.
http://team/clients/rivm/shared documents/a1 - what defines nanomaterials/report/rivm_a1_final report.doc 34
Request A1: What Defines Nanomaterials?
3.4.3 Palladium
Two studies found that larger Pd particles could not be oxidised although smaller particles were able to react. Schalow et al. (2007) investigated the reactivity of Pd nanoparticles supported on an ordered Fe3O4 film on Pt(111) for the oxidation of CO as a function of particle size (ca. 4 to ca. 70 nm) at 500 K. Interface oxidation and partial surface oxidation occur easily at particle sizes up to approximately 7 nm (corresponding to a Pd coverage of 0.4 nm). Kinetic hindrances limited oxidation at larger particle sizes. A study of Pd on an MgO substrate found that palladium particles were increasingly oxidised to PdO as particle size decreased from 5.6 to 4.8 nm while particles between 5.6 and 24 could not be oxidised (Nolte et al., 2008).
Several research teams have studied the reaction mechanisms that affect the size dependency of reactivity. However because these studies focused on the smallest of nanoparticles they do not directly inform the definition of a nanomaterial. Doyle et al. (2005), working with particles between 1 and 5 nm, found a strong particle size effect for the hydrogenation of pentene by Pd coated Al2O3, but not for ethene. The authors attributed the different effects of particle size on reactivity to the portion of the crystalline structure involved in the reaction (and the relative effect of size on that aspect of the structure). In another study, Wilson et al. (2006) “report that the rate of hydrogenation of allyl alcohol is a function of the diameter of the Pd nanoparticles (1.3 to 1.9 nm) used to catalyse the reaction. Furthermore, kinetic data indicate that this effect is electronic in nature for particles having diameters < 1.5 nm, but for larger particles it depends primarily on their geometric properties.” In this study, Pd nanoparticles were encapsulated with hydroxyl-terminated polyamidoamine dendrimers.
Another study, of carbon supported Pd in alkaline solution, found different size effects (Jiang et al., 2009). The specific activity of the Pd/C catalyst (i.e., the oxygen reduction reaction current normalised to the Pd active surface area), increased by a factor of 3 with increasing particle size from 3 to 16.7 nm. The researchers surmised that increased OH− adsorption on smaller particles blocked the active reaction sites. The mass activity of Pd slightly increased (by a factor of 1.3) when particle size increased from 3 to 5 nm and then decreased with increasing particle size.
3.4.4 Gold
Many studies have examined the reactivity of nanoscale particles of gold (Au), alone or supported on a metal-based or organic structure. These studies typically examined either the catalytic oxidation of CO or of organic molecules by gold particles between 1 and 60 nm, sometimes on a metal oxide support. The results generally showed that
http://team/clients/rivm/shared documents/a1 - what defines nanomaterials/report/rivm_a1_final report.doc 35
Request A1: What Defines Nanomaterials?
reactivity increased as particle size increased (Cuenya et al., 2003; Haruta et al., 1993; Kalimuthu et al., 2008; Kozlove et al., 2000; Schwartz et al., 2004; Zhou et al., 2010).
Four studies showed that catalytic activity reached a maximum at a relatively small particle size and then decreased as the particle size grew even smaller. In a study utilizing Au nanoparticles between 10 and 48 nm, Sau et al. (2001) found that catalysis of the oxidation of eosin decreased from 10 to 15 nm and then increased from 15 to 48 nm (i.e., minimised at 15 nm). Valden et al. (1998), working with Au particles of 1 to 6 nm in size, determined that oxidation of CO reached a maximum when the Au catalyst was 3.5 nm. A study of Au nanoparticles between 1 and 3.5 nm in size found that the maximum oxidation of CO occurred at 2 to 2.4 nm (Zanella et al., 2004). Finally, Deng et al. (2005), testing particles 2.7 to 24.7 nm, found that the maximum activity of Au nanoparticles for the reduction of anthracene was 5.4 nm.
Catalysis reactions may be affected by the ability of gold itself to be oxidised under aerobic conditions. Miller et al. (2006), working with 2- to 5-nm Au particles supported on SiO2, Al2O3 or TiO2, found that Au particles < 3 nm oxidize in air (with approximately 10% reacting); larger particles are not oxidised.
Parker and Campbell (2007) appear to have obtained contrary results regarding the effect of particle size on catalytic activity. In their work with Au deposited on titanium dioxide TiO2, they found that the catalytic reaction rate for the oxidation of CO increased with increasing nanoparticle size. However, they did not clearly report the particle size range tested, simply reporting on the coverage of Au on the TiO2 substrate. By inference from one of the figures in the paper they may have examined particles in the size range ca. 1 nm to ca. 6 nm.
3.4.5 Platinum
Platinum (Pt) can catalyse oxidation reactions, such as the oxidation of CO, and reduction reactions. In fact, Pt catalysts can be used in both the anode and cathode of fuel cells (Yano et al., 2006). The studies described below examined both types of reactions. Some studies showed increasing catalytic activity as the particle size decreased; others showed the opposite effect, or a peak reactivity at a small particle size (with declining reactivity of larger particles or particles that were smaller yet), or no effect at all. Brief summaries of these studies follow.
Wang et al. (2009b), investigating the size-dependent activity of nanoplatinum bimetallic alloy catalysts (Pt3Co) on the oxygen reduction reaction (ORR), found that the specific activity of the particles increased by a factor greater than two as the particle size decreased from 9 to 3 nm while the maximum mass activity occurred at 4.5 nm. In a study of ethylene hydrogenation, the activity of 5-nm MCF-17 mesoporous
http://team/clients/rivm/shared documents/a1 - what defines nanomaterials/report/rivm_a1_final report.doc 36
Request A1: What Defines Nanomaterials?
silica-supported Pt nanocrystals was 2 to 3 times higher than that of 9-nm nanocrystals (Tsung et al., 2009). Also studying mesoporous silica-supported Pt nanocatalysts, Grass et al. (2009) evaluated the effect of particle size on the hydrogenation of crotonaldehyde to crotyl alcohol and butyraldehyde. They reported that with an increase in particle size from 1.7 to 7.1 nm, the selectivity towards crotyl alcohol as the reaction product (rather than butyraldehyde) increased from 13.7 to 33.9%. In addition, the TOF for the catalytic hydrogenation increased with increasing particle size. The initial rate of decarbonylation to form propene and CO was higher for smaller catalyst particles, and the authors inferred that these reaction products “poisoned” or deactivated the smaller catalyst particles to a greater degree than the larger catalyst particles, thus explaining the higher TOF for larger particles.
Mayrhofer et al. (2005) found that the specific activity of carbon-supported Pt catalysts increased with decreasing particle size (from 30 to 1 nm) for the CO oxidation reaction and decreased with decreasing particle size for ORR.
Several studies found that specific activity decreased with decreasing particle size. However given the ranges of particle sizes tested in two of the studies, the results may be consistent with the data described further below which showed a maximum reactivity at a relatively small particle size, with reactivity decreasing for particles larger or smaller than that critical size. A study of particles ranging in size from bulk to nanoscale (Nesselberger et al., 2011) found that the specific activity of the ORR decreased as particle size decreased from 5,000,000 nm to 5 nm. Differences in the ORR from 5 to 1 nm Pt were insignificant. Wang et al. (2010), working with a Pt-Co bimetallic alloy supported on carbon black, found that as the particle size decreased from 9 to 3 nm, the specific activity for ORR also decreased , with the activity at 9-nm nanoparticles being twice that for 3-nm Pt3Co nanoparticles. The authors noted that 4.5-nm Pt3Co nanoparticles exhibited the maximum mass activity for the ORR.
Two studies identified an optimum particle size, above and below which reactivity decreased. Sharma et al. (2003) used Pt nanoparticles (ranging from 10 to 80 nm in size) to catalyse the reaction between Fe(CN)6
3- and S2O32-. The maximum reaction
rate was observed at a catalyst particle diameter of ca. 38 nm. Below a catalyst particle diameter of 38 nm, the reaction rate decreased with the decrease in particle size. Above a catalyst particle diameter of 38 nm, the experimental results showed a steady decline of reaction rate with increasing size. The authors attributed the slow reaction rate for the smallest particles to surface adsorption of Fe(CN)6
3- onto the nanoparticles and consequent enhancement of band gap, which leads to a higher activation energy for particle-mediated electron transfer. As the size of the particle is increased to 38 nm the band gap is reduced, leading to lower energy for the reaction process. For larger particles (> 38 nm), the total surface area available for the reactants becomes an
http://team/clients/rivm/shared documents/a1 - what defines nanomaterials/report/rivm_a1_final report.doc 37
Request A1: What Defines Nanomaterials?
important factor in deciding the reaction rate. Perez et al. (1998) found that the activity of Pt nanoparticles supported on carbon electrodes depended on solution pH, particle size, and the structure of the active layer. In alkaline solution, the maximum specific activity occurred at ca. 4.5 nm, then decreased at sizes of 9 to 12 nm and then an increase in specific activity up to the maximum diameter tested, 16.5 nm. The authors noted that in alkaline solution, the carbon played a role in the reaction. However in acid medium specific activity decreased with decreasing particle size, particularly when the calculation compensated for the structural effects of the active layer.
One study found no effect of particle size on reactivity. Yano et al. (2006) tested the reactivity of Pt supported on carbon black (nanoparticles 1.6 to 4.8 nm in size). They concluded that “the electronic properties of the surface atoms on platinum nanoparticles do not show any particle size effect” with respect to ORR.
3.4.6 Other Substances
This section of the report summarizes information obtained for other substances. Typically, only one or two studies were performed on each of the substances described below.
3.4.6.1 Metals
Sun et al. (2006) studied the reaction of Al particles (passivated with a layer of Al2O3 and ranging in size from 17 to 3000 nm) with oxygen and with molybdenum trioxide (MoO3). They found that the maximum oxidation reaction rate increased with decreasing particle size over the size range tested. Zachariah et al. (2004) tested the oxidation of Al particles between ca. 15 and 150 nm. The rate of oxidation of Al increased with decreasing particle size. Aluminium nanopowder with a primary particle size > ca. 80 nm was not fully oxidised even at 1100 °C.
A study of the catalytic activity of Ni aerosols (5 to 26 nm) found that the reactivity varied with particle size such that reactivity peaked at a critical size and then declined for particles larger or smaller than that size. The test reaction was the methanation of CO and H2, and reactivity was characterised according to the TOF. The TOF increased by a factor of 20 between Ni particle sizes of 5 and 18 nm and decreased to the initial value for particles 25 to 26 nm (Seipenbusch et al., 2000).
Two papers identified in the literature search described the reactivity of silver particles of various sizes. Ivanova and Zamborini (2010) studied the voltammetry of citrate-capped Ag nanoparticle oxidation as a function of size. The redox potential decreased with decreasing particle size (i.e., greater tendency to be oxidised as particle size decreases) within the size ranged studied of 10.4 to 44.2 nm. Chaki et al. (2004)
http://team/clients/rivm/shared documents/a1 - what defines nanomaterials/report/rivm_a1_final report.doc 38
Request A1: What Defines Nanomaterials?
investigated the variation in electrochemical properties with size for Ag nanoparticles, 2 to 7.2 nm in size, which were protected with dodecanethiol in aqueous medium. The authors concluded based on voltammetric data that electron transfer facility in redox reactions should be at its maximum, within the size range tested, at 3.5 to 6 nm.
3.4.6.2 Metal Oxides
Zaki et al. (2011) investigated the relationship between the catalytic activity of anatase TiO2 nanoparticles and particle diameter. This study found that smaller particle sizes (within the size range 8 to 19 nm) had a larger number and/or energy of catalytically active sites, as evidenced by an increase in the TOF of alcohol decomposition with decreasing particle size. A second study evaluated the reactive oxygen species (ROS) generating capacity of anatase TiO2 nanoparticles of nine different sizes between 5 and 182 nm. The production of ROS was constant with size for particles < 10 nm and > 30 nm, with a sharp increase between 10 and 30 nm (Jiang et al., 2008). The authors noted that for particles between 30 and195 nm and below 10 nm, the ROS activity was proportional to the surface area. They also noted that reactivity can be related to the defect site density (i.e., density of defects in the crystalline structure) and that the defect site density is approximately constant above 30 nm, decreases between 30 and 10 nm, and then is very low and approximately constant for particles below 10 nm.
An investigation into the size-dependent redox potentials of ZnO particles between 2.55 and 4.22 nm in size found that the critical redox potential increased with decreasing particle size (Hoyer and Weller, 1994).
Two studies were identified which investigated the reactivity of ruthenium dioxide (RuO2). Jirkovský et al. (2006) studied the electrochemical behaviour of RuO2 in acidic media containing chlorides to address the activity of nanocrystals toward both oxygen and chlorine evolution reactions (OER and CER, respectively). They found that the activity of the nanoparticles for the OER increased with decreasing particle size from 50 to 10 nm but did not find a size-related effect for CER. These relationships were explained by the amount of crystalline edges and faces present on the particles. Nowakowski et al. (2008) studied the catalytic conversion of methane by RuO2 nanoparticles ranging from 8 to 16.5 nm; it was found that catalytic efficiency increases with decreasing particle size.
Finally, Kumar et al. (2004) evaluated the catalytic activity of uranium oxide (U3O8) co-encapsulated in the pore system of mesoporous silica for the decomposition and oxidation reactions of methanol. Nanoparticles were produced by two different methods resulting in particle size ranges of 2 to 5 nm and 3 to 15 nm. The catalysts synthesised by different methods had different structures, in addition to different sizes.
http://team/clients/rivm/shared documents/a1 - what defines nanomaterials/report/rivm_a1_final report.doc 39
Request A1: What Defines Nanomaterials?
The study found that the 2- to 5-nm particles had a higher catalytic activity than the particles ranging from 3 to 15 nm in size.
3.4.6.3 Carbon
Williams et al. (2010), working with diamond nanoparticles, found that reactivity of the particles increased as the particle size decreased from 20 to 4 nm. Core-sized diamond nanoparticles (4 nm) were able to react with molecular hydrogen while 20-nm diamond nanoparticles and bulk diamond particles did not.
3.4.7 Summary
Mayrhofer et al. (2005) provided succinct perspective on the effect of catalyst particle size:
Decades before the prefix “nano” appeared so prominently in the scientific lexicon, catalytic chemists had already realized that unique catalytic properties were obtained on metallic clusters in the diameter range of 1 to 10 nm…. In the scale of this dimension, two kinds of parameters can control the catalytic activity of nanoparticles: electronic factors, mainly related to the surface electronic structure and energetics, and geometric factors, naturally believed to be associated with the topography of atom distribution on the catalysts’ surface. … Given that the distribution of surface atoms varies with the characteristic dimension of the aggregates, each size cluster may exhibit unique electronic and structural properties. This would generate what is now widely known in heterogeneous catalysis as the “crystallite size effect”, that is, the variation of the reaction rate or selectivity with the characteristic dimension of a metallic catalyst.
Most of the studies described in this report determined that reactivity increased as particle size decreased, with maximum activity often occurring below 15 to 20 nm. Some studies reported the opposite effect, and some noted a size corresponding to peak reactivity (with lesser reactivity of particles above and below that size). The studies often focused on particles well below 100 nm in size and such studies do not aid in evaluating the upper bound of the proposed definition of a nanomaterial.
At least two phenomena, electronic and geometric, may explain the size dependence of reactivity. First, decreasing the particle size increases the relative number of atoms at the surface of the particle; not only does that mean that a higher proportion of atoms are available to participate in reactions, but they are less energetically stable than the atoms in the centre of the particle. Second, some reactions depend on geometry. A reaction may require a certain type of surface atom, e.g., a crystal edge or face, in
http://team/clients/rivm/shared documents/a1 - what defines nanomaterials/report/rivm_a1_final report.doc 40
Request A1: What Defines Nanomaterials?
order to occur. Reactivity may also be affected by the presence of capping agents, solution conditions, or the sorption of reactants to the particle surface.
3.5 Photocatalytic Reactivity
The following paragraphs summarize studies of the effect of particle size on the photocatalytic activity of titanium dioxide, cadmium sulphide, and gold-titanium dioxide films and composites.
3.5.1 Titanium Dioxide
Several studies have evaluated the effect of particle size on the photocatalytic degradation of chlorinated solvents such as chloroform (CHCl3) and trichloroethylene (TCE). Wang et al (1997) tested primarily anatase TiO2 particles between 6 and 21 nm in size and found that the highest photoactivity occurred for the intermediate particle size of 11 nm. Zhang et al. (1998) found similar results: for pure TiO2 catalysts, which were primarily anatase, the photonic efficiency18 of pure TiO2 increased when particle size was reduced from 21 to 11 nm, but decreased when the size was further reduced to 6 nm; they concluded that a particle size of ca. 10 nm might be the optimal value for pure TiO2 photocatalyst in liquid-phase decomposition of CHCl3.
Maira et al. (2000) examined the photocatalytic activity of nanometre-sized anatase TiO2 and TiO2 aggregates using gas-phase TCE photooxidation. The rate of oxidation increased as the TiO2 crystal size decreased from 27 to 7 nm, but catalyst activity dropped when smaller primary particles (i.e., 3.8 and 2.3 nm) were used. The authors propose that the drop in catalyst activity for crystal sizes smaller than 7 nm may be due to changes in the structural and electronic properties of the nanometre crystals. Secondary particle size also had a strong effect on the catalytic activity of TiO2. For aggregates smaller than 600 nm, TCE conversion exhibited a rapid linear decline with increasing secondary particle size.
Three studies tested the efficacy of various sized nanoparticles in the photooxidation of phenol. The first investigated the photoactivities of TiO2 nanoparticles (4 to 58.2 nm) in the anatase, rutile or mixed-phases (Gao and Zhang, 2001). For rutile TiO2, the photocatalytic activity increased with decreasing crystallite size (40.8 to 7.2 nm), and the activity of rutile-type TiO2 nanoparticles of 7.2 nm in size was comparable to that of anatase TiO2 nanoparticles. Another study used TiO2 particles (> 70% anatase; < 30% rutile) between 5 and 169 nm in size as photocatalysts for the oxidation of phenol.
18 Photonic efficiency is defined as the ratio of the overall rate of photocatalytic process to the intensity of incident light falling on the reactor. (Klabunde, K. J. and Richards, R. M. [Eds.] 2009.)
http://team/clients/rivm/shared documents/a1 - what defines nanomaterials/report/rivm_a1_final report.doc 41
Request A1: What Defines Nanomaterials?
Researchers observed a strong effect of particle size on photoactivity. They found that the effects of particle size on the efficiency of light absorption and scattering and charge-carrier dynamics at particle sizes < 25 nm dominated the apparent photoactivity of TiO2, and concluded that an optimum particle size of 25 to 40 nm existed under the test conditions (Almquist and Biswas, 2002). The third study (Calza et al., 2007) showed that the reaction rate for the photocatalytic degradation of phenol by TiO2 nanoparticles increased with increasing particle size over the range of 3.7 to 7.8 nm.
Another study (Jang et al. 2001) evaluated the decomposition of several materials – methylene blue, two bacterial species, and ammonia gas – by TiO2 nanoparticles at varying particle size and anatase mass fractions (the latter at a constant particle size of 15 nm) under low intensity UV light. The photocatalytic decomposition of methylene blue (1 mW UV light) increased with decreasing particle size from 30 to 15 nm; however, the effect of anatase mass fraction played a more important role in enhancing the degrees of decomposition of methylene blue than did particle size. TiO2 nanoparticles of smaller size (13 to 15 nm) were more effective in the decomposition of both bacterial species at 1 µW UV light. Again, the anatase mass fraction was much more effective in the decomposition of the bacteria than the particle size. For the decomposition of ammonia gas (1 µW UV light), 13- to 15-nm nanoparticles were more effective than were large particles (28 to 30 nm).
In summary, the research described here indicates that reactivity increases with decreasing particle size. In some cases that occurred until a particle size of approximately 7 to 11 nm, and particles that were smaller still showed reduced photoreactivity. In addition to depending on particle size, photoreactivity depended on the mineral form (anatase or rutile) of TiO2.
3.5.2 Cadmium Sulphide
Pal et al. (2004) investigated the size-dependent photocatalytic activity of silica-coated cadmium sulphide for the dehydrogenation of methanol, using catalyst particles of 2.4 to > 100 nm in size and found the maximum reaction rate was obtained for 2.8-nm particles. Above and below this size the reaction rate decreased. Datta et al. (2008) performed experiments to investigate the size-dependency of photocatalytic activity of thiol-capped CdS nanoparticles on nitroaromatics. The photocatalytic rate constant increased with decreasing particle size (5.8 to 3.8 nm). The authors noted that for particles > 6 nm, the photocatalytic efficiency of CdS nanoparticles is negligible.
3.5.3 Gold–Titanium Dioxide and Other Gold Nanoparticles
As described by Yogi et al. (2011), “Improvement of the photocatalytic activity of TiO2 is one of the most important aspects of heterogeneous photocatalysis. Au nanoparticles
http://team/clients/rivm/shared documents/a1 - what defines nanomaterials/report/rivm_a1_final report.doc 42
Request A1: What Defines Nanomaterials?
(AuNPs)-doped TiO2 is well-known to possess a high photocatalytic activity due to its inhibition of a recombination of photogenerated electron hole pairs by AuNPs.” Several studies, as summarised below, have examined the effect of varying the Au nanoparticle size on the photocatalytic activity of Au-doped TiO2.
A study of the reduction of reduction of boron-dipyrromethene via gold-titanium dioxide (Au-TiO2) composite nanoparticles (5 to 14 nm) found that the time for substrate to adsorb to catalyst surface and to be catalysed decreased with decreasing particle size (Wang et al., 2011).
Kaur and Pal (2012) investigated the effects of the size and shape of supported Au nanoparticles on the co-catalytic activity imparted to TiO2 during photocatalytic oxidation of salicylic acid. The photodegradation rate was rapidly enhanced with decreasing size of Au nanoparticles on the TiO2 catalyst from 9.5 nm to > 5 nm and 3.5 nm. The addition of Au nanoparticles to TiO2 increased the rate of photodegradation compared to bare TiO2.
Yogi et al. (2011) investigated the size effects of Au nanoparticles on the TiO2 crystalline phase of nanocomposite Au nanoparticle-embedded TiO2 (Au-TiO2) thin films, their adsorption ability, and photocatalytic activity. Their results showed an indirect effect of particle size on reactivity. The size of the Au nanoparticle affected the TiO2 crystalline phase (anatase vs. rutile); the highest photocatalytic activity occurred in the film with the well-crystallised anatase phase.
Another type of gold nanoparticle has also been studied. Kell et al. (2005) evaluated the photoreactivity of Au-core monolayer-protected nanoparticles modified using a series of aryl ketones. Their objective was to probe aspects of site reactivity as it varies with core size, recognizing that reactivity may depend on aspects of the structure/ crystallinity that vary with nanoparticle size. The reactivity of aryl-ketone modified Au nanoparticles increased with decreasing particle size from 4.6 to 1.7 nm for all four ketones tested.
3.5.4 Summary
The studies summarised herein, for TiO2, CdS, and Au and various Au composites, generally showed that photoreactivity increased with decreasing particle size. In some cases the behaviour of the material changed at a particle size of approximately 5 to 10 nm. For example, some studies of TiO2 showed that photoreactivity reached a maximum at a particle size of approximately 7 to 11 nm, and decreased at smaller sizes. A study of CdS showed that particles above 6 nm in size were not photoreactive at all, but that smaller particles effectively catalysed the dehydrogenation of methanol.
http://team/clients/rivm/shared documents/a1 - what defines nanomaterials/report/rivm_a1_final report.doc 43
Request A1: What Defines Nanomaterials?
4 Discussion
By compiling and evaluating the literature on critical physical/chemical parameters of nanomaterials, this project sought to define, where possible, the particle sizes at which the “nano” distinction might become clear. Review of the literature indicated that:
• Few published studies tested materials at size ranges that included particles both above and below the threshold criterion of 100 nm;
• The studies focused on inorganic substances rather than carbon-based nanomaterials; and
• Most studies did not use standard methods, in part because the research community has struggled with the application of standard methods to nanomaterials and in part because much of the research to date has occurred in university research laboratories.
Physical/chemical properties were prioritised with respect to their potential variation with size and importance with respect to fate, transformation, and/or toxicological effects in the environment. The findings for high priority parameters are presented below, followed by a discussion of lower priority parameters and recommendations.
4.1 High Priority Properties
The high priority physicochemical properties investigated were surface morphology, crystalline structure, water solubility / dissolution, reactivity and photocatalytic activity. Of these properties, water solubility and reactivity/ photoreactivity have the most direct implications for environmental fate, transformation, and toxicity of nanomaterials.
The effects of particle size on surface morphology have not been widely investigated in the peer-reviewed literature.
Many studies have investigated the size-related effects on crystallinity, including contraction / expansion of the unit cell (lattice contraction / expansion) and phase transformation between different crystalline phases of inorganic materials. Crystallinity can affect solubility and reactivity, and thus influence the fate, transformation, and toxicity of nanomaterials, and thus was assigned a high priority. The majority of the studies reported size related effects. Most notably, they reported that distortion of the crystal lattice structure and the transformation between different crystalline forms occur at particle sizes ranging from 11.7 to 200 nm (See Table 5). However, no simple conclusions can be drawn to inform the definition of nanomaterials.
It is widely understood that nanosizing materials increases the rate of dissolution and equilibrium water solubility concentration. Both phenomena have immediate
http://team/clients/rivm/shared documents/a1 - what defines nanomaterials/report/rivm_a1_final report.doc 44
Request A1: What Defines Nanomaterials?
implications for environmental effects: an increase in the rate of solubility could, for example, change the dynamics of toxicity, and an increase in equilibrium solubility could increase the bioavailability and thus perhaps the toxicity of a substance. A common application of this phenomenon is in the pharmaceutical industry where drugs are milled to nanosizes to increase the bioavailability. The majority of the peer-reviewed literature investigating water solubility/dissolution of nanomaterials study poorly-soluble organic compounds used in the pharmaceutical industry. A small number of papers investigated the size-related effects of water solubility / dissolution; a ‘bright line’ particle size threshold could not be calculated from these papers. However, some data suggest that equilibrium solubility concentrations of substances originating from nanoparticles may be greater than the equilibrium concentration resulting from dissolution of larger particles.
The catalytic and photocatalytic properties of inorganic materials can be enhanced through a reduction in size, particularly at particle sizes much smaller than 100 nm. The majority of the peer-reviewed literature on this topic describes the catalytic and photocatalytic activities of various materials at sizes in the range of 1 to 20 nm. ‘Bright line’ particle size thresholds were determined from the literature as being 15 to 20 nm and 5 to 10 nm for catalytic and photocatalytic reactivity, respectively. (The literature does not suggest a second threshold at a larger particle size.) These thresholds are not useful for informing the definition of nanomaterials as they relate to the current widely-accepted particle diameter of 100 nm.
Table 5. ‘Bright Line’ Thresholds Identified in the Literature Review
Substance Bright Line Threshold Identified?
Bright Line Threshold (nm)
Basis for Threshold
Surface morphology None N/A N/A
Crystalline structure Yes 11.7 to 200
Distortion of crystal lattice structure
Different crystalline forms
Water solubility / Dissolution None N/A N/A
Reactivity Yes 15 to 20 Maximum catalytic activity
Photocatalytic activity Yes 5 to 10 Maximum photocatalytic activity
http://team/clients/rivm/shared documents/a1 - what defines nanomaterials/report/rivm_a1_final report.doc 45
Request A1: What Defines Nanomaterials?
4.2 Lower Priority Properties
Some of the parameters assigned a lower priority in this project may also be important to environmental fate and transformation in some cases. Physical hazards can result from the increase in flammability, self-ignition potential, and explosiveness that can result from decreasing particle size. The effect of particle size on magnetism has been widely evaluated for non-environmental purposes, but may affect the environmental transport of certain metals such as nano zero-valent iron.
Finally, it may be worth noting that the particle-size dependence of two properties that were screened out of this evaluation may become more important as scientists gather more data. Zeta potential characterises the electrokinetic potential of a nanoparticle suspended in solution. It indicates the tendency for nanoparticles to either agglomerate or remain suspended. Dispersibility, a related parameter, describes the relative number or mass of suspended particles. Both parameters relate to the potential for environmental transport in aqueous suspension as nanoparticles or, conversely, to agglomerate and accumulate in soil or sediment. Very limited data published within the last few years suggest that these parameters may relate to particle size. Zeta potential and dispersibility may be very important to the definition of nanomaterial, as the concepts were initially developed in the characterisation of colloids (which are often defined as particles up to one micron or more in size). The currently-available data for these properties do not suffice to inform the definition of nanomaterial, however.
4.3 Recommendations
One way to view the data presented in this report is to ask how well they characterise the properties of the nanomaterials in most common use. The answer to that question illuminates the practical aspects of developing a definition for nanomaterials. A second way to assess the data is to consider how well the data describe the nanomaterials that they have characterised. Each of these questions is addressed below within the context of developing recommendations for further evaluation.
4.3.1 Adequacy of Data with Respect to Common Nanomaterials
The definition of nanomaterials refers to “natural, incidental or manufactured material”. Few data were identified on the size-related properties of natural or incidental materials.
Information from several authorities on the prevalence of specific nanomaterials in commerce was compared to the data reviewed in this study to determine how well those data represent the characteristics of the most common nanomaterials in commerce.
http://team/clients/rivm/shared documents/a1 - what defines nanomaterials/report/rivm_a1_final report.doc 46
Request A1: What Defines Nanomaterials?
The OECD has focused on the following substances in their Safety Testing of a Representative Set of Manufactured Nanomaterials (OECD, 2010): aluminum dioxide, cerium dioxide, dendrimers19, fullerenes (C60), gold nanoparticles, iron nanoparticles, multi-walled carbon nanotubes (MWCNTs), nano clays, silicon oxide, silver nanoparticles, single walled carbon nanotubes (SWCNTs), titanium dioxide, and zinc oxide.
For additional perspective on the nanomaterials in most common use, one can also consider inventories of consumer products that contain nanomaterials. RIVM has compiled an inventory of nanomaterials in consumer products on the European market in 2010 (Wijnhoven et al., 2011). It includes a total of 858 consumer products with a “nanoclaim”. Further work by RIVM to characterise nanomaterials in consumer products “focused on the presence of nanomaterials of the elements silver, silicon, titanium and/or zinc, as these are the insoluble ‘hard’ nanomaterials that are most likely to be present in consumer products” (Oomen et al., 2011).
The RIVM inventory is based in part on a database of nano-enabled consumer products, compiled by the Project on Emerging Nanomaterials20, which now lists 1,317 items. Figure 2 illustrates the nanomaterials found most often in those products and the relative frequency with which they occur.
Finally, a few nanomaterials are used in high quantities for very specialised uses. For example, nanoparticles of copper carbonate are widely used in wood preservation and may represent the nanomaterial in greatest commercial use, by tonnage, according to one source (Evans, 2009).
19 “Dendrimers are hyper-branched, well-organized polymer molecules made up of three components: core, branches, and end groups. Dendrimer surfaces terminate in several functional groups that can be modified to enhance specific chemical activity” (OECD, 2009b). 20 Data obtained from product inventories maintained by The Project on Emerging Nanotechnologies http://www.nanotechproject.org/inventories/ as of April 14, 2011.
http://team/clients/rivm/shared documents/a1 - what defines nanomaterials/report/rivm_a1_final report.doc 47
Request A1: What Defines Nanomaterials?
Figure 2. Nanomaterials Found Most Frequently in Consumer Products
In summary, these various sources indicate that the following nanomaterials may be in particularly wide use: aluminum dioxide, cerium dioxide, dendrimers, fullerenes (C60), gold nanoparticles, iron nanoparticles, MWCNTs, nano clays, silicon oxide, silver nanoparticles, SWCNTs, titanium dioxide, and zinc oxide; copper carbonate may also be important commercially. Substances in wide use are important with respect to the potential for exposure and the consequent applicability of regulations.
In contrast, and as illustrated in Figure 3, the studies reviewed in this project pertained primarily to gold, titanium dioxide, platinum, silver, and cobalt21. Few or no size-related data were available for aluminum dioxide, cerium dioxide, copper carbonate, dendrimers, fullerenes (C60), iron nanoparticles, MWCNTs, nano clays, silicon oxide, SWCNTs, or zinc oxide. Some of these materials (i.e., dendrimers, fullerenes, carbon nanotubes) are arguably nanomaterials by definition. Therefore data on the size-related properties of such materials may not be as relevant to the definition of nanomaterials.
21 “Other” in Figure 3 includes substances for which only one study was identified: C (diamond), CdSe, CuO, In(OH)3, LiIn(WO4)2, PbS, PbZrO3, Pd3Co, Pr, Pt3Co, Sb, SiO2, SnO2, U3O8, V.
http://team/clients/rivm/shared documents/a1 - what defines nanomaterials/report/rivm_a1_final report.doc 48
Request A1: What Defines Nanomaterials?
Figure 3. Number of Studies Reviewed for Each Substance
In summary, this comparison suggests that few size-related data are available for some of the nanomaterials in widest use. In particular, additional data on copper carbonate, silicon, zinc, organic nanomaterials, and some characteristics of silver and titanium dioxide would be valuable. The OECD programme on Safety Testing of a Representative Set of Manufactured Nanomaterials will provide some relevant data, but is not expressly designed to test materials of various particle sizes and compare those data to the characterisation of bulk materials.
Therefore, one recommendation is to obtain additional data on the size related properties of common nanomaterials in commercial use, and to consider whether additional data should be collected on the size-related properties of natural or incidental nanomaterials.
4.3.2 Adequacy of Data with Respect to Parameters Characterised
The data summarised in this report were also reviewed with respect to their adequacy to describe the nanomaterials tested.
Solubility – both the rate of dissolution and the equilibrium solubility concentration – is fundamental to environmental fate and the risks resulting from exposure.
http://team/clients/rivm/shared documents/a1 - what defines nanomaterials/report/rivm_a1_final report.doc 49
Request A1: What Defines Nanomaterials?
Thermodynamic theory predicts the change in equilibrium solubility with particle size, yet few data are available from laboratory studies. Those studies examined the solubility of metals in the following substances: particulate air pollutants, silver, hematite, lead sulphite, and brushite. The data do not adequately characterise the size-related solubility of nanomaterials, particularly by comparison to the roster of the most common nanomaterials described above.
The size dependence of reactivity has been extensively studied for many catalysts. Few studies were identified, however, pertaining to the size-dependent reactivity of some of the most common nanomaterials, including copper, silver, titanium, and zinc.
Zeta potential and dispersibility characterise the properties which determine whether a particle is transported in aqueous suspension or else agglomerates and accumulates in soil or sediment. These parameters may relate to particle size. Additional data need to be collected to characterise the size dependence of these properties.
The effects of particle size on crystallinity have been widely studied for some substances. Changes in crystallinity can affect the behaviour of a material in the environment. However, the data reviewed in this project do not point to a simple relationship between size-related changes in crystallinity and characteristics such as solubility or reactivity, Therefore, collection of additional data regarding crystallinity is considered of lower priority with respect to the recommendations of this report than the data described above.
http://team/clients/rivm/shared documents/a1 - what defines nanomaterials/report/rivm_a1_final report.doc 50
Request A1: What Defines Nanomaterials?
5 Conclusions
This project constituted a review of the literature to determine which physicochemical properties make a nanomaterial different from a ‘conventional’ material and at what size these properties change to ‘nanospecific’ properties. The European Commission (2011) definition of “nanomaterial” provided the context for the review. That definition is:
A natural, incidental or manufactured material containing particles, in an unbound state or as an aggregate or as an agglomerate and where, for 50% or more of the particles in the number size distribution, one or more external dimensions is in the size range 1 to 100 nm.
In specific cases and where warranted by concerns for the environment, health, safety or competitiveness the number size distribution threshold of 50% may be replaced by a threshold between 1 and 50%.
By derogation from the above, fullerenes, graphene flakes and single wall carbon nanotubes with one or more external dimensions below 1 nm should be considered as nanomaterials.
A review of the parameters which characterise nanomaterials at ambient temperatures and pressures led to a focus on morphology/crystallinity, water solubility, reactivity, and photoreactivity. Other characteristics may also vary with particle size but were judged to be of lesser priority and so are not discussed in this report in detail. Those parameters include, among others, flammability, autoflammability, explosiveness and magnetism.
The scientific literature was reviewed to obtain information on the effect of particle size on morphology/ crystallinity, water solubility, reactivity, and photoreactivity. Few published studies tested materials at size ranges that included particles both above and below the threshold criterion of 100 nm. That lack of information, along with a general lack of experimental focus on the percentage of particles in a test substance within the size range 1 to 100 nm, limited the evaluation described in this report with respect to the EU definition of nanomaterials. Most of the papers described herein pertained to metals and metal oxides rather than carbon-based substances. The emphasis on metals and metal oxides in the published literature may reflect the commercial value of such inorganic substances and the consequent impetus to research their properties. It may also reflect in part the parameters evaluated. For example, carbon-based substances such as carbon nanotubes are valued in part due to their physical strength and conductivity and the search terms used in this study, which were based on the study objectives, did not reflect such properties.
http://team/clients/rivm/shared documents/a1 - what defines nanomaterials/report/rivm_a1_final report.doc 51
Request A1: What Defines Nanomaterials?
The outcome of the literature review for each of the target parameters is summarised below.
Surface morphology may affect the rate of dissolution and equilibrium solubility, as well as the reactivity of a particle. The literature review identified two relevant papers. These papers suggest that in some cases the shape and structure of an inorganic particle may depend upon its size, but the data are too few to draw general conclusions about the size dependence of morphology. Additional information is available regarding the effect of size on crystalline structure, a specific aspect of morphology.
The crystalline phase refers to how molecules are physically arranged in space. Many materials with the same chemical composition can have different lattice structures and consequently exhibit different physicochemical properties. The literature search identified 46 papers that examined size-related effects on crystalline structure, most of which indicated that crystalline structure depended in some way on particle size. The researchers often recognised the interrelationship between calcination temperature, particle size, and crystalline structure. Several aspects of the crystallinity of metals and metal oxides may vary with particle size. With changes in particle size the unit cell can contract or expand, as represented by changes in lattice parameters. Particles of two different sizes can also assume different crystalline phases. In some cases, different experiments with the same material found different results with respect to lattice contraction or expansion. In summary, while many studies have demonstrated size-related effects, no simple conclusions can be drawn to inform the definition of nanomaterial.
Water solubility can depend on particle size, as well as on solution characteristics and the particle coating. Two aspects of water solubility can change with particle size: the rate of dissolution and the equilibrium solubility concentration. The rate of dissolution of soluble materials commonly increases with decreasing particle size. However, based on the 9 papers reviewed in this report, no clear threshold of a size-related effect exists to support a definition of nanomaterial. Further, thermodynamic theory predicts that equilibrium solubility should increase with decreasing particle size, which is supported by some experimental data. Thermodynamic considerations suggest that the solubility varies as an exponential function of the particle size diameter.
Catalytic activity was studied as a measure of nanoparticle reactivity, which also depends on particle size. Decreasing the particle size affects the surface free energy and can change the geometry at the surface of the particle, thereby increasing the catalytic activity of surface atoms. Most of the studies described in this report determined that catalytic activity increased as particle size decreased, with maximum
http://team/clients/rivm/shared documents/a1 - what defines nanomaterials/report/rivm_a1_final report.doc 52
Request A1: What Defines Nanomaterials?
activity often occurring below 15 to 20 nm. Some studies reported the opposite effect, and some noted a size corresponding to peak reactivity (i.e., with lesser catalytic activity of particles above and below that size).
Photoactivity refers to the generation of electron-hole pairs by nanomaterials exposed to light. The thirteen studies summarised herein generally showed that photoreactivity increased with decreasing particle size. In some cases the behaviour of the material changed at a particle size of approximately 5 to 10 nm.
Finally, as discussed in the Recommendations section of this report, the data do not suffice to characterise the size-related behaviour of natural or incidental nanomaterials or of many of the common nanomaterials in commercial use. Additional data on the critical properties of such materials would provide valuable input to the definition of nanomaterials.
http://team/clients/rivm/shared documents/a1 - what defines nanomaterials/report/rivm_a1_final report.doc 53
Request A1: What Defines Nanomaterials?
6 References
Akdogan, E. K., Rawn, C. J., Porter, W. D., Payzant, E. A. and Safari, A. 2005. Size effects in PbTiO3 nanocrystals: Effect of particle size on spontaneous polarization and strains. Journal of Applied Physics, 97: 084305.
Almquist, C. B. and Biswas, P. 2002. Role of synthesis method and particle size of nanostructured TiO2 on its photoactivity. J. Catalys., 212: 145–56.
Ambrus, R., Kocbek, P., Kristl, J., Sibanc, R., Rajkó, R. and Szabó-Révész, P. 2009. Investigation of preparation parameters to improve the dissolution of poorly water-soluble meloxicam. International Journal of Pharmaceutics, 381 (2): 153-9.
Anschutz, A. J. and Penn, R. L. 2004. Size dependent reactivity of iron oxyhydroxide nanoparticles. Interfacial Phenomena: Linking Atomistic and Macroscopic Properties. Abstract. 1:00 PM-5:50 PM, Tuesday, March 30, 2004 Marriott -- Marquis NW, Oral Division of Geochemistry. The 227th ACS National Meeting, Anaheim, CA, March 28-April 1, 2004.
Anschutz, A. J. and Penn, R. L. 2005. Reduction of crystalline iron(III) oxyhydroxides using hydroquinone: Influence of phase and particle size. Geochemical Transactions, 6(3): 60-6.
Auffan, M., Rose, J., Bottero, J.-Y., Lowry, G. V., Jolivet, J.-P. and Wiesner, M. R. 2009. Towards a definition of inorganic nanoparticles from an environmental, health and safety perspective. Nature Nanotechnology, 4: 634-641.
Ayyub, P., Palkar, V. R., Chattopadhyay, S. and Multani, M. 1995. Effect of crystal size reduction on lattice symmetry and cooperative properties. Phys. Rev. B, 51: 6135–8.
Bakhmutsky, K., Wiedera, N. L., Baldassare, T., Smith, M. A. and Gortea, R. J. 2011. A thermodynamic study of the redox properties of supported Co particles. Applied Catalysis A: General, 397(1-2): 266-71.
Barton, L. E., Quicksall, A. N. and Maurice, P. A. 2012. Siderophore-Mediated Dissolution of Hematite (α-Fe2O3): Effects of Nanoparticle Size. Geomicrobiology Journal, 29: 314-22.
Basa, S., Muniyappan, T., Karatgi, P., Prabhu, R. and Pillai, R. 2008. Production and in vitro characterization of solid dosage form incorporating drug nanoparticles. Drug Development and Industrial Pharmacy, 34 (11): 1209-18.
Bezemer, G. L., Bitter, J. H., Kuipers, H. P. C. E., Oosterbeek, H., Holewijn, J. E., Xu, X., Kapteijn, F., van Dillen, A. J. and de Jong, K. P. 2006. Cobalt Particle Size Effects in the Fischer−Tropsch Reaction Studied with Carbon Nanofiber Supported Catalysts. J. Am. Chem. Soc., 128: 3956-64.
http://team/clients/rivm/shared documents/a1 - what defines nanomaterials/report/rivm_a1_final report.doc 54
Request A1: What Defines Nanomaterials?
Borm, P., Klaessig, F. C., Landry, T. D., Moudgil, B., Pauluhn, J., Thomas, K., Trottier, R. and Wood, S. 2006. Research Strategies for Safety Evaluation of Nanomaterials, Part V: Role of Dissolution in Biological Fate and Effects of Nanoscale Particles. Toxicol. Sci., 90(1): 23-32.
Calza, P., Pelizzetti, E., Mogyorósi, K., Kun, R. and Dékány, I. 2007. Size dependent photocatalytic activity of hydrothermally crystallized titania nanoparticles on poorly adsorbing phenol in absence and presence of fluoride ion. Applied Catalysis B: Environmental, 72(3-4): 314-21.
Chaki, N. K., Sharma, J., Mandle, A. B., Mulla, I. S., Pasricha, R. and Vijayamohanan, K. 2004. Size dependent redox behavior of monolayer protected silver nanoparticles (2–7 nm) in aqueous medium. Physical Chemistry Chemical Physics, 6: 1304-9.
Chernyshova, I. V., Ponnurangam, S. and Somasundaran, P. 2010. On the origin of an unusual dependence of (bio)chemical reactivity of ferric hydroxides on nanoparticle size. Physical Chemistry Chemical Physics, 12(42): 14045.
Chernyshova, I. V., Ponnurangam, S. and Somasundaran, P. 2011. Effect of nanosize on catalytic properties of ferric (hydr)oxides in water: Mechanistic insights. Journal of Catalysis, 282(1): 25-34.
Choi, J., Reipa, V., Hitchins, V. M., Goering, P. L. and Malinauskas, R. A. 2011. Physicochemical Characterization and In Vitro Hemolysis Evaluation of Silver Nanoparticles. Toxicological Sciences, 123(1): 133-43.
Cuenya, B. R., Baeck, S. H., Jaramillo, T. F. and McFarland, E. W. 2003. Size- and support-dependent electronic and catalytic properties of Au0/Au3+ nanoparticles synthesized from block copolymer micelles. J. Am. Chem. Soc., 125(42): 12928-34.
Dai, W., Dong, L.C., and Song, Y. 2007. Nanosizing of a drug/carrageenan complex to increase solubility and dissolution rate. International Journal of Pharmaceutics, 342 (1-2): 201-7.
Datta, A., Priyam, A., Bhattacharyya, S. N., Mukherjea, K. K. and Saha, A. 2008. Temperature tunability of size in CdS nanoparticles and size dependent photocatalytic degradation of nitroaromatics. J. Colloid Interface Sci., 322(1): 128-35.
De Villiars, M. M., Aramwit, P. and Kwon, G. S. 2009. Nanotechnology in Drug Delivery. Springer. New York. Pp. 22-23. Available at: http://books.google.com/books?id=avUQuJTXnX0C&printsec=frontcover&dq=Nanotechnology+in+Drug+Delivery&hl=en&sa=X&ei=0iPKT429Ocuu6gHg54D-Dw&ved=0CEEQ6AEwAA#v=onepage&q=Nanotechnology%20in%20Drug%20Delivery&f=false .
http://team/clients/rivm/shared documents/a1 - what defines nanomaterials/report/rivm_a1_final report.doc 55
Request A1: What Defines Nanomaterials?
den Breejen, J. P., Sietsma, J. R. A., Friedrich, H., Bitter, J. H. and de Jong, K. P. 2010. Design of supported cobalt catalysts with maximum activity for the Fischer–Tropsch synthesis. J. Catal., 270: 146-52.
Deng, J.-P., Shih, W.-C. and Mou, C.-Y. 2005. Hydrogenation of Anthracene Catalyzed by Surfactant-Protected Gold Nanoparticles in Aqueous Solution: Size Dependence. Phys. Chem. Phys. Chem., 6: 2021-5.
Devalapally, H., Chakilam, A. and Amiji, M. M. 2007. Role of nanotechnology in pharmaceutical product development. Journal of Pharmaceutical Sciences, 96(10): 2547-65.
Dingreville, R., Qu, J. and Cherkaoui, M. 2005. Surface free energy and its effect on the elastic behavior of nano-sized particles, wires and films. Journal of the Mechanics and Physics of Solids, 53(8): 1827-54.
Doyle, A. M., Shaikhutdinov, S. K. and Freund, H.-J. 2005. Surface-Bonded Precursor Determines Particle Size Effects for Alkene Hydrogenation on Palladium. Angew. Chem., Int. Ed., 44: 629.
Duan, Y. W., Kou, X. L. and Li, J. G. 2005. Size dependence of structure and magnetic properties of La0.7Sr0.3MnO3 nanoparticles. Physica B: Condensed Matter, 355(1–4): 250–4.
Eckhoff, R. K. 2003. Dust explosions in the process industries. 3rd edition, Gulf Professional Publishing, 719 pp. As cited in RIVM, 2009.
Engineered Nanoparticles - Review of Health and Environmental Safety (ENRHES). 2009. Engineered Nanoparticles: Review of Health and Environmental Safety. Edingurgh Napier University, Available online at: http://ihcp.jrc.ec.europa.eu/whats-new/enhres-final-report
Environmental Defense and Dupont. 2007. Nano-Risk Framework. Available at: http://www.edf.org/documents/6496_Nano%20Risk%20Framework.pdf
European Chemicals Agency (ECHA). 2008. Guidance on information requirements and chemical safety assessment. Chapter R.7a: Endpoint specific guidance.
European Commission (EC). 2011. Recommendations of 18 October 2011 on the definition of nanomaterial. Official Journal of the European Union. Available at: http://eur-lex.europa.eu/LexUriServ/LexUriServ.do?uri=OJ:L:2011:275:0038:0040:EN:PDF (accessed 25 January 2012).
http://team/clients/rivm/shared documents/a1 - what defines nanomaterials/report/rivm_a1_final report.doc 56
Request A1: What Defines Nanomaterials?
Evans, G., Kozhevnikov, I. V., Kozhevnikova, E. F., Claridge, J. B., Vaidhyanathan, R., Dickinson, C., Wood, C. D., Cooper, A. I. and Rosseinsky, M. J. 2008. Particle size–activity relationship for CoFe2O4 nanoparticle CO oxidation catalysts. J. Mater. Chem., 18: 5518-23.
Evans, P. 2009. World’s Largest Industrial Application of Nanoparticles. Presented at: 2009 International Conference on Nanotechnology for the Forest Products Industry Edmonton, Alberta, Canada - June 23-26, 2009. Available at: http://www.tappi.org/content/events/09nano/papers/09nan69e.pdf (accessed July 9, 2012).
Fakes, M. G., Vakkalagadda B. J., Qian, F., Desikan, S., Gandhi, R. B., Lai, C., Hsieh, A., Franchini, M. K., Toale, H. and Brown, J. 2009. Enhancement of oral bioavailability of an HIV-attachment inhibitor by nanosizing and amorphous formulation approaches. Int. J. Pharm., 31; 370(1-2): 167-74.
Federal Institute for Occupational Safety and Health (BAUA). 2007. Nanotechnology: Health and environmental risks of nanomaterials – Research strategy. Final Report. December 2007. Available at: http://www.baua.de/en/Topics-from-A-to-Z/Hazardous-Substances/Nanotechnology/pdf/research-strategy.pdf;jsessionid=F5B6387481A6203E7F8C205A895F4D6A.1_cid246?__blob=publicationFile&v=2
Gamarnik, M. Y. 1994. Size-related change of lattice parameters in NiO nanoparticles. J. Aerosol Sci., 25(S1): S411-2.
Gao, L. and Zhang, Q. 2001. Effects of amorphous contents and particle size on the photocatalytic properties of TiO2 nanoparticles. Scr. Mater., 44: 1195.
Gilbert, B., Huang, F., Zhang, H., Waychunas, G. A. and Banfield, J. F. 2004. Nanoparticles: Strained and Stiff. Science, 305: 651-4.
Ghosh, T. B., Dhabal, S. and Datta, A. K. 2003. On crystallite size dependence of phase stability of nanocrystalline TiO2. J. Appl. Phys., 94: 4577.
Grass, M. E., Rioux, R. M. and Somorjai, G. A. 2009. Dependence of Gas-Phase Crotonaldehyde Hydrogenation Selectivity and Activity on the Size of Pt Nanoparticles (1.7–7.1 nm) Supported on SBA-15. Catal. Lett., 128: 1-8.
Grassian, V. H. 2008. When Size Really Matters: Size-Dependent Properties and Surface Chemistry of Metal and Metal Oxide Nanoparticles in Gas and Liquid Phase Environments. J. Phys. Chem. C., 112: 18303. As cited by Suttiponparnit et al. (2008).
http://team/clients/rivm/shared documents/a1 - what defines nanomaterials/report/rivm_a1_final report.doc 57
Request A1: What Defines Nanomaterials?
Hansen, S. F., Baun, A., Tiede, K., Gottshalk, F., van der Meent, D., Peijenburg, W., Fernandes, T. and Riediker, M. 2011. Consensus Report based on the NanoImpactNet workshop: Environmental fate and behaviour of nanoparticles - beyond listing of limitations Bilthoven, October 7th 2009. Accepted by the NanoImpactNet Management Committee on 11 February 2011. Available at: http://www.nanoimpactnet.eu/uploads/file/Reports_Publications/D2.4_Workshop_Report_Bilthoven.pdf
Haruta, H., Tsubota, S., Kobayashi,T., Kageyama, H., Genet, M. J., Delmon, B. and Catal, J. 1993. Low-Temperature Oxidation of CO over Gold Supported on TiO2, α-Fe2O3, and Co3O4. Journal of Catalysis, 144(1): 175-92.
Hermanowicz, K., Maczka, M., Tomaszewski, P. E., Krajczyk, L., Hanuza, J. and Baran, J. 2008. Size dependent structural, vibrational, and luminescence properties of nanocrystalline Liln(WO4)2:Cr3. Journal of Nanoscience and Nanotechnology, 8(7): 3545-54.
Hoshina, H., Kakemoto, H., Tsurumi, T., Wadaa, S. and Yashima, M. 2006. Size and temperature induced phase transition behaviors of barium titanate nanoparticles. J. Appl. Phy., 99, 054311.
Hoyer, P. and Weller, H. 1994. Size-dependent redox potentials of quantized zinc oxide measured with an optically transparent thin layer electrode. Chem. Phys. Lett., 221: 379-84.
Huang, T.-C., Wang, M-T., Sheu, H.-S. and Hsieh, W.-F. 2007. Size-dependent lattice dynamics of barium titanate nanoparticles. Journal of Physics: Condensed Matter, 19(47): 6212.
Ishikawa, K., Nomura, T., Okada, N. and Takada, K. 1996. Size effect on the phase transition in PbTiO3 fine particles. Jpn. J. Appl. Phys. Vol., 35: 5196-8.
Ivanova, O. S. and Zamborini, F. P., 2010. Size-Dependent Electrochemical Oxidation of Silver Nanoparticles. J. Am. Chem. Soc., 132(1): 70-2.
Jang, H. D., Kim, S.-K. and Kim, S.-J. 2001. Effect of particle size and phase composition of titanium dioxide nanoparticles on the photocatalytic properties. J. Nanopart. Res., 3: 141-7.
Jiang, L., Hsu, A., Chu, D. and Chen, R. 2009. Size-Dependent Activity of Palladium Nanoparticles for Oxygen Electroreduction in Alkaline Solutions. J. Electrochem. Soc., 156(5): B643-9.
http://team/clients/rivm/shared documents/a1 - what defines nanomaterials/report/rivm_a1_final report.doc 58
Request A1: What Defines Nanomaterials?
Jinno, J., Kamada, N., Miyake, M., Yamada, K., Mukai, T., Odomi, M., Toguchi, H., Liversidge, G.G., Higaki, K., and Kimura, T. 2006. Effect of particle size reduction on dissolution and oral absorption of a poorly water-soluble drug, cilostazol, in beagle dogs. Journal of Controlled Release, 111(1-2): 56-64.
Jirkovský, J., Hoffmannová, H., Klementová, M. and Krtil, P. 2006. Particle Size Dependence of the Electrocatalytic Activity of Nanocrystalline RuO2 Electrodes. Journal of the Electrochemical Society, 153(6): E111-8.
Joint Research Council (JRC). 2011. REACH Implementation Project Substance Identification of Nanomaterials (RIP oN1) AA N°070307/2009/D1/534733 between DG ENV and JRC. Advisory Report. March. Available at: http://ec.europa.eu/environment/chemicals/nanotech/pdf/report_ripon1.pdf
Kalimuthu, P. and John, S. A. 2008. Size dependent electrocatalytic activity of gold nanoparticles immobilized onto three dimensional sol-gel network. Journal of Electroanalytical Chemistry, 617(2): 164-70.
Karthik, K., Selvan, G. K., Kanagaraj, M., Arumugam, S. and Jaya, N. V. 2011. Particle size effect on the magnetic properties of NiO nanoparticles prepared by a precipitation method. Journal of Alloys and Compounds, 509(1): 181-4.
Kaur, T. and Pal, B. 2012. Size and shape dependent attachments of Au nanostructures to TiO2 for optimum reactivity of Au-TiO2 photocatalysis. Journal of Molecular Catalysis A: Chemical, 355: 39-43.
Kell, A. J., Donkers, R. L. and Workentin, M. S. 2005. Core size effects on the reactivity of organic substrates as monolayers on gold nanoparticles. Langmuir, 21(2): 735-42.
Kesisoglou, F., Panmai, S. and Wu, Y. 2007. Nanosizing-oral formulation development and biopharmaceutical evaluation. Adv. Drug Deliv. Rev., 30; 59(7):631-44.
Kipp, J. E. 2004. The role of solid nanoparticle technology in the parenteral delivery of poorly water-soluble drugs. International Journal of Pharmaceutics, 284(1-2): 109-22.
Kirmse, H., Stegemann, B., Neumann, W., Rademann, K. and Kaiser, B. 2003. Size-dependent phase transition from amorphous to crystalline in antimony clusters on crystalline surfaces. Microscopy and Microanalysis, 9: 338-9.
Klabunde, K. J. and Richards, R. M. [Eds.] 2009. Nanoscale Materials in Chemistry. 2nd Edtition. John Wiley & Sons, Inc. Hoboken, NJ. pp. 592, 634.
Kozlov, A. I., Kozlova, A. P., Asakura, K., Matsui, Y., Kogure, T., Shido, T. and Iwasawa, Y. 2000. Supported gold catalysts prepared from a gold phosphine precursor and as-precipitated metal-hydroxide precursors: Effect of preparation conditions on the catalytic performance. Journal of Catalysis, 196: 56-65.
http://team/clients/rivm/shared documents/a1 - what defines nanomaterials/report/rivm_a1_final report.doc 59
Request A1: What Defines Nanomaterials?
Kumar, D., Varma, S. and Gupta, N. M. 2004. The influence of particle size on H2-reduction, catalytic activity and chemisorption behavior of uranium oxide species dispersed in MCM-41: TPR, methanol-TPD and in situ FTIR studies. Catalysis Today, 93–95: 541–51.
Lamber, R., Wetjen, S. and Jaeger, N. I. 1995. Size dependence of the lattice parameter of small palladium particles. Phys. Rev. B, 51, 10968–71.
Li, G., Goates, J. B., Woodfield, B. F. and Li, L. 2004a. Evidence of linear lattice expansion and covalency enhancement in rutile TiO2 nanocrystals. Appl. Phys. Lett., 85: 2059-61.
Li, W., Ni, C., Lin, H., Huang, C. P. and Shah, S. I. 2004b. Size dependence of thermal stability of TiO2 nanoparticles. J. Appl. Phys., 96: 6663-9.
Liu, J., Arguette, D. M., Murayama, M. and Hochella, M. F., Jr. 2009a. Influence of size and aggregation on the reactivity of an environmentally and industrially relevant manomaterial (PbS). Environ. Sci. Technol., 43(21): 8178−83.
Luo, W., Hu, W. and Xiao, S. 2008. Size Effect on the Thermodynamic Properties of Silver Nanoparticles. J. Phys. Chem. C, 112: 2359-69.
Ma, R., Levard, C., Marinakos, S. M., Cheng, Y., Liu, J., Michel, F. M., Brown, G. E. and Lowry, G. V. 2012. Size-controlled dissolution of organic-coated silver nanoparticles. Environ. Sci. Technol., 46(2): 752-9.
Mahendra, S., Zhu, H., Colvin, V. L. and Alvarez, P. J. 2008. Quantum Dot Weathering Results in Microbial Toxicity. Environ. Sci. Technol., 42: 9424-30.
Maira, A. J., Yeung, K. L., Lee, C. Y., Yue, P. L. and Chan, C. K. 2000. Size effects in gas-phase photo-oxidation of trichloroethylene using nanometer-sized TiO2 catalysts. J. Catalysis.,192: 185-96.
Mayo, M. J., Suresh, A. and Porter, W. D. 2003. Thermodynamics for nanosytems: Grain and particle size-dependent phase diagrams. Rev. Adv. Mater. Sci., 5: 100-9.
Mayrhofer, K. J. J., Blizanac, B. B., Arenz, M., Stamenkovic, V. R., Ross, P. N. and Markovic, N. M. 2005. The Impact of Geometric and Surface Electronic Properties of Pt-Catalysts on the Particle Size Effect in Electrocatalysis. J. Phys. Chem. B, 109: 14433-40.
Merisko-Liversidge E. M. and Liversidge G. G. 2008. Drug nanoparticles: formulating poorly water-soluble compounds. Toxicologic Pathology, 36 (1): 43-8.
Meulenkamp, E. A. 1998. Size Dependence of the Dissolution of ZnO Nanoparticles. J. Phys. Chem. B, 102(40): 7764–9.
http://team/clients/rivm/shared documents/a1 - what defines nanomaterials/report/rivm_a1_final report.doc 60
Request A1: What Defines Nanomaterials?
Miller, J. T., Kropf, A. J., Zha, Y., Regalbuto, Z. R., Delannoy, L., Louis, C., Bus, E. and van Bokhoven, J. A. 2006. The effect of gold particle size on Au–Au bond length and reactivity toward oxygen in supported catalysts. J. Catalysis, 240: 222–34.
Morris, V. N., Farrell, R. A., Sexton, A. M. and Morris, M. A. 2006. Lattice Constant Dependence on Particle Size for Ceria prepared from a Citrate Sol-Gel. Journal of Physics: Conference Series, 26(1): 119-22.
Muller R.H. and Peters K. 1998. Nanosuspensions for the formulation of poorly soluble drugs - I. Preparation by a size-reduction technique. International Journal of Pharmaceutics, 160 (2): 229-37.
National Industrial Chemicals Notification and Assessment Scheme (NICNAS). 2010. Adjustments to NICNAS new chemicals processed for industrial nanomaterials. Australian Government Gazette, No.: C 10, 5 October 2010. Available at: http://www.nicnas.gov.au/Publications/Chemical_Gazette/pdf/2010oct_whole.pdf#page=14.
National Institute for Occupational Safety and Health (NIOSH). 2009. Approaches to Safe Nanotechnology: Managing the Health and Safety Concerns Associated with Engineered Nanomaterials. U.S. Department of Health and Human Services, Centers for Disease Control and Prevention. Available at: http://www.cdc.gov/niosh/docs/2009-125/pdfs/2009-125.pdf.
Navrotsky, A., Ma, C., Lilova, K. and Birkner, N. 2010. Nanophase Transition Metal Oxides Show Large Thermodynamically Driven Shifts in Oxidation-Reduction Equilibria. Science, 330: 199-201.
Nesselberger, M., Ashton, S., Meier, J. C., Katsounaros, I., Mayrhofer, K. J. and Arenz, M. 2011. The particle size effect on the oxygen reduction reaction activity of Pt catalysts: influence of electrolyte and relation to single crystal models. J. Am. Chem. Soc., 133(43): 17428-33.
Niu, J., Rasmussen, P., Hassan, N. and Vincent, R. 2010. Concentration distribution and bioaccessibility of trace elements in nano and fine urban airborne particulate matter: Influence of particle size. Water, Air, and Soil Pollution, 213(1-4): 211-25.
Nolte, P., Stierle, A., Kasper, N., Jin-Phillipp, N. Y., Reichert, H., Rühm, A., Okasinski, J., Dosch, H. and Schöder, S. 2008. Combinatorial high-energy x-ray microbeam study of the size-dependent oxidation of Pd nanoparticles on MgO(100). Physical Review B, 77(11): 5444-51.
http://team/clients/rivm/shared documents/a1 - what defines nanomaterials/report/rivm_a1_final report.doc 61
Request A1: What Defines Nanomaterials?
Nowakowski, P., Dallas, J.-P., Villain, S., Kopia, A. and Gavarri, J.-R. 2008. Structure, microstructure, and size dependent catalytic properties of nanostructured ruthenium dioxide. Journal of Solid State Chemistry, 181(5): 1005–16.
Oezaslan, M., Heggen, M. and Strasser, P. 2012. Size-dependent morphology of dealloyed bimetallic catalysts: linking the nano to the macro scale. J. Am. Chem. Soc., 134(1): 514-24.
Oomen, A. G., Bennink, M., van Engelen, J. G. M., Sips, A. J. A. M. 2011. Nanomaterial in consumer products: Detection, characterisation and interpretation. National Institute for Public Health and the Environment. RIVM Report 320029001/2011. Available at: http://www.rivm.nl/bibliotheek/rapporten/320029001.pdf (accessed July 2012).
Organisation for Economic Co-operation and Development (OECD). 2010. List of manufactured nanomaterials and list of endpoints for phase one of the OECD Testing Programme. ENV/JM/MONO(2008). Available at: http://www.oecd.org/officialdocuments/displaydocumentpdf/?cote=env/jm/mono(2010)46&doclanguage=en.
Organisation for Economic Co-operation and Development (OECD). 2009a. Guidance Manual for the Testing of Manufactured Nanomaterials, available at http://www.oecd.org/officialdocuments/displaydocumentpdf/?cote=env/jm/mono(2009)mr20/rev&doclanguage=en.
Organisation for Economic Co-operation and Development (OECD). 2009b. OECD Conference on Potential Environmental Bene ts of Nanotechnology: Fostering Safe Innovation-Led Growth. 15-17 July 2009, OECD Conference Centre, Paris – France. Abstracts and Session Materials. Available at: http://www.oecd.org/dataoecd/4/45/43289415.pdf (accessed July 2012).
Pal, B., Torimoto, T., Iwasaki, K., Shibayama, T., Takahashi, H. and Ohtani, B. 2004. Size and Structure-Dependent Photocatalytic Activity of Jingle-Bell-Shaped Silica-Coated Cadmium Sulfide Nanoparticles for Methanol Dehydrogenation. J. Phys. Chem. B, 108(48): 18670-4.
Palkar, V. R., Ayyub, P., Chattopadhyay, S. and Multani, M. 1996. Size-induced structural transitions in the Cu-O and Ce-O systems. Phy. Rev. B, 53(5): 2167-70.
Park, T.-J., Papaefthymiou, G. C., Viescas, A. J., Moodenbaugh, A. R. and Stanislaus, S. W. 2007. Size-Dependent Magnetic Properties of Single-Crystalline Multiferroic BiFeO3 Nanoparticles. Nano Lett., 7(3): 766-72.
http://team/clients/rivm/shared documents/a1 - what defines nanomaterials/report/rivm_a1_final report.doc 62
Request A1: What Defines Nanomaterials?
Parker, S. C. and Campbell, C. T. 2007. Reactivity and sintering kinetics of Au/TiO2(110) model catalysts: particle size effects. Topics in Catalysis, 44(1-2): 3-13.
Perez, J., Gonzalez, E. R. and Ticianelli, E. A. 1998. Oxygen electrocatalysis on thin porous coating rotating platinum electrodes. Electrochim. Acta., 44(8-9): 1329-39.
Prieto, G., Martinez, A., Concepcion, P. and Moreno-Tost, R. 2009. Cobalt particle size effects in Fischer–Tropsch synthesis: structural and in situ spectroscopic characterisation on reverse micelle-synthesised Co/ITQ-2 model catalysts. J. Catal., 266: 129-44.
Pronk, M. E. J., Wijnhoven, S. W. P., Bleeker, E. A. J., Heugens, E. H. W., Peijenburg, W. J. G. M., Luttik, R. and Hakkert, B. C. 2009. Nanomaterials under REACH - Nanosilver as a case study. RIVM report 601780003/2009. Available at: http://www.rivm.nl/bibliotheek/rapporten/601780003.pdf.
Puzyn, T., Rasulev, B., Gajewicz, A., Hu, X., Dasari, T. P., Michalkova, A., Hwang, H. M., Toropov, A., Leszczynska, D. and Leszczynski J. 2011. Using nano-QSAR to predict the cytotoxicity of metal oxide nanoparticles. Nature Nanotechnology, 6: 175-8.
Rockenberger, J. Tröger, L., Kornowski, A., Voßmeyer, T., Eychmüller, A., Feldhaus, J. and Weller, H. 2010. Size dependence of structural and dynamic properties of CdS-nanoparticles. Berichte der Bunsengesellschaft für physikalische Chemie, 101(11): 1613-6.
Sarkar, T., Barnali, G. and Raychaudhuri, A. K. 2007. Effect of Size Reduction on Charge Ordering in La0.5Ca0.5MnO3. Journal of Nanoscience and Nanotechnology, 7(6): 2020-4.
Sau, T. K., Pal, A. and Pal, T. 2001. Size regime dependent catalysis by gold nanoparticles for the reduction of eosin. J. Phys. Chem. B, 105: 9266-72.
Schalow, T., Brandt, B., Starr, D. E., Laurin, M., Shaikhutdinov, S. K., Schauermann, S., Libuda, J. and Freund, H. J. 2007. Particle size dependent adsorption and reaction kinetics on reduced and partially oxidized Pd nanoparticles. Phys. Chem. Chem. Phys., 9(11): 1347-61.
Schmidt, J. and Vogelsberger, W. 2006. Dissolution kinetics of titanium dioxide nanoparticles: The observation of an unusual kinetic size effect. Journal of Physical Chemistry B, 110(9): 3955-63.
Schwartz, V., Mullins, D. R., Yan, W., Chen, B., Dai, S. and Overbury, S. H. 2004. XAS Study of Au Supported on TiO2: Influence of Oxidation State and Particle Size on Catalytic Activity. J. Phys. Chem. B, 108: 15782-90.
http://team/clients/rivm/shared documents/a1 - what defines nanomaterials/report/rivm_a1_final report.doc 63
Request A1: What Defines Nanomaterials?
Scientific Committee on Emerging and Newly Identified Health Risks (SCENIHR). 2007. Opinion on the appropriateness of the risk assessment methodology in accordance with the technical guidance documents for new and existing substances for assessing the risks of nanomaterials. Available at: http://ec.europa.eu/health/ph_risk/committees/04_scenihr/docs/scenihr_o_010.pdf.
Scientific Committee on Emerging and Newly Identified Health Risks (SCENIHR). 2009. Risk assessment of products of nanotechnologies. Available at: http://ec.europa.eu/health/ph_risk/committees/04_scenihr/docs/scenihr_o_023.pdf.
Scientific Committee on Emerging and Newly Identified Health Risks (SCENIHR). 2010. Scientific basis for the definition of the term “nanomaterial.” Available at: http://ec.europa.eu/health/scientific_committees/emerging/docs/scenihr_o_032.pdf.
Seipenbusch, M., Weber, A. P and Kasper, G., 2000. Aerosol catalysis on nickel-nanoparticles: Dependence of catalytic activity on particle size. Journal of Aerosol Science, 31(S1): S634-5.
Selbach, S. M., Tybell, T., Einarsrud, M. A. and Grande, T. 2007. Size-dependent properties of multiferroic BiFeO3 nanoparticles. Chem. Mater., 19: 6478-84.
Sellers, K., et al., 2009. Nanotechnology and the Environment. Taylor & Francis/ CRC Press.
Sharma, A., Kumar, S., Kumar, R., Varshney, M. and Verma, K. D. 2009. Size dependent structural, optical and magnetic properties of un-doped SnO2 nanoparticles. Optoelectronics and Advanced Materials Rapid Communications, 3(12): 1285-9.
Sharma, R. K., Sharma, P. and Maitra, A. 2003. Size-dependent catalytic behavior of platinum nanoparticles on the hexacyanoferrate- (III)/thiosulfate redox reaction. J. Colloid Interface Sci., 265: 134-40.
Shetty, S., Palkar, V.R. and Pinto, R., 2002. Size effect study in magnetoelectric BiFeO3 system. Pramana – J. Phys., Vol. 58, Nos 5 & 6, May & June. Available at: http://www.ias.ac.in/pramana/mayjune2002/as46.pdf.
Shikov, A. N., Pozharitskaya, O. N., Miroshnyk, I., Mirza, S., Urakova, I. N., Hirsjärvi, S., Makarov, V. G., Heinämäki, J., Yliruusi, J. and Hiltunen, R. 2009. Nanodispersions of taxifolin: impact of solid-state properties on dissolution behavior. Int. J. Pharm., 377(1-2):148-52.
Sigfridsson, K., Lundqvist, A. J., Strimfors, M. 2009. Particle size reduction for improvement of oral absorption of the poorly soluble drug UG558 in rats during early development. Drug Development and Industrial Pharmacy, 35 (12): 1479-86.
http://team/clients/rivm/shared documents/a1 - what defines nanomaterials/report/rivm_a1_final report.doc 64
Request A1: What Defines Nanomaterials?
Singh, V. N. and Mehta, B. R. 2005. Nanoparticle size-dependent lowering of temperature for phase transition from In(OH)3 to In2O3. J. Nanosci. Nanotechnol., 5(3): 431-5.
Spanier, J. E., Robinson, R. D., Zhang, F., Chan, S.-W. and Herman, I. P. 2001. Size-dependent properties of CeO2 nanoparticles as studied by Raman scattering. Physical Review B, 64, 245407: 1-8.
Srivastava, C., Chithra, S., Malviya, K. D., Sinha, S. K. and Chattopadhyay, K. 2011. Size dependent microstructure for Ag–Ni nanoparticles. Acta. Materialia, 59(16): 6501–9.
Srinivasan, S. [Ed.] 2006. Fuel Cells: Fundamentals to Applications. Springer Science, pp. 691.
Strongin, D. R., Hosein, H. A., Debnath, S. and Liu, G. 2005. Size-reactivity relationship of iron and cobalt oxyhydroxide nanoparticles assembled within ferritin protein. Nanotechnology and the Environment. Abstract. 8:30 AM-11:10 AM, Monday, 14 March 2005 Hyatt Regency -- Del Mar B, Oral. Division of Industrial and Engineering Chemistry. The 229th ACS National Meeting, in San Diego, CA, March 13-17, 2005.
Sun, J., Pantoya, M. L. and Simon, S. L. 2006. Dependence of size and size distribution on reactivity of aluminium nanoparticles in reactions with oxygen and MoO3. Thermochimica Acta., 444(2): 117–27.
Suttiponparnit, K., Jiang, J., Sahu, M., Suvachittanont, S., Charinpanitkul, T. and Biswas, P. 2011. Role of Surface Area, Primary Particle Size, and Crystal Phase on Titanium Dioxide Nanoparticle Dispersion Properties. Nanoscale Res. Lett., 6(1): 27.
Switzerland Federal Office of Public Health (FOPH)/ Federal Office for the Environment (FOEN). 2011. Precautionary Matrix for Synthetic Nanomaterials, 14 July 2011, Version 2.1. Available at: http://www.bag.admin.ch/themen/chemikalien/00228/00510/05626/index.html?lang=en
Takano, R., Furumoto, K., Shiraki, K., Takata, N., Hayashi, Y., Aso, Y. and Yamashita, S. 2008. Rate-limiting steps of oral absorption for poorly water-soluble drugs in dogs; prediction from a miniscale dissolution test and a physiologically-based computer simulation. Pharmaceutical Research, 25 (10): 2334-44.
Tanaka, Y., Inkyo, M., Yumoto, R., Nagai, J., Takano, M. and Nagata, S. 2009. Nanoparticulation of poorly water soluble drugs using a wet-mill process and physicochemical properties of the nanopowders. Chemical and Pharmaceutical Bulletin, 57(10): 1050-7.
http://team/clients/rivm/shared documents/a1 - what defines nanomaterials/report/rivm_a1_final report.doc 65
Request A1: What Defines Nanomaterials?
Tsunekawa, S., Ishikawa, K., Li, Z. Q., Kawazoe, Y. and Kasuya, A. 2000. Origin of Anomalous Lattice Expansion in Oxide Nanoparticles. Physical Review. Lett., 85: 3440-3.
Tsunekawa, S., Ito, S. and Kawazoe, Y. 2004. Surface structures of cerium oxide nanocrystalline particles from the size dependence of the lattice parameters. Appl. Phys. Lett., 85(17): 3845-8.
Tsung, C.-K., Kuhn, J. N., Huang, W., Aliaga, C., Hung, H., Somorjai, G. A. and Yang, P. 2009. Sub-10 nm Platinum Nanocrystals with Size and Shape Control: Catalytic Study for Ethylene and Pyrrole Hydrogenation. J. Am. Chem. Soc., 131: 5816-22.
Uchino, K., Sadanaga, E. and Hirose, T. J. 1989. Dependence of the crystal structure on particle size in barium titanate. Am. Ceram. Soc., 72: 1555-8.
U.S. Environmental Protection Agency (U.S. EPA). 2007a. Nanoscale Materials Stewardship Program Data Form, available at http://www.regulations.gov/#!documentDetail;D=EPA-HQ-OPPT-2007-0572-0003.
U.S. Environmental Protection Agency (U.S. EPA). 2007b. Nanotechnology White Paper. EPA/100/B-07/001. Prepared for the U.S. Environmental Protection Agency, by members of the Nanotechnology Workgroup, a group of EPA’s Science Policy Council: 5, 22-27. Available at: http://www.epa.gov/osa/nanotech.htm.
U.S. Environmental Protection Agency (U.S. EPA). 2011. Release, fate and transport of engineered nanosilver from consumer products. Final Report. Prepared for: U.S. EPA Air Pollution Prevention and Control Division. Research Triangle Park, NC 27711.
U.S. Food and Drug Administration (FDA). 2010. Manual of policies and procedures - Reporting Format for Nanotechnology-Related Information in CMC Review. Center for Drug Evaluation and Research – Office of Pharmaceutical Science. MAPP 5015.9 Available at: http://www.fda.gov/downloads/AboutFDA/CentersOffices/CDER/ManualofPoliciesProcedures/UCM214304.pdf.
Valden, M., Lai, X. and Goodman, D. W. 1998. Onset of Catalytic Activity of Gold Clusters on Titania with the Appearance of Nonmetallic Properties. Science, 281(5383): 1647-50.
Vikesland, P. J., Heathcock, A. M., Rebodos, R. L. and Makus, K. E. 2007. Particle Size and Aggregation Effects on Magnetite Reactivity toward Carbon Tetrachloride. Environ. Sci. Technol., 41: 5277-83.
http://team/clients/rivm/shared documents/a1 - what defines nanomaterials/report/rivm_a1_final report.doc 66
Request A1: What Defines Nanomaterials?
Vogta, M., Kunath, K., and Dressman, J. B. 2007. Dissolution enhancement of fenofibrate by micronization, cogrinding and spray-drying: Comparison with commercial preparations. European Journal of Pharmaceutics and Biopharmaceutics, 68(2): 283-8.
Wang, C.-C., Zhang, Z. and Ying, J. Y. 1997. Phtocatalytic decomposition of halogenated organics over nanocrystalline titania. Nanostr. Mater., 9: 583-6.
Wang, C., van der Vliet, D., Chang, K.-C., You, H., Strmcnik, D., Schlueter, J. A., Markovic, N. M. and Stamenkovic, V. R. 2009. Monodisperse Pt3Co nanoparticles as a catalyst for the oxygen reduction reaction: size-dependent activity. J. Phys. Chem. Lett., 113: 19365-8.
Wang, C., Wang, G., van der Vliet, D., Chang, K-C., Markovic, N. M. and Stamenkovic, V. R. 2010. Monodisperse Pt3Co nanoparticles as electrocatalyst: the effects of particle size and pretreatment on electrocatalytic reduction of oxygen. Phys. Chem. Chem. Phys., 12: 6933-9.
Wang, N., Tachikawa, T. and Majima, T. 2011. Single-molecule, single-particle observation of size-dependent photocatalytic activity in Au/TiO2 nanocomposites. Chem. Sci., 2: 891-900.
Wei, T., Liu, H. M., Zhu, C., Guo, Y. J., Liu, J.-M., Wu, Y. J. and Chen, X. M. 2010. Size-dependent structural preferences and magnetization enhancement in 0.5Bi0.8La0.2FeO3-0.5PbTiO3. J. Appl. Phys., 108(12): 4108-13.
Williams, O. A., Hees, J., Dieker, C., Jager, W., Kirste, L. and Nebel, C. E. 2010. Size-Dependent Reactivity of Diamond Nanoparticles. ACS Nano, 4(8): 4824-30.
Wilson, O. M., Knecht, M. R., Garcia-Martinez, J. C. and Crooks, R. M. 2006. Effect of Pd Nanoparticle Size on the Catalytic Hydrogenation of Allyl Alcohol. J. Am. Chem. Soc., 128: 4510.
Wijnhoven, S. W. P., Dekkers, S., Kooi, M., Jongeneel, W. P. and de Jong, W.H., 2011. Nanomaterials in consumer products Update of products on the European market in 2010. RIVM Report 340370003/2010. National Institute for Public Health and the Environment. Available at: http://www.rivm.nl/bibliotheek/rapporten/340370003.pdf (accessed July 2012).
Wong, S. W. Y., Leung, P. T. Y., Djurišić, A. B. and Leung, K. M. Y. 2010. Toxicities of nano zinc oxide to five marine organisms: influences of aggregate size and ion solubility. Analytical and Bioanalytical Chemistry, 396(2): 609-18.
http://team/clients/rivm/shared documents/a1 - what defines nanomaterials/report/rivm_a1_final report.doc 67
Request A1: What Defines Nanomaterials?
World Technology Evaluation Center (WTEC). 2010. Nanotechnology Research Directions for Societal Needs in 2020. Retrospective and Outlook. September 30, 2010. Available at: http://wtec.org/nano2/Nanotechnology_Research_Directions_to_2020/Nano_Resarch_Directions_to_2020.pdf.
Xu, H. and Barnard, A. S. 2008. Nano-minerals: Size-dependent crystal structure, shape and chemical reactivity changes. Abstract. Geochimica et. Cosmochimica Acta., 72(12): A1045.
Yamamoto, T., Urabe, K. and Banno, H. 1993. BaTiO3 particle-size dependence of ferroelectricity in BaTiO3/polymer composites. Jpn. J. Phys., 32: 4272-6.
Yan, T., Shen, Z. G., Zhang, W. W. and Chen, J. F. 2006. Size dependence on the ferroelectric transition of nano-sized BaTiO3 particles. Mater. Chem. Phys., 98: 450-5.
Yano, H., Inukai, J., Uchida, H., Watanabe, M., Babu, P. K., Kobayashi, T., Chung, J. H., Oldfield, E. and Wieckowski, A. 2006. Particle-size effect of nanoscale platinum catalysts in oxygen reduction reaction: an electrochemical and 195Pt EC-NMR study. Phys. Chem. Chem. Phys., 8(42): 4932-9.
Ye, H., Crooks, J. A. and Crooks, R. M. 2007. Effect of Particle Size on the Kinetics of the Electrocatalytic Oxygen Reduction Reaction Catalyzed by Pt Dendrimer-Encapsulated Nanoparticles. Langmuir, 23: 11901.
Yogi, C., Kojima, K., Hashishin, T., Wada, N., Inada, Y., Gaspera, E. D., Bersani, M., Martucci, A., Liu, L. and Sham, T. K. 2011. Size Effect of Au Nanoparticles on TiO2 Crystalline Phase of Nanocomposite Thin Films and Their Photocatalytic Properties, J. Phys. Chem. C, 115: 6554-60.
Zachariah, M. R., Park, K. and Lee, D. 2004. Size-dependent reactivity of aluminium nanoparticles measured by single-particle mass-spectrometry. Nanoscience and Nanotechnology. Abstract. 8:30 AM-11:45 AM, Wednesday, March 31, 2004 Marriott -- Orange County 5, Oral. Division of Colloid and Surface Chemistry. The 227th ACS National Meeting, Anaheim, CA, March 28-April 1, 2004.
Zaki, M. I., Mekhemer, G. A. H., Fouad, N. E., Jagadale, T. C. and Ogale, S. B. 2010. Surface texture and specific adsorption sites of sol–gel synthesized anatase TiO2 nanoparticles. Mater. Res. Bull., 45: 1470-5.
Zanella, R., Giorgio, S., Shin, C. -H., Henry, C. R. and Louis, C. 2004. Characterization and reactivity in CO oxidation of gold nanoparticles supported on TiO2 prepared by deposition-precipitation with NaOH and urea. Journal of Catalysis, 222(2): 357-67.
http://team/clients/rivm/shared documents/a1 - what defines nanomaterials/report/rivm_a1_final report.doc 68
Request A1: What Defines Nanomaterials?
Zhang. Z., Wang, C.-C., Zakaria, R. and Ying, J. Y. 1998. Role of Particle Size in Nanocrystalline TiO2-Based Photocatalysts. J. Phys. Chem. B, 102: 10871-8.
Zhang, F., Chan, S.-W., Spanier, J. E., Apak, E., Jin, Q., Robinson, Herman, I. P. 2002. Cerium oxide nanoparticles: Size-selective formation and structure analysis. Appl. Phys. Lett., 80: 127-9.
Zhang, H. and Banfield, J. F. 2000. Understanding Polymorphic Phase Transformation Behavior during Growth of Nanocrystalline Aggregates: Insights from TiO2. J. Phys. Chem. B, 104: 3481-7.
Zhang, H. and Banfield, J. F. 2005. Size Dependence of the Kinetic Rate Constant for Phase Transformation in TiO2 Nanoparticles. Chem. Mater., 17(13): 3421-5.
Zhang, H., Chen, B. and Banfield, J. F. 2009. The size dependence of the surface free energy of titania nanocrystals. Phys. Chem. Chem. Phys., 11(14): 2553-8.
Zhang, Y. L., Jin, X. J., Rong, Y. H., Hsu, T. Y., Jiang, D. Y. and Shi, J. L. 2006. The size dependence of structural stability in nano-sized ZrO2 particles. Materials Science and Engineering: A, 438-440(25): 399-402.
Zhang, H., Chen, B. and Banfield, J. F. 2010. Particle Size and pH Effects on Nanoparticle Dissolution. J. Phys. Chem. C, 114(35): 14876-84.
Zhou, X., Xu, W., Liu, G., Panda, D. and Chen, P. 2010. Size-Dependent Catalytic Activity and Dynamics of Gold Nanoparticles at the Single-Molecule Level. J. Am. Chem. Soc., 132: 138-46.
Appendix A
Literature Search
A-1
Appendix A
Literature Search
1 Developing the Database Searches
An index search string was developed to query the Dialog® databases, which consists of 58 individual databases. The index search consisted of three major concepts, each designed to search titles and subject headings. Duplicate references and patents were removed.
· Concept 1 - was designed to capture titles/subject headings that studied nanoparticles. This concept included the following search terms (“?” indicates that the search term will include all words containing additional characters following the “?” symbol):
– NANO or NANOPARTICLE? or NANOMATERIAL?
AND
· Concept 2 - was designed to capture titles that investigated the size of nanoparticles and a threshold
– (DIAMETER OR SIZE) AND (RELATED or DEPENDENT or DEPENDENCE or DRIVEN or REDUCTION or THRESHOLD or RELATIONSHIP)
AND
· Concept 3 – was designed to capture title/subject headings that investigated one of the priority physicochemical properties (“()” indicates that two adjacent terms are next to each other in that order [i.e., a space or a punctuation mark such as a hyphen can be found between the search terms])
– (WATER()SOLUBILITY) or DISSOLUTION or
– (CRYSTALLINE()STRUCTURE) or (CRYSTAL()STRUCTURE) or
– MORPHOLOGY or
– REACTIVITY or REDOX or (REACTIVE()OXYGEN()SPECIES) or
– (PHOTOCATALYTIC()ACTIVITY) or (PHOTO()ACTIVATION) or
– FLAMMABILITY or
– (AUTO()IGNITION) or (SELF()IGNITION) or
– EXPLOSIVENESS or EXPLOSIVITY or EXPLODE or COMBUSTION or
– OXIDIZING or OXIDISING or OXIDIZER or OXIDISER or OXIDANT or
– MAGNETISM or MAGNETIC or
– DISPERSABILITY or (DIS()AGGREGAT?) or DISAGGREGATION or
– APPEARANCE or COLOR or COLOUR or
– (MELTING()POINT) or (FREEZING()POINT) or
– (BOILING()POINT) or
– (PARTICLE()SIZE) or GRANULOMETRY or
– (PARTITION()COEFFICIENT) or KOW or (OCTANOL()WATER) or POW or
– (SOLUBILITY(2W)(ORGANIC()SOLVENTS)) or
– (FAT()SOLUBILITY) or
– (RELATIVE()SURFACE()AREA) or
A-2
– DUSTINESS
The first index search was performed on 9 February 2012. Twenty-nine of the databases contained at least one reference that matched the search criteria. Focused queries of these databases and elimination of duplicate references identified 611 potential references.
The applicability of each reference (i.e., studying size-dependent effects of a low/medium/high priority property) was determined by examining each reference’s title, and, in many cases, the abstract. Many publications were ruled out because they pertained to synthesis methods, characterization methods, or to the antimicrobial properties of nanoparticles such as nanosilver. Therefore, it was necessary to refine the literature search to exclude such references.
2 Refining the Database Search
In the second Dialog® search, performed on 27 February 2012, a fourth concept was added to the original literature search to remove references whose titles contained any of the following terms:
· Concept 4
– SYNTHESIS or SYNTHESES or CHARACTERIZATION or CHARACTERISATION or PREPARATION or COMPOSITIONS or FABRICATION or FORMATION or ANTIBACTERIAL or ANTIMICROBIAL
This search produced 724 references.
The second Dialog® search failed to identify any relevant papers investigating carbonaceous nanomaterials such as fullerenes, carbon nanotubes or carbon black. Therefore, on 19 June 2012 a supplemental Dialog® search was performed by modifying the search terms in the first concept and keeping concepts 1-3 identical to the second Dialog® search.
· Concept 1
– FULLERENE? or NANOTUBE? or CARBON()BLACK
This search produced 83 potentially-relevant references. Based on the titles and abstracts of the papers, 5 papers were obtained for possible inclusion into the database. Upon review, none were judged relevant and included.
3 List of Databases Queried in the Dialog® Search
The Dialog® searches inspected the following databases:
The papers were sorted into one of three categories:
• Relevant for this project – Based on title, the reference was obtained.
• Possibly relevant for this project – Based on title, it was unclear if the reference was relevant for the project and required discussion among the
ARCADIS project team. Abstracts were obtained for each reference to assist in this determination. Papers ultimately determined to be relevant were obtained while papers determined not to be relevant were moved to the third category.
• Not relevant for this project – Based on title, the reference was determined not to be in-scope for this project. No further action was taken for
these references.
References either initially or ultimately determined to be relevant for this project were entered into the literature database.
5 Project Literature Database
An Excel database was created to summarize the information from each paper deemed critical and to highlight any size-dependent relationships. Table 1 summarizes the number of papers entered into the database for each property.
A-5
Table 1 Summary of Papers Entered into Database Per Property
Property: Priority Total Number of Papers Identified
Number of Papers Determined to be Relevant
Boiling point Low 0 --
Dispersability Low 0 --
Dustiness Low 1 Low priority papers were not
reviewed
Melting / freezing point Low 12 Low priority papers were not
reviewed
Partition coefficient Low 1 Low priority papers were not
reviewed
Solubility in organic solvents Low 1 Low priority papers were not
reviewed
Auto-flammability: Medium 0 --
Explosiveness Medium 10 Medium priority papers were
not reviewed
Flammability Medium 0 --
Magnetism Medium 48 Medium priority papers were
not reviewed
Crystalline structure (structure) High 47 46
Photocatalytic activity High 13 13
Reactivity High 64 52
Surface morphology High 3 2
Water solubility High 9 9
TOTAL: 209 122
Appendix B
Copy of Database
Appendix B: Copy of Database
Physico‐chemical Property Investigated:
Crystalline structure (structure)
Priority of Property: High
Relevant for A1 Project?: Yes
Type of nanomaterial (eg, nanometal, nanometal oxide):
Nanometal alloy oxide
Particle Functionalization or Capping Agent (if applicable):
None
List Study Objective(s) Relevant to Investigated Physicochemical Property:
• To determine the spontaneous polarization in mechanically unclamped and surface charge compensated PbTiO3 nanocrystals as a function of particle size in the range <150 nm by differential scanning calorimetry (DSC).
Akdogan et al. (2005)
Specific Details on Tested Nanomaterial(s)
• Lead titanate (PbTiO(3))
Details on Preparation Method of Nanomaterial(s):
• The resins obtained by the Pechini process were first thermally decomposed <= 250 deg C), and then the decomposition product was heat treated in the range 773–1373 K for 30 min under controlled PbO atmospheres.
Details on Tests Examining Physicochemical Property:
• The variation in the cubic to tetragonal transition temperature and the transition enthalpy with particle/ crystal size was measured by DSC.• La ce parameters at 25 deg C were determined from data collected on a x-ray
powder diffractometer with Cu–Ka radia on (45 kV/40 mA).• Cubic cell constants were measured at 773 K by high temperature x-ray diffractometry.
Individual Particle Diameters Tested (nm):
ca. 25, ca. 40, ca. 55, ca. 75, ca. 150
Solution characteristics (pH, cosolvents or other additives, sonication, ionic strength)
• pH: No data• Cosolvents or other addi ves: No data• Sonica on: No data• Ionic strength (conduc vity): No data
Min Diameter Tested (nm): ca. 25
Max Diameter Tested (nm): ca. 150
Specific Surface Area (SSA) (m2/g): No data
Bulk materials tested (≥ 1000 nm): No
Information on Analytical Methods Used to Determine Particle Size:
X-ray crystal size was determined from high-resolution x-ray synchrotron data collected at the X14-A beam line in the National Synchrotron Light Source (lambda = 0.1551 nm). The full width at half maximum (FWHM) was analyzed with a Voigt profile shape function. Particle/crystal size srd was determined from the (111) reflection by the parametrized single-line Warren–Averbach method.
List of Relevant Findings: • Preliminary x-ray phase analyses showed that all samples exhibited strong reflections up to high 2-theta, indicating that good crystallinity was achieved. Nanoparticles used in this work were found to be minimally
aggregated.• We observe a substan al decrease in cell parameters for r <100 nm. Nanocrystals of >150 nm size, on the other hand, asymptotically approach macroscopic lattice constants, indicating that such systems should
essen ally display pseudo macroscopic behavior in their dielectric and ferroelectric proper es.• The decline in the (c) parameter is significantly larger than the decline in the (a) parameter. Such an anisotropic change in cell constants with size could be attributed to the anisotropy in elastic compliances. There is a pronounced drop in c/a for r < ~100 nm. Through the use of the c/a trace, we estimate the critical size (below which the ferroelectric tetragonal phase transforms to the paraelectric cubic phases) ~15 nm which is obtained by extrapolation from 28 nm size–the smallest particle size studied.
Page B-1 of 177
Appendix B: Copy of DatabaseSize versus Effect Relationship Observed by Authors?:
Yes
Mathematical Relationship Identified in Paper (if applicable):
None
Author‐Identified 'Bright Line' Particle Size (diameter) Threshold (nm) ‐ List if applicable:
ca. 30
Notes on 'Bright Line' Threshold: Below a particle size of ca. 30 nm, lead titanate exists in the cubic phase. Above ca. 30 nm, lead titanate exists in the tetragonal phase. A critical size of ca. 15 nm was extrapolated from the data, below which the ferroelectric phase transforms to the paraelectric cubic phase.
ARCADIS Discussion of Results The authors tried to explain the observed phenomenon with the lattice parameter a increasing with decreasing particle size with both extrinsic factors (surface stress, depolarization fields) and intrisic factors (thermal energy, short- and long-range forces). They "attribute the size dependence of the order parameters to the reduced extent of long-range dipole–dipole interactions that arise from the changes in bonding characteristics of ions with decreasing particle size in the perovskite lattice."
Nature of Size versus Effect Relationship (if applicable)
The lattice parameter (c) decreased with decreasing particle size while the lattice parameter (a) increased with decreasing particle size over the range ca. 25 to ca. 150 nm. The c/a ratio decreases with increasing particle size and approaches the bulk value.
Physico‐chemical Property Investigated:
Photocatalytic activity
Priority of Property: High
Relevant for A1 Project?: Yes
Type of nanomaterial (eg, nanometal, nanometal oxide):
Nanometal
Particle Functionalization or Capping Agent (if applicable):
None
List Study Objective(s) Relevant to Investigated Physicochemical Property:
• The apparent photoactivities of flame synthesized TiO2 and commercially availableTiO2 as received and after calcination in air at temperatures ranging from 200 to 700 deg C were compared. A model was developed based on the mechanistic steps in photocatalysis to elucidate the role of particle size on the apparent photoactivity of TiO2
for the photooxida on of organic substrates in water.• The model was used to explain the trends in the experimental data for four different sets of photoac vity experiments with TiO2 powders.• Ishihara ST-01,
Degussa P25 and Aldrich Anatase TiO2.
Almquist and Biswas (2002)
Specific Details on Tested Nanomaterial(s)
• Titanium dioxide (TiO2)• > 70% anatase; <30% ru le
Details on Preparation Method of Nanomaterial(s):
No data
Details on Tests Examining Physicochemical Property:
• Oxidizer: phenol• The reactor in this test system was a 25-cm^3 impinger (Pyrex, Ace Glass) placed ver cally in a water bath (500-cm^3 Pyrex beaker). The Pyrex filtered out wavelengths of less than 300 nm, and the water bath filtered out infrared wavelengths from the lamp. Aeration flow to the reactor was pure oxygen controlled at 150
cm^3/min.• The phenol in each aqueous sample was extracted with benzene (99%, Aldrich Chemical) and analyzed using a Hewlett-Packard HP 5890 gas chromatograph (GC) equipped with an FID detector and capillary column (DB-5, J&W Scientific). The lamp used for photocatalysis was a 450-W xenon lamp (Oriel Instruments), positioned horizontally with respect to and in very close proximity to the impinger.
Individual Particle Diameters Tested (nm):
5 - 165 nm
Solution characteristics (pH, cosolvents or other additives, sonication, ionic strength)
• pH: No data• Cosolvents or other addi ves: Phenol (99% pure)• Sonica on: Samples were sonicated for up to 5 min prior to each test• Ionic strength (conduc vity): No data
Page B-2 of 177
Appendix B: Copy of DatabaseMin Diameter Tested (nm): 5
Max Diameter Tested (nm): 169
Specific Surface Area (SSA) (m2/g): 10 - 300
Bulk materials tested (≥ 1000 nm): No
Information on Analytical Methods Used to Determine Particle Size:
The crystal phase of each catalyst was determined using a Siemens X-Ray Diffractometer (XRD) with a Cu Kα source from 5<2θ<60 at a scan rate of 0.1 s−1. The d-values of the XRD spectra were used to iden fy the crystal phases. The Scherrer equation was used to determine the average crystal size of the TiO2 catalysts.
List of Relevant Findings: • A strong effect of particle size on photoactivity was observed. The effects of particle size on the efficiency of light absorption and scattering and charge-carrier dynamics at particle sizes less than 25 nm dominate the apparent
photoac vity of TiO2• An op mum par cle size of 25 to 40 nm exists within all sets of photocatalysis experiments conducted with TiO2 powders in this study.• The op mum par cle size is a result of compe ng effects of effec ve
particle size on light absorption and scattering efficiency, charge-carrier dynamics, and surface area.
Size versus Effect Relationship Observed by Authors?:
Yes
Mathematical Relationship Identified in Paper (if applicable):
None
Author‐Identified 'Bright Line' Particle Size (diameter) Threshold (nm) ‐ List if applicable:
25 - 40
Notes on 'Bright Line' Threshold: The apparent photoactivity increased as the effective particle size increased from 5 to approximately 30 nm and decreased as the effective particle size increased beyond 30 nm. The fact that the optimum particle size with respect to apparent photoactivity was 25 to 40 nm in all sets of photocatalysis experiments conducted in this study is noteworthy. It is also noteworthy that the optimum anatase crystal size with respect to photoactivity is 25 nm in all cases. This suggests that the optical (light absorption and scattering) and electrical properties of TiO2 at effective particle sizes less than ∼40 nm and anatase crystal sizes less than 25 nm dominate the apparent photoactivity of TiO2, but at effective particle sizes greater than 30 nm and anatase crystal sizes greater than 25 nm, the optical and electrical properties of TiO2 become similar to those of bulk TiO2, and the apparent photoactivity of TiO2 has dominated by its available surface area.
ARCADIS Discussion of Results None
Nature of Size versus Effect Relationship (if applicable)
An optimum particle size of 25 to 40 nm exists within all sets of photocatalysis experiments conducted with TiO2 powders in this study.
Physico‐chemical Property Investigated:
Reactivity
Priority of Property: High
Relevant for A1 Project?: Yes
Type of nanomaterial (eg, nanometal, nanometal oxide):
Nanometal
Particle Functionalization or Capping Agent (if applicable):
None
List Study Objective(s) Relevant to Investigated Physicochemical Property:
• To investigate the size-dependent reactivity of iron oxyhydroxide nanoparticles.
Anschutz and Penn (2004)
Specific Details on Tested Nanomaterial(s)
• The 6-line iron oxyhydroxide ((Fe3+)2O3.0.5H2O; ferrihydrite) nanopar cles• needle-shaped goethite (alpha- FeO(OH)) nanopar cles• needle-shaped goethite par cles
Details on Preparation Method of Nanomaterial(s):
No data
Details on Tests Examining Physicochemical Property:
• Redox reactions used hydroquinone as the reducing agent and iron oxyhydroxide nanoparticles as the reductant.
Individual Particle Diameters Tested (nm):
ca. 3.5, ca. 9 (needle), ca. 30 (needle)
Solution characteristics (pH, cosolvents or other additives, sonication, ionic strength)
• pH: No data• Cosolvents or other addi ves: No data• Sonica on: No data• Ionic strength (conduc vity): No data
Page B-3 of 177
Appendix B: Copy of DatabaseMin Diameter Tested (nm): ca. 3.5
Max Diameter Tested (nm): ca. 30
Specific Surface Area (SSA) (m2/g): No data
Bulk materials tested (≥ 1000 nm): No
Information on Analytical Methods Used to Determine Particle Size:
No data
List of Relevant Findings: • The surface-area normalized rates of redox are fastest (by as much as 100x) in experiments using the 6-line ferrihydrite.• Furthermore, the surface-area normalized rates of redox for the ~9x70 nm needle-shaped goethite
nanopar cles is up to fourteen mes faster than the rates for the ~30x350 nm needle-shaped goethite par cles.• The rate of redox using hydroquinone as the reducing agent and iron oxyhydroxide nanoparticles as reductant is strongly particle size and phase dependent.
Size versus Effect Relationship Observed by Authors?:
Yes
Mathematical Relationship Identified in Paper (if applicable):
None
Author‐Identified 'Bright Line' Particle Size (diameter) Threshold (nm) ‐ List if applicable:
None
Notes on 'Bright Line' Threshold: A ferrihydrite nanoparticle and 2 goethite nano-needles were tested. Therefore, it is not possible to determine a 'bright line' particle size threshold as the structure of the nanomaterials tested were different.
ARCADIS Discussion of Results None
Nature of Size versus Effect Relationship (if applicable)
The rate of reduction increases with decreasing particle size.
Physico‐chemical Property Investigated:
Reactivity
Priority of Property: High
Relevant for A1 Project?: Yes
Type of nanomaterial (eg, nanometal, nanometal oxide):
Nanometal
Particle Functionalization or Capping Agent (if applicable):
None
List Study Objective(s) Relevant to Investigated Physicochemical Property:
• This paper presents quantitative results demonstrating that abiotic iron oxide reactivity is particle size dependent.• Specifically, this paper examines the abio c reduc on on two types of well-characterized ferrihydrite
Fe5HO8∙4H2O 3 and goethite (alpha-FeOOH) nanoparticles using hydroquinone as the reducing agent.
Anschutz and Penn (2005)
Specific Details on Tested Nanomaterial(s)
• Ferrihydrite (Fe(5)HO(8).4H(2)O)^3
Page B-4 of 177
Appendix B: Copy of DatabaseDetails on Preparation Method of Nanomaterial(s):
• For synthesis of six-line ferrihydrite-4 nm dots (4nm-6LF), using a peristaltic pump at a rate of 4.58 mL/min, 1.0 L of 0.4799 M NaHCO3 was added drop wise to a continuously stirred 1.0 L solution of 0.4 M Fe(NO3)3∙9H2O. The suspension was separated and microwaved until boiling occurred, shaking every 40 s. Immediately after heating, each suspension was plunged into an ice bath until it reached ~20 deg C. In order to remove the counter ions present from the synthesis, the cooled suspensions were placed into dialysis bags, which were placed in Milli-Q® H2O. The water was changed three times per day for three days. The resulting suspensions were placed in a fume hood to dry. Using a mortar and pestle, the dry, dark reddish brown particles were ground into a fine powder and
stored in a glass vial.• For synthesis of six-line Ferrihydrite-6 nm dots (6nm-6LF), with s rring, 20 g of solid Fe(NO3)3.9H2O was added to 2.0 L of Milli-Q H2O at 75 deg C. The solution temperature was maintained at 75 deg C for 12 min. After heating, the solution was plunged into an ice bath until it reached ~20 deg C (30 min).
Details on Tests Examining Physicochemical Property:
• All preparations and reactions were performed in a catalytically maintained anaerobic environment (~3% H2 in N2, vinyl anaerobic chamber, O2 <100 ppm, as measured by an oxygen/hydrogen gas analyzer). Suspensions were
s rred and all reac on bo les were covered with aluminum foil to prevent exposure to light.• Known masses (75, 50, 25, or 12.5 mg) of particles were placed in clean bottles containing 5.0 mL of 40 mM, pH 3.75 acetate buffer prepared using glacial acetic acid and NaOH that had been purged with N2 gas for at least 20 min. The suspensions were capped, removed from the anaerobic chamber, and sonicated for 10 min. After returning the bottles to the anaerobic chamber and stirring overnight, the appropriate volume of acetate buffer (to bring the final reaction volume to 25.0 mL) and 10 mM hydroquinone stock solution were added. The samples were stirred continuously throughout the experiment. At desired time intervals, 1.0 mL aliquots were removed and filtered using nylon filter membrane. The concentration of p-benzoquinone (Q) at time t, [Q]t, was immediately quantified (<1 min) via high
performance liquid chromatography (HPLC). Stop me was recorded as the me of filtering.• Blank samples containing only QH2 in acetate buffer were used to account for the spontaneous oxidation of QH2 to Q.
Individual Particle Diameters Tested (nm):
4, 6
Solution characteristics (pH, cosolvents or other additives, sonication, ionic strength)
• pH: 3.75 (test)• Cosolvents or other addi ves: None• Sonica on: Yes (just prior to test)• Ionic strength (conductivity): No data
Min Diameter Tested (nm): 4
Max Diameter Tested (nm): 6
Specific Surface Area (SSA) (m2/g): 234.9, 1565 (BET); 271, 409 (TEM)
Bulk materials tested (≥ 1000 nm): No
Information on Analytical Methods Used to Determine Particle Size:
Particles were characterized by three different methods: x-ray diffraction (XRD), transmission electron microscopy (TEM), and Brunauer-Emmett-Teller surface area analysis (BET).
List of Relevant Findings: • SA(TEM) normalized rate constants for the 4 nm-6LF nanoparticles are up to 16 times larger than for the 6 nm-6LF nanoparticles. This is a large difference, with the smaller particles exhibiting a substantially higher reactivity than the larger particles.
Size versus Effect Relationship Observed by Authors?:
Yes
Mathematical Relationship Identified in Paper (if applicable):
None
Author‐Identified 'Bright Line' Particle Size (diameter) Threshold (nm) ‐ List if applicable:
None
Notes on 'Bright Line' Threshold: The particle size range tested spanned 2 nm, thus, determination of a 'bright line' particle size threshold is not possible.
ARCADIS Discussion of Results The particle size range (2 nm) may be too small to infer any meaningful results.
Nature of Size versus Effect Relationship (if applicable)
Reactivity of ferrihydrite increases with decreasing particle size.
Page B-5 of 177
Appendix B: Copy of Database
Physico‐chemical Property Investigated:
Reactivity
Priority of Property: High
Relevant for A1 Project?: Yes
Type of nanomaterial (eg, nanometal, nanometal oxide):
Nanometal
Particle Functionalization or Capping Agent (if applicable):
None
List Study Objective(s) Relevant to Investigated Physicochemical Property:
• This paper presents quantitative results demonstrating that abiotic iron oxide reactivity is particle size dependent.• Specifically, this paper examines the abio c reduc on on two types of well-characterized ferrihydrite
Fe5HO8∙4H2O 3 and goethite (alpha-FeOOH) nanoparticles using hydroquinone as the reducing agent.
Anschutz and Penn (2005)
Specific Details on Tested Nanomaterial(s)
• Goethite (alpha-FeOOH)
Details on Preparation Method of Nanomaterial(s):
• For synthesis of nanorods of goethite (alpha-FeOOH), using a peristaltic pump at a rate of 4.58 mL/min, 1.0 L of 0.4799 M NaHCO3 was added drop wise to a continuously stirred 1.0 L solution of 0.4 M Fe(NO3)3∙9H2O. The suspension was separated and microwaved until boiling occurred, shaking every 40 s. Immediately after heating, each suspension was plunged into an ice bath until it reached ~20 °C. In order to remove the counter ions present from the synthesis, the cooled suspensions were placed into dialysis bags, which were placed in Milli-Q® H2O. The pH of the ferrihydrite suspension was quickly adjusted to 12 using 5 M NaOH. The suspension was heated at 90 °C for 24 h, after which a deep orange precipitate had settled to the bottom quarter of the bottle. The supernatant
was discarded, and the remaining suspension was placed into dialysis bags, which were placed in Milli-Q H2O.• For synthesis of microrods of goethite (alpha-FeOOH), with stirring, 40 g of Fe NO3 3∙9H20 was added to 900 mL of Milli-Q H2O. While stirring, the pH was adjusted to 12 using 5 M NaOH. A deep maroon suspension formed. The suspension was heated in an oven at 90 °C for one week, after which a yellow-orange precipitate had settled to the bottom quarter of the bottle. The supernatant was discarded, and the remaining suspension was placed into dialysis bags, which were placed in Milli-Q H2O. The water was changed three times per day for three days. The resulting suspension was dialyzed, dried, and ground as described earlier.
Details on Tests Examining Physicochemical Property:
• All preparations and reactions were performed in a catalytically maintained anaerobic environment (~3% H2 in N2, vinyl anaerobic chamber, O2 <100 ppm, as measured by an oxygen/hydrogen gas analyzer). Suspensions were
s rred and all reac on bo les were covered with aluminum foil to prevent exposure to light.• Known masses (75, 50, 25, or 12.5 mg) of particles were placed in clean bottles containing 5.0 mL of 40 mM, pH 3.75 acetate buffer prepared using glacial acetic acid and NaOH that had been purged with N2 gas for at least 20 min. The suspensions were capped, removed from the anaerobic chamber, and sonicated for 10 min. After returning the bottles to the anaerobic chamber and stirring overnight, the appropriate volume of acetate buffer (to bring the final reaction volume to 25.0 mL) and 10 mM hydroquinone stock solution were added. The samples were stirred continuously throughout the experiment. At desired time intervals, 1.0 mL aliquots were removed and filtered using nylon filter membrane. The concentration of p-benzoquinone (Q) at time t, [Q]t, was immediately quantified (<1 min) via high
performance liquid chromatography (HPLC). Stop me was recorded as the me of filtering.• Blank samples containing only QH2 in acetate buffer were used to account for the spontaneous oxidation of QH2 to Q.
Solution characteristics (pH, cosolvents or other additives, sonication, ionic strength)
• pH: 12 (prepara on), 3.75 (test)• Cosolvents or other addi ves: None• Sonica on: Yes (just prior to test)• Ionic strength (conductivity): No data
Min Diameter Tested (nm): 5.3
Max Diameter Tested (nm): 22
Specific Surface Area (SSA) (m2/g): Nanorods: 136.8 (BET), 210 (TEM); Microrods: 38.19 (BET), 53 (TEM)
Bulk materials tested (≥ 1000 nm): No
Information on Analytical Methods Used to Determine Particle Size:
Particles were characterized by three different methods: x-ray diffraction (XRD), transmission electron microscopy (TEM), and Brunauer-Emmett-Teller surface area analysis (BET).
List of Relevant Findings: • Results clearly show that both the SA(TEM) and SA(BET) normalized, 2D rate constants for the nanorods are nearly two times larger than for the microrods, which is a significant but not a large effect.
Page B-6 of 177
Appendix B: Copy of DatabaseSize versus Effect Relationship Observed by Authors?:
Yes
Mathematical Relationship Identified in Paper (if applicable):
None
Author‐Identified 'Bright Line' Particle Size (diameter) Threshold (nm) ‐ List if applicable:
None
Notes on 'Bright Line' Threshold: Reactivity of the nanorods was greater than for the microrods; however, a 'bright line' particle size threshold cannot be determined.
ARCADIS Discussion of Results None
Nature of Size versus Effect Relationship (if applicable)
Reactivity of goethite increases with decreasing rod size.
Physico‐chemical Property Investigated:
Crystalline structure (structure)
Priority of Property: High
Relevant for A1 Project?: Yes
Type of nanomaterial (eg, nanometal, nanometal oxide):
Nanometal oxide alloy
Particle Functionalization or Capping Agent (if applicable):
None
List Study Objective(s) Relevant to Investigated Physicochemical Property:
• Inves gate the size-induced changes in the crystal symmetry of par ally covalent metal oxides.• Inves gate the rela onship between the symmetry of the crystal la ce structure and crystal size.• Inves gate the size
dependence of many important physical properties on lattice distortion.
• Nanocrystalline alumina with different average par cle sizes was prepared by the sol-gel process.• The as-prepared sample (calcined at 1100 C for 30 min) consists of a mixture of mainly rhomohedrum corundum structure and monoclinic phases with a small amount of tetragonal phase.
Details on Tests Examining Physicochemical Property:
No data
Individual Particle Diameters Tested (nm):
No data
Solution characteristics (pH, cosolvents or other additives, sonication, ionic strength)
Not applicable
Min Diameter Tested (nm): ca. 10
Max Diameter Tested (nm): ca. 83
Specific Surface Area (SSA) (m2/g): No data
Bulk materials tested (≥ 1000 nm): No
Information on Analytical Methods Used to Determine Particle Size:
The "particle size" is the volume averaged size of the coherently diffracting domains obtained from x-ray diffraction line broadening after making the usual correction for instrumental broadening.
List of Relevant Findings: • The unit cell volume (UCV) (normalized to the number of formula units per unit cell, Z) increases with decreasing size for each phase. The crossover from one phase to another with decreasing size is accompanied by large,
discon nuous increases in the UCV.• In nano Al2O3, a reduc on in size leads to a transi on to an oxygen deficient crystal structure (the corresponding 7 phases) without, however, any change in the ca on:oxygen ra o.• In many
important cases, deviations from bulk properties are related primarily to the changes in the size and symmetry of the unit cell. The significance of this finding is that it provides an insight into the delicate interplay between the structure and properties of solid matter.
Page B-7 of 177
Appendix B: Copy of DatabaseSize versus Effect Relationship Observed by Authors?:
Yes
Mathematical Relationship Identified in Paper (if applicable):
None
Author‐Identified 'Bright Line' Particle Size (diameter) Threshold (nm) ‐ List if applicable:
None
Notes on 'Bright Line' Threshold: The increase in unit cell volume was monotonic over the range of particles tested and did not pass through a minima or maxima. A 'bright line' particle size threshold cannot be determined.
ARCADIS Discussion of Results None
Nature of Size versus Effect Relationship (if applicable)
The unit cell volume increases with decreasing particle size.
Physico‐chemical Property Investigated:
Crystalline structure (structure)
Priority of Property: High
Relevant for A1 Project?: Yes
Type of nanomaterial (eg, nanometal, nanometal oxide):
Nanometal oxide
Particle Functionalization or Capping Agent (if applicable):
None
List Study Objective(s) Relevant to Investigated Physicochemical Property:
• Inves gate the size-induced changes in the crystal symmetry of par ally covalent metal oxides.• Inves gate the rela onship between the symmetry of the crystal la ce structure and crystal size.• Inves gate the size
dependence of many important physical properties on lattice distortion.
Ayyub et al. (1995)
Specific Details on Tested Nanomaterial(s)
• Iron trioxide (Fe2O3)
Details on Preparation Method of Nanomaterial(s):
No data
Details on Tests Examining Physicochemical Property:
No data
Individual Particle Diameters Tested (nm):
No data
Solution characteristics (pH, cosolvents or other additives, sonication, ionic strength)
Not applicable
Min Diameter Tested (nm): ca. 10
Max Diameter Tested (nm): ca. 70
Specific Surface Area (SSA) (m2/g): No data
Bulk materials tested (≥ 1000 nm): No
Information on Analytical Methods Used to Determine Particle Size:
The "particle size" is the volume averaged size of the coherently diffracting domains obtained from x-ray diffraction line broadening after making the usual correction for instrumental broadening.
List of Relevant Findings: • The unit cell volume (UCV) (normalized to the number of formula units per unit cell, Z) increases with decreasing size for each phase. The crossover from one phase to another with decreasing size is accompanied by large,
discon nuous increases in the UCV.• In n-Fe2O3, a reduc on in size leads to a transi on to an oxygen deficient crystal structure (the corresponding 7 phases) without, however, any change in the ca on:oxygen ra o.• In many
important cases, deviations from bulk properties are related primarily to the changes in the size and symmetry of the unit cell. The significance of this finding is that it provides an insight into the delicate interplay between the structure and properties of solid matter.
Page B-8 of 177
Appendix B: Copy of DatabaseSize versus Effect Relationship Observed by Authors?:
Yes
Mathematical Relationship Identified in Paper (if applicable):
None
Author‐Identified 'Bright Line' Particle Size (diameter) Threshold (nm) ‐ List if applicable:
None
Notes on 'Bright Line' Threshold: The increase in unit cell volume was monotonic over the range of particles tested and did not pass through a minima or maxima. A 'bright line' par cle size threshold cannot be determined.Authors cite earlier work which
showed that "a decrease in size below 30 nm was found to alter the equilibrium crystal structure from the corundum to the inverse spinel type." (Ayyub et al., 1988 - J. Phys. C 21, 2229)
ARCADIS Discussion of Results None
Nature of Size versus Effect Relationship (if applicable)
The unit cell volume, or UCV, increases with decreasing particle size.
Physico‐chemical Property Investigated:
Crystalline structure (structure)
Priority of Property: High
Relevant for A1 Project?: Yes
Type of nanomaterial (eg, nanometal, nanometal oxide):
Nanometal oxide
Particle Functionalization or Capping Agent (if applicable):
None
List Study Objective(s) Relevant to Investigated Physicochemical Property:
• Inves gate the size-induced changes in the crystal symmetry of par ally covalent metal oxides.• Inves gate the rela onship between the symmetry of the crystal la ce structure and crystal size.• Inves gate the size
dependence of many important physical properties on lattice distortion.
Ayyub et al. (1995)
Specific Details on Tested Nanomaterial(s)
• Lead titanium trioxide (PbTiO3)
Details on Preparation Method of Nanomaterial(s):
• Ultrafine particles of PbTiO3 were prepared by co precipitation as hydroxides from a solution of Pb(NO3)2 and Ti(NO3)4. The dried precipitate was heated at various temperatures between 450 C and 900 C to obtain PbTiO3 particles with average sizes in the range of 45-300 nm.
Details on Tests Examining Physicochemical Property:
• The ferroelectric transition temperature was determined by measuring the temperature dependence of the static dielectric response function as well as by differential scanning calorimetry.
Individual Particle Diameters Tested (nm):
No data
Solution characteristics (pH, cosolvents or other additives, sonication, ionic strength)
Not applicable
Page B-9 of 177
Appendix B: Copy of DatabaseMin Diameter Tested (nm): 45
Max Diameter Tested (nm): 300
Specific Surface Area (SSA) (m2/g): No data
Bulk materials tested (≥ 1000 nm): No
Information on Analytical Methods Used to Determine Particle Size:
The "particle size" is the volume averaged size of the coherently diffracting domains obtained from x-ray diffraction line broadening after making the usual correction for instrumental broadening.
List of Relevant Findings: • Above Tc =763 K, PbTiO3 transforms to a cubic (a=c=0.396 nm) paraelectric structure with each Ti4+ ion at the center of an oxygen octahedron. Below Tc, the softening of a TO mode causes an off center displacement of the Ti4+ ion by 0.017 nm along the polar axis (with the Pb ion as origin) and, consequently, a spontaneous polarization,
Ps. The tetragonal distor on (c/a), therefore, scales as the order parameter (Ps).• The ini al reduc on in Tc may be caused by the size-induced modification of the structure towards the cubic symmetry. Note that the ferroelectric transition is not observed below a size of 60 nm, in spite of a still nonzero tetragonal distortion. The balance between the short-range repulsive and the long-range attractive forces (necessary for the softening of a lattice mode) appears to be affected in the latter size regime, leading to an abrupt disappearance of
ferroelectricity.• In many important cases, devia ons from bulk proper es are related primarily to the changes in the size and symmetry of the unit cell. The significance of this finding is that it provides an insight into the delicate interplay between the structure and properties of solid matter.
Size versus Effect Relationship Observed by Authors?:
Unclear
Mathematical Relationship Identified in Paper (if applicable):
None
Author‐Identified 'Bright Line' Particle Size (diameter) Threshold (nm) ‐ List if applicable:
None
Notes on 'Bright Line' Threshold: Size-induced modification of structure towards the cubic symmetry was noted; however, inference of a particle size threshold is not possible.
ARCADIS Discussion of Results Authors discuss effects on structure in terms of calcination temperature, and do not clearly relate results to particle size.
Nature of Size versus Effect Relationship (if applicable)
Above a critical temperature of 763 K, a cubic structure is present. However, the particle size affilated with this temperature is not reported.
Physico‐chemical Property Investigated:
Crystalline structure (structure)
Priority of Property: High
Relevant for A1 Project?: Yes
Type of nanomaterial (eg, nanometal, nanometal oxide):
Nanometal oxide
Particle Functionalization or Capping Agent (if applicable):
None
List Study Objective(s) Relevant to Investigated Physicochemical Property:
• Inves gate the size-induced changes in the crystal symmetry of par ally covalent metal oxides.• Inves gate the rela onship between the symmetry of the crystal la ce structure and crystal size.• Inves gate the size
dependence of many important physical properties on lattice distortion.
Ayyub et al. (1995)
Specific Details on Tested Nanomaterial(s)
• Lead zirconium trioxide (PbZrO3)
Details on Preparation Method of Nanomaterial(s):
• Fine particles of PbZrO3 were prepared by a modified sol-gel technique starting with an aqueous solution of ZrOCl2.8H2O and Pb(NO3)2.
Details on Tests Examining Physicochemical Property:
No data
Individual Particle Diameters Tested (nm):
No data
Solution characteristics (pH, cosolvents or other additives, sonication, ionic strength)
Not applicable
Page B-10 of 177
Appendix B: Copy of DatabaseMin Diameter Tested (nm): ca. 36
Max Diameter Tested (nm): ca. 3900
Specific Surface Area (SSA) (m2/g): No data
Bulk materials tested (≥ 1000 nm): Yes
Information on Analytical Methods Used to Determine Particle Size:
The "particle size" is the volume averaged size of the coherently diffracting domains obtained from x-ray diffraction line broadening after making the usual correction for instrumental broadening.
List of Relevant Findings: • PbZrO3 is antiferroelectric at room temperature and has an orthorhombic structure. Transition to a cubic, paraelectric phase occurs at 230 deg C.• The pseudotetragonal la ce distor on (a/c ra o) in the an ferroelectric
phase decreases monotonically to 1 with decreasing size. The Tc appears to scale with the pseudotetragonal distor on.• In many important cases, devia ons from bulk proper es are related primarily to the changes in the
size and symmetry of the unit cell. The significance of this finding is that it provides an insight into the delicate interplay between the structure and properties of solid matter.
Size versus Effect Relationship Observed by Authors?:
Yes
Mathematical Relationship Identified in Paper (if applicable):
None
Author‐Identified 'Bright Line' Particle Size (diameter) Threshold (nm) ‐ List if applicable:
None
Notes on 'Bright Line' Threshold: The antiferroelectric phase decreases monotonically with decreasing size; therefore, not possible to infer a threshold from the data.
ARCADIS Discussion of Results None
Nature of Size versus Effect Relationship (if applicable)
The pseudotetragonal lattice distortion (a/c ratio) increases with increasing particle size.
Physico‐chemical Property Investigated:
Crystalline structure (structure)
Priority of Property: High
Relevant for A1 Project?: Yes
Type of nanomaterial (eg, nanometal, nanometal oxide):
Nanometal alloy oxide
Particle Functionalization or Capping Agent (if applicable):
None
List Study Objective(s) Relevant to Investigated Physicochemical Property:
• Inves gate the size-induced changes in the crystal symmetry of par ally covalent metal oxides.• Inves gate the rela onship between the symmetry of the crystal la ce structure and crystal size.• Inves gate the size
dependence of many important physical properties on lattice distortion.
• Submicrometer LSCO particles were synthesized by rapid liquid dehydration. The process involved a fast nucleation of fine particles from a mixture of the citrates of La, Sr and Cu in aqueous solution. Dry acetone was used as dehydrating agent since it has a high solubility for water but not for the metal salts. The citrate precipitate was calcined at different temperatures to obtain samples with different average sizes.
Details on Tests Examining Physicochemical Property:
• The superconducting transition was studied by a superconducting quantum interference device magnetometer (Quantum Design). Both the tetragonal distortion (c/a) and Tc fall monotonically with decreasing size below ca. 0.6 um.
Individual Particle Diameters Tested (nm):
No data
Solution characteristics (pH, cosolvents or other additives, sonication, ionic strength)
Not applicable
Page B-11 of 177
Appendix B: Copy of DatabaseMin Diameter Tested (nm): ca. 350
Max Diameter Tested (nm): ca. 1300
Specific Surface Area (SSA) (m2/g): No data
Bulk materials tested (≥ 1000 nm): Yes
Information on Analytical Methods Used to Determine Particle Size:
The "particle size" is the volume averaged size of the coherently diffracting domains obtained from x-ray diffraction line broadening after making the usual correction for instrumental broadening.
List of Relevant Findings: • The basic structural units of LSCO are the corner-sharing CuO6 octahedra, which form a two-dimensional layered structure. A Jahn-Teller (JT) distor on of these octahedra splits the degenerate (eg) levels of the Cu(3d) states.• A
decrease in size is seen to reduce the JT distortion. The strong correlation between the extent of the JT distortion and the Tc that we observe appears to underline the importance of the JT effect in the mechanism of
superconduc vity in this class of high-Tc superconductors.• In many important cases, devia ons from bulk properties are related primarily to the changes in the size and symmetry of the unit cell. The significance of this finding is that it provides an insight into the delicate interplay between the structure and properties of solid matter.
Size versus Effect Relationship Observed by Authors?:
Yes
Mathematical Relationship Identified in Paper (if applicable):
None
Author‐Identified 'Bright Line' Particle Size (diameter) Threshold (nm) ‐ List if applicable:
None
Notes on 'Bright Line' Threshold: A decrease in size is seen to reduce the Jahn-Teller distortion; however, inference of a particle size threshold is not possible.
ARCADIS Discussion of Results None
Nature of Size versus Effect Relationship (if applicable)
The Jahn-Teller distortion decreases with decreasing particle size.
Physico‐chemical Property Investigated:
Reactivity
Priority of Property: High
Relevant for A1 Project?: Yes
Type of nanomaterial (eg, nanometal, nanometal oxide):
Nanometal
Particle Functionalization or Capping Agent (if applicable):
None
List Study Objective(s) Relevant to Investigated Physicochemical Property:
• The researchers were exploring whether the thermodynamic properties of various particle sizes could explain the observa on that smaller-sized par cles (less than ca 7 nm) were less effec ve catalysts.• The equilibrium
properties of various supported-Co catalysts were directly measured using colometric titration on Co particles in SBA-15, a mesoporous material with a narrow range of pore sizes ∼4.7 nm, and on Co particles supported on zirconia, with and without Pd doping
Appendix B: Copy of DatabaseDetails on Preparation Method of Nanomaterial(s):
• For the ZrO2-supported catalysts, Co was added by impregnation with aqueous solutions of the nitrate salt, followed by drying at 338 K and calcining in air at 773 K for 4 h.• To study the effect of Pd promo on,
Pd(NH3)4(NO3)2 was added to a portion of the 5-wt% Co/ZrO2 sample to achieve a final weight ratio of 1:10 Pd to Co.• The bulk ZrO2 samples used in this study were prepared by simply decomposing the nitrate salt
Zr(NO3)2.6H2O, in air at 773 K for 4 h. The ZrO2 was calcined a second time at 1073 K overnight in order to stabilize its surface area for use as a support for Co.
Details on Tests Examining Physicochemical Property:
• The apparatus for colometric titration consisted of a YSZ tube with Ag electrodes painted on both the inside and outside of the tube. The sample to be analyzed was placed in an alumina crucible that was then inserted into the center of the YSZ tube. Ultra-Torr fittings were attached to the ends of the YSZ tube, while the center portion of the YSZ tube was placed in a furnace, allowing the tube and catalyst sample to be gradually heated in air to the measurement temperature. When starting the equilibrium measurements from the oxidizing side, a gas mixture of 5% O2, 11% H2O, and 84% Ar was allowed to flow over the sample for 0.5 h. Immediately after stopping the flow, the ends of the tube were sealed by inserting glass stoppers into the Ultra-Torr vacuum fittings. When starting from the reducing side, the sample was exposed to a gas mixture containing 10% H2 in N2 instead. Oxygen was then added or removed from the cell electrochemically by passing a current through the Ag electrodes, across the electrolyte. After passing a given quantity of charge, the open circuit potential across the electrodes was measured as a function of time in order to determine the equilibrium P(O2). It was assumed that equilibrium had been reached when the potential varied by no more than 0.1 mV/h, a rate typically achieved after 3 or 4 days. Changes in the oxygen content within the cell were determined from Faraday’s Law and the equilibrium P(O2) was calculated from the Nernst equation.
Individual Particle Diameters Tested (nm):
No data (2.5 wt%), 20-25 (5, 7.5, wt%), 38 (20 wt%)
Solution characteristics (pH, cosolvents or other additives, sonication, ionic strength)
Not applicable
Min Diameter Tested (nm): 20
Max Diameter Tested (nm): 38
Specific Surface Area (SSA) (m2/g): 45-54
Bulk materials tested (≥ 1000 nm): No
Information on Analytical Methods Used to Determine Particle Size:
The XRD measurements were performed using a Cu K radiation source (lambda = 0.15405 nm). XRD data was collected at a 0.5 deg 2/min rate with a 0.01 step size in 2 . The surface areas of the Co–zirconia catalysts were determined from BET isotherms using N2 adsorption at 77K and were obtained after degassing the samples at 473K for 45 min. Samples for transmission electron microscopy (TEM) were prepared by placing a drop of sample dispersed in 2-propanol (Fluka) onto a 200-mesh copper grid coated with a holey carbon film. The images were obtained on a JEOL 2010 operated at 200 kV.
List of Relevant Findings: • There was no reduction of the bulk zirconia sample, even after the P(O2) was decreased below 10−29 atm. Assuming that the O/Zr ratio of the oxidized sample was 2.0, this oxygen stoichiometry remained 2.0 at even the
lowest P(O2).• The amount of oxygen that could be added to the sample was only 18.6 mmol/gCo, corresponding to only 80% of the amount of oxygen that a 2-wt% Co catalyst should have been able to accept. More important, all of the equilibrium P(O2) are close to that which would be expected for the bulk compounds. The equilibrium between Co and CoO at 973K occurred very close to the expected value of 2E-18 atm and a point at 1E-04 atm hints at an equilibrium between CoO and Co3O4. Certainly, there is no evidence for reducible forms of Co that would be
oxidized at H2O:H2 ra os near unity.• Samples with 7.5-wt%, 10-wt%, and 20-wt% Co showed isotherms that were indis nguishable from that observed for bulk CoOx.• Interac ons between CoOx and its support can shi
the equilibrium constant enough to cause particles to be oxidized under Fischer–Tropsch synthesis conditions. Small amounts of Pd are capable of breaking up these interactions and restoring the redox properties of small CoOx particles back to the bulk properties.
Page B-13 of 177
Appendix B: Copy of DatabaseSize versus Effect Relationship Observed by Authors?:
None
Mathematical Relationship Identified in Paper (if applicable):
None
Author‐Identified 'Bright Line' Particle Size (diameter) Threshold (nm) ‐ List if applicable:
None
Notes on 'Bright Line' Threshold: None
ARCADIS Discussion of Results Researchers were exploring potential size-related effects on catalysis of Fischer-Tropsch synthesis, which occurs at temperatures not representative of environmental conditions.
Nature of Size versus Effect Relationship (if applicable)
Although it has been suggested that small particles could exhibit equilibrium properties that differ from that of bulk Co, the data for Co particles supported in SBA-15 indicates that particle size does not affect the redox
thermodynamic proper es to any significant degree for par cles larger than 4 nm.The results do not provide evidence for changes in the redox properties of Co with particle size, but do indicate that interactions between Co and its support can make Co more difficult to reduce.
Physico‐chemical Property Investigated:
Crystalline structure (structure)
Priority of Property: High
Relevant for A1 Project?: Yes
Type of nanomaterial (eg, nanometal, nanometal oxide):
Nanometal oxide
Particle Functionalization or Capping Agent (if applicable):
None
List Study Objective(s) Relevant to Investigated Physicochemical Property:
• This study focused on the effects of particle size on hematite dissolution by the siderophore desferrioxamine-B (DFOB). Results on size-related effects on crystalline strucure were also reported.
Barton et al. (2012)
Specific Details on Tested Nanomaterial(s)
• Iron (III) oxide (Fe2O3)• hema te
Details on Preparation Method of Nanomaterial(s):
• Hematite nanoparticles of (nominal) size 3.6, 8.6 and 40 nm Were synthesized via forced hydrolysis from solution using Fe(NO3)3. For 8.6 nm particles, 60 mL of 1M Fe(NO3)3 solution was added to 750 mL of boiling deionized (MilliQ) water via peristaltic pump. Boil was maintained on a hot plate with continuous stirring. Following addition
of Fe(NO3)3, the mixture was removed from heat, cooled 24 hours, and placed into dialysis tubing.• The 3.6 nm particles were synthesized by doubling the initial Fe(NO3)3 concentration to 2M to promote greater super-
satura on.• For 40 nm par cles, 500 mL of 0.002 M HCl were placed in a screw cap glass bo le and preheated to 98 deg C overnight. The following day, 4.04 g of Fe(NO3)3 were added. After vigorous shaking, the mixture was returned to the oven for 7 days, then allowed to cool overnight before being placed into dialysis tubing.
Details on Tests Examining Physicochemical Property:
• Particle morphology was determined by transmission electron micropscopy (TEM).
Individual Particle Diameters Tested (nm):
3.6, 8.6, 49
Solution characteristics (pH, cosolvents or other additives, sonication, ionic strength)
• pH: 3, 5, 7• Cosolvents or other addi ves: evalua ng poten al environmental degrada on in the presence of low molecular weight organic ligands known as siderophores that are released by microorganisms• Sonica on:
• Ionic strength (conductivity): in 0.01 M NaClO4
Min Diameter Tested (nm): 3.6
Max Diameter Tested (nm): 49
Specific Surface Area (SSA) (m2/g): 151, 119, 45
Bulk materials tested (≥ 1000 nm): No
Information on Analytical Methods Used to Determine Particle Size:
• Par cle sizes were determined by Transmission electron microscopy (TEM).• Specific surface area was measured according to the method of Brunauer, Emmett and Teller (BET).
List of Relevant Findings: • The 3.6 nm particles had a globular appearance, the 8.6 nm particles were globular, pseudo-hexagonal or pseudo- spherical, and the 40 nmpar cles were rhombohedral or rounded rhombohedral in shape.• Although individual
3–4 nm grains could be discerned within aggregates, the much lower low BET specific surface area suggests that many particles were probably sutured together, removing reactive surface area from solution.
Page B-14 of 177
Appendix B: Copy of DatabaseSize versus Effect Relationship Observed by Authors?:
Yes
Mathematical Relationship Identified in Paper (if applicable):
None
Author‐Identified 'Bright Line' Particle Size (diameter) Threshold (nm) ‐ List if applicable:
None
Notes on 'Bright Line' Threshold: The particle morpholgy changed as particle size decreased from 40 to 3.8 nm; however, a 'bright line' particle size threshold cannot be inferred from these data.
ARCADIS Discussion of Results None
Nature of Size versus Effect Relationship (if applicable)
The particle morphology changes from rhombohedral to pseudo-hexagonal pseudo-spherical to globular as the particle size decreases from 40 to 3.6 nm.
Physico‐chemical Property Investigated:
Water solubility
Priority of Property: High
Relevant for A1 Project?: Yes
Type of nanomaterial (eg, nanometal, nanometal oxide):
Nanometal oxide
Particle Functionalization or Capping Agent (if applicable):
None
List Study Objective(s) Relevant to Investigated Physicochemical Property:
• This study focused on the effects of particle size on hematite dissolution by the siderophore desferrioxamine-B (DFOB).• Control data reported herein from experiments without DFOB.
Barton et al. (2012)
Specific Details on Tested Nanomaterial(s)
• Iron (III) oxide (Fe2O3)• hema te
Page B-15 of 177
Appendix B: Copy of DatabaseDetails on Preparation Method of Nanomaterial(s):
• Hematite nanoparticles of (nominal) size 3.6, 8.6 and 40 nm Were synthesized via forced hydrolysis from solution using Fe(NO3)3. For 8.6 nm particles, 60 mL of 1M Fe(NO3)3 solution was added to 750 mL of boiling deionized (MilliQ) water via peristaltic pump. Boil was maintained on a hot plate with continuous stirring. Following addition
of Fe(NO3)3, the mixture was removed from heat, cooled 24 hours, and placed into dialysis tubing.• The 3.6 nm particles were synthesized by doubling the initial Fe(NO3)3 concentration to 2M to promote greater super-
satura on.• For 40 nm par cles, 500 mL of 0.002 M HCl were placed in a screw cap glass bo le and preheated to 98 deg C overnight. The following day, 4.04 g of Fe(NO3)3 were added. After vigorous shaking, the mixture was returned to the oven for 7 days, then allowed to cool overnight before being placed into dialysis tubing.
Details on Tests Examining Physicochemical Property:
• This study focused on the effects of particle size (3.6, 8.6, and 40 nm) on hematite dissolution by the siderophore desferrioxamine-B (DFOB) at pH 3, 5, and 7 and 22 deg C, to 48 hours.• To maintain the same ini al ra o of total
particle surface area to ligand (DFOB) concentration, nanoparticle suspensions were prenormalized to BET surface area. Each reaction vessel contained 33.5 m^2/L of hematite. The normalized suspension densities for the 3.6, 8.6,
and 40 nm par cles were 0.22, 0.28, and 0.75 g/L, respec vely.• Batch adsorp on and dissolu on experiments were performed in 0.01M NaClO4 in 50mL polypropylene tubes. Three milliliters of the 2.4 mM DFOB stock solution were dispensed into reaction vessels containing electrolyte, followed by 20 mL of the BET normalized nanoparticle suspensions, to give a total volume of 30 mL. Suspension pH was adjusted to pH 3 - 7. The reaction vessels were then placed on a rotary shaker until the time of sampling. Experiments were conducted in triplicate at atmospheric temperature (ca. 22 deg C) and ambient CO2 conditions for either 24 or 2–48 h. For dissolution experiments, entire samples were sacrificed at each time period. Following sampling, the pH was measured again
to determine any dri s in pH over the reac on period.• Due to small par cle size, solu on was separated from hematite particles via a two-step filtration method; then 1–2 mL of suspension was filtered through a 0.22 μm PTFE filter followed by filtration through a 0.02 μm membrane filter. The first 1 mL of filtrate was discarded. The filtrate was diluted with 0.01M NaClO4 and acidified with 100 uL of 6M HCl. This two-step filtration method was developed after determining that centrifugation (up to 1 hour at 90,000 rpm) did not adequately separate the smallest particles and to avoid potential disturbance to samples by high-speed ultracentrifugation. A combination of absorbance measurements and ICP analysis of Fe was used to verify removal of hematite nanoparticles; centrifugation or filtration through larger membranes were insufficient. Without the two-step filtrationmethod, samples remained faintly red-colored on visual inspection, evidence of light scattering in UV/Vis spectra indicated the likely presence of particles, and high Fe concentrations were measured by ICP.
Individual Particle Diameters Tested (nm):
3.6, 8.6, 49
Solution characteristics (pH, cosolvents or other additives, sonication, ionic strength)
• pH: 3, 5, 7• Cosolvents or other addi ves: evalua ng poten al environmental degrada on in the presence of low molecular weight organic ligands known as siderophores that are released by microorganisms• Sonica on:
• Ionic strength (conductivity): in 0.01 M NaClO4
Min Diameter Tested (nm): 3.6
Max Diameter Tested (nm): 49
Specific Surface Area (SSA) (m2/g): 151, 119, 45
Bulk materials tested (≥ 1000 nm): No
Information on Analytical Methods Used to Determine Particle Size:
• Par cle sizes were determined by Transmission electron microscopy (TEM).• Specific surface area was measured according to the method of Brunauer, Emmett and Teller (BET).
List of Relevant Findings: • At pH 3, total Fe released at 24 hours decreased with increasing particle size and was ca. 6.3, 3.6, and 1.0 μM Fe for the 3.6, 8.6 and 40 nm particles, respectively. Release was ≤0.7 μM Fe for all 3 particles at pH 5 and below the detection limit of the ICP-OES (ca. 0.01 μM Fe) at pH 7. Due to minimal Fe released (often below detection), dissolution rates were not calculated. Total Fe released at 24 h at pH 3 and 5 decreased slightly as particle size increased in the order: 3.6 nm ≥ 8.6 nm > 40 nm.
Size versus Effect Relationship Observed by Authors?:
Yes
Mathematical Relationship Identified in Paper (if applicable):
None
Author‐Identified 'Bright Line' Particle Size (diameter) Threshold (nm) ‐ List if applicable:
None
Notes on 'Bright Line' Threshold: At pH 3, total Fe ion dissolution increased with decreasing particle diameter from 49 to 3.6 nm. However, a 'bright line' particle size threshold cannot be inferred from these data.
ARCADIS Discussion of Results None
Nature of Size versus Effect Relationship (if applicable)
At pH 3, dissolution increased with decreasing particle size from 49 to 3.6 nm. Release was similar or below detection at pH 5 and 7.
Page B-16 of 177
Appendix B: Copy of Database
Physico‐chemical Property Investigated:
Reactivity
Priority of Property: High
Relevant for A1 Project?: Yes
Type of nanomaterial (eg, nanometal, nanometal oxide):
Supported nanometal
Particle Functionalization or Capping Agent (if applicable):
None
List Study Objective(s) Relevant to Investigated Physicochemical Property:
• To investigate the role of particle size of cobalt in cobalt-carbon nanofiber catalysts on the Fischer-Tropsch reaction.
Bezemer et al. (2006)
Specific Details on Tested Nanomaterial(s)
• Cobalt (Co) on carbon nanofiber catalysts
Details on Preparation Method of Nanomaterial(s):
• Different preparation methods were employed, including: incipient wetness impregnation (IWI) - 9 samples, ion adsorp on (IA) - 1 sample, and homogeneous deposi on precipita on (HDP) - samples.• The support material,
carbon nanofibers of the fishbone-type with a diameter of about 30 nm, were grown from synthesis gas (CO and H2) using a 5 wt % Ni/SiO2 growth catalyst.
Details on Tests Examining Physicochemical Property:
• Catalysts were tested at atmospheric pressure and at 35 bar. The measurements at 1 bar were carried out at 220 deg C using CO/H2 (1/2 v/v) after a reduction treatment at 350 deg C for 2 h in H2 flow. Typically, 50 mg of catalyst particles (0.5-1.0 mm) was diluted with 200 mg of SiC particles (0.2 mm) to achieve isothermal plug flow conditions. Gas chromatography (GC) was used for online product analysis (C1-C20) and to establish weight selectivities toward methane (C1) and toward products with chain length of 5 and higher (C5+). Catalysts were measured atmospherically at a CO conversion of 2%, which was achieved by tailoring the space velocity. For the high-pressure measurements, 0.25 g of catalyst (150-212 um) was diluted with 0.5-0.7 g of SiC. Catalytic data were obtained at 210 and 250 deg C and a pressure of 35 bar using a flow of CO/H2/N2 (33/66/6). The space velocity was adjusted to maximize CO conversions at 60-80%. Both on-line and off-line product analyses were performed with GC. Reported catalytic data are obtained after at least 3 days of operation.
Individual Particle Diameters Tested (nm):
No data
Solution characteristics (pH, cosolvents or other additives, sonication, ionic strength)
• pH: 8 (HDP method); 11.2 (anion adsorp on method)• Cosolvents or other addi ves: None• Sonica on: Not performed• Ionic strength (conduc vity): No data
Min Diameter Tested (nm): 2.6
Max Diameter Tested (nm): 27
Specific Surface Area (SSA) (m2/g): No data
Bulk materials tested (≥ 1000 nm): No
Information on Analytical Methods Used to Determine Particle Size:
Four techniques were used to determine the cobalt particle sizes of the catalysts because all have their limitations: 1) calculation from hydrogen chemisorption; 2) quantitative XPS to measure the cobalt dispersion (the Co/C atomic ratios varied from 0.0034 to 0.047, from which cobalt particle sizes varying from 2.6 to 27 nm were obtained); 3) transmission electron microscopy (TEM); and 4) Extended X-ray absorption fine structure (EXAFS).
List of Relevant Findings: • The catalytic performance in the Fischer-Tropsch reaction was independent of cobalt particle size for catalysts with sizes larger than 6 nm (1 bar) or 8 nm (35 bar), but both activity and selectivity were strongly affected for
catalysts with smaller cobalt par cles.• At 1 bar, the turnover frequency (TOF) was constant from ca. 6 nm to ca. 27 nm. Below 6 nm, the TOF decreased from 10^-2/s to 10^-3/s for IWA1.• At 35 bar, the TOF decreased from
23E-03 to 1.4E-03/s when the particle size was decreased from 16 to 2.6 nm. The TOF decreased sharply below a particle diameter of 8 nm. It is interesting to note that the catalytic data obtained at 1 bar were in good agreement with data at high pressure.
Page B-17 of 177
Appendix B: Copy of DatabaseSize versus Effect Relationship Observed by Authors?:
Yes
Mathematical Relationship Identified in Paper (if applicable):
None
Author‐Identified 'Bright Line' Particle Size (diameter) Threshold (nm) ‐ List if applicable:
6 - 8
Notes on 'Bright Line' Threshold: Below particle sizes of 6-8 nm, the activity and TOF of carbon nanofiber-supported cobalt catalysts sharply increases. From ca. 6-8 nm to 27 nm, the activity and TOF remains roughly the same.
ARCADIS Discussion of Results None
Nature of Size versus Effect Relationship (if applicable)
The activity and TOF of cobalt catalysts increases with decreasing particle size below 6 - 8 nm.
Physico‐chemical Property Investigated:
Photocatalytic activity
Priority of Property: High
Relevant for A1 Project?: Yes
Type of nanomaterial (eg, nanometal, nanometal oxide):
Nanometal
Particle Functionalization or Capping Agent (if applicable):
None
List Study Objective(s) Relevant to Investigated Physicochemical Property:
• The main goal of the present work is to elucidate the relationship between the nanoparticle size and the photocatalytic activity for phenol in presence and absence of fluoride ion.
Calza et al. (2007)
Specific Details on Tested Nanomaterial(s)
• Titanium dioxide (TiO2)
Details on Preparation Method of Nanomaterial(s):
• Titanium dioxide nanoparticles were prepared by hydrolysis of titanium(IV)-isopropoxide and subsequent heat treatment.• The resul ng TiO2 precipitate was centrifuged (30 min, 4000 rpm) and washed twice with Milli-Q
water. The solid phase was re-dispersed in distilled water, and it was dialyzed in Milli-Q water till the conductivity of the outer phase reached 20 mS/cm in equilibrium. Finally the purified TiO2 was collected and dried at 50 C in a
hotbox oven.• Some par cles were autoclaved to make the par cles larger and increase their crystallinity. This procedure was repeated with different aliquots in separate experiments at 125 and 150 deg C resulting in three different samples (SGHT100, SGHT125 and SGHT150). Subsequent to the heat treatment the samples were dried at 50 deg C and the X-ray diffractograms were recorded.
Details on Tests Examining Physicochemical Property:
• Aqueous solution of phenol was used for the photocatalytic characterization of sol–gel prepared TiO2 in absence and presence of sodium fluoride (NaF). Irradiation was carried out in cylindrical Pyrex glass cells on 5 mL of the suspension containing the catalyst. Using a 1500 W Xenon lamp AM1 solar light and equipped with a 340 nm cut-off filter. The pH 3.6 value was adjusted with diluted HClO4 or HF solutions in fluoride free and fluoride containing
experiments, respec vely.• The disappearance of the primary compound (phenol) and the intermediates evolution with time were followed using high performance liquid chromatography (HPLC).
Individual Particle Diameters Tested (nm):
3.7, ca. 5.4, ca. 6.4, 7.8
Solution characteristics (pH, cosolvents or other additives, sonication, ionic strength)
• pH: 1.25 - 4 (prepara on of TiO2); 3.6 (during irradia on experiments)• Cosolvents or other addi ves: Sodium fluoride• Sonica on: Not performed• Ionic strength (conduc vity): No data
Page B-18 of 177
Appendix B: Copy of DatabaseMin Diameter Tested (nm): 3.7
Max Diameter Tested (nm): 7.8
Specific Surface Area (SSA) (m2/g): No data
Bulk materials tested (≥ 1000 nm): No
Information on Analytical Methods Used to Determine Particle Size:
The particle diameter of anatase nanoparticles were calculated from the line broadening of the anatase reflection (101, 25.3 deg (2theta)) obtained from X-Ray diffractograms.
List of Relevant Findings: • A good correlation between the particle size and the rate of disappearance of phenol exists both in presence and absence of fluoride ions. The rate of phenol decomposition is increased with the growing particle size. The catalytic activity was not further improved by calcination in the presence of fluoride ions. Although the calcined TiO2 contains particles with a larger diameter (8.5 nm), the enhancement of catalyst photoactivity is partially limited by
the increased amount of the ru le phase.• The highest efficiency is shown by TiO2 fluorinated and crystallized by hydrothermal heat treatment at 150 deg C, with particle diameter of 7.8 nm. However, this reaction rate was only 20% of the observed reaction rate for Degussa P25 photocatalyst (30 nm) under the same conditions probably due to the particle aggregation (the suspension had much higher transparency at former case causing incomplete
absorp on of UV light, 0.01, w/v%).• The tania nanopar cles crystallized by hydrothermal heat treatment showed higher photocatalytic activity compare to the non heat treated samples. The bigger particle size achieved was coupled with better crystallinity, resulting in better catalytic performance.
Size versus Effect Relationship Observed by Authors?:
Yes
Mathematical Relationship Identified in Paper (if applicable):
None
Author‐Identified 'Bright Line' Particle Size (diameter) Threshold (nm) ‐ List if applicable:
None
Notes on 'Bright Line' Threshold: The reaction rate for the photocatalytic degradation of phenol by TiO2 nanoparticles was found to increase with increasing particle size over the range of 3.7 to 7.8 nm. No 'bright line' particle size threshold can be inferred from this study.
ARCADIS Discussion of Results None
Nature of Size versus Effect Relationship (if applicable)
Increased photodegradation of phenol with increasing TiO2 particle size.
Physico‐chemical Property Investigated:
Reactivity
Priority of Property: High
Relevant for A1 Project?: Yes
Type of nanomaterial (eg, nanometal, nanometal oxide):
Nanometal
Particle Functionalization or Capping Agent (if applicable):
Dodecanethiol
List Study Objective(s) Relevant to Investigated Physicochemical Property:
• To investigate the variation in the electrochemical properties with size for silver nanoparticles protected with dodecanethiol in aqueous medium.
Chaki et al. (2004)
Specific Details on Tested Nanomaterial(s)
• Silver (Ag)• dodecanethiol-capped
Page B-19 of 177
Appendix B: Copy of DatabaseDetails on Preparation Method of Nanomaterial(s):
• Aqueous AgNO3 solution was reduced by an aqueous solution of NaBH4 in the presence of dodecanethiol (DDT) in toluene under vigorous stirring. A yellow color which initially appeared in the aqueous layer gradually changed to
dark brown in the organic layer.• Different sized par cles were obtained by tuning the reac on temperature and the metal salt to DDT ra o.• Par cles were concentrated under vacuum using a rotary pump and precipitated by
the addition of acetonitrile, and the resultant brown powder was collected by centrifugation. All the samples were further redispersed in toluene for all solution phase investigations.
Details on Tests Examining Physicochemical Property:
• In order to understand the electrochemical behavior of these differently sized silver clusters, samples were drop casted on a Pt disc electrode from toluene dispersions and dried at room temperature in air prior to cyclic voltammetric experiments.
Individual Particle Diameters Tested (nm):
2, 2.6, 3.3, 4.7, 7.2
Solution characteristics (pH, cosolvents or other additives, sonication, ionic strength)
• pH: No data• Cosolvents or other addi ves: toluene• Sonica on: Not performed• Ionic strength (conductivity): No data
Min Diameter Tested (nm): 2
Max Diameter Tested (nm): 7.2
Specific Surface Area (SSA) (m2/g): No data
Bulk materials tested (≥ 1000 nm): No
Information on Analytical Methods Used to Determine Particle Size:
Particle sizes were determined by transmission electron microscopy (TEM).
List of Relevant Findings: • In order to understand the effect of particle size on the electrochemical behavior of DDT capped Ag nanoparticles, we correlated the separation between anodic and cathodic peak potentials (delta-Ep) and E1/2 with size. An increase of delta-Ep with increase in size is clear until a maxima is reached corresponding to 3.5 to 6 nm.
Size versus Effect Relationship Observed by Authors?:
Yes
Mathematical Relationship Identified in Paper (if applicable):
None
Author‐Identified 'Bright Line' Particle Size (diameter) Threshold (nm) ‐ List if applicable:
3.5 - 6
Notes on 'Bright Line' Threshold: A maximum catalytic activity was observed for particles of 3.5 to 6 nm.
ARCADIS Discussion of Results None
Nature of Size versus Effect Relationship (if applicable)
The separation between oxidation and reduction peaks (delta-Ep) increases with an increase in size reaching a maximum (3.5–6 nm) followed by a decline.
Physico‐chemical Property Investigated:
Crystalline structure (structure)
Priority of Property: High
Relevant for A1 Project?: Yes
Type of nanomaterial (eg, nanometal, nanometal oxide):
Nanometal alloy
Particle Functionalization or Capping Agent (if applicable):
Coated with a monolayer of surfactant, tri-n-octyl phosphine oxide.
List Study Objective(s) Relevant to Investigated Physicochemical Property:
• In this study the researchers investigated the kinetics of the four- to six-coordinate transformation from the wurtzite to rock-salt structure in CdSe and CdS nanocrystals.
Chen et al. (1997)
Specific Details on Tested Nanomaterial(s)
• Cadmium selenide (CdSe) nanocrystals, in a wurtzite crystal structure and a faceted, hexagonal shape with an aspect ra o of 1.1:1, coated with a monolayer of surfactant, tri-n-octyl phosphine oxide. •
Cd(32)S(14)(SC(6)H(5))(36) x DMF(4)(DMF = N,N-dim
Page B-20 of 177
Appendix B: Copy of DatabaseDetails on Preparation Method of Nanomaterial(s):
• No data
Details on Tests Examining Physicochemical Property:
•The transformations were investigated as a function of pressure (0 to 13 Gpa) and temperature (300 to 500 K) by x-ray powder diffraction and optical absorption.
Individual Particle Diameters Tested (nm):
1.5, 2.3, 4.3
Solution characteristics (pH, cosolvents or other additives, sonication, ionic strength)
• pH: No data• Cosolvents or other addi ves: ethylcyclohexane • Sonica on: Not performed• Ionic strength (conductivity): No data
Min Diameter Tested (nm): 1.5
Max Diameter Tested (nm): 4.3
Specific Surface Area (SSA) (m2/g): --
Bulk materials tested (≥ 1000 nm): No
Information on Analytical Methods Used to Determine Particle Size:
No data
List of Relevant Findings: • These experiments focused on the size evolution of the kinetic barriers to structural transformations in defect free solids. At very small sizes, the barriers are small, as in many molecular isomerizations, and the kinetics are dominated by the interface contribution. This is clearly the case for the Cd32S50 (1.5 nm in diameter) clusters. As the nanocrystals increase in size, the barriers become substantially larger, and a volume, or interior, contribution
dominates.• There is an op mal size to achieve metastability in a solid. This op mal size will depend on the largest size at which single nanocrystals can be prepared defect-free and also on the judicious choice of
interface.• Nanocrystals undergo solid-solid phase transi ons by single nuclea on events, because the me required for propagation of a phase front across a distance of nanometers is less than the time separation between successive nucleation events in one crystallite.
Size versus Effect Relationship Observed by Authors?:
Yes
Mathematical Relationship Identified in Paper (if applicable):
None
Author‐Identified 'Bright Line' Particle Size (diameter) Threshold (nm) ‐ List if applicable:
None
Notes on 'Bright Line' Threshold: An increase in the activation energy required for the phase transition of CdSe from wurtzite to rock salt occurred as a function of particle size over the range of 1.5 to 4.3 nm; however, a 'bright line' particle size threshold cannot be determined from these data.
ARCADIS Discussion of Results Examined phase change at elevated temperature and pressure, not necessarily representative of environmental condi ons.A larger range of sizes may have revealed a 'bright line' par cle size for structural transi on.
(Authors' basic premise that crystalline phase transition can occur more readily (and is easier to study) at nano scale due to lack of kinetic limitations and limited interference from crystalline defects.)
Nature of Size versus Effect Relationship (if applicable)
At a constant pressure, the activation energy required for phase transition from wurtzite to rock salt increased with increasing particle size.
Physico‐chemical Property Investigated:
Reactivity
Priority of Property: High
Relevant for A1 Project?: Yes
Type of nanomaterial (eg, nanometal, nanometal oxide):
Nanometal
Particle Functionalization or Capping Agent (if applicable):
None
List Study Objective(s) Relevant to Investigated Physicochemical Property:
• To investigate the size-dependence of the (bio)chemical reactivity of hematite.
Chernyshova et al. (2010)
Specific Details on Tested Nanomaterial(s)
• Hematite (alpha-iron (III) oxide) (Fe2O3)
Page B-21 of 177
Appendix B: Copy of DatabaseDetails on Preparation Method of Nanomaterial(s):
• Hematite NPs of mean TEM sizes of 7, 9, 30, 38, 45, 60, and 120 nm were synthesized by forced hydrolysis, while 150 nm hematite was purchased.
Details on Tests Examining Physicochemical Property:
• UV-Vis absorption spectra were measured on suspensions of NPs in TDW using Lambda-25 (Perkin-Elmer) spectrophotometer at the scan speed of 120 nm min 1 and a 1 nm slit. Spectra were run immediately after
sonica ng the suspensions for 1 h, in 1 cm quartz cuve es.• XPS spectra were collected with a Perkin-Elmer PHI 5500 instrument using monochromatic AlKa X-rays with pass energies of 17.6 eV at resolution of 0.9 eV, at take-off angle of 451, at pressures of less than 1E+08 Torr, calibrated using the Ag 3d peak. Scans of X-ray induced Auger peaks were performed at 0.1 eV steps. All samples were prepared by spreading a thin layer of an aqueous suspension of NPs on a UHV metallic holder followed by air-drying.
Individual Particle Diameters Tested (nm):
7, 9, 30, 38, 45, 60, 120
Solution characteristics (pH, cosolvents or other additives, sonication, ionic strength)
• pH: No data• Cosolvents or other addi ves: No data• Sonica on: Not performed• Ionic strength (conductivity): Not applicable
Min Diameter Tested (nm): 7
Max Diameter Tested (nm): 120
Specific Surface Area (SSA) (m2/g): 154.4, 128.3, 56.1, 37.0, 53.8, 65.7, 10.0 and 9.5
Bulk materials tested (≥ 1000 nm): No
Information on Analytical Methods Used to Determine Particle Size:
The NPs were characterized by transmission electron transmission microscopy (TEM), X-ray diffraction (XRD), and BET surface area measurements.
List of Relevant Findings: • Both the direct and indirect band gaps decrease with increasing NP size. The slope of both the dependences abruptly increases at H150, which is due to the optical distortions. As expected, the direct band gap is much more sensitive to NP size than both the indirect band gap and the deflection point since the latter two approximate energy of the double exciton process (DEP) transition. The obtained values of the direct band gap are 2.18–2.95 eV
for NPs of 120 nm size and smaller.• The lower overlap of the Fe 3d and O 2p orbitals in smaller hema te NPs probably stems from an increase in concentration of iron vacancies, which is accompanied by an increase in the a and c cell parameters, lattice disorder, and relaxation of trigonal distortion of the Oh symmetry of ferric
octahedra.• An addi onal contribu on to the opening of the Fe 3d O 2p band gap is expected from a lower number of Fe atoms that coordinate to the O atom, which decreases the available unoccupied density of states (available from empty Fe 3d bands).
Size versus Effect Relationship Observed by Authors?:
Yes
Mathematical Relationship Identified in Paper (if applicable):
None
Author‐Identified 'Bright Line' Particle Size (diameter) Threshold (nm) ‐ List if applicable:
120 < Threshold < 150
Notes on 'Bright Line' Threshold: The decrease in band gap decreases with increasing particle size from 7 to 150 nm, with a significant increase in this rate of band gap decrease occurring between NPs with particle size of 120 and 150 nm.
ARCADIS Discussion of Results Decreasing the band gap with increasing size can increase the particle reactivity. To paraphrase the authors, the decrease in the band gaps and lower energy of the valence band edges with increasing particle size imply a higher electron affinity of larger hematite nanoparticles. Higher electron affinity makes larger nanoparticles stronger electron acceptors from reducing species. Along with the lower mobility of charge carriers, this effect causes a decrease in the oxidative catalytic activity of hematite with decreasing size. The nanoparticle-driven destabilization of energy of the conduction and valence bands observed in this study is also consistent with the degradation of photocatalytic properties of hematite with decreasing particle size.
Nature of Size versus Effect Relationship (if applicable)
The band gap decreases with increasing particle size.
Page B-22 of 177
Appendix B: Copy of Database
Physico‐chemical Property Investigated:
Reactivity
Priority of Property: High
Relevant for A1 Project?: Yes
Type of nanomaterial (eg, nanometal, nanometal oxide):
Nanometal oxide
Particle Functionalization or Capping Agent (if applicable):
None
List Study Objective(s) Relevant to Investigated Physicochemical Property:
• To study the effect of size on the catalytic oxygenation of Mn(II) in the presence of hematite (alpha-Fe2O3) NPs.
Chernyshova et al. (2011)
Specific Details on Tested Nanomaterial(s)
• Hematite (alpha-Fe2O3)
Details on Preparation Method of Nanomaterial(s):
• Highly monodisperse and highly pure hematite nanoparticles of three different average sizes were synthesized by forced hydrolysis. All the NPs have similar aspect ratio ranging from 1 to 2.
Details on Tests Examining Physicochemical Property:
• Batch measurements of kinetics of heterogeneous Mn(II) oxidations were run either in 0.04 M HEPES buffer or 0.001 M NaCl. pH was preset by NaOH (Fisher) and equilibrated overnight upon stirring. Experiments in a 0.04 M HEPES were conducted at constant pH of 7.40 for all hematite NPs. All the batch experiments were run under the same stirring conditions for 6–8 h, at room temperature of 23 ± 2 deg C, in high-density opaque polyethylene flasks covered with aluminum foil to prevent photolysis. Aliquots of the test suspension were withdrawn at regular time
intervals and analyzed for concentra on of Mn2+ ions using UV–Vis spectrophotometry.• In situ FTIR spectroscopic measurements were performed on the NPs deposited onto a ZnSe internal reflection element in a 10^-2 M carbonate buffer. A particulate film of NPs was deposited and air-dried and rinsed several times with water to remove any loose or detached particles. The layer was equilibrated for at least 1 h with the buffer being changed manually every 10 min. Afterward, a fresh portion of the buffer was added and the background spectrum was measured. Then, the buffer was replaced with the buffer containing Mn(II). The sample spectra were measured for 5–6 h at ~1-h time intervals. The Mn(II) solution in the cell was refreshed after 1 and 2 h from the start. The spectra were collected at 300 scans at a resolution of 4 cm^-1 and represented in the absorbance scale. To determine the oxidation state of sorbed Mn(II) as well as to quantify adsorption density of manganese, samples collected after the batch and in situ FTIR experiments were analyzed by XPS. Regional XPS scans from 10 to 50 eV windows widths were collected at 0.1 eV steps. The Mn/Fe atomic concentration ratios were evaluated using the Mn 2p3/2 and Fe 2p3/2 peaks and PHI atomic sensitivity factors.
Individual Particle Diameters Tested (nm):
7, 9, 38, 150
Solution characteristics (pH, cosolvents or other additives, sonication, ionic strength)
• pH: 7.4• Cosolvents or other addi ves: None• Sonica on: Not performed• Ionic strength (conduc vity): No data
Min Diameter Tested (nm): 7
Max Diameter Tested (nm): 150
Specific Surface Area (SSA) (m2/g): 180, 154.4, 128.3, 37.0, 9.5
Bulk materials tested (≥ 1000 nm): No
Information on Analytical Methods Used to Determine Particle Size:
The nanoparticles were extensively characterized by transmission electron microscopy (TEM), X-ray diffraction (XRD), X-ray photoelectron spectroscopy (XPS), and UV–Vis spectroscopy measurements.
List of Relevant Findings: • The normalized pseudo-first order rate constant of the reaction, k(obs), decreases with decreasing NP size (the reaction rate of the catalytic Mn(II) oxygenation decreases with decreasing NP size). The slowing down of the redox reaction causes reduction of hematite NP. The reason for the opposite trend reported in the literature can be
differences in the pH values naturally established in unbuffered suspensions of different catalysts.• Smaller nanoparticles are also characterized by lower surface concentration of manganese sorbed during the first 30–60 min. As this time interval is typical for the Mn(II) sorption on ferric hydroxides this fact indicates that larger hematite NPs have higher sorption capacity.
Page B-23 of 177
Appendix B: Copy of DatabaseSize versus Effect Relationship Observed by Authors?:
Yes
Mathematical Relationship Identified in Paper (if applicable):
None
Author‐Identified 'Bright Line' Particle Size (diameter) Threshold (nm) ‐ List if applicable:
None
Notes on 'Bright Line' Threshold: The normalized pseudo-first order rate constant increased with increasing particle size of the hematite nanoparticles. A large increase in this rate constant was observed between 38 and 150 nm hematite particles; however, the relationship appears to be linear in nature. Therefore, a 'bright line' particle size threshold cannot be determined from these data.
ARCADIS Discussion of Results None
Nature of Size versus Effect Relationship (if applicable)
The catalytic reaction rate for the oxygenation of Mn(II) decreases with decreasing particle size of the catalyst.
Physico‐chemical Property Investigated:
Water solubility
Priority of Property: High
Relevant for A1 Project?: Yes
Type of nanomaterial (eg, nanometal, nanometal oxide):
Nanometal
Particle Functionalization or Capping Agent (if applicable):
Citrate
List Study Objective(s) Relevant to Investigated Physicochemical Property:
• The physical and chemical properties of four different silver particle preparations were characterized and their hemolytic properties in dilute human blood were evaluated using a test protocol described in the new consensus
ASTM standard E2524-08-Standard Test Method for Analysis of Hemoly c Proper es of Nanopar cles.• In addition, the rate of dissolution among citrate-stabilized and non-citrate-stabilized nAg and non-stabilized microparticulate Ag was investigated.
Choi et al. (2011)
Specific Details on Tested Nanomaterial(s)
• Silver (Ag) nanoparticles and microparticles
Details on Preparation Method of Nanomaterial(s):
• Two suspensions of nanoscale silver particles citrate stabilized <100 nm nAg and ~35 nm nAg at a concentration of 20 mg/mL were prepared by dispersion of the powders in deionized sterile water using an ultrasonic cleaner for
10 min. Dispersions were prepared in glass vials as the stabilized nAg adhered to plas c vials.• Similarly, two aqueous suspensions of microscale particles were also prepared from dry powders, d = 2000-3500 nm, and heat-treated Ag-microparticles, which consisted of citrate-stabilized nAg that had agglomerated after being dry heat
treated (300 deg C, 10 min) to remove the surface-bound citrate).• As the larger silver par cles were not well dispersed and quickly sank in water, dilutions were prepared using large bore pipette tips to quickly withdraw aliquots from mixed samples. The three commercially available particles had labeled silver purity of 99.5%.
Details on Tests Examining Physicochemical Property:
• To determine silver ion release rate, multiple vials containing fresh particle suspensions in water were incubated in a water bath at 37 deg C for 210 min. At 30-min intervals, one vial for each particle type was removed from the
bath and centrifuged at 10,000 g for 10 min to remove par cles from the solu on.• The silver ion concentra on was determined for each supernatant using a pH/ISE meter equipped with a silver/sulfide ion-selective electrode that had been calibrated against a dilution series of AgNO3 solutions. The free silver ion concentration in particle suspensions made in Ca2+/Mg2+-free DPBS could not be measured with the ion-selective electrode because silver ions were binding with free chloride ions in DPBS to form insoluble precipitates.
Solution characteristics (pH, cosolvents or other additives, sonication, ionic strength)
• pH: No data• Cosolvents or other addi ves: None• Sonica on: Suspensions were sonicated for 10 min to create dispersions prior to tes ng.• Ionic strength (conduc vity): No data
Page B-24 of 177
Appendix B: Copy of DatabaseMin Diameter Tested (nm): 21
Max Diameter Tested (nm): 800-3000
Specific Surface Area (SSA) (m2/g): No data
Bulk materials tested (≥ 1000 nm): No
Information on Analytical Methods Used to Determine Particle Size:
• Transmission electron microscopy (TEM)was performed to characterize the par cles. A drop of silver par cle suspension in water was deposited on a TEM carbon grid and was allowed to dry at ambient temperature.• To
complement the size analysis of dried particle suspensions performed by TEM, the hydrodynamic sizes of the particles in water were measured by DLS. (Due to limitations in the DLS size analysis from time-dependent agglomeration, particle settling, and polydispersity when exposed to the different suspension media (i.e., water, DPBS, and DPBS with plasma), the DLS results should only be used to make qualitative comparisons between the particle suspensions.)
List of Relevant Findings: • In water, citrate-stabilized nAg was well-dispersed while non-citrate-stabilized nAg was slightly less well-dispersed. Microparticles (non-citrate-stabilized and heat-treated to remove the citrate cap) quickly fell out of
solu on.• Silver ion release measurements were obtained at 30-min intervals from the Ag par cles incubated in water at concentrations of 220 ug/mL. Particles were incubated in 37 deg C water for 3.5 h to simulate the conditions of the hemolysis assay. The rate of silver ion release from the nanoparticles was linear over the first 150 min and was much higher (up to three orders of magnitude based on an equivalent mass concentration basis) than from the micron-sized particles. It was expected that the ion release would increase proportionally with particle surface area, and therefore, the nanoparticles would have a higher release rate than the micron-sized particles.
Size versus Effect Relationship Observed by Authors?:
Yes
Mathematical Relationship Identified in Paper (if applicable):
None
Author‐Identified 'Bright Line' Particle Size (diameter) Threshold (nm) ‐ List if applicable:
None
Notes on 'Bright Line' Threshold: The rate of dissolution of nAg particulate (21 and 111 nm) was up to three times greater than for Ag microparticulate (800-3000, 10-2000 nm). Derivation of a 'bright line' particle size threshold is not possible based on the these data.
ARCADIS Discussion of Results Microparticulate particle diameters determined to have minimum size ranges of 10 nm (heat treated), which is consistent with diameters of nanoparticulate. The paper mentions to not use DLS measurements for comparison of particle sizes; therefore, we do not have reliable particle diameter data for the heat-treated Ag microparticulate.
Nature of Size versus Effect Relationship (if applicable)
The rate of dissolution was up to three orders of magnitude greater for nanoparticulate compared to microparticulate of Ag.
Physico‐chemical Property Investigated:
Crystalline structure (structure)
Priority of Property: High
Relevant for A1 Project?: Yes
Type of nanomaterial (eg, nanometal, nanometal oxide):
Nanometal oxide
Particle Functionalization or Capping Agent (if applicable):
None
List Study Objective(s) Relevant to Investigated Physicochemical Property:
• In this paper, we consider why a high temperature polymorph is found to be stable in as prepared nanocrystalline zirconia par cles which are smaller than a certain cri cal size.• Secondly, annealing experiments resul ng in
coarsening are presented and the consequent phase transformation and its influence on the particle size distribution character are discussed.
Chraska et al. (2000)
Specific Details on Tested Nanomaterial(s)
• Zirconium dioxide (ZrO2) - zirconia
Page B-25 of 177
Appendix B: Copy of DatabaseDetails on Preparation Method of Nanomaterial(s):
• Nanocrystalline powders of pure ZrO2 were prepared by liquid thermal spray synthesis using a modified conventional atmospheric plasma spray torch. The injector, which works on the two-fluid atomization principle with nitrogen as the atomizing gas, produces atomized droplets of the liquid organo-metallic precursor and injects
it into the high pressure plume of the plasma jet.• An electrosta c precipitator (ESP) consis ng of a pair of polished stainless steel plates (100 100 2 mm) separated by a 10 mm thick ceramic insulator is placed parallel to the trajectory of the spray jet. An electric field of 6 kV cm 1 was applied in the ESP so that the spray particles could
be collected on the plates by electrophoresis.• A volume of 20 mL of 80 wt.% zirconium butoxide in n-butanol was diluted with 300 mL of n-butanol to obtain the 2.4 wt.% zirconia liquid precursor. The liquid feed rate was maintained at 6.8 mL/min. The stand-off distance of both the ESP plate edge or the substrate from the torch nozzle was maintained on 100 mm. The collected powder was then annealed at 500 or 900 deg C for 1 or 2 h in air and slowly cooled down in the furnace. Both annealing temperatures are set below the first transformation temperature for coarse-grained ZrO2.
Details on Tests Examining Physicochemical Property:
• The phase composition of the powder specimens was established by X-ray diffraction (XRD) with Cu-Ka radiation and by selected area electron diffraction SAED.
Individual Particle Diameters Tested (nm):
• Powder: 2-15• Annealed at 500 deg C: 5-18• Annealed at 900 deg C: <20
Solution characteristics (pH, cosolvents or other additives, sonication, ionic strength)
• pH: No data• Cosolvents or other addi ves: A volume of 20 ml of 80 wt.% zirconium butoxide in n-butanol was diluted with 300 ml of n-butanol to obtain the 2.4 wt.% zirconia liquid precursor.• Sonica on: Prior to tes ng,
small quan es (0.001 g) of the annealed nanopowders were dispersed ultrasonically inpropanol and then allowed to se le on carbon coatedcopper grids for inves ga on by transmission electronmicroscopy (TEM).•
Ionic strength (conductivity): No data
Min Diameter Tested (nm): 2
Max Diameter Tested (nm): 18
Specific Surface Area (SSA) (m2/g): No data
Bulk materials tested (≥ 1000 nm): No
Information on Analytical Methods Used to Determine Particle Size:
XRD line profile analysis was carried out to estimate the average particle size using integral breadth analysis.
List of Relevant Findings: • For particles annealed at 500 deg C for 1 h (size range: 5 - 18 nm), the relative abundance of monoclinic phase is less than 5% as determined by XRD. For particles annealed at 900 deg C for 1 h (average size = 9.5 nm, maximum size < 20 nm), approximately 70% of the zirconia powder transformed to the monoclinic phase with 30% tetragonal. After annealing at 900 deg C (average grain size = 137 nm) for 2 h all nanoparticles have transformed to monoclinic
phase with no tetragonal zirconia par cles remaining.• Upon annealing, the zirconia par cles coarsen and undergo a phase transformation when the particle size is of the order of 18 nm, for reasons associated with the surface energy, and the occurrence of this phase transformation produces a sudden change in the driving force for coarsening.
Size versus Effect Relationship Observed by Authors?:
Yes
Mathematical Relationship Identified in Paper (if applicable):
None
Author‐Identified 'Bright Line' Particle Size (diameter) Threshold (nm) ‐ List if applicable:
18
Notes on 'Bright Line' Threshold: The critical size, up to which the tetragonal phase is stable, is 18 nm.
ARCADIS Discussion of Results None
Nature of Size versus Effect Relationship (if applicable)
Stabilization of high temperature tetragonal phase in nanocrystalline zirconia particles of small (<18 nm) diameter.
Page B-26 of 177
Appendix B: Copy of Database
Physico‐chemical Property Investigated:
Reactivity
Priority of Property: High
Relevant for A1 Project?: Yes
Type of nanomaterial (eg, nanometal, nanometal oxide):
Nanometal
Particle Functionalization or Capping Agent (if applicable):
Polymer encapsulated
List Study Objective(s) Relevant to Investigated Physicochemical Property:
• The size-dependence of Au NP activity in both the catalytic product formation reaction and the product dissocia on reac on was examined.• The size-dependence of Au NP selec vity in the two parallel product
dissocia on pathways, and of their surface-restructuring-coupled cataly c dynamics is examined.• The size-dependence of Au NP surface-restructuring-coupled catalytic dynamics is examined.
Cuenya et al. (2003)
Specific Details on Tested Nanomaterial(s)
• Gold (Au)
Details on Preparation Method of Nanomaterial(s):
• A 0.5 wt % solution of the diblock copolymer PS(x)-b-P2VP(y) was prepared in 5 mL of toluene and stirred for 4 h. Later, a fixed ratio of the metal precursor (HAuCl4.3H2O, 7.4 mg) per pyridine unit (0.6/1 ratio) was added to the solution under nitrogen in a glovebox and stirred for 48 h. The AuCl4-ions were bound as counter ions to the pyridine units of the polar core of the micelles. A relative gold/2VP ratio of 0.6/1 was held constant throughout, and different cluster sizes were obtained by changing the size of the polymer head.
Details on Tests Examining Physicochemical Property:
• Electrocatalytic CO oxidation measurements of Au nanoparticles coated on indium tin oxide (ITO) were performed (after polymer removal by oxygen plasma) in 30 mL of 0.5 M KOH solution. A gas sealed electrochemical
cell was used to conduct the CO electrooxida on experiments.• The cell housed three electrodes (sample working electrode, Pt mesh counter electrode, and Ag/AgCl reference electrode). The inlet reactant gas passed through an immersed tube capped by a gas-diffusion frit to facilitate gas-liquid saturation. The 0.5 M KOH solution was
saturated with 99.998% N2 for 15 min with light s rring prior to the first cyclic voltammogram.• To “ac vate” the Au nanoparticles for electrocatalysis, 30 cyclic voltammograms were then measured from -0.2 to +0.7 V versus the Ag/AgCl reference electrode, at a scan rate of 0.3 V/s. 25 The electrolyte was subsequently saturated with 99.5% CO for 20 min. Sixty cyclic voltammograms were then measured for CO electrooxidation, from -0.4 to +0.8 V versus the reference electrode at a rate of 0.3 V/s.
Individual Particle Diameters Tested (nm):
11.5, 14, 27.5
Solution characteristics (pH, cosolvents or other additives, sonication, ionic strength)
• pH: No data• Cosolvents or other addi ves: toluene • Sonica on: Not performed• Ionic strength (conductivity): Not applicable
Min Diameter Tested (nm): 11.5
Max Diameter Tested (nm): 27.5
Specific Surface Area (SSA) (m2/g): No data
Bulk materials tested (≥ 1000 nm): No
Information on Analytical Methods Used to Determine Particle Size:
The size, order, and dispersion of the Au nanoparticles produced by the micellar block copolymer synthesis method were characterized before and after oxygen plasma treatment by atomic force microscopy (AFM, Digital Instruments D-3000) operating in tapping mode (noncontact), and by a transmission electron microscope (TEM, JEOL 2000 FX).
List of Relevant Findings: • The smallest particles yielded the largest current densities for CO oxidation, approximately 135 uA/cm^2 after 60 IV scans, as compared to the medium and large particles that resulted in current densities of approximately 106 and 63 uA/cm^2, respectively. A thick bulk Au film prepared by PVD and measured under similar conditions
showed no ac vity for CO oxida on• The high ac vity for CO oxida on displayed by the 1.5 nm nanopar cles as compared to the 4.0 and 6.0 nm particles may be a result of two factors: (1) size effects (resulting in a lower coordination number for surface atoms), and (2) stabilization of the Au3+- oxide on the surface.
Page B-27 of 177
Appendix B: Copy of DatabaseSize versus Effect Relationship Observed by Authors?:
Yes
Mathematical Relationship Identified in Paper (if applicable):
None
Author‐Identified 'Bright Line' Particle Size (diameter) Threshold (nm) ‐ List if applicable:
None
Notes on 'Bright Line' Threshold: Increased oxidation of CO occurred for the smallest Au clusters (1.5 nm) with oxidation decreasing in a size-dependent manner for larger clusters. However, inference of a 'bright line' threshold is not possible based on these results.
ARCADIS Discussion of Results None
Nature of Size versus Effect Relationship (if applicable)
The current density increased with decreasing particle size.
Physico‐chemical Property Investigated:
Photocatalytic activity
Priority of Property: High
Relevant for A1 Project?: Yes
Type of nanomaterial (eg, nanometal, nanometal oxide):
Nanometal sulfide
Particle Functionalization or Capping Agent (if applicable):
Thiophenol capped
List Study Objective(s) Relevant to Investigated Physicochemical Property:
• To investigate the size-dependency of photocatalytic activity of thiol-capped CdS nanoparticles on the nitroaromatics.
Datta et al. (2008)
Specific Details on Tested Nanomaterial(s)
• Cadmium sulfide (CdS)
Details on Preparation Method of Nanomaterial(s):
• Cadmium chloride (CdCl2) and sodium sulfide (Na2S) were used as starting materials. A methanolic solution (50 ml) of Cd2+ ions (2.34 × 10⁻² M) and thiophenol (5.75 × 10⁻² M) was prepared. To this solu on, 0.5 ml alcoholic KOH solution (0.1 M) was added and argon was bubbled through the solution to remove dissolved oxygen. A saturated methanolic solution of Na2S was added to make the final molar ratio of Cd2+:thiophenol:S2−,
1:2.5:0.5.• The solu on thus obtained was centrifuged and the precipitate was washed thoroughly in methanol for 4–5 times. The precipitate was air-dried and stored in vacuum dessicator. Size of the nanoparticles was varied by changing temperature of the reaction mixtures.
Details on Tests Examining Physicochemical Property:
• The photocatalytic degradation were carried out by mixing freshly synthesized sonicated CdS samples with nitroaromatic compounds taken in a quartz cuvette and placed in cell holder in UV–vis spectrophotometer. The samples were irradiated by photons of wavelength 370 nm emanated from 50 W halogen and Deuterium lamp. Photons entered the sample chamber after passing through the grating monochromator and 2.0 nm slit. The absorbed dose rate was determined to be 0.6 mJ s−1 by ferri-oxalate ac nometry following the standard
method.• UV–vis absorp on and photoluminescence measurements were recorded; an excita on wavelength of 370 nm was used when CdS emission at 510 nm was followed (nitroaromatics used in our work had no absorption at this excitation). Fluorescence lifetimes of thiophenol capped CdS nanoparticles both in the absence and in the presence of nitrotoluene were measured using a time-correlation-single-photon-counting (TCSPC) spectrophotometer. The details of the set up are described elsewhere. Room temperature photoluminescence quantum efficiency (PLQE) of the as-prepared NPs was determined by taking quinine sulfate as reference (analytical grade, BDH, 57% PLQE) in 0.1 M H2SO4.
Individual Particle Diameters Tested (nm):
3.8, 4.2, 5.0, 5.8
Solution characteristics (pH, cosolvents or other additives, sonication, ionic strength)
• pH: No data• Cosolvents or other addi ves: methanol• Sonica on: The photocataly c degrada on were carried out by mixing freshly synthesized sonicated CdS samples with nitroaromatic compounds taken in a quartz
cuve e and placed in cell holder in UV–vis spectrophotometer.• Ionic strength (conduc vity): No data
Page B-28 of 177
Appendix B: Copy of DatabaseMin Diameter Tested (nm): 3.8
Max Diameter Tested (nm): 5.8
Specific Surface Area (SSA) (m2/g): No data
Bulk materials tested (≥ 1000 nm): No
Information on Analytical Methods Used to Determine Particle Size:
Sizes of all as-prepared CdS nanoparticles were estimated using absorption onset. Band gap was determined from the absorption onset and the size was calculated from well established correlation of band gap and particle size based on tight binding approximation. Dynamic light scattering (DLS) technique was also used in order to check particle size determined by optical method. The morphology and particle sizes were also confirmed by transmission electron microscopy (TEM).
List of Relevant Findings: • The Stern-Volmer quenching constant (Ksv) values increased considerably from 1.0×10⁴ to 4.0×10⁴ M−1 on moving from 5 nm sized particles to 4.2 nm. However, only a small change in KSV value (5.33 × 10⁴ M−1) was observed when particle size was further lowered to 3.8 nm. The increase in Stern–Volmer quenching constants with decrease in particle size could be explained by considering the change in electronic energy levels of the semiconductor NPs. As the size of nanoparticles decreases, the energy of conduction band shifts to higher energy due to quantum confinement effect. Redox potentials of the conduction band become more negative thereby
enhancing the reducing power with decrease in par cle size.• With decreasing par cle size, the degrada on efficiency increased substantially. On moving down from 5.8 to 3.8 nm sized particles, the catalytic efficiency was quintupled i.e. for a 34% decrease in particle diameter, the reaction rate increases by about 400% (Table 3). In contrast, simple photolysis of nitrotoluene carried out in the absence of CdS NPs by irradiating samples at 370 nm (where, only CdS absorbs) as well as at 265 nm (where, nitrotoluene absorbs) resulted in less than 5% degradation
in each case.• The accelera on rate constant k (Kcat / Kuncat) increased with decreasing par cle size: 8, 18, 24 and 40 for sizes of 5.8, 5.0, 4.2 and 3.8, respectively. Based on extrapolation of the data, it is apparent that catalytic efficiency for CdS particles >6 nm in size (Bohr exciton diameter) will be negligible.
Size versus Effect Relationship Observed by Authors?:
Yes
Mathematical Relationship Identified in Paper (if applicable):
None
Author‐Identified 'Bright Line' Particle Size (diameter) Threshold (nm) ‐ List if applicable:
6
Notes on 'Bright Line' Threshold: For particles greater than 6 nm, photocatalytic efficiency for CdS particles will be negligible.
ARCADIS Discussion of Results None
Nature of Size versus Effect Relationship (if applicable)
The photocatalytic rate constant increased with decreasing particle size.
Physico‐chemical Property Investigated:
Reactivity
Priority of Property: High
Relevant for A1 Project?: Yes
Type of nanomaterial (eg, nanometal, nanometal oxide):
Supported nanometal
Particle Functionalization or Capping Agent (if applicable):
None
List Study Objective(s) Relevant to Investigated Physicochemical Property:
• To investigate the role of the cobalt particle size distribution in the Fischer–Tropsch (FT) reaction for supported Co catalysts.
den Breejen et al. (2010)
Specific Details on Tested Nanomaterial(s)
• Cobalt / carbon nanofiber (Co/CNF)
Page B-29 of 177
Appendix B: Copy of DatabaseDetails on Preparation Method of Nanomaterial(s):
• The CNF support was obtained.• The cobalt catalysts were synthesized using incipient wetness impregna on, in which cobalt loading (0.9–13 wt.%), cobalt precursor (cobalt nitrate or cobalt acetate) and solvent (water or
ethanol) were varied. A er impregna on, the catalysts were dried in air at 120 deg C for 12 h.• The Co/CNF catalysts were reduced at 350 deg C (5 deg C/min) for 2 h in a flow of 33 vol.% hydrogen, which was followed by an oxidation treatment to Co3O4 at room temperature by diffusion of air to the reactor, thereby preventing complete oxidation to Co3O4. This yielded Co/CNF catalysts with various average particle sizes (2.6–11 nm).
Details on Tests Examining Physicochemical Property:
• The Fischer–Tropsch reaction was performed at 220 deg C at 1 bar in a plug-flow reactor with an H2/CO ratio of 2 v/v. Typically, 20 mg catalyst (90–150 um), mixed with 200 mg SiC (200 um), was loaded in the reactor in order to achieve isothermal plug-flow conditions. The calcined catalysts were in situ reduced at temperatures ranging from 350 to 600 deg C, for 2 h, with a ramp of 5 deg C/min in 20 mL/min H2 and 40 mL/min Ar. Online gas chromatography analysis (C1–C16) was performed during the FT reaction to determine the activity and selectivity (wt.%) toward C1 (methane) and C5+ hydrocarbons. The activity was expressed as Cobalt-Time Yield. The reported activity and selectivity data are obtained after at least 20 h of FT synthesis and at 2% CO conversion.
Solution characteristics (pH, cosolvents or other additives, sonication, ionic strength)
• pH: No data• Cosolvents or other addi ves: ethanol• Sonica on: Not performed• Ionic strength (conductivity): No data
Min Diameter Tested (nm): 2.4
Max Diameter Tested (nm): 11.3
Specific Surface Area (SSA) (m2/g): No data
Bulk materials tested (≥ 1000 nm): No
Information on Analytical Methods Used to Determine Particle Size:
Transmission electron microscopy (TEM) and X-ray photoelectron spectroscopy (XPS) were used to determine particle sizes.
List of Relevant Findings: • Based on this TOF–size relationship, it was concluded that the cobalt particle size for maximum CTY is found at 4.5 nm for 0.5 nm bin size. However, as the theoretical optimum particle size depends slightly on the bin size in the
histogram analyses, an overall op mum cobalt par cle size of 4.7 ± 0.2 nm is obtained• The cataly c ac vity for the FT reaction values were: 0.80, 0.93, 1.46, 2.08, 3.51, 2.17, 1.83 and 1.52 for particle sizes of 2.4, 2.8, 3.2, 4.3,
5.7, 6.9, 9.7, 11.3 nm (surface-weighted values), respec vely.• Thus, the maximum value was achieved for a particle size of 5.7 nm.
Size versus Effect Relationship Observed by Authors?:
Yes
Mathematical Relationship Identified in Paper (if applicable):
None
Author‐Identified 'Bright Line' Particle Size (diameter) Threshold (nm) ‐ List if applicable:
5.7
Notes on 'Bright Line' Threshold: A surface-weighted particle diameter of 5.7 for carbon nanofiber-supported cobalt nanoparticles achieved the maximum catalytic activity in the Fischer–Tropsch reaction.
ARCADIS Discussion of Results None
Nature of Size versus Effect Relationship (if applicable)
The catalytic activity for Co/CNF nanoparticles for the Fischer–Tropsch reaction reaches a maximum at 5.7 nm and decreases with both increasing and decreasing particle size.
Physico‐chemical Property Investigated:
Reactivity
Priority of Property: High
Relevant for A1 Project?: Yes
Type of nanomaterial (eg, nanometal, nanometal oxide):
Appendix B: Copy of DatabaseDetails on Preparation Method of Nanomaterial(s):
• The cobalt catalysts were synthesized using incipient wetness impregnation, in which cobalt loading (0.9–13 wt.%), cobalt precursor (cobalt nitrate or cobalt acetate) and solvent (water or ethanol) were varied. After
impregna on, the catalysts were dried in air at 120 deg C for 12 h.• The cobalt on silica catalysts were prepared via incipient wetness impregnation. Silica was impregnated with an aqueous cobalt nitrate solution, to achieve a
cobalt loading of 18 wt.%.• Subsequently, the catalyst was dried by hea ng the samples from room temperature (RT) to 70 C at a heating rate of 1 deg C/min and kept at this temperature for 12 h. Next, the dried catalyst (100 mg) was calcined in a 100 mL min 1 flow of 1 vol.% NO in He. The sample was heated from RT to 240 deg C at a rate of 1 deg C/min and kept at this temperature for 1 h. For comparison, another batch of the catalyst was calcined in air following the same procedure of flow and ramp. The NO and air calcinations are abbreviated NC and AC,
respec vely• All catalysts (25 mg) were reduced at 550 deg C with a hea ng rate of 5 deg C/min, 2 h, in a 60 mL/min flow of 33 vol.% H2 in N2. Next, the catalysts were oxidized in air to CoO at room temperature.
Details on Tests Examining Physicochemical Property:
• The Fischer–Tropsch reaction was performed at 220 deg C at 1 bar in a plug-flow reactor with an H2/CO ratio of 2 v/v. Typically, 20 mg catalyst (90-150 um), mixed with 200 mg SiC (200 um), was loaded in the reactor in order to achieve isothermal plug-flow conditions. The calcined catalysts were in situ reduced at temperatures ranging from 350 to 600 deg C, for 2 h, with a ramp of 5 deg C/min in 20 mL/min H2 and 40 mL/min Ar. Online gas chromatography analysis (C1-C16) was performed during the FT reaction to determine the activity and selectivity (wt.%) toward C1 (methane) and C5+ hydrocarbons. The activity was expressed as Cobalt-Time Yield. The reported activity and selectivity data are obtained after at least 20 h of FT synthesis and at 2% CO conversion.
Individual Particle Diameters Tested (nm):
4.6, 4.7, 5.7, 15.8 (surface-weighted values)
Solution characteristics (pH, cosolvents or other additives, sonication, ionic strength)
• pH: No data• Cosolvents or other addi ves: ethanol• Sonica on: Not performed• Ionic strength (conductivity): No data
Min Diameter Tested (nm): 4.6
Max Diameter Tested (nm): 15.8
Specific Surface Area (SSA) (m2/g): No data
Bulk materials tested (≥ 1000 nm): No
Information on Analytical Methods Used to Determine Particle Size:
Transmission electron microscopy (TEM) analysis was used to investigate the cobalt particle size and particle size distribution of the air-calcined (AC) and nitric oxide-calcined (NC) Co/SiO2 catalysts in more detail, after a reduction (550 C) and oxidation treatment (r.t.).
List of Relevant Findings: • For SiO2-supported cobalt nanoparticles (reduced at 550 deg C for 2 h), the CTY increased from 2.41 to 4.80 for particle sizes of 11 and 5 nm, respectively. Therefore, the optimum particle size of the catalyst in this study was 5
nm.• The SiO2-supported catalyst with a narrow Co par cle size distribu on with a surface-average size of 4.6 ± 0.8 nm was synthesized via NO calcination. This catalyst displays an unprecedented high FT activity and outperforms the air-calcined Co/SiO2 catalysts at 220 deg C, 1 bar. The high activity at 1 bar is ascribed to narrowing of the size distribution close to the optimum.
Size versus Effect Relationship Observed by Authors?:
Yes
Mathematical Relationship Identified in Paper (if applicable):
None
Author‐Identified 'Bright Line' Particle Size (diameter) Threshold (nm) ‐ List if applicable:
None
Notes on 'Bright Line' Threshold: An optimum catalyst particle diameter for the Fischer–Tropsch reaction was not identified in this study; therefore, a 'bright line' particle size diameter cannot be determined for the Co/SiO2 catalyst.
ARCADIS Discussion of Results None
Nature of Size versus Effect Relationship (if applicable)
The catalytic activity for Co/SiO2 nanoparticles for the Fischer–Tropsch reaction increases with decreasing particle size.
Page B-31 of 177
Appendix B: Copy of Database
Physico‐chemical Property Investigated:
Reactivity
Priority of Property: High
Relevant for A1 Project?: Yes
Type of nanomaterial (eg, nanometal, nanometal oxide):
Nanometal
Particle Functionalization or Capping Agent (if applicable):
Ionic surfactants
List Study Objective(s) Relevant to Investigated Physicochemical Property:
• To investigate the hydrogenation of anthracene catalyzed by size-controlled gold colloids which are protected by ionic surfactants in aqueous solution at room temperature.
Deng et al. (2005)
Specific Details on Tested Nanomaterial(s)
• Gold (Au) colloid nanopar cles• Gold (Au) colloid nanopar cles with ca onic surfactant (CATB)• Gold (Au) colloid nanoparticles with anionic surfactant (SDS)
Details on Preparation Method of Nanomaterial(s):
• For the preparation of gold NPs in the sodium dodecyl sulfate (SDS) system (denoted Au-SDS), 0.02 mL of an aqueous 25 mm HAuCl4∙3H2O solution was added to 5 mL of an aqueous solution of 20 mm SDS. Then, 0.06 mL of an aqueous NaBH4 (11 mm) solution was added. After the addition of NaBH4, the solution turned pink and an UV/Vis absorption spectrum was measured. The surface plasmon resonance (SPR) band at 520 nm indicates the formation of gold NPs. The same procedure was used to product AU NPs with hexadecyltrimethylammonium
bromide (CATB) as the surfactant (denoted as Au-CATB).• Au SDS and Au CATB solu ons were heated (at 80 deg C) to allow for the Au nanopar cles to grow bigger.• The size of the surfactant-protected gold NPs can be
controlled by the properties of the surfactant used and the amount of the catalyst, we thus prepared four colloidal Au NP systems with different mean diameters. The smallest system (2.7 nm) was prepared in a 0.1m CATB solution and the others (5.4, 10.8 and 24.7 nm) in a 20 mm SDS solution.
Details on Tests Examining Physicochemical Property:
• Au, Au-SDS or Au-CATB NPs were mixed with anthracene, followed by the addition of the reducing agent, sodium borohydride (NaBH4) and the UV/Vis absorbance at 253 nm was measured as an indicator of the rate of reduction of anthracene.
Individual Particle Diameters Tested (nm):
2.7, 5.4, 10.8, 24.7
Solution characteristics (pH, cosolvents or other additives, sonication, ionic strength)
• pH: No data• Cosolvents or other addi ves: Ionic surfactants were added• Sonica on: Not performed• Ionic strength (conductivity): No data
Min Diameter Tested (nm): 2.7
Max Diameter Tested (nm): 24.7
Specific Surface Area (SSA) (m2/g): No data
Bulk materials tested (≥ 1000 nm): No
Information on Analytical Methods Used to Determine Particle Size:
The size of gold nanoparticles was measured by transmission electron microscopy (TEM).
List of Relevant Findings: • For Au-SDS and Au-CATB NPs, the larger-sized particles showed stronger catalytic activity than the original Au-CATB NPs although the larger-sized NP has a smaller surface area. Thus, the catalytic activity of Au is mainly determined by its size, and not by the charge of the surfactant. There seems to be an optimum size for the catalytic
effect.• Au-NPs with a diameter of 5.4 nm exhibit the maximum cataly c ac vity.
Size versus Effect Relationship Observed by Authors?:
Yes
Mathematical Relationship Identified in Paper (if applicable):
R = (delta-A(N) * V(N)/eta(Au,N)) / ((delta-A(24.7) * V(24.7)/eta(Au,24.7))R = rela ve ra os of the absorp on decrease at 253 nm for the four Au NP solu ons rela ve to the case of a par cle size of 24.7 nmdelta-A: the
absorp on decrease at 253 nmN: the par cle sizeV(N): solu on volumeeta(Au): the molar amount of Au in the solution of gold NPs
Author‐Identified 'Bright Line' Particle Size (diameter) Threshold (nm) ‐ List if applicable:
5.4
Notes on 'Bright Line' Threshold: At a gold nanoparticle size of 5.4 nm, the maximum catalytic activity was achieved for the reduction of anthracene.
ARCADIS Discussion of Results None
Nature of Size versus Effect Relationship (if applicable)
Maximum catalytic activity at 5.4 nm
Page B-32 of 177
Appendix B: Copy of Database
Physico‐chemical Property Investigated:
Reactivity
Priority of Property: High
Relevant for A1 Project?: Yes
Type of nanomaterial (eg, nanometal, nanometal oxide):
Nanometal coating
Particle Functionalization or Capping Agent (if applicable):
None
List Study Objective(s) Relevant to Investigated Physicochemical Property:
• To investigate the size effects on alkene reactivity (ethene and trans-2-pentene) using a well-defined Pd/Al2O3 model catalyst, where the particle size can be varied in a controllable manner.
Doyle et al. (2005)
Specific Details on Tested Nanomaterial(s)
• Palladium (Pd) coated aluminum trioxide (Al2O3)
Details on Preparation Method of Nanomaterial(s):
• Thin alumina films were grown on a clean NiAl(110) single crystal as described elsewhere. Palladium (99.99%) was deposited onto the alumina films using a commercial evaporator (Focus EM3).
Details on Tests Examining Physicochemical Property:
• The experiments were performed in an ultrahigh-vacuum chamber (base pressure <10^-10 mbar) equipped for low-energy electron diffraction and Auger electron spectroscopy, and with a differentially pumped quadrupole
mass spectrometer for TPD experiments.• All gas exposures were performed with a calibrated direc onal gas doser. Trans-2-pentene was purified by a number of freeze–thaw cycles before adsorption. To increase sensitivity, the signals for fragmented masses were used to analyze the hydrocarbon molecules: 56 amu for C5H9D1 and 45 amu for C5H10D2. We checked that these signals fully described the desorption of the corresponding molecules.
The full mass signals were used for the reac ons of deuterated ethene.• Pd was deposited at 90 K and subsequently oxidized in O2 at 500 K for 30 min and reduced with CO at 300 K until no CO2 was produced. Pd surfaces were presaturated with deuterium and the replacement of H with D on alkenes (ethene, pentene) was studied as a proxy for the reaction rate with the NPs.
Individual Particle Diameters Tested (nm):
No data
Solution characteristics (pH, cosolvents or other additives, sonication, ionic strength)
Not applicable
Min Diameter Tested (nm): 1
Max Diameter Tested (nm): 5
Specific Surface Area (SSA) (m2/g): No data
Bulk materials tested (≥ 1000 nm): No
Information on Analytical Methods Used to Determine Particle Size:
No data
List of Relevant Findings: • For the lowest Pd coverage, a small quantity of desorption-limited D2 is detected at 225 K, and a single, reaction-limited D2 peak at 450 K is observed. As the particle size is increased, additional D2 peaks emerge at 415 and 505 K, which prevail for the largest Pd coverage such that the signal at 450 K is only seen as a shoulder at intermediate Pd coverage. Similar trends are found for the H2 signal. For the smallest particles, peaks at 260 and 440 K are detected. Peaks at 260, 405, and 500 K are prominent at the highest Pd coverage. At intermediate Pd coverage, both groups of peaks are present with corresponding weighting factors.
Page B-33 of 177
Appendix B: Copy of DatabaseSize versus Effect Relationship Observed by Authors?:
Yes
Mathematical Relationship Identified in Paper (if applicable):
None
Author‐Identified 'Bright Line' Particle Size (diameter) Threshold (nm) ‐ List if applicable:
None
Notes on 'Bright Line' Threshold: The deuterium desorption rate from NPs increased with increasing nanoparticle size over a range of nanoparticles 1 to 5 nm. No maxima/minima were identified and, therefore, a 'bright line' particle size threshold cannot be established.
ARCADIS Discussion of Results The increase in hydrogenation of trans-2-pentene as particle size increases may be related to an increase in the availability of Pd terrace sites, the number of which also increases as particle size increases.
Nature of Size versus Effect Relationship (if applicable)
The reaction rate of alkenes with Pd/Al2O3 NPs increases with increasing Pd coating thickness (i.e., particle size).
Physico‐chemical Property Investigated:
Crystalline structure (structure)
Priority of Property: High
Relevant for A1 Project?: Yes
Type of nanomaterial (eg, nanometal, nanometal oxide):
Nanometal alloy oxide
Particle Functionalization or Capping Agent (if applicable):
None
List Study Objective(s) Relevant to Investigated Physicochemical Property:
• To investigate the size dependence of the structure and magnetic properties for the La0.7Sr0.3MnO3 nanoparticles.
Duan et al. (2005)
Specific Details on Tested Nanomaterial(s)
• Lanthanum Stron um Manganese (VI) oxide (La(0.7)Sr(0.3)MnO(3))• perskovite
Details on Preparation Method of Nanomaterial(s):
• La0.7Sr0.3MnO3 nanoparticles were prepared using sol–gel method. La2O3, MnCO3, Sr(NO3)2 and a dispersion agent were dissolved in dilute nitric acid to get transparent solutions. Evaporating the water in the solutions, the viscous gels were dried and then calcined at different temperatures to get the desired products.
Details on Tests Examining Physicochemical Property:
• Transmission electron microscopy (TEM) and X-ray diffraction (XRD) analyses were employed to identify the microstructure of the NPs.• In order to gain the crystallographic parameters informa on at room temperature,
the La0.7Sr0.3MnO3 nanoparticles were refined using the R3c space group and the Rietveld refinement.
Individual Particle Diameters Tested (nm):
16, 24, 35, 47
Solution characteristics (pH, cosolvents or other additives, sonication, ionic strength)
Not applicable
Min Diameter Tested (nm): 16
Max Diameter Tested (nm): 47
Specific Surface Area (SSA) (m2/g): No data
Bulk materials tested (≥ 1000 nm): No
Information on Analytical Methods Used to Determine Particle Size:
Transmission electron microscopy (TEM) was used to determine the sizes of the nanoparticles.
List of Relevant Findings: • As grain size decreases, some split diffraction peaks belonging to rhombohedral structure start to approach each other and gradually merge into single peaks, and some weak diffrac on peaks disappear gradually.•The edge
length (a) of the rhombohedral unit cell increases markedly as grain size decreases, indicating that decreasing grain sizes can cause lattice expansion. This can be explained by the surface effect of the nanoscale particles (i.e., with decreasing particle sizes, the number of surface atoms of the nanoparticles increases, the atomic disorder and
reduced coordina on of the surface atoms can cause the la ce distor on of the surface atoms).• As grain size decreases, the angle a between the edges decreases almost linearly, and closes to 60 degrees at D = 16nm; which is the value of the ideal cubic perovskite. The crystal symmetry changes from rhombohedral to cubic structure at D = 16nm; above which the rhombohedral phase is stable. The internal pressure caused by small grain diameter and surface stress may be the reasons for structural transformation.
Page B-34 of 177
Appendix B: Copy of DatabaseSize versus Effect Relationship Observed by Authors?:
Yes
Mathematical Relationship Identified in Paper (if applicable):
None
Author‐Identified 'Bright Line' Particle Size (diameter) Threshold (nm) ‐ List if applicable:
16
Notes on 'Bright Line' Threshold: The La0.7Sr0.3MnO3 nanoparticles prepared by sol–gel method have two kinds of phase structures, the crystal symmetry changes from rhombohedral to cubic structure at D = 16nm; above which the rhombohedral phase is stable.
ARCADIS Discussion of Results This study found that the lattice parameter increases with decreasing particle diameter. This is the opposite trend observed in most of the literature. Lattice expansion was reported to occur for the perskovite structure La0.7Sr0.3MnO3 as the particle diameter decreased. In a similar explanation as Li et al. (2004), the authors explain this by the increased lattice distortion of surface atoms resulting from the decreased coordination of surface atoms with decreasing size.
Nature of Size versus Effect Relationship (if applicable)
Lattice expansion occurs as particle size decreases over the range 16 to 47 nm.
Physico‐chemical Property Investigated:
Reactivity
Priority of Property: High
Relevant for A1 Project?: Yes
Type of nanomaterial (eg, nanometal, nanometal oxide):
Nanometal oxide
Particle Functionalization or Capping Agent (if applicable):
List Study Objective(s) Relevant to Investigated Physicochemical Property:
• To investigate the influence of nanoparticle size on the activity of the inverse spinel CoFe(2)O(4) for CO oxidation. • To establish scalable route to quantities of metal oxide nanoparticles with a well-defined size-activity
rela onship.
Evans et al. (2008)
Specific Details on Tested Nanomaterial(s)
• Inverse spinel cobalt iron oxide (CoFe(2)O(4))
Page B-35 of 177
Appendix B: Copy of DatabaseDetails on Preparation Method of Nanomaterial(s):
• Sample C1 was prepared solvothermally. Briefly, 0.8 mmol of iron(III) cupferronate, 0.4 mmol of cobalt(II) cupferronate and 8.6 mmol of n-dodeclyamine were added to 15 ml toluene and heated. After removal from the oven, 2-propanol was then added to the resulting solution before it was decanted and the black product was then
washed repeatedly with 2-propanol and dried.• Sample C2 - a solu on was made consis ng of 10 ml of 0.1 M CoCl(2) x 6H(2)O in H(2)O and 10 ml of 0.2 M FeCl(3) x 6H(2)O in H(2)O, this was heated and 50 ml of a 0.3 M solution of hexadecyltrimethylammonium bromide (CTAB) in H(2)O was added and heating was continued. 3 M NaOH, was then added. The solution was allowed to cool and the liquid was decanted by magnetic assistance. The
product was then washed repeatedly with H(2)O and then dried.• Sample C3 - Prepared the same as C2 except that instead of CTAB the oxalic acid–ethylenediamine (ox–en) capping group was used. Ox-en was made by reacting oxalic acid (6 mmol) with ethylenediamine (3 mmol) in 5 ml H2O. This was added to a solution consisting of 10 ml of 0.1 M CoCl(2) x 6H(2)O in H(2)O and 10 ml of 0.2 M FeCl(3) x 6H(2)O in H(2)O (the ratio of ox–en to Co2+ was therefore 3 : 1). Addition of 3 ml concentrated HCl removed the resulting oxalate precipitates. A 3 M NaOH solution was then added drop wise, with stirring. The black product was collected by decanting off the liquid, which
was assisted by a magnet. The product was then washed several mes with H(2)O and dried.• Samples C4-C6 and C8, C9 were prepared using the same procedures as sample C3, the composition of the capping groups was different for each sample (C4 - 1:1 ratio of ox to en, C5 - 2:1 ratio of ox to en, C6 - 3: 1 ratio of ox-TEA to en, C8 - 6
mmol of ox only was used, C9 - 3 mmol of en only was used.• C7 and C10 - Made through hea ng ~ 100 mg of
Details on Tests Examining Physicochemical Property:
• The CO oxida on was carried out in a Pyrex glass con nuousflow micro reactor (9 mm i.d.) with an online Varian 3800 gaschromatograph equipped with a thermal conduc vity detector (TCD). A gas mixture of 2% CO in He at 25
ml/min and O(2) at 5 ml/min was used. 0.02 g catalyst samples were diluted with 0.18 g of SiO2 for tes ng. TheCO conversion was measured a er 30 min me on stream at eachtemperature, with the temperature jumps ranging
from 20 deg C to10 deg C. The catalysts were not subjected to pre-treatment prior tocatalysis. The composi ons of the samples were determined using x-ray diffraction (XRD), thermogravimetric analysis-mass spectrometry (TGA-MS), carbon hydrogen nitrogen (CHN) microanalysis and Fourier transform infrared spectroscopy (FTIR).
Solution characteristics (pH, cosolvents or other additives, sonication, ionic strength)
• pH: No data• Cosolvents or other addi ves: Sample C1: toluene, 2-propanol• Sonica on: No data• Ionic strength (conductivity): No data
Min Diameter Tested (nm): 5.8 (C6)
Max Diameter Tested (nm): 30 (C7)
Specific Surface Area (SSA) (m2/g): 57 (C4), 85 (C5), 104 (C6), 15.3 (C7)
Bulk materials tested (≥ 1000 nm): no
Information on Analytical Methods Used to Determine Particle Size:
Surface area measurements were carried out using the BET method on a Micromeritics ASAP 2000 nitrogen absorption analyzer. XRD was carried out on a PANalytical Xpert syste using Co Kalpha(1) radiation. Fourier transform infrared spectroscopy (FTIR) was carried out on a Nicolet Nexus instrument. Thermal analysis (TGA) was performed using a Seiko SII-TG/DTA 6300 thermal analyzer under a flow of N2. High resolution transmission electron microscopy (HRTEM) was carried out on a Joel JEM-2011 electron microscope operated at 200 kV.
List of Relevant Findings: • From these data, the relationship between T50 and particle size could be derived. There is a quasi-linear rela onship between the par cle size and T50 over the studied range of sizes.• Results show that sample C1 (6.1
nm) has a temperature 50% conversion of CO to CO(2), T50, at 123 degrees C. In comparison, sample C2 (12 nm) proved less active with a T50 of 183 degrees C whilst sample C3 (8.2 nm) displayed activity intermediate between those of samples C1 and C2. Furthermore, sample C6 (5.8 nm), which had the smallest measured particle size, required the lowest temperature for 100% conversion of CO to CO(2) and had a T50 of 125 degrees C. Sample C7 (30 nm), displayed the lowest activity of all of the samples tested with a T50 of 262 degrees C, some 137 degrees C
higher than that of the 5.8 nm sample.• The size–ac vity rela onship for the CO oxida on reac on has been mapped out for a model CO oxidation catalyst, where the surface area is systematically controlled via the particle size rather than through other mechanisms such as support effects. Particle size has been shown to have a significant effect upon the activity of the catalyst when the unsupported particle dimensions are reduced to the nanometer range and the results also demonstrate that CoFe(2)O(4) nanoparticles are active CO oxidation catalysts
under rela vely mild condi ons with 100%conversion at 185 degrees C.
Page B-36 of 177
Appendix B: Copy of DatabaseSize versus Effect Relationship Observed by Authors?:
Yes
Mathematical Relationship Identified in Paper (if applicable):
None
Author‐Identified 'Bright Line' Particle Size (diameter) Threshold (nm) ‐ List if applicable:
None
Notes on 'Bright Line' Threshold: As the particle diameter increases, the temperature required for 50% conversion of the CO to CO(2) within the sample, the T50, increases. A 'bright line' threshold cannot be inferred from these data.
ARCADIS Discussion of Results None
Nature of Size versus Effect Relationship (if applicable)
There is a quasi-linear relationship between the particle size and T50 over the studied range of sizes.
Physico‐chemical Property Investigated:
Reactivity
Priority of Property: High
Relevant for A1 Project?: Yes
Type of nanomaterial (eg, nanometal, nanometal oxide):
Nanometal
Particle Functionalization or Capping Agent (if applicable):
None
List Study Objective(s) Relevant to Investigated Physicochemical Property:
• To investigate the catalytic activity fully oxidized planar Au/TiO2 model catalysts with fully oxidized TiO2(110) support materials performed at different Au coverages (i.e., different particle size) and different temperatures.
Eyrich et al. (2011)
Specific Details on Tested Nanomaterial(s)
• Gold/titanium dioxide (Au/TiO2) model catalysts with a fully oxidized TiO2(110) support
Details on Preparation Method of Nanomaterial(s):
No data
Details on Tests Examining Physicochemical Property:
• The strong influence of the size of the Au nanoparticles on the catalytic activity was studied at different temperatures.• The ac va on energy was determined for different par cle sizes, in the size regime of the high
catalytic activity (small Au nanoparticles) and for larger Au nanoparticles.
Individual Particle Diameters Tested (nm):
No data
Solution characteristics (pH, cosolvents or other additives, sonication, ionic strength)
• pH: No data• Cosolvents or other addi ves: No data• Sonica on: No data• Ionic strength (conduc vity): No data
Min Diameter Tested (nm): No data
Max Diameter Tested (nm): No data
Specific Surface Area (SSA) (m2/g): No data
Bulk materials tested (≥ 1000 nm): No data
Information on Analytical Methods Used to Determine Particle Size:
No data
List of Relevant Findings: • The strong influence of the size of the Au nanoparticles on the catalytic activity showed a less pronounced size dependence (but very high activity) at low temperatures (around room temperature).
Page B-37 of 177
Appendix B: Copy of DatabaseSize versus Effect Relationship Observed by Authors?:
Yes
Mathematical Relationship Identified in Paper (if applicable):
None
Author‐Identified 'Bright Line' Particle Size (diameter) Threshold (nm) ‐ List if applicable:
None
Notes on 'Bright Line' Threshold: Abstract only.
ARCADIS Discussion of Results Since only an abstract is available, this study is not discussed in the report.
Nature of Size versus Effect Relationship (if applicable)
Catalytic activity increases with decreasing particle size.
Physico‐chemical Property Investigated:
Crystalline structure (structure)
Priority of Property: High
Relevant for A1 Project?: Yes
Type of nanomaterial (eg, nanometal, nanometal oxide):
Nanometal oxide
Particle Functionalization or Capping Agent (if applicable):
None
List Study Objective(s) Relevant to Investigated Physicochemical Property:
• Experimental study of the role of particle size in the change of lattice parameters in nickel oxide (bunsenite)
Gamarnik (1994)
Specific Details on Tested Nanomaterial(s)
• Nickel oxide (NiO)• The ini al sample was obtained by oxida on of highly disperse powder nickel in air at room temperature.• The average size of crystallites of the nickel sample was about 5 nm.
Details on Preparation Method of Nanomaterial(s):
No data
Details on Tests Examining Physicochemical Property:
• NiO NPs were of 5 crystallite sizes were thermally treated at temperatures ranging from 270 to 350 deg C for 0.3 to 1.5 h under vacuum or non-vacuum condi ons.• The rela ve changes of la ce parameters (delta a / a), where
delta a = a - am, where a and am are the lattice parameters in small and bulk crystals, respectively
Individual Particle Diameters Tested (nm):
2.3, 5.4, 7.2, 12.0, 14.0
Solution characteristics (pH, cosolvents or other additives, sonication, ionic strength)
• pH: No data• Cosolvents or other addi ves: None• Sonica on: Not performed• Ionic strength (conduc vity): No data
Min Diameter Tested (nm): 2.3
Max Diameter Tested (nm): 14
Specific Surface Area (SSA) (m2/g): No data
Bulk materials tested (≥ 1000 nm): No
Information on Analytical Methods Used to Determine Particle Size:
The samples were investigated by X-ray diffractometer with CoKalpha radiation. The sizes of crystallites - regions of coherentsca ering were determined by the half-widths of the physical profiles of reflec ons. The posi on of
reflections was determined from the position of the gravity centre of the Kalpha doublet. The goniometer aberrations were accounted for employing the position of reflections of the standard substance (silicon).
List of Relevant Findings: • The results provide evidence for increase of the lattice parameter when decreasing the sizes of crystallites.
Page B-38 of 177
Appendix B: Copy of DatabaseSize versus Effect Relationship Observed by Authors?:
Yes
Mathematical Relationship Identified in Paper (if applicable):
None
Author‐Identified 'Bright Line' Particle Size (diameter) Threshold (nm) ‐ List if applicable:
None
Notes on 'Bright Line' Threshold: No statistical analysis was performed on the data; therefore, it is not possible to determine if the observed trend is significant.
ARCADIS Discussion of Results This study found that the lattice parameter increases with decreasing particle diameter. This is the opposite trend observed in most of the literature.
Nature of Size versus Effect Relationship (if applicable)
The lattice parameter increases with decreasing particle size over the range 2.3 to 14 nm.
Physico‐chemical Property Investigated:
Photocatalytic activity
Priority of Property: High
Relevant for A1 Project?: Yes
Type of nanomaterial (eg, nanometal, nanometal oxide):
Nanometal
Particle Functionalization or Capping Agent (if applicable):
None
List Study Objective(s) Relevant to Investigated Physicochemical Property:
• To investigate the photoactivities of ultrafine TiO2 nanoparticles in the anatase, rutile or mixed-phases for the photocatalytic degradation of phenol.
Gao and Zhang (2001)
Specific Details on Tested Nanomaterial(s)
• Titanium dioxide (TiO2)• anatase, ru le, or mixed-phases
Details on Preparation Method of Nanomaterial(s):
• The nanocrystalline titania catalysts were prepared by TiCl4 hydrolysis. Samples were dried at room temperature (25 deg C) or calcined at 200, 400, 600 or 700 deg C.• The samples were labeled as A (predominantly anatase), R (predominantly ru le) or RA (mixed phase) (the digits25 and 400 denote the catalysts dried at 25 deg C under
vacuum and calcined at 400 deg C for 2h, respectively) as follows (% rutile): A25 (0), A400 (0), A600 (0), A700 (13), RA25 (63), RA400 (58), RA600 (72), R25 (100), R400 (100) and R600 (100).
Details on Tests Examining Physicochemical Property:
• Powder X ray diffraction (XRD) was used for crystal phase identification and estimation of the anatase-to rutile ratio and the crystallite size of each phase present. XRD patterns were obtained at room temperature with a
diffractometer RAX-10 using CuKa radia on.• Transmission electron microscopy (TEM) observa ons were carried out using a JEOL22010 electron microscope.• Thermogravimetric and differen al thermal analyses (TG-DTA) were
carried out in a Schimahzu thermoanalyzer TG-DTA-50 under dry nitrogen, using platinum crucibles and a constant heating rate 10 deg C/min up to 1000 deg C. Fine alumina powder was used as a reference substance. In this paper, O2 was bubbled into aqueous suspensions at a constant flow rate.
Solution characteristics (pH, cosolvents or other additives, sonication, ionic strength)
• pH: No data• Cosolvents or other addi ves: No data• Sonica on: No data• Ionic strength (conduc vity): No data
Page B-39 of 177
Appendix B: Copy of DatabaseMin Diameter Tested (nm): 4
Max Diameter Tested (nm): 58.2
Specific Surface Area (SSA) (m2/g): 12.2, 32.7, 34.5, 35.9, 71.4, 77.5, 167.6, 183.6, 271.4, 289.9
Bulk materials tested (≥ 1000 nm): No
Information on Analytical Methods Used to Determine Particle Size:
Powder X ray diffraction (XRD) was used for crystal phase identification and estimation of the anatase-to rutile ratio and the crystallite size of each phase present. The Brunauer-Emmett-Teller (BET) surface area was determined using a Micromeritics ASAP 2010 nitrogen adsorption apparatus. The absorption spectra of the solid catalysts were performed on Perkin Emler Lambda 20 spectrophotometer.
List of Relevant Findings: • The photocatalytic activity of A25 (containing 42.3% amorphous parts) is lower than that of A400 (which containing 10.5% amorphous parts); and the activities of both samples are lower than that of completely crystallized anatase such as A600 and A700, although the specific surface areas of A600 and A700 are lower and
par cle sizes are larger than that of A25 and A400.• For samples in the mixed-phases, the photoac vity of RA25, which consists of 8.0% amorphous content and crystalline parts, is lower than that of RA400. However, the photocatalytic activity of RA600 decreases significantly resulting from a large decrease in the specific surface area
and increase in par cle size.• For ru le samples, no amorphous contents can be detected by DTA, R25 exhibits much higher photocatalytic activity than R400 and R600; the specific surface areas of R400 and R600 are lower
than R25.• The photocataly c ac vity of the ultra fine nanocrystals in the ru le phase was comparable to ultra fine nanocrystals in the anatase phase and much higher than that of rutile-type TiO2 in larger size. The results indicate that the existence of the amorphous phase has detrimental effects on photocatalytic properties.
Size versus Effect Relationship Observed by Authors?:
Yes
Mathematical Relationship Identified in Paper (if applicable):
None
Author‐Identified 'Bright Line' Particle Size (diameter) Threshold (nm) ‐ List if applicable:
None
Notes on 'Bright Line' Threshold: For rutile (crystalline) TiO2, the photocatalytic activity increased with decreasing crystallite size. For anatase TiO2, the photocatalytic activity was higher for larger particles.
ARCADIS Discussion of Results Two variables may affect the photocatalytic activity: 1) particle size; 2) relative percentage of anatase/rutile phases. Therefore, it may not be possible to isolate effects for the size variable and state that a size-dependent effect was observed.
Nature of Size versus Effect Relationship (if applicable)
The photocatalytic activity of crystalline TiO2 (rutile) 7.2 nm NP is much higher than that of larger rutile samples.
Physico‐chemical Property Investigated:
Crystalline structure (structure)
Priority of Property: High
Relevant for A1 Project?: Yes
Type of nanomaterial (eg, nanometal, nanometal oxide):
Nanometal oxide
Particle Functionalization or Capping Agent (if applicable):
None
List Study Objective(s) Relevant to Investigated Physicochemical Property:
• To investigate the stability of anatase phase component present in commercial grade nanocrystalline powder of TiO2 , synthesized from the gas phase.
Ghosh et al. (2003)
Specific Details on Tested Nanomaterial(s)
• Titanium dioxide (TiO2)• nanocrystalline
Page B-40 of 177
Appendix B: Copy of DatabaseDetails on Preparation Method of Nanomaterial(s):
• Nanopowders of TiO2 were synthesized by combustion flame chemical vapor condensation (CF-CVC). Powder samples are annealed at 200, 400, 600, 800, and at 1000 deg C for 2 h in ambient conditions.
Details on Tests Examining Physicochemical Property:
• X-ray measurements are done with a Philips (PW 1710) diffractometer. The diffraction data are recorded with Cu Ka radiation while the tube operated at 35 kV and current at 24 mA. Microstructural parameters like the crystallite size, rms strain, lattice parameters, volume fractions of component phases are obtained from the best fit of the generated x-ray diffraction pattern to the experimental pattern.
Individual Particle Diameters Tested (nm):
10.17, 11.02, 11.13, 11.65, 44.90 and 187.78
Solution characteristics (pH, cosolvents or other additives, sonication, ionic strength)
Not applicable
Min Diameter Tested (nm): 10.17
Max Diameter Tested (nm): 187.78
Specific Surface Area (SSA) (m2/g): No data
Bulk materials tested (≥ 1000 nm): No
Information on Analytical Methods Used to Determine Particle Size:
Microstructural parameters like the crystallite size, rms strain, lattice parameters, volume fractions of component phases are obtained from the best fit of the generated x-ray diffraction pattern to the experimental pattern. Fourier coefficients of the strongest Bragg reflections are used to calculate the crystallite size and rms strain.
List of Relevant Findings: • Crystallite size of the anatase phase is measured from the Fourier coefficient of (101) reflection. The observed change in the crystallite size for annealing up to 800 deg C (15.71 nm) is small (changes from 11.3 to 15.7 nm). Beyond 800 deg C (i.e., 1000 deg C) anatase phase completely disappears and large crystallites of rutile phase is grown. For Rutile, increase in crystallite size at initial stages of annealing (<600 deg C) is small, however the growth
is pronounced above 600 deg C and it grows from 10 nm at room temperature to 187 nm at 1000 deg C.• The above results clearly demonstrate that stability of nanopar cles of anatase phase is size dependent.• The la ce
parameter (c) increased with increasing particle size. The lattice parameter (a) reached a maximum at a particle size of 13.04 nm.
Size versus Effect Relationship Observed by Authors?:
Yes
Mathematical Relationship Identified in Paper (if applicable):
None
Author‐Identified 'Bright Line' Particle Size (diameter) Threshold (nm) ‐ List if applicable:
15.71
Notes on 'Bright Line' Threshold: While not stated in the paper as a 'bright line' particle size threshold, the anatase phase was noted to completely disappear for nanoparticles annealed at 800 deg C (15.71 nm).
ARCADIS Discussion of Results Not sure if the threshold represents the annealing temperature or the particle size.
Nature of Size versus Effect Relationship (if applicable)
The phase of TiO2 transitions from anatase to rutile with increasing particle size (that stability of nanoparticles of anatase phase is size dependent).
Physico‐chemical Property Investigated:
Reactivity
Priority of Property: High
Relevant for A1 Project?: Yes
Type of nanomaterial (eg, nanometal, nanometal oxide):
Nanometal
Particle Functionalization or Capping Agent (if applicable):
None
List Study Objective(s) Relevant to Investigated Physicochemical Property:
• To investigate the selectivity and activity for the hydrogenation of crotonaldehyde to crotyl alcohol and butyraldehyde using a series of Pt nanoparticle catalysts.
Appendix B: Copy of DatabaseDetails on Preparation Method of Nanomaterial(s):
• The nanoparticles were synthesized by alcohol reduction of a Pt salt in the presence of poly(vinylpyrrolidone) (PVP), followed by incorpora on into mesoporous SBA-15 silica.• The 1.7 and 7.1 nm NPs were synthesized by the
polyol reduction process in ethylene glycol (EG), while 2.9 and 3.6 nm particles were synthesized in an 80/20 v/v mixture of methanol and water by alcohol reduction. The 3.6 nm particles were synthesized by a seeded growth method beginning with the 2.9 nm particles. All of the NPs except for the 1.7 nm particles were synthesized in the presence of PVP, which sterically protects the particles from agglomeration. The 1.7 nm particles are electrostatically stabilized in a solution of NaOH in EG during synthesis, then precipitated from the EG solution and
transferred to an ethanol solu on containing PVP.• The nanopar cles were incorporated into silica by synthesizingthe mesoporous SBA-15-like silica matrix in neutral pH hydrothermal condi ons in the presence of the
PVP-protected NPs. The catalysts were washed in ethanol, dried in air at 373 K and calcined ex situ in O2 at 723 K for 12 h (Pt(2.9 nm)/SBA-15 and Pt(3.6 nm)/SBA-15), at 623 K for 12 h (Pt(1.7 nm)/SBA-15), or at 723 K for 24 h (Pt(7.1-15)/SBA-15).
Details on Tests Examining Physicochemical Property:
• Catalytic reactions were carried out in a stainless steel flow reactor. The catalyst was reduced in situ at the desired temperature (typically 673 K) for 2 h in H2 (160 Torr)/He (70 mL/min). The reaction was initiated by introducing a flow of 160 Torr H2/He (70 mL/min) through the saturator containing crotonaldehyde held at 273 K. The inlet conditions prior to contact with the catalyst bed was 8 Torr crotonaldehyde, 160 Torr H2 and balance
He.• The catalyst was placed on top of a quartz frit in a Pyrex U-tube reactor. For a typical experiment, ~15 mg catalyst was diluted with ~50 mg acid-washed and calcined low surface area quartz and loaded into the reactor between beds of the same acid-washed and calcined quartz. The effluent stream was analyzed by gas chromatography using a flame ionization detector (FID) for analysis of organics and a thermal conductivity detector (TCD) for H2 detection. The reaction was started at 353 K until a stable activity was measured (i.e. until initial deactivation was complete and a steady state activity was reached); most catalysts required ~2.5 h to reach steady-state. The reaction temperature was then changed (and left for 1.5 h at each temperature) to 373, 393, 383, 373, 363, and finally back to 353 K for a check on the extent of catalyst deactivation. Unless stated otherwise, data reported in this paper is the steady-state rate at 353 K (the deactivation check measurement). The activation energy for all samples was determined using the rates obtained while cooling from 393 to 353 K, averaging the rate
calculated from ten GC injec ons at each temperature.• The TOF was calculated by normalizing the reac on rate to the number surface Pt atoms based on TEM measurements and the Pt loading determined by ICP–OES. Selectivity values were calculated by dividing the TOF a particular product by the overall TOF (the rate of disappearance of crotonaldehyde).
Individual Particle Diameters Tested (nm):
1.7, 2.9, 3.6, 7.1
Solution characteristics (pH, cosolvents or other additives, sonication, ionic strength)
• pH: No data• Cosolvents or other addi ves: ethylene glycol, poly(vinylpyrrolidone), methanol• Sonica on: Not performed• Ionic strength (conduc vity): No data
Min Diameter Tested (nm): 1.7
Max Diameter Tested (nm): 7.1
Specific Surface Area (SSA) (m2/g): No data
Bulk materials tested (≥ 1000 nm): No
Information on Analytical Methods Used to Determine Particle Size:
The catalysts were characterized by X-ray diffraction (XRD) with a Bruker D8 GADDS diffractometer with Co Ka radiation (lambda = 0.179 nm) and transmission electron microscopy (TEM microscope operated at 100 kV) for confirmation of the bulk particle size. The total surface area and metallic surface area were measured by N2 physisorption (BET method) and H2 chemisorption with a Quantachrome Autosorb 1 automated sorption analyzer.
List of Relevant Findings: • The turnover frequency (TOF) for the catalytic hydrogenation of crotonaldehyde to crotyl alcohol and butyraldehyde increased monotonically with increasing par cle size.• The selec vity for the forma on of crotyl
alcohol increased with increasing particle size (selectivity toward butyraldehyde decreased with increasing particle size).• The ini al deac va on is also dependent on par cle size. During the first few minutes on stream, Pt(1.7
nm)/SBA-15 is 1.5 times more active than Pt(7.1 nm)/SBA-15. While both catalysts have the same TOF for butyraldehyde production, the Pt(1.7 nm)/SBA-15 is 1.5 times more active for the formation of crotyl alcohol, seven times more active for complete hydrogenation to butanol, and three times more active for decarbonylation at the onset of the reaction.
Page B-42 of 177
Appendix B: Copy of DatabaseSize versus Effect Relationship Observed by Authors?:
Yes
Mathematical Relationship Identified in Paper (if applicable):
None
Author‐Identified 'Bright Line' Particle Size (diameter) Threshold (nm) ‐ List if applicable:
None
Notes on 'Bright Line' Threshold: Smaller nanoparticle catalysts were capable of more complete reduction of crotonaldehyde than larger-sized nanoparticle catalysts over the range 1.7 to 7.1 nm.
ARCADIS Discussion of Results None
Nature of Size versus Effect Relationship (if applicable)
Crotonaldehyde is more completely reduced in the presence of smaller NPs.
Physico‐chemical Property Investigated:
Reactivity
Priority of Property: High
Relevant for A1 Project?: Yes
Type of nanomaterial (eg, nanometal, nanometal oxide):
Nanometal
Particle Functionalization or Capping Agent (if applicable):
None
List Study Objective(s) Relevant to Investigated Physicochemical Property:
• To investigate the interrelation between preparation, fine structure, and catalytic properties of gold deposited on a variety of metal oxides, most specifically TiO(2), alpha-Fe(2)O(3), and Co(3)O(4).
Haruta et al. (1993)
Specific Details on Tested Nanomaterial(s)
• Gold (Au)• Supported by one of the following: TiO2 (anatase)
Details on Preparation Method of Nanomaterial(s):
• TiO2 was used as purchased, AuCl(4) was used as a precursor for the formation of gold particles.
Details on Tests Examining Physicochemical Property:
• Mechanistic investigations on the size effect of gold particles, kinetic behavior, TPD and Fourier-transformed infrared spectroscopy (FT-IR).• Cataly c ac vity measurements were carried out in a fixed bed reactor using 200
mg of catalysts of 70 to 120 mesh size. The conversions of H2 and CO were determined by analyzing effluent gases with gas chromatography.
Individual Particle Diameters Tested (nm):
ca. 3 - ca. 18
Solution characteristics (pH, cosolvents or other additives, sonication, ionic strength)
• pH: The particle size of gold was controlled by changing pH and the concentration of HAuCl(4) in the starting solu ons.• Cosolvents or other addi ves: No data• Sonica on: Not performed• Ionic strength (conduc vity):
No data
Min Diameter Tested (nm): ca. 3
Max Diameter Tested (nm): ca. 18
Specific Surface Area (SSA) (m2/g): 50 (TiO2)
Bulk materials tested (≥ 1000 nm): No
Information on Analytical Methods Used to Determine Particle Size:
The particle size of gold was determined by a high-resolution transmission electron microscope (TEM). At least 200 particles were chosen to determine the mean diameter by using a computerized image analyzer.
List of Relevant Findings: • For CO oxidation, the turnover frequency (TOF) per surface gold atom was found to be significantly dependent on the particle diameter of gold.
Page B-43 of 177
Appendix B: Copy of DatabaseSize versus Effect Relationship Observed by Authors?:
Yes
Mathematical Relationship Identified in Paper (if applicable):
None
Author‐Identified 'Bright Line' Particle Size (diameter) Threshold (nm) ‐ List if applicable:
4
Notes on 'Bright Line' Threshold: Below a size of 4 nm, the catalytic rate of activity increases sharply with decreasing particle size.
ARCADIS Discussion of Results Particle size range determined from graph. Paper is quiet old for the field of nanotechnology.
Nature of Size versus Effect Relationship (if applicable)
Catalytic activity increases with decreasing particle size.
Physico‐chemical Property Investigated:
Reactivity
Priority of Property: High
Relevant for A1 Project?: Yes
Type of nanomaterial (eg, nanometal, nanometal oxide):
Nanometal
Particle Functionalization or Capping Agent (if applicable):
None
List Study Objective(s) Relevant to Investigated Physicochemical Property:
• To investigate the interrelation between preparation, fine structure, and catalytic properties of gold deposited on a variety of metal oxides, most specifically TiO(2), alpha-Fe(2)O(3), and Co(3)O(4).
Haruta et al. (1993)
Specific Details on Tested Nanomaterial(s)
• Gold (Au)• Supported by alpha-Fe(2)O(3)
Details on Preparation Method of Nanomaterial(s):
• All of samples had a metal loading expressed as atomic ratio of Au/Me = 1/19 (where Me is the metal of oxide support). AuCl(4) was used as a precursor for the formation of gold particles. Au/TiO2 catalysts were prepared by
coprecipita on and deposi on-precipita on.• For the coprecipita on method, the coprecipitate was washed and then dried under vacuum overnight and finally calcined in air at 400 deg C for 5 h. The deposition-precipitation method also used calcination at 400 deg C for 4 h following the washing and drying steps.
Details on Tests Examining Physicochemical Property:
• Mechanistic investigations on the size effect of fold particles, kinetic behavior, TPD and Fourier-transformed infrared spectroscopy (FT-IR).• Cataly c ac vity measurements were carried out in a fixed bed reactor using 200
mg of catalysts of 70 to 120 mesh size. The conversions of H2 to CO were determined by analyzing effluent gases with gas chromatography.
Individual Particle Diameters Tested (nm):
No data
Solution characteristics (pH, cosolvents or other additives, sonication, ionic strength)
• pH: The particle size of gold was controlled by changing pH and the concentration of HAuCl(4) in the starting solu ons.• Cosolvents or other addi ves: No data• Sonica on: Not performed• Ionic strength (conduc vity):
No data
Min Diameter Tested (nm): ca. 2
Max Diameter Tested (nm): No data
Specific Surface Area (SSA) (m2/g): 37 (Fe2O3)
Bulk materials tested (≥ 1000 nm): No
Information on Analytical Methods Used to Determine Particle Size:
The particle size of gold was determined by a high-resolution transmission electron microscope (TEM). At least 200 particles were chosen to determine the mean diameter by using a computerized image analyzer.
List of Relevant Findings: • For CO oxidation, the turnover frequency (TOF) per surface gold atom was found to be significantly dependent on the particle diameter of gold.
Page B-44 of 177
Appendix B: Copy of DatabaseSize versus Effect Relationship Observed by Authors?:
Yes
Mathematical Relationship Identified in Paper (if applicable):
None
Author‐Identified 'Bright Line' Particle Size (diameter) Threshold (nm) ‐ List if applicable:
4
Notes on 'Bright Line' Threshold: Below a size of 4 nm, the catalytic rate of activity increases sharply with decreasing particle size.
ARCADIS Discussion of Results Particle size range determined from graph. Paper is quiet old for the field of nanotechnology.
Nature of Size versus Effect Relationship (if applicable)
Catalytic activity increases with decreasing particle size.
Physico‐chemical Property Investigated:
Reactivity
Priority of Property: High
Relevant for A1 Project?: Yes
Type of nanomaterial (eg, nanometal, nanometal oxide):
Nanometal
Particle Functionalization or Capping Agent (if applicable):
None
List Study Objective(s) Relevant to Investigated Physicochemical Property:
• To investigate the interrelation between preparation, fine structure, and catalytic properties of gold deposited on a variety of metal oxides, most specifically TiO(2), alpha-Fe(2)O(3), and Co(3)O(4).
Haruta et al. (1993)
Specific Details on Tested Nanomaterial(s)
• Gold (Au)• Supported by Co(3)O(4)
Details on Preparation Method of Nanomaterial(s):
• All of samples had a metal loading expressed as atomic ratio of Au/Me = 1/19 (where Me is the metal of oxide support). AuCl(4) was used as a precursor for the formation of gold particles. Au/TiO2 catalysts were prepared by
coprecipita on and deposi on-precipita on.• The coprecipitate was washed and then dried under vacuum overnight and finally calcined in air at 400 deg C for 5 h.
Details on Tests Examining Physicochemical Property:
• Mechanistic investigations on the size effect of fold particles, kinetic behavior, TPD and Fourier-transformed infrared spectroscopy (FT-IR).• Cataly c ac vity measurements were carried out in a fixed bed reactor using 200
mg of catalysts of 70 to 120 mesh size. The conversions of H2 to CO were determined by analyzing effluent gases with gas chromatography.
Individual Particle Diameters Tested (nm):
No data
Solution characteristics (pH, cosolvents or other additives, sonication, ionic strength)
• pH: The particle size of gold was controlled by changing pH and the concentration of HAuCl(4) in the starting solu ons.• Cosolvents or other addi ves: No data• Sonica on: Not performed• Ionic strength (conduc vity):
No data
Min Diameter Tested (nm): ca. 2
Max Diameter Tested (nm): No data
Specific Surface Area (SSA) (m2/g): 59 (Co3O4)
Bulk materials tested (≥ 1000 nm): No
Information on Analytical Methods Used to Determine Particle Size:
The particle size of gold was determined by a high-resolution transmission electron microscope (TEM). At least 200 particles were chosen to determine the mean diameter by using a computerized image analyzer.
List of Relevant Findings: • For CO oxidation, the turnover frequency (TOF) per surface gold atom was found to be significantly dependent on the particle diameter of gold.
Page B-45 of 177
Appendix B: Copy of DatabaseSize versus Effect Relationship Observed by Authors?:
Yes
Mathematical Relationship Identified in Paper (if applicable):
None
Author‐Identified 'Bright Line' Particle Size (diameter) Threshold (nm) ‐ List if applicable:
4
Notes on 'Bright Line' Threshold: Below a size of 4 nm, the catalytic rate of activity increases sharply with decreasing particle size.
ARCADIS Discussion of Results Particle size range determined from graph. Paper is quiet old for the field of nanotechnology.
Nature of Size versus Effect Relationship (if applicable)
Catalytic activity increases with decreasing particle size.
Physico‐chemical Property Investigated:
Crystalline structure (structure)
Priority of Property: High
Relevant for A1 Project?: Yes
Type of nanomaterial (eg, nanometal, nanometal oxide):
Inorganic compound
Particle Functionalization or Capping Agent (if applicable):
None
List Study Objective(s) Relevant to Investigated Physicochemical Property:
• To investigate size-dependent structural transitions.
Hermanowicz et al. (2008)
Specific Details on Tested Nanomaterial(s)
• Lithium Indium Double Tungstate (LiIn(WO4)2)
Details on Preparation Method of Nanomaterial(s):
• Indium nitrate hydrate, chromium (III) nitrate nonahydrate, lithium tungstate and ammonium metatungstate were used as a source of metallic ca ons.• Separately, the citrate and tungstate solu ons were prepared by
dissolving appropriate amount of reagents. After complete homogenization, half of the citric acid solution was added to the nitrate solution and another half to the tungstate solution, and both solutions were mixed together. The resulting clear solution of citric acid complexed metal ions, the appropriate amount of ethylene glycol was added and this mixture was heated to about 70 deg C on a hot plate with constant stirring. After half an hour the
mixture was transferred to the dryer and kept at 100 deg C for 7 days.• The obtained brown resin was heat-treated for 2 h at temperatures ranging from 460 to 800 deg C to obtain carbon free nanocrystalline powders of LiIn(WO4)2:Cr^3+.
Details on Tests Examining Physicochemical Property:
• X-Ray diffraction (XRD) and transmission electron microscopy (TEM) were used to examine the phase transition.
Individual Particle Diameters Tested (nm):
18-25, 60-100, 130-570
Solution characteristics (pH, cosolvents or other additives, sonication, ionic strength)
• pH: No data• Cosolvents or other addi ves: ethylene glycol, citric acid• Sonica on: Not performed• Ionic strength (conductivity): No data
Min Diameter Tested (nm): 18-25
Max Diameter Tested (nm): 130-570
Specific Surface Area (SSA) (m2/g): No data
Bulk materials tested (≥ 1000 nm): No
Information on Analytical Methods Used to Determine Particle Size:
The particle size and morphology of LiIn(WO4)2 were determined using a 200 kV Phillips super-Twin transmission electron microscope (TEM) providing 0.24 nm resolution.
List of Relevant Findings: • Tungstate undergoes two size-induced phase transitions from the structure similar to LiFe(WO4)2 into the structure similar to LiYb(WO4)2 and then into the structure of LiGa(WO4)2 type. These transitions occur for the critical particle size of about 100 and 30 nm, and the could be attributed mainly to some changes in the distribution of the sites occupied by Li+ and In3+ ions (associated with modification of the Li and In sub lattice).
Page B-46 of 177
Appendix B: Copy of DatabaseSize versus Effect Relationship Observed by Authors?:
Yes
Mathematical Relationship Identified in Paper (if applicable):
None
Author‐Identified 'Bright Line' Particle Size (diameter) Threshold (nm) ‐ List if applicable:
30, 100
Notes on 'Bright Line' Threshold: Phase transitions occur at these sizes.
ARCADIS Discussion of Results None
Nature of Size versus Effect Relationship (if applicable)
As the particle size decreases, tungstate undergoes two size-induced phase transitions at 100 and 30 nm.
Physico‐chemical Property Investigated:
Crystalline structure (structure)
Priority of Property: High
Relevant for A1 Project?: Yes
Type of nanomaterial (eg, nanometal, nanometal oxide):
Supported nanometal
Particle Functionalization or Capping Agent (if applicable):
None
List Study Objective(s) Relevant to Investigated Physicochemical Property:
• In this study, we report on the synthesis of both homometallic and heterometallic nanoparticles of Pt, Ru, and Pt-Ru. Using a battery of analytical tools, including X-ray photoelectron spectroscopy (XPS), scanning transmission electron microscopy (STEM), energy-dispersive X-ray analysis (EDX), and electron nanodiffraction, we characterize the size distributions, compositions, and microstructures of the particles.
Hills et al. (2003)
Specific Details on Tested Nanomaterial(s)
• 10% Carbon-supported platinum (Pt/C) and ruthenium trichloride
Details on Preparation Method of Nanomaterial(s):
• Solutions of RuCl3, (CH3)2Pt(COD), and H2PtCl6 were made by dissolving each in tetrahydrofuran (THF), followed by sonication to ensure complete dissolution. To deposit Ru onto commercial samples of supported Pt particles (Ru:Pt/C), the supported Pt particles were added to a RuCl3 solution, sonicated, and then dried under a stream of N2. To ensure homogeneity, the cycle of THF addition, sonication, and drying was repeated a total of three
mes.• The same process was followed for the deposi on of Pt onto commercial samples of Ru par cles (Pt:Ru/C), except carbon supported Ru particles were added to a solution of either (CH3)2Pt(COD) or H2PtCl6. Monometallic nanoparticles were prepared by incorporating each of the three precursors onto the carbon supports
Vulcan XC-72 (VXC) and Shawinigan Acetylene Black (SAB) using the same method described above.• A er incorporating the metallic salts, reduction was accomplished by placing the samples in a custom tube furnace under a constant flow of H2. In addition, a sample of Ru on Pt was also reduced at a higher temperature, 823 K, to examine the affect of temperature on the final structural states of the particles.
Details on Tests Examining Physicochemical Property:
• The ordered microstructure of the nanoparticles was probed by electron nanodiffraction. The specimens were prepared by dipping copper mesh, holey carbon grids with silicon crystals into the reduced nanopowders. An incident electron beam probe was focused on the nanoparticles of interest, and the diffracted electrons were collected on a phosphor screen. Due to the fact that the diffraction patterns for individual nanoparticles degrade during exposure to the electron beam, the diffraction images were gathered promptly. A low-light level television camera was used to this end and Scion Image (NIH/Scion Corp.) software used to capture the images. Digital Microscopist (Virtual Laboratories) software was then used to analyze the patterns, using diffraction patterns from the silicon crystals to calibrate the camera constant.
Individual Particle Diameters Tested (nm):
ca. 2.0 (mean)
Solution characteristics (pH, cosolvents or other additives, sonication, ionic strength)
Not applicable
Page B-47 of 177
Appendix B: Copy of DatabaseMin Diameter Tested (nm): ca. 0.1
Max Diameter Tested (nm): 10
Specific Surface Area (SSA) (m2/g): No data
Bulk materials tested (≥ 1000 nm): No
Information on Analytical Methods Used to Determine Particle Size:
Scanning transmission electron microscopy (STEM) was used to determine particle size.
List of Relevant Findings: • The nanophase diagrams show a dominant preference for face centeredcubic (fcc) (compared to hexagonal-closest packed, hcp) structures in the size range tested at essentially all but the most Ru-rich compositions.
Size versus Effect Relationship Observed by Authors?:
None
Mathematical Relationship Identified in Paper (if applicable):
None
Author‐Identified 'Bright Line' Particle Size (diameter) Threshold (nm) ‐ List if applicable:
None
Notes on 'Bright Line' Threshold: A size-dependent phase preference was not identified in this paper.
ARCADIS Discussion of Results None
Nature of Size versus Effect Relationship (if applicable)
N/A
Physico‐chemical Property Investigated:
Crystalline structure (structure)
Priority of Property: High
Relevant for A1 Project?: Yes
Type of nanomaterial (eg, nanometal, nanometal oxide):
Supported nanometal
Particle Functionalization or Capping Agent (if applicable):
None
List Study Objective(s) Relevant to Investigated Physicochemical Property:
• In this study, we report on the synthesis of both homometallic and heterometallic nanoparticles of Pt, Ru, and Pt-Ru. Using a battery of analytical tools, including X-ray photoelectron spectroscopy (XPS), scanning transmission electron microscopy (STEM), energy-dispersive X-ray analysis (EDX), and electron nanodiffraction, we characterize the size distributions, compositions, and microstructures of the particles.
Appendix B: Copy of DatabaseDetails on Preparation Method of Nanomaterial(s):
• Solutions of RuCl3, (CH3)2Pt(COD), and H2PtCl6 were made by dissolving each in tetrahydrofuran (THF), followed by sonication to ensure complete dissolution. To deposit Ru onto commercial samples of supported Pt particles (Ru:Pt/C), the supported Pt particles were added to a RuCl3 solution, sonicated, and then dried under a stream of N2. To ensure homogeneity, the cycle of THF addition, sonication, and drying was repeated a total of three
mes.• The same process was followed for the deposi on of Pt onto commercial samples of Ru par cles (Pt:Ru/C), except carbon supported Ru particles were added to a solution of either (CH3)2Pt(COD) or H2PtCl6. Monometallic nanoparticles were prepared by incorporating each of the three precursors onto the carbon supports
Vulcan XC-72 (VXC) and Shawinigan Acetylene Black (SAB) using the same method described above.• A er incorporating the metallic salts, reduction was accomplished by placing the samples in a custom tube furnace under a constant flow of H2. In addition, a sample of Ru on Pt was also reduced at a higher temperature, 823 K, to examine the affect of temperature on the final structural states of the particles.
Details on Tests Examining Physicochemical Property:
• The ordered microstructure of the nanoparticles was probed by electron nanodiffraction. The specimens were prepared by dipping copper mesh, holey carbon grids with silicon crystals into the reduced nanopowders. An incident electron beam probe was focused on the nanoparticles of interest, and the diffracted electrons were collected on a phosphor screen. Due to the fact that the diffraction patterns for individual nanoparticles degrade during exposure to the electron beam, the diffraction images were gathered promptly. A low-light level television camera was used to this end and Scion Image (NIH/Scion Corp.) software used to capture the images. Digital Microscopist (Virtual Laboratories) software was then used to analyze the patterns, using diffraction patterns from the silicon crystals to calibrate the camera constant.
Individual Particle Diameters Tested (nm):
ca. 2.5 (mean)
Solution characteristics (pH, cosolvents or other additives, sonication, ionic strength)
Not applicable
Min Diameter Tested (nm): ca. 0.1
Max Diameter Tested (nm): 10
Specific Surface Area (SSA) (m2/g): No data
Bulk materials tested (≥ 1000 nm): No
Information on Analytical Methods Used to Determine Particle Size:
Scanning transmission electron microscopy (STEM) was used to determine particle size.
List of Relevant Findings: • The nanophase diagrams show a dominant preference for face centeredcubic (fcc) (compared to hexagonal-closest packed, hcp) structures in the size range tested at essentially all but the most Ru-rich compositions.
Size versus Effect Relationship Observed by Authors?:
None
Mathematical Relationship Identified in Paper (if applicable):
None
Author‐Identified 'Bright Line' Particle Size (diameter) Threshold (nm) ‐ List if applicable:
None
Notes on 'Bright Line' Threshold: A size-dependent phase preference was not identified in this paper.
ARCADIS Discussion of Results None
Nature of Size versus Effect Relationship (if applicable)
N/A
Page B-49 of 177
Appendix B: Copy of Database
Physico‐chemical Property Investigated:
Crystalline structure (structure)
Priority of Property: High
Relevant for A1 Project?: Yes
Type of nanomaterial (eg, nanometal, nanometal oxide):
Supported nanometal
Particle Functionalization or Capping Agent (if applicable):
None
List Study Objective(s) Relevant to Investigated Physicochemical Property:
• The authors report on the synthesis of both homometallic and heterometallic nanoparticles of Pt, Ru, and Pt-Ru. A battery of analytical tools, including X-ray photoelectron spectroscopy (XPS), scanning transmission electron microscopy (STEM), energy-dispersive X-ray analysis (EDX), and electron nanodiffraction, were used to characterize the size distributions, compositions, and microstructures of the particles.
• Solutions of RuCl3, (CH3)2Pt(COD), and H2PtCl6 were made by dissolving each in tetrahydrofuran (THF), followed by sonication to ensure complete dissolution. To deposit Ru onto commercial samples of supported Pt particles (Ru:Pt/C), the supported Pt particles were added to a RuCl3 solution, sonicated, and then dried under a stream of N2. To ensure homogeneity, the cycle of THF addition, sonication, and drying was repeated a total of three
mes.• The same process was followed for the deposi on of Pt onto commercial samples of Ru par cles (Pt:Ru/C), except carbon supported Ru particles were added to a solution of either (CH3)2Pt(COD) or H2PtCl6. Monometallic nanoparticles were prepared by incorporating each of the three precursors onto the carbon supports
Vulcan XC-72 (VXC) and Shawinigan Acetylene Black (SAB) using the same method described above.• A er incorporating the metallic salts, reduction was accomplished by placing the samples in a custom tube furnace under a constant flow of H2. In addition, a sample of Ru on Pt was also reduced at a higher temperature, 823 K, to examine the affect of temperature on the final structural states of the particles.
Details on Tests Examining Physicochemical Property:
• The ordered microstructure of the nanoparticles was probed by electron nanodiffraction. The specimens were prepared by dipping copper mesh, holey carbon grids with silicon crystals into the reduced nanopowders. An incident electron beam probe was focused on the nanoparticles of interest, and the diffracted electrons were collected on a phosphor screen. Due to the fact that the diffraction patterns for individual nanoparticles degrade during exposure to the electron beam, the diffraction images were gathered promptly. A low-light level television camera was used to this end and Scion Image (NIH/Scion Corp.) software used to capture the images. Digital Microscopist (Virtual Laboratories) software was then used to analyze the patterns, using diffraction patterns from the silicon crystals to calibrate the camera constant.
Individual Particle Diameters Tested (nm):
ca. 3.0 (mean)
Solution characteristics (pH, cosolvents or other additives, sonication, ionic strength)
Not applicable
Min Diameter Tested (nm): ca. 0.15
Max Diameter Tested (nm): ca. 9
Specific Surface Area (SSA) (m2/g): No data
Bulk materials tested (≥ 1000 nm): No
Information on Analytical Methods Used to Determine Particle Size:
Scanning transmission electron microscopy (STEM) was used to determine particle size.
List of Relevant Findings: • The Pt-(fcc) structure dominated the apparent phase diagram; however, the few hcp particles present had compositions that projected well into the bulk Pt(fcc) region. It thus appears that no clear bulk-like fcc/hcp phase boundary exists for bimetallic nanoparticles with sizes of a few nanometers. The data, when taken together, suggest that metastable structures can be obtained but that, on average, particles with fcc habits tend to dominate the product distribution.
Page B-50 of 177
Appendix B: Copy of DatabaseSize versus Effect Relationship Observed by Authors?:
None
Mathematical Relationship Identified in Paper (if applicable):
None
Author‐Identified 'Bright Line' Particle Size (diameter) Threshold (nm) ‐ List if applicable:
None
Notes on 'Bright Line' Threshold: A size-dependent phase preference was not identified in this paper.
ARCADIS Discussion of Results None
Nature of Size versus Effect Relationship (if applicable)
N/A
Physico‐chemical Property Investigated:
Crystalline structure (structure)
Priority of Property: High
Relevant for A1 Project?: Yes
Type of nanomaterial (eg, nanometal, nanometal oxide):
Nanometal alloy
Particle Functionalization or Capping Agent (if applicable):
None
List Study Objective(s) Relevant to Investigated Physicochemical Property:
• The crystal structures of these barium titanate nanoparticles were investigated as a function of the size and the temperature using synchrotron radiation x-ray diffraction XRD measurement.
Hoshina et al. (2006)
Specific Details on Tested Nanomaterial(s)
• Barium titanate (BaTiO3)
Details on Preparation Method of Nanomaterial(s):
• BaTiO3 nanopar cles with various sizes were preparedby the two-step thermal decomposi on of barium tanyl oxalate [BaTiO(C2O4)2∙4H2 and posthea ng treatment.• At the first step, the thermal decomposi on was
performed at 500 deg C for 3 h in air and resulted in the forma on of the whiteintermediate compounds Ba2Ti2O5∙CO3 with almost amorphousstructure.• At the following second step, this compound was annealed at
650 deg C for 3 h in the vacuum of around 1 Pa, and resulted in the formation of the BaTiO3 nanoparticles. Moreover, these nanoparticles were annealed in air at various temperatures from 700 to 1100 deg C for 3 h, to control particle sizes of BaTiO3. The impurities in the products were analyzed using Fourier transform infrared spectrometer (FTIR) and differential thermal analysis with thermogravimetry (TG-DTA). The dielectric constants of the particles were also measured using the powder dielectric measurement method.
Details on Tests Examining Physicochemical Property:
• High intensity synchrotron radiation XRD data were collected using the large Debye-Sherrer camera. High energy x ray with wavelength of 0.05 nm was used as incident x ray. The BaTiO3 nanoparticles were sealed into a glass capillary of 0.2 mm inside diameter. The diffraction pattern was recorded on the imaging plate of the camera with
transmission geometry. Sample temperature was controlled by N2 gas flow system from 24 to 150 deg C.• The observed diffraction data was analyzed using Rietveld analysis. Normally, the two phase model (i.e., the surface cubic phase and the bulk tetragonal phase), was applied to analyze the crystal structure of the BaTiO3
nanopar cles.• For the simplifica on of the calcula on, a single phase model was applied to refine the crystal structure (i.e., it was assumed that the whole particle was composed of a tetragonal single phase (P4mm) or a cubic single phase (Pm-3m)).
Individual Particle Diameters Tested (nm):
20, 30, 40, 85, 140, 215, 430, 1000
Solution characteristics (pH, cosolvents or other additives, sonication, ionic strength)
Not applicable
Page B-51 of 177
Appendix B: Copy of DatabaseMin Diameter Tested (nm): 20
Max Diameter Tested (nm): 1000
Specific Surface Area (SSA) (m2/g): No data
Bulk materials tested (≥ 1000 nm): No
Information on Analytical Methods Used to Determine Particle Size:
• The average particle sizes were estimated using transmission electron microscope (TEM).
List of Relevant Findings: • For each nanoparticle, the crystal symmetry was determined by comparing the FWHM of (002) and (200) refractions with that of (111) refraction at 24 and 150 deg C. As a result, the room temperature crystal symmetries of the BaTiO3 nanoparticles with 20 and 30 nm were assigned to cubic Pm-3m while those of the particles over 40 nm were assigned to tetragonal P4mm. This result revealed that the critical size of BaTiO3 nanoparticles, which is
the size of ferroelectric phase transi on from tetragonal to cubic at room temperature, exists at around 30 nm• With decreasing particle sizes over 85 nm, the lattice parameter (c) gradually decreased while lattice parameter (a)
gradually increased over the en re range tested.• With decreasing par cle sizes, over 40 nm, the c/a ra o gradually decreased, and at around 30 nm, drastically decreased down to 1.00. This revealed that the discontinuous change of the c/a ratio was existent in the sizes between 30 and 40 nm, which supported that the critical size of BaTiO3 nanoparticles exists at around 30 nm.
Size versus Effect Relationship Observed by Authors?:
Yes
Mathematical Relationship Identified in Paper (if applicable):
A mathematical relationship relating the lattice parameters directly to particle size is not presented in this paper; however, a relationship relating the lattice parameters to the cube root of the cell volume is presented
as:V^(1/3) = (a^2*c)^(1/3)Where:V = cell volume
Author‐Identified 'Bright Line' Particle Size (diameter) Threshold (nm) ‐ List if applicable:
30
Notes on 'Bright Line' Threshold: The critical size of BaTiO3 nanoparticles, which is the size of ferroelectric phase transition from tetragonal to cubic at room temperature, exists at around 30 nm.
ARCADIS Discussion of Results None
Nature of Size versus Effect Relationship (if applicable)
At a particle size of 30 nm, the phase transitions from tetragonal to cubic as particle size decreases. The lattice parameters (a) gradually increased and (c) gradually decreased as particle size decreases.
Physico‐chemical Property Investigated:
Reactivity
Priority of Property: High
Relevant for A1 Project?: Yes
Type of nanomaterial (eg, nanometal, nanometal oxide):
Nanometal
Particle Functionalization or Capping Agent (if applicable):
None
List Study Objective(s) Relevant to Investigated Physicochemical Property:
• The authors report on the spectroelectrochemical investigations of quantized zinc oxide colloids of different sizes in solution. Their objective was to evaluate size-dependent redox potentials.
Hoyer and Weller (1994)
Specific Details on Tested Nanomaterial(s)
• Zinc oxide (ZnO) colloids
Details on Preparation Method of Nanomaterial(s):
No data
Details on Tests Examining Physicochemical Property:
• An optically transparent thin layer electrode was used to measure the redox potential of zinc colloids using a gold electrode.• Photochemical reduc on and tra on of the colloids was carried out in a quartz cell in the absence of
air. The par cles were illuminated with light of the 3 13 nm line of a 500 W Hg/xenon lamp.• An Ag/AgCl electrode in a solution of 1 M LiCl in ethanol was used as a reference.
Solution characteristics (pH, cosolvents or other additives, sonication, ionic strength)
Not applicable
Page B-52 of 177
Appendix B: Copy of DatabaseMin Diameter Tested (nm): 2.55
Max Diameter Tested (nm): 4.22
Specific Surface Area (SSA) (m2/g): No data
Bulk materials tested (≥ 1000 nm): No
Information on Analytical Methods Used to Determine Particle Size:
The size of the particles was determined using a Phillips CM 12 ST transmission electron microscope.
List of Relevant Findings: • The critical potential increases with decreasing particle size, i.e., the expected behavior if electrons are transferred into the quantized electronic levels.
Size versus Effect Relationship Observed by Authors?:
Yes
Mathematical Relationship Identified in Paper (if applicable):
None
Author‐Identified 'Bright Line' Particle Size (diameter) Threshold (nm) ‐ List if applicable:
None
Notes on 'Bright Line' Threshold: None observed
ARCADIS Discussion of Results None
Nature of Size versus Effect Relationship (if applicable)
The critical potential increases with decreasing particle size
Physico‐chemical Property Investigated:
Crystalline structure (structure)
Priority of Property: High
Relevant for A1 Project?: Yes
Type of nanomaterial (eg, nanometal, nanometal oxide):
Nanometal sulfide
Particle Functionalization or Capping Agent (if applicable):
Mercaptoethanol-capped
List Study Objective(s) Relevant to Investigated Physicochemical Property:
• The phase transformation of sphalerite (cubic ZnS) to wurtzite (hexagonal ZnS) in Zn nanoparticles was investigated.
Huang and Banfield (2005)
Specific Details on Tested Nanomaterial(s)
• Zinc sulfide (ZnS)
Details on Preparation Method of Nanomaterial(s):
• Sodium sulfide aqueous solution was dropped into equal molar zinc chloride aqueous solution in the presence of 0.1 M mercaptoethanol at pH 10.2. Impurities were removed by dialysis treatment (until the pH was 8.0 and Cl was below detection). The initial nanocrystalline ZnS product was coarsened in aqueous solution at 225 deg C and 25 bar in hydrothermal bombs.
Details on Tests Examining Physicochemical Property:
• The phase composition of a sample can be calculated from the integrated intensities of the wurtzite (100) peak (2theta = 27.01) and the overlapping sphalerite (111) and wurtzite (002) peaks (2theta = 28.64). If the intensity ratio of wurtzite (100) to the overlapping peak is R, the weight fraction of wurtzite (Fw) can be calculated from:
Fw = R / (Iw*Iws – R(Iws – 1))Where Iw = 3.88 represents the intensity ra o of the wurtzite (100) peak to the (002) peak, and Iws = 0.491 is the intensity ra o of the wurtzite (002) peak to the sphalerite (111) peak.• High-
resolution transmission electron microscopy (HRTEM) was used to determine the particle morphology and for microstructure analysis and phase identification. Samples were prepared for HRTEM study by dispersing the ZnS powder onto holey carbon-coated Formvar supported by a copper mesh grid. HRTEM analyses were performed using a Philips CM200 UltraTwin HRTEM.
Individual Particle Diameters Tested (nm):
No data
Solution characteristics (pH, cosolvents or other additives, sonication, ionic strength)
• pH: 8-10.2 (prepara on)• Cosolvents or other addi ves: None• Sonica on: Not performed• Ionic strength (conductivity): No data
Page B-53 of 177
Appendix B: Copy of DatabaseMin Diameter Tested (nm): No data
Max Diameter Tested (nm): No data
Specific Surface Area (SSA) (m2/g): No data
Bulk materials tested (≥ 1000 nm): No
Information on Analytical Methods Used to Determine Particle Size:
X-ray diffraction (XRD) was used to identify the phase composition and average particle sizes of initial and coarsened samples. Diffraction data were recorded using a Scintag PADV diffractometer with Cu KR radiation (35 kV, 40 mA) in the step scanning mode. The 2theta scanning range was from 15 deg to 90 deg in steps of 0.02 deg with a collection time of 4 s per step. The average crystallite size was calculated from the peak broadening using the Scherrer equation
List of Relevant Findings: • TEM images were collected from samples taken after 0.5, 4, 32, and 120 h of coarsening. Most particles were 100% sphalerite. The sample coarsened for 4 h contained irregularly shaped sphalerite particles containing many twins and stacking faults, consistent with OA-based growth. Only in one case, wurtzite was found as a cap on the large sphalerite crystals surface over hundreds of measurements. The interface between sphalerite and wurtzite is
about 17 nm.• Around 90% of the par cles in samples reacted for longer mes (32 and 120 h) were sphalerite (measured from TEM observation), but wurtzite (several unit cells) was present on the surfaces of some cases. The partial transformation of sphalerite particles to wurtzite rather than formation of discrete wurtzite particles is
consistent with the observa on of highly anisotropic (non-Gaussian) XRD peaks.• Par al transforma on of sphalerite to wurtzite accompanies crystal growth of ZnS nanoparticles in hydrothermal solution. Formation of wurtzite over relatively short reaction times at this temperature implies a phase transformation mechanism that differs from that operating in bulk ZnS. The transformation did not go to completion within the rounded sphalerite particles, but stopped when the diameter of the interface between sphalerite and wurtzite reached 22 nm.
Size versus Effect Relationship Observed by Authors?:
None
Mathematical Relationship Identified in Paper (if applicable):
None
Author‐Identified 'Bright Line' Particle Size (diameter) Threshold (nm) ‐ List if applicable:
None
Notes on 'Bright Line' Threshold: None
ARCADIS Discussion of Results None
Nature of Size versus Effect Relationship (if applicable)
N/A
Physico‐chemical Property Investigated:
Crystalline structure (structure)
Priority of Property: High
Relevant for A1 Project?: Yes
Type of nanomaterial (eg, nanometal, nanometal oxide):
Nanometal alloy oxide
Particle Functionalization or Capping Agent (if applicable):
None
List Study Objective(s) Relevant to Investigated Physicochemical Property:
• In this paper we report the change of the tetragonal phase toward the cubic one for reducing the diameter of the BaTiO3 nanocrystals from 140 to 30 nm.
Huang et al. (2007)
Specific Details on Tested Nanomaterial(s)
• Barium titanium trioxide (BaTiO3)
Page B-54 of 177
Appendix B: Copy of DatabaseDetails on Preparation Method of Nanomaterial(s):
• The glycothermal treatment method was adopted to synthesize BaTiO3 nanocrystals. Barium hydroxide octahydrate (Ba(OH)2∙8H2O) was used as the source of Ba and titanium tetrachloride (TiCl4) was used as the source of Ti. Amorphous titanium hydrous gel was prepared by adding 30 ml NH4OH (24%) drop wise into 160 ml 0.1 M TiOCl2 solution at 60 deg C for 2 h with stirring. The gel was separated and washed with DI water by three cycles of centrifugation for 4 min at 4000 rpm in a centrifuge. Excess water was decanted after final washing and
the wet precursor was redispersed in a mixture of water and 1,4-butanediol.• Ba(OH)2∙8H2O was then added into a mixture of water and 1,4- butanediol (1,4-butanediol/deionized water: B/W = 1, Ba:Ti molar ratio = 1). To acquire BaTiO3 particles with various grain sizes, reactions were carried out at the desired temperature from 100 to 220 deg C for 12 h; the larger sizes of particles require a higher reaction temperature. After glycothermal treatment, the flask was cooled to RT. The powder was then washed with acetic acid solution to remove the residual BaCO3 and Ba ions. After washing, the recovered powder was dried at 60 deg C on a hot plate for 48 h.
Details on Tests Examining Physicochemical Property:
• The XRD data of the prepared BaTiO3 nanoparticles were collected on the imaging plate with transmission geometry using high intensity synchrotron radiation with wavelength of 0.056357 nm. A single tetragonal- phase (P4mm) model was applied to refine the crystal structure with the XRD data by using the Rietveld analysis
computer program General Structure Analysis System.• The morphology of the synthesized par cles was observed using field-emission scanning electron microscopy. The non polarized Raman spectra were collected by a Spex 1877C triple spectrograph equipped with a liquid-nitrogen-cooled charge-coupled device at 140 K under the excitation of an Ar+ laser at 488 nm wavelength.
Individual Particle Diameters Tested (nm):
30, 60, 140, >1000
Solution characteristics (pH, cosolvents or other additives, sonication, ionic strength)
• pH: No data• Cosolvents or other addi ves: mixture of 1,4-butanediol/deonized water used as the solvent• Sonica on: No data• Ionic strength (conduc vity): No data
Min Diameter Tested (nm): 30
Max Diameter Tested (nm): >1000
Specific Surface Area (SSA) (m2/g): No data
Bulk materials tested (≥ 1000 nm): Yes
Information on Analytical Methods Used to Determine Particle Size:
The morphology/size of the synthesized particles was observed using field-emission scanning electron microscopy (FESEM, JEOL 6500).
List of Relevant Findings: • Par cles were decreasingly tetragonal with decreasing par cle size (the c/a ra o decreased to approach 1).• Cell volume increased with decreasing par cle size.• The la ce parameters (a) and (c) both increased with decreasing
particle size from bulk (~1000 nm) to nanoparticulate (30-140 nm) and within nanoparticulate from 140 to 30 nm.
Size versus Effect Relationship Observed by Authors?:
Yes
Mathematical Relationship Identified in Paper (if applicable):
None
Author‐Identified 'Bright Line' Particle Size (diameter) Threshold (nm) ‐ List if applicable:
None
Notes on 'Bright Line' Threshold: The tetragonality decreases with decreasing particle size; however, a 'bright line' particle size threshold cannot be determined from these data.
ARCADIS Discussion of Results None
Nature of Size versus Effect Relationship (if applicable)
Particles were decreasingly tetragonal with decreasing particle size. The lattice parameters (a) and (c) both increased with decreasing particle size from bulk (~1000 nm) to nanoparticulate (30-140 nm) and within nanoparticulate from 140 to 30 nm.
Page B-55 of 177
Appendix B: Copy of Database
Physico‐chemical Property Investigated:
Crystalline structure (structure)
Priority of Property: High
Relevant for A1 Project?: Yes
Type of nanomaterial (eg, nanometal, nanometal oxide):
Nanometal alloy oxide
Particle Functionalization or Capping Agent (if applicable):
None
List Study Objective(s) Relevant to Investigated Physicochemical Property:
• To study the finite size effect on the phase transition in PbTiO(3) fine particles.
Ishikawa et al. (1996)
Specific Details on Tested Nanomaterial(s)
• Lead titanate (PbTiO(3))
Details on Preparation Method of Nanomaterial(s):
• Fine particles were synthesized by hydrolyzing a mixture of the constituent metal alkoxides. Particles were crystallized by calcination in air at about 400 to 550 deg C. The size was controlled by controlling the calcination temperature and time. Smaller particles were obtained by calcination at temperatures lower than 500 deg C.
Details on Tests Examining Physicochemical Property:
• Raman scattering measurements of fine particles were carried out to study the dependence of the phase transition temperature on the particle size. The Raman spectrum was measured in the backscattering geometry
using the 514.5 nm line of an Ar ion laser.• The X-ray diffrac on pa er was also measured to study the tetragonality, c/a ratio.
Individual Particle Diameters Tested (nm):
14.2, 16.8, 40.5 1200
Solution characteristics (pH, cosolvents or other additives, sonication, ionic strength)
Not applicable
Min Diameter Tested (nm): 14.2
Max Diameter Tested (nm): 1200
Specific Surface Area (SSA) (m2/g): No data
Bulk materials tested (≥ 1000 nm): Yes
Information on Analytical Methods Used to Determine Particle Size:
The average size was calculated from the full width at half-maximum (FWHM) using Scherrer's equation, taking into consideration the apparatus conditions. The shape and size were also observed by transmission electron microscopy (TEM).
List of Relevant Findings: • The critical size determined by Raman scattering was 10.7 nm and that determined from the c/a ratio by XRD was 11.7 nm. Below this critical size, the cubic phase exists and above this critical size the tetragonal phase exists (the c/a ratio approaches 1.0635, the value for bulk particles).
Size versus Effect Relationship Observed by Authors?:
Yes
Mathematical Relationship Identified in Paper (if applicable):
None
Author‐Identified 'Bright Line' Particle Size (diameter) Threshold (nm) ‐ List if applicable:
11.7
Notes on 'Bright Line' Threshold: Below a critical size of 11.7 nm, the cubic (ferroelectric) phase exists and above this critical size the tetragonal phase exists (the c/a ratio approaches 1.0635, the value for bulk particles).
ARCADIS Discussion of Results None
Nature of Size versus Effect Relationship (if applicable)
The c/a ratio decreases with decreasing particle size.
Page B-56 of 177
Appendix B: Copy of Database
Physico‐chemical Property Investigated:
Reactivity
Priority of Property: High
Relevant for A1 Project?: Yes
Type of nanomaterial (eg, nanometal, nanometal oxide):
Nanometal
Particle Functionalization or Capping Agent (if applicable):
Citrate
List Study Objective(s) Relevant to Investigated Physicochemical Property:
• The voltammetry of Ag nanoparticle (Ag NP) oxidation as a function of size was studied.
Ivanova and Zamborini (2010)
Specific Details on Tested Nanomaterial(s)
• Silver (Ag)
Details on Preparation Method of Nanomaterial(s):
• Different sized citrate-capped Ag NPs, were synthesized ranging in diameter from approximately 8 to 50 nm, by a seed mediated growth procedure. This involved the synthesis of Ag NP “seeds” first by the reduction of AgNO3
with NaBH4 in water in the presence of trisodium citrate.• We then synthesized larger sizes by growing the Ag NP “seeds” into larger NPs by heating a solution of Ag NP “seeds”, AgNO3, and trisodium citrate. The final diameter of the grown Ag NPs increased with increasing AgNO3 (Ag+)/Ag seed mole ratio during the synthesis (ratios of 5:1, 10:1, 20:1, 40:1, 60:1 and 100:1 were used).
Details on Tests Examining Physicochemical Property:
• An amine-functionalized indium tin oxide (ITO) coated glass electrode was immersed into a solution of the Ag NPs, which leads to electrosta c a achment. The coverage depended on the immersion me.• Linear sweep
voltammetry (LSV) was performed on the Glass/ ITO/NH3 +/Ag NP electrode to directly measure Ep for Ag oxidation. The important features are (1) Ag NP size control, (2) attachment of Ag NPs through an organic linker to remove the effect of direct interactions between the Ag NPs and Glass/ITO on the oxidation, and (3) control of Ag
NP coverage.• Linear sweep voltammograms (LSVs) were obtained from 0.1 to 1.0 V in 0.1 M H2SO4 at 1.0 mV/s of Glass/ITO/NH2 electrodes coated with Ag NPs of different sizes.
Individual Particle Diameters Tested (nm):
10.4, 16.8, 20.1, 25.8, 29.4, 36.5, 44.2 (mean of AFM and SEM values)
Solution characteristics (pH, cosolvents or other additives, sonication, ionic strength)
• pH: No data• Cosolvents or other addi ves: trisodium citrate• Sonica on: Not performed• Ionic strength (conductivity): No data
Min Diameter Tested (nm): 10.4
Max Diameter Tested (nm): 44.2
Specific Surface Area (SSA) (m2/g): No data
Bulk materials tested (≥ 1000 nm): No
Information on Analytical Methods Used to Determine Particle Size:
The different Ag NPs in solution were characterized by optical methods and by atomic force microscopy (AFM) and scanning electron microscopy (SEM) after electrostatic attachment to Si/SiOx/NH2 and Glass/ITO/NH2 surfaces, respectively. The Ag NPs were fairly well-spaced and isolated on the surface (very few aggregates).
List of Relevant Findings: • The average peak potential (Ep) values shift positive with increasing Ag NP diameter and are all statistically different from one another except for the ratio 60 and 100 Ag NPs. Ep shifts ∼107 mV from the smallest seed particles to the largest ratio 100 Ag NPs. The observed negative shift in Ep with size is not due to diffusion, but rather due to a negative shift in the standard redox potential (E0) as the size decreases.
Size versus Effect Relationship Observed by Authors?:
Yes
Mathematical Relationship Identified in Paper (if applicable):
None
Author‐Identified 'Bright Line' Particle Size (diameter) Threshold (nm) ‐ List if applicable:
None
Notes on 'Bright Line' Threshold: The average peak potential (Ep) values shift positive with increasing Ag NP diameter (i.e., less catalytic activity); however, this relationship does not allow for determination of a 'bright line' particle size threshold over the range of particles tested.
ARCADIS Discussion of Results None
Nature of Size versus Effect Relationship (if applicable)
The redox potential decreases with decreasing particle size (i.e., greater tendency to be oxidiezed as particle size decreases).
Page B-57 of 177
Appendix B: Copy of Database
Physico‐chemical Property Investigated:
Photocatalytic activity
Priority of Property: High
Relevant for A1 Project?: Yes
Type of nanomaterial (eg, nanometal, nanometal oxide):
Nanometal
Particle Functionalization or Capping Agent (if applicable):
None
List Study Objective(s) Relevant to Investigated Physicochemical Property:
• To investigate the decomposition of methylene blue by TiO2 nanoparticles by varying particle size and anatase mass fraction (at a constant particle size of 15 nm).
Jang et al. (2001)
Specific Details on Tested Nanomaterial(s)
• Titanium dioxide (TiO2)• 45% anatase
Details on Preparation Method of Nanomaterial(s):
• Vapor-phase synthesis from TiCl4 in a flame reactor was used to prepare TiO2 nanoparticles. Through the combustion of hydrogen, water vapor and oxygen exist in the flame. Thus, TiCl4 is converted to TiO2 in two ways: hydrolysis and oxidation.
Details on Tests Examining Physicochemical Property:
• The photocatalytic properties of TiO2 nanoparticles were characterized through the decomposition of methylene blue.• Decomposi on of methylene blue was determined by a photocatalysis evalua on checker (PEC), which
consists of a light emitting element and receiving element that are connected to a black light (UV quantity about 1mW) by means of a fiber. The absorbance change (ABS) between two elements with decomposition of colored film (methylene blue) by photocatalysis can be determined relatively with PEC. Large absolute value of the ABS
means the high decomposi on of methylene blue by photocatalyst. • Experimental procedure was as follows: one gram of TiO2 nanoparticles were put into one liter of coating agent, and agitated to obtain full suspension. Then thin TiO2 film was prepared with coating solution including TiO2 nanoparticles on the surface of stainless steel plate of 10 × 20 cm in dimension by using a bar coater, and dried for 24 h. TiO2 coated plate was covered with methylene blue solution of 1 mmol/L by dipping, and dried for 2 h. The decomposition of methylene blue was measured by PEC.
Individual Particle Diameters Tested (nm):
15, 23, 26, 30
Solution characteristics (pH, cosolvents or other additives, sonication, ionic strength)
Not applicable
Min Diameter Tested (nm): 15
Max Diameter Tested (nm): 30
Specific Surface Area (SSA) (m2/g): ca. 50-102
Bulk materials tested (≥ 1000 nm): No
Information on Analytical Methods Used to Determine Particle Size:
Particle diameter was determined by BET and transmission electron microscopy (TEM).
List of Relevant Findings: • The phase composition of TiO2 nanoparticles was 45% anatase in mass fraction. As the particle size decreased, the absolute value of the absorbance change, which represents the degree of the decomposition of methylene
blue, increased.• The effect of the phase composi on at the fixed par cle size on the decomposi on of methylene blue was studied. The particle size of TiO2 nanoparticles was about 15 nm in average diameter. The effect of anatase mass fraction played a more important role in enhancing the degrees of decomposition of methylene blue than that of particle size.
Page B-58 of 177
Appendix B: Copy of DatabaseSize versus Effect Relationship Observed by Authors?:
Yes
Mathematical Relationship Identified in Paper (if applicable):
None
Author‐Identified 'Bright Line' Particle Size (diameter) Threshold (nm) ‐ List if applicable:
None
Notes on 'Bright Line' Threshold: The photocatalytic decomposition of methylene blue increased with decreasing particle size from 30 to 15 nm; however, a 'bright line' particle size threshold cannot be determined.
ARCADIS Discussion of Results None
Nature of Size versus Effect Relationship (if applicable)
The photocatalytic decomposition of methylene blue increased with decreasing particle size from 30 to 15 nm.
Physico‐chemical Property Investigated:
Photocatalytic activity
Priority of Property: High
Relevant for A1 Project?: Yes
Type of nanomaterial (eg, nanometal, nanometal oxide):
Nanometal
Particle Functionalization or Capping Agent (if applicable):
None
List Study Objective(s) Relevant to Investigated Physicochemical Property:
• To investigate the decomposition of two bacterial species by TiO2 nanoparticles by varying particle size and anatase mass fraction (at a constant particle size of 15 nm).
Jang et al. (2001)
Specific Details on Tested Nanomaterial(s)
• Titanium dioxide (TiO2)• 45% anatase
Details on Preparation Method of Nanomaterial(s):
• Vapor-phase synthesis from TiCl4 in a flame reactor was used to prepare TiO2 nanoparticles. Through the combustion of hydrogen, water vapor and oxygen exist in the flame. Thus, TiCl4 is converted to TiO2 in two ways: hydrolysis and oxidation.
Details on Tests Examining Physicochemical Property:
• The photocatalytic properties of TiO2 nanoparticles were characterized through the decomposition of ammonia gas.• TiO2 nanopar cles (0.2 g) was put into a closed cylindrical glass chamber that was 15 cm in diameter and 30
cm in length. The chamber was illuminated with the fluorescent light (UV quantity about 1 μW) that was installed at 2 cm apart from the top of the chamber.• Thin foils (4 × 4 cm in dimension) made of TiO2 nanopar cles were
prepared for the experiment, and placed on the center of the chamber floor. Ammonia gas was fed into the chamber to maintain the initial concentration of 500 ppm in the chamber. The variation of concentration of ammonia in the chamber was measured with a gas detector (Cole-Parmer, Model P81900) in course of time.
Individual Particle Diameters Tested (nm):
13-15, 28-30 nm
Solution characteristics (pH, cosolvents or other additives, sonication, ionic strength)
Not applicable
Min Diameter Tested (nm): 13-15
Max Diameter Tested (nm): 28-30
Specific Surface Area (SSA) (m2/g): ca. 50-102
Bulk materials tested (≥ 1000 nm): No
Information on Analytical Methods Used to Determine Particle Size:
Particle diameter was determined by BET and transmission electron microscopy (TEM).
List of Relevant Findings: • The effect of particle size keeping constant anatase mass fraction (45%) on the decomposition of the Escherichia coli was found to be 93.2% at the particle size of 30 nm and 97.6% at the particle size of 15 nm, respectively. As the anatase mass fraction increased from 45% to 80%, the degree of decomposition of the Escherichia coli also
increased from 97.6% to 99.1%.• The same trend of the decomposi on of the Pseudomonas areruginosa was obtained as in the case of the Escherichia coli.• TiO2 nanopar cles having smaller size and higher anatase mass
fraction were more effective in the decomposition of the bacteria under the illumination of very lowintensity of UV light, and anatase mass fraction was much more effective in the decomposition of the bacteria than the particle size.
Page B-59 of 177
Appendix B: Copy of DatabaseSize versus Effect Relationship Observed by Authors?:
Yes
Mathematical Relationship Identified in Paper (if applicable):
None
Author‐Identified 'Bright Line' Particle Size (diameter) Threshold (nm) ‐ List if applicable:
None
Notes on 'Bright Line' Threshold: Increased decomposition of bacteria occurred at the smaller particle size; however, as only two particle sizes were tested, a 'bright line' particle size threshold cannot be determined.
ARCADIS Discussion of Results None
Nature of Size versus Effect Relationship (if applicable)
TiO2 nanoparticles having smaller size were more effective in the decomposition of the bacteria under the illumination of very low intensity of UV light.
Physico‐chemical Property Investigated:
Photocatalytic activity
Priority of Property: High
Relevant for A1 Project?: Yes
Type of nanomaterial (eg, nanometal, nanometal oxide):
Nanometal
Particle Functionalization or Capping Agent (if applicable):
None
List Study Objective(s) Relevant to Investigated Physicochemical Property:
• To investigate the decomposition of ammonia gas by TiO2 nanoparticles by varying particle size and anatase mass fraction (at a constant particle size of 15 nm).
Jang et al. (2001)
Specific Details on Tested Nanomaterial(s)
• Titanium dioxide (TiO2)• 45% anatase
Details on Preparation Method of Nanomaterial(s):
• Vapor-phase synthesis from TiCl4 in a flame reactor was used to prepare TiO2 nanoparticles. Through the combustion of hydrogen, water vapor and oxygen exist in the flame. Thus, TiCl4 is converted to TiO2 in two ways: hydrolysis and oxidation.
Details on Tests Examining Physicochemical Property:
• The photocataly c proper es of TiO2 nanopar cles were characterized through the decomposi on of bacteria.• Escherichia coli and Pseudomonas areruginosa were chosen as bacteria to determine the decomposition of bacteria. The growth in the number of each bacteria without addition of TiO2 nanoparticles under the illumination
of a fluorescent light (UV quan ty about 1 μW) was measured with the lapse of me.• A er the addi on of 0.1 g of TiO2 at the known number of bacteria, the change of the number of bacteria was measured with the lapse of time under the illumination of fluorescent light.
Individual Particle Diameters Tested (nm):
13-15, 28-30 nm
Solution characteristics (pH, cosolvents or other additives, sonication, ionic strength)
Not applicable
Min Diameter Tested (nm): 13-15
Max Diameter Tested (nm): 28-30
Specific Surface Area (SSA) (m2/g): ca. 50-102
Bulk materials tested (≥ 1000 nm): No
Information on Analytical Methods Used to Determine Particle Size:
Particle diameter was determined by BET and transmission electron microscopy (TEM).
List of Relevant Findings: • The decomposition of the ammonia gas of initial concentration of the 500 ppm was measured at every 30 min for 2 h. The degree of decomposi on became constant a er 1 h in all samples.• As the par cles containing 45%
anatase became smaller from 30 to 15 nm, the degree of decomposition of ammonia slightly increased from 8% to 10%.• When the phase composi on was varied at the constant par cle size (15 nm) the degree of decomposi on
of ammonia gas increased from 10% to 13%.
Page B-60 of 177
Appendix B: Copy of DatabaseSize versus Effect Relationship Observed by Authors?:
Yes
Mathematical Relationship Identified in Paper (if applicable):
None
Author‐Identified 'Bright Line' Particle Size (diameter) Threshold (nm) ‐ List if applicable:
None
Notes on 'Bright Line' Threshold: Increased decomposition of ammonia gas occurred at the smaller particle size; however, as only two particle sizes were tested, a 'bright line' particle size threshold cannot be determined.
ARCADIS Discussion of Results None
Nature of Size versus Effect Relationship (if applicable)
TiO2 nanoparticles having smaller size were more effective in the decomposition of ammonia gas under the illumination of very low intensity of UV light.
Physico‐chemical Property Investigated:
Reactivity
Priority of Property: High
Relevant for A1 Project?: Yes
Type of nanomaterial (eg, nanometal, nanometal oxide):
Nanometal oxide
Particle Functionalization or Capping Agent (if applicable):
None
List Study Objective(s) Relevant to Investigated Physicochemical Property:
• The reactive oxygen species (ROS) generating capacity of anatase titanium dioxide nanoparticles of nine different sizes was tested.
Jiang et al. (2008)
Specific Details on Tested Nanomaterial(s)
• Titanium dioxide (TiO2)• prepared anatase NPs
Details on Preparation Method of Nanomaterial(s):
• Nanosized TiO2 samples were prepared using several gas phase synthesis methods: a diffusion flame aerosol reactor, a premixed flame aerosol reactor, a furnace aerosol reactor, and a spark aerosol reactor. The diffusion flame aerosol reactor was used to synthesize TiO2 nanoparticles with large size (>= 30 nm) and different crystal
structures. TiO2 nanopar cles with small sizes (<= 20 nm) were made in the premixed flame aerosol reactor.• The precursor used to synthesize TiO2 par cles was taniumtetra-isopropoxide, and was fed into the reactors either
by an atomizer or a bubbler. The properties of TiO2 nanoparticles were controlled by adjusting the reactant feed rates and the temperature-time history in these reactors.
Details on Tests Examining Physicochemical Property:
• The ability of nanoparticles to generate ROS was measured by using a fluorescent dye, 2′,7′-dichlorofluorescein diacetate (DCFH-DA). Sodium hydroxide was used to cleave the acetate group from the reduced dye (DCFH). In the presence of hydrogen peroxide (H2O2) or oxidizing species generated by nanoparticles, DCFH was oxidatively modified into a highly fluorescent derivative, dichlorofluorescein (DCF), which was detected using a spectrofluorometer (absorbance/emission maxima, 485 nm/535 nm). Horseradish peroxidase (HRP) was added to enhance the oxidation of DCFH (experiments using particles with high reactivity (nanosized Ag) showed that the
removal of HRP from the system reduced the ROS ac vity to background level).• Par cle suspensions in sodium phosphate buffer with DCFH and HRP were incubated in a 37 deg C water bath for 15 minutes (in the dark) before measuring the fluorescence intensity of the sample. For comparison, blanks (without nanoparticles) and the standard solutions with known H2O2 concentration were also incubated and measured. By comparing the DCF produced in particle suspensions to the DCF produced in H2O2 standard solutions, the level of ROS generated by nanoparticles was determined and expressed as equivalent H2O2 concentration. Two different suspension particle mass concentrations, 50 μg/mL and 100 μg/mL, were used for each TiO2 sample. As these are chemical tests, and the samples are very well controlled, error estimates in the ROS data are not illustrated from the duplicate measurements.
Individual Particle Diameters Tested (nm):
5, 8, 11, 15, 30, 40, 48, 98, 182
Solution characteristics (pH, cosolvents or other additives, sonication, ionic strength)
• pH: No data• Cosolvents or other addi ves: None• Sonica on: No performed• Ionic strength (conduc vity): No data
Page B-61 of 177
Appendix B: Copy of DatabaseMin Diameter Tested (nm): 5
Max Diameter Tested (nm): 182
Specific Surface Area (SSA) (m2/g): 426.1, 209.6, 155.7, 95.80, 51.93, 38.86, 31.52, 14.99, 8.033
Bulk materials tested (≥ 1000 nm): No
Information on Analytical Methods Used to Determine Particle Size:
• During the synthesis process, the particle mobility size distributions were measured online using a scanning mobility particle spectrometry (SMPS) including a differential mobility analyzer and a condensation particle
counter.• A er par cle collec on on the filter paper, scanning electron microscopy and transmission electron microscopy were used to characterize their morphology and measure the primary particle size distribution. X-ray diffraction (XRD) patterns of collected samples were measured using a Rigaku Geigerflex D-MAX/A Diffractometer with Cu-Kα radiation. Based on the diffraction patterns, the weight fractions of each phase for mixed anatase and
ru le samples were calculated.• The crystallite sizes of crystalline TiO2 nanopar cles were es mated using the Scherrer equation. BET isotherms were used to measure the specific surface area of the nanoparticles with nitrogen adsorption at 77K. The BET equivalent particle diameter was calculated based upon the specific surface area and the particle density.
List of Relevant Findings: • The measured ROS (expressed as equivalent H2O2 concentration) in particle suspensions for two mass concentrations of nanomaterials (50 μg/mL and 100 μg/mL) was plotted as a function of size. For same sized particles, ROS generation was nearly doubled when doubling the TiO2 mass concentration. 30 nm particles showed the highest activity in terms of ROS species generation at both mass concentrations; however, no size effect is discernable, as the total surface area is not held constant for all the samples (higher for the smaller sized particles
at the same mass concentra on).• It has been proposed that a simple term such as the total surface area or particle number can be used to describe the dose-response curve. Therefore, the results of the equivalent H2O2 concentration (measure of ROS) was plotted as a function of the total number concentration and total surface area concentration for different sized anatase TiO2 samples. The dose-response curve did not exhibit any trend over the
full range of par cle sizes in the number concentra on plot (or the surface area plot).• The ROS data were normalized by expressing the equivalent ROS activity per unit of the different dose metrics of mass, number, and surface area; the ROS activity per unit mass or number collapses onto a single curve; but the size dependency is still not clear. However, when normalized by the total surface area, a clear relationship is observed in the form of an S-shaped curve. Three size ranges can be established: below 10 nm, above 30 nm, and from 10 nm to 30 nm. In the first two ranges, the ROS activities per unit area of TiO2 particles were relatively constant, while a sharp increase was observed in the third range.
Size versus Effect Relationship Observed by Authors?:
Yes
Mathematical Relationship Identified in Paper (if applicable):
None
Author‐Identified 'Bright Line' Particle Size (diameter) Threshold (nm) ‐ List if applicable:
10, 30
Notes on 'Bright Line' Threshold: The production of ROS by anatase TiO2 nanoparticles was constant with size for particles < 10 nm and > 30 nm, with a sharp increase between 10 and 30 nm.
ARCADIS Discussion of Results In the range of 30 -195 nm and below 10 nm, the ROS activity is proportional to the surface area. Therefore, the intrinsic ROS activity of particles in the 30-200 nm size range increases with decreasing particle size for a given mass loading, and this non-biological activity is similar to what was reported in previous toxicological studies. The same reasoning holds for anatase TiO2 particles in the size range of 4 - 10 nm, i.e. they had similar ROS activity and smaller particles generated more ROS at a fixed mass loading (due to their larger total surfac area). In summary, the reactivity depends on the defect site density (number of defects per unit area). The defect site density is approximately constant above 30 nm, decreases between 30 and 10 nm, and then is very low and approximately constant for particles below 10 nm.
Nature of Size versus Effect Relationship (if applicable)
Sharp increase in the ROS activity per unit surface area for anatase nanoparticles in the size range of 10 to 30 nm.
Page B-62 of 177
Appendix B: Copy of Database
Physico‐chemical Property Investigated:
Reactivity
Priority of Property: High
Relevant for A1 Project?: Yes
Type of nanomaterial (eg, nanometal, nanometal oxide):
Supported nanometal
Particle Functionalization or Capping Agent (if applicable):
None
List Study Objective(s) Relevant to Investigated Physicochemical Property:
• The objective of this study is to investigate the effect of palladium particle size on catalytic activity for oxygen reduction reactions ORRs in alkaline solutions.
Jiang et al. (2009)
Specific Details on Tested Nanomaterial(s)
• Carbon-supported palladium (Pd)
Details on Preparation Method of Nanomaterial(s):
• For the 20% Pd/C catalyst (denoted as Pd/C-AR), 100 mg of Pd/C-AR powder was loaded in a ceramic boat and put into a quartz tube in an oven. Pure N2 gas was first introduced into the quartz tube for 30 min to displace the air in it. The temperature of the oven was then increased from room temperature to 100 deg C for 30 min to evaporate any possible water in the catalyst. The stream was then changed to a H2/N2 stream, and the temperature was increased to the objective temperature reducing temperature and kept at this temperature for 2 h. After 2 h, the oven was cooled to room temperature in a nitrogen stream. The Pd/C-AR catalyst, reduced at 300, 400, 500, and 600 deg C, is denoted as Pd/C-300, -400, -500, and -600, respectively.
Details on Tests Examining Physicochemical Property:
• The working electrodes were formed by depositing a 40 uL aliquot of the suspended catalyst as an ultrathin layer on the surface of a glassy carbon rotating disk electrode (RDE) of 5.3 mm diameter. After evaporating the water in an air stream, an aqueous polyvinyl alcohol solution was pipetted onto the electrode’s surface. The surface was
then dried again in the air stream to give a PVA-bound catalyst film. • The electrochemical setup consisted of a computer-controlled Pine potentiostat, a radiometer speed control unit and an RRDE (glassy carbon with a diameter of 5.3 mm as the disk and with gold as the ring). The electrochemical experiments were carried out in an Ar- or O2-purged 0.1 M NaOH solution using a standard three-electrode electrochemical cell. All the potentials in this work refer to Hg/HgO in a 0.1 M NaOH solution, denoted as Hg/HgO/OH− 0.164 V vs normal hydrogen electrode . A Pt wire was used as the counter electrode.
Individual Particle Diameters Tested (nm):
3.1, 5.1, 5.2, 8.8, 17.1
Solution characteristics (pH, cosolvents or other additives, sonication, ionic strength)
• pH: No data• Cosolvents or other addi ves: None• Sonica on: Not performed• Ionic strength (conduc vity): No data
Min Diameter Tested (nm): 3.1
Max Diameter Tested (nm): 17.1
Specific Surface Area (SSA) (m2/g): 30, 58, 102, 106, 161
Bulk materials tested (≥ 1000 nm): No
Information on Analytical Methods Used to Determine Particle Size:
X-ray diffraction (XRD) patterns of the Pd/C catalysts were recorded using Cu K radiation with a Ni filter. The tube current was 30 mA with a tube voltage of 50 kV. The 2theta angular regions between 15 and 85 deg were explored at a scan rate of 2 deg/min. TEM measurements of the catalysts were carried out microscope operated at 80 kV.
List of Relevant Findings: • The specific activity of the Pd/C catalyst continuously increased by a factor of about 3 with increasing particle size from 3 to 16.7 nm without passing through a maximum. A possible explanation for the increasing specific activity with increased Pd particle size is that increased OH− adsorp on on smaller par cles blocked the ac ve sites for the
ORR.• The mass ac vity of Pd increased by a factor of 1.3 when par cle size increased from 3 to 5 nm and then decreased with increasing particle size. As the metal dispersion increased with decreased particle size, a larger number of the palladium atoms participated in surface reactions. However, because the activity per surface atom decreased, an optimum particle size is indicated as the result of these two effects; the maximum activity per unit weight of palladium is in the neighborhood of 5 nm.
Page B-63 of 177
Appendix B: Copy of DatabaseSize versus Effect Relationship Observed by Authors?:
Yes
Mathematical Relationship Identified in Paper (if applicable):
None
Author‐Identified 'Bright Line' Particle Size (diameter) Threshold (nm) ‐ List if applicable:
5
Notes on 'Bright Line' Threshold: The maximum activity per unit weight of palladium is in the neighborhood of 5 nm. Mass activity peaked at a size of 5 nm.
ARCADIS Discussion of Results None
Nature of Size versus Effect Relationship (if applicable)
The specific activity of the Pd/C catalyst continuously increases with increasing particle size without passing through a maximum. The mass activity sharply increases from 3 to 5 nm and then decreases.
Physico‐chemical Property Investigated:
Reactivity
Priority of Property: High
Relevant for A1 Project?: Yes
Type of nanomaterial (eg, nanometal, nanometal oxide):
Nanometal
Particle Functionalization or Capping Agent (if applicable):
None
List Study Objective(s) Relevant to Investigated Physicochemical Property:
• To investigate the high resolution transmission electron microscopy (HRTEM) combined with voltammetric and differential electrochemical mass spectroscopic (DEMS) investigations of electrocatalytic activity of nanocrystalline RuO2 electrodes with respect to the oxygen evolution reaction (OER) and the chlorine evolution reaction (CER).
Jirkovský et al. (2006)
Specific Details on Tested Nanomaterial(s)
• Ruthenium dioxide (RuO2)
Details on Preparation Method of Nanomaterial(s):
• The ruthenium dioxide samples were prepared using a sol-gel approach. A ruthenium (III nitrosylnitrate (98%) solution in a mixture of ethanol and propane-2-ol was precipitated with an aqueous solution of
tetramethylammonium hydroxide (25%).• An amorphous precursor was annealed for 4 h at 400, 500, 600, 700, 800, and 900 deg C in air to obtain nanocrystalline single-phase ruthenium dioxide samples of variable particle size.
Details on Tests Examining Physicochemical Property:
• The RuO2-based electrodes for electrochemical experiments were prepared by sedimentation of RuO2 powder from a water based suspension on Ti mesh. The duration of the deposition was adjusted to obtain the surface coverage of about 1–2 mg/cm^2 of RuO2 and was later stabilized by annealing the electrode for 30 min at 400 deg
C in air.• The ini al RuO2 suspension was prepared in ultrasound bath and contained approximately 5 g/L of RuO2 in deionized water. The electrochemical behavior of the prepared RuO2 samples was studied by cyclic voltammetry combined with DEMS. All experiments were performed in a homemade Kel-F single-compartment cell. The experiments were performed in a three-electrode arrangement controlled by a potentiostat. Pt and saturated calomel electrode were used as an auxiliary and a reference electrode, respectively. The selectivity of the nanocrystalline electrodes toward oxygen and chlorine evolution was studied.
Individual Particle Diameters Tested (nm):
No data
Solution characteristics (pH, cosolvents or other additives, sonication, ionic strength)
• pH: No data• Cosolvents or other addi ves: ethanol / propane-2-ol• Sonica on: Not performed• Ionic strength (conductivity):
Min Diameter Tested (nm): 10
Max Diameter Tested (nm): 50
Specific Surface Area (SSA) (m2/g): No data
Bulk materials tested (≥ 1000 nm): No
Information on Analytical Methods Used to Determine Particle Size:
The crystallinity and phase purity of the prepared samples was checked using a powder X-ray diffractometer with Cu K-alpha radiation. The annealed RuO2 samples were further analyzed by HRTEM; images recorded using a charge-coupled device (CCD) camera were used to determine the particle size distribution.
List of Relevant Findings: • The activity of the RuO2 nanocrystals towards oxygen evolution reaction (OER) decreases with increasing particle size.• The ac vity of the RuO2 nanocrystals towards chlorine evolu on reac on (CER) is insensi ve to the par cle
size/shape.• The observed tendency indicates that the oxygen evolu on is significantly affected by the crystal edges while chlorine evolution reaction proceeds mainly on crystal faces.
Page B-64 of 177
Appendix B: Copy of DatabaseSize versus Effect Relationship Observed by Authors?:
Yes
Mathematical Relationship Identified in Paper (if applicable):
None
Author‐Identified 'Bright Line' Particle Size (diameter) Threshold (nm) ‐ List if applicable:
None
Notes on 'Bright Line' Threshold: Only the range of particle sizes was reported in the paper; therefore, a 'bright line' particle size threshold cannot be determined from these data.
ARCADIS Discussion of Results None
Nature of Size versus Effect Relationship (if applicable)
The activity of the OER increased with decreasing particle size.
Physico‐chemical Property Investigated:
Crystalline structure (structure)
Priority of Property: High
Relevant for A1 Project?: Yes
Type of nanomaterial (eg, nanometal, nanometal oxide):
Nanometal
Particle Functionalization or Capping Agent (if applicable):
Palladium capping agent
List Study Objective(s) Relevant to Investigated Physicochemical Property:
• In the present study, effect of size on the structural properties of Pr nanoparticles based switchable mirrors has been studied.
Kala and Mehta (2007)
Specific Details on Tested Nanomaterial(s)
• Praseodymium (Pr) layers capped with a palladium (Pd) layer
Details on Preparation Method of Nanomaterial(s):
• Pr nanoparticles were deposited on glass/quartz substrates, Ar pressure was varied from 10^−4 to 10^−3 Torr, at a flow rate of 13 sccm (standard cubic centimeters per minute) and 30 deg C substrate temperature. Specifically, Pr nanoparticle layers of 90 nm thickness deposited at 3.0E-04 Torr (sample NP1 ) and 1.2E-03 Torr (sample NP2) of Ar pressure have been studied. Pr thin film (sample TF) has been deposited by evaporating Pr on to glass/quartz
substrates at deposi on pressure of 1.4E-06 Torr.• Without breaking the vacuum, at 1.0E-06 Torr pressure, Pd overlayer of 9 and 16 nm were deposited onto TF , NP1 and NP2 samples by thermal evaporation method. Thin film and nanoparticle samples having Pd overlayer will be referred as TF, NP1 and NP2 samples, respectively. A pre-calibrated quartz crystal thickness monitor was used to control thickness.
Details on Tests Examining Physicochemical Property:
• Glancing angle X-ray diffractometer (Philips X’pert) was used for structural analysis of TF, NP1 and NP2 samples.
Solution characteristics (pH, cosolvents or other additives, sonication, ionic strength)
Not applicable
Min Diameter Tested (nm): No data
Max Diameter Tested (nm): No data
Specific Surface Area (SSA) (m2/g): No data
Bulk materials tested (≥ 1000 nm): No
Information on Analytical Methods Used to Determine Particle Size:
Surface morphology and size of the nanoparticles were determined by employing atomic force microscope (AFM), Nanoscope IIIa (Digital Instruments).
List of Relevant Findings: The calculated values of the lattice parameters (from XRD peaks) are a = 0.3678 nm and c = 1.1795 nm, as compared to a = 0.3670 nm and c = 1.1826 nm for a bulk sample reported elsewhere. Peaks observed at about 2θ = 40.1 deg and 46.5 deg correspond to (1 1 1) and (2 0 0) planes of the fcc (define, face centered cubic) structure of Pd overlayer. Large stacking faults in nanoparticle samples were discovered in comparison to the Pr thin film sample.
Page B-65 of 177
Appendix B: Copy of DatabaseSize versus Effect Relationship Observed by Authors?:
Yes
Mathematical Relationship Identified in Paper (if applicable):
None
Author‐Identified 'Bright Line' Particle Size (diameter) Threshold (nm) ‐ List if applicable:
None
Notes on 'Bright Line' Threshold: Large stacking faults were observed in Pr nanoparticles (capped with 16-nm Pd) of mean diameters 12 and 22 nm; however, they were not observed in a 45 nm thin film sample; however, a 'bright line' particle size threshold cannot be determined from these data.
ARCADIS Discussion of Results Comparing Pr NPs to thin film samples may be comparing two unlike entities.
Nature of Size versus Effect Relationship (if applicable)
X-ray diffraction studies show large stacking faults in the crystal structure at the lower nanoparticle size.
Physico‐chemical Property Investigated:
Reactivity
Priority of Property: High
Relevant for A1 Project?: Yes
Type of nanomaterial (eg, nanometal, nanometal oxide):
Nanometal
Particle Functionalization or Capping Agent (if applicable):
None
List Study Objective(s) Relevant to Investigated Physicochemical Property:
• The objective of the present study is to examine the electrocatalytic activity of AuNPs with respect to their size towards the oxidation of biologically important compounds such as ascorbic acid (AA), uric acid (UA) and 3,4
dihydroxyphenylace c acid (DOPAC).• The oxida on of bare Au electrodes, 3-mercaptopropyl)-trimethoxysilane sol–gel modified Au electrodes (Au-MPTS), and Au NPs of different sized immobilized on to Au-MPTS electrodes was studied.
Kalimuthu et al. (2008)
Specific Details on Tested Nanomaterial(s)
• Gold (Au)
Details on Preparation Method of Nanomaterial(s):
• 2.6 and 12.6 nm - No data• Colloidal solu ons of 20, 40 and 60 nm AuNPs were prepared by adding 450, 330 and 230 uL of trisodium citrate in 50 mL of 0.01% HAuCl4 solution, respectively.
Details on Tests Examining Physicochemical Property:
• The cleaned Au electrode was immersed in MPTS sol–gel for 30 min at room temperature. The resulting sol–gel modified electrode was thoroughly washed with water to remove physically adsorbed silica sol.• Then the
electrode was immersed in a colloidal solution of AuNPs with different sizes for 12 h. The electrode was removed from the AuNPs solu on a er 12 h, washed with water and then used for electrochemical measurements.•
Electrochemical measurements were performed in a conventional two-compartment three-electrode cell with a polished 1.6 mm Au as a working electrode, a Pt wire as counter electrode and a KCl saturated Ag/AgCl as reference electrode. All other electrochemical measurements were carried out with CHI model 650B Electrochemical Workstation. The diffuse reflectance spectra (DRS) were recorded with a spectrophotometer. Thin gold films produced by sputtering 99.99% pure gold on glass plates were used as substrates for AFM and DRS measurements. UV–Visible spectra were recorded with a spectrophotometer.
Individual Particle Diameters Tested (nm):
2.6, 12.6, 20, 40 60
Solution characteristics (pH, cosolvents or other additives, sonication, ionic strength)
• pH: 7.2 (phosphate buffer)• Cosolvents or other addi ves: None• Sonica on: Not performed• Ionic strength (conductivity): No data
Page B-66 of 177
Appendix B: Copy of DatabaseMin Diameter Tested (nm): 2.6
Max Diameter Tested (nm): 60
Specific Surface Area (SSA) (m2/g): No data
Bulk materials tested (≥ 1000 nm): No
Information on Analytical Methods Used to Determine Particle Size:
AFM images were recorded by Digital Instruments Nanoscope IV, Veeco
List of Relevant Findings: • When the size of the immobilized Au NPs increases the oxidation potential of ascorbic acid (AA) was shifted to more positive potential with decreased oxidation current. For example, 12.6, 20, 40 and 60 nm Au NPs immobilized Au-MPTS electrodes show oxidation of AA at 0.35, 0.38, 0.42 and 0.44 V, respectively. Since the surface area of the Au NPs with 2.6 nm size is greater than other AuNPs, it is expected that more number of AA molecules will be oxidized at this Au NP's modified electrode when compared to other AuNPs' modified electrodes. Thus, we
observed higher oxida on current for AA at 2.6 nm AuNPs when compared to other AuNPs modified electrodes.• At bare Au electrode uric acid (UA) oxidation occurs at 0.57 V while no oxidation peak was observed at Au-MPTS electrode. On the other hand, the oxidation of UA occurs at less positive potentials for different sizes of Au NPs immobilized onto Au-MPTS electrodes when compared to bare Au electrode. For example, oxidation of UA occurs at 0.47 V, 0.52 V and 0.55 V at 2.6, 20 and 60 nm AuNPs immobilized Au-MPTS electrodes, respectively. Among the
different sizes of Au NPs, once again 2.6 nm AuNPs show higher oxida on current for UA.• The co-oxida on of AA and UA by Au-NPs of different sizes was also tested. Among the AuNPs, 2.6 nm AuNPs immobilized Au-MPTS electrode oxidizes AA and UA at less positive potentials. Surprisingly, the peak separation between AA and UA oxidation potentials was same (180 mV) irrespective of the sizes of immobilized AuNPs (curves c–e). The observed stable oxidation current response with 180 mV peak separation is enough to determine AA and UA simultaneously
using AuNPs immobilized electrodes.• The 2.6 nm AuNPs immobilized electrode has higher sensi vity than 60 nm AuNPs immobilized electrode for the detection of DOPAC.
Size versus Effect Relationship Observed by Authors?:
Yes
Mathematical Relationship Identified in Paper (if applicable):
None
Author‐Identified 'Bright Line' Particle Size (diameter) Threshold (nm) ‐ List if applicable:
None
Notes on 'Bright Line' Threshold: For all three compounds tested, a size-dependent relationship was observed for the electrocatalytic activity of Au NPs (decreasing electrocatalytic activity with increasing particle size). A 'bright line' threshold cannot be inferred from these relationships.
ARCADIS Discussion of Results None
Nature of Size versus Effect Relationship (if applicable)
The oxidation current increases with decreasing particle size of the catalyst.
Physico‐chemical Property Investigated:
Crystalline structure (structure)
Priority of Property: High
Relevant for A1 Project?: Yes
Type of nanomaterial (eg, nanometal, nanometal oxide):
Nanometal oxide
Particle Functionalization or Capping Agent (if applicable):
None
List Study Objective(s) Relevant to Investigated Physicochemical Property:
• The synthesis of NiO nanopar cles by a novel precipita on method is reported.• The morphology was examined by scanning electron microscopy (Hitachi S-3400).
Karthik et al. (2011)
Specific Details on Tested Nanomaterial(s)
• Nickel oxide (NiO)• NiO nanopar cles were prepared through a novel precipita on method. Nickel(II) nitrate was used as a precursor for nickel
Page B-67 of 177
Appendix B: Copy of DatabaseDetails on Preparation Method of Nanomaterial(s):
No data
Details on Tests Examining Physicochemical Property:
• The structures of the samples were identified by X-ray powder diffraction (XRD) at room temperature on a PANalytical X’pert PRO X-ray diffractometer using Cu K radiation (lambda = 0.15406) as the X-ray source. Themorphology and particle size of the prepared sample was examined by scanning electron microscopy. UV–vis absorption spectra of the prepared samples were recorded using UV–vis spectrophotometer.
Individual Particle Diameters Tested (nm):
No data
Solution characteristics (pH, cosolvents or other additives, sonication, ionic strength)
Not applicable
Min Diameter Tested (nm): 16
Max Diameter Tested (nm): 25
Specific Surface Area (SSA) (m2/g): No data
Bulk materials tested (≥ 1000 nm): No
Information on Analytical Methods Used to Determine Particle Size:
The morphology and particle size of the prepared sample was examined by scanning electron microscopy (Hitachi S-3400).
List of Relevant Findings: • The lattice parameters estimated from the XRD patterns are 0.4167 and 0.4163 nm respectively for the 25 nm and 16 nm particles, reflecting a slight decrease in the lattice parameters with the decrease in particle size. A lattice contraction with decreasing particle size seems reasonable from a thermodynamic point of view due to the higher surface curvature as is observed in many nanocrystalline materials. It is apparent that the surface stresses and surface defect dipoles are the two phenomena governing the changes in the lattice volume as the particle size is reduced.
Size versus Effect Relationship Observed by Authors?:
Slight
Mathematical Relationship Identified in Paper (if applicable):
None
Author‐Identified 'Bright Line' Particle Size (diameter) Threshold (nm) ‐ List if applicable:
None
Notes on 'Bright Line' Threshold: The lattice parameters reflect a slight decrease in the lattice parameters with the decrease in particle size. A lattice contraction with decreasing particle size seems reasonable from a thermodynamic point of view due to the higher surface curvature as is observed in many nanocrystalline materials. It is apparent that the surface stresses and surface defect dipoles are the two phenomena governing the changes in the lattice volume as the particle size is reduced.
ARCADIS Discussion of Results Only two particle sizes tested, therefore difficult to draw strong conclusions.
Nature of Size versus Effect Relationship (if applicable)
A slight decrease in the lattice parameters occurred with a decrease in particle size from 25 to 16 nm.
Physico‐chemical Property Investigated:
Photocatalytic activity
Priority of Property: High
Relevant for A1 Project?: Yes
Type of nanomaterial (eg, nanometal, nanometal oxide):
Nanometal
Particle Functionalization or Capping Agent (if applicable):
None
List Study Objective(s) Relevant to Investigated Physicochemical Property:
• To investigate the effects of supported Au nanoparticles of various sizes and shapes on its co catalytic activity imparted to TiO2 during photocatalytic oxidation on salicylic acid.
Kaur and Pal (2012)
Specific Details on Tested Nanomaterial(s)
• Gold (Au) nanoparticles supported on titanium dioxide (TiO2) catalyst
Page B-68 of 177
Appendix B: Copy of DatabaseDetails on Preparation Method of Nanomaterial(s):
• The Au NPs were synthesized by a seed-mediated approach in aqueous media at 0 deg C. The Au seeds were first prepared by adding 250 uL (0.01 M) HAuCl to 9.5 mL (0.1 M) cetyltrimethylammonium bromide (CTAB), followed by reduction with 600 uL (0.01 M) NaBH4 solution under magnetic stirring for 2 min. The growth solution was prepared by treating a mixture of 500 uL (0.01 M) HAuCl4, 9.5 ml (0.1 M) CTAB and 75 uL (0.01 M) AgNO3 with 55
uL ascorbic acid (0.1 M). Then, 12 uL of above Au seed solu on was introduced into the growth solu on.• The Au nanoparticles were repeatedly washed with deionized water under four cycles of centrifugation at 8500 rpm for 10 min and then used for photocatalytic reactions. Chemical aggregation of Au nanosphere was carried out by the addition of 100 uL CH3OH to 100 uL Au–MNS in a test tube and then the solvent was vacuum evaporated and used for photoreaction. For the surface plasmon absorption study, the aggregation of the Au–MNS (SP band 563 nm and size >5 nm) was carried out by direct addition of 1.5 mL CH3OH (or CCl4) to 1.5 mL of aqueous Au–MNS particles
which showed 557 nm and 974 nm peaks.• Photo deposi on of 0.02 wt% Au onto TiO2 (P25, Degussa, size 20-30 nm) was carried out in a test tube using 5 ml deaerated aqueous suspension of CH3OH, 50 mg TiO2 and HAuCl4 for 1 h light irradiation under stirring.
Details on Tests Examining Physicochemical Property:
• The influence of Au co-catalysts size on the photocatalytic activity of TiO2 by the addition of 100 uL (0.02 wt% of TiO2) Au NPs where the ra o of TiO2 par cles to Au atoms (12,500:1) was kept same• The photoreac on was
carried out in a test tube containing 5 ml salicylic acid (1 mM), 50 mg TiO2 and desired amount (50-300 uL) of various AuNPs suspension under UV irradiation (125 W Hg-arc lamp, 10.4 mW/cm^2 and lambda max = 253.6 nm) and magnetic stirring for different time periods at 30 deg C temperature. The unreacted SA was measured by UV–vis spectrophotometer (at lambda max = 298 nm) and HPLC (C18 column, 50% CH3OH) analysis.
Individual Particle Diameters Tested (nm):
ca. 3.5, > 5, ca. 9.5
Solution characteristics (pH, cosolvents or other additives, sonication, ionic strength)
• pH: No data• Cosolvents or other addi ves: None• Sonica on: Not performed• Ionic strength (conduc vity): No data
Min Diameter Tested (nm): ca. 3.5
Max Diameter Tested (nm): No data
Specific Surface Area (SSA) (m2/g): No data
Bulk materials tested (≥ 1000 nm): No
Information on Analytical Methods Used to Determine Particle Size:
Transmission electron microscopy (TEM) was used to determine the size of the particles.
List of Relevant Findings: • It is observed that with decreasing size of Au NPs from 9.5 nm to >5 nm and 3.5 nm, the SA photodegradation rate (PDR) is rapidly enhanced in comparison to bare TiO2.• During SA photodegrada on, the Au–SNS exhibited
highest PCA, whereas Au–MNS of size >5 nm and Au–LNS of size ca. 9.5 nm imparted nearly similar co-catalytic efficiency to TiO2.• Although the added Au NPs and TiO2 are not permanently connected, it is presumed that an
electrostatic interaction due to intrinsic surface charge of colloidal particles may occur which facilitate the conduction of photo excited electron from TiO2 to Au NPs and thereby, increased the photodegradation rate by
valence band holes.• The TiO2 photoac vity has been found to be dras cally enhanced with the decreasing size (9.5–3.5 nm) of AuNPs loading. It is interesting to know that the effective amount (0.01 wt%) of Au atom required for maximum PCA of TiO2 is 100 times less than the traditional prerequisite of 1–2 wt% metal deposition.
Size versus Effect Relationship Observed by Authors?:
Yes
Mathematical Relationship Identified in Paper (if applicable):
None
Author‐Identified 'Bright Line' Particle Size (diameter) Threshold (nm) ‐ List if applicable:
None
Notes on 'Bright Line' Threshold: It was found that the addition of Au NPs to TiO2 significantly increased the photocatalytic activity; however, the size-dependent relationship does not allow for determination of a 'bright line' particle size threshold.
ARCADIS Discussion of Results Interesting that Au NPs (Au is the least reactive metal) had such a pronounced effect on the PCA of TiO2. Really demonstrated nano-sized effects.
Nature of Size versus Effect Relationship (if applicable)
The photodegradation rate (PDR) is rapidly enhanced with decreasing size of Au NPs from 9.5 nm to >5 nm and 3.5 nm in comparison to bare TiO2.
Page B-69 of 177
Appendix B: Copy of Database
Physico‐chemical Property Investigated:
Photocatalytic activity
Priority of Property: High
Relevant for A1 Project?: Yes
Type of nanomaterial (eg, nanometal, nanometal oxide):
Nanometal
Particle Functionalization or Capping Agent (if applicable):
One of four separate aryl ketones: • 11-mercaptoundecaphenone (1)• 1-(4-hexyl-phenyl)-11- mercaptoundecanone (2)• 1-[4-(11-mercaptoundecyl)phenyl]hexanone (3)• 1-[4-(11-
List Study Objective(s) Relevant to Investigated Physicochemical Property:
• To study the photoreactivity of Au-core monolayer-protected nanoparticles modified using a series of aryl ketones.
Kell et al. (2005)
Specific Details on Tested Nanomaterial(s)
• Gold (Au) nanoparticles with an organic substrate monolayer
Details on Preparation Method of Nanomaterial(s):
• Monolayer protected nanoparticles (MPNs) with three different average core size diameters (1.7, 2,2 and 4.5 nm) were prepared by the standard two-phase synthesis. Dodecanethiol was used as the capping thiol, and the gold/dodecanethiol ratio was varied between 1:3, 1:1, and 6:1 to generate a series of MPNs with small, medium,
and large cores, respec vely.• The prepara on of the MPNs requires the use of sodium borohydride (and hydride converts ketones to alcohols); therefore, the place-exchange reaction was employed to functionalize the C12MPNX with the probe aryl ketones (1) (2) (3) or (4).
Details on Tests Examining Physicochemical Property:
• The Norrish type II photoreaction was used for a series of aryl ketones (1-4) anchored to MPNs with increasingly larger cores in order to probe how the extent of the Norrish type II reaction is affected by core size. In doing so, 1H-NMR spectra of 15-20-mg samples of 1-4-C12MPNX, where X= small, medium, and large, respectively, dissolved in nitrogen-saturated benzene-d(6) were recorded prior to irradiation and at intermittent times during the
irradia on• For aryl ketone probes (1) and (2), any liberated acetophenone was washed free of the modified MPN partway through the irradiation to prevent competitive absorption, which could slow or prevent efficient photoreaction on the MPNsurface. In addition, the liberated acetophenone was also washed away from the MPN when the photoreaction was complete, before the final stoichiometry of the MPN was determined. Probe aryl ketones 3 and 4 were also anchored to C12-MPNlarge. These probes reacted similarly to 1 and 2, except that an alkene is liberated to solution and the product para-alkyl acetophenone remains anchored to the MPN surface.
Solution characteristics (pH, cosolvents or other additives, sonication, ionic strength)
Not applicable
Min Diameter Tested (nm): 1.7
Max Diameter Tested (nm): 4.6
Specific Surface Area (SSA) (m2/g): No data
Bulk materials tested (≥ 1000 nm): No
Information on Analytical Methods Used to Determine Particle Size:
The sizes of the cores for the various MPNs were measured after the place-exchange reaction by transmission electron microscopy (TEM).
List of Relevant Findings: • With this caveat, the extent of reaction for 1-C12MPNsmall was nearly quantitative (99 +/- 1%), whereas 1-C12MPNmedium had an extent of reaction of 85 +/- 5% and 1-C12MPNlarge had a conversion of only 62 +/- 6%, indicating that as the core size increases, the reactivity of 1 significantly decreases. This trend is general for all 1-4-
C12MPNX studied• The smaller MPN cores, 1-C12MPNsmall and 2-C12-MPNsmall, facilitate a more efficient Norrish type II photoreaction (99 +/- 1% and 93 +/- 1%, respectively) than both 1-C12MPNmedium (85 +/- 5%) and 1-4-C12MPNlarge (collectively 66 +/- 6%). Interestingly, 2-C12- MPNsmall shows an extent of reaction of 93 +/- 1%,
which is intermediate to that of 1-C12MPNsmall (99 +/- 1%) and 1-C12MPNmedium (85 +/- 5%).• These data show that the extent of reaction for the Norrish type II reaction is quite sensitive to small changes in the average core size (extent of reaction increases 85% to 99% as the average core size decreases from 2.2 to 1.7 nm). A 30%
decrease occurred in the extent ofreac on as the average size of the MPN core increases from 1.7 to 4.5 nm. However, the MPN environment exerts some control overreac vity in all of 1-4-C12MPNX (i.e., not solely
described by core particle size).
Page B-70 of 177
Appendix B: Copy of DatabaseSize versus Effect Relationship Observed by Authors?:
Yes
Mathematical Relationship Identified in Paper (if applicable):
None
Author‐Identified 'Bright Line' Particle Size (diameter) Threshold (nm) ‐ List if applicable:
None
Notes on 'Bright Line' Threshold: An increase in nanoparticle reactivity occurred as the core particle size decreased from 4.6 to 1.7 nm, regardless of the aryl-ketone modification of the monolayer coating. A 'bright line' particle size threshold cannot be identified from this study.
ARCADIS Discussion of Results The MPN environment exerts some control over reactivity in all of 1-4-C12MPNX (i.e., not solely described by core particle size).
Nature of Size versus Effect Relationship (if applicable)
The reactivity of aryl-ketone modified Au nanoparticles increases with decreasing particle size from 4.6 to 1.7 nm for all 4 ketones tested.
Physico‐chemical Property Investigated:
Crystalline structure (structure)
Priority of Property: High
Relevant for A1 Project?: Yes
Type of nanomaterial (eg, nanometal, nanometal oxide):
Nanometal
Particle Functionalization or Capping Agent (if applicable):
None
List Study Objective(s) Relevant to Investigated Physicochemical Property:
• Morphology and structure of antimony nano-particles were investigated.
Kirmse et al. (2003)
Specific Details on Tested Nanomaterial(s)
• Antimony (Sb) clusters
Details on Preparation Method of Nanomaterial(s):
• The Sb particles were formed during thermal deposition of antimony tetramers on the (0001) basal planes of freshly cleaved highly oriented pyroly c graphite (HOPG) and molybdenum disulfide (MoS2) in ultrahigh vacuum.•
Surface diffusion and aggregation lead to the formation of nano-particles with various shapes and dimensions. By choosing appropriate deposition parameters (coverage, particle flux, surface temperature) the selective growth of well-defined island shapes is achieved.
Details on Tests Examining Physicochemical Property:
• Morphology and structure of antimony nano-particles grown at room temperature were studied by transmission electron microscopy (TEM) and transmission electron diffrac on.• Addi onally, scanning tunneling microscopy
was applied for checking the quality of the substrate surface and secondary electron microscopy was utilized for the determination of size distribution and area density of the nanoparticles on a scale of several micrometers.
Individual Particle Diameters Tested (nm):
No data
Solution characteristics (pH, cosolvents or other additives, sonication, ionic strength)
Not applicable
Page B-71 of 177
Appendix B: Copy of DatabaseMin Diameter Tested (nm): No data
Max Diameter Tested (nm): No data
Specific Surface Area (SSA) (m2/g): No data
Bulk materials tested (≥ 1000 nm): No
Information on Analytical Methods Used to Determine Particle Size:
Transition electron microscopy (TEM) was used to identify particle diameters.
List of Relevant Findings: • In the initial stage of particle growth on HOPG, spherical, amorphous particles are formed. Electron diffraction using a convergent beam verifies that one fraction of the Sb particles is amorphous and that the remaining particles are crystalline. The TEM bright-field image shows a number of Sb particles having a size of about 100 nm in diameter. In addition to the reflections arising from the HOPG substrate the (102) reflection of Sb is visible. The Sb particles have different orientations with respect to the crystalline substrate. This is a further indication for non-
epitaxial growth besides the par cles being amorphous in the ini al stage of growth.• Above a cri cal diameter of about 120 nm the spherical Sb islands become unstable at room temperature and transform into dendritic and finger-like structures. This change of morphology from compact to ramified is closely related to the phase transition from amorphous to crystalline.
Size versus Effect Relationship Observed by Authors?:
Yes
Mathematical Relationship Identified in Paper (if applicable):
None
Author‐Identified 'Bright Line' Particle Size (diameter) Threshold (nm) ‐ List if applicable:
120
Notes on 'Bright Line' Threshold: Above a critical diameter of about 120 nm the spherical Sb islands become unstable at room temperature and transform into dendritic and finger-like structures. This change of morphology from compact to ramified is closely related to the phase transition from amorphous to crystalline.
ARCADIS Discussion of Results None
Nature of Size versus Effect Relationship (if applicable)
Above an approximate particle diameter of 120 nm, the particles transitioned from amorphous to crystalline structure, as evidenced by TEM data.
Physico‐chemical Property Investigated:
Crystalline structure (structure)
Priority of Property: High
Relevant for A1 Project?: Yes
Type of nanomaterial (eg, nanometal, nanometal oxide):
Nanometal
Particle Functionalization or Capping Agent (if applicable):
None
List Study Objective(s) Relevant to Investigated Physicochemical Property:
• To investigate the structural stability of gold nanoparticles in relation to both size and temperature.
Koga et al. (2004)
Specific Details on Tested Nanomaterial(s)
• Gold (Au)
Details on Preparation Method of Nanomaterial(s):
• Gold nanoparticles were produced by cooling gold vapor with purified helium gas and were annealed at 1173, 1223, 1273 K or 1373 K (bulk melting point 1337 K), and then cooled quasistatically to room temperature. They were deposited onto an amorphous carbon film.
Details on Tests Examining Physicochemical Property:
• High-resolution electron microscopic (HREM) observations for several thousands of particles in each sample was used to investigate morphology.
Individual Particle Diameters Tested (nm):
No data
Solution characteristics (pH, cosolvents or other additives, sonication, ionic strength)
Not applicable
Page B-72 of 177
Appendix B: Copy of DatabaseMin Diameter Tested (nm): 3
Max Diameter Tested (nm): 18
Specific Surface Area (SSA) (m2/g): No data
Bulk materials tested (≥ 1000 nm): No
Information on Analytical Methods Used to Determine Particle Size:
Structural observations were performed by using a JEOL JEM-2010 electron microscope with a point to point resolution of 0.194 nm.
List of Relevant Findings: • Under the present conditions for the particle generation, the major morphology in as-grown particles (i.e., without annealing) was found to be icosahedral (Ih), and the minor one was decahedral (Dh) in faceted pentagonal
bipyramidal form.• Crystalline par cles were hardly found in the as-grown sample even though quite a large number of par cles were analyzed.• For nanopar cles that were annealed, the Ih-to-Dh transi on occurred for
particles of 3-6 nm, up to 7.5 nm and up to 14 nm for 1173, 1223 and 1273 K, respectively. At 1223 K, in the size range smaller than 5 nm, the coexistence of Ih and Dh was observed, even though the complete transition into Dh was observed at the lower temperature, suggesting that the particles smaller than 5 nm melted during annealing at 1223 K. At 1273 K, particles smaller than 6 nm resulted in a mixture of Ih and Dh. No transformation to fcc from either Ih or Dh was observed. At 1373 K, populations in the 3–6 nm range showed a mixture of Ih and Dh, similarly to the case of the annealing at 1273 K. This indicates that the particles in the 3–6 nm range have already melted at 1273 K due to the fall of the melting temperature by the size decreasing.
Size versus Effect Relationship Observed by Authors?:
Yes
Mathematical Relationship Identified in Paper (if applicable):
None
Author‐Identified 'Bright Line' Particle Size (diameter) Threshold (nm) ‐ List if applicable:
None
Notes on 'Bright Line' Threshold: A general trend of the smaller particle sizes in the range of 3 to 18 nm having a lower annealing temperature and thus a lower temperature required for phase transition was observed; however, a 'bright line' threshold cannot be established.
ARCADIS Discussion of Results None
Nature of Size versus Effect Relationship (if applicable)
Smaller particles annealed at lower temperatures and, therefore, changed phases at lower temperatures.
Physico‐chemical Property Investigated:
Reactivity
Priority of Property: High
Relevant for A1 Project?: Yes
Type of nanomaterial (eg, nanometal, nanometal oxide):
Nanometal
Particle Functionalization or Capping Agent (if applicable):
None
List Study Objective(s) Relevant to Investigated Physicochemical Property:
• In the present study EXAFS, TEM, XRD, and N2 adsorption measurements were employed to elucidate an effect of preparation conditions on the performances of Au/Fe(OH)3 and Au/Ti(OH)4 catalysts in low-temperature CO oxidation.
Kozlov et al. (2000)
Specific Details on Tested Nanomaterial(s)
• Gold (Au) supported on Fe(OH)3 using different starting aqueous solutions and rates of calcination
Page B-73 of 177
Appendix B: Copy of DatabaseDetails on Preparation Method of Nanomaterial(s):
• As-precipitated wet hydroxides were obtained by hydrolysis of Fe(NO3)3.9H2O or Ti(i-OPr)4 with an aqueous solution of Na2CO3 or NH4OH (They are denoted in the text as M(OH)-S and M(OH)-A (M = Fe, Ti). After supporting the AuPPh3NO3 complex on the Fe and Ti support, the samples were temperature-programmed calcined at a given heating rate (0.1, 0.5, 4 or 20 K/min) to 673 K and kept at 673K for 4 h in a flow of dry air (30 mL/min) to give Au/Fe and Au/Ti catalysts. The Au loading was typically 3 wt%. To examine the effect of PPh3 ligand on support structure, a Fe(OH)3 {P} sample was prepared by impregnation of Fe(OH)3 with an acetone solution of PPh3 instead of AuPPh3NO3.
Details on Tests Examining Physicochemical Property:
• The catalytic performances at the steady-state were measured after 40 min on stream at each reaction temperature in the temperature ranges from 207 to 298 K for the Au/Fe(OH)3 catalysts and from 273 to 503 K for the Au/Ti(OH)4 catalysts. In a typical experiment a gas mixture of 1.0% CO balanced with air was passed through 200 mg of a catalyst at a flow rate of 67 mL/min. The product analysis was performed by an on-line gas chromatograph.
Individual Particle Diameters Tested (nm):
2.8, 2.9, 3.1, 4.8, 5.5, 8.3, 9.3, 9.7, 9.7, 10.4
Solution characteristics (pH, cosolvents or other additives, sonication, ionic strength)
• pH: No data• Cosolvents or other addi ves: None• Sonica on: Not performed• Ionic strength (conduc vity): No data
Min Diameter Tested (nm): 2.8
Max Diameter Tested (nm): 10.4
Specific Surface Area (SSA) (m2/g): 39, 50, 54, 54, 68, 130, 164, 186, 193, 226
Bulk materials tested (≥ 1000 nm): No
Information on Analytical Methods Used to Determine Particle Size:
Size distributions of Au metallic particles in typical Au/Fe(OH)3 catalysts were estimated by transmission electron microscopy (TEM).
List of Relevant Findings: • Importance of the calcination conditions for regulating the Au particle size in both Au/Fe(OH)3 and AuTi(OH)4 catalysts is evident from the TEM results, which revealed that slow heating in the calcination process resulted in reduction of the gold particle size. The CO conversion was much larger when heating rate of 0.1 K/min instead of 4 K/min was used to calcine Au/Fe(OH)-A. The similar promoting effect of slow calcination was observed with
Au/Fe(OH)3-S and Au/Ti(OH)4-S.• The most ac ve Au/Fe(OH)3-S and Au/Fe(OH)3-A catalysts (slow hea ng rate) possessed a high population of Au particles less than 3–4 nm, while the Au particle size distribution in the Au/Fe(OH)3-A catalyst with low activity was broad (2–13 nm) with average particle size of 4.9 nm. Comparison of TOFs for the supported Au catalysts indicates that variation in the activity of both Au/Fe(OH)3 and Au/Ti(OH)4
catalysts cannot be explained by changes of surface area of Au par cles.• CO oxida on on Au-support interfacial sites seems to be a reasonable interpretation for the present catalytic results.
Size versus Effect Relationship Observed by Authors?:
Yes
Mathematical Relationship Identified in Paper (if applicable):
None
Author‐Identified 'Bright Line' Particle Size (diameter) Threshold (nm) ‐ List if applicable:
None
Notes on 'Bright Line' Threshold: The particle size range tested does not allow for determination of a 'bright line' particle size threshold.
ARCADIS Discussion of Results None
Nature of Size versus Effect Relationship (if applicable)
Catalytic activity increases with decreasing catalyst size.
Page B-74 of 177
Appendix B: Copy of Database
Physico‐chemical Property Investigated:
Reactivity
Priority of Property: High
Relevant for A1 Project?: Yes
Type of nanomaterial (eg, nanometal, nanometal oxide):
Nanometal
Particle Functionalization or Capping Agent (if applicable):
None
List Study Objective(s) Relevant to Investigated Physicochemical Property:
• In the present study EXAFS, TEM, XRD, and N2 adsorption measurements were employed to elucidate an effect of preparation conditions on the performances of Au/Fe(OH)3 and Au/Ti(OH)4 catalysts in low-temperature CO oxidation.
Kozlov et al. (2000)
Specific Details on Tested Nanomaterial(s)
• Gold (Au) supported on Ti(OH)4 using different starting aqueous solutions and rates of calcination
Details on Preparation Method of Nanomaterial(s):
• As-precipitated wet hydroxides were obtained by hydrolysis of Fe(NO3)3.9H2O or Ti(i-OPr)4 with an aqueous solution of Na2CO3 or NH4OH (They are denoted in the text as M(OH)-S and M(OH)-A (M = Fe, Ti). After supporting the AuPPh3NO3 complex on the Fe and Ti support, the samples were temperature-programmed calcined at a given heating rate (0.1, 0.5, 4 or 20 K/min) to 673 K and kept at 673K for 4 h in a flow of dry air (30 mL/min) to give Au/Fe and Au/Ti catalysts. The Au loading was typically 3 wt%. To examine the effect of PPh3 ligand on support structure, a Fe(OH)3 {P} sample was prepared by impregnation of Fe(OH)3 with an acetone solution of PPh3 instead of AuPPh3NO3.
Details on Tests Examining Physicochemical Property:
• The catalytic performances at the steady-state were measured after 40 min on stream at each reaction temperature in the temperature ranges from 207 to 298 K for the Au/Fe(OH)3 catalysts and from 273 to 503 K for the Au/Ti(OH)4 catalysts. In a typical experiment a gas mixture of 1.0% CO balanced with air was passed through 200 mg of a catalyst at a flow rate of 67 mL/min. The product analysis was performed by an on-line gas chromatograph.
Individual Particle Diameters Tested (nm):
4.6, 6.6, 9.3
Solution characteristics (pH, cosolvents or other additives, sonication, ionic strength)
• pH: No data• Cosolvents or other addi ves: None• Sonica on: Not performed• Ionic strength (conduc vity): No data
Min Diameter Tested (nm): 4.6
Max Diameter Tested (nm): 9.3
Specific Surface Area (SSA) (m2/g): No data
Bulk materials tested (≥ 1000 nm): No
Information on Analytical Methods Used to Determine Particle Size:
Size distributions of Au metallic particles in typical Au/Ti(OH)4 catalysts were estimated by transmission electron microscopy (TEM).
List of Relevant Findings: • Importance of the calcination conditions for regulating the Au particle size in both Au/Fe(OH)3 and AuTi(OH)4 catalysts is evident from the TEM results, which revealed that slow heating in the calcination process resulted in reduction of the gold particle size. The CO conversion was much larger when heating rate of 0.1 K/min instead of 4 K/min was used to calcine Au/Fe(OH)-A. The similar promoting effect of slow calcination was observed with
Au/Fe(OH)3-S and Au/Ti(OH)4-S.• The most ac ve Au/Fe(OH)3-S and Au/Fe(OH)3-A catalysts (slow hea ng rate) possessed a high population of Au particles less than 3–4 nm, while the Au particle size distribution in the Au/Fe(OH)3-A catalyst with low activity was broad (2–13 nm) with average particle size of 4.9 nm. Comparison of TOFs for the supported Au catalysts indicates that variation in the activity of both Au/Fe(OH)3 and Au/Ti(OH)4
catalysts cannot be explained by changes of surface area of Au par cles.• CO oxida on on Au-support interfacial sites seems to be a reasonable interpretation for the present catalytic results.
Page B-75 of 177
Appendix B: Copy of DatabaseSize versus Effect Relationship Observed by Authors?:
Yes
Mathematical Relationship Identified in Paper (if applicable):
None
Author‐Identified 'Bright Line' Particle Size (diameter) Threshold (nm) ‐ List if applicable:
None
Notes on 'Bright Line' Threshold: The particle size range tested does not allow for determination of a 'bright line' particle size threshold.
ARCADIS Discussion of Results None
Nature of Size versus Effect Relationship (if applicable)
Catalytic activity increases with decreasing catalyst size.
Physico‐chemical Property Investigated:
Reactivity
Priority of Property: High
Relevant for A1 Project?: Yes
Type of nanomaterial (eg, nanometal, nanometal oxide):
Encapsulated nanometal
Particle Functionalization or Capping Agent (if applicable):
Mesoporous silica (MCM-41)
List Study Objective(s) Relevant to Investigated Physicochemical Property:
• The catalytic activity was evaluated for decomposition and oxidation reactions of methanol, with an objective to establish a relationship between the nature of surface transient species formed over uranium oxide crystallites as a
func on of par cle size and the corresponding reac on products formed at different stages.• Parallel experiments were also performed on parent mesoporous silica (MCM-41) and bulk U3O8 samples, so as to examine the distinct role played by encapsulated uranium oxide species.
Kumar et al. (2004)
Specific Details on Tested Nanomaterial(s)
• Uranium oxide (U3O8)• co-encapsulated in the pore system of mesoporous silica (MCM-41)
Details on Preparation Method of Nanomaterial(s):
• Uranium oxide species within mesoporous MCM-41 was achieved using two different methods: impregnation (IUM) and template exchange method (TUM).• In the impregna on method, uranyl acetate solu on was added
slowly to of template-free MCM-41 sample and then stirred for 30 min. The resulting mass was washed with de-ionized water and it was then dried slowly at room temperature under vacuum. The sample was finally calcined in
oxygen at 550 deg C for 8 h.• In the template exchange method, uncalcined MCM-41 was s rred with aqueous uranyl acetate solution for half an hour, filtered, washed, dried in vacuum and then calcined at 550 deg C for 1 h in nitrogen followed finally by 8 h heating in oxygen.
Details on Tests Examining Physicochemical Property:
• The catalytic activity was monitored for the reaction of methanol using a fixed-bed down-flow tubular quartz reactor of 8 mm diameter, operating in a pulse mode. Experiments were carried out at isothermal temperatures in 25–500 deg C region and at atmospheric pressure. The catalyst was maintained under flow (30 ml min−1) of purified He carrier gas and the successive pulses (10 numbers) composed of methanol + argon (1:16 mol ratio) or alternatively that of methanol + argon + oxygen (1:16:1.5 mol ratio) were introduced at a time interval of about 25 min. The effluents were analyzed on-line on a CHEMITO model-8510 gas chromatograph equipped with dual TCD
and FID detectors, connected in tandem.• The infrared spectra were recorded in transmission mode employing a JASCO-610 FTIR Spectrophotometer equipped with a DTGS detector. A self-supporting sample pellet (80 mg, 25mm diameter) was mounted in a high-temperature, high-pressure, stainless steel cell. Prior to its exposure to methanol, the sample pellets were heated for 24 h in a vacuum of about 0.013 Pa at a temperature of 300 deg C. The experiments were carried out by exposing a sample wafer to a mixture of methanol vapor + argon (1:16 mol ratio).
Individual Particle Diameters Tested (nm):
• IUM: 2, 3, 4, 5• TUM: 3, 6, 9, 12, 15
Solution characteristics (pH, cosolvents or other additives, sonication, ionic strength)
• pH: No data• Cosolvents or other addi ves: None• Sonica on: Not performed• Ionic strength (conduc vity): Not applicable
Page B-76 of 177
Appendix B: Copy of DatabaseMin Diameter Tested (nm): 2
Max Diameter Tested (nm): 15
Specific Surface Area (SSA) (m2/g): No data
Bulk materials tested (≥ 1000 nm): No
Information on Analytical Methods Used to Determine Particle Size:
For the characterization of nanopowders, XRD, FTIR spectroscopy, DR UV–vis spectroscopy, N2 sorption, TEM and XPS techniques were employed. The XRD measurements were made ona Philips Analy cal Diffractometer using Ni-
filtered Cu K radiation in the 2θ-region of 10–70 deg and at a scan rate of 1 deg/min. The data were also collected in the selected 2-10 deg 2θ-region at a lower scan rate, so as to monitor the framework reflections carefully. The TEM pictures were taken on a Joel, model 2000 FX instrument, operating at 120 kV. The samples for this analysis were prepared by ultrasonicating a sample of 300 mesh size in ethanol and then dispersing it on a carbon film supported on a copper grid.
List of Relevant Findings: • The surface area of the host MCM-41, IUM and TUM samples was found to be 1000, 856 and 630m^2/g, respectively. The surface area of a bulk U3O8 sample, obtained by calcination of uranyl acetate in air, was
6m^2/g.• Results for the adsorp on of methanol over IUM and TUM samples, as compared to the results for bulk U3O8, a significant difference was noticed in the nature of the transient species formed and also in the reaction
onset temperature when CH3OH was dosed on UOx/MCM samples.• It is quite evident that the chemisorp on behavior of bulk U3O8 and dispersed UOx species is quite different. Thus, while room temperature adsorption over bulk U3O8 resulted in the formation of formate complex and oxymethylene species, the exposure of methanol over UOx/MCM gave rise to surface-adsorbed (–OCH2)n type polymerized species. These surface transients undergo further oxidation/decomposition reactions to give rise to CO, CO2 and CH4 as final products; the size of UOx crystallites having a strong influence on these transformations. The smaller size crystallites of uranium oxide (3 nm) in sample IUM exhibited better oxidizing activity compared to those of larger size (2–15 nm) on sample TUM.
Size versus Effect Relationship Observed by Authors?:
Yes
Mathematical Relationship Identified in Paper (if applicable):
None
Author‐Identified 'Bright Line' Particle Size (diameter) Threshold (nm) ‐ List if applicable:
None
Notes on 'Bright Line' Threshold: Particles produced by the TUM were larger than particles produced by IUM. The authors compare the catalytic activity of IUM particles compared to TUM particles which provides an indirect evaluation of size-dependence on catalytic activity since these particle size ranges overlap. The authors describe the catalytic activity of IUM particles as 'better' than that of TUM particles. For this reason, a 'bright line' particle size threshold cannot be derived from these data.
ARCADIS Discussion of Results None
Nature of Size versus Effect Relationship (if applicable)
Increased oxidizing activity was observed for smaller particle sizes.
Physico‐chemical Property Investigated:
Crystalline structure (structure)
Priority of Property: High
Relevant for A1 Project?: Yes
Type of nanomaterial (eg, nanometal, nanometal oxide):
Nanometal
Particle Functionalization or Capping Agent (if applicable):
None
List Study Objective(s) Relevant to Investigated Physicochemical Property:
• Contrary to other metals, for small palladium particles a dilatation of the lattice parameter has been reported; however, Pd clusters embedded in a plasma polymer matrix show a contraction of the lattice constant with
decreasing size of the cluster, similar to what is usually observed for other metals.• In this study, a technique has been developed for the preparation of metal clusters in a plasma polymer matrix. Using an inert gas evaporation technique in combination with a simultaneous plasma polymerization process, Pd clusters uniform in size and free of impurities could be produced in an amorphous plasma polymer matrix. The lattice parameters were determined for each cluster size.
Lamber et al. (1995)
Specific Details on Tested Nanomaterial(s)
• Palladium (Pd)
Page B-77 of 177
Appendix B: Copy of DatabaseDetails on Preparation Method of Nanomaterial(s):
• Palladium clusters were prepared by evaporation of Pd (Pd wire, Alfa Products, 25 ppm) from a resistance-heated graphite boat (Balzers BD 482090-T)
Details on Tests Examining Physicochemical Property:
• For the structural characterization by means of transmission electron microscopy (TEM) the palladium-containing plasma polymer films were deposited onto a fresh, air-cleaved (100) face of a NaCl single crystal. The NaCl substrate was immersed in a large amount of distilled water, and the floating plasma polymer films were picked up onto Cu electron microscope grids. The conventional TEM and electron diffraction study was carried out with a Philips EM 420T electron microscope operated at 120 keV and equipped with an energy dispersive x-ray analyzer (EDX). High-resolution electron microscopy (EM) examinations were performed in a Philips CM 20 Ultra-Twin electron microscope with a point resolution of 0.19 nm
Individual Particle Diameters Tested (nm):
1.4, 2, 2.5, 3, 4, 5 (mean values)
Solution characteristics (pH, cosolvents or other additives, sonication, ionic strength)
Not applicable
Min Diameter Tested (nm): 1.4
Max Diameter Tested (nm): 5
Specific Surface Area (SSA) (m2/g): No data
Bulk materials tested (≥ 1000 nm): No
Information on Analytical Methods Used to Determine Particle Size:
For the characterization of Pd clusters in a VTMS-polymer matrix x-ray photoelectron spectroscopy (XPS), Fourier-transform infrared (FTIR) spectroscopy, and UV-visible spectrophotometry were also used.
List of Relevant Findings: • The study of palladium/plasma polymer composites has shown that Pd clusters embedded in a plasma polymer matrix show a contrac on of the la ce parameter with decreasing size.• To our knowledge a decrease of the
lattice parameter of small palladium particles with their size has not been reported in the literature up to now.
Size versus Effect Relationship Observed by Authors?:
Yes
Mathematical Relationship Identified in Paper (if applicable):
For spherical particles with a cubic structure and lattice constant a, the surface stress can be calculated according to the following rela on:f= -3/(4delta(a))/aD/K,Where:ha = the change in la ce constant due to the surface
stressa = the la ce constant of the bulk materialD = the mean par cle diameterK = the compressibility of the bulk material
Author‐Identified 'Bright Line' Particle Size (diameter) Threshold (nm) ‐ List if applicable:
None
Notes on 'Bright Line' Threshold: A size-effect relationship was observed over the particle size range tested; however, this relationship was continuous and thus does not allow for the development of a bright line.
ARCADIS Discussion of Results Lamber et al. cited Vermaak et al. (1968) as the source of the mathematical relationship identified herein. However, upon review of that paper, Vermaak et al. (1968) did not appear to have derived that equation.
Nature of Size versus Effect Relationship (if applicable)
The lattice parameter decreases with decreasing particle size over the range 1.4 to 5 nm.
Physico‐chemical Property Investigated:
Crystalline structure (structure)
Priority of Property: High
Relevant for A1 Project?: Yes
Type of nanomaterial (eg, nanometal, nanometal oxide):
Nanometal oxide
Particle Functionalization or Capping Agent (if applicable):
None
List Study Objective(s) Relevant to Investigated Physicochemical Property:
• To investigate the effect of particle size on linear lattice expansion of rutile TiO2 nanocrystals.
Li et al. (2004a)
Specific Details on Tested Nanomaterial(s)
• Titanium dioxide (TiO2)• ru le
Page B-78 of 177
Appendix B: Copy of DatabaseDetails on Preparation Method of Nanomaterial(s):
• Highly pure ru le nanopar cles were prepared by a hydrothermalmethod.
Details on Tests Examining Physicochemical Property:
• X-ray diffraction (XRD) data of the rutile nanoparticles were measured at room temperature at a scan rate of 0.2 deg 2-theta/min.• The la ce parameters for the samples were calculated by least-squares methods.• The ionic
characteristics were studied by determining the binding energies of the O 1s and Ti 2p electrons using x-ray photoelectron spectroscopy (XPS). The binding-energy data are calibrated with the C 1s signal at 284.6 eV.
Individual Particle Diameters Tested (nm):
ca. 5, ca. 7.3, ca. 12.3, ca. 16, ca. 24
Solution characteristics (pH, cosolvents or other additives, sonication, ionic strength)
• pH: No data• Cosolvents or other addi ves: No data• Sonica on: No data• Ionic strength (conduc vity): No data
Min Diameter Tested (nm): ca. 5
Max Diameter Tested (nm): ca. 24
Specific Surface Area (SSA) (m2/g): No data
Bulk materials tested (≥ 1000 nm): No
Information on Analytical Methods Used to Determine Particle Size:
The average grain size (sDd) was measured from the most intense XRD peak (110) using the Scherrer formula.
List of Relevant Findings: • Structural refinements using a least-squares method indicate the lattice volume of rutile TiO2 nanocrystals increases monotonically with a reduction in grain size.
Size versus Effect Relationship Observed by Authors?:
Yes
Mathematical Relationship Identified in Paper (if applicable):
V = V0 + ((V(c) - V(0)) * D(c))/DWhere:V(0) = 6.2363E-02 nm^3 denotes an imaginary bulk la ceinfinitely largeD(c) = cri cal par cle size when the external forces from the surface dipoles and surface tension are
balancedV(c) = cri cal la ce volume when the external forces from the surface dipoles and surface tension are balancedAs the par cle size increases beyond D(c), the rela ve surface area and surface tension will become
extremely small and the lattice volume at D >= D(c) can be taken as a constant; that is, V(c) will have a value much closer to the actual lattice volume of 6.2433E-02 nm^3 for the bulk phase of rutile TiO2. If we assume this value for Vc, the equation will yield a critical size of D(c) = 54 nm. This critical size, obtained by our linear lattice expansion, is in excellent agreement with that of ca. 50 nm as determined by the photoluminescence method below which a significant blue shift is observed in the absorption spectra relative to those of bulk phases, indicating a quantum-size effect.
Author‐Identified 'Bright Line' Particle Size (diameter) Threshold (nm) ‐ List if applicable:
54
Notes on 'Bright Line' Threshold: The lattice parameter (and lattice volume) increase monotonically with decreasing particle size from ca. 24 to ca. 5 nm. The authors calculate a particle diameter of 54 nm as the critical size when the external forces from surface dipoles and surface tension are matched.
ARCADIS Discussion of Results None
Nature of Size versus Effect Relationship (if applicable)
The lattice parameter (and lattice volume) increases with decreasing particle diameter over the range ca. 5 to ca. 24 nm.
Physico‐chemical Property Investigated:
Crystalline structure (structure)
Priority of Property: High
Relevant for A1 Project?: Yes
Type of nanomaterial (eg, nanometal, nanometal oxide):
Nanometal oxide
Particle Functionalization or Capping Agent (if applicable):
None
List Study Objective(s) Relevant to Investigated Physicochemical Property:
• The objectives of the study are to determine phase transformation type and the onset temperature of the phase transforma on as a func on of par cle size.• The la ce changes of anatase are also quan fied during the phase
evolu on.• The surface energy, surface stress, and ac va on energy, which are the important factors to study the phase transformations, are evaluated to reveal the effect of these parameters on the thermal stability of anatase nanoparticles.
Appendix B: Copy of DatabaseDetails on Preparation Method of Nanomaterial(s):
• MOCVD method was used to prepare TiO2 nanopar cles with different average par cle sizes• All par cles were collected disks made of several layers of stainless steel screen, which were cleaned by acetone, methanol, and de-ionized water. A 3 cm diameter and 12.5 cm long quartz tube was used to hold substrate perpendicular to the flow direction in the central part of reaction chamber. For deposition, the substrate temperature was raised to 600 deg C. In order to obtain particles with different sizes, O2 flow rate was varied. For all depositions, TTIP (titanium tetraisoproxide) was used as Ti precursor. The temperature of the precursor bath was kept at 220 deg C. Ar was
used as the carrier gas and the total ini al deposi on pressure was about 2 kPa.• Deposited nanopar cles were then removed from the screen for annealing and characterization. Isochronal annealings were carried out to investigate the phase transformation behavior. For annealing, each as deposited sample was divided into several portions. The annealing temperatures were 700, 750 and 800 deg C. Annealing experiments were carried out in air for 1 h in a 1200 W box furnace.
Details on Tests Examining Physicochemical Property:
• Before the sorption analysis, the samples were degassed and calcinated at 100 °C for 24 h. N2 was chosen as the adsorbate for isothermal adsorp on.• The rela ve pressure P/P0 used was within the range of 0.05–0.35. P0 is
the gas pressure required for saturation at the temperature of experiment and P is the pressure of the gas at the equilibrium with a solid. The average pore radius was also recorded.• In order to study the phase transforma on
behavior, the particle growth and phase concentrations at various annealing temperatures (including starting anatase nanoparticles) were qualitatively determined by TEM and XRD.
Individual Particle Diameters Tested (nm):
12, 17, 23
Solution characteristics (pH, cosolvents or other additives, sonication, ionic strength)
Not applicable
Min Diameter Tested (nm): 12
Max Diameter Tested (nm): 23
Specific Surface Area (SSA) (m2/g): 125, 95, 65
Bulk materials tested (≥ 1000 nm): No
Information on Analytical Methods Used to Determine Particle Size:
The structure and particle size analysis were measured by x-ray diffraction (XRD) and transmission electron microscopy (TEM). Specific surface area was measured by Brunauer- Emmett-Teller (BET) method. The BET measurements were performed in a NOVA2000 gas sorption analyzer (Quantachrome Corporation).
List of Relevant Findings: • Anatase nanoparticles with a smaller initial particle diameter have a lower thermal stability and lower transition to rutile phase onset temperature than larger particles; 12 nm anatase had the lowest transformation starting
temperature and thermal stability as compared with 17 and 23 nm samples.• This behavior is different from the high pressure TiO2 phase transformations which include the appearance of other structures such as a −PbO2 and ZrO2-type phases, as previously reported. All of our phase transformation experiments were carried out under
normal pressure (1 atm).• The higher the anatase surface energy and surface stress energy, the more the contribution to the non equilibrium transition from anatase to rutile. Particles with smaller sizes have larger surface areas; therefore, in anatase with smaller size, it is easier to start the phase transformation. The higher negative delta-G(A->R) value corresponds to the lower activation energy needed for anatase to rutile transition. Assuming the transformation is a first-order reaction, the activation energies were calculated as 180, 236 and 299 kJ/mol for 12, 17 and 23 nm TiO2 particles, respectively.
Size versus Effect Relationship Observed by Authors?:
Yes
Mathematical Relationship Identified in Paper (if applicable):
The phase composi on is calculated by the following formula:W(r) = A(r)/A(0) = A(r) / (0.884A(a) + A(r))Where:W(r) = ru le weight percentA(a) = integrated diffrac on peak intensity from ru le (110)A(r) =
integrated diffrac on peak intensity from anatase (101)A(0) = total integrated (101) and (110) peak intensity
Author‐Identified 'Bright Line' Particle Size (diameter) Threshold (nm) ‐ List if applicable:
None
Notes on 'Bright Line' Threshold: Smaller anatase TiO2 particles have a lower phase transition onset temperature and activation energy for transformation to rutile than larger particles; however, a 'bright line' particle size threshold cannot be determined from these data.
ARCADIS Discussion of Results Mathema cal Rela onship Iden fied in Paper (cont'd): The system Gibbs free energy of the nanopar cles for anatase to ru le phase transforma on is usually expressed as:delta-G(A-->R) = delta-G(v,R)*T - delta-G(v,A)*T +
((3*M*gamma®/rho®*r®) - (3*M*gamma(A)/rho(A)*r(A))) + ((3*M*f(A)/rho(A)*r(A)) - (2*M*f(A)/rho(A)*r(A)))Where:subscript R = ru lesubscript A = anatase delta-G(A->R) = system Gibbs free
energy of the nanopar cles for anatase to ru le phase transforma ondelta-G(v,R) = ru le volume energydelta- G(v,A) = anatase volume energyT = absolute temperatureM = molecular weightr = radiusrho = phase
densitygamma = surface free energydelta-P = surface stress (f) related excess pressure with a value of (2f)/r
Nature of Size versus Effect Relationship (if applicable)
Smaller particles have a lower phase transition onset temperature and activation energy.
Page B-80 of 177
Appendix B: Copy of Database
Physico‐chemical Property Investigated:
Water solubility
Priority of Property: High
Relevant for A1 Project?: Yes
Type of nanomaterial (eg, nanometal, nanometal oxide):
Nanometal sulfide
Particle Functionalization or Capping Agent (if applicable):
None
List Study Objective(s) Relevant to Investigated Physicochemical Property:
• Nanoparticle dissolution rate data have been collected and explained for an environmentally and industrially relevant nanomaterial (PbS, the mineral galena) as a function of its particle size and aggregation state using high-resolution transmission electron microscopy (HRTEM) and solution analysis.
Liu et al. (2009a)
Specific Details on Tested Nanomaterial(s)
• Lead sulfide (PbS)
Details on Preparation Method of Nanomaterial(s):
• Galena microcrystals were synthesized by a hydrothermal method. One mmol (CH3COO)2Pb and 4 mmol Na2S2O3 were dissolved in 9.2 mL of deionized water, respectively. The solutions were transferred into a 23 mL Parr acid digestion bomb with an inserted PTFE sample cup. Then, the system was closed tightly and heated in an oven to 150 deg C for 20 h. Black precipitates were collected, washed with deionized water several times, and dried in air at 50 deg C.
Details on Tests Examining Physicochemical Property:
• Dissolution experiments were performed in a glass reactor (750 mL capacity) under constant mechanical stirring at 25 deg C. Hydrochloric acid solution (495 mL; pH3) was added to the chamber and purged with nitrogen for 30 min to remove dissolved O2. Nanoparticle aggregates were sonicated in 5 mL of HCl solution (pH 3). This suspension was then added to a batch reactor with deoxygenated HCl solution (pH 3). Nitrogen purging was
maintained throughout the experiment and the pH was monitored constantly with a pH meter.• Samples of 6 mL of solutions were taken after certain intervals and immediately filtered. For the dissolution of microcrystals, syringe filters with a pore size of 0.45 μm were used. In the dissolution of nanocrystal aggregates, filters with two different pore sizes were used to evaluate the effect of filtration on the measured dissolution rate: a syringe filter with a pore size of 100 nm, and a centrifugal ultra filter (Amicon Ultra-4, Millipore) with a cutoff of 100k NMWL (nominal
molecular weight limit), approximately equivalent to a pore size of 6.2 nm.• Pb concentra ons of the sampled solutions were measured using an inductively coupled plasma atomic emission spectrometer (ICP-AES). The detection limit for Pb is 0.016 ppm.
Solution characteristics (pH, cosolvents or other additives, sonication, ionic strength)
• pH: 3• Cosolvents or other addi ves: hydrochloric acid (pH adjustment)• Sonica on: For nanocrystal aggregate analysis, aggregateswere sonicated in hexanes un l the suspension becametransparent.• Ionic
strength (conductivity): No data
Page B-81 of 177
Appendix B: Copy of DatabaseMin Diameter Tested (nm): 14.4
Max Diameter Tested (nm): 3100
Specific Surface Area (SSA) (m2/g): -- , 11.71, 0.285
Bulk materials tested (≥ 1000 nm): Yes
Information on Analytical Methods Used to Determine Particle Size:
• The size and morphology of primary nanocrystals and aggregates were observed by a Philips EM420 transmission electron microscope (TEM) operated in bright field mode at 100 keV. For primary nanocrystal analysis, samples were prepared by dipping a carbon-coated 400-mesh copperTEM grid into the nanocrystal suspension and then drying the grid in air. For nanocrystal aggregate analysis, aggregates were sonicated in hexanes until the suspension
became transparent.• Dynamic light sca ering (DLS) was used to measure the size of nanocrystal aggregates in hydrochloric acid solu ons.• To complement DLS results, the size and degree of aggrega on of nanopar cle
aggregates were observed by high-resolution field emission scanning electron microscopy (FESEM)
List of Relevant Findings: • For 0.05 g of galena microcrystals dissolved in 0.4 L of deoxygenated HCl (pH 3) solution, the Ageo normalized dissolution rate is 7.7E-10 mol/m^2*s, which is 1 order of magnitude slower than the dissolution rate of dispersed nanocrystals. Although the dissolution rates of dispersed nanoparticles and microcrystals were measured with two different techniques (monitoring size reduction or measuring the release of ions), these two measurements are
directly correlated, and should not lead to any enormous difference in rates.• The faster dissolu on of galena nanoparticles agrees with the prediction of the modified Kevin equation, in that the dissolution is more
thermodynamically favored on nanocrystals rela ve to bulk materials.• The faster dissolu on of galena nanoparticles can be attributed to a difference in surface reactivity as a function of size. Even with the same total surface area, and considering the roughness of typical galena crystal growth and cleavage surfaces as measured by scanning tunneling microscopy (STM), nanocrystals have a much larger fraction of atoms at edges (or steps) and corners, and not on flat terraces, than larger particles. Such surface nanotopographic features are well-known as preferred detachment/dissolution sites. Also, besides {100} faces which dominate the morphology of microcrystals, nanocrystals also present {110} and {111} faces which are more reactive to dissolution under these experimental conditions as determined by HRTEM analysis.
Size versus Effect Relationship Observed by Authors?:
Yes
Mathematical Relationship Identified in Paper (if applicable):
None
Author‐Identified 'Bright Line' Particle Size (diameter) Threshold (nm) ‐ List if applicable:
None
Notes on 'Bright Line' Threshold: A single size of microcrystals (3100 nm) and a single size of nanocrystals (14.4 nm) was tested and the rate of dissolution was greater for nanoparticles. As only two sizes were tested and the size of these particles is greatly different, a 'bright line' particle size threshold cannot be determined.
ARCADIS Discussion of Results Authors note that nanocrystals have a much larger fraction of atoms at edges (or steps) and corners, and not on flat terraces, than larger particles. Such surface nanotopographic features are well-known as preferred detachment/dissolution sites. Also, besides {100} faces which dominate the morphology of microcrystals, nanocrystals also present {110} and {111} faces which are more reactive to dissolution under these experimental conditions as determined by HRTEM analysis.
Nature of Size versus Effect Relationship (if applicable)
The dissolution rate increases with decreasing particle size from microcrystals to nanocrystals.
Physico‐chemical Property Investigated:
Crystalline structure (structure)
Priority of Property: High
Relevant for A1 Project?: Yes
Type of nanomaterial (eg, nanometal, nanometal oxide):
Coated nanometal
Particle Functionalization or Capping Agent (if applicable):
PVP
List Study Objective(s) Relevant to Investigated Physicochemical Property:
• To measure the solubility of organic-coated silver nanoparticles (Ag NPs) having particle diameters ranging from 5 to 80 nm that were synthesized using various methods, and with different organic polymer coatings including poly(vinylpyrrolidone) and gum arabic.
Appendix B: Copy of DatabaseDetails on Preparation Method of Nanomaterial(s):
No data
Details on Tests Examining Physicochemical Property:
• To confirm the absence of strain in the Ag NPs, the average Ag−Ag (first-neighbor) distances and la ce parameters for selected Ag NPs weredetermined using EXAFS and PDF analyses.
Individual Particle Diameters Tested (nm):
25, 38, 80
Solution characteristics (pH, cosolvents or other additives, sonication, ionic strength)
• pH: 8• Cosolvents or other addi ves: none• Sonica on: Prior to solubility studies, solu ons containing nanoparticles were sonicated in an ice-bath to resuspend the NPs. The suspension was agitated for 1 h on an end-over-end rotator at 30 rpm in the
Min Diameter Tested (nm): 5
Max Diameter Tested (nm): 80
Specific Surface Area (SSA) (m2/g): No data
Bulk materials tested (≥ 1000 nm): No
Information on Analytical Methods Used to Determine Particle Size:
The size and morphology of Ag NPs were characterized by transmission electron microscopy (TEM).
List of Relevant Findings: • No differences in Ag−Ag (first-neighbor) distances (i.e., la ce contrac on) occurred as a func on of par cle size.
Size versus Effect Relationship Observed by Authors?:
None
Mathematical Relationship Identified in Paper (if applicable):
N/A
Author‐Identified 'Bright Line' Particle Size (diameter) Threshold (nm) ‐ List if applicable:
N/A
Notes on 'Bright Line' Threshold: N/A
ARCADIS Discussion of Results None
Nature of Size versus Effect Relationship (if applicable)
N/A
Physico‐chemical Property Investigated:
Crystalline structure (structure)
Priority of Property: High
Relevant for A1 Project?: Yes
Type of nanomaterial (eg, nanometal, nanometal oxide):
Coated nanometal
Particle Functionalization or Capping Agent (if applicable):
gum arabic
List Study Objective(s) Relevant to Investigated Physicochemical Property:
• To measure the solubility of organic-coated silver nanoparticles (Ag NPs) having particle diameters ranging from 5 to 80 nm that were synthesized using various methods, and with different organic polymer coatings including poly(vinylpyrrolidone) and gum arabic.
Details on Tests Examining Physicochemical Property:
• To confirm the absence of strain in the Ag NPs, the average Ag−Ag (first-neighbor) distances and la ce parameters for selected Ag NPs weredetermined using EXAFS and PDF analyses.
Individual Particle Diameters Tested (nm):
6, 25
Solution characteristics (pH, cosolvents or other additives, sonication, ionic strength)
• pH: 8• Cosolvents or other addi ves: none• Sonica on: Prior to solubilit studies, solu ons containing nanoparticles were sonicated in an ice-bath to resuspend the NPs. The suspension was agitated for 1 h on an end-over-end rotator at 30 rpm in the dark. This process was repeated once more to remove silver ions in solution
prior to dissolu on studies.• Ionic strength (conduc vity): no data
Page B-83 of 177
Appendix B: Copy of DatabaseMin Diameter Tested (nm): 6
Max Diameter Tested (nm): 25
Specific Surface Area (SSA) (m2/g): No data
Bulk materials tested (≥ 1000 nm): No
Information on Analytical Methods Used to Determine Particle Size:
The size and morphology of Ag NPs were characterized by transmission electron microscopy (TEM).
List of Relevant Findings: • No differences in Ag−Ag (first-neighbor) distances (i.e., la ce contrac on) occurred as a func on of par cle size.
Size versus Effect Relationship Observed by Authors?:
None
Mathematical Relationship Identified in Paper (if applicable):
N/A
Author‐Identified 'Bright Line' Particle Size (diameter) Threshold (nm) ‐ List if applicable:
N/A
Notes on 'Bright Line' Threshold: N/A
ARCADIS Discussion of Results None
Nature of Size versus Effect Relationship (if applicable)
N/A
Physico‐chemical Property Investigated:
Water solubility
Priority of Property: High
Relevant for A1 Project?: Yes
Type of nanomaterial (eg, nanometal, nanometal oxide):
Coated nanometal
Particle Functionalization or Capping Agent (if applicable):
PVP
List Study Objective(s) Relevant to Investigated Physicochemical Property:
• To measure the solubility of organic-coated silver nanoparticles (Ag NPs) having particle diameters ranging from 5 to 80 nm that were synthesized using various methods, and with different organic polymer coatings including poly(vinylpyrrolidone) and gum arabic.
Details on Tests Examining Physicochemical Property:
• Prior to the dissolution studies, the Ag NPs were washed two times using DI water to remove excess silver ions and organic coatings resulting from synthesis or during storage. After ultracentrifugation, the supernatant was
carefully decanted and an equal volume of deoxygenated DI water was added. • The solubili es of Ag NPs of different sizes were measured by quantifying dissolved silver in solution with a known initial mass of Ag NPs
(typically 5 mg/L) in air saturated (8.6 mg/L DO) 1 mM NaHCO3 solu on at pH 8.• Washed stock solu ons (concentration ranging from 20 to 1000 mg/L) were diluted into 120 mL serum bottles to provide the desired initial Ag NPs concentrations (~5 mg/L). Control reactors were acid digested immediately after washing to confirm the total initial silver concentration (C0) for each Ag NP type. The serum bottles were sealed with air in the headspace and agitated on the end-over-end rotator at 30 rpm in the dark at room temperature (20 deg C). Reactors were sampled at time intervals over three months, to determine the dissolved Ag concentration. The duration of solubility measurements was two months for smaller particles (Ag PVP 5, Ag PVP 8) and three months for larger particles (Ag NA 80, Ag PVP 25 and Ag PVP 38). Dissolution experiments were stopped only after no significant changes in dissolved Ag concentrations were observed.
Individual Particle Diameters Tested (nm):
5, 8, 25, 38, 80
Solution characteristics (pH, cosolvents or other additives, sonication, ionic strength)
• pH: 8• Cosolvents or other addi ves: none• Sonica on: Prior to solubilit studies, solu ons containing nanoparticles were sonicated in an ice-bath to resuspend the NPs. The suspension was agitated for 1 h on an end-over-end rotator at 30 rpm in the dark. This process was repeated once more to remove silver ions in solution
prior to dissolu on studies.• Ionic strength (conduc vity): no data
Page B-84 of 177
Appendix B: Copy of DatabaseMin Diameter Tested (nm): 5
Max Diameter Tested (nm): 80
Specific Surface Area (SSA) (m2/g): No data
Bulk materials tested (≥ 1000 nm): No
Information on Analytical Methods Used to Determine Particle Size:
The size and morphology of Ag NPs were characterized by transmission electron microscopy (TEM).
List of Relevant Findings: • The measured extent of dissolution of the Ag NPs was 62.9, 14.5, 6, 4.1 and 0.98% for 5, 8, 25, 38 and 80 nm nAg.• The solubili es increased with decreasing NP size. In the absence of any effects due to NP size or strain, one
would expect constant release of Ag+ species per surface area unit ((Ag+)/SA) irrespective of particle size, assuming that surface area is reasonably represented by that of a sphere having the measured TEM diameter. A constant release of Ag+ ion per unit surface area was not observed for the Ag NPs studied here; which indicates that surface
area alone did not explain the dissolu on of Ag NPs.• A plot of log solubility versus 1/TEM diameter shows a good fit of the data by the Ostwald-Freundlich equation, which indicates that solubility is impacted by the size of the Ag NPs evaluated here. The correlation of log solubility with 1/XRD diameter or 1/DLS diameter is poorer than that of log solubility with 1/TEM diameter. This finding suggests that the solubility of Ag NPs may be predicted from their TEM diameter for the coating types and synthesis methods used here, and that it is not affected the limited aggregation observed here (DLS size). It should be noted that this suggestion is for dilute suspensions of Ag NPs at pH 8, where the availability of dissolved oxygen does not limit dissolution. It should also be noted that even though the organic coatings did not affect solubility, they may affect the kinetics of dissolution as has been previously reported.
Size versus Effect Relationship Observed by Authors?:
Yes
Mathematical Relationship Identified in Paper (if applicable):
None
Author‐Identified 'Bright Line' Particle Size (diameter) Threshold (nm) ‐ List if applicable:
5 < Threshold < 8
Notes on 'Bright Line' Threshold: There is a large increase in dissolution between particle sizes of 8 and 5 nm.
ARCADIS Discussion of Results None
Nature of Size versus Effect Relationship (if applicable)
Dissolution increased with decreasing particle size from 80 to 5 nm PVP-coated nAg.
Physico‐chemical Property Investigated:
Water solubility
Priority of Property: High
Relevant for A1 Project?: Yes
Type of nanomaterial (eg, nanometal, nanometal oxide):
Coated nanometal
Particle Functionalization or Capping Agent (if applicable):
gum arabic
List Study Objective(s) Relevant to Investigated Physicochemical Property:
• To measure the solubility of organic-coated silver nanoparticles (Ag NPs) having particle diameters ranging from 5 to 80 nm that were synthesized using various methods, and with different organic polymer coatings including poly(vinylpyrrolidone) and gum arabic.
Appendix B: Copy of DatabaseDetails on Preparation Method of Nanomaterial(s):
No data
Details on Tests Examining Physicochemical Property:
• Prior to the dissolution studies, the Ag NPs were washed two times using DI water to remove excess silver ions and organic coatings resulting from synthesis or during storage. After ultracentrifugation, the supernatant was
carefully decanted and an equal volume of deoxygenated DI water was added. • The solubili es of Ag NPs of different sizes were measured by quantifying dissolved silver in solution with a known initial mass of Ag NPs
(typically 5 mg/L) in air saturated (8.6 mg/L DO) 1 mM NaHCO3 solu on at pH 8.• Washed stock solu ons (concentration ranging from 20 to 1000 mg/L) were diluted into 120 mL serum bottles to provide the desired initial Ag NPs concentrations (~5 mg/L). Control reactors were acid digested immediately after washing to confirm the total initial silver concentration (C0) for each Ag NP type. The serum bottles were sealed with air in the headspace and agitated on the end-overend rotator at 30 rpm in the dark at room temperature (20 deg C). Reactors were sampled at time intervals over three months, to determine the dissolved Ag concentration. The duration of solubility measurements was two months for smaller particles (Ag GA 6) and three months for larger particles (Ag GA 25). Dissolution experiments were stopped only after no significant changes in dissolved Ag concentrations were observed.
Individual Particle Diameters Tested (nm):
6, 25
Solution characteristics (pH, cosolvents or other additives, sonication, ionic strength)
• pH: 8• Cosolvents or other addi ves: none• Sonica on: Prior to solubilit studies, solu ons containing nanoparticles were sonicated in an ice-bath to resuspend the NPs. The suspension was agitated for 1 h on an end-over-end rotator at 30 rpm in the dark. This process was repeated once more to remove silver ions in solution
prior to dissolu on studies.• Ionic strength (conduc vity): no data
Min Diameter Tested (nm): 6
Max Diameter Tested (nm): 25
Specific Surface Area (SSA) (m2/g): No data
Bulk materials tested (≥ 1000 nm): No
Information on Analytical Methods Used to Determine Particle Size:
The size and morphology of Ag NPs were characterized by transmission electron microscopy (TEM).
List of Relevant Findings: • The measured extent of dissolu on of the Ag NPs was 51.0 and 5.8% for 6 and 25 nm nAg.• The solubili es increased with decreasing NP size. In the absence of any effects due to NP size or strain, one would expect constant release of Ag+ species per surface area unit ((Ag+)/SA) irrespective of particle size, assuming that surface area is reasonably represented by that of a sphere having the measured TEM diameter. A constant release of Ag+ ion per unit surface area was not observed for the Ag NPs studied here; which indicates that surface area alone did not
explain the dissolu on of Ag NPs.• A plot of log solubility versus 1/TEM diameter shows a good fit of the data by the Ostwald-Freundlich equation, which indicates that solubility is impacted by the size of the Ag NPs evaluated here. The correlation of log solubility with 1/XRD diameter or 1/DLS diameter is poorer than that of log solubility with 1/TEM diameter. This finding suggests that the solubility of Ag NPs may be predicted from their TEM diameter for the coating types and synthesis methods used here, and that it is not affected the limited aggregation observed here (DLS size). It should be noted that this suggestion is for dilute suspensions of Ag NPs at pH 8, where the availability of dissolved oxygen does not limit dissolution. It should also be noted that even though the organic coatings did not affect solubility, they may affect the kinetics of dissolution as has been previously reported.
Size versus Effect Relationship Observed by Authors?:
Yes
Mathematical Relationship Identified in Paper (if applicable):
None
Author‐Identified 'Bright Line' Particle Size (diameter) Threshold (nm) ‐ List if applicable:
None
Notes on 'Bright Line' Threshold: Only two sizes were tested; insufficient number of sizes to infer a 'bright line' particle size threshold.
ARCADIS Discussion of Results None
Nature of Size versus Effect Relationship (if applicable)
Dissolution increased with decreasing particle size from 25 to 6 nm gum arabic-coated nAg.
Page B-86 of 177
Appendix B: Copy of Database
Physico‐chemical Property Investigated:
Photocatalytic activity
Priority of Property: High
Relevant for A1 Project?: Yes
Type of nanomaterial (eg, nanometal, nanometal oxide):
Nanometal
Particle Functionalization or Capping Agent (if applicable):
None
List Study Objective(s) Relevant to Investigated Physicochemical Property:
• TiO2 photocatalysts of controlled crystal and aggregate sizes were created, particle size TiO2 photocatalysts was characterized using XRD, TEM and N2 physi-adsorp on.• Following the sol–gel prepara on, controlled
thermaland/or hydrothermal treatments were used to transform the amorphous tania into crystalline anatase.
Maira et al. (2000)
Specific Details on Tested Nanomaterial(s)
• Titanium dioxide (TiO2)• anatase
Details on Preparation Method of Nanomaterial(s):
No data
Details on Tests Examining Physicochemical Property:
• The catalytic activity of the nanometer-sized TiO2 was investigated using gas-phase trichloroethylene (TCE) photooxida on as a probe reac on.• Cataly c ac vity of TiO2 aggregates was also examined
Individual Particle Diameters Tested (nm):
2.3 - 25
Solution characteristics (pH, cosolvents or other additives, sonication, ionic strength)
• pH: No data• Cosolvents or other addi ves: • Sonica on: Sonica on was used to clean the support to which the TiO2 catalysts were coated (the solvent used for sonica on was sequence of trichloroethylene and ethanol)•
Ionic strength (conductivity): No data
Min Diameter Tested (nm): 2.3
Max Diameter Tested (nm): 25
Specific Surface Area (SSA) (m2/g): 28 - 268
Bulk materials tested (≥ 1000 nm): No
Information on Analytical Methods Used to Determine Particle Size:
The grain size of the TiO2 particles was determined from the X-ray diffraction patterns.
List of Relevant Findings: • The rate of oxida on increased as the TiO2 crystal size decreases from 27 to 7 nm. • Catalyst ac vity dropped when smaller TiO2 primary particles (i.e., 3.8 and 2.3 nm) were used. The results suggest that an optimum TCE
degrada on can be obtained from catalyst with 7-nm TiO2 crystal.• Secondary par cle size has a strong effect on the catalytic activity of TiO2 for TCE photo-oxidation. For aggregates smaller than 600 nm, the TCE conversion exhibits a rapid linear decline with increasing secondary particle size.
Size versus Effect Relationship Observed by Authors?:
Yes
Mathematical Relationship Identified in Paper (if applicable):
None
Author‐Identified 'Bright Line' Particle Size (diameter) Threshold (nm) ‐ List if applicable:
7 - 11
Notes on 'Bright Line' Threshold: • For particles < 11 nm, the surface structure of the atom ensembles can deviate from that of a bulk crystal, could result in a sig. difference in the number and types of cataly c sites present in nanocrystals and bulk crystals.• A
blue shift in the TiO2 band gap occurred for crystals < 11 nm; there are fewer photons with the required energy to generate the e¡/hC pairs needed for the reaction. The modified electronic band-gap structure of the TiO2 could increase or decrease the photocatalytic activity depending on the reduction–oxidation potential of the adsorbed,
organic compounds.• TCE degrada on over TiO2 catalyst exhibits a maximum at a primary par cle size of 7 nm. For TiO2 catalysts with primary particle or crystal size larger than 7 nm, the smaller crystals offer a larger surface area and exhibit higher TCE degradation. The subsequent drop in catalyst activity for crystal sizes smaller than 7 nm may be due to changes in the structural and electronic properties of the nanometer crystals.
ARCADIS Discussion of Results None
Nature of Size versus Effect Relationship (if applicable)
The rate of oxidation increased as the size of the TiO2 nanoparticles decreased from 27 to 7 nm and then decreased below 7 nm.
Page B-87 of 177
Appendix B: Copy of Database
Physico‐chemical Property Investigated:
Crystalline structure (structure)
Priority of Property: High
Relevant for A1 Project?: Yes
Type of nanomaterial (eg, nanometal, nanometal oxide):
Nanometal
Particle Functionalization or Capping Agent (if applicable):
None
List Study Objective(s) Relevant to Investigated Physicochemical Property:
• This study investigates the phase transformation of zirconia samples with varying grain sizes and yytria content using dilatometry and high temperature differential scanning calorimetry (HTDSC).
Mayo et al. (2003)
Specific Details on Tested Nanomaterial(s)
• Zirconia (Zr) powder
Details on Preparation Method of Nanomaterial(s):
• Nanocrystalline zirconia powders were synthesized by chemical co-precipitation from the reaction of a zirconium oxychloride salt solu on (containing added dissolved yytria, as needed) with ammonia.• Zirconia powders of the
composition ZrO2 - xmol% Y2O3 were produced, with x = 0.05, 1 and 1.5. These will hereafter be referred to as 0YSZ, 0.5YSZ, 1YSZ and 1.5YSZ.• To create samples at varying crystallite sizes, powders were preheated to 1200
deg C for varying lengths of time and cooled to room temperature prior to testing.
Details on Tests Examining Physicochemical Property:
• The heat-treated powders were heated in a Netsch 404 high temperature differential scanning calorimeter (HTDSC) at 40 deg C/min to a temperature not exceeding the prior heat treatment temperature of 1200 deg C, then cooled at 10 deg C/min. The monoclinic to tetragonal phase transformation was observed as an endothermic event
on hea ng.• Conversely, the tetragonal to monoclinic phase transforma on was observed as an exothermic event on cooling. For both the forward and reverse transformations, the HTDSC onset temperature associated with the
phase transforma on.• Crystallite sizes were measured by field emission scanning electron microscopy (FESEM) using a Leo 1530 FE-SEM. Crystallite sizes measured after the high temperature pre-treatment but before the test began were taken as the crystallite size for the monoclinic to tetragonal transformation on heating; crystallite sizes measured after cooling in HTDSC was complete were assigned to the reverse tetragonal to monoclinic transformation.
Individual Particle Diameters Tested (nm):
No data
Solution characteristics (pH, cosolvents or other additives, sonication, ionic strength)
Not applicable
Min Diameter Tested (nm): ca. 100
Max Diameter Tested (nm): ca. 400
Specific Surface Area (SSA) (m2/g): No data
Bulk materials tested (≥ 1000 nm): No
Information on Analytical Methods Used to Determine Particle Size:
The particle diameter was determined by both BET surface area analysis and x-ray line broadening using the Scherrer relation.
List of Relevant Findings: • The onset temperature for the phase transformation remained virtually identical on heating but varied systematically with grain size on cooling. An inverse linear relationship between the onset temperature for the tetragonal to monoclinic transformation (cooling experiment) and the inverse of the particle diameter was observed for all 4 powders tested (all samples exhibit the lower transformation temperatures - equivalent to
increasing tetragonal phase stability - with smaller par cle sizes).• The most plausible reason for this phenomenon is a lower surface energy of the tetragonal phase compared to the monoclinic phase.• In zirconia,
the tetragonal phase appeared to be stabilized even down to room temperature in sufficiently fine powder crystallites.• A surface area contribu on cannot only predict the observed inverse linear rela onship between
grain/particle size and transformation temperature - but the values of many relevant thermodynamic components as well.
Page B-88 of 177
Appendix B: Copy of DatabaseSize versus Effect Relationship Observed by Authors?:
Yes
Mathematical Relationship Identified in Paper (if applicable):
T(transforma on) = (deltaH(vol) + ((10*deltaH(surf)/D*) / (deltaS(vol) + (10*deltaS(surf)/D*))where:D* = grain size at which a material will spontaneously transform from the tetragonal to the monoclinic phasedeltaH(vol) =
enthalpy for an infinitely large par cledeltaH(surf) = the difference in surface enthalpy between two phases (in J/m^2)deltaS(surf) = the surface entropy (or the temperature-dependent component of the surface energy)
Author‐Identified 'Bright Line' Particle Size (diameter) Threshold (nm) ‐ List if applicable:
None
Notes on 'Bright Line' Threshold: A linear decrease in the onset temperature of tetragonal to monoclinic phase transformation (cooling experiment) with decreasing particle diameter was observed. A 'bright line' threshold cannot be inferred from this study.
ARCADIS Discussion of Results Examined phase change a er hea ng, at temperatures not represena ve of environmental condi ons. Par cle diameters tested were not mentioned in the paper. The range of tested particle diameters was estimated from Figure 4 of the paper.
Nature of Size versus Effect Relationship (if applicable)
The onset temperature for the tetragonal to monoclinic phase transformation decreased with decreasing particle size.The data in both powder and pellet cases exhibit an inverse linear rela onship between grain/crystallite size
and transformation temperature, as predicted in a simple thermodynamic model in which surface (or interfacial) energy terms are added to the overall free energy of the system.
Physico‐chemical Property Investigated:
Crystalline structure (structure)
Priority of Property: High
Relevant for A1 Project?: Yes
Type of nanomaterial (eg, nanometal, nanometal oxide):
Nanometal
Particle Functionalization or Capping Agent (if applicable):
None
List Study Objective(s) Relevant to Investigated Physicochemical Property:
• This study investigates the phase transformation of zirconia samples with varying grain sizes and yytria content using dilatometry.
Mayo et al. (2003)
Specific Details on Tested Nanomaterial(s)
• Zirconia (Zr) pellets
Details on Preparation Method of Nanomaterial(s):
• Nanocrystalline zirconia powders were synthesized by chemical co-precipitation from the reaction of a zirconium oxychloride salt solu on (containing added dissolved yytria, as needed) with ammonia.• Zirconia powders of the
composition ZrO2 - xmol% Y2O3 were produced, with x = 0.05, 1 and 1.5. These will hereafter be referred to as 0YSZ, 0.5YSZ, 1YSZ and 1.5YSZ.• The as-produced (but not heat-treated) 0.5YSZ, 1.0YSZ and 1.5YSZ nanocrystalline
powders were uniaxially pressed to 1.12 Gpa and then sintered for 5 hours at 1040, 1060 and 1125 deg C for the three compositions respectively.
Details on Tests Examining Physicochemical Property:
• The tetragonal to monoclinic phase transformation was observed as an exothermic event on cooling; the HTDSC onset temperature associated with the phase transforma on.• Each pellet was first preheated in the dilatometer
at 1200 deg C for varying lengths of time in the tetragonal phase field to achieve the grain size of interest. Samples were then cooled in situ at a rate of 10 deg C/min. The sudden linear expansion event experienced on cooling was taken to be the tetragonal to monoclinic phase transformation, a dilatant transformation. The grain size associated with the transformation on cooling was taken to be the FESEM-measured mean linear intercept grain sizes of the polished pellet surface after cooling was complete, multiplied by a factor of 1.56 to yield a true grain diameter.
Individual Particle Diameters Tested (nm):
No data
Solution characteristics (pH, cosolvents or other additives, sonication, ionic strength)
Not applicable
Page B-89 of 177
Appendix B: Copy of DatabaseMin Diameter Tested (nm): 120
Max Diameter Tested (nm): 400
Specific Surface Area (SSA) (m2/g): No data
Bulk materials tested (≥ 1000 nm): No
Information on Analytical Methods Used to Determine Particle Size:
The particle diameter was determined by both BET surface area analysis and x-ray line broadening using the Scherrer relation.
List of Relevant Findings: • An inverse linear relationship between the onset temperature for the tetragonal to monoclinic transformation (cooling experiment) and the inverse of the grain size was observed for all 3 pellets tested (all samples exhibit the lower transformation temperatures - equivalent to increasing tetragonal phase stability - with smaller grain
sizes).• The most plausible reason for this phenomenon is a lower surface energy of the tetragonal phase compared to the monoclinic phase.• A surface area contribu on cannot only predict the observed inverse linear
relationship between grain/particle size and transformation temperature - but the values of many relevant thermodynamic components as well.
Size versus Effect Relationship Observed by Authors?:
Yes
Mathematical Relationship Identified in Paper (if applicable):
None
Author‐Identified 'Bright Line' Particle Size (diameter) Threshold (nm) ‐ List if applicable:
None
Notes on 'Bright Line' Threshold: A linear decrease in the onset temperature of tetragonal to monoclinic phase transformation (cooling experiment) with decreasing grain size of the pellets; therefore, a 'bright line' threshold cannot be inferred from this study.
ARCADIS Discussion of Results The individual grain sizes tested were not mentioned in the paper. Rather, the range of tested particle diameters is stated in the paper.
Nature of Size versus Effect Relationship (if applicable)
The onset temperature for the tetragonal to monoclinic phase transformation decreased with decreasing grain size.
Physico‐chemical Property Investigated:
Reactivity
Priority of Property: High
Relevant for A1 Project?: Yes
Type of nanomaterial (eg, nanometal, nanometal oxide):
Supported nanometal
Particle Functionalization or Capping Agent (if applicable):
None
List Study Objective(s) Relevant to Investigated Physicochemical Property:
• To investigate the particle size effect on the formation of OH adlayer, the CO bulk oxidation, and the oxygen reduction reaction (ORR) on Pt nanoparticles in perchloric acid electrolyte.
Mayrhofer et al. (2005)
Specific Details on Tested Nanomaterial(s)
• Carbon-supported Platinum (Pt) catalysts
Details on Preparation Method of Nanomaterial(s):
• Four different Pt high surface area catalysts were used in this study. Three samples, supplied by TKK, were carbon- supported Pt nanopar cles with mean diameters of 1-1.5 nm, 2-3 nm, and 5 nm, respec vely.• The fourth
sample, consisting of a nanostructured Pt film supported on crystalline organic whiskers, was supplied by 3M.
Details on Tests Examining Physicochemical Property:
• Electrochemical measurements were conducted in a thermostatted standard three-compartment electrochemical cell, using a ring-disk electrode setup with a bipoten ostat and rota on control.• A saturated
Calomel electrode (SCE), separated by an electrolytic bridge from the main cell compartment, was used for every experiment, however, all poten als are given with respect to the reversible hydrogen electrode (RHE).• To
minimize the error from the potential reading especially for the ORR, the hydrogen oxidation/evolution reaction was measured shortly before or after the ORR at 333 K or the CO-bulk oxidation at 298 K to calibrate the RHE relative to the Calomel electrode. A Pt mesh was used as a counter electrode. The electrolyte was prepared using pyrolitically triply distilled water and concentrated HClO4.
Individual Particle Diameters Tested (nm):
1, 2, 5, 30
Solution characteristics (pH, cosolvents or other additives, sonication, ionic strength)
• pH: No data• Cosolvents or other addi ves: None• Sonica on: Yes• Ionic strength (conduc vity): No data
Page B-90 of 177
Appendix B: Copy of DatabaseMin Diameter Tested (nm): 1
Max Diameter Tested (nm): 30
Specific Surface Area (SSA) (m2/g): No data
Bulk materials tested (≥ 1000 nm): No
Information on Analytical Methods Used to Determine Particle Size:
No data
List of Relevant Findings: • The kinetic region for the CO oxidation is extended to more negative potentials for smaller particles, with 30 nm revealing almost reversible behavior and becoming inactive already at the ignition potential in contrast to 1 nm, which is fairly active till about 0.8-0.82 V. The trend in the CO bulk activity can be unambiguously determined over the whole potential region of interest, which leads to a reaction order of 30 nm < 5 nm < 1 nm (the specific activity
of carbon-supported Pt catalysts for CO oxida on decreases with increasing par cle size).• The specific ac vity of carbon-supported Pt catalysts for the oxygen reduction reaction increases with increasing particle size.
Size versus Effect Relationship Observed by Authors?:
Yes
Mathematical Relationship Identified in Paper (if applicable):
None
Author‐Identified 'Bright Line' Particle Size (diameter) Threshold (nm) ‐ List if applicable:
None
Notes on 'Bright Line' Threshold: Although not reported in the study, a particle diameter between 2 and 5 nm appears to be critical for the specific activity of carbon-supported Pt catalysts for the CO oxidation reaction. Below a particle diameter of 5 the specific activity for this reaction sharply increases. A similar critical particle diameter between 5 and 30 nm for the ORR can be inferred from the data. Above a particle diameter of 5 nm, the rate of increase of the specific activity decreases as compared to the range 1 - 5 nm.
ARCADIS Discussion of Results None
Nature of Size versus Effect Relationship (if applicable)
Specific activity of carbon-supported Pt catalysts increases with decreasing particle size for the CO oxidation reaction and decreases with decreasing particle size for ORR.
Physico‐chemical Property Investigated:
Water solubility
Priority of Property: High
Relevant for A1 Project?: Yes
Type of nanomaterial (eg, nanometal, nanometal oxide):
Nanometal
Particle Functionalization or Capping Agent (if applicable):
None
List Study Objective(s) Relevant to Investigated Physicochemical Property:
• The relationship between particle size and dissolution rate was studied. Possible size selective etching was studied by investigating the rate of dissolution of ZnO sols of various sizes. The etch rate was defined as the initial rate of the decrease of the ZnO absorption with time.
Meulenkamp (1998)
Specific Details on Tested Nanomaterial(s)
• Zinc oxide (ZnO)
Details on Preparation Method of Nanomaterial(s):
• For preparation of ZnO nanoparticles, 1.10 g (5 mmol) Zn(Ac)2.2H2O was dissolved in 50 mL boiling absolute ethanol and cooled to 0 deg C. Then, 0.29 g (7 mmol) LiOH.H2O was dissolved in 50 mL ethanol at room temperature, cooled to 0 deg C and slowly added to the Zn(II) solution under vigorous stirring. The reaction mixture
was stored at 4 deg C.• The desired par cle size (2.5 nm ≤ size ≤ 7.0 nm) was obtained by aging the ZnO sol at 4 deg C or at room temperature.
Details on Tests Examining Physicochemical Property:
• Op cal absorp on spectra were recorded on a Perkin-Elmer Lambda 19 spectrophotometer.• Etch rate experiments were carried out using a thermostatted cuvette holder. The reactants were mixed inside the
thermosta ed cuve e.• The ZnO concentra on in the reac on mixture was typically 2.5 mM at the start of the experiment.
Individual Particle Diameters Tested (nm):
3.15, 4.3
Solution characteristics (pH, cosolvents or other additives, sonication, ionic strength)
• pH: In one experiment, the pH was lowered by addi on of glacial ace c acid (HAc).• Cosolvents or other addi ves: ethanol, lithium hydroxide• Sonica on: Not performed• Ionic strength (conduc vity): No data
Page B-91 of 177
Appendix B: Copy of DatabaseMin Diameter Tested (nm): 3.15
Max Diameter Tested (nm): 4.3
Specific Surface Area (SSA) (m2/g): No data
Bulk materials tested (≥ 1000 nm): No
Information on Analytical Methods Used to Determine Particle Size:
No data
List of Relevant Findings: • The etch rate depends markedly on the particle size; the rate found for 4.3 nm particles was about 5 times smaller than that for 3.0 nm par cles.• The size dependence of the etch rate could only be studied properly using
solutions derived from a single synthesis run, after which the size was varied by aging. Although the size dependencies of the etch rates of solutions produced in several synthesis runs are in agreement, the absolute
values of the etch rates at a par cular par cle size could differ by a factor of about three.• It is conceivable that during aging not only the particle size changes, but also other parameters which can affect the etch rate, such as the pH. Therefore, an additional experiment was carried out. Approximately equal amounts of ZnO with about 3.15 and 4.3 nm size were mixed, with lambda1/2 values of 342 and 358 nm, respectively. The sols were derived from the same synthesis run. It was found that the smaller particles react much faster; about 90% of the 3.15 nm ZnO has reacted, while only 15% of the 4.3 nm particles has dissolved. Thus, the observed size dependence is not due to variations of parameters other than the ZnO size and it is possible to selectively etch the smaller particles.
Size versus Effect Relationship Observed by Authors?:
Yes
Mathematical Relationship Identified in Paper (if applicable):
The relationship between the volume-weighted size D (nm) an lambda1/2 (nm), which is defined as the wavelength at which the absorption was 50% of that at the excitonic peak (or shoulder), valid for 2.5 nm < D < 6.5 nm, is: 1240/(lambda1/2 = 3.556 + 799.9/D^2 - 22.64/D (citing: Meulenkamp, E.A., J. Phys. Chem. 1998, 102, 5566).
Author‐Identified 'Bright Line' Particle Size (diameter) Threshold (nm) ‐ List if applicable:
None
Notes on 'Bright Line' Threshold: The rate of etching (dissolution) clearly increased with decreasing particle size; however, a 'bright line' particle diameter threshold cannot be inferred from these results.
ARCADIS Discussion of Results The actual initial particle sizes was not mentioned in the paper (sizes reported in the database were taken from Fig. 4). It is difficult to conclude there was a size effect when only two sizes were tested. Hard to say there was a size effect when only two sizes were tested.
Nature of Size versus Effect Relationship (if applicable)
The rate of etching (dissolution) of ZnO increased markedly with decreasing particle size.
Physico‐chemical Property Investigated:
Reactivity
Priority of Property: High
Relevant for A1 Project?: Yes
Type of nanomaterial (eg, nanometal, nanometal oxide):
Supported nanometal
Particle Functionalization or Capping Agent (if applicable):
None
List Study Objective(s) Relevant to Investigated Physicochemical Property:
• The reactivity of the Au particles toward oxidation was evaluated by XANES (X-ray Absorption Near Edge Structure) and EXAFS (Extended X-ray absorption fine structure) after exposure to air at room temperature and above.
Miller et al. (2006)
Specific Details on Tested Nanomaterial(s)
• Gold (Au)
Details on Preparation Method of Nanomaterial(s):
• Au catalysts were prepared by adding HAuCl4 to alumina, silica, titania, ceria, zirconia and niobia by several methods.
Details on Tests Examining Physicochemical Property:
• The ability of gold nanopar cles to react with oxygen (in air) was examined.• Either silicon dioxide (SiO2),
aluminum trioxide (Al2O3) or titanium dioxide (TiO2) was used as a support for the catalyst.
Individual Particle Diameters Tested (nm):
No data
Solution characteristics (pH, cosolvents or other additives, sonication, ionic strength)
• pH: Au catalysts were prepared under a range of pH: < 1 to 8• Cosolvents or other addi ves: None• Sonica on: Not performed• Ionic strength (conduc vity): No data
Page B-92 of 177
Appendix B: Copy of DatabaseMin Diameter Tested (nm): 2
Max Diameter Tested (nm): 5
Specific Surface Area (SSA) (m2/g): No data
Bulk materials tested (≥ 1000 nm): No data
Information on Analytical Methods Used to Determine Particle Size:
No data
List of Relevant Findings: • Au particles smaller than about 3 nm are also reactive to air, leading to oxidation of about 10% of the Au atoms, whereas larger particles are not oxidized. It is suggested that the high oxidation activity of Au nanoparticles is due to reduction of oxidized Au atoms by CO, forming CO2.
Size versus Effect Relationship Observed by Authors?:
Yes
Mathematical Relationship Identified in Paper (if applicable):
None
Author‐Identified 'Bright Line' Particle Size (diameter) Threshold (nm) ‐ List if applicable:
3
Notes on 'Bright Line' Threshold: • Au particles smaller than about 3 nm are also reactive to air, leading to oxidation of about 10% of the Au atoms, whereas larger particles are not oxidized.
ARCADIS Discussion of Results None
Nature of Size versus Effect Relationship (if applicable)
Au NPs smaller than 3 nm can react with air while Au NPs greate than 3 nm cannot.
Physico‐chemical Property Investigated:
Crystalline structure (structure)
Priority of Property: High
Relevant for A1 Project?: Yes
Type of nanomaterial (eg, nanometal, nanometal oxide):
Nanometal oxide
Particle Functionalization or Capping Agent (if applicable):
None
List Study Objective(s) Relevant to Investigated Physicochemical Property:
• To investigate the lattice parameters of high surface area ceria nanoparticles, how they relate to size and to discuss these results in the light of the role played by surface tension effects.
Morris et al. (2006)
Specific Details on Tested Nanomaterial(s)
• Ceria (CeO2)
Details on Preparation Method of Nanomaterial(s):
• High surface area ceria nanopar cles have been prepared using a citrate sol gel precipita on method.• 25 mL of ammonium hydroxide is slowly added to a 1 M solution of Ce(NO3)3.6H2O to precipitate out the CeO2 under constant stirring. This results in a thick yellow/ white emulsion, which is left to further stir for 30 min before being vacuum dried in a Buchner funnel. The brownish/ purple precipitate is dried at 60 deg C for 24 h. The preparation of the acid-precipitated gel samples require 3g of the above bulk ceria powder to be weighed out into a sample vial. 3 mL of 70% citric acid was then added to the bulk ceria. This mixture was allowed stir for 12 hours. This was repeated for 3 mL nitric acid and 3 mL oxalic acid, using 3g of bulk ceria powder for each, for comparative
purposes. A er s rring, the acid pep sed emulsions are dried at 80°C for 12 h.• The precipita on samples are calcined at different temperatures up to 1000 deg C with dwell times of 2 h.
Details on Tests Examining Physicochemical Property:
• Powder x-ray diffraction (PXRD) profiles were recorded on a Philips 3710 PWD diffractometer (θ–2θ mode), equipped with a Cu Kα radia on source and standard scin lla on detector.• Samples were degassed at 200 deg C
for 24 h using ultra high grade 5.0 nitrogen prior to each measurement. TEM was used for structural characterization. Each powder was dispersed onto holey carbon support grids and examined at 200kV in a JEOL 2000FX.
Individual Particle Diameters Tested (nm):
25.7, 29.8, 54.9
Solution characteristics (pH, cosolvents or other additives, sonication, ionic strength)
Not applicable
Page B-93 of 177
Appendix B: Copy of DatabaseMin Diameter Tested (nm): 29.8
Max Diameter Tested (nm): 54.9
Specific Surface Area (SSA) (m2/g): No data
Bulk materials tested (≥ 1000 nm): No
Information on Analytical Methods Used to Determine Particle Size:
Powder x-ray diffraction (PXRD) profiles were recorded on a Philips 3710 PWD diffractometer (θ–2θ mode), equipped with a Cu Kα radiation source and standard scintillation detector. Particle sizes were determined from x-ray results using the Scherrer equation. Surface areas were measured using Nitrogen adsorption/desorption analysis on a Micrometrics Gemini 2375 instrument at 77 K.
List of Relevant Findings: • Many calcination temperatures were used, including: 350, 400, 450, 550, 600, 650, 700, 750, 800, 850 and 950 deg C. Par cle size informa on is only available for 350, 650 and 950 deg C: 29.8, 25.7 and 54.9 nm, respec vely.•
As observed by PXRD, strong lattice contractions (not expansions) were measured with decreasing particle size, strongly indicating surface tension plays a major role in determining the lattice parameter.
Size versus Effect Relationship Observed by Authors?:
Yes
Mathematical Relationship Identified in Paper (if applicable):
None
Author‐Identified 'Bright Line' Particle Size (diameter) Threshold (nm) ‐ List if applicable:
None
Notes on 'Bright Line' Threshold: Lattice contraction occurred as a function of decreasing particle size in a linear relationship. Therefore, a 'bright line' particle size threshold cannot be determined from these data.
ARCADIS Discussion of Results None
Nature of Size versus Effect Relationship (if applicable)
Lattice parameters decreased with decreasing particle size below a size of 54.9 nm.
Physico‐chemical Property Investigated:
Reactivity
Priority of Property: High
Relevant for A1 Project?: Yes
Type of nanomaterial (eg, nanometal, nanometal oxide):
Nanometal
Particle Functionalization or Capping Agent (if applicable):
None
List Study Objective(s) Relevant to Investigated Physicochemical Property:
• The influence of the size of Pt NPs on the ORR in different electrolyte solutions with varying anionic adsorption strength was examined.
Nesselberger et al. (2011)
Specific Details on Tested Nanomaterial(s)
• Pla num (Pt)• Four different HAS carbon supported catalysts provided by TKK (Tokyo, Japan), a Pt-black catalyst provided by Umicore AG, and a polycrystalline platinum sample (5 mm diameter) were investigated. The carbon support of the catalysts is ide
Page B-94 of 177
Appendix B: Copy of DatabaseDetails on Preparation Method of Nanomaterial(s):
• Carbon-supported Pt catalysts were purchased; no information is available on their preparation.
Details on Tests Examining Physicochemical Property:
• For the ORR measurements, a suspension containing the catalyst was pipetted onto a polished glassy carbon substrate and dried under N2 gas. Measurements were conducted in a three-compartment electrochemical Teflon cell, using a rotating disk electrode (RDE) setup and a home-built potentiostat with analog compensation of the
solu on resistance.• A saturated Calomel electrode and a graphite rod were used as reference and counter electrodes, respectively. All potentials in the paper are expressed with respect to the reversible hydrogen electrode (RHE) potential, which was experimentally determined for each measurement series. Three different electrolytes were studied: two acid electrolytes and one alkaline electrolyte. The electrolyte was prepared using Millipore Milli
Q water, KOH pellets, conc. H2SO4, and conc. HClO4.• The specific ac vity of the ORR is calculated from the positive going RDE polarization curves recorded at a scan rate of 50 mV/s; the RDE polarization curves were corrected by subtracting background surface oxidation and capacitive processes and the so-called IR-drop was
compensated for in the refined methodology.• The mass ac vity was calculated based on the specific ac vity and the ECSA, averaged from at least eight values with two different suspensions, each determined via CO stripping experiments using a multiarray electrode.
Solution characteristics (pH, cosolvents or other additives, sonication, ionic strength)
"• pH: No data• Cosolvents or other addi ves: None• Sonica on: For electrochemical measurements, the catalyst powders were ultrasonically dispersed in ultrapure water to a concentration of 0.14 mgPt/cm3 for at least
10 min. Before each measurement the catalyst suspension was again put into the ultrasonic bath for 3 min.• Ionic strength (conductivity): No data"
Min Diameter Tested (nm): 1
Max Diameter Tested (nm): 5000000
Specific Surface Area (SSA) (m2/g): • HSA carbon supported (TKK): 46, 76, 108, 128• Pt-black: 13• Polycrystalline Pt sample: N/A
Bulk materials tested (≥ 1000 nm): Yes
Information on Analytical Methods Used to Determine Particle Size:
Transmission electron microscopy (TEM) and X-Ray Diffraction were used to characterize the particles.
List of Relevant Findings: • The difference in specific activity between the four HSA carbon supported catalysts (1-5 nm) is comparatively small and lies within the experimental error of the measurements, an observation which is valid for all three different electrolytes despite the fact that the particle size effects are typically expected to occur in the low
nanometer region (ca. < 5 nm).• The overall par cle size effect is be er characterized by a rapid decrease in the SA of the ORR going from polycrystalline Pt, to unsupported Pt black particles, and HSA carbon supported Pt NPs (i.e., SA(Ptpoly) > SA(Pt30 nm) > SA(HSAC), rather than the less significant difference between the individual HSA
catalysts (par cle size ranging from 1 to 5 nm).• Furthermore, the MA of the catalysts does not exhibit a maximum at a specific par cle size/dispersion but instead con nues to increase with the ECSA.• These trends are
independent of the suppor ng electrolyte despite its strong influence on the ac vity of single crystal electrodes.• For particle sizes below 5 nm drastic changes in the surface structure appear.
Size versus Effect Relationship Observed by Authors?:
Yes
Mathematical Relationship Identified in Paper (if applicable):
None
Author‐Identified 'Bright Line' Particle Size (diameter) Threshold (nm) ‐ List if applicable:
None
Notes on 'Bright Line' Threshold: The decrease in specific activity was rapid from an electrochemical surface area of ca. 0 to ca. 40 m^2/g followed by no significant changes in ECSA from ca. 40 to ca. 130 m^2/g. No 'bright line' threshold was identified.
ARCADIS Discussion of Results None
Nature of Size versus Effect Relationship (if applicable)
A decrease in the specific activity of the ORR occurred as particle size decreased from bulk Pt to nano Pt. Differences in the ORR among 1-5 nm nano Pt were insignificant.
Page B-95 of 177
Appendix B: Copy of Database
Physico‐chemical Property Investigated:
Water solubility
Priority of Property: High
Relevant for A1 Project?: Yes
Type of nanomaterial (eg, nanometal, nanometal oxide):
Nanometal
Particle Functionalization or Capping Agent (if applicable):
None
List Study Objective(s) Relevant to Investigated Physicochemical Property:
• Determine the bioaccessability of particulate matter collected in airborne urban samples in buffered aqueous solution.
Niu et al. (2010)
Specific Details on Tested Nanomaterial(s)
• Fractions of two urban airborne particulate matter (PM) samples collected in Ottawa (in different years) containing the following elements: Vanadium (V), Manganese (Mn), Iron (Fe), Nickel (Ni), Copper (Cu), Zinc (Zn), Selenium (Se), Strontium (Sr), Moly
Details on Preparation Method of Nanomaterial(s):
Not applicable
Details on Tests Examining Physicochemical Property:
• Size-selective particle sampling was performed using a micro-orifice uniform deposit impactor, and element concentrations were determined in each different size fraction (10,000, 5,600, 3,200, 1,800, 1,000, 560, 320, 180,
97, and 57 nm) by induc vely coupled plasma-mass spectroscopy.• Element bioaccessibility in Environmental Health Center (EHC) airborne particulate samples (PM-bound nano and fine elements) was assessed using a “water soluble” extraction buffered at pH 7 to simulate the neutral lung environment which was then compared with the
total element diges on results• Mul -element analysis was performed using induc vely coupled plasma-mass spectroscopy (ICP-MS) for the digested samples.
Solution characteristics (pH, cosolvents or other additives, sonication, ionic strength)
• pH: The soluble metal fraction was extracted under clean laboratory conditions using 0.01 M ammonium acetate (AA) at pH 7• Cosolvents or other addi ves: 0.01 M ammonium acetate• Sonica on: Not performed•
Ionic strength (conductivity): No data
Min Diameter Tested (nm): < 57
Max Diameter Tested (nm): < 10,000
Specific Surface Area (SSA) (m2/g): No data
Bulk materials tested (≥ 1000 nm): Yes
Information on Analytical Methods Used to Determine Particle Size:
A micro-orifice uniform deposit impactor with 10 nominal cut sizes: 10,000, 5,600, 3,200, 1,800, 1,000, 560, 320, 180, 97, and 57 nm was used to determine fractions of nano and fine metal bound PM.
List of Relevant Findings: • Element bioaccessibility values increase with decreasing particle size. It would appear that bioaccessibility is both par cle size- and element-dependent• The general trend of increasing element bioaccessibility with decreasing
particle size is observed indicating that certain elements have the highest bioaccessibility in the nano-size range of EHC-2K urban air particles. Some elements show a steep increase as particle size decreases from fine to nano (e.g., V, Fe, Mo, Sn, and Pb), whereas others show gentle increase or little change with size (e.g., Mn, Cu, and Zn).
Page B-96 of 177
Appendix B: Copy of DatabaseSize versus Effect Relationship Observed by Authors?:
Yes
Mathematical Relationship Identified in Paper (if applicable):
None
Author‐Identified 'Bright Line' Particle Size (diameter) Threshold (nm) ‐ List if applicable:
None
Notes on 'Bright Line' Threshold: The general concentration trend was consistent for elements in EHC samples collected during different years. However, the comparison between EHC-93 and EHC-2K samples indicated that there were some differences in total element concentrations and/or particle size distributions for certain elements, indicating possible source variations during these two sampling periods. Aging-related aggregation or long-range transport processes, which have been generally accepted as the cause of fine particle mass variations, may also partly account for relative elemental concentration changes between different sampling periods. Changes in windblown soil or road dust resuspension may also contribute to such variations.
ARCADIS Discussion of Results None
Nature of Size versus Effect Relationship (if applicable)
The bioaccessibility values increase with decreasing particle size for a given sample.
Physico‐chemical Property Investigated:
Reactivity
Priority of Property: High
Relevant for A1 Project?: Yes
Type of nanomaterial (eg, nanometal, nanometal oxide):
Nanometal
Particle Functionalization or Capping Agent (if applicable):
None
List Study Objective(s) Relevant to Investigated Physicochemical Property:
• To shed new light on the size-dependent oxidation mechanism of Pd nanoparticles on MgO 100 , the authors performed an in situ high-energy x-ray diffraction experiment photon energy of 85 keV on a sample with a Pd particle size gradient from 4 to 24 nm in diameter.
Nolte et al. (2008)
Specific Details on Tested Nanomaterial(s)
• Palladium (Pd) nanoparticles on an MgO (100) substrate
Details on Preparation Method of Nanomaterial(s):
• Two edge-oriented MgO(001) substrates with a size of 5 x10 mm^2 and in-plane orientations (100)-(010) (substrate A) and (110)-(110) (substrate B), respectively, were annealed in air at T=1670 K and then mounted on a sample holder. The substrates were further treated in a UHV preparation chamber by repeated sputtering with 750 eV Ar ions and annealing at 870 K and 10 −5 mbar O2.• Then Pd was deposited by electron beam evapora on at 670 K with a special mask at the evaporator tip, which enabled well-defined cutoff lines in the Pd deposition. By translation of the sample during evaporation, six 1.6 mm wide stripes across both substrates with increasing Pd deposition were produced, referred to as three different deposition areas which are associated with nanoparticle diameters D=4–5 nm (I), D=5–9 nm (II) and D=9–24 nm (III).
Details on Tests Examining Physicochemical Property:
• For the in situ x-ray diffraction experiment, the sample was transferred into a portable UHV compatible oxidation chamber. The high energy x-ray microbeam (85 keV) is focused onto the sample surface by a compound refractive lens which produces an x-ray spot of 25 x 4 um^2 (horizontal x vertical, full width at half maximum) at a focal length of 4.5 m. The incident angle was set close to the critical angle of total external reflection for MgO (0.025°), in order to limit the scattering from the substrate. This angular setting produces a slab like footprint of the x-ray beam on
the sample surface, which is 25 um wide and 9 mm long, enabling simultaneous diffrac on from both substrates.• The x-ray data were recorded with a charge coupled device camera placed 1.07 m downstream of the sample. The direct beam and unwanted powder rings from the beryllium window were suppressed by a beam stop and a special circular mask. By translating the sample along Xs, the different surface areas (I–III) with different Pd nanoparticle
sizes can be interrogated with the x-ray beam.• The in situ oxida on study has been carried out at T=570 K in two oxidation steps, i.e., an exposure of the sample to 0.15–0.3 mbar O2 for several hours and, after the extended x-ray characterization, a further exposure to 56 mbar O2
Individual Particle Diameters Tested (nm):
4.8, 5.6, 11, 24
Solution characteristics (pH, cosolvents or other additives, sonication, ionic strength)
Not applicable
Page B-97 of 177
Appendix B: Copy of DatabaseMin Diameter Tested (nm): 4.8
Max Diameter Tested (nm): 24
Specific Surface Area (SSA) (m2/g): No data
Bulk materials tested (≥ 1000 nm): No
Information on Analytical Methods Used to Determine Particle Size:
To obtain size-dependent information on the particles for the different preparation conditions, the sample was translated in steps of 0.25 mm perpendicular to the beam and diffraction (XRD) images were taken. For the determination of the particle diameter D and height H, line scans were performed on the CCD images through the Pd(111) reflection along the <111> and <001> directions.
List of Relevant Findings: • At 56 mbar, the XRD exhibits three generic features: the MgO (111) reflection (Q=26 nm−1) and the Pd (111) diffraction signal from the Pd nanoparticles (Q=28 nm−1), which shows different widths associated with the different sizes interrogated by the x-ray microbeam. Upon oxidation, a third diffraction peak emerges at (Q=24 nm −1), which can be iden fied as the PdO(101) bulk oxide Bragg reflec on.• A er the second oxida on step at 56 mbar, the bulk oxide PdO(101) peak is more dramatic for small particles: the Pd(111) diffraction signal disappears completely for D=4.8 nm and the PdO(101) signal gets more pronounced. For particles with D=5.6 nm, the Pd(111) Bragg peak gets significantly weakened and broadened, and the PdO(101) Bragg peak grows. For bigger particle diameters, the change in the Pd(111) signal is very small, indicating the passivation of the particles, and a ring like
PdO(101) signal can be observed.• The oxida on at 56 mbar has a drama c effect on par cles with D<5 nm (I), as their signal vanishes completely. Particles with diameters 5 nm to 9 nm (II) undergo continuous shrinkage, whereas the particles with D>9 nm (III) keep their average diameter and height. As can be seen from the profile of the PdO(101) signal, the formation of bulk PdO reflects a size dependence.
Size versus Effect Relationship Observed by Authors?:
Yes
Mathematical Relationship Identified in Paper (if applicable):
None
Author‐Identified 'Bright Line' Particle Size (diameter) Threshold (nm) ‐ List if applicable:
5.6
Notes on 'Bright Line' Threshold: Particles above a diameter of 5.6 nm were incapable of being oxidized.
ARCADIS Discussion of Results None
Nature of Size versus Effect Relationship (if applicable)
Palladium particles were increasingly oxidized to PdO as particle size decreased.
Physico‐chemical Property Investigated:
Crystalline structure (structure)
Priority of Property: High
Relevant for A1 Project?: Yes
Type of nanomaterial (eg, nanometal, nanometal oxide):
Nanometal
Particle Functionalization or Capping Agent (if applicable):
None
List Study Objective(s) Relevant to Investigated Physicochemical Property:
• The correlations between crystal structure, microstructure, and catalytic conversion properties of RuO2 nanopowders were studied.
Nowakowski et al. (2008)
Specific Details on Tested Nanomaterial(s)
• Ruthenium dioxide (RuO2)
Page B-98 of 177
Appendix B: Copy of DatabaseDetails on Preparation Method of Nanomaterial(s):
• A RuO2 precursor solution was prepared by dissolving the RuCl3.xH20 in absolute ethanol. The solution was agitated for 24 h under air by the means of rotating magnet (400 rotations per minute). An acidic solution was obtained with pH = 0.4. After 7 days of ageing in room conditions, a wet gel was formed without any modification
of pH and color.• Well-controlled amounts of NH4OH solu on were added to this gel, in order to reach the following pH: 0.4, 1.5, 2.0, 3.0, and 4.5 (precipitation of Ru(OH)3 started at pH 4.5). As this hydroxide is unstable in presence of oxygen (from air), the precipitation of the RuO2, xH2O phase occurred, which was expected from the
poten al pH diagram data.• The wet gels were exposed to two successive cycles of heat treatment (120 deg C, 1 h; 450 deg C, 2h). Five samples of the resultant anhydrous RuO2 crystallized powder, at five different pHs, were selected for structural, microstructural, and catalytic study. Samples were designated as RuO2-n with n = 1–5, successively for pH = 0.4, 1.5, 2, 3, 4.5. A standard sample was prepared by heating a RuO2 sample (pH = 1.5) at 800 deg C for 10 h, under air. This sample will be noted as RuO2- standard.
Details on Tests Examining Physicochemical Property:
• Morphologies and chemical composition (EDS) of the powder agglomerates were investigated using the scanning electron microscope (SEM) Philips XL30.• For morphologies and crystals sizes/coherence lengths determina on
the transmission electron microscopy (TEM) observations were carried out using the TecnaiG2 microscope, operating at 200 kV, with LaB6 source, equipped with CCD camera.
Individual Particle Diameters Tested (nm):
8, 10.5, 11, 12, 16.5, 250
Solution characteristics (pH, cosolvents or other additives, sonication, ionic strength)
• pH: 0.4, 1.5, 2, 3, 4.5• Cosolvents or other addi ves: ethanol (prepara on)• Sonica on: Not performed• Ionic strength (conductivity): No data
Min Diameter Tested (nm): 8
Max Diameter Tested (nm): 250
Specific Surface Area (SSA) (m2/g): No data
Bulk materials tested (≥ 1000 nm): No
Information on Analytical Methods Used to Determine Particle Size:
Transmission electron microscopy (TEM) observations were carried out using the TecnaiG2 microscope, operating at 200 kV, with LaB6 source, equipped with CCD camera.
List of Relevant Findings: • Values for the lattice parameter (a) were: 0.4521 (8 nm), 0.4518 (10.5), 0.4516 (11 nm), 0.4527 (12 nm), 0.4519 (16.5 nm) and 0.44904 (250 nm).• Values for the la ce parameter (c) were: 0.3111 (8 nm), 0.3105 (10.5 nm),
0.3113 (11 nm), 0.3111 (12 nm), 0.3116 (16.5 nm) and 0.31040 (250 nm).• In the RuO2-n series, the cell parameter a is close to a 0.452 nm while this parameter is significantly smaller for standard RuO2 sample (a = 0.449 nm). Taking into account the experimental errors, the difference between these values is quite significant.
Size versus Effect Relationship Observed by Authors?:
Yes
Mathematical Relationship Identified in Paper (if applicable):
None
Author‐Identified 'Bright Line' Particle Size (diameter) Threshold (nm) ‐ List if applicable:
None
Notes on 'Bright Line' Threshold: The lattice parameter (a) decreased with increasing particle size from 8 to 250 nm; however, a 'bright line' particle size threshold cannot be determined from these data.
ARCADIS Discussion of Results None
Nature of Size versus Effect Relationship (if applicable)
The lattice parameter (a) increased with decreasing particle size from 250 to 8 nm while the lattice parameter (c) remained constant over the this size range.
Page B-99 of 177
Appendix B: Copy of Database
Physico‐chemical Property Investigated:
Reactivity
Priority of Property: High
Relevant for A1 Project?: Yes
Type of nanomaterial (eg, nanometal, nanometal oxide):
Nanometal
Particle Functionalization or Capping Agent (if applicable):
None
List Study Objective(s) Relevant to Investigated Physicochemical Property:
• Nanostructured powders of ruthenium dioxide RuO2 were synthesized via a sol gel route involving acidic solu ons with pH varying between 0.4 and 4.5.• The tetragonal crystal cell parameter (a) and cell volumes of
nanostructured samples were characterized and catalytic conversion of methane by these RuO2 nanostructured catalysts was studied as a function of pH, catalytic interaction time, air methane composition, and catalysis
temperature.• The cataly c efficiency defined as FTIR absorp on was also inves gated.
Nowakowski et al. (2008)
Specific Details on Tested Nanomaterial(s)
• Ruthenium dioxide (RuO2)
Details on Preparation Method of Nanomaterial(s):
• A RuO2 precursor solution was prepared by dissolving the RuCl3.xH20 in absolute ethanol. The solution was agitated for 24 h under air by the means of rotating magnet (400 rotations per minute). An acidic solution was obtained with pH = 0.4. After 7 days of ageing in room conditions, a wet gel was formed without any modification
of pH and color.• Well-controlled amounts of NH4OH solu on were added to this gel, in order to reach the following pH: 0.4, 1.5, 2.0, 3.0, and 4.5 (precipitation of Ru(OH)3 started at pH 4.5). As this hydroxide is unstable in presence of oxygen (from air), the precipitation of the RuO2, xH2O phase occurred, which was expected from the
poten al pH diagram data.• The wet gels were exposed to two successive cycles of heat treatment (120 deg C, 1 h; 450 deg C, 2h). Five samples of the resultant anhydrous RuO2 crystallized powder, at five different pHs, were selected for structural, microstructural, and catalytic study. Samples were designated as RuO2-n with n = 1–5, successively for pH = 0.4, 1.5, 2, 3, 4.5. A standard sample was prepared by heating a RuO2 sample (pH = 1.5) at 800 deg C for 10 h, under air. This sample will be noted as RuO2- standard.
Details on Tests Examining Physicochemical Property:
• The catalytic properties of these RuO2 nanopowders in the presence of an air–CH4 mixture were studied by Fourier transform infrared (FTIR) spectroscopy. Powder samples were first exposed to air–CH4 action in a homemade heated cell; then, the emitted gases were analyzed through the FTIR equipment. The catalytic efficiency is relative to the proportion of CO2 (and H2O) resulting from classical reaction: CH4+2O2 ->
CO2+2H2O.• The reactor consisted of a cylindrical cell in which the sample could be subjected to reac ve air–methane flow. The sample temperature was controlled by a thermocouple, and stabilized at a given Tcat-value corresponding to a given catalytic activity. The fixed mass (0.03 g for each test) of RuO2 powder was placed between two porous (ZrO2) separators. The various gas flows, controlled by the flow meters (2500–100 ppm CH4 in air), crossed through the separator, then the sample, and then the second separator, with a fixed slow speed (10 cm^3/min). The cell was heated in a furnace at temperatures ranging between room temperature and 550 deg
C.• For a fixed me t and a given temperature Tcat, the cataly c efficiency was defined as being propor onal to the intensity of CO2 peak I(CO2).
Individual Particle Diameters Tested (nm):
8, 10.5, 11, 12, 16.5
Solution characteristics (pH, cosolvents or other additives, sonication, ionic strength)
• pH: 0.4, 1.5, 2, 3, 4.5• Cosolvents or other addi ves: ethanol (prepara on)• Sonica on: Not performed• Ionic strength (conductivity): No data
Min Diameter Tested (nm): 8
Max Diameter Tested (nm): 16.5
Specific Surface Area (SSA) (m2/g): No data
Bulk materials tested (≥ 1000 nm): No
Information on Analytical Methods Used to Determine Particle Size:
Transmission electron microscopy (TEM) observations were carried out using the TecnaiG2 microscope, operating at 200 kV, with LaB6 source, equipped with CCD camera.
List of Relevant Findings: • In absence of any catalytic matter a maximum intensity of methane vibration bands is observed, while, in presence of RuO2 powder sintered at 350 deg C, the transformation of methane into CO2 and water takes place. No catalytic conversion was significantly observed from the crystallized standard sample obtained after sintering at
800 deg C.• Cataly c efficiency reaches at the smallest crystallite size 8 nm and a pH = 1.5.• Cataly c efficiency decreases in a size-dependent manner: ca. 0.9, ca. 0.8, 0.79, 0.67 and ca. 0.44 a.u. for particle diameters of 8, 10.5, 11, 12 and 16.5 nm, respectively. However, this result cannot be solely attributed to the low particle diameter values: probably, these diameter values should be closely correlated to increasing specific surfaces and porosity in RuO2 powders.
Page B-100 of 177
Appendix B: Copy of DatabaseSize versus Effect Relationship Observed by Authors?:
Yes
Mathematical Relationship Identified in Paper (if applicable):
None
Author‐Identified 'Bright Line' Particle Size (diameter) Threshold (nm) ‐ List if applicable:
None
Notes on 'Bright Line' Threshold: The catalytic efficiency increases with decreasing particle size; however, a 'bright line' particle size threshold cannot be determined from these data.
ARCADIS Discussion of Results None
Nature of Size versus Effect Relationship (if applicable)
Catalytic efficiency increases with decreasing particle size.
Physico‐chemical Property Investigated:
Surface Morphology
Priority of Property: High
Relevant for A1 Project?: Yes
Type of nanomaterial (eg, nanometal, nanometal oxide):
Nanometal alloy
Particle Functionalization or Capping Agent (if applicable):
None
List Study Objective(s) Relevant to Investigated Physicochemical Property:
• The basic dealloyed morphological and compositional structures in dealloyed bimetallic nanoparticles as a function of their size have been identified. We have examined the morphology and composition of dealloyed Pt−Co and Pt−Cu nanopar cle electrocatalysts using microscopic, spectroscopic and surface sensi ve techniques, such as cyclic voltammetry, high-resolution aberration corrected high-angle annular dark field scanning transmission electron microscopy (STEM-HAADF), transmission electron microscopy (TEM), electron energy loss (EEL) spectroscopy, and energy-dispersive X-ray spectroscopy (EDS).
Oezaslan et al. (2012)
Specific Details on Tested Nanomaterial(s)
• Platinum-Cobalt (Pt-Co)
Details on Preparation Method of Nanomaterial(s):
• The synthesis of Pt−Co alloy nanopar cles was conducted via liquid precursor impregna on−freeze-drying method, followed by thermal annealing in a hydrogen/argon atmosphere. All chemicals were used as received. The precursor salt was dissolved in 3 mL of deionized water (18 MOhm at room temperature) and added to the previously weighed amount of Pt/HSAC. The suspension was horn-ultrasonicated and subsequently freeze-dried for a few days. Finally, the dried impregnated powder was annealed at 800 deg C for 7 h in a hydrogen/argon atmosphere.
Details on Tests Examining Physicochemical Property:
• The electrochemical experiments were performed in deaerated 0.1 M HClO4 electrolyte solution at room temperature using a rotating disk electrode (RDE), equipped with a self-made, three compartment glass cell, a rotator and a potentiostat. The following electrodes were employed: Pt gauze as a counter electrode, mercury−mercury sulfate (MMS) electrode as reference electrode and a rota ng disk electrode with a glassy
carbon (GC) disk at 5 mm diameter as working electrode.• Around 5 mg of Pt alloy catalyst powder was suspended by ultrahorn sonication in 3.98 mL of deionized water, 1.00 mL of 2-propanol and 20 μL of 5 wt % Nafion solution. Ten μL of the suspension was pipetted onto the previously polished and cleaned GC electrode and dried at 60 °C for 10 min in air. All potentials were converted and normalized with respect to the reversible hydrogen
electrode (RHE) scale.• Cyclic voltammograms (CVs) were recorded in a voltage range between 0.06 and 1.00 V/RHE in nitrogen-purged 0.1 M HClO4 electrolyte at room temperature. The bimetallic alloy catalysts were electrochemically dealloyed to leach off cobalt or copper from the particle surface. Here, the dealloying protocol involved three voltammetric segments: three slow scans with a scan rate of 100 mV/s, 200 fast scans with 500 mV/s and finally three slow scans with 100 mV/s.
Individual Particle Diameters Tested (nm):
<5, <20, <100
Solution characteristics (pH, cosolvents or other additives, sonication, ionic strength)
• pH: No data• Cosolvents or other addi ves: None• Sonica on: Yes• Ionic strength (conduc vity): No data
Page B-101 of 177
Appendix B: Copy of DatabaseMin Diameter Tested (nm): < 5
Max Diameter Tested (nm): < 100
Specific Surface Area (SSA) (m2/g): No data
Bulk materials tested (≥ 1000 nm): No
Information on Analytical Methods Used to Determine Particle Size:
To examine the size−morphology− composi on rela on,used a combina on of high-resolu on scanning transmission electron microscopy (STEM), transmission electron microscopy (TEM), electro energy loss (EEL) spectroscopy, energy-dispersive X ray spectroscopy (EDS), and surface-sensitive cycling voltammetry.
List of Relevant Findings: • To summarize the analysis in the size regime up to 20 nm,the authors identified a characteristic particle size, referred to as dmultiple cores, of 10−15 nm that separates a single core−shell arrangement from complex mul ple cores−shell structure. The characteris c par cle diameter highlights a dis nct morphological and composi onal structure change of the dealloyed particles. Above dmultiple cores, dealloyed bimetallic particles generally exhibit
dominantly mul ple, less noble metal-rich cores with irregular and/or ellipsoidal shape.• To summarize their observation in the size regime of up to 100-nm size, the authors identified a novel class of particle morphologies characterized by the presence of particles involving surfaces pits and pores of characteristic length scale coexisting
with irregularly shaped mul ple Co/Cu rich cores.• The results suggest the existence of three different size−morphology regimes of dealloyed Pt−Co and Pt−Cu catalysts: With increasing size, a structural regime characterized exclusively by single core−shell structures give way to one involving mul ple-core bimetallic structures. At even larger sizes, surface pits and nanopores coexisting with multiple cores are formed. These size−morphological regimes are separated by two characteris c par cle diameters, d(mul ple cores) (10-15 nm) and d(pores) (30 nm). These values represent the approximate lower particle size boundaries, where Cu-/Co rich multiple cores and nanopores/voids were observed to exist, respectively. They are manifestations of nanoscale effects.
Size versus Effect Relationship Observed by Authors?:
Yes
Mathematical Relationship Identified in Paper (if applicable):
None
Author‐Identified 'Bright Line' Particle Size (diameter) Threshold (nm) ‐ List if applicable:
10-15, 30
Notes on 'Bright Line' Threshold: With increasing size, a structural regime characterized exclusively by single core−shell structures give way to one involving multiple-core bimetallic structures at 10-15 nm (d(multiple cores)). At even larger sizes, surface pits and nanopores coexisting with multiple cores are formed at 30 nm (d(pores)).
ARCADIS Discussion of Results None
Nature of Size versus Effect Relationship (if applicable)
With increasing size, a structural regime characterized exclusively by single core−shell structures give way to one involving multiple-core bimetallic structures. At even larger sizes, surface pits and nanopores coexisting with multiple cores are formed.
Physico‐chemical Property Investigated:
Surface Morphology
Priority of Property: High
Relevant for A1 Project?: Yes
Type of nanomaterial (eg, nanometal, nanometal oxide):
Nanometal alloy
Particle Functionalization or Capping Agent (if applicable):
None
List Study Objective(s) Relevant to Investigated Physicochemical Property:
• The basic dealloyed morphological and compositional structures in dealloyed bimetallic nanoparticles as a function of their size have been identified. We have examined the morphology and composition of dealloyed Pt−Co and Pt−Cu nanopar cle electrocatalysts using microscopic, spectroscopic and surface sensi ve techniques, such as cyclic voltammetry, high-resolution aberration corrected high-angle annular dark field scanning transmission electron microscopy (STEM-HAADF), transmission electron microscopy (TEM), electron energy loss (EEL) spectroscopy, and energy-dispersive X-ray spectroscopy (EDS).
Oezaslan et al. (2012)
Specific Details on Tested Nanomaterial(s)
• Platinum-Copper (Pt-Cu)
Page B-102 of 177
Appendix B: Copy of DatabaseDetails on Preparation Method of Nanomaterial(s):
• The synthesis of Pt−Cu alloy nanopar cles was conducted via liquid precursor impregna on−freeze-drying method, followed by thermal annealing in a hydrogen/argon atmosphere. All chemicals were used as received. The precursor salt was dissolved in 3 mL of deionized water (18 MOhm at room temperature) and added to the previously weighed amount of Pt/HSAC. The suspension was horn-ultrasonicated and subsequently freeze-dried for a few days. Finally, the dried impregnated powder was annealed at 800 deg C for 7 h in a hydrogen/argon atmosphere.
Details on Tests Examining Physicochemical Property:
• The electrochemical experiments were performed in deaerated 0.1 M HClO4 electrolyte solution at room temperature using a rotating disk electrode (RDE), equipped with a self-made, three compartment glass cell, a rotator and a potentiostat. The following electrodes were employed: Pt gauze as a counter electrode, mercury−mercury sulfate (MMS) electrode as reference electrode and a rota ng disk electrode with a glassy
carbon (GC) disk at 5 mm diameter as working electrode.• Around 5 mg of Pt alloy catalyst powder was suspended by ultrahorn sonication in 3.98 mL of deionized water, 1.00 mL of 2-propanol and 20 μL of 5 wt % Nafion solution. Ten μL of the suspension was pipetted onto the previously polished and cleaned GC electrode and dried at 60 deg C for 10 min in air. All potentials were converted and normalized with respect to the reversible hydrogen
electrode (RHE) scale.• Cyclic voltammograms (CVs) were recorded in a voltage range between 0.06 and 1.00 V/RHE in nitrogen-purged 0.1 M HClO4 electrolyte at room temperature. The bimetallic alloy catalysts were electrochemically dealloyed to leach off cobalt or copper from the particle surface. Here, the dealloying protocol involved three voltammetric segments: three slow scans with a scan rate of 100 mV/s, 200 fast scans with 500 mV/s and finally three slow scans with 100 mV/s.
Individual Particle Diameters Tested (nm):
<5, <20, <100
Solution characteristics (pH, cosolvents or other additives, sonication, ionic strength)
• pH: No data• Cosolvents or other addi ves: None• Sonica on: Yes• Ionic strength (conduc vity): No data
Min Diameter Tested (nm): < 5
Max Diameter Tested (nm): < 100
Specific Surface Area (SSA) (m2/g): No data
Bulk materials tested (≥ 1000 nm): No
Information on Analytical Methods Used to Determine Particle Size:
To examine the size−morphology− composi on rela on, we used a combina on of high-resolu on scanning transmission electron microscopy (STEM), transmission electron microscopy (TEM), electro energy loss (EEL) spectroscopy, energy-dispersive X ray spectroscopy (EDS), and surface-sensitive cycling voltammetry.
List of Relevant Findings: • To summarize the analysis in the size regime up to 20 nm, we have identified a characteristic particle size, referred to as dmultiple cores, of 10−15 nm that separates a single core−shell arrangement from complex mul ple cores−shell structure. The characteris c par cle diameter highlights a dis nct morphological and composi onal structure change of the dealloyed particles. Above dmultiple cores, dealloyed bimetallic particles generally exhibit
dominantly mul ple, less noble metal-rich cores with irregular and/or ellipsoidal shape.• To summarize our observation in the size regime of up to 100-nm size, we have uncovered the existence of a novel class of particle morphologies characterized by the presence of particles involving surfaces pits and pores of characteristic length
scale coexis ng with irregularly shaped mul ple Co/Cu rich cores.• The results suggest the existence of three different size−morphology regimes of dealloyed Pt−Co and Pt−Cu catalysts: With increasing size, a structural regime characterized exclusively by single core−shell structures give way to one involving mul ple-core bimetallic structures. At even larger sizes, surface pits and nanopores coexisting with multiple cores are formed. These size−morphological regimes are separated by two characteris c par cle diameters, d(mul ple cores) (10-15 nm) and d(pores) (30 nm). These values represent the approximate lower particle size boundaries, where Cu-/Co rich multiple cores and nanopores/voids were observed to exist, respectively. They are manifestations of nanoscale effects.
Page B-103 of 177
Appendix B: Copy of DatabaseSize versus Effect Relationship Observed by Authors?:
Yes
Mathematical Relationship Identified in Paper (if applicable):
None
Author‐Identified 'Bright Line' Particle Size (diameter) Threshold (nm) ‐ List if applicable:
10-15, 30
Notes on 'Bright Line' Threshold: With increasing size, a structural regime characterized exclusively by single core−shell structures give way to one involving multiple-core bimetallic structures at 10-15 nm (d(multiple cores)). At even larger sizes, surface pits and nanopores coexisting with multiple cores are formed at 30 nm (d(pores)).
ARCADIS Discussion of Results None
Nature of Size versus Effect Relationship (if applicable)
With increasing size, a structural regime characterized exclusively by single core−shell structures give way to one involving multiple-core bimetallic structures. At even larger sizes, surface pits and nanopores coexisting with multiple cores are formed.
Physico‐chemical Property Investigated:
Photocatalytic activity
Priority of Property: High
Relevant for A1 Project?: Yes
Type of nanomaterial (eg, nanometal, nanometal oxide):
Coated nanometal
Particle Functionalization or Capping Agent (if applicable):
• The starting bare CdS NPs having an average diameter of 5.0 nm were prepared by an AOT-reversed-micelle method with a concentration ratio, w(=[[H2O]/[AOT]), of 12. The SiO2 shell thickness was increased, if necessary, by hydrolysis of tetraethyl orthosilicate (TEOS) in the presence of 3-mercaptopropyltrimethoxysilane (MPTS)-
modified CdS nanopar cles.• These SiO2/CdS powders were subjected to size selec ve photo etching using an argon ion laser with wavelengths of 514, 488, and 458 nm. The average size of original CdS nanoparticles became
small with decrease in wavelength of the monochroma c laser light.• For comparison, original SiO2(thin)/CdS particles having smaller CdS core size were prepared in AOT reversed micelles of smaller size (w = 6.3) and were covered with SiO2 shells in a similar way. The CdS core size of thus-obtained core-shell particles was estimated to be 2.4 nm from the exciton peak position at 424 nm on the basis of a theoretical relation between energy gap and
par cle diameter of CdS. These par cles were used without photo etching.• Bare CdS nanopar cles were subjected to size-selective photo etching (458 nm) in toluene solution containing AOT, water and methyl viologen. After the absorption spectrum of the solution became almost unchanged, 2-mercaptoethanol was added to modify the surfaces of the photo etched CdS particles, followed by stirring overnight. Then, methanol was added to destroy the reverse micelles, resulting in the precipitation of 2-mercaptoethanol-modified CdS nanoparticles (RSH/CdS)
Details on Tests Examining Physicochemical Property:
• Photocatalytic methanol dehydrogenation was performed by monochromatic irradiation at 436 nm that was extracted from a high-pressure mercury lamp (Eiko-sha, 400 W) using glass filters. The irradiation intensity was 7.3 mW/cm^2. Each photocatalyst containing 6 mg CdS was suspended in an aqueous solution containing methanol
and irradiated under an argon atmosphere at 298 K with vigorous magne c s rring (ca. 1000 rpm).• The amount of liberated hydrogen (H2) was measured with a gas chromatograph (Shimadzu GC 8A) equipped with a molecular sieve 5A column and a thermal conductivity detector (TCD) using argon as a carrier.
Solution characteristics (pH, cosolvents or other additives, sonication, ionic strength)
• pH: No data• Cosolvents or other addi ves: None• Sonica on: Not performed• Ionic strength (conduc vity): No data
Page B-104 of 177
Appendix B: Copy of DatabaseMin Diameter Tested (nm): 2.4
Max Diameter Tested (nm): >100
Specific Surface Area (SSA) (m2/g): No data
Bulk materials tested (≥ 1000 nm): No data
Information on Analytical Methods Used to Determine Particle Size:
Nanoparticles were sized by photo etching. No information on measurement of particle sizes is provided.
List of Relevant Findings: • The rate of dehydrogenation of methanol was found to be 40, 0.34, 60, 4.5, 4.7, 0.88 and 1.9 nmol/h for silica- coated CdS par cles with sizes of 2.4, 2.8 (with thick SiO2 shell), 2.8, 3.4, 3.7, 5.0 and >100 nm.• The addi on of
rhodium (Rh) to the SiO2/CdS NPs significantly increased the rate of dehydrogena on for all par cle sizes.• The addition of platinum (Pt) to the SiO2/CdS NPs significantly increased the rate of dehydrogenation for all particle
sizes.• The 458-nm photo etched SiO2(thick)/CdS (entry 6) exhibited much smaller R(H2) than that obtained with SiO2-(thin)/CdS (entry 5) even when Rh was photo-deposited suggesting that the increase in the thickness of SiO2
layer prevented the permea on of the reac on substrate, methanol.• In the SiO2/CdS par cles photocataly c activity was little improved by the addition of Pt particles, irrespective of the photo etching of CdS core, while the photo deposited Rh induced the large enhancement as mentioned above. These results indicated that the SiO2 shell prevented the contact between the surfaces of CdS and Pt. Consequently it was suggested that the photo deposition of Rh on SiO2/CdS made the electronic contact between CdS cores and Rh particles and then the photo generated electrons in CdS were effectively scavenged by the loaded metal particles.
Size versus Effect Relationship Observed by Authors?:
Yes
Mathematical Relationship Identified in Paper (if applicable):
None
Author‐Identified 'Bright Line' Particle Size (diameter) Threshold (nm) ‐ List if applicable:
2.8 < Threshold < 3.4
Notes on 'Bright Line' Threshold: The data presented in Table 1 of the paper (excluding the thick shell SiO2/CdS particles), show a clear relationship between CdS core particle size and the rate of methanol dehydrogenation, with a sharp decline from 2.8 particles (maximum reaction rate) to 3.4 nm particles. Therefore, a 'bright line' threshold of > 2.8 nm and < 3.4 nm is inferred from these data.
ARCADIS Discussion of Results None
Nature of Size versus Effect Relationship (if applicable)
The maximum reaction rate was obtained for 2.8 nm particles (thin SiO2 shell). Above and below this size the reaction rate decreased.
Physico‐chemical Property Investigated:
Crystalline structure (structure)
Priority of Property: High
Relevant for A1 Project?: Yes
Type of nanomaterial (eg, nanometal, nanometal oxide):
Nanometal oxide
Particle Functionalization or Capping Agent (if applicable):
None
List Study Objective(s) Relevant to Investigated Physicochemical Property:
• The effect of reducing the particle size on the crystal structures of copper oxide has been studied.
Palkar et al. (1996)
Specific Details on Tested Nanomaterial(s)
• Copper oxide
Page B-105 of 177
Appendix B: Copy of DatabaseDetails on Preparation Method of Nanomaterial(s):
• CuO was synthesized by two different routes: rapid liquid dehydra on and precipita on.• The liquid dehydration process involves fast nucleation of fine particles from an aqueous solution of copper citrate. Distilled acetone was used as dehydrating agent since it has a high solubility for water but not for copper citrate. The copper citrate precursor thus obtained was calcined at 250 or 400 deg C for various amounts of time to produce copper oxide (CuO or Cu2O). Samples with different average sizes were obtained by changing the solution concentration
and the calcina on condi on.• The second route involved the precipita on of copper oxalate from a solu on of copper acetate at a constant pH of ~2.0. The oxalate was converted to oxide by heating at 250 or 350 deg C for 15 min and the particle size was controlled as before.
Details on Tests Examining Physicochemical Property:
• Chemical phase analysis was carried out by powder x-ray diffraction (XRD). The coherently diffracting domain size (XRD) was calculated from the width of the XRD peaks under the Scherrer approximation (which assumes the small crystallite size to be the only cause of line broadening) after correcting for instrumental broadening. The equivalent spherical diameter (dBET) of the powder samples was calculated from the specific surface area measured by the Brunauer-Emmett-Teller (BET) (gas adsorption) technique.
Individual Particle Diameters Tested (nm):
No data
Solution characteristics (pH, cosolvents or other additives, sonication, ionic strength)
• pH: ~2.0 (precipita on method of prepara on)• Cosolvents or other addi ves: acetone (dehydra ng agent, liquid dehydra on method of prepara on) • Sonica on: Not performed• Ionic strength (conduc vity): No data
Min Diameter Tested (nm): No data
Max Diameter Tested (nm): No data
Specific Surface Area (SSA) (m2/g): No data
Bulk materials tested (≥ 1000 nm): No
Information on Analytical Methods Used to Determine Particle Size:
• Transmission electron microscopy (TEM) was used to characterize particle size.
List of Relevant Findings: • Heating the citrate precursor (produced by rapid dehydration) at 250 deg C results in a mixture of Cu2O and CuO. The percentage of Cu2O in the mixture was found to decrease when either the calcination temperature or the calcination time was increased. Though the particle size of CuO increases gradually (from 30 to 55 nm) with heating time, that of Cu2O remains approximately constant at a particle diameter of 25 nm when calcined at 400 deg C for various times. The above result possibly indicates the existence of a critical particle size up to which the Cu2O
phase remains stable. Any further growth in size due to thermal aggrega on leads to a conversion to CuO.• Transmission electron micrographs give us a direct idea of the particle size and its distribution. Most particles fall in the 12–18 nm range in the sample heated for 10 min at 400 deg C. The size range is larger (20–50 nm) in the sample heated for 120 min at 400 deg C due to the presence of small Cu2O and larger CuO particles. The results are essentially similar for copper oxide particles prepared by the direct precipitation method. When calcined at 250 deg C (15 min) and 350 deg C (15 min). The relative enhancement of the Cu2O phase at low particle sizes is obvious. The formation of Cu2O, therefore, appears to be a size-induced phenomenon which is independent of the
process and the precursor.• The size-induced transi on from the low-symmetry CuO phase to the high-symmetry Cu2O phase is accompanied by a sharp increase in the unit-cell volume (calculated per formula unit). We have previously suggested that the increase in crystal symmetry that occurs with reducing size is related to a size-induced negative pressure effect (as evidenced by an expansion in the unit-cell volume). High-pressure measurements in transition-metal oxides indicate that the covalence increases with increasing pressure. We therefore postulated that a reduction in particle size should result in an enhancement in the ionic character of the system and a consequent tendency towards structures of comparatively higher symmetry. This argument is directly supported by the present results since Cu2O—in addition to being more symmetric—is also more ionic than CuO, as can be shown from Fajan’s rules of ionic polarizability.
Size versus Effect Relationship Observed by Authors?:
Yes
Mathematical Relationship Identified in Paper (if applicable):
None
Author‐Identified 'Bright Line' Particle Size (diameter) Threshold (nm) ‐ List if applicable:
None
Notes on 'Bright Line' Threshold: None
ARCADIS Discussion of Results Unsure of direct relevance for the objejctives of this project.
Nature of Size versus Effect Relationship (if applicable)
Cu2O particles are stable when calcined at 400 deg C for various times; any further growth in size due to thermal aggregation leads to a conversion to CuO (i.e., CuO phase is stable at larger particle sizes than Cu2O).
Page B-106 of 177
Appendix B: Copy of Database
Physico‐chemical Property Investigated:
Crystalline structure (structure)
Priority of Property: High
Relevant for A1 Project?: Yes
Type of nanomaterial (eg, nanometal, nanometal oxide):
Nanometal oxide
Particle Functionalization or Capping Agent (if applicable):
None
List Study Objective(s) Relevant to Investigated Physicochemical Property:
• The effect of reducing the particle size on the crystal structures of cerium oxide has been studied.
Palkar et al. (1996)
Specific Details on Tested Nanomaterial(s)
• Cerium oxide
Details on Preparation Method of Nanomaterial(s):
• Cerium oxide nanoparticles were synthesized by a modified sol-gel method from a solution of Ce(NO3)3. 6H2O. A stable suspension (sol) of Ce(OH)3 was gelated using a chemical dehydrating agent together with a surfactant. The gelated material was dried and calcined at different temperatures to obtain different sizes of cerium oxide nanoparticles (ranging in size from 5 nm to about 1 um).
Details on Tests Examining Physicochemical Property:
• Chemical phase analysis was carried out by powder x-ray diffraction (XRD). The coherently diffracting domain size (XRD) was calculated from the width of the XRD peaks under the Scherrer approximation (which assumes the small crystallite size to be the only cause of line broadening) after correcting for instrumental broadening. The equivalent spherical diameter (dBET) of the powder samples was calculated from the specific surface area measured by the Brunauer-Emmett-Teller (BET) (gas adsorption) technique.
Individual Particle Diameters Tested (nm):
No data
Solution characteristics (pH, cosolvents or other additives, sonication, ionic strength)
• pH: No data• Cosolvents or other addi ves: No data• Sonica on: No data• Ionic strength (conduc vity): No data
Min Diameter Tested (nm): 4.8
Max Diameter Tested (nm): No data
Specific Surface Area (SSA) (m2/g): No data
Bulk materials tested (≥ 1000 nm): No
Information on Analytical Methods Used to Determine Particle Size:
• Transmission electron microscopy (TEM) was used to characterize particle size.
List of Relevant Findings: • The stable, "bulk" phase of cerium oxide is cubic CeO2. If a release of oxygen is a necessary part of the size reduction process, then a size-induced structural transition to either the oxygen-deficient phase Ce(6)O(11) (low-symmetry) or to CeO or Ce2O3 (both cubic) could be expected. But if an increase in symmetry is the more important effect of size reduction, then cubic CeO2 should not undergo a change in its crystal structure with decreasing size. But even a conversion to cubic CeO is unlikely, since its unit-cell volume (0.329 nm^3) is less than that of CeO2 (0.396 nm^3), and earlier results from the same laboratory, indicate that the unit-cell volume tends to
expand as the par cle size is reduced (nega ve pressure effect).• We used the sol-gel technique to produce ultrafine particles of cerium oxide with various average sizes down to 4.8 nm (dBET). Calcining the precursor at 1000 deg C for 10 h leads to single phase (bulk) CeO2 with dBET = 684 nm, while calcining at 100 deg C for 15 min still leads to completely single phase CeO2 with dBET = 4.8 nm. Clearly, the high-symmetry cubic phase remains perfectly stable with a decrease in size and does not transform to any of the other known phases with lower oxygen stoichiometry.
Page B-107 of 177
Appendix B: Copy of DatabaseSize versus Effect Relationship Observed by Authors?:
No
Mathematical Relationship Identified in Paper (if applicable):
None
Author‐Identified 'Bright Line' Particle Size (diameter) Threshold (nm) ‐ List if applicable:
None
Notes on 'Bright Line' Threshold: None
ARCADIS Discussion of Results None
Nature of Size versus Effect Relationship (if applicable)
The high-symmetry cubic phase remains perfectly stable with a decrease in size and does not transform to any of the other known phases with lower oxygen stoichiometry.
Physico‐chemical Property Investigated:
Reactivity
Priority of Property: High
Relevant for A1 Project?: Yes
Type of nanomaterial (eg, nanometal, nanometal oxide):
Nanometal
Particle Functionalization or Capping Agent (if applicable):
None
List Study Objective(s) Relevant to Investigated Physicochemical Property:
• To investigate the reactivity and sintering kinetics of model catalysts consisting of gold nanoparticles dispersed on TiO2(110).
• No informa on is presented on the synthesis of gold nanopar cles.• For prepara on of the TiO2 (100) surface, the surface was cleaned with a 1.0 keV Ar ion sputter and subsequently annealed for 10 min at 873 K. The sample
was then allowed to cool. • Gold was deposited onto the surface using a resis vely heated Ta boat that was coated with a high temperature ceramic glue to prevent the gold from wetting the boat and breaking the contacts.
All of the experiments outlined in this work havebeen performed in a Leybold–Heraeus ultrahigh
Details on Tests Examining Physicochemical Property:
• The size-dependence of Au/TiO2 (1 1 0) to catalyze the reaction of oxygen adatoms O(a) with CO to form CO2 was investigated. A hot filament method was used to dissociate O2 gas and deposit oxygen adatoms (Oa) on the gold
nanopar cles.• All of the experiments outlined in this work have been performed in a Leybold–Heraeus ultrahigh vacuum (UHV) system, which consisted of two chambers with a base pressure with capabilities of x-ray photoelectron spectroscopy (XPS), low energy ion scattering (LEIS), low energy electron diffraction (LEED), and temperature programmed desorption (TPD). A polished TiO2(110) crystal is mounted on a Ta plate and can be resistively heated and cooled with liquid N2, such that temperatures from 150 to1000 K can be obtained. Temperature is monitored by a thermocouple glued directly to the crystal.
Individual Particle Diameters Tested (nm):
No data
Solution characteristics (pH, cosolvents or other additives, sonication, ionic strength)
Not applicable
Min Diameter Tested (nm): No data
Max Diameter Tested (nm): No data
Specific Surface Area (SSA) (m2/g): No data
Bulk materials tested (≥ 1000 nm): No data
Information on Analytical Methods Used to Determine Particle Size:
No data
List of Relevant Findings: • Oxygen adatoms were more strongly adsorbed to Au NPs as the number of layers (thickness) of the gold islands deposited on the TiO2 crystals decreased.• Calcula on of reac on rates found that the reac on rate constant
increased with increasing nanoparticle size. Thus the association reaction (COa+ Oa --> CO2, g) gets faster as the oxygen adsorption strength decreases, again as expected from Brønsted relations.
Page B-108 of 177
Appendix B: Copy of DatabaseSize versus Effect Relationship Observed by Authors?:
Yes
Mathematical Relationship Identified in Paper (if applicable):
None
Author‐Identified 'Bright Line' Particle Size (diameter) Threshold (nm) ‐ List if applicable:
None
Notes on 'Bright Line' Threshold: The actual particle diameters are not stated in the paper; therefore, determination of a 'bright line' particle size threshold is not possible.
ARCADIS Discussion of Results Limited utility since the actual particle diameters tested are not reported.
Nature of Size versus Effect Relationship (if applicable)
Catalytic reaction rate increases with increasing particle size.
Physico‐chemical Property Investigated:
Reactivity
Priority of Property: High
Relevant for A1 Project?: Yes
Type of nanomaterial (eg, nanometal, nanometal oxide):
Supported nanometal
Particle Functionalization or Capping Agent (if applicable):
None
List Study Objective(s) Relevant to Investigated Physicochemical Property:
• This work presents studies on the electrocatalysis ofthe oxygen reduc on reac on (ORR) on pla num oncarbon thin porous coa ng/rota ng disk electrode (TPC/RDE) in alkaline and acid media. The materials studied
are dispersed pla num on carbon (Pt/C)with different values of the ra o Pt/C. The electrochemical techniques considered are cyclic voltammetry, steady state polarization and impedance spectroscopy.
Perez et al. (1998)
Specific Details on Tested Nanomaterial(s)
• Carbon-supported platinum (Pt/C)
Details on Preparation Method of Nanomaterial(s):
• The catalyst was prepared by mixing the catalyst powders (Vulcan XC-72 carbon, 10 ± 80 w/w Pt/carbon and pure platinum) with a dilute suspension (12% w/w) of a Teflon emul referred to the RHE.
Details on Tests Examining Physicochemical Property:
• The rotating electrode was made by adapting a PTFE cylinder with a 0.5 cm diameter cavity to a PINE rotator system. A graphite rod was forced into the cavity leaving a recess of 0.015 cm which was filled with the catalyst material. All the experiments were carried out in 1.0 M NaOH or 0.5 M H2SO4 solutions, saturated with purified N2
or O2 gases.• Cyclic voltammetry was performed and ac impedance and rota ng disk polariza on measurements were carried out. The oxygen reduction polarization potentials for the ac impedance measurements were set point-by-point in the potentiostatic mode. The ac perturbation was a 5 mV peak-to-peak sinusoidal signal, with the frequency varying from 0.005 Hz to 10 kHz. In all cases, the dc steady state currents at each electrode potential
were recorded prior to the ac measurement.• Transmission electron microscopy (TEM) analyses of the Pt/C catalysts were conducted. X-ray diff rac on (XRD) analysis were made. The crystallite size of the Pt par cles was calculated from the full width at half-maximum of the (111) peak.
Individual Particle Diameters Tested (nm):
2.4, 2.8, 3.8, 4.5, 9, 16.5
Solution characteristics (pH, cosolvents or other additives, sonication, ionic strength)
• pH: No data• Cosolvents or other addi ves: All the experiments were carried out in 1.0 M NaOH or 0.5 M H2SO4 solu ons• Sonica on: Not performed• Ionic strength (conduc vity): No data
Page B-109 of 177
Appendix B: Copy of DatabaseMin Diameter Tested (nm): 2.4
Max Diameter Tested (nm): 16.5
Specific Surface Area (SSA) (m2/g): 17, 31, 62, 74, 100, 114
Bulk materials tested (≥ 1000 nm): No
Information on Analytical Methods Used to Determine Particle Size:
Average particle size was obtained from transmission electron microscopy (TEM) and X-ray diffraction (XRD).
List of Relevant Findings: • Specific activity increased with increasing particle size in acid medium (H2SO4). The specific activity of the platinum particles, calculated without compensation for the structural effects of the active layer, is practically independent of Pt particle size; values obtained after compensation for the structural effects present a marked dependence on particle size. These results show that, at least for the TPC electrodes, the structural eff ects are
very important in determining the ac vity profiles.• In alkaline medium, the rela onship between specific ac vity and particle size appears to be bimodal, with a maximum specific activity at ca. 4.5 nm, then SA until ca. 9-12 nm
and then increasing again at a par cle size of 16.5 nm.• In alkaline medium (NaOH), the mass ac vity reached a maximum at ca. 4 nm and then decreased as particle size increased up to ca. 15.2 nm. Thus the increase in the mass activity in the region of small particle sizes, can be understood as an increase of the platinum contribution to the catalysis of ORR (a 4e- process). Beyond 5 nm, the decay in the mass activity is strongly governed by the
decrease of the AVF of the Pt crystallite (111) facets.• The eff ect of Pt par cle size on the oxygen reduc on electrocatalysis in both electrolytes is correlated with the predominant facets of the platinum crystallites.
Size versus Effect Relationship Observed by Authors?:
Yes
Mathematical Relationship Identified in Paper (if applicable):
None
Author‐Identified 'Bright Line' Particle Size (diameter) Threshold (nm) ‐ List if applicable:
None
Notes on 'Bright Line' Threshold: For specific activity in the ORR, activity increased with increasing particle size; therefore, a 'bright line' particle size threshold cannot be determined. For mass activity in the ORR, a maximum activity was reached before decreasing with increasing particle size. The size at which the maximum occurred was ca. 4 nm.
ARCADIS Discussion of Results A particle size threshold was not mentioned by the authors for specific of mass activity. However, a threshold of ca. 4 nm can be inferred for mass activity based on the data presented.
Nature of Size versus Effect Relationship (if applicable)
For specific activity in the ORR, activity increases with increasing particle size. For mass activity in the ORR, a maximum activity was reached before decreasing with increasing particle size.
Physico‐chemical Property Investigated:
Reactivity
Priority of Property: High
Relevant for A1 Project?: Yes
Type of nanomaterial (eg, nanometal, nanometal oxide):
Nanometal oxide
Particle Functionalization or Capping Agent (if applicable):
None
List Study Objective(s) Relevant to Investigated Physicochemical Property:
• To investigate the size-dependence of the activation energy required for reduction of Co3O4 nanoparticles to elemental Co.
Prieto et al. (2009)
Specific Details on Tested Nanomaterial(s)
• Cobalt oxide (Co3O4) supported on spherical SiO2
Page B-110 of 177
Appendix B: Copy of DatabaseDetails on Preparation Method of Nanomaterial(s):
• Cobalt nanoparticles were synthesized in a reverse micellar medium utilizing a double microemulsion system. A first reverse microemulsion was prepared by dissolving the non-ionic surfactant Triton X114 in cyclohexane. Then, 2-propanol was added as a modifier of the organic phase; this organic solution was stirred at room temperature while displacing the air by an Ar flow. An aqueous solution of Co(NO3)2.6H2O was then added to the organic solution of the surfactant to a microemulsion. A twin reverse microemulsion was prepared in the same way containing hydrazine (N2H4.H2O) as reductive reagent in the aqueous phase instead of cobalt. The hydrazine-bearing microemulsion was added to the cobalt containing microemulsion under sweeping Ar. The suspension was stirred under Ar and then the support added and the suspension sonicated to properly disperse the support nanosheets. Tetrahydrofuran was added to ensure a complete destabilization of the micelles and deposition of cobalt–hydrazine complexes on the support. The solid was then filtered, washed, dried, and calcined by slowly
hea ng the sample from room temperature to 773 K in flowing diluted air.• An addi onal low-dispersed model catalyst was prepared by supporting commercial nanosized Co3O4 on a porous SiO2. The Co3O4 nanopowder was co-suspended in ethanol with the required amount of the silica carrier to yield 30 wt% Co loading and the suspension was sonicated for 30 min. The solvent was then removed in a rotary evaporator and the solid finally dried and air-calcined as previously described for Co/ITQ-2 catalysts. The metal loading has been set to 30% in this catalyst (sample named as 30%Co/SiO2) aiming at attaining the desired CO conversion level (~10%) within the range of experimental conditions allowed by the reactor volume and gas-flow meters during the catalytic experiments.
Details on Tests Examining Physicochemical Property:
• Hydrogen temperature-programmed reduction (H2-TPR) was used to study reduction of Co3O4. About 30 mg of sample was initially flushed with an Ar flow at room temperature for 30 min, then the gas was switched to 10 vol% H2 in Ar and the temperature increased up to 1173 K at a heating rate of 10 K/min. A downstream 2-propanol/N2(liq) trap was used to retain the water generated during the reduction. The H2 consumption rate was monitored in a thermal conductivity detector (TCD) previously calibrated using the reduction of CuO as reference.
Solution characteristics (pH, cosolvents or other additives, sonication, ionic strength)
• pH: No data• Cosolvents or other addi ves: Triton X114 (non-ionic surfactant) in cyclohexane, 2-propanol (reverse microemulsion synthesis); hydrazine, tetrahydrofuran (twin reverse microemulsion) • Sonica on: Cobalt
microemulsions were sonicated und
Min Diameter Tested (nm): 5.9
Max Diameter Tested (nm): 141
Specific Surface Area (SSA) (m2/g): No data
Bulk materials tested (≥ 1000 nm): No
Information on Analytical Methods Used to Determine Particle Size:
X-ray diffraction (XRD) patterns were acquired at room temperature in a Phillips X’pert diffractometer using monochromatized CuKa radiation. The average particle size of Co3O4 in the calcined catalysts was estimated from the Scherrer’s equation applied to the most intense (311) diffraction (2h = 36.9) using a shape factor K=0.9. The FWHM of the peak was determined after Gaussian fitting using the Philips APDW software and quartz (Merck) for determination of the instrumental broadening.
List of Relevant Findings: • No significant reduction features in the higher temperature regime (> 800 K) are found for catalysts displaying a par cle diameter from 6.8 to 125 nm.• When the Co3O4 par cle size is decreased to 5.9 nm in, an addi onal
intense peak develops at 840 K while a weak H2 consumption occurs at very high temperature of 1020 K. Further decreasing Co particle size nearly depletes the reduction features for Co3O4 below 800 K, in agreement with the
absence of X-ray diffrac ons for Co3O4.• The ac va on energies for the stepwise Co3O4 -> CoO -> Co0 reduc on are found to be particle size dependent. Formation of barely reducible surface and bulk Co silicate species is observed for samples with d(Co3O4) <= 5.9 nm. Under realistic Fischer–Tropsch synthesis conditions (493 K, 2.0 MPa) the TOF increases from 1.2E-03/s to 8.6E-03/s when d(Co0) is increased from 5.6 to 10.4 nm, and then it remains constant up to a particle size of 141 nm.
Page B-111 of 177
Appendix B: Copy of DatabaseSize versus Effect Relationship Observed by Authors?:
Yes
Mathematical Relationship Identified in Paper (if applicable):
None
Author‐Identified 'Bright Line' Particle Size (diameter) Threshold (nm) ‐ List if applicable:
10.4
Notes on 'Bright Line' Threshold: The TOF increased with increasing particle diameter from 5.6 and 10.4 nm and then remains constant up to a particle diameter of 141 nm. Therefore, 10.4 nm can be seen as a threshold, below which, the TOF decreases with decreasing particle diameter.
ARCADIS Discussion of Results None
Nature of Size versus Effect Relationship (if applicable)
Under realistic Fischer–Tropsch synthesis conditions (493 K, 2.0 MPa) the TOF increases from 1.2E-03/s to 8.6E-03/s when d(Co0) is increased from 5.6 to 10.4 nm, and then it remains constant up to a particle size of 141 nm. The intrinsic (per Co0 site) catalytic activity is expressed as turnover frequency or TOF.
Physico‐chemical Property Investigated:
Crystalline structure (structure)
Priority of Property: High
Relevant for A1 Project?: Yes
Type of nanomaterial (eg, nanometal, nanometal oxide):
Nanometal sulfide
Particle Functionalization or Capping Agent (if applicable):
None
List Study Objective(s) Relevant to Investigated Physicochemical Property:
• To investigate the structure of nanoparticles of zinc sulfide at various annealing temperatures under vacuum conditions.
Qadri et al. (1999)
Specific Details on Tested Nanomaterial(s)
• Zinc sulfide (ZnS)
Details on Preparation Method of Nanomaterial(s):
• Particles were synthesized using a technique in which the bicontinuous cubic phase exhibited by some lipids and surfactants is used as a matrix to provide a uniform nanometer-sized reaction chamber for the formation of nanoparticles.
Details on Tests Examining Physicochemical Property:
• High-resolution transmission electron microscopic (TEM) studies showed that the particles are highly monodispersed. High-resolution TEM images show that the particles are monocrystalline and indicate a small
anisotropy in shape.• X-ray-diffrac on scans were taken on a Rigaku diffractometer using Cu K(alpha)radia on from a rotating anode x-ray generator operating at 50 kV and 200 mA. The as-made nanocrystalline ZnS sample was divided into four portions for annealing in vacuum at four different temperatures. After 45 min of annealing at the desired temperature, the sample was cooled to room temperature at a rate of about 15–20 deg C/min. This procedure was carried out for four samples separately annealed at four temperatures, 300, 350, 400 and 500 deg C. After annealing at the specified temperatures, the samples were mounted on silicon wafer for the theta/2theta diffraction scans.
Individual Particle Diameters Tested (nm):
2.7, 2.9, 3.2, 7.4, 7.4, 23.2, 24.3
Solution characteristics (pH, cosolvents or other additives, sonication, ionic strength)
Not applicable
Page B-112 of 177
Appendix B: Copy of DatabaseMin Diameter Tested (nm): 2.7
Max Diameter Tested (nm): 24.3
Specific Surface Area (SSA) (m2/g): No data
Bulk materials tested (≥ 1000 nm): No
Information on Analytical Methods Used to Determine Particle Size:
The size and morphology of the particles before and after annealing were assessed with transmission electron microscopy (TEM; 200 kV).
List of Relevant Findings: • Post-anneal analyses revealed an increase of crystallite size, accompanied by a partial transformation from the cubic, zinc-blend structure to the hexagonal, wurtzite structure at temperatures as low as 400 deg C. This is significantly less than accepted bulk transition temperature of 1020 deg C. The particles also show some lattice distortion with decreasing particle size and there is a monotonic reduction in the specific volume of about 2.3% as
the par cle size decreases from about 240 to about 3 nm.• The data suggest that for the nanometer-sized particles of ZnS, the equilibrium transition temperature for the cubic-to wurtzite transition is significantly reduced from the bulk value. The nanometer-sized particles show distortion from the cubic lattice of ZnS.
Size versus Effect Relationship Observed by Authors?:
Yes
Mathematical Relationship Identified in Paper (if applicable):
None
Author‐Identified 'Bright Line' Particle Size (diameter) Threshold (nm) ‐ List if applicable:
None
Notes on 'Bright Line' Threshold: A size range of ca. 0.3 to ca. 24 nm ZnS was tested; the cubic to wurtzite transition temperature for nano-ZnS is significantly reduced compared to reported values (from other sources) for bulk ZnS. No 'bright line' threshold can be established from these data.
ARCADIS Discussion of Results None
Nature of Size versus Effect Relationship (if applicable)
The equilibrium transition temperature from cubic to wurtzite of nano-ZnS is significantly reduced compared to bulk-ZnS.
Physico‐chemical Property Investigated:
Surface Morphology
Priority of Property: High
Relevant for A1 Project?: Yes
Type of nanomaterial (eg, nanometal, nanometal oxide):
Nanometal
Particle Functionalization or Capping Agent (if applicable):
Thiol capping agents
List Study Objective(s) Relevant to Investigated Physicochemical Property:
• To investigate a series of CdS nanoparticles using Extended X-ray Absorption Fine Structure (EXAFS).
Rockenberger et al. (2010)
Specific Details on Tested Nanomaterial(s)
• Cadmium sulfide (CdS)
Details on Preparation Method of Nanomaterial(s):
• Sample 1: Cadmium 1-thioglycerolate• Sample 2: Cd17S4(SCH2CH2OH)26.4H2O nanocrystals• Sample 3: Cd32S14(SCH2CH(OH)CH3)36.4H2O nanocrystals• Sample 4: CdS with 1-thioglycerol as a stabilizing ligand•
Sample 5: CdS with 1-thioglycerol as a stabilizing ligand• Sample 6: CdS with 1-thioglycerol as a stabilizing ligand• Sample 7: CdS with 1-thioglycerol as a stabilizing ligand• Sample 8: Polyphosphate-stabilized CdS NPs• Sample 9:
Details on Tests Examining Physicochemical Property:
• EXAFS measurements between 5 and 290 K at the Cd K edge have been performed at beamline X1.1 of the DORIS storage ring HAYSLAB, DESY. This beamline is equipped with a SI (311) double crystal monochromator which was detuned to 60% of the Bragg peak intensity to eliminate higher harmonics. EXAFS data of a sample and simultaneously of Cd metal foil as reference were measured between 26.4 and 290.0 keV in transmission with three ionization chambers. The temperature of the sample was varied between 5 and 290 K by a liquid He bath cryostat.
Individual Particle Diameters Tested (nm):
1.4-4.0, 3.0-12.0
Solution characteristics (pH, cosolvents or other additives, sonication, ionic strength)
Not applicable
Page B-113 of 177
Appendix B: Copy of DatabaseMin Diameter Tested (nm): 1.4
Max Diameter Tested (nm): 12
Specific Surface Area (SSA) (m2/g): No data
Bulk materials tested (≥ 1000 nm): No
Information on Analytical Methods Used to Determine Particle Size:
Particle diameter was determined by UV-vis absorption spectroscopy and by powder X-ray diffraction (XRD).
List of Relevant Findings: The size dependence of the static disorder was demonstrated by enlarged values for n-CdS compared to bulk-CdS. CdS NPS larger than 3 nm diameter show a strongly increasing static disorder. Below 3 nm, the static disorder is slightly reduced with respect to intermediate particle size.
Size versus Effect Relationship Observed by Authors?:
Yes
Mathematical Relationship Identified in Paper (if applicable):
None
Author‐Identified 'Bright Line' Particle Size (diameter) Threshold (nm) ‐ List if applicable:
3
Notes on 'Bright Line' Threshold: For particles larger than 3 nm, the increase of the static disorder follows the change of the surface to volume ratio.
ARCADIS Discussion of Results None
Nature of Size versus Effect Relationship (if applicable)
• The sol-gel based polymeric precursor route was used to synthesize LCMO nanoparticles down to a particle diameter of 15 nm. Ethylene glycol was used as the polymer, which helps to form a close network of cations from
the precursor solu on and assists the reac on.• High purity (CH3COO)3La.xH2O, Ca(CH3CO2)2H2O and (CH3COO)2Mn.4H2O were dissolved in the desired stoichiometric proportions in acetic acid and H2O. To this solution the appropriate amount of ethylene glycol was added and heated until the sol was formed. the gel was dried overnight at 150 deg C. Pyrolysis was done at 350 deg C and 450 deg C followed by sintering at ca. 650 deg C
in order to obtain the desired chemical phase. • The nanopowders were subjected to pelle za on at various sintering temperatures from 370 to 1100 deg C and for varying periods of time (5 to 30 h) in an effort to prepare a batch of LCMO samples of varying particle sizes.
Details on Tests Examining Physicochemical Property:
• X-ray diffraction (XRD), magnetization measurements and resistivity measurements were used to characterize the formed nanoparticles.
Individual Particle Diameters Tested (nm):
No data
Solution characteristics (pH, cosolvents or other additives, sonication, ionic strength)
• pH: No data• Cosolvents or other addi ves: Ethylene glycol• Sonica on: Not performed• Ionic strength (conductivity): No data
Page B-114 of 177
Appendix B: Copy of DatabaseMin Diameter Tested (nm): ca. 10
Max Diameter Tested (nm): ca. 1000-2000
Specific Surface Area (SSA) (m2/g): No data
Bulk materials tested (≥ 1000 nm): No
Information on Analytical Methods Used to Determine Particle Size:
X-Ray diffraction (XRD) and transmission electron microscopy were used to determine the particle size.
List of Relevant Findings: • It was observed that the lattice parameter, cell volume and the asymmetry parameter decreased in a systematic way with a decrease in the par cle size from approximately a few microns to ca. 30 nm.• It has been established
that the size reduction destabilizes the charge-ordered state and established a ferromagnetic ground state which is metallic.• The orthorhombic distor on decreases with decreasing par cle size. This is thought to be due to an
increased surface pressure in the nanoparticles. Assuming the particles to be spherical in shape, it is known that the higher pressure has a direct consequence of reducing the cell volume (from 22.59 nm to 21.96 nm) and the asymmetry parameter (from 0.41600 to 0.40876).
Size versus Effect Relationship Observed by Authors?:
Yes
Mathematical Relationship Identified in Paper (if applicable):
None
Author‐Identified 'Bright Line' Particle Size (diameter) Threshold (nm) ‐ List if applicable:
None
Notes on 'Bright Line' Threshold: The orthorhombic distortion of ca. 30 nm nanoparticles was compared to particles of a few microns. While the distortion was smaller for the nanoparticles, the data do not allow for calculation of a 'bright line' particle size threshold.
ARCADIS Discussion of Results None
Nature of Size versus Effect Relationship (if applicable)
Orthorhombic distortion (lattice parameter, cell volume, asymmetry parameter all decrease) with a decrease in particle sizes from a few microns to approx. 30 nm.
Physico‐chemical Property Investigated:
Reactivity
Priority of Property: High
Relevant for A1 Project?: Yes
Type of nanomaterial (eg, nanometal, nanometal oxide):
Nanometal
Particle Functionalization or Capping Agent (if applicable):
None
List Study Objective(s) Relevant to Investigated Physicochemical Property:
• The attempt to segregate the effects of any other unconventional size factor(s) from commonly known surface area and concentra on effects on catalysis; • The demonstra on of size regime dependent effects on catalysis;
and third, the attempt to relate the kinetics of this heterogeneous catalysis with the size of the catalyst particles.
Sau et al. (2001)
Specific Details on Tested Nanomaterial(s)
• Gold (Au)
Details on Preparation Method of Nanomaterial(s):
• Gold particles over a size range of 10-46 nm (diameter) were prepared by a two-step seed mediated method. Seed nanoparticles of gold were prepared by the UV irradiation of solution containing Au(III) ions in aqueous Triton X-100 (TX-100).
Details on Tests Examining Physicochemical Property:
• Typically, 2 mL of a sample containing particles of a given average size and 0.04 mL 10^-2 M eosin were mixed, and to this was added 0.4 mL 0.5 M NaBH4 solution. The kinetics of eosin reduction was monitored
spectrophotometrically following the decrease in absorbance at lambda = 535 nm at 29 +/- 1 deg C.• Spectrophotometric studies were carried out in aShimadzu UV-160 digital spectrophotometer (Kyoto, Japan) with
a 1 cm quartz cuvette.
Individual Particle Diameters Tested (nm):
10, 12, 14, 22, 31 and 46 nm
Solution characteristics (pH, cosolvents or other additives, sonication, ionic strength)
• pH: No data• Cosolvents or other addi ves: None• Sonica on: Not performed• Ionic strength (conduc vity): No data
Page B-115 of 177
Appendix B: Copy of DatabaseMin Diameter Tested (nm): 10
Max Diameter Tested (nm): 46
Specific Surface Area (SSA) (m2/g): No data
Bulk materials tested (≥ 1000 nm): No
Information on Analytical Methods Used to Determine Particle Size:
Transmission electron microscopy (TEM) was used to characterize the particles. Samples for TEM were prepared by placing a drop of solution containing nanoparticles on a carbon-coated Cu grid. TEM measurement was carried out at 400 kV using a JEOL 4000 EX instrument.
List of Relevant Findings: • The kinetics of catalytic reduction revealed that for the same surface area of different particles, the catalytic rate does not increase proportionately with the decrease in size over the whole range of average diameter from 10 to
46 nm.• The rate decreases first with the increase in par cle size, and above 15 nm, it increases. • Moreover, if the mass effect is also taken into account, that is, catalytic rate is determined in terms of per unit mass per unit surface area, then the resulting catalytic rate falls with the rise in particle size over the whole range of size studied.
Size versus Effect Relationship Observed by Authors?:
Yes
Mathematical Relationship Identified in Paper (if applicable):
k = vAR^mwhere:k = cataly c rate constantA = the total catalyst surface areaR = the average par cle radius for the given setv = the constant (3.9E13 cm2/s/mol) and is independent of par cle concentra on and size
Author‐Identified 'Bright Line' Particle Size (diameter) Threshold (nm) ‐ List if applicable:
15
Notes on 'Bright Line' Threshold: A gold catalyst particle diameter of 15 nm achieved the minimum rate of catalytic degradation of eosin.
ARCADIS Discussion of Results None
Nature of Size versus Effect Relationship (if applicable)
The catalytic reduction rate decreases as particle size decreases from 10 to 15 nm and then increases from 15 to 46 nm (15 nm = minimum).
Physico‐chemical Property Investigated:
Reactivity
Priority of Property: High
Relevant for A1 Project?: Yes
Type of nanomaterial (eg, nanometal, nanometal oxide):
Nanometal
Particle Functionalization or Capping Agent (if applicable):
None
List Study Objective(s) Relevant to Investigated Physicochemical Property:
• This study investigates the reaction kinetics on Pd/Fe3O4 as function of particle size, using CO oxidation as a test reaction.
Schalow et al. (2007)
Specific Details on Tested Nanomaterial(s)
• Pd nanoparticles supported on an ordered Fe3O4 film on Pt(111),
Page B-116 of 177
Appendix B: Copy of DatabaseDetails on Preparation Method of Nanomaterial(s):
• The thin (~10 nm) Fe3O4 film was grown on Pt(111) by repeated cycles of Fe deposition and subsequent oxidation. Pd particles were grown by physical vapor deposition using a commercial evaporator. Pd coverages between 7E13 atoms/cm^2 and 1.3E16 atoms/cm^2 were deposited at a sample temperature of 115 Km resulting in Pd coverages of 0.03, 0.4, 0.7 and 1.5 nm). During Pd evaporation the sample was biased in order to avoid creation of defects by metal ions. Directly after Pd deposition, the sample was annealed to 600 K and was stabilized by several cycles of oxygen (8E7 mbar for 1000 s) and CO exposure (8E7 mbar for 3000 s) at 500 K.
Details on Tests Examining Physicochemical Property:
• Redox kinetic information was obtained by combining structural data from scanning tunneling microscopy (STM) with molecular beam (MB) techniques and IR reflec on absorp on spectroscopy (IRAS).• All molecular beam (MB)
experiments were performed in a UHV apparatus at the Fritz-Haber-Ins tut.• For gas-phase detec on an automated quadrupole mass spectrometer (QMS) system was employed, detecting the partial pressure of the
reactants and the product.• In addi on, the MB apparatus allows us to acquire IR spectra (IRAS, IR reflec on absorption spectroscopy) during gas exposure and reaction using a vacuum FT-IR spectrometer. In addition to the IR spectra shown in the following, IR spectroscopy was used as a spectroscopic tool in order to control the reproducibility and stability of the model surfaces prepared. All IR spectra were acquired with a spectral resolution
of 2/cm, and an MIR polarizer to select the p-component of the IR light only.• Scanning tunneling microscopy measurements were performed in a separate UHV chamber (at a base pressure of <2E10 mbar) equipped with Auger electron spectroscopy/ low energy electron diffraction, a quadrupole mass spectrometer and an STM.
Individual Particle Diameters Tested (nm):
ca.4, ca. 7, ca. 12, ca. 70
Solution characteristics (pH, cosolvents or other additives, sonication, ionic strength)
Not applicable
Min Diameter Tested (nm): ca. 4
Max Diameter Tested (nm): ca. 70
Specific Surface Area (SSA) (m2/g): No data
Bulk materials tested (≥ 1000 nm): No
Information on Analytical Methods Used to Determine Particle Size:
Scanning tunneling microscopy (STM) was used to investigate particle sizes.
List of Relevant Findings: • The average oxidation state of the complete particles was estimated by calculating the ratio between the oxygen uptake and the total amount of Pd deposited. With decreasing nominal Pd coverage the average oxidation state rapidly increases for Pd coverages of 0.4 nm and below (corresponding to an average particle size of 7 nm). For
very small par cles the oxygen release points to an O/Pd ra o of around 0.6 to 0.8.• Oxygen release appears to decrease again for the smallest particles. We have to treat this observation with care because of the large experimental uncertainties in the limit of small particles. Still, it is important to notice that a decreasing oxygen release for the smallest particles does not necessarily imply a hindered oxidation. Instead, it may also point to a
hindered reduc on upon CO exposure.• Oxida on and reduc on of the Pd par cle was inves gated as a func on of particle size at 500 K. Interface oxidation and partial surface oxidation occur easily at particle sizes up to approximately 7 nm. On larger particles strong kinetic hindrances with respect to oxidation are observed. On the contrary, smaller particles are easily oxidized. Estimates point to the formation of oxide layers which, in average, are thicker than the surface oxides formed on single crystal surfaces. Full reduction of very small Pd particles may be hindered due to strong interaction with the support.
Size versus Effect Relationship Observed by Authors?:
Yes
Mathematical Relationship Identified in Paper (if applicable):
None
Author‐Identified 'Bright Line' Particle Size (diameter) Threshold (nm) ‐ List if applicable:
7
Notes on 'Bright Line' Threshold: Interface oxidation and partial surface oxidation occur easily at particle sizes up to approximately 7 nm.
ARCADIS Discussion of Results Some experiments carried out at temperatures not found under environmental conditions.
Nature of Size versus Effect Relationship (if applicable)
On larger particles strong kinetic hindrances with respect to oxidation are observed while smaller particles are easily oxidized. Interface oxidation and partial surface oxidation occur easily at particle sizes up to approximately 7 nm.
Page B-117 of 177
Appendix B: Copy of Database
Physico‐chemical Property Investigated:
Water solubility
Priority of Property: High
Relevant for A1 Project?: Yes
Type of nanomaterial (eg, nanometal, nanometal oxide):
Nanometal oxide
Particle Functionalization or Capping Agent (if applicable):
None
List Study Objective(s) Relevant to Investigated Physicochemical Property:
• Different types of industrially produced titanium dioxide nanoparticles and a precipitated titanium dioxide have been dissolved in aqueous NaCl solutions at temperatures of 25 and 37 deg C. The titanium concentration in solution with regard to dependence on time has been determined up to 3000 h after starting the dissolution experiment.
Schmidt and Vogelsberger (2006)
Specific Details on Tested Nanomaterial(s)
• Titanium dioxide (TiO2)• anatase, anatase/ru le mixture, anatase/amorphous
Details on Preparation Method of Nanomaterial(s):
• P25 TiO2 nanoparticles (86% anatase, 14% rutile) were purchased from Degussa and were made by flame pyrolysis. DT41D and G5 TiO2 nanoparticles were purchased from Millennium Chemicals (100% anatase) and were
made by a precipita on process.• TIPO TiO2 nanopar cles were synthesized in-house using a precipita on process (60% anatase, 40% amorphous). Briefly, the sample was made by mixing 15 mL of
taniumtetraisopropoxide and 185 mL of deionized water at pH = 5.5. The obtained hydrous oxide was not freeze dried but dried at 70 deg C.
Details on Tests Examining Physicochemical Property:
• Dissolu on condi ons: pH = 1.5, concentra on of NaCl = 0.1 mol/L,temperature = 25 deg C, and dissolu on area = 40 m^2/100 mL.• The background electrolyte is NaCl. First, the background electrolyte solu on was acidified
with hydrochloric acid to achieve approximately the desired pH value of the dissolution experiment. For pH measurements, a pH meter was used. Then titanium dioxide was introduced into the solution. The amount of titanium dioxide (dried at 70 to 110 deg C) in most experiments was chosen in such a way that the surface area exposed to the solvent is 40 m^2. The final pH adjustment has been done by HCl or NaOH, having concentrations of 0.1 or 1 mol/L, respectively. The starting point of the dissolution is defined as point where the pH has reached the desired value.
Individual Particle Diameters Tested (nm):
9.7 (G5), 23.9 (DT51D), 24.4-29.7 (P25)
Solution characteristics (pH, cosolvents or other additives, sonication, ionic strength)
• pH: 1.5• Cosolvents or other addi ves: none• Sonica on: Not performed• Ionic strength (conduc vity): No data
Min Diameter Tested (nm): 9.7
Max Diameter Tested (nm): 24.4-29.7
Specific Surface Area (SSA) (m2/g): 332.5 (G5), 88.5 (DT51D), 55.7 (P25)
Bulk materials tested (≥ 1000 nm): No
Information on Analytical Methods Used to Determine Particle Size:
• The phase composition and size of the crystallites (Scherrer equation) were determined by X-ray diffraction (XRD).
List of Relevant Findings: • The amounts dissolved at longer dissolution times for P25 and DT51D are smaller than those measured for G5. The size of the particles determined from the BET surface area of G5 is significantly smaller than that of the other
two samples.• Smaller par cles have larger solubili es than larger ones. The solubility difference between the particles of P25 and DT51D could not be resolved.
Page B-118 of 177
Appendix B: Copy of DatabaseSize versus Effect Relationship Observed by Authors?:
Yes
Mathematical Relationship Identified in Paper (if applicable):
Gibbs Free Energy (g(r,z)):g(r,z) = (1-zr^3)*ln{y(1-zr^3)} - (1/a)*(1-azr^3)*ln{1-azr^3} + hzr^2-zr^3*ln(b)- ln(y)Where:g(r,z) = the dimensionless difference in Gibbs free energy between the actual state of the system
and the reference stater = radiusz = concentra on of the par clesy = the ini al supersatura on (quo ent of the total amount of substance of the particle forming species and that amount of substance in the saturated solution
(satura on concentra on))a, b, h = constants (a and be depend on the amount of substance in the system), and can be calculated as:delta-C(g)/(N(0)*k(B)*T) = g(r,z)z = Z/N(0)r = R/R(0)h =
((4*pi*theta)/(k(B)*T))*R(0)^2Where:delta-C(g) = the difference in Gibbs free energy between the actual state of the system and the reference statek(B) = Boltzmann constantT = temperatureN(0) = number of monomer
moleculesR(0) = radiiR = radiusZ = number of par clestheta = surface tension of tanium dioxide
Author‐Identified 'Bright Line' Particle Size (diameter) Threshold (nm) ‐ List if applicable:
None
Notes on 'Bright Line' Threshold: An increased solubility was observed between G5 nanoparticles (9.7 nm diameter, TEM; 332.5 m^2/g SSA, BET) and DT51D (23.9 nm diameter, 88.5 m^2/g SSA) and P25 (24.4-29.7 nm diameter; 55.7 m^2/g SSA) nanoparticles. However, only qualitative information on this relationship is presented in this paper, precluding the determination of a 'bright line' particle size threshold.
ARCADIS Discussion of Results None
Nature of Size versus Effect Relationship (if applicable)
Water solubility increases with decreasing particle diameters.
Physico‐chemical Property Investigated:
Reactivity
Priority of Property: High
Relevant for A1 Project?: Yes
Type of nanomaterial (eg, nanometal, nanometal oxide):
Nanometal
Particle Functionalization or Capping Agent (if applicable):
None
List Study Objective(s) Relevant to Investigated Physicochemical Property:
• To investigate the effect of synthesis and reaction conditions on the structure and activity of Au clusters supported on nanocrystalline and mesoporous TiO2.
Schwartz et al. (2004)
Specific Details on Tested Nanomaterial(s)
• Gold (Au) supported on nanocrystalline titanium dioxide (TiO2)
Details on Preparation Method of Nanomaterial(s):
• For Au/TiO2 (nanocrystalline), a series of Au catalysts were prepared using commercially available TiO2 supports. The introduction of gold precursors on the TiO2 support was achieved via a deposition-precipitation (D-P) method
using a solu on of hydrogen tetrachloroaurate (III) trihydrate (HAuCl4.3H2O) as a precursor.• A solu on of hydrogen tetrachloroaurate (III) trihydrate was made by dissolving 3.0 g into 500 mL deionized water. Then, 50-g aliquots were adjusted to a pH of 2, 4, 6, 8, 10, or 11 with vigorous stirring, using a solution of 1.0 M KOH at room temperature. After pH adjustment, the solution was heated at 60 deg C in a water bath. Next, 1.0 g TiO2 powder was added. The resulting mixture was continuously stirred for 2 h. Finally, the precipitates were separated by centrifugation, then washed three times with deionized water and once with ethanol. The product was dried at 40 deg C in air overnight to obtain the “as synthesized” catalyst.
Details on Tests Examining Physicochemical Property:
• Fifty milligrams Au-TiO2 catalyst was packed into a 4-mm-ID quartz U-tube, supported by quartz wool. Sample treatments were carried out on the same instrument. During reactions, a gas stream of 1% CO balanced with dry air (<4 ppm water) was flowed at ambient pressure through the catalyst at a rate that was adjusted to maintain a constant space velocity. Gas exiting the reactor was analyzed by a Buck Scientific 910 gas chromatograph equipped with a dual molecular sieve/porous polymer column and using a thermal conductivity detector.
Solution characteristics (pH, cosolvents or other additives, sonication, ionic strength)
• pH: 2,4,6,8,10,11 (prepara on)• Cosolvents or other addi ves: None• Sonica on: Not performed• Ionic strength (conductivity): Not applicable
Page B-119 of 177
Appendix B: Copy of DatabaseMin Diameter Tested (nm): 0.198
Max Diameter Tested (nm): 0.228
Specific Surface Area (SSA) (m2/g): No data
Bulk materials tested (≥ 1000 nm): No
Information on Analytical Methods Used to Determine Particle Size:
The size of the Au particles was estimated by Au cluster models with varying numbers of atoms and by calculating the average coordination number.
List of Relevant Findings: • Treatments at higher temperature (300°C) brought a decrease in activity that was accompanied by an observed particle growth, and a correlation was found between particle size and activity for CO oxidation. Since particle growth caused surface area loss, the decrease in activity might be explained by Au surface area loss. Again, since the lightoff temperature is not a linear measure of activity, it is not possible to determine from these data if the activity falls faster than expected from the decrease in dispersion, which would indicate a size effect rather than a dispersion effect.
Size versus Effect Relationship Observed by Authors?:
None
Mathematical Relationship Identified in Paper (if applicable):
N/A
Author‐Identified 'Bright Line' Particle Size (diameter) Threshold (nm) ‐ List if applicable:
N/A
Notes on 'Bright Line' Threshold: N/A
ARCADIS Discussion of Results The range of particle sizes tested was too small to infer any meaningful results.
Nature of Size versus Effect Relationship (if applicable)
N/A
Physico‐chemical Property Investigated:
Reactivity
Priority of Property: High
Relevant for A1 Project?: Yes
Type of nanomaterial (eg, nanometal, nanometal oxide):
Nanometal
Particle Functionalization or Capping Agent (if applicable):
None
List Study Objective(s) Relevant to Investigated Physicochemical Property:
• To investigate the effect of synthesis and reaction conditions on the structure and activity of Au clusters supported on nanocrystalline and mesoporous TiO2.
Schwartz et al. (2004)
Specific Details on Tested Nanomaterial(s)
• Gold (Au) supported on mesoporous titanium dioxide (TiO2)
Page B-120 of 177
Appendix B: Copy of DatabaseDetails on Preparation Method of Nanomaterial(s):
• In a typical preparation, 4.18 g titanium-(IV) tetraethoxide was dissolved in 2.7 mL concentrated hydrochloric acid at room temperature under vigorous stirring. After 10-15 min, a solution of 1.0 g surfactant (triblock copolymer P123) dissolved in 12 mL dry ethanol was added. The solutions were subsequently aged with stirring at room temperature for about 30 min, poured into a glass Petri dish, and dried. After 2 days, the dried material was calcined (ramp to 180 deg C at 2 deg C/min, hold for 4 h, ramp to 315 deg C at 2 deg C/ min, hold for 15 h) to
remove the block copolymer species.• The Au was introduced by adding variable amounts of hydrogen tetrachloroaurate (III) trihydrate to 50 mL water, adjusting the pH to7 by adding KOH with vigorous stirring, and then adding 0.8 g mesoporous titania. The resulting mixture was stirred for 4 h, filtered, washed with distilled water several times, and dried at 60 deg C. The precursors were finally calcined in air at 200 deg C for 3 h. Three Au sample loadings of 2.5, 5, and 10 wt % were prepared, based upon synthesis stoichiometry.
Details on Tests Examining Physicochemical Property:
• Fifty milligrams Au-TiO2 catalyst was packed into a 4-mm-ID quartz U-tube, supported by quartz wool. Sample treatments were carried out on the same instrument. During reactions, a gas stream of 1% CO balanced with dry air (<4 ppm water) was flowed at ambient pressure through the catalyst at a rate that was adjusted to maintain a constant space velocity. Gas exiting the reactor was analyzed by a Buck Scientific 910 gas chromatograph equipped with a dual molecular sieve/porous polymer column and using a thermal conductivity detector.
Solution characteristics (pH, cosolvents or other additives, sonication, ionic strength)
• pH: 7 (prepara on)• Cosolvents or other addi ves: ethanol• Sonica on: Not performed• Ionic strength (conductivity): Not applicable
Min Diameter Tested (nm): 0.197
Max Diameter Tested (nm): 0.287
Specific Surface Area (SSA) (m2/g): No data
Bulk materials tested (≥ 1000 nm): No
Information on Analytical Methods Used to Determine Particle Size:
No data
List of Relevant Findings: • The catalyst with the lowest loading was still slightly oxidized after treatment with 4% H2 at RT, which is revealed by the presence of a Au-O contribution at 0.195 nm. However, after reduction at higher temperatures (200 deg C), this sample presented the highest Au-Au coordination numbers when compared to the others containing higher Au loadings.
Size versus Effect Relationship Observed by Authors?:
None
Mathematical Relationship Identified in Paper (if applicable):
N/A
Author‐Identified 'Bright Line' Particle Size (diameter) Threshold (nm) ‐ List if applicable:
N/A
Notes on 'Bright Line' Threshold: N/A
ARCADIS Discussion of Results The range of particle sizes tested was too small to infer any meaningful results.
Nature of Size versus Effect Relationship (if applicable)
N/A
Physico‐chemical Property Investigated:
Reactivity
Priority of Property: High
Relevant for A1 Project?: Yes
Type of nanomaterial (eg, nanometal, nanometal oxide):
Nanometal
Particle Functionalization or Capping Agent (if applicable):
None
List Study Objective(s) Relevant to Investigated Physicochemical Property:
• To investigate the effect of synthesis and reaction conditions on the structure and activity of Au clusters supported on nanocrystalline and mesoporous TiO2.
Schwartz et al. (2004)
Specific Details on Tested Nanomaterial(s)
• Gold (Au) supported on different allotropic forms of nanocrystalline titanium dioxide (TiO2)
Page B-121 of 177
Appendix B: Copy of DatabaseDetails on Preparation Method of Nanomaterial(s):
• For Au/TiO2 (different allotropic forms of nanocrystalline TiO2), titanium dioxide (TiO2). Anatase and rutile TiO2 were obtained by sonication synthesis using titanium (IV) tetra isopropoxide and TiCl4 precursors, respectively. Brookite was obtained by hydrothermal synthesis using a TiCl4 precursor. The Au was introduced by D-P at a pH of 9.8-10.0 and the sample was dried at 50 deg C in air overnight to yield the as-synthesized sample. The supports used were the commercial P-25 (contains 70 wt % anatase and 30 wt % rutile), as well as pure forms of anatase, rutile, and brookite.
Details on Tests Examining Physicochemical Property:
• Fifty milligrams Au-TiO2 catalyst was packed into a 4-mm-ID quartz U-tube, supported by quartz wool. Sample treatments were carried out on the same instrument. During reactions, a gas stream of 1% CO balanced with dry air (<4 ppm water) was flowed at ambient pressure through the catalyst at a rate that was adjusted to maintain a constant space velocity. Gas exiting the reactor was analyzed by a Buck Scientific 910 gas chromatograph equipped
with a dual molecular sieve/porous polymer column and using a thermal conduc vity detector.• The supports used were the commercial P-25 (contains 70 wt % anatase and 30 wt % rutile), as well as pure forms of anatase,
ru le, and brookite.• The first set of experiments consisted of measuring the XANES por on of the absorp on spectra of the catalysts as inserted, followed by flowing 1% CO in air at RT to mimic the gases present during the CO oxidation reaction. Several measurements were taken during the interval of 1 h while flowing the gas mixture containing CO and O2. Then, a XANES spectrum was taken for each sample after the sample was heated to 150 deg C under He for 30 min. Finally, another measurement was taken after switching the gas to a reducing atmosphere of 4% H2/He at 150 deg C for 30 min.
Solution characteristics (pH, cosolvents or other additives, sonication, ionic strength)
• pH: 9.8-10 (prepara on)• Cosolvents or other addi ves: none• Sonica on: Yes• Ionic strength (conductivity): Not applicable
Min Diameter Tested (nm): 0.28
Max Diameter Tested (nm): 0.286
Specific Surface Area (SSA) (m2/g): No data
Bulk materials tested (≥ 1000 nm): No
Information on Analytical Methods Used to Determine Particle Size:
No data
List of Relevant Findings: • A continuous reduction of the Au cations under 1% CO/air was observed, even at room temperature. The catalyst is further autoreduced in He at 150 deg C, but complete reduction to Au0 is achieved under 4% H2 at 150 deg C. The continuous reduction is even more evidenced by subtracting each normalized spectrum from the sample after treatment under 4% H2 at 150 deg C and recording the peak height difference.
Size versus Effect Relationship Observed by Authors?:
None
Mathematical Relationship Identified in Paper (if applicable):
N/A
Author‐Identified 'Bright Line' Particle Size (diameter) Threshold (nm) ‐ List if applicable:
N/A
Notes on 'Bright Line' Threshold: N/A
ARCADIS Discussion of Results The range of particle sizes tested was too small to infer any meaningful results.
Nature of Size versus Effect Relationship (if applicable)
N/A
Page B-122 of 177
Appendix B: Copy of Database
Physico‐chemical Property Investigated:
Reactivity
Priority of Property: High
Relevant for A1 Project?: Yes
Type of nanomaterial (eg, nanometal, nanometal oxide):
Nanometal
Particle Functionalization or Capping Agent (if applicable):
None
List Study Objective(s) Relevant to Investigated Physicochemical Property:
• To determine the size dependence of the catalytic activity of nickel particles.
Seipenbusch et al. (2000)
Specific Details on Tested Nanomaterial(s)
• Nickel (Ni)• aerosol
Details on Preparation Method of Nanomaterial(s):
• Nickel powder was placed in an aerosol generator, followed by an heating in an over and electrostatic neutralization.
Details on Tests Examining Physicochemical Property:
• The test reac on was the methana on of CO and H2.• The aerosol was then mixed with the educt gases and passed through the aerosol reactor heated to 450 deg C. The product gas was analysed on-line with a Fourier-transformed infrared spectrophotometer (FT-IR) while the particles were analysed with several on- and offline
methods.• To characterize the cataly c ac vity of the nickel par cles the Turn Over Rate (TOR), which is defined as number of product molecules per active site and unit of time, was determined for a number of particle sizes.
Individual Particle Diameters Tested (nm):
No data
Solution characteristics (pH, cosolvents or other additives, sonication, ionic strength)
Not applicable
Min Diameter Tested (nm): 5
Max Diameter Tested (nm): 26
Specific Surface Area (SSA) (m2/g): No data
Bulk materials tested (≥ 1000 nm): No
Information on Analytical Methods Used to Determine Particle Size:
Particles were characterized by BET, scanning electron microscopy (SEM), transmission electron microscopy (TEM), SMPS, mass concentration and UPS.
List of Relevant Findings: • The cataly c ac vity of the nickel-par cles, plo ed versus their size, shows a maximum at about 18 nm.• The TOR increases by a factor of 20 between 5 and 18 nm and decreases to the initial value for particles larger than 25 nm. This behavior hints to the existence of a particle size with an optimal arrangement of the surface atoms for the active sites suitable for the methanation reaction.
Size versus Effect Relationship Observed by Authors?:
Yes
Mathematical Relationship Identified in Paper (if applicable):
None
Author‐Identified 'Bright Line' Particle Size (diameter) Threshold (nm) ‐ List if applicable:
18
Notes on 'Bright Line' Threshold: A particle size of 18 nm achieved the highest TOR among the particle sizes tested.
ARCADIS Discussion of Results None
Nature of Size versus Effect Relationship (if applicable)
The TOR increases by a factor of 20 between 5 and 18 nm and decreases to the initial value for particles larger than 25 nm.
Page B-123 of 177
Appendix B: Copy of Database
Physico‐chemical Property Investigated:
Crystalline structure (structure)
Priority of Property: High
Relevant for A1 Project?: Yes
Type of nanomaterial (eg, nanometal, nanometal oxide):
Nanometal oxide
Particle Functionalization or Capping Agent (if applicable):
None
List Study Objective(s) Relevant to Investigated Physicochemical Property:
• Characterized BiFeO3 nanocrystallites by X-ray diffraction (XRD) to investigate the size-dependent structural properties and correlated the structural data with size-dependent TN measured by differential scanning calorimetry (DSC).
Selbach et al. (2007)
Specific Details on Tested Nanomaterial(s)
• Bismuth iron trioxide (BiFeO3)• ferroelectric• perovskite
Details on Preparation Method of Nanomaterial(s):
• BiFeO3 nanocrystallites were prepared by a modified Pechini method using nitrates as metal precursors. The precursors were prepared by dissolving Bi(NO3)3 ∙5 H2O (Fluka, >99%) and Fe(NO3)3 (Merck, >99%) in distilled water with the addition of HNO3 (Merck, 65%) to pH 1–2.
Details on Tests Examining Physicochemical Property:
Characterized BiFeO3 nanocrystallites by X-ray diffraction (XRD) to investigate the size-dependent structural properties and correlated the structural data with size-dependent TN measured by differential scanning calorimetry (DSC).
Solution characteristics (pH, cosolvents or other additives, sonication, ionic strength)
Not applicable
Min Diameter Tested (nm): 11
Max Diameter Tested (nm): 86.4
Specific Surface Area (SSA) (m2/g): No data
Bulk materials tested (≥ 1000 nm): No
Information on Analytical Methods Used to Determine Particle Size:
XRD characterization at room temperature was performed on a θ-θ Bruker AXS D8 ADVANCE (Karlsruhe, Germany) diffractometer with a VANTEC-1 detector and Cu KR radiation. Data were collected using a 0.016° step size and 1 s count time over the 2θ range 20-90°. The crystallite sizes (dXRD) were calculated from the (024)hex Bragg reflections by the Scherrer equation corrected for instrumental peak broadening determined with a LaB6 standard.
List of Relevant Findings: • Crystallites larger than 30 nm display bulk lattice parameters. Below 30 nm, the lattice parameters deviate from bulk, approaching a cubic perovskite structure with decreasing particle size, corresponding to the normalized lattice
parameters becoming equal.• The unit-cell volume does not deviate from the bulk value for crystallites larger than 30 nm and increases with reduction in the crystallite size below 30 nm. The increase in unit-cell volume
observed is typical for partly covalent oxides.• No finite size effect on the oxida on state of Fe in the powders.
Size versus Effect Relationship Observed by Authors?:
Yes
Mathematical Relationship Identified in Paper (if applicable):
None
Author‐Identified 'Bright Line' Particle Size (diameter) Threshold (nm) ‐ List if applicable:
30
Notes on 'Bright Line' Threshold: None
ARCADIS Discussion of Results None
Nature of Size versus Effect Relationship (if applicable)
For crystallites smaller than 30 nm, the crystal structure gradually becomes more symmetric, approaching the ideal, cubic perovskite structure, with increasing unit-cell volume.
Page B-124 of 177
Appendix B: Copy of Database
Physico‐chemical Property Investigated:
Reactivity
Priority of Property: High
Relevant for A1 Project?: Yes
Type of nanomaterial (eg, nanometal, nanometal oxide):
Nanometal
Particle Functionalization or Capping Agent (if applicable):
None
List Study Objective(s) Relevant to Investigated Physicochemical Property:
•The authors synthesized platinum nanoparticles of various sizes in reverse micellar media by regulating the size of the aqueous cores of reverse micellar droplets.• Metallic pla num was obtained by the reduc on of chloropla nic
acid using sodium borohydride.• A size dependent cataly c study of the pla num catalyzed reac on between Fe(CN)6(3-) and S2O3(2-) was followed by monitoring the absorbance in the visible spectrum of Fe(CN)6(3-). Reactions were also followed at different temperatures to measure the activation energy of the above reaction.
Sharma et al. (2003)
Specific Details on Tested Nanomaterial(s)
• Platinum (Pt)
Details on Preparation Method of Nanomaterial(s):
• Pt NPs were prepared in reverse micelles by the reduction of chloroplatinic acid with sodium borohydride. The solution was stirred for 30–40 min until an optically clear reverse micellar solution was obtained. A calculated amount of water was added to maintain the desired W0, i.e., the molar ratio of water to reverse micelles. The mixture was stirred till a transparent microemulsion solution was obtained. After the complete addition of sodium borohydride the solution was further stirred for about 5 h. Isooctane was removed and the NPs were then separated by kept at 4 C overnight, after which time the supernatant was decanted. The NPs were washed 4–5 times with dry acetone to remove any residual reverse micelles. The nanoparticles were then dispersed in distilled water by sonication for 10 min.
Details on Tests Examining Physicochemical Property:
• To a mixture containing 200 μL of 0.01 M Fe(CN)6(3-) and 200 μL of 0.1 M S2O3(2-) solution, 500 μL of aqueous dispersion of 10% w/v platinum particles was added. Total volume of the solution was made up to 3 mL by adding the required amount of distilled water. The reactions were studied in a spectrophotometer cuvette kept at desired
temperature by circula ng water from a thermosta ed water bath.• The reac on was followed by studying the time-dependent absorbance (A) in a UV–visible spectrophotometer at 420 nm for 40 min and the fall in A with time
was noted.• A pseudo first- order plot of −lnA vs me gave a straight line and the rate constant k was obtained from the slope of the straight line. Rate constants were obtained for reactions catalyzed by Pt nanoparticle of various sizes and at different temperatures (20–50 C).
Individual Particle Diameters Tested (nm):
No data
Solution characteristics (pH, cosolvents or other additives, sonication, ionic strength)
• pH: No data• Cosolvents or other addi ves: None• Sonica on: Nanopar cles were dispersed in dis lled water by sonica on for 10 min.• Ionic strength (conduc vity): No data
Min Diameter Tested (nm): 10
Max Diameter Tested (nm): 80
Specific Surface Area (SSA) (m2/g): No data
Bulk materials tested (≥ 1000 nm): No
Information on Analytical Methods Used to Determine Particle Size:
• Three different methods were used to study the catalyst par cle size:• Dynamic light sca ering (DLS) spectra of the nanopar cles were taken with a Brookhaven model BI8000 instrument fi ed with a BI200 SM goniometer•
Transmission electron microscopic (TEM) pictures were taken with a JEOL JEM 2000 EX200 instrument.• X-ray diffraction was carried out on a Bruker, AXS-D8 diffractometer.
List of Relevant Findings: • The reaction rate constant increased initially with the increase in size of the platinum nanoparticles until it attained a maximum value corresponding to particle size of 38 nm diameter. With further increase of particle size
the reac on rate constant decreased once again giving an overall bell shaped curve.• It is well known that the rate of heterogeneous catalysis increases with the available active surface area of the catalyst. This has been exactly observed for particles of size range between 38 and 80 nm diameter. For particles of sizes below 38 nm diameter an opposite effect was observed: the reaction rate constant decreased with the decrease in size of the catalyst particle for a given mass of the particle, indicating that an additional parameter was playing its role to manifest this
effect.• The authors presume that the adsorp on of Fe(CN)6(3-) onto the surfaces of Pt NPs may cause Fermi level depression and consequent enhancement of band gap. As the size of the particle is gradually increased, this band gap is reduced, leading to lower energy for the reaction process. The assumption of a very slow reaction rate for smaller particles could be attributed to the higher activation energy for particle-mediated electron transfer caused by their larger band gap in the presence of electron-withdrawing species such as Fe(CN)6(3-) ions. Since change of Fermi level shift is negligible for the larger particles total surface area available for the reactants becomes important factor in deciding the reaction rate.
Page B-125 of 177
Appendix B: Copy of DatabaseSize versus Effect Relationship Observed by Authors?:
Yes
Mathematical Relationship Identified in Paper (if applicable):
None
Author‐Identified 'Bright Line' Particle Size (diameter) Threshold (nm) ‐ List if applicable:
38
Notes on 'Bright Line' Threshold: The catalytic rate for Pt NPs increased for increasing particle sizes up to a particle diameter of 38 nm. For particle sizes greater than 38 nm, the rate decreases again up to the maximum particle size tested, 80 nm. The authors propose that at a particle sizes < 38 nm, the higher activation energy required (based on increased band gap) overwhelms the surface area effect. As the particle diameter increases, the band gap is reduced and therefore a lower activation energy is required. A bright line threshold cannot be determined from these data as it is expected that at some critical activation energy, surface area effects (or other forces) will begin to play a role thereby reducing the reaction rates for conventionally sized Pt catalysts.
ARCADIS Discussion of Results None
Nature of Size versus Effect Relationship (if applicable)
The catalytic reaction rate reaches a maximum at 38 nm.
Physico‐chemical Property Investigated:
Crystalline structure (structure)
Priority of Property: High
Relevant for A1 Project?: Yes
Type of nanomaterial (eg, nanometal, nanometal oxide):
Nanometal oxide
Particle Functionalization or Capping Agent (if applicable):
None
List Study Objective(s) Relevant to Investigated Physicochemical Property:
• Nanosized tin dioxide powders of different sizes were synthesized using co-precipitation method and the crystal structure, morphology, optical band gap and magnetic behavior were investigated.
Sharma et al. (2009)
Specific Details on Tested Nanomaterial(s)
• Tin dioxide (SnO2)
Details on Preparation Method of Nanomaterial(s):
• Ammonium hydroxide was added (drop wise) into the SnCl4.5H2O solution (0.01M) with stirring. The pH value was controlled via controlling the NH4OH concentration in the solution. The resultant white precipitates were
rinsed with de-ionized water and dried in air at 40 deg C.• Some part of the powder product, grown at pH 7, was annealed in air at 800 deg C for 4 hours.
Details on Tests Examining Physicochemical Property:
• La ce parameters were calculated using the following equa on:1/d^2 = (h^2 + k^2)/a^2 + l^2/c^2where:a and c = unit cell parametersd = interplanar distance
Individual Particle Diameters Tested (nm):
1.89 (pH 3), 3.94 (pH 7), 35.2 (annealed)
Solution characteristics (pH, cosolvents or other additives, sonication, ionic strength)
• pH: 3, 7• Cosolvents or other addi ves: None• Sonica on: Not performed• Ionic strength (conduc vity): No data
Min Diameter Tested (nm): 1.89
Max Diameter Tested (nm): 35.2
Specific Surface Area (SSA) (m2/g): No data
Bulk materials tested (≥ 1000 nm): No
Information on Analytical Methods Used to Determine Particle Size:
Particle diameters were assessed by X-Ray Diffraction using Cu-Ka radiation (λ = 0.1540 nm).
List of Relevant Findings: • The calculated lattice parameters (a) were calculated to be: 0.4740, 0.4738 and 0.4736 nm for pH 3, pH 7 and annealed SnO2 NPs, respec vely.• Par cle size has strong rela on with WFHM of the XRD peaks and the la ce
parameters of SnO2 nanocrystals. Furthermore, the lattice parameters of 3 pH grown SnO2 nanoparticles were higher than that of bulk SnO2 lattice parameters.
Page B-126 of 177
Appendix B: Copy of DatabaseSize versus Effect Relationship Observed by Authors?:
Yes
Mathematical Relationship Identified in Paper (if applicable):
La ce parameters were calculated using the following equa on:1/d^2 = (h^2 + k^2)/a^2 + l^2/c^2where:a and c = unit cell parametersd = interplanar distance
Author‐Identified 'Bright Line' Particle Size (diameter) Threshold (nm) ‐ List if applicable:
None
Notes on 'Bright Line' Threshold: As the particle diameter increases, the lattice parameter decreases. A 'bright line' threshold cannot be inferred from these data.
ARCADIS Discussion of Results None
Nature of Size versus Effect Relationship (if applicable)
The lattice parameter increases with decreasing particle diameter over the range 1.89 to 35.2 nm.
Physico‐chemical Property Investigated:
Crystalline structure (structure)
Priority of Property: High
Relevant for A1 Project?: Yes
Type of nanomaterial (eg, nanometal, nanometal oxide):
Nanometal
Particle Functionalization or Capping Agent (if applicable):
Iron oxide shell
List Study Objective(s) Relevant to Investigated Physicochemical Property:
• In this paper, x-ray absorption spectroscopy (XAS) was used to probe the local structure of the oxide phase in core-shell Fe/Fe oxide nanopar cles prepared by IGC and post-oxida on.• XAS measurements have been carried
out both at the Fe K edge and at the O K edge, thus studying Fe and O environments independently; the O edge data is selec vely sensi ve only to the oxide shell structure and thus unaffected by the a-Fe core contribu on.•
Samples with different core sizes in the 7–21 nm range have been investigated. The analysis of the spectra, in the near-edge as well as the extended absorption regions, unambiguously prove the existence of a correlation between the core size and the structure of the oxide shell, which can be explained on the basis of specific surface area and structural disorder arguments.
Signorini et al. (2003)
Specific Details on Tested Nanomaterial(s)
• Iron / Iron Oxide core-shell nanopar cles• Magne te (Fe3O4)• Maghemite (gamma-Fe2O3)
Details on Preparation Method of Nanomaterial(s):
• Iron nanoparticles were synthesized using the IGC technique: 99.98% pure iron was placed into a Joule-heated tungsten crucible and evaporated in presence of 133 Pa of He. Nanoparticles are formed by homogeneous
nuclea on of metallic vapors and convec on collects them onto a rota ng drum cooled by liquid nitrogen• The mean size of the nanoparticles was controlled by varying the evaporation rate by adjusting the evaporator heating current. In this way, three different samples were prepared: FeO7, FeO10, and FeO21, where the final number represents D, the average core diameter in nm units.
Details on Tests Examining Physicochemical Property:
• Measurements were performed at the Fe- and O-K edges.• For the Fe K edge, all measurements were performed in the transmission geometry at room temperature using nitrogen and argon filled ionization chambers to record the energy dependence of the incident and transmitted x ray flux. The powders to be measured were suspended in an organic solvent using an ultrasound bath and deposited on a cellulose membrane, following standard XAS procedures. The XANES region was measured using a minimum step of 0.1 eV, while the EXAFS region
was scanned so as to obtain a step in k-space smaller than 0.005 nm.• For the O K edge, both samples and reference oxides were smeared on carbon tabs and then placed on a sample holder consisting of a steel plate mounted on a vertical rotary feedthrough. The samples were polarized at 11000 V in order to avoid electrons excited by the photon beam reaching the photodiode detector. The energy step was 0.05 eV for the XANES spectra and 1 eV for the EXAFS ones and the acquisition time was 1 sec per point; due to the presence of the Fe L2,3 absorption edge it was possible to record the EXAFS data up to a maximum energy of ~705 eV, which corresponds to a wave vector of ~0.67 nm.
Individual Particle Diameters Tested (nm):
7 - 21
Solution characteristics (pH, cosolvents or other additives, sonication, ionic strength)
• pH: No data• Cosolvents or other addi ves: For K-edge measurements, NPs were suspended in an organic solvent.• Sonica on: For K-edge measurements, NPs were suspended in an organic solvent in an ultrasonic
bath.• Ionic strength (conduc vity): No data
Page B-127 of 177
Appendix B: Copy of DatabaseMin Diameter Tested (nm): 7
Max Diameter Tested (nm): 21
Specific Surface Area (SSA) (m2/g): No data
Bulk materials tested (≥ 1000 nm): No
Information on Analytical Methods Used to Determine Particle Size:
X-ray diffraction was carried out using a Philips PW710 diffractometer with Cu-Ka radiation (lambda = 0.154056 nm) and a graphite monochromator in the diffracted beam. The diffraction profiles were analyzed using the MAUD software package,10 which performs a Rietveld full profile fitting.
List of Relevant Findings: • There are size-dependent changes in the local structure and oxidation state of the oxide shell. At small particle sizes. the relative fraction of maghemite (gamma-Fe2O3) increased while the fraction of magnetite (Fe3O4)
decreased.• Analysis of O- and Fe-edge XANES spectra, and fi ng of the EXAFS data, clearly show that the structure and oxidation state of the oxide shell depend on the particle size. More precisely, small particles (D = 7-11 nm) are richer in maghemite while, with increasing core mean size, the shell becomes almost entirely composed by magnetite.
Size versus Effect Relationship Observed by Authors?:
Yes
Mathematical Relationship Identified in Paper (if applicable):
The overall concentration (Cvol) (volume fraction) of maghemite in the shell is a function of the core diameter D:Cvol(D) = INT(0,sigma)[rho(z)*(D/2 + sigma - z]^2 dz / INT(0,sigma)[(D/2 + sigma - z]^2 dzWhere:sigma =
the shell thicknessD = core diameterandrho(z) = e^(-z/lambda)^2Where:lambda = length parameter which quantifies the diffusion process and is proportional to the effective diffusion coefficient
Author‐Identified 'Bright Line' Particle Size (diameter) Threshold (nm) ‐ List if applicable:
11 < Threshold < 21
Notes on 'Bright Line' Threshold: Between core-particle sizes of 11 and 21 nm, the nanoparticle shell transitions from magnetite to maghemite (decreases oxidation state from Fe3+ to Fe2.5+.
ARCADIS Discussion of Results None
Nature of Size versus Effect Relationship (if applicable)
The oxidation state of the oxide shell increased as the particle size of the core decreases.
Physico‐chemical Property Investigated:
Crystalline structure (structure)
Priority of Property: High
Relevant for A1 Project?: Yes
Type of nanomaterial (eg, nanometal, nanometal oxide):
Inorganic compound
Particle Functionalization or Capping Agent (if applicable):
Alanine
List Study Objective(s) Relevant to Investigated Physicochemical Property:
• To study the transformation of In(OH)3 to In2O3 as a function of particle size.
Singh and Mehta (2005)
Specific Details on Tested Nanomaterial(s)
• Indium I(II) hydroxide (In(OH)3)
Page B-128 of 177
Appendix B: Copy of DatabaseDetails on Preparation Method of Nanomaterial(s):
• In(OH)3 nanoparticles were synthesized by the chemical capping method and the nanoparticle size was controlled by varying the relative concentration of the capping agent and reactant molecules. A 0. M solution of InCl3 in ethanol was added drop-wise to a 0.1 M solution of alanine in ammonia with continuous stirring at 80 deg C for 24 h. Nanoparticles were collected, washed several times in high-purity water to remove the excess ions (NH4+ and Cl-) and dried. The In(OH)3 nanoparticles were synthesized using capping-to-reagent ratios of 25:4, 10:4, and 1:4 (referred to as IH1, IH2 and IH3, respectively). These samples were dried at 80 deg C in air. In2O3 nanoparticles were prepared by heating IH1, IH2 and IH3 nanoparticles at 350 deg C and are referred to as IO1, IO2 and IO3, respectively.
Details on Tests Examining Physicochemical Property:
• In2O3 par cles were prepared by hea ng In(OH)3 nanopar cles at 350 deg C.• Thermo-gravimetric analysis (TGA) was conducted in ambient N2 at a heating rate of 10 deg C per min in a temperature range from 50 deg C to 500 deg C. A Phillips CM12 electron microscope was used for transmission electron microscopy (TEM) studies. Nanoparticles were dispersed ultrasonically in water and spread over polyvar-coated copper grids for TEM analysis. Nanoparticle samples for X-Ray diffraction (XRD) analysis were prepared by pressing the dried powder in a quartz plate groove. The average crystallite size was estimated from the x-ray line broadening using Scherrer's equation.
Individual Particle Diameters Tested (nm):
8, 11, 15
Solution characteristics (pH, cosolvents or other additives, sonication, ionic strength)
• pH: No data• Cosolvents or other addi ves: ethanol, ammonia• Sonica on: Not performed• Ionic strength (conductivity): No data
Min Diameter Tested (nm): 8
Max Diameter Tested (nm): 15
Specific Surface Area (SSA) (m2/g): No data
Bulk materials tested (≥ 1000 nm): No
Information on Analytical Methods Used to Determine Particle Size:
The sizes of In(OH)3 particles prior to and after the completion of transformation were obtained from X-ray diffraction (XRD) and transmission electron microscopy (TEM).
List of Relevant Findings: • Thermo-gravimetric analysis shows a sharp weight decrease (18%) around 215-285 deg C, which is consistent with the calculated weight loss of 16.3% for the transforma on of In(OH)3 to In2O3.• The endothermic peak
corresponding to In(OH)3 to In2O3 transformation shifts toward a lower temperature with the reduction in particle size from 15 nm to 8 nm.• For 15-nm nanopar cles (IO3) the transforma on takes place at 285 deg C while for 11-
and 8-nm samples the transformation temperature is 272 and 255 deg C, respectively. This is comparison to a value of ca. 350 to 400 deg C for larger-sized particles (reported elsewhere).
Size versus Effect Relationship Observed by Authors?:
Yes
Mathematical Relationship Identified in Paper (if applicable):
None
Author‐Identified 'Bright Line' Particle Size (diameter) Threshold (nm) ‐ List if applicable:
None
Notes on 'Bright Line' Threshold: Results are only reported for a particle size range of 8 to 15 nm, for which a continuous decrease in the transformation temperature with decreasing particle size was observed.
ARCADIS Discussion of Results None
Nature of Size versus Effect Relationship (if applicable)
The phase transformation temperature decreases with decreasing particle size.
Page B-129 of 177
Appendix B: Copy of Database
Physico‐chemical Property Investigated:
Crystalline structure (structure)
Priority of Property: High
Relevant for A1 Project?: Yes
Type of nanomaterial (eg, nanometal, nanometal oxide):
Nanometal oxide
Particle Functionalization or Capping Agent (if applicable):
None
List Study Objective(s) Relevant to Investigated Physicochemical Property:
• A detailed Raman analysis of CeO2 nanoparticles is presented here for a range of particle sizes and preparations; the increasing lattice constant (strain relative to the bulk) for successively smaller particles is seen to explain much of the Raman-spectrum changes with particle size, when the dispersion in the particle-size distribution and phonon confinement are also included.
Spanier et al. (2001)
Specific Details on Tested Nanomaterial(s)
• Cerium (IV) oxide (CeO2)
Details on Preparation Method of Nanomaterial(s):
• Solutions of 0.04M Ce(NO3)(3) and 0.5M HMT (C6H12N4, hexamethylenetetramine) reagents were mixed at room temperature with continuous stirring, producing nucleation and growth of CeO2(2-y) particles. Solutions were allowed to mix for different controlled lengths of time (5-24 h) and then placed in a centrifuge, yielding
nanopar cles.• The nanopar cle size was controlled by the length of the reac on me. To obtain the largest particles the mixing reaction was carried out for 12–24 h prior to centrifugation and the particles were then sintered in air at atmosphere at different temperatures (400–800 deg C) for 8–16 h.
Details on Tests Examining Physicochemical Property:
• The lattice parameter (a) was determined from fitting the x-ray diffraction peak position and the mean particle diameter from the peak width using the Scherrer formula.
Individual Particle Diameters Tested (nm):
ca. 6.1, ca. 7.4, ca. 10, ca. 15, ca. 25, ca. 5000
Solution characteristics (pH, cosolvents or other additives, sonication, ionic strength)
• pH: No data• Cosolvents or other addi ves: None• Sonica on: Not performed• Ionic strength (conduc vity): No data
Min Diameter Tested (nm): ca. 6.1
Max Diameter Tested (nm): ca. 5000
Specific Surface Area (SSA) (m2/g): No data
Bulk materials tested (≥ 1000 nm): Yes
Information on Analytical Methods Used to Determine Particle Size:
The resulting particle size, dispersion, and shapes were determined by transmission electron microscopy (TEM).
List of Relevant Findings: • The lattice parameters (a) were 0.54330, 0.54285, 0.54152, 0.54131, 0.54087 and 0.54087 nm for ca. 6.1, ca. 7.4, ca. 10, ca. 15, ca. 25 and ca. 5000 nm par cles, respec vely.• The la ce parameter (a) increased with decreasing
particle size over a range of particles from ca. 6.4 to ca. 25 nm. The lattice parameter (a) was the same for 25 and 5000 nm particles.
Size versus Effect Relationship Observed by Authors?:
Yes
Mathematical Relationship Identified in Paper (if applicable):
None
Author‐Identified 'Bright Line' Particle Size (diameter) Threshold (nm) ‐ List if applicable:
None
Notes on 'Bright Line' Threshold: Based on the lattice parameter decreasing with increasing particle size up until the 25 to 5000 nm range, a 'bright line' particle size threshold cannot be determined. However, it can be inferred that there is a value that is < 25 nm at which the lattice parameter no longer decreases with increasing particle size.
ARCADIS Discussion of Results None
Nature of Size versus Effect Relationship (if applicable)
The lattice parameter (a) increased with decreasing particle size over the range ca. 6.1 to ca. 25.
Page B-130 of 177
Appendix B: Copy of Database
Physico‐chemical Property Investigated:
Crystalline structure (structure)
Priority of Property: High
Relevant for A1 Project?: Yes
Type of nanomaterial (eg, nanometal, nanometal oxide):
Nanometal alloy
Particle Functionalization or Capping Agent (if applicable):
Polyvinyl pyrrolidone (PVP)
List Study Objective(s) Relevant to Investigated Physicochemical Property:
• This paper presents an experimental and thermodynamic analysis of the tendency of Ag and Ni atoms to mix to form a solid-solution face-centered cubic (fcc) structure as a function of particle size, for nanoparticles synthesized by co-reduction of Ag and Ni metal precursors in water.
Srivastava et al. (2011)
Specific Details on Tested Nanomaterial(s)
• Silver-Nickel (Ag-Ni)
Details on Preparation Method of Nanomaterial(s):
• To synthesize the nanoparticles, 0.54 g of nickel(II) nitrate (Ni(NO3)2), 0.5 g of silver nitrate (Ag(NO3)) and 1.36 g of polyvinyl pyrrolidone (PVP) were dissolved in 100 mL of distilled water. The mixture containing the metal precursors and PVP was stirred vigorously using a magnetic stirrer. Once this solution appeared clear, co-reduction of the metal precursors was facilitated by drop wise addition of the water solution of NaBH4 (containing 0.52 g of sodium borohydride (NaBH4) in 25 mL distilled water) over a period of 10 min. Once the color of the reaction
mixture turned black, s rring was stopped. A er the synthesis, the as-prepared par cles were covered with PVP.• To clean the nanoparticles, the reaction mixture was poured from the reaction flask into a beaker containing 100 ml ethanol and was left for more than 3 h. A black dispersion of particles collected at the bottom of the beaker and was then centrifuged at 5000 rpm for 10 min. The particles collected at the bottom of the centrifuge tube were then dispersed in distilled water for further analysis.
Details on Tests Examining Physicochemical Property:
• Average composition of the nanoparticle dispersion was determined by the energy dispersive spectroscopy (EDS) technique and scanning electron microscopy (SEM) using a Quanta ESEM instrument opera ng at 20 kV.• High-
resolution transmission electron microscopy (HRTEM)-based analysis of the nanoparticles was performed to investigate the microstructure.
Individual Particle Diameters Tested (nm):
• Size range 1: 3-7• Size range 2: 8-13• Size range 3: 14-20
Solution characteristics (pH, cosolvents or other additives, sonication, ionic strength)
Not applicable
Min Diameter Tested (nm): 3
Max Diameter Tested (nm): 20
Specific Surface Area (SSA) (m2/g): No data
Bulk materials tested (≥ 1000 nm): No
Information on Analytical Methods Used to Determine Particle Size:
Average composition of the nanoparticle dispersion was determined by the energy dispersive spectroscopy (EDS) technique and scanning electron microscopy (SEM) using a Quanta ESEM instrument operating at 20 kV.
List of Relevant Findings: • The mean composi on of Ni (at.%) for size ranges 1, 2 and 3 was 48 (± 26), 17 (± 14) and 11 (± 9)%.• High-resolution transmission electron microscopy (HRTEM) imaging revealed that the smaller particles (<7 nm) in the dispersion were essentially single phase. The interplanar spacing of (1 1 1) plane corresponding to a solid Ag/Ni 50/50 solution should be ~0.220 nm. The observed single-phase microstructure and interplanar spacing of ~0.22 nm for the representative ~6 nm (mean size of group 1) particle thus indicated the formation of a crystalline fcc
solid solu on between Ag and Ni atoms. 26), 17 (± 14) and 11 (± 9)%.• HRTEM analysis of bigger par cles (>10 nm) revealed a two-phase microstructure: (a) a phase with d spacing of 0.24 nm, which corresponds to the d spacing of (1 1 1) plane of a pure fcc Ag lattice; and (b) a phase with d spacing of 0.22 nm, which corresponds to the d spacing of (1 1 1) plane of Ag(50)Ni(50) fcc solid solution. Confirmatory TEM mapping images reveals N-rich
regions and Ag-rich regions.• Results from the HRTEM and EFTEM analysis thus indicate that the miscibility between Ag and Ni atoms is restricted only for smaller sizes (<7 nm) and a two-phase microstructure essentially consisting of Ag on the fcc solid solution of Ag(Ni) nanoparticles develops for the bigger particles.
Page B-131 of 177
Appendix B: Copy of DatabaseSize versus Effect Relationship Observed by Authors?:
Yes
Mathematical Relationship Identified in Paper (if applicable):
For all the particle sizes for which the Gss was less than Gmm, miscibility between Ag and Ni atoms with a resultant solid solu on with fcc structure can be expected.G(mm):G(mm) = x(Ag)*G(Ag) + x(Ni)*G(Ni) +
alpha(Ag)*S(Ag)*gamma(Ag)(D) + alpha(Ni)*S(Ni)*gamma(Ni)(D) + G(int)*DWhere:x(Ag) = the mole frac on of Agx(Ni) = the mole frac on of NiG(Ag) = the molar free energy of pure Ag (-12.72 kJ/mol)G(Ni) = the molar free
energy of pure Ni (-8.91 kJ/mol)AAg and ANi are the surface area of the pure Ag and pureNi phase, respec velyA = the total surface area of the model spherealpha(Ag) = the frac ons of surface atoms Ag vs. the total number of
atoms in the bulkalpha(Ni) = the frac on of surface atoms Ni vs. the total number of atoms in the bulkS(Ag) = the surface areas occupied by 1 mole of Ag atoms (4.35E4 m^2)S(Ni) = the surface areas occupied by 1 mole of Ni
atoms (3.24E4 m^2)gamma(Ag)(D) = the size-dependent specific surface energy (surface energy per unit area) of pure Ag spherical surfaces (calcu)gamma(Ni) = the size-dependent specific surface energy(surface energy per unit
area) of pure Ni spherical surfaces (calcu)D = the diameter of the par cle (the model sphere)G(int) = the Gibbs free energy contribution from the interface between the pure Ag andNi forming the model sphere.
Author‐Identified 'Bright Line' Particle Size (diameter) Threshold (nm) ‐ List if applicable:
7
Notes on 'Bright Line' Threshold: Smaller particles (<7 nm) consisted of a single-phase crystalline microstructure while larger particles consisted of a two-phase structure.
ARCADIS Discussion of Results Mathema cal Rela onship Iden fied in Paper (cont'd): G(ss):G(ss) = x(Ag)*G(Ag) + x(Ni) = delta-G(mix) + 2(2*gamma(ss)(D)*V(AgNi)/(D/2)Where:x(Ag) and x(Ni) = the atomic frac ons of Ag and Ni, respec velyGAg
and GNi = the molar free energies ofpure Ag and Ni, respec velydelta-G(mix) = the excess free energy of the alloy phase due to mixinggamma-(ss)(D) = the size-dependent specific surface energy (surface energy per unit
area) of the nanopar cle with solid solu on between Ag and Ni atomsV(AgNi) = the molar volume of fcc AgNi solid solu onD = the diameter of the par cle.The free energy of an alloy phase due to mixing (Dgmix) is given
by:delta-G(mix) = delta-H(mix) - T*delta-S(mix)Where:delta-H(mix) and delta-S(mix) = the enthalpy and entropy of mixing, respec vely.The entropy term for the solid solu on was taken as that of an ideal solid
solu on given by:delta-S(mix) = -R[x(Ag) + ln(x(Ag)) + x(Ni)*ln(x(Ni))Where:xAg and xNi are the atomic frac on of Ag and Ni, respec vely, and R is the gas constant.Using these qua ons, the G(mm) was found to equal the
G(ss) for Ag-Ni nanoparticles at a size of 7 nm, which matches the experimentally-determined value.
Nature of Size versus Effect Relationship (if applicable)
Crystalline phase for smaller nanoparticles; two-phase structure for larger particles.
Physico‐chemical Property Investigated:
Reactivity
Priority of Property: High
Relevant for A1 Project?: Yes
Type of nanomaterial (eg, nanometal, nanometal oxide):
Nanometal
Particle Functionalization or Capping Agent (if applicable):
None
List Study Objective(s) Relevant to Investigated Physicochemical Property:
• To investigate the size-dependent surface reaction rate of nanoparticles.
Strongin et al. (2005)
Specific Details on Tested Nanomaterial(s)
• Iron oxyhydroxide ((Fe3+)2O3.0.5H2O)
Details on Preparation Method of Nanomaterial(s):
• Horse spleen ferritin, which has a shell that is roughly spherical with a 12 nm outer diameter and a 8 nm internal diameter, was used to prepare ferrihydrite.
Details on Tests Examining Physicochemical Property:
• Atomic force and scanning tunneling microscopy were used as a tool for the characterization of these nanostructures and provided a range of information regarding surface topography and electronic structure. ATR-
FTIR spectroscopy was used to inves gate the reac vity of the par cles as a func on of size.• The reac ons of sulfur dioxide (with molecular oxygen) on different sizes of iron oxide and cobalt oxide nanoparticles were investigated in situ with this technique.
Individual Particle Diameters Tested (nm):
2-3, 5-6
Solution characteristics (pH, cosolvents or other additives, sonication, ionic strength)
• pH: No data• Cosolvents or other addi ves: No data• Sonica on: No data• Ionic strength (conduc vity): No data
Page B-132 of 177
Appendix B: Copy of DatabaseMin Diameter Tested (nm): 2
Max Diameter Tested (nm): 6
Specific Surface Area (SSA) (m2/g): No data
Bulk materials tested (≥ 1000 nm): No
Information on Analytical Methods Used to Determine Particle Size:
No data
List of Relevant Findings: • The surface reactions that led to the production of adsorbed sulfur oxyanions were found to be sensitive to the size of the nanoparticle substrate.
Size versus Effect Relationship Observed by Authors?:
Yes
Mathematical Relationship Identified in Paper (if applicable):
None
Author‐Identified 'Bright Line' Particle Size (diameter) Threshold (nm) ‐ List if applicable:
None
Notes on 'Bright Line' Threshold: The rate of surface reactions increased with decreasing particle size; however, no quantitative data were presented to allow for a 'bright line' threshold.
ARCADIS Discussion of Results Difficult to define size effect when only two sizes were tested.
Nature of Size versus Effect Relationship (if applicable)
The rate of surface reactions increased with decreasing particle size.
Physico‐chemical Property Investigated:
Reactivity
Priority of Property: High
Relevant for A1 Project?: Yes
Type of nanomaterial (eg, nanometal, nanometal oxide):
Nanometal
Particle Functionalization or Capping Agent (if applicable):
None
List Study Objective(s) Relevant to Investigated Physicochemical Property:
• To investigate the size-dependent surface reaction rate of nanoparticles.
Strongin et al. (2005)
Specific Details on Tested Nanomaterial(s)
• Cobalt oxide (CoO)
Details on Preparation Method of Nanomaterial(s):
• Listeria innocua ferritin-like protein, which has an inner cavity of diameter 5.6 nm, was used to prepare cobalt oxide nanoparticles.
Details on Tests Examining Physicochemical Property:
• Atomic force and scanning tunneling microscopy were used as a tool for the characterization of these nanostructures and provided a range of information regarding surface topography and electronic structure. ATR-
FTIR spectroscopy was used to inves gate the reac vity of the par cles as a func on of size.• The reac ons of sulfur dioxide (with molecular oxygen) on different sizes of iron oxide and cobalt oxide nanoparticles were investigated in situ with this technique.
Individual Particle Diameters Tested (nm):
2-3
Solution characteristics (pH, cosolvents or other additives, sonication, ionic strength)
• pH: No data• Cosolvents or other addi ves: No data• Sonica on: No data• Ionic strength (conduc vity): No data
Min Diameter Tested (nm): 2
Max Diameter Tested (nm): 3
Specific Surface Area (SSA) (m2/g): No data
Bulk materials tested (≥ 1000 nm): No
Information on Analytical Methods Used to Determine Particle Size:
No data
List of Relevant Findings: • The surface reactions that led to the production of adsorbed sulfur oxyanions were found to be sensitive to the size of the nanoparticle substrate.
Page B-133 of 177
Appendix B: Copy of DatabaseSize versus Effect Relationship Observed by Authors?:
Yes
Mathematical Relationship Identified in Paper (if applicable):
None
Author‐Identified 'Bright Line' Particle Size (diameter) Threshold (nm) ‐ List if applicable:
None
Notes on 'Bright Line' Threshold: The rate of surface reactions increased with decreasing particle size; however, no quantitative data were presented to allow for a 'bright line' threshold.
ARCADIS Discussion of Results The particle size range (1 nm) may be too small to infer any meaningful results.
Nature of Size versus Effect Relationship (if applicable)
The rate of surface reactions increased with decreasing particle size.
Physico‐chemical Property Investigated:
Reactivity
Priority of Property: High
Relevant for A1 Project?: Yes
Type of nanomaterial (eg, nanometal, nanometal oxide):
Nanometal
Particle Functionalization or Capping Agent (if applicable):
Aluminum oxide (Al2O3) layer
List Study Objective(s) Relevant to Investigated Physicochemical Property:
• The objectives of this study are, thus, to determine the effect of aluminum nanoparticle size and size distribution on the reactivity and kinetics of aluminum oxidation using differential scanning calorimetry (DSC).
Sun et al. (2006)
Specific Details on Tested Nanomaterial(s)
• Aluminum (Al) passivated with a layer of Al2O3
Details on Preparation Method of Nanomaterial(s):
• Nanoscale aluminum particles were obtained from Technanogy (Irvine, CA), and 3 um size aluminum particles (3–4.5 um, 97.5% purity) were purchased from Alfa Aesar (Milwaukee, WI).• Pure aluminum is pyrophoric, and
thus, each aluminum nanoparticle is passivated with a 2-4 nm Al2O3 layer to protect the particles from premature reaction.
Details on Tests Examining Physicochemical Property:
• Both a broad- and narrow-par cle size distribu on of Al nanopar cles was tested.• Differen al scanning calorimetry was performed using a Perkin-Elmer DSC-7 instrument with an ethylene glycol/water cooling system
maintained at 10 C.• For the reac on of aluminum par cles with oxygen, the runs were made under 25/75 oxygen/argon atmosphere.• For the MIC reac on of aluminum par cles with molybdenum trioxide, the runs were
Solution characteristics (pH, cosolvents or other additives, sonication, ionic strength)
Not applicable
Page B-134 of 177
Appendix B: Copy of DatabaseMin Diameter Tested (nm): 17
Max Diameter Tested (nm): 3,000
Specific Surface Area (SSA) (m2/g): No data
Bulk materials tested (≥ 1000 nm): Yes
Information on Analytical Methods Used to Determine Particle Size:
The average particle diameter and standard deviation were obtained from SEM images.
List of Relevant Findings: • There is a large exothermic reaction peak present for the nanoparticles prior to the aluminum melting peak at 660 deg C due to the oxidation of aluminum by oxygen, whereas for the micrometer size material, only a small exotherm is present prior to melting. The onset temperature for oxidation is also dramatically reduced for the nanopowders. In addition, compared with micrometer size sample, the melting peaks for the nano-sized samples are considerably smaller, suggesting that more aluminum in the nanopowders reacted in the oxidation process prior to melting. Hence, the reactivity of aluminum nanoparticles is considerably higher than that of the micrometer-size sample. The 52 nm broad size distribution sample showed a higher reactivity than the 43 nm narrow size distribution sample even though the average particle size is larger for the broad size distribution
sample.• The onset and peak temperatures for both Al/O2 and Al/MoO3 reac ons are affected by the par cle size distribution, and the temperatures for the narrow size distribution samples were approximately 50 deg C higher than those for broad size distribution samples; no effect of particle size was observed for onset and peak temperatures. On the other hand, the maximum reaction rate for both reactions depends on particle size, and with decreasing particle size, the maximum reaction rate increases.
Size versus Effect Relationship Observed by Authors?:
Yes
Mathematical Relationship Identified in Paper (if applicable):
None
Author‐Identified 'Bright Line' Particle Size (diameter) Threshold (nm) ‐ List if applicable:
None
Notes on 'Bright Line' Threshold: None
ARCADIS Discussion of Results For the Al/O2 reaction, the Qmax appears to increase for increasing particle size in the range of 60 - 100 nm and the same can be said for the Al/MoO3 reaction in the range of 40-100 nm.
Nature of Size versus Effect Relationship (if applicable)
The maximum oxidation reaction rate increased with decreasing particle size.
Physico‐chemical Property Investigated:
Reactivity
Priority of Property: High
Relevant for A1 Project?: Yes
Type of nanomaterial (eg, nanometal, nanometal oxide):
Nanometal
Particle Functionalization or Capping Agent (if applicable):
None
List Study Objective(s) Relevant to Investigated Physicochemical Property:
• The objectives of this study are, thus, to determine the effect of aluminum nanoparticle size and size distribution on the reactivity and kinetics of aluminum oxidation using differential scanning calorimetry (DSC).
Appendix B: Copy of DatabaseDetails on Preparation Method of Nanomaterial(s):
• Nanoscale aluminum particles were obtained from Technanogy (Irvine, CA), and 3 m size aluminum particles (3–4.5 m, 97.5% purity) were purchased from Alfa Aesar (Milwaukee, WI).• Pure aluminum is pyrophoric, and
thus, each aluminum nanoparticle is passivated with a 2–4 nm Al2O3 layer to protect the particles from premature reac on.• Molybdenum trioxide was obtained from Climax Molybdenum (Sahuarita, AZ) and is composed of
rectangular sheet like par cles approximately 1 m in length and 20 nm thick.• To make the MIC samples, an appropriate amount of aluminum and molybdenum trioxide were immersed in a solvent of hexanes hexanes and mixed using ultrasonic waves; no evidence of sintering is observed using our mixing method based on SEM measurements. The solution was poured into a glass container and after the solvent was completely evaporated the mixture was carefully collected and put in a vial for further use.
Details on Tests Examining Physicochemical Property:
• Both a broad- and narrow-par cle size distribu on of Al nanopar cles was tested.• Differen al scanning calorimetry was performed using a Perkin-Elmer DSC-7 instrument with an ethylene glycol/water cooling system
maintained at 10 C.• For the reac on of aluminum par cles with oxygen, the runs were made under 25/75 oxygen/argon atmosphere.• For the MIC reac on of aluminum par cles with molybdenum trioxide, the runs were
Solution characteristics (pH, cosolvents or other additives, sonication, ionic strength)
Not applicable
Min Diameter Tested (nm): 17
Max Diameter Tested (nm): 3,000
Specific Surface Area (SSA) (m2/g): No data
Bulk materials tested (≥ 1000 nm): Yes
Information on Analytical Methods Used to Determine Particle Size:
The average particle diameter and standard deviation were obtained from SEM images.
List of Relevant Findings: • For the reaction of Al NPs with MoO3, there is a large exothermic peak followed by a small aluminum melting peak, whereas for the sample containing micrometer-sized aluminum, there is only a small exothermic peak followed by a large melting peak, suggesting that reducing Al particle size can significantly increase the reactivity of
the Al/MoO3 MIC.• The onset and peak temperatures for both Al/O2 and Al/MoO3 reac ons are affected by the particle size distribution, and the temperatures for the narrow size distribution samples were approximately 50 deg C higher than those for broad size distribution samples; no effect of particle size was observed for onset and peak temperatures. On the other hand, the maximum reaction rate for both reactions depends on particle size, and with decreasing particle size, the maximum reaction rate increases.
Size versus Effect Relationship Observed by Authors?:
Yes
Mathematical Relationship Identified in Paper (if applicable):
None
Author‐Identified 'Bright Line' Particle Size (diameter) Threshold (nm) ‐ List if applicable:
None
Notes on 'Bright Line' Threshold: None
ARCADIS Discussion of Results The coefficient of variation on these figures on the right looks pretty high. In fact, for the Al/O2 reaction, the Qmax appears to increase for increasing particle size in the range of 60 - 100 nm and the same can be said for the Al/MoO3 reaction in the range of 40-100 nm.
Nature of Size versus Effect Relationship (if applicable)
The maximum oxidation reaction rate increased with decreasing particle size.
Page B-136 of 177
Appendix B: Copy of Database
Physico‐chemical Property Investigated:
Water solubility
Priority of Property: High
Relevant for A1 Project?: Yes
Type of nanomaterial (eg, nanometal, nanometal oxide):
Nanomineral
Particle Functionalization or Capping Agent (if applicable):
None
List Study Objective(s) Relevant to Investigated Physicochemical Property:
• Investigate the size effects on the dissolution of four different brushite seeds.
Tang et al. (2004)
Specific Details on Tested Nanomaterial(s)
• Four different brushite (CaHPO4∙2H2O) seeds in the size range of 10 to 200 microns were used in this study.
Details on Preparation Method of Nanomaterial(s):
No data
Details on Tests Examining Physicochemical Property:
• Dissolution experiments were performed in magnetically stirred (450 rpm, with hanging stirring bar) double-walled Pyrex vessels. The reaction solutions were prepared by slowly mixing calcium chloride and potassium dihydrogen phosphate with sodium chloride to maintain the ionic strength, I, at 0.15 mol/L. The pH was adjusted to the desired value for dissolution by using HCl or KOH. solution. Nitrogen, saturated with water vapor, was purged through the reaction solutions to exclude carbon dioxide. Dissolution was initiated by the introduction of a known mass of seed crystals. Titrant addition was potentiometrically controlled by the glass/calcium and reference electrodes. During dissolution, the electrode potentials were constantly compared with preset values and the differences, or error signals, activated motor-driven titrant burets. Thus a constant thermodynamic dissolution driving force was maintained. During the reactions, slurry samples were periodically withdrawn, filtered (0.22 mm Millipore filter) and the solutions analyzed for calcium and phosphate. The solids were examined by FTIR, SEM, X-ray diffraction and chemical analysis.
Individual Particle Diameters Tested (nm):
9, 20, 50, 180 micron
Solution characteristics (pH, cosolvents or other additives, sonication, ionic strength)
• pH: No data• Cosolvents or other addi ves: None• Sonica on: Not performed• Ionic strength (conduc vity): 0.15 mol/L
Min Diameter Tested (nm): 9 micron
Max Diameter Tested (nm): 180 micron
Specific Surface Area (SSA) (m2/g): No data
Bulk materials tested (≥ 1000 nm): No
Information on Analytical Methods Used to Determine Particle Size:
No data
List of Relevant Findings: • Large crystallites underwent continuous monotonic reaction until 100% of the added seed crystals were consumed. The dissolution rate was almost constant (2.4 +/- 0.3 mol m^2/min) during the entire dissolution reaction, a finding consistent with traditional dissolution theory. The smaller seed crystals always dissolved at lower rates after surface normalization and not all of the crystals dissolved; the resulting solids remained stable in the
undersaturated solu ons for long periods.• This abnormal dissolu on behavior was much more apparent for small crystallites; the fraction of undissolved solid increased markedly with decreasing initial crystallite sizes. For the smallest crystallites, A, only 65% of the added crystallites had dissolved at s=0.060 prior to the first dissolution suppression plateau and the corresponding fractions for the relatively larger seeds 20 and 50 nm were about 92% and 98%, respectively. Moreover, the dissolution rates of these small seeds decreased significantly during the reaction and this "self-inhibition was clearly related to crystallite size.
Page B-137 of 177
Appendix B: Copy of DatabaseSize versus Effect Relationship Observed by Authors?:
Yes
Mathematical Relationship Identified in Paper (if applicable):
None
Author‐Identified 'Bright Line' Particle Size (diameter) Threshold (nm) ‐ List if applicable:
None
Notes on 'Bright Line' Threshold: From the data presented, it is clear that a relationship exists between particle diameter and dissolution; namely that smaller particle diameters undergo partial dissolution. A 'bright line' particle size threshold cannot be determined from these data.
ARCADIS Discussion of Results Note that the particles were larger than nanoscale.
Nature of Size versus Effect Relationship (if applicable)
Dissolution decreased with decreasing particle size.
Physico‐chemical Property Investigated:
Crystalline structure (structure)
Priority of Property: High
Relevant for A1 Project?: Yes
Type of nanomaterial (eg, nanometal, nanometal oxide):
Nanometal oxide
Particle Functionalization or Capping Agent (if applicable):
None
List Study Objective(s) Relevant to Investigated Physicochemical Property:
• To measure lattice expansions in monodisperse CeO2-x nanoparticles.
Tsunekawa et al. (2000)
Specific Details on Tested Nanomaterial(s)
• Cerium dioxide (CeO2-x)• Ceria has the fluoritetypestructure, mixed valence ca ons in the bulk crystal
Details on Preparation Method of Nanomaterial(s):
• No data
Details on Tests Examining Physicochemical Property:
• Transmission electron microscopy (TEM) was used to obtain the size dependence of the lattice constant from the diffraction rings for CeO2-x nanoparticles in the size range of 2–8 nm.
Individual Particle Diameters Tested (nm):
No data
Solution characteristics (pH, cosolvents or other additives, sonication, ionic strength)
• pH: No data• Cosolvents or other addi ves: No data• Sonica on: No data• Ionic strength (conduc vity): No data
Min Diameter Tested (nm): 2
Max Diameter Tested (nm): 8
Specific Surface Area (SSA) (m2/g): No data
Bulk materials tested (≥ 1000 nm): No
Information on Analytical Methods Used to Determine Particle Size:
No data
List of Relevant Findings: • The increase in lattice constant with decreasing particle size in nanocrystalline CeO2-x particles is connected monotonically with the nominal lattice constant of a maximum size cluster of 14 CeO2 formula units, composed of Ce3+ ions, in spite of the variations strongly depending on the cluster (nominal particle) size. The nominal lattice
constant of clusters composed of Ce4+ ions, however, decreases with decreasing cluster size.• The data strongly suggest that the large lattice expansion in CeO2-x nanoparticles is related to the cluster structure with Ce3+ rather than Ce4+ ions. The charge reduction from +4 to +3 in Ce ions reasonably results in the lattice expansion due to the electrostatic force reduction.
Page B-138 of 177
Appendix B: Copy of DatabaseSize versus Effect Relationship Observed by Authors?:
Yes
Mathematical Relationship Identified in Paper (if applicable):
The log-log plot of the change in la ce constant, Da, vs the par cle size, D, shows a rela on of the form:delta-a = 0.0324*D^1.06 (nm) for ceria nanopar clesWhere:delta-a = a - a(0) and a and a(0) are the la ce constants of
the nanoparticles and the bulk crystal (0.5411 nm) at room temperature.
Author‐Identified 'Bright Line' Particle Size (diameter) Threshold (nm) ‐ List if applicable:
None
Notes on 'Bright Line' Threshold: The lattice parameters increase with decreasing particle size in a linear manner; therefore, a 'bright line' particle size threshold cannot be determined for CeO2-x.
ARCADIS Discussion of Results None
Nature of Size versus Effect Relationship (if applicable)
The lattice parameters increased with decreasing particle size.
Physico‐chemical Property Investigated:
Crystalline structure (structure)
Priority of Property: High
Relevant for A1 Project?: Yes
Type of nanomaterial (eg, nanometal, nanometal oxide):
Nanometal alloy
Particle Functionalization or Capping Agent (if applicable):
None
List Study Objective(s) Relevant to Investigated Physicochemical Property:
• To measure lattice expansions in single barium titanate nanoparticles.
Tsunekawa et al. (2000)
Specific Details on Tested Nanomaterial(s)
• Barium tanate (BaTiO3)• Barium tanate has the perovskite-type structure, not mixed valence ca ons, and is the most extensively investigated material among ferroelectrics.
Details on Preparation Method of Nanomaterial(s):
• No data
Details on Tests Examining Physicochemical Property:
• Transmission electron microscopy (TEM) was used to obtain the size dependence of the lattice constant from the diffraction rings for BaTiO3 nanoparticles in the size range of 15–250 nm.
Individual Particle Diameters Tested (nm):
No data
Solution characteristics (pH, cosolvents or other additives, sonication, ionic strength)
• pH: No data• Cosolvents or other addi ves: No data• Sonica on: No data• Ionic strength (conduc vity): No data
Min Diameter Tested (nm): 15
Max Diameter Tested (nm): 250
Specific Surface Area (SSA) (m2/g): No data
Bulk materials tested (≥ 1000 nm): No
Information on Analytical Methods Used to Determine Particle Size:
No data
List of Relevant Findings: • The lattice constant (a) in BaTiO3 nanoparticles monotonically increases with decreasing particle size, while the lattice constant (c) decreases slightly with decreasing size and ceases to exist for particle sizes less than 80 nm in diameter.
Page B-139 of 177
Appendix B: Copy of DatabaseSize versus Effect Relationship Observed by Authors?:
Yes
Mathematical Relationship Identified in Paper (if applicable):
A semilogarithmic plot of the change in the lattice constant, delta-a, against the particle size, D, shows a relation of:delta-a = 0.0166 - 0.00234 * lnD' (nm) for BaTiO3 nanopar cles.Where:delta-a = a - a(o) and a(0) is the
lattice constant (0.39920 nm) of the bulk crystal.
Author‐Identified 'Bright Line' Particle Size (diameter) Threshold (nm) ‐ List if applicable:
80
Notes on 'Bright Line' Threshold: The lattice parameter (c) becomes 0 for particle sizes smaller than 80 nm (ferroelectric to tetragonal phase transition size).
ARCADIS Discussion of Results Lattice parameter (c) ceasing to exist (as mentioned in the text and said to be shown in Figure 2A, and relationship to the ferroelectric to tetragonal phase transformation is unclear.
Nature of Size versus Effect Relationship (if applicable)
The lattice parameter (a) monotonically increased with decreasing particle size while the lattice constant (c) decreases slightly with decreasing size and ceases to exist for particle sizes less than 80 nm in diameter.
Physico‐chemical Property Investigated:
Crystalline structure (structure)
Priority of Property: High
Relevant for A1 Project?: Yes
Type of nanomaterial (eg, nanometal, nanometal oxide):
Nanometal oxide
Particle Functionalization or Capping Agent (if applicable):
None
List Study Objective(s) Relevant to Investigated Physicochemical Property:
• The researchers estimated the thickness of the surface layer from the size dependence of the lattice parameters based on the shell and core structures and examined the change in the lattice parameters depending on the method which was used to prepare the particles.
Tsunekawa et al. (2004)
Specific Details on Tested Nanomaterial(s)
• Cerium oxide (Ce2O3)• CeO(2) core and Ce(2)O(3) shell
Details on Preparation Method of Nanomaterial(s):
• Cerium oxide hydrochloric acid solutions were synthesized by gel-sol process and hydrothermal reaction, and monosized by ultrafiltration with a membrane and successive fractionation with a surfactant.
Details on Tests Examining Physicochemical Property:
• Lattice parameters were estimated by the least-squares method with a set of data, Miller indices, hkl, and lattice distances, d(hkl), where d(hkl)=(L*lambda)/r; L is the camera length which was carefully calibrated in order to calculate exact lattice distances using the diffraction pattern of gold particles (>100 nm in diameter), lambda is the electron wavelength 0.00251 nm at an accelerated voltage of 200 kV, and r is the radius of the diffraction ring
obtained by an electron microscope.• The dependence of the la ce parameters on par cle size is obtained by x-ray and electron diffraction analysis.
Individual Particle Diameters Tested (nm):
2.1, 3.8, 6.7, 15, ≥1000
Solution characteristics (pH, cosolvents or other additives, sonication, ionic strength)
• pH: No data• Cosolvents or other addi ves: No data• Sonica on: No data• Ionic strength (conduc vity): No data
Min Diameter Tested (nm): 2.1
Max Diameter Tested (nm): ≥1000
Specific Surface Area (SSA) (m2/g): No data
Bulk materials tested (≥ 1000 nm): Yes
Information on Analytical Methods Used to Determine Particle Size:
No data
List of Relevant Findings: • The lattice parameter (a) decreases in a size-dependent manner as the particle diameter increases.
Page B-140 of 177
Appendix B: Copy of DatabaseSize versus Effect Relationship Observed by Authors?:
Yes
Mathematical Relationship Identified in Paper (if applicable):
delta-a = 0.0324*D^(-1.04)Where:delta-a = a - a(0)a(0) = la ce parameter of bulk CeO2 (0.5411 nm)D = par cle diameterOr alterna vely (using data from Wu et al. (2004)):delta-a = 0.06*D^(-1.05)
Author‐Identified 'Bright Line' Particle Size (diameter) Threshold (nm) ‐ List if applicable:
No
Notes on 'Bright Line' Threshold: The lattice parameter increased in a size-dependent manner with decreasing particle size; however, a 'bright line' particle size threshold cannot be determined.
ARCADIS Discussion of Results This study found that the lattice parameter increases with decreasing particle diameter. This is the opposite trend observed in most of the literature. As the particle size of CeO2 nanoparticles decreases, at a size of ca. 1.4 nm, the valence state of the Ce ions changes from 4.0 to 3.0, meaning that CeO2 transitions to Ce2O3. This decrease in cation valence state results in a lattice expansion due to the increase of the effective atomic radii.
Nature of Size versus Effect Relationship (if applicable)
Lattice parameter increases with decreasing particle size over the range 2.1. to 6.7 nm.
Physico‐chemical Property Investigated:
Reactivity
Priority of Property: High
Relevant for A1 Project?: Yes
Type of nanomaterial (eg, nanometal, nanometal oxide):
Supported nanometal
Particle Functionalization or Capping Agent (if applicable):
None
List Study Objective(s) Relevant to Investigated Physicochemical Property:
• To investigate the size-dependence of free Pt nanocrystals and MCF-17-supported Pt nanocatalysts on ethylene hydrogenation.
Tsung et al. (2009)
Specific Details on Tested Nanomaterial(s)
• Pla num (Pt) nanocrystals• MCF-17 (silica)-supported Pt catalysts
Details on Preparation Method of Nanomaterial(s):
• A total of 0.05 mmol of Pt ions (NH4)2Pt(IV)Cl6 and (NH4)2Pt(II)Cl4), 0.75 mmol of tetramethylammonium bromide, and 1.00 mmol of poly(vinylpyrrolidone) (in terms of the repeating unit; Mw 29,000) were dissolved into
10 mL of ethylene glycol in a 25 mL round-bo om flask at room temperature.• The mixed solu on was heated to 180 deg C in an oil bath at 60 deg C/min. The solutions were held at these respective temperatures for 20 min under argon protection and magnetic stirring, resulting in a dark brown solution. After the solution was cooled to room temperature, acetone (90 mL) was then added to form a cloudy black suspension, which was separated by centrifugation at 3000 rpm for 10 min. The black product was collected by discarding the colorless supernatant. The products were further washed three times by precipitation/dissolution (redispersed in 20 mL of ethanol and then precipitated by adding 80 mL of hexanes). The nanocrystals were then redispersed in 10 mL of ethanol for
characteriza on and catalyst prepara on.• Pt colloidal solu on (1 mg/mL) was diluted by ethanol (0.1 mg/mL). The desired amount of solution (0.25 wt % Pt) was added to mesoporous MCF-17 and sonicated for 3 h at room temperature by a commercial ultrasonic cleaner. The brown precipitates were separated by centrifugation (3000 rpm, 20 min), thoroughly washed with ethanol two more times, and dried in an oven at 373 K overnight.
Details on Tests Examining Physicochemical Property:
• Shape, size, and lattice structure of the nanocrystals were analyzed by transmission electron microscopy (TEM) and high-resolu on TEM (HRTEM). X-ray photoelectron spectroscopy (XPS) experiments were also performed.•
For catalytic studies, samples were diluted with low surface area quartz and loaded into glass reactors. Temperature was controlled by a PID controller and a type-K thermocouple. Gas flows were regulated using calibrated mass flow controllers. Before the reaction, samples were reduced in 50 mL/min of 76 Torr of H2 with a He balance for 1 h at 100 deg C. For ethylene hydrogenation, the gases were 10 Torr of ethylene, 100 Torr of H2 with a balance of He. For pyrrole hydrogenation, the feed was 4 Torr of pyrrole and 400 Torr of H2 with a balance of He. The desired partial pressure of pyrrole was achieved by bubbling He through pyrrole and assuming saturation. For both reactions, gas composition was analyzed with flame ionization (FID) and thermal conductivity (TCD) detectors on a HP 5890 Series II gas chromatograph (GC). Turnover frequencies were determined by normalizing the conversion to the number of Pt surface atoms determined by hydrogen chemisorption.
Individual Particle Diameters Tested (nm):
3.5, 5, 6, 7, 9
Solution characteristics (pH, cosolvents or other additives, sonication, ionic strength)
• pH: No data• Cosolvents or other addi ves: ethylene glycol, ethanol• Sonica on: Pt on MCF-17 catalysts were sonicated for 3 h at room temperature.• Ionic strength (conduc vity):
Page B-141 of 177
Appendix B: Copy of DatabaseMin Diameter Tested (nm): 3.5
Max Diameter Tested (nm): 9
Specific Surface Area (SSA) (m2/g): No data
Bulk materials tested (≥ 1000 nm): No
Information on Analytical Methods Used to Determine Particle Size:
Particle sizes were analyzed by transmission electron microscopy (TEM) and high-resolution TEM (HRTEM). X-ray photoelectron spectroscopy (XPS) experiments were also performed.
List of Relevant Findings: • The activity of the 5 nm single-digit nanocrystal then was much higher than that of the 9 nm nanocrystals. This result unambiguously revealed the advantage of the smaller nanocrystals. The number of active sites was significantly increased, without sacrificing the shape, when the size of the nanocrystals decreased in the single-digit nanometer region.
Size versus Effect Relationship Observed by Authors?:
Yes
Mathematical Relationship Identified in Paper (if applicable):
None
Author‐Identified 'Bright Line' Particle Size (diameter) Threshold (nm) ‐ List if applicable:
None
Notes on 'Bright Line' Threshold: The catalytic activity of silica-supported Pt nanocatalysts over the range 3.5 to 9 nm increases with decreasing particle size. A 'bright line' particle size threshold cannot be determined from these data.
ARCADIS Discussion of Results None
Nature of Size versus Effect Relationship (if applicable)
The catalytic activity increases with decreasing particle size.
Physico‐chemical Property Investigated:
Crystalline structure (structure)
Priority of Property: High
Relevant for A1 Project?: Yes
Type of nanomaterial (eg, nanometal, nanometal oxide):
Nanometal alloy oxide
Particle Functionalization or Capping Agent (if applicable):
None
List Study Objective(s) Relevant to Investigated Physicochemical Property:
• To investigate the effects of particle size on the crystal structure and the Curie temperature of BaTiO(3) powder.
Uchino et al. (1989)
Specific Details on Tested Nanomaterial(s)
• Barium titanate (BaTiO(3))
Details on Preparation Method of Nanomaterial(s):
• BaTiO(3) particles were prepared by three different methods: a hydrothermal method, a coprecipitation method and a solid-state reac on.• Hydrothermal NPs were either not fired or fired at 400, 600 or 800 deg C.
Coprecipitation NPs were fired at 900, 1000 or 1050 deg C and solid-state particles were fired at 1100 deg C.
Details on Tests Examining Physicochemical Property:
• The tetragonal lattice parameters, (a) and (c), were determined by X-ray CuK-alpha diffraction using (200) and (002) peaks. The measurements were performed at several elevated temperatures. The temperature of the sample holder was controlled by a ceramic heater which can heat the sample to 200 deg C. The temperature of the sample is monitored on the surface of the packed powder. The temperature at which the splitting of the (200) of (002) reflections disappeared was taken as the Curie temperature.
Individual Particle Diameters Tested (nm):
120, 120, 140, 160, 180, 220, 300 and 1000
Solution characteristics (pH, cosolvents or other additives, sonication, ionic strength)
• pH: No data• Cosolvents or other addi ves: No data• Sonica on: No data• Ionic strength (conduc vity): No data
Page B-142 of 177
Appendix B: Copy of DatabaseMin Diameter Tested (nm): 100
Max Diameter Tested (nm): 1000
Specific Surface Area (SSA) (m2/g): 8.5, 8.2, 7.2, 6.0, 5.5, 4.6, 3.3, 1.0
Bulk materials tested (≥ 1000 nm): Yes
Information on Analytical Methods Used to Determine Particle Size:
The particle size was determined by two methods. The specific surface areas of three powders were measured, and the SSA diameter was calculated from the SSA value. The crystallite size was also estimated using Scherrer's formula from the half-maximum full-width (HMFW) values of the (200) reflections of XRD patterns taken for each sample.
List of Relevant Findings: • With decreasing particle size, the tetragonality decreases gradually at first with a drastic drop in the c/a ratio to 1.00 (i.e., cubic) at 120 nm.• The tetragonality decreases with increasing temperature and exhibits an abrupt
change at c/a = 1.0025 into the cubic state.
Size versus Effect Relationship Observed by Authors?:
Yes
Mathematical Relationship Identified in Paper (if applicable):
None
Author‐Identified 'Bright Line' Particle Size (diameter) Threshold (nm) ‐ List if applicable:
120 < Threshold < 140
Notes on 'Bright Line' Threshold: The tetragonal phase converts to a cubic phase at a particle diameter of 120 nm.
ARCADIS Discussion of Results None
Nature of Size versus Effect Relationship (if applicable)
The tetragonality decreases with decreasing particle size.
Physico‐chemical Property Investigated:
Reactivity
Priority of Property: High
Relevant for A1 Project?: Yes
Type of nanomaterial (eg, nanometal, nanometal oxide):
Nanometal
Particle Functionalization or Capping Agent (if applicable):
None
List Study Objective(s) Relevant to Investigated Physicochemical Property:
• To address the basic issues relating to the structure sensitivity of CO oxidation over supported Au catalysts, we investigated the reaction of CO and O2 on Au clusters of varying size supported on TiO2(110)
Valden et al. (1998)
Specific Details on Tested Nanomaterial(s)
• Gold (Au)• Supported on TiO(2)
Details on Preparation Method of Nanomaterial(s):
• The Au/TiO2 catalysts were prepared by deposition-precipitation method.
Details on Tests Examining Physicochemical Property:
No data
Individual Particle Diameters Tested (nm):
1 - 6
Solution characteristics (pH, cosolvents or other additives, sonication, ionic strength)
• pH: No data• Cosolvents or other addi ves: No data• Sonica on: No data• Ionic strength (conduc vity): No data
Min Diameter Tested (nm): 1
Max Diameter Tested (nm): 6
Specific Surface Area (SSA) (m2/g): No data
Bulk materials tested (≥ 1000 nm): No
Information on Analytical Methods Used to Determine Particle Size:
The average cluster diameters were measured by transmission electron microscopy.
List of Relevant Findings: • The reaction studies of this surface indeed show a marked size effect of the catalytic activity of the supported Au clusters for the CO oxidation reaction, with Au clusters in the range of 3.5 nm exhibiting the maximum reactivity.
Page B-143 of 177
Appendix B: Copy of DatabaseSize versus Effect Relationship Observed by Authors?:
Yes
Mathematical Relationship Identified in Paper (if applicable):
None
Author‐Identified 'Bright Line' Particle Size (diameter) Threshold (nm) ‐ List if applicable:
3.5
Notes on 'Bright Line' Threshold: The maximum catalytic activity of gold nanoparticles occurred at a size of 3.5 nm.
ARCADIS Discussion of Results None
Nature of Size versus Effect Relationship (if applicable)
Catalytic activity increases with decreasing particle size.
Physico‐chemical Property Investigated:
Reactivity
Priority of Property: High
Relevant for A1 Project?: Yes
Type of nanomaterial (eg, nanometal, nanometal oxide):
Nanomineral
Particle Functionalization or Capping Agent (if applicable):
None
List Study Objective(s) Relevant to Investigated Physicochemical Property:
• To characterize the reac vity of magne te toward carbon tetrachloride (CCl4).• To study the importance of magnetite particle size and aggregation effects for reactivity.
Vikesland et al. (2007)
Specific Details on Tested Nanomaterial(s)
• Magnetite (Fe3O4)
Details on Preparation Method of Nanomaterial(s):
• Nanoparticulate magnetite (9 nm) was synthesized in the 95%/5%N2/H2 atmosphere of an anaerobic glovebox by drop wise addition of a mixture of 0.2M FeCl3 and 0.1M FeCl2 to a well-mixed solution of 1 M NaOH in 1MNaCl. Mixing was maintained by use of an overhead mixer, glass stirring shaft, and PTFE blade. To remove excess salts, precipitated nanoparticles were magnetically separated, decanted, and rinsed with deaerated water at least three times. Following the final rinse, the particles were diluted with water and stored in a polypropylene container in the anaerobic glovebox. The final suspension pH was between 10.5 and 11.5. Larger magnetite particles (80 nm) were synthesized my methods reported elsewhere.
Details on Tests Examining Physicochemical Property:
• Kinetic experiments were conducted by exposing magnetite solutions to CCl4. Chloroform (CHCl3) is one of the primary products formed by CCl4 reduction, so kinetic experiments were also conducted with CHCl3 to determine if the particles could reduce CHCl3. One experiment was conducted using trichloroethylene (TCE) to determine if magnetite could reduce this compound. The experiments with both CHCl3 and TCE indicated that neither compound was readily reduced by 9 nm magnetite after 120 h. No further experiments were conducted with either
species.• All reac vity experiments were carried out in ~61 mL glass vials that were stored in the anaerobic chamber and allowed to equilibrate for a minimum of 24 h. Reactor vials were prepared by mixing an aliquot of magnetite stock with 50 mM HEPES-buffered water at a given ionic strength under headspace free conditions. Particle concentrations ranged from 1 to 10 g/L, with most experiments at 5 g/L. The pH was set by adding NaOH or HCl into each reactor until the desired pH was achieved. The vials were capped and sealed with aluminum seals and PTFE lined septa. Prepared vials were equilibrated for a period of 8-96 h prior to spiking them with an aliquot of
CCl4, CHCl3, or TCE (each in 100% methanol).• Following compound addi on, the reactors were removed from the glovebox and placed on a bottle roller. 250 uL samples of supernatant was withdrawn and mixed with 2.75 mL of deionized water in a 20 mL glass vial. The vials were capped and sealed with aluminum caps and septa. Control reactors without magnetite were set up for each experiment under identical solution conditions. CCl4, CHCl3, and TCE were quantified by headspace analysis using a headspace gas analyzer and carbon monoxide was measured using a reduced gas analyzer.
Individual Particle Diameters Tested (nm):
9, 80
Solution characteristics (pH, cosolvents or other additives, sonication, ionic strength)
• pH: 7, 7.8• Cosolvents or other addi ves: None• Sonica on: Not performed• Ionic strength (conduc vity): No data
Page B-144 of 177
Appendix B: Copy of DatabaseMin Diameter Tested (nm): 9
Max Diameter Tested (nm): 80
Specific Surface Area (SSA) (m2/g): No data
Bulk materials tested (≥ 1000 nm): No
Information on Analytical Methods Used to Determine Particle Size:
The par cle size and morphology of thesynthesized par cles were characterized by X-ray diffrac on (XRD), Brunauer-Emmett Teller (BET) surface area analysis, and transmission electron microscopy (TEM).
List of Relevant Findings: • Under identical solution conditions, the km values for CCl4 degradation are higher for 9 nm magnetite than those for 80 nm magnetite. Some of the difference in reaction rates can be accounted for by the larger available surface area of the 9 nm suspension. However, even after normalization by SABET, the calculated kSA values for the 9 nm particles remain an order of magnitude larger than those for 80 nm magnetite. The higher rates observed with 9 nm magnetite could be the result of differences in the available reactive surface area for suspensions of different particle sizes, quantum confinement effects, or differences in the diffusive availability of FeII in each suspension.
Size versus Effect Relationship Observed by Authors?:
Yes
Mathematical Relationship Identified in Paper (if applicable):
The higher rates observed with 9 nm magnetite could be the result of differences in the available reactive surface area for suspensions of different particle sizes, quantum confinement effects, or differences in the diffusive availability of FeII in each suspension. To evaluate this later possibility, particle conversion rates estimated using a diffusion in a sphere model were used to calculate theoretical CCl4 reduction rates as a function of particle radius. Under the boundary condition that FeII is immediately oxidized when it reaches the surface, this model can be
wri en as:M(t)/M(infinity) = 6*Pi^(-1/2)*(D(t)/r^2)^(1/2) - 3*(D(t)/r^2)Where:M(t)/M(infinity) is the frac onal conversion of magne te into maghemite at me tD is the diffusion coefficient for Fe II within the
crystalline matrix (approximately 1.25 x 10^-20 cm2/s) r is the particle radius
Author‐Identified 'Bright Line' Particle Size (diameter) Threshold (nm) ‐ List if applicable:
None
Notes on 'Bright Line' Threshold: Magnetite particles of size 9 and 80 nm were tested and the catalytic reaction rate was higher for 9 nm particles. A 'bright line' particle size threshold cannot be established from these data.
ARCADIS Discussion of Results Difficult to define size effect based on testing only two sizes.
Nature of Size versus Effect Relationship (if applicable)
The catalytic degradation rate of CCl4 to CHCl3 increases with decreasing particle size of the catalyst.
Physico‐chemical Property Investigated:
Photocatalytic activity
Priority of Property: High
Relevant for A1 Project?: Yes
Type of nanomaterial (eg, nanometal, nanometal oxide):
Nanometal
Particle Functionalization or Capping Agent (if applicable):
None
List Study Objective(s) Relevant to Investigated Physicochemical Property:
• To investigate the particle size effect on nanocrystalline TiO2 photocatalysts.
Wang et al. (1997)
Specific Details on Tested Nanomaterial(s)
• Titanium dioxide (TiO2)• The HA and HB par cles were mostly anatase with a small amount of brookite• The SA particles were pure anatase
Page B-145 of 177
Appendix B: Copy of DatabaseDetails on Preparation Method of Nanomaterial(s):
• Nanocrystalline TiO2 were prepared through sol-gel hydrolysis precipitation of titanium isopropoxide followed by hydrothermal treatment or post calcination. The as- precipitated gel was amorphous. In hydrothermal treatment, the nanocrystalline TiO2 samples obtained were labeled as HA (6 nm) and HB (11 nm), respectively while in the post calcination route, the powder derived was labeled as SA.
Details on Tests Examining Physicochemical Property:
• The photocatalytic degradation of CHCl3 over these nanocrystalline TiO2 was conducted in an immersion-type batch reactor. The UV photon intensity was calculated to be about 5 x 10^18 photons/second from data supplied by the lamp manufacturer. For each experimental run, 0.125 g TiO2 catalyst was added to 250 mL of 1.2 x 10^-2 M CHCl3 solution, and O2 was bubbled, through the reaction media during the experiment. The degradation of CHCl3 at room temperature was monitored by measuring the chloride ions generated in the liquid phase with a chloride ion selective electrode. Photolysis experiment in which no photocatalyst was added was also performed, and this background activity was subtracted to yield the photoreactivity results for the various photocatalytic measurements.
Individual Particle Diameters Tested (nm):
6, 11, 21
Solution characteristics (pH, cosolvents or other additives, sonication, ionic strength)
• pH: pH 2 to break agglomerates prior to measuring UV-visible absorp on spectra• Cosolvents or other additives: hydrothermally treated suspension of NPs was then centrifuged for powder separation, washed several
mes with ethanol to minimizeagglomera
Min Diameter Tested (nm): 6
Max Diameter Tested (nm): 21
Specific Surface Area (SSA) (m2/g): 70 - 253
Bulk materials tested (≥ 1000 nm): No
Information on Analytical Methods Used to Determine Particle Size:
• X-ray diffraction (XRD) patterns of the powders were collected with a Siemens D5000 diffractometer. Average grain sizes were calculated from XRD peak broadening using Scherrer's equation. Transmission electron microscopy (TEM) was performed on a JEOL 200CX microscope operating at 200 kV. Nitrogen adsorption was employed to
characterize the surface area of the materials using a Micromeri cs ASAP 2000.• BET surface areas were measured by N2 adsorption.
List of Relevant Findings: • HB which has high surface area (157 m2/g) and the intermediate grain size (11 nm) has the highest photoactivity. • Compared to HB, catalyst HA with a finer grain size of 6 nm and a higher surface area has a lower activity. Since the charge carrier recombination rate is mostly determined by the quantity of surface defects in semiconductor, it is thought that the potentially high surface reactivity from the ultrahigh surface area is offset by the high charge carrier surface recombination rate in these quantum-sized particles. Also, the photoactivity of HA levels out after the first half hour of irradiation. It seems that this ultrafine material is more surface sensitive to changes in the
reac on medium such as CI- concentra on and sol pH.• On the other hand, photoreac vity also decreases with particle size larger than 11 nm (SA, 21 nm). Consequently, the intermediate-sized TiO2 (sample HB) is the best photocatalyst in the decomposition of CHCI3.
Size versus Effect Relationship Observed by Authors?:
Yes
Mathematical Relationship Identified in Paper (if applicable):
None
Author‐Identified 'Bright Line' Particle Size (diameter) Threshold (nm) ‐ List if applicable:
11
Notes on 'Bright Line' Threshold: The intermediate particle size, 11 nm, provided the highest rate of photocatalytic activity. As the particle size either increased or decreased the reaction rate decreased. Therefore, while 11 nm appears to be an optimal particle size for TiO2-photocatalysis of CHCl3.
ARCADIS Discussion of Results None
Nature of Size versus Effect Relationship (if applicable)
The highest photoactivity was observed for the intermediate particle size of 11 nm (maximum).
Page B-146 of 177
Appendix B: Copy of Database
Physico‐chemical Property Investigated:
Reactivity
Priority of Property: High
Relevant for A1 Project?: Yes
Type of nanomaterial (eg, nanometal, nanometal oxide):
Core-shall carbon supported nanometal
Particle Functionalization or Capping Agent (if applicable):
None
List Study Objective(s) Relevant to Investigated Physicochemical Property:
• This study examined the core-shell nanocatalysts made by Pt monolayer depositions on Pd and Pd3Co cores using a Z-contrast scanning transmission electron microscope (STEM) equipped with an element-sensitive electron
energy loss spectrometer (EELS).• Density func onal theory (DFT) calcula ons were carried out using a nanoparticle model that allows surface atoms fully relaxed in all directions for an in-depth understanding of how the particle’s size affects the oxygen reduction reaction (ORR) activity.
Wang et al. (2009a)
Specific Details on Tested Nanomaterial(s)
• Core: Carbon supported palladium (PdC)• Shell: Pla num (Pt) of various thickness
Details on Preparation Method of Nanomaterial(s):
• The carbon-supported Pd catalyst was synthesized using a colloidal approach and then annealed at 350 deg C for 30 min.
Details on Tests Examining Physicochemical Property:
• These catalysts were dispersed in ultrapure water by sonication and loaded on a polished glassy carbon-disk electrode without Nafion. About 10-40 potential cycles between 0.05 and 1.15 V were carried out in Ar-saturated
0.1 M HClO4 solu on un l stable voltammetry curves were obtained.• Pt-shells with controlled morphology and thickness were generated on a Pd-core utilizing a Cu-UPD mediated electrodeposition model. K2PtCl4 was added up to 0.1 mM to irreversibly deposit additional Pt layers thereby increasing the thickness of the core-shell
nanopar cles.• The ORR polariza on (0.9 V and 10 mV/s) and voltammetry curves were generated, in oxygen- and argon-saturated HClO4 solutions, respectively. Repeating the procedure on the same electrode yielded data on the ORR activity as a function of Pt shell thickness.
Individual Particle Diameters Tested (nm):
No data
Solution characteristics (pH, cosolvents or other additives, sonication, ionic strength)
• pH: No data• Cosolvents or other addi ves: None• Sonica on: Nanocatalysts were dispersed in ultrapure water by sonica on prior to loading onto tht electrode.• Ionic strength (conduc vity): No data
Min Diameter Tested (nm): 4
Max Diameter Tested (nm): No data
Specific Surface Area (SSA) (m2/g): No data
Bulk materials tested (≥ 1000 nm): No
Information on Analytical Methods Used to Determine Particle Size:
Their average diameter was determined by X-ray powder diffraction with about 80% particles within (2 nm size range).
List of Relevant Findings: • The specific activity had no relationship with the number of Pt layers on 4 nm Pd/C (10 wt%) catalysts: 0.50, 0.52 and 0.51 mA/cm^2 for 1, 2 and 3 Pt layers, respec vely.• The mass ac vity decreased with increasing number of
Pt layers on 4 nm Pd/C (10 wt%) catalysts: 0.96, 0.59 and 0.43 mA/ug for 1, 2 and 3 Pt layers, respectively.
Size versus Effect Relationship Observed by Authors?:
Yes
Mathematical Relationship Identified in Paper (if applicable):
None
Author‐Identified 'Bright Line' Particle Size (diameter) Threshold (nm) ‐ List if applicable:
None
Notes on 'Bright Line' Threshold: Essentially one size of the core Pd nanoparticle was tested. There is no information on the thickness of each Pt layer; therefore, NP diameters cannot be assigned for n= 1, 2 and 3 Pt layers.
ARCADIS Discussion of Results None
Nature of Size versus Effect Relationship (if applicable)
The mass activity decreased with increasing number of Pt layers (thus increasing particle size)
Page B-147 of 177
Appendix B: Copy of Database
Physico‐chemical Property Investigated:
Reactivity
Priority of Property: High
Relevant for A1 Project?: Yes
Type of nanomaterial (eg, nanometal, nanometal oxide):
Core-shell nanometal
Particle Functionalization or Capping Agent (if applicable):
None
List Study Objective(s) Relevant to Investigated Physicochemical Property:
• To examine the core-shell nanocatalysts made by Pt monolayer depositions on Pd and Pd3Co cores using a Z-contrast scanning transmission electron microscope (STEM) equipped with an element-sensitive electron energy
loss spectrometer (EELS).• Density func onal theory (DFT) calcula ons were carried out using a nanopar cle model that allows surface atoms fully relaxed in all directions for an in-depth understanding of how the particle’s size affects the oxygen reduction reaction (ORR) activity.
Wang et al. (2009a)
Specific Details on Tested Nanomaterial(s)
• Core: Palladium cobalt (Pd3Co)• Shell: Pla num (Pt) of various thickness
Details on Preparation Method of Nanomaterial(s):
• The Pd3Co catalyst was synthesized using a colloidal approach and then annealed at 350 deg C for 30 min.
Details on Tests Examining Physicochemical Property:
• These catalysts were dispersed in ultrapure water by sonication and loaded on a polished glassy carbon-disk electrode without Nafion. About 10-40 potential cycles between 0.05 and 1.15 V were carried out in Ar-saturated
0.1 M HClO4 solu on un l stable voltammetry curves were obtained.• Pt-shells with controlled morphology and thickness were generated on a Pd-core utilizing a Cu-UPD mediated electrodeposition model. K2PtCl4 was added up to 0.1 mM to irreversibly deposit additional Pt layers thereby increasing the thickness of the core-shell
nanopar cles.• The ORR polariza on (0.9 V and 10 mV/s) and voltammetry curves were generated, in oxygen- and argon-saturated HClO4 solutions, respectively. Repeating the procedure on the same electrode yielded data on the ORR activity as a function of Pt shell thickness.
Individual Particle Diameters Tested (nm):
4.6
Solution characteristics (pH, cosolvents or other additives, sonication, ionic strength)
• pH: No data• Cosolvents or other addi ves: None• Sonica on: Nanocatalysts were dispersed in ultrapure water by sonica on prior to loading onto tht electrode.• Ionic strength (conduc vity): No data
Min Diameter Tested (nm): 4.6
Max Diameter Tested (nm): 4.6
Specific Surface Area (SSA) (m2/g): No data
Bulk materials tested (≥ 1000 nm): No
Information on Analytical Methods Used to Determine Particle Size:
The average diameter was determined by X-ray powder diffraction with about 80% particles within (2 nm size range).
List of Relevant Findings: • The specific activity had no relationship with the number of Pt layers on 4.6 nm Pd(3)/Co (14 wt%) catalysts: 0.80, 0.78 and 0.79 mA/cm^2 for 1, 2 and 3 Pt layers, respec vely.• The mass ac vity decreased with increasing
number of Pt layers on 4 nm Pd/C (10 wt%) catalysts: 1.56, 0.99 and 0.75 mA/ug for 1, 2 and 3 Pt layers, respectively.
Size versus Effect Relationship Observed by Authors?:
Yes
Mathematical Relationship Identified in Paper (if applicable):
None
Author‐Identified 'Bright Line' Particle Size (diameter) Threshold (nm) ‐ List if applicable:
None
Notes on 'Bright Line' Threshold: Essentially one size of the core Pd nanoparticle was tested. There is no information on the thickness of each Pt layer; therefore, NP diameters cannot be assigned for n= 1, 2 and 3 Pt layers.
ARCADIS Discussion of Results None
Nature of Size versus Effect Relationship (if applicable)
The mass activity decreased with increasing number of Pt layers (thus increasing particle size)
Page B-148 of 177
Appendix B: Copy of Database
Physico‐chemical Property Investigated:
Reactivity
Priority of Property: High
Relevant for A1 Project?: Yes
Type of nanomaterial (eg, nanometal, nanometal oxide):
Nanometal
Particle Functionalization or Capping Agent (if applicable):
None
List Study Objective(s) Relevant to Investigated Physicochemical Property:
• To investigate the size-dependent activity of nanoplatinum bimetallic alloy catalysts on the oxygen reduction reaction (ORR).
Wang et al. (2009b)
Specific Details on Tested Nanomaterial(s)
• Pla num (III) cobalt (Pt3Co)• Pt bimetallic alloy catalyst
Details on Preparation Method of Nanomaterial(s):
• Monodisperse Pt3Co NPs were synthesized through an organic solvothermal approach.• Pla num acetylacetonate, Pt(acac)2, was reduced by 1,2-tetradecanediol in the presence of 1-adamantanecarboxylic acid and a large excess of oleylamine, while Co was introduced by thermal decomposition of cobalt carbonyl, Co2(CO)8. Adding Co2(CO)8 at different temperatures gave Pt3Co NPs of various sizes.
Details on Tests Examining Physicochemical Property:
• The as-synthesized NPs were supported on carbon black (Tanaka, ∼900 m^2/g) via a colloidal deposition approach by mixing the NPs and carbon in chloroform suspension, followed by sonication. Organic surfactants were removed by heat treatment of the NPs/carbon mixture in an oxygen atmosphere at 185 deg C. The obtained catalyst was then dispersed in deionized water by vigorous sonication, and the formed suspension was dropped
onto a glassy carbon (GC) electrode.• A er drying under argon flow, the GC electrode was immersed into 0.1 M HClO4 for electrocatalytic measurements, which were carried out in a three-compartment electrochemical cell with Pt wire as the counter and Ag/AgCl as the reference electrode.
Individual Particle Diameters Tested (nm):
3, 4, 5, 6, 9
Solution characteristics (pH, cosolvents or other additives, sonication, ionic strength)
• pH: No data• Cosolvents or other addi ves: None• Sonica on: Yes• Ionic strength (conduc vity): No data
Min Diameter Tested (nm): 3
Max Diameter Tested (nm): 9
Specific Surface Area (SSA) (m2/g): 0.0277-0.0692
Bulk materials tested (≥ 1000 nm): No
Information on Analytical Methods Used to Determine Particle Size:
Transmission electron microscopy (TEM) and X-Ray Diffraction were used to characterize the particles.
List of Relevant Findings: • The specific activity of the particles increased as the particle size decreased from 9 to 3 nm; the specific activity at 9 nm being over two mes greater than measured for 3 nm par cles.• The maximum mass ac vity was achieved
at 4.5 nm.• The results presented here show about three-fold enhancement in the specific ac vity for the ORR between synthesized Pt3Co/carbon (6 nm) and commercially available Pt/carbon (6 nm) catalysts. The enhancement has been ascribed to the modification of the Pt surface electronic structure by alloying with 3d transition metals.
Size versus Effect Relationship Observed by Authors?:
Yes
Mathematical Relationship Identified in Paper (if applicable):
None
Author‐Identified 'Bright Line' Particle Size (diameter) Threshold (nm) ‐ List if applicable:
4.5
Notes on 'Bright Line' Threshold: Maximum activity for the Pt3Co catalyst was achieved at a particle size of 4.5 nm.
ARCADIS Discussion of Results None
Nature of Size versus Effect Relationship (if applicable)
The ORR decreases with increasing particle size.
Page B-149 of 177
Appendix B: Copy of Database
Physico‐chemical Property Investigated:
Reactivity
Priority of Property: High
Relevant for A1 Project?: Yes
Type of nanomaterial (eg, nanometal, nanometal oxide):
Nanometal
Particle Functionalization or Capping Agent (if applicable):
None
List Study Objective(s) Relevant to Investigated Physicochemical Property:
• The authors examine the size-dependent activity of Pt3Co NPs for ORR and postulate the particle size effect through the change of the average coordina on number of surface atoms with the par cle size.• They specifically
focus on the 4.5 nm Pt3Co NPs, which have shown the highest mass activity, to study the effect of pretreatment conditions. The NPs deposited on carbon black are annealed at different temperatures and electrochemical studies are applied to clarify the effect of annealing temperature on their catalytic performance.
Wang et al. (2010)
Specific Details on Tested Nanomaterial(s)
• Platinum (Pt) bimetallic alloy with Cobalt (Co)
Details on Preparation Method of Nanomaterial(s):
• The Pt3Co NPs were synthesized through an organic solvothermal approach. In a typical synthesis of 4.5 nm Pt3Co NPs, 0.16 mmol Pt(acac) was dissolved in 10 mL oleylamine and 5 mL benzyl ether, in the presence of 1 mmol 1-tetradecanediol, 2.8 mmol adamantanecarboxylic acid (ACA). The formed solution was heated to 200 deg C under Ar flow and 0.25 mmol Co2(CO)(8) dissolved in 1 mL dichlorobenzene was injected into this hot solution under the Ar atmosphere. After 30 min, the solution temperature was raised to 260 deg C and kept at this temperature for 30 min. Then the solution was cooled down to room temperature and 40 mL isopropanol and 20 mL ethanol were added to precipitate NPs, followed by centrifuge. The collected product was dispersed in 10 mL hexane for further applications. Introducing Co2(CO)8 at 225, 170 and 145 deg C gave Pt3Co NPs of 3, 6 and 9 nm.
Details on Tests Examining Physicochemical Property:
• For electrochemical measurements, The Pt3Co NPs of various sizes were supported on carbon black (~900 m^2/g) via a colloidal deposition method. Organic surfactants were removed by heat treatment of the NP/carbon mixture
in oxygen-rich atmosphere at 185 deg C.• The obtained catalyst was then dispersed in deionized water by vigorous sonication, and the formed suspension was dropped on the surface of glassy carbon (GC) electrode. The electrochemical measurements were conducted in a three-compartment electrochemical cell on a rotational disc electrode setup. A saturated Ag/AgCl electrode and a Pt wire were used as reference and counter electrodes,
respec vely in 0.1 M HClO4 electrolyte.• Cyclic voltammogram (CV) was collected under Ar satura on with scanning rates of 20 and 50 mV/s at 20 deg C, and oxygen reduction reaction (ORR) activity was measured by rotating disk electrode (RDE) method with scanning rate of 20 mV/s at 60 deg C. All potentials in this report are given versus reversible hydrogen electrode (RHE, calibrated via H2 oxidation reaction after each measurement), and readout currents are corrected for the ohmic iR drop. The specific activity was represented as the kinetic current density (Jk) at 0.9 V vs. RHE.
Individual Particle Diameters Tested (nm):
3, 4.5, 6, 9
Solution characteristics (pH, cosolvents or other additives, sonication, ionic strength)
• pH: No data• Cosolvents or other addi ves: hexane, oleylamine, benzyl ether, 1-tetradecanediol, adamantanecarboxylic acid (ACA)• Sonica on: Not performed• Ionic strength (conduc vity): No data
Min Diameter Tested (nm): 3
Max Diameter Tested (nm): 9
Specific Surface Area (SSA) (m2/g): No data
Bulk materials tested (≥ 1000 nm): No
Information on Analytical Methods Used to Determine Particle Size:
TEM images and EDX spectra were collected on a Philips CM 30 TEM equipped with EDX functionality. The EDX analysis covered a large area of nanoparticle assembly (>1 x 1 um, over thousands of particles).
List of Relevant Findings: • The specific activities measured by RDE increase in the following trend: 3 < 4.5 < 6 < 9 nm, with the activity of 9 nm being twice that for 3 nm Pt3Co NPs.• It should be noted that, during opera on in a low-pH environment such
as a proton exchange membrane fuel cell (PEMFC), all of the surface Co atoms would be dissolved immediately resulting in skeleton type of surface morphology with low coordinated Pt topmost atoms. The level of catalytic enhancement is thus likely to depend on the Co concentration in the subsurface layers and the extent of surface Pt coordination. By balancing these two opposite trends, i.e. smaller surface area and higher specific activity as particle size increases, the maximum mass activity has been achieved with 4.5 nm Pt3Co NPs. The catalyst with this size was hence in the focus of the following studies.
Page B-150 of 177
Appendix B: Copy of DatabaseSize versus Effect Relationship Observed by Authors?:
Yes
Mathematical Relationship Identified in Paper (if applicable):
None
Author‐Identified 'Bright Line' Particle Size (diameter) Threshold (nm) ‐ List if applicable:
None
Notes on 'Bright Line' Threshold: The ORR reactivity was noted to decrease with increasing particle size from 3 to 9 nm. The authors selected a particle size of 4.5 nm to represent the maximum mass activity.
ARCADIS Discussion of Results None
Nature of Size versus Effect Relationship (if applicable)
The specific activity increased as the particle size increased from 3 to 9 nm.
Physico‐chemical Property Investigated:
Photocatalytic activity
Priority of Property: High
Relevant for A1 Project?: Yes
Type of nanomaterial (eg, nanometal, nanometal oxide):
Nanometal composites
Particle Functionalization or Capping Agent (if applicable):
None
List Study Objective(s) Relevant to Investigated Physicochemical Property:
• To provide a single-molecule, single-particle approach for elucidating the inherent photocatalytic activity of individual Au nanoparticle-loaded TiO2 particles.
Wang et al. (2011)
Specific Details on Tested Nanomaterial(s)
• Gold-titanium dioxide (Au-TiO2)
Details on Preparation Method of Nanomaterial(s):
• A series of Au/TiO2 particles were prepared by the deposition-precipitation method under various temperatures and times using HAuCl4 and TiO2 (A-100, 100–200 nm particles) as the raw materials. Particles were then annealed
at either 300, 600 or 700 deg C for 0.5, 4.0 and 4.5 h, respec vely.• Steady-state UV–visible absorp on and diffuse reflectance spectra were measured using UV–visible–NIR spectrophotometers. Steady state fluorescence
spectra were measured using a Hitachi 850 fluorescence spectrophotometer.• To obtain isolated TiO2 or Au/TiO2 particles, well-dispersed methanol suspensions containing small amounts of TiO2 or Au/TiO2 powders were spin-coated onto clean cover glasses.
Details on Tests Examining Physicochemical Property:
• The fluorogenic reaction is based on ET-involved reduction of boron-dipyrromethene compound, 3,4- dinitrophenyl (BODIPY); DN-BODIPY to HN-BODIPY (dinitrobenzene moiety).• Single-molecule fluorescence
measurements were performed using both total internal reflection fluorescence microscopy (TIRFM) (365 nm light used for excitation) and confocal microscopy (485 nm pulsed laser used for excitation).
Individual Particle Diameters Tested (nm):
5. 8, 14
Solution characteristics (pH, cosolvents or other additives, sonication, ionic strength)
• pH: No data• Cosolvents or other addi ves: methanol• Sonica on: Not performed• Ionic strength (conductivity): No data
Page B-151 of 177
Appendix B: Copy of DatabaseMin Diameter Tested (nm): 5
Max Diameter Tested (nm): 14
Specific Surface Area (SSA) (m2/g): No data
Bulk materials tested (≥ 1000 nm): No
Information on Analytical Methods Used to Determine Particle Size:
No data
List of Relevant Findings: • The adsorption coefficient for the substrate (K(ad)) values increased slightly from 1/0.8 uM to 1/ 1.1 uM as the Au NP size decreased from 14 nm to 5 nm; all of the Au/TiO2 systems showed larger Kad values than that of the TiO2 system (1/0.5 uM). These results imply that DN-BODIPY prefers to adsorb onto the Au surface of Au/TiO2, and smaller Au nanoparticles exhibit a stronger substrate binding affinity, probably because of a sufficient amount of
Au atoms with a low coordina on number.• The characteris c me prior to the forma on of fluorescence products on the TiO2 or Au/TiO2 particle decreased as the diameter of the Au particles decreased: this time is 1.95
higher for 15 nm than 4 nm at in intensity of 0.015 W/cm^2.• Overall, the findings suggest that the effects of UV light intensity and Au particle diameter on Toff and Ton are intricately interrelated and that the photocatalytic behavior of TiO2 loaded with larger Au nanoparticles is more dependent on IUV when compared to smaller Au nanoparticles.
Size versus Effect Relationship Observed by Authors?:
Yes
Mathematical Relationship Identified in Paper (if applicable):
None
Author‐Identified 'Bright Line' Particle Size (diameter) Threshold (nm) ‐ List if applicable:
None
Notes on 'Bright Line' Threshold: The time for substrate to adsorb to catalyst surface and to be catalyzed decreased with decreasing particle size; however, a bright line threshold cannot be inferred from these data.
ARCADIS Discussion of Results None
Nature of Size versus Effect Relationship (if applicable)
The time for substrate to adsorb to catalyst surface and to be catalyzed decreased with decreasing particle size.
Physico‐chemical Property Investigated:
Crystalline structure (structure)
Priority of Property: High
Relevant for A1 Project?: Yes
Type of nanomaterial (eg, nanometal, nanometal oxide):
Nanometal alloy
Particle Functionalization or Capping Agent (if applicable):
None
List Study Objective(s) Relevant to Investigated Physicochemical Property:
• BLF-PT nanoparticles of different sizes were prepared by sol-gel method and the structural and magnetization properties characterized.
Wei et al. (2010)
Specific Details on Tested Nanomaterial(s)
• 0.5Bi(0.8)La(0.2)FeO(3) - 0.5PbTiO(3) (BLF-PT)
Page B-152 of 177
Appendix B: Copy of DatabaseDetails on Preparation Method of Nanomaterial(s):
• The BLF-PT sol was prepared with Bi(NO3)3∙5H2O, Fe(NO3)3∙9H2O, La(NO3)3∙6H2O, Pb(AC)2, and tetrabutyl titanate Ti(O–C4H9)4. Then, the sol was kept at 80 deg C for 4 days to form dried gel which was then sintered at different temperature Ts in between 600 and 1000 deg C for different times 2–3 h in air.
Details on Tests Examining Physicochemical Property:
• Scanning electron microscopy (SEM) was used to observe the powder morphology and the crystal structures were probed by x-ray diffraction (XRD) with Cu K-alpha radiation. Raman spectroscopy was conducted using a spectrometer in backscattering geometry. The excitation source is the 488 nm line of an Ar+ laser with 20 mW output. The power of the laser spot on the samples is 1 mW. The valence of Fe ions was distinguished by x-ray
photoelectron spectroscopy (XPS).• For electrical and magne c measurements, spark plasma sintering (SPS) technique was used to sinter the bulk samples in order to restrain the particle size from remarkable growth. The dielectric constant (susceptibility), epsilon, was measured using the HP4192A impedance analyzer at frequency f =100 Hz, 1.0 kHz, 10 kHz, 100 kHz, and 1.0 MHz, respectively. We also measured the FE property of the as-prepared samples; however, the measured FE hysteresis is not good and the samples exhibit leakage behaviors which may be attributed to the oxygen defects formed in the SPS process under vacuum conditions.
Individual Particle Diameters Tested (nm):
80, 150, 400, 900 and ca. 1500
Solution characteristics (pH, cosolvents or other additives, sonication, ionic strength)
Not applicable
Min Diameter Tested (nm): 80
Max Diameter Tested (nm): ca. 1500
Specific Surface Area (SSA) (m2/g): No data
Bulk materials tested (≥ 1000 nm): No
Information on Analytical Methods Used to Determine Particle Size:
The average grain size was measured directly from scanning electron microscopy (SEM) images.
List of Relevant Findings: • The XRD pattern shows remarkable size dependence of the phase; the ca. 1500 nm sample exhibits the tetragonal symmetry noting that the MPB of (1−y) BFO-yPT is at y ~ 0.3 with the T-phase at y ~ 0.3 and rhombohedral symmetry at y ~ 0.3. With decreasing size r, the tetragonal phase distortion is continuously
weakened.• Further evidence of the size-dependent structure symmetry is given by the Raman spectroscopy.
Size versus Effect Relationship Observed by Authors?:
Yes
Mathematical Relationship Identified in Paper (if applicable):
None
Author‐Identified 'Bright Line' Particle Size (diameter) Threshold (nm) ‐ List if applicable:
150 < Threshold < 400
Notes on 'Bright Line' Threshold: The structure symmetry evolves from the tetragonal phase for samples ca. 1500, 900 and 400 nm particles to the rhombohedral phase for 150 and 400 nm particles; therefore, an apparent threshold exists between 150 and 400 nm for the phase transformation of these particles.
ARCADIS Discussion of Results None
Nature of Size versus Effect Relationship (if applicable)
With decreasing particle size, the crystal structure transits from the tetragonal symmetry to rhombohedral one.
Physico‐chemical Property Investigated:
Reactivity
Priority of Property: High
Relevant for A1 Project?: Yes
Type of nanomaterial (eg, nanometal, nanometal oxide):
Nanocarbon
Particle Functionalization or Capping Agent (if applicable):
None
List Study Objective(s) Relevant to Investigated Physicochemical Property:
• To introduce a new technique to modify the surface of particles with hydrogen, which prevents cluster formation in buffer solution and which is a perfect starting condition for chemical surface modifications.
Williams et al. (2010)
Specific Details on Tested Nanomaterial(s)
• Diamond (C0) nanoparticles
Page B-153 of 177
Appendix B: Copy of DatabaseDetails on Preparation Method of Nanomaterial(s):
• Nanodiamond powders were produced via a detonation method.
Details on Tests Examining Physicochemical Property:
• For the gas treatment, 0.4 g of powder was placed in a vacuum oven and evacuated to a base pressure better than 1 = 10^-6 mbar. Purified H2 gas was flowed through the chamber at 50 sccm (standard cubic centimeter), and the pressure was maintained at 10 mbar. The powder was resistively heated to 500 deg C as determined by a single wavelength optical pyrometer. After 5 h of exposure, the sample was cooled to room temperature under hydrogen
gas flow, evacuated to high vacuum, and vented.• Aqueous colloids were made from both treated and untreated powder by immersing 0.1 g of powder in 200 mL of deionized water and dispersing with a high-power ultrasonic horn. The conditions were 250 W at a duty cycle of 3:2 (on/off) for 5 h under aggressive liquid cooling. The temperature of the solution was maintained below 20 deg C. The solutions were allowed to settle for 24 h and then decanted to remove any large mass contaminants such as the unavoidable titanium alloy from the sonotrode. Solutions were then centrifuged for 90 min at various speeds from 5000 to 15000 rpm in a Universal 320R
centrifuge.• To confirm the results obtained for 4 nm par cles, the zeta poten al measurements were also performed for 20 nm and bulk diamond nanoparticles.
Individual Particle Diameters Tested (nm):
No data
Solution characteristics (pH, cosolvents or other additives, sonication, ionic strength)
• pH: pH was increased/decreased in the zeta poten al measurements.• Cosolvents or other addi ves: None• Sonica on: Diamond nanopar cles were dispersed into water using a high power ultrasound.• Ionic strength
(conductivity): No data
Min Diameter Tested (nm): 4
Max Diameter Tested (nm): 20
Specific Surface Area (SSA) (m2/g): No data
Bulk materials tested (≥ 1000 nm): No
Information on Analytical Methods Used to Determine Particle Size:
Diamond NPs characterized by dynamic light scattering (DLS), X-ray diffraction (XRD), transmission electron microscopy (TEM), and Fourier transform infrared (FTIR) microscopy.
List of Relevant Findings: • For powder not treated with H2 gas, independent of centrifugation, the dominant particle size is over 100 nm, with no evidence of any smaller particles. For treated powder, before centrifugation, the particle size distribution (PSD) is now centered on 58 nm. Particles are significantly smaller than those of the untreated powder. After centrifugation, the peak of the PSD shifts to lower sizes. After centrifugation at 5000 rpm it reduces to 28-32 nm, after 75,000 rpm to 16 nm, and then to 2-4 nm after centrifugation above 10,000 rpm. The core particle size (4 nm) is reached after 10,000 rpm centrifugation for 90 min, and the colloid can be defined as fundamentally
monodisperse.• The untreated powder has a nega ve zeta poten al over the en re pH range which becomes progressively more negative as the pH is increased. For treated powders, the zeta potential becomes positive for all pH values. The pH is constant around 40 mV from pH 3 until pH 7 where it decreases with increasing pH. At higher pH values the hydrogenated sample showed a very low zeta potential which was difficult to measure and again resulted in electrode degradation. The solution of hydrogenated diamond particles showed a zeta potential as high
as 70 mV when measured immediately a er prepara on.• The large change in zeta poten al resul ng from this gas treatment demonstrates that nanodiamond (4 nm) particle surfaces are able to react with molecular hydrogen at relatively low temperatures, a phenomenon not witnessed with larger (20 nm) diamond particles or bulk diamond surfaces.
Size versus Effect Relationship Observed by Authors?:
Yes
Mathematical Relationship Identified in Paper (if applicable):
None
Author‐Identified 'Bright Line' Particle Size (diameter) Threshold (nm) ‐ List if applicable:
4 < Threshold < 20
Notes on 'Bright Line' Threshold: Core-sized diamond nanoparticles (4 nm) were able to react with molecular hydrogen while 20 nm diamond nanoparticles and bulk diamond particles were not able to do so; therefore, a threshold can be inferred to be in the range of 4-20 nm.
ARCADIS Discussion of Results None
Nature of Size versus Effect Relationship (if applicable)
Reactivity of particles increases with decreasing particle size.
Page B-154 of 177
Appendix B: Copy of Database
Physico‐chemical Property Investigated:
Reactivity
Priority of Property: High
Relevant for A1 Project?: Yes
Type of nanomaterial (eg, nanometal, nanometal oxide):
Nanometal
Particle Functionalization or Capping Agent (if applicable):
List Study Objective(s) Relevant to Investigated Physicochemical Property:
• To investigate the rate of hydrogenation of allyl alcohol as a function of the diameter of the Pd nanoparticles (1.3-1.9 nm) used to catalyze the reaction.
• The total moles of Pd used for each hydrogenation reaction was maintained constant for all experiments, but the Pd/dendrimer ratio was varied to yield dendromer-encapsulated nanoparticles (DENs) having different sizes. Specifically, sixth-generation, hydroxyl-terminated polyamidoamine dendrimers (G6-OH) were used to synthesize Pd DENs containing an average of 55, 100, 147, 200, or 250 Pd atoms (G6-OH(Pdn), where n is the average number of atoms per particle).
Details on Tests Examining Physicochemical Property:
• The rate of hydrogenation of allyl alcohol was determined by measuring hydrogen uptake. Briefly, 20.0 mL of the catalyst solution (3.0 umol of Pd) was transferred to a Schlenk flask. The system was sealed and purged with H2 for 10 min and then stirred for an additional 10 min. Allyl alcohol was added, and differential H2 pressure measurements were obtained every 10 s for 10 min. Turnover frequencies (TOFs, mol H2/mol active site-h) were determined from the slope of plots of turnover (mol H2/mol catalyst) versus time.
Individual Particle Diameters Tested (nm):
1.3, 1.4, 1.5, 1.7, 1.9
Solution characteristics (pH, cosolvents or other additives, sonication, ionic strength)
• pH: No data• Cosolvents or other addi ves: No data• Sonica on: No data• Ionic strength (conduc vity): No data
Min Diameter Tested (nm): 1.3
Max Diameter Tested (nm): 1.9
Specific Surface Area (SSA) (m2/g): No data
Bulk materials tested (≥ 1000 nm): No
Information on Analytical Methods Used to Determine Particle Size:
Transmission electron microscopy (TEM) was used to determine particle size.
List of Relevant Findings: • The normalized turnover frequencies (TOFs) increased with increasing particle diameter over the range of nanopar cle sizes tested.• For three of the four plots (surface atoms, defect atoms, total number of
nanoparticles), there is a monotonic increase in the TOF as the particle size increases. This indicates that, if this size effect is due to geometric factors, the active site does not correlate to the number of surface atoms, defect atoms, or nanoparticles. However, when only face atoms are considered, the plot attains zero slope for particle diameters >= 1.5 nm. Because this TOF is calculated in terms of the number of face atoms (mol H2/mol face atoms-h), it means there is a 1:1 correspondence between the rate of hydrogen uptake and the number of face atoms for particles in this size range. As the particle size increases, only the total number of face atoms in solution increases. From this result the authors concluded that, for Pd DENs having diameters in the range of 1.5-1.9 nm, the hydrogenation of allyl alcohol occurs preferentially on the face atoms.
Size versus Effect Relationship Observed by Authors?:
Yes
Mathematical Relationship Identified in Paper (if applicable):
None
Author‐Identified 'Bright Line' Particle Size (diameter) Threshold (nm) ‐ List if applicable:
None
Notes on 'Bright Line' Threshold: The tested particle size range is too small to determine a 'bright line' particle size threshold.
ARCADIS Discussion of Results None
Nature of Size versus Effect Relationship (if applicable)
The normalized turnover frequency for the hydrogenation of allyl alcohol increases with increasing particle diameter.
Page B-155 of 177
Appendix B: Copy of Database
Physico‐chemical Property Investigated:
Water solubility
Priority of Property: High
Relevant for A1 Project?: Yes
Type of nanomaterial (eg, nanometal, nanometal oxide):
Nanometal oxide
Particle Functionalization or Capping Agent (if applicable):
None
List Study Objective(s) Relevant to Investigated Physicochemical Property:
• This study primarily aimed to characterize the aggregate size and solubility of nZnO and ZnO.• To assess their toxicities towards five selected marine organisms.
• nZnO powder (average particle size (APS), 20 nm) was purchased from Nanostructured & Amorphous Materials Inc. (New Mexico, USA); ZnO powder (i.e., bulk ZnO) was purchased from BDH Chemical Ltd. (Poole, England) while zinc sulfate heptahydrate (ZnSO4∙7H2O) was purchased from Sigma Chemical Co. (St. Louis, Missouri, USA).
Details on Tests Examining Physicochemical Property:
• To quantify the dissolved metal ion concentrations for nZnO and ZnO, test solutions of 80 mg/L (in filtered ar ficial seawater) were shaken on a rotary shaker opera ng at 200 rpm under room temperature (25 ± 2 deg C).•
At each sampling time point, aliquots were withdrawn and filtered through a 0.1-μm sterile syringe filter. The Zn2+ concentration in the filtrate was then measured by inductively coupled plasma with optical emission spectrometry (ICP-OES). The method of standard additions was utilized to account for matrix interference.
Individual Particle Diameters Tested (nm):
26.2, 216.2
Solution characteristics (pH, cosolvents or other additives, sonication, ionic strength)
• pH: 8• Cosolvents or other addi ves: none• Sonica on: Not performed• Ionic strength (conduc vity): No data
Min Diameter Tested (nm): 26.2
Max Diameter Tested (nm): 216.2
Specific Surface Area (SSA) (m2/g): No data
Bulk materials tested (≥ 1000 nm): No
Information on Analytical Methods Used to Determine Particle Size:
• To determine the average particle size distribution, nZnO and ZnO powders were examined under transmission electron microscope (TEM), while for aggregate size distribution, 100 mg/L of nZnO and ZnO suspensions were dispersed in filtered artificial seawater (salinity, 30 ± 0 .5%; pH, 8.0 ± 0.1) and inspected by laser diffractometry.
List of Relevant Findings: • nZnO tended to form aggregates in seawater in the micrometer range, with hydrodynamic diameters of 2.3 ± 1.6 μm, which were even bigger than those formed by its bulk equivalent, 1.7 ± 1.2 μm; t=4.183, p<0.01).• For both
nZnO and ZnO, the equilibrium was achieved within 72 h after initial dispersion of both metal oxides in seawater. The dissolved Zn concentration for nZnO and ZnO was 3.7 ± 0.6 and 1.6 ± 0.5 mg Zn/L, respectively, at equilibrium
(n=2).• The solubility of ZnO at pH 8.0 was close to values (1.1-2.5 mg Zn/L) postulated in the literature. In contrast to previous research where the solubilities of nZnO and ZnO were found to be the same in distilled water, the current study showed that nZnO displays a higher solubility than its bulk equivalent in seawater, possibly because of its smaller size, larger surface area and curvature.
Page B-156 of 177
Appendix B: Copy of DatabaseSize versus Effect Relationship Observed by Authors?:
Ambiguous
Mathematical Relationship Identified in Paper (if applicable):
None
Author‐Identified 'Bright Line' Particle Size (diameter) Threshold (nm) ‐ List if applicable:
None
Notes on 'Bright Line' Threshold: Two sizes of zinc oxide particles were tested with an ca. 2.3-fold increase in equilibrium solubility for 26.2 nm particles compared to 216.2 nm particles. With only two particle sizes tested, a 'bright line' particle size threshold cannot be determined.
ARCADIS Discussion of Results Hydrodynamic diameter of nZnO particles (26.2 nm) was greater than those of the 216.2 nm particles. This seems to confound the results of looking at a size-related effect. However, nZnO tended to form aggregates in seawater in the micrometer range (2.3±1.6 μm), which were even bigger than those formed by its bulk equivalent (1.7± 1.2 μm; t=4.183, p<0.01).
Nature of Size versus Effect Relationship (if applicable)
Solubility (equilibrium dissolution) of nZnO particles was greater than for Zno particles in sea water at pH 8.
Physico‐chemical Property Investigated:
Crystalline structure (structure)
Priority of Property: High
Relevant for A1 Project?: Yes
Type of nanomaterial (eg, nanometal, nanometal oxide):
Nanometal
Particle Functionalization or Capping Agent (if applicable):
None
List Study Objective(s) Relevant to Investigated Physicochemical Property:
• To determine the size-dependent phase transition between the tetragonal and monoclinic phases.
Xu and Barnard (2008)
Specific Details on Tested Nanomaterial(s)
• Zirconia (Zr)
Details on Preparation Method of Nanomaterial(s):
No data
Details on Tests Examining Physicochemical Property:
No data
Individual Particle Diameters Tested (nm):
No data
Solution characteristics (pH, cosolvents or other additives, sonication, ionic strength)
• pH: No data• Cosolvents or other addi ves: No data• Sonica on: No data• Ionic strength (conduc vity): No data
Min Diameter Tested (nm): No data
Max Diameter Tested (nm): No data
Specific Surface Area (SSA) (m2/g): No data
Bulk materials tested (≥ 1000 nm): No data
Information on Analytical Methods Used to Determine Particle Size:
No data
List of Relevant Findings: • The thermodynamically unstable tetragonal phase becomes stable when the crystal size becomes small (<13 nm).
Page B-157 of 177
Appendix B: Copy of DatabaseSize versus Effect Relationship Observed by Authors?:
Yes
Mathematical Relationship Identified in Paper (if applicable):
None
Author‐Identified 'Bright Line' Particle Size (diameter) Threshold (nm) ‐ List if applicable:
13
Notes on 'Bright Line' Threshold: Below 13 nm, zirconium particles are stable in the tetragonal phase.
ARCADIS Discussion of Results None
Nature of Size versus Effect Relationship (if applicable)
The stability of the tetragonal phase increases with decreasing particle size.
Physico‐chemical Property Investigated:
Crystalline structure (structure)
Priority of Property: High
Relevant for A1 Project?: Yes
Type of nanomaterial (eg, nanometal, nanometal oxide):
Nanometal alloy oxide
Particle Functionalization or Capping Agent (if applicable):
None
List Study Objective(s) Relevant to Investigated Physicochemical Property:
• To investigate the particle-size dependence of hydrothermally produced BaTiO(3) powder, by focusing on the crystal phase, and discussed the piezoelectric properties in BaTiO(3)/polymer composites as a function of the particle size of BaTiO(3) powder.
Yamamoto et al. (1993)
Specific Details on Tested Nanomaterial(s)
• Barium titanate (BaTiO(3))
Details on Preparation Method of Nanomaterial(s):
• BaTiO(3) powders with particle sizes of 60 to 1000 nm were prepared by hydrothermal processing.
Details on Tests Examining Physicochemical Property:
• The relationship between the crystal phase and the particle size were examined by means of the X-ray diffraction (XRD) method, differential thermal analysis (DTA), Raman spectroscopy (RS), transmission electron microscopy
(TEM).• In general, the differences in tetragonal and cubic phases can be confirmed by the separa on of (002) and (200) XRD peaks.
Individual Particle Diameters Tested (nm):
60, 100, 200, 300, 500
Solution characteristics (pH, cosolvents or other additives, sonication, ionic strength)
• pH: No data• Cosolvents or other addi ves: No data• Sonica on: No data• Ionic strength (conduc vity): No data
Min Diameter Tested (nm): 60
Max Diameter Tested (nm): 500
Specific Surface Area (SSA) (m2/g): No data
Bulk materials tested (≥ 1000 nm): No
Information on Analytical Methods Used to Determine Particle Size:
No data
List of Relevant Findings: • The crystal phase of BaTiO(3) powder was transformed from tetragonal to pseudo cubic at a critical particle size of 100 to 200 nm at room temperature.• The crystal phase of BaTiO(3) powder with par cle sizes of 60, 100 and
200 nm may be considered to be of the pseudo cubic phase. The crystal phase above 300 nm was tetragonal, as seen from the separation in (002) and (200) XRD peaks.
Page B-158 of 177
Appendix B: Copy of DatabaseSize versus Effect Relationship Observed by Authors?:
Yes
Mathematical Relationship Identified in Paper (if applicable):
None
Author‐Identified 'Bright Line' Particle Size (diameter) Threshold (nm) ‐ List if applicable:
100 < Threshold < 200
Notes on 'Bright Line' Threshold: The crystal phase of BaTiO(3) powder was transformed from tetragonal to pseudo cubic at a critical particle size of 100 to 200 nm at room temperature.
ARCADIS Discussion of Results None
Nature of Size versus Effect Relationship (if applicable)
The crystalline phase transformed from tetragonal to pseudo cubic with decreasing particle size.
Physico‐chemical Property Investigated:
Crystalline structure (structure)
Priority of Property: High
Relevant for A1 Project?: Yes
Type of nanomaterial (eg, nanometal, nanometal oxide):
Nanometal alloy oxide
Particle Functionalization or Capping Agent (if applicable):
None
List Study Objective(s) Relevant to Investigated Physicochemical Property:
• In this study, the critical size and lattice expansions observed in nanosized BaTiO3 particles (30–250 nm) was inves gated by scanning electron microscope (SEM).• In addi on, coincidence between phase transmissions was
evaluated by X-rays diffrac on (XRD), thermogravimetric analysis (TGA), and Raman sca ering measurements.• The results for HGRP were discussed in terms of lattice parameters, critical size and elastic constrains for BaTiO3. The phenomenology and possible causes for the anomalous structure characteristics, classified within size effects on BaTiO3, was also discussed.
Yan et al. (2006)
Specific Details on Tested Nanomaterial(s)
• Barium titanate (BaTiO3)
Details on Preparation Method of Nanomaterial(s):
• In a typical high-gravity reactive precipitation reaction, an excess of BaCl2 was added to a Ti(OH)4 aqueous solution to form a solution A, with Ba/Ti mole ratio of 1.5 and total concentration of Ba2+ and hydrated titanium ions kept at 1.25 mol/L. The solution A and 6.0 mol/L aqueous NaOH (solution B) at 95 deg C were mixed by continuous, simultaneous pumping from their storage tanks into individual slotted pipe distributors in the rotating packed bed reactor, resulting in a white precipitate and spherical BaTiO3 nanoparticles with a diameter of 30 nm. After exiting from RPB, the BaTiO3 suspension was filtered, followed by the washing of residual product with de-ionized water to remove soluble byproducts. Nanosized samples, A–J, were prepared using BaTiO3 particles from HGRP through heating at various temperatures in the range of 100–1200 deg C for a time period of 2 h.
Details on Tests Examining Physicochemical Property:
• Lattice parameter and lattice strain calculations were obtained from the diffraction patterns.
Individual Particle Diameters Tested (nm):
30, 32, 35, 40, 45, 50, 60, 110, 250, 500
Solution characteristics (pH, cosolvents or other additives, sonication, ionic strength)
• pH: No data• Cosolvents or other addi ves: No data• Sonica on: No data• Ionic strength (conduc vity): No data
Page B-159 of 177
Appendix B: Copy of DatabaseMin Diameter Tested (nm): 30
Max Diameter Tested (nm): 500
Specific Surface Area (SSA) (m2/g): No data
Bulk materials tested (≥ 1000 nm): No
Information on Analytical Methods Used to Determine Particle Size:
The particle size and morphology of the prepared powder was investigated using scanning electron microscope (SEM) transmission electron microscopy (TEM). This instrument was equipped with an Oxford INCA EDS system with the potential of performing selected area electron diffraction (SAED) to further characterize individual BaTiO3 nanostructures. The particle size was obtained from the average value of ≥100 particles taken along the diagonals of the micrograph from SEM.
List of Relevant Findings: • The lattice parameter (a) decreased with increasing particle size (measured by SEM) in a size-dependent manner. The lattice parameter (c) decreased with increasing particle size tp to a particle size of 50 nm. For particles greater than 50 nm, the lattice parameter (c) increased in a size-dependent manner. The c/a ratio held constant at 1 for particles 45 nm and smaller. For particles greater than 45 nm, the c/a ratio increased to 1.010 in a size-dependent manner. Therefore, it was determined that particles 45 nm and smaller were cubic while particles greater than 45
nm are tetragonal.• The cri cal size is defined as the par cle size at which the crystal structure changes from cubic to tetragonal with spontaneous polarization. The lattice constant (a) decreased with a particle size increase (i.e. lattice constant for 30 nm particle was 1.3% longer than that of 250 nm particle) while the lattice constant (c) decreased with decreasing particle size. The critical size was estimated as 70 nm. The variations of the lattice constants, therefore, were divided into three regions according to size: tetragonal F (ferroelectric) phase (>110 nm), cubic P (paraelectric) phase (<50 nm) and an intermediate (pseudo-cubic) phase (50–110 nm). Pseudo-cubic phase showed two significant changes: transitions from ferroelectric to paraelectric phase (around particle size of 60 nm) and from nanoparticles to clusters (around particle size of 35 nm).
Size versus Effect Relationship Observed by Authors?:
Yes
Mathematical Relationship Identified in Paper (if applicable):
None
Author‐Identified 'Bright Line' Particle Size (diameter) Threshold (nm) ‐ List if applicable:
70
Notes on 'Bright Line' Threshold: Particles below a particle size of 70 nm are in the cubic phase while particles greater than 70 nm are tetragonal.
ARCADIS Discussion of Results None
Nature of Size versus Effect Relationship (if applicable)
Lattice parameter (a) decreases with decreasing size over the range 30 to 250 nm.
Physico‐chemical Property Investigated:
Reactivity
Priority of Property: High
Relevant for A1 Project?: Yes
Type of nanomaterial (eg, nanometal, nanometal oxide):
Supported nanometal
Particle Functionalization or Capping Agent (if applicable):
None
List Study Objective(s) Relevant to Investigated Physicochemical Property:
• In order to elucidate any real particle size effect on the oxygen reduction reaction (ORR), ORR activity measurements and electrochemical nuclear magnetic resonance (EC-NMR) were carried out on Pt/CB catalysts.
Yano et al. (2006)
Specific Details on Tested Nanomaterial(s)
• Carbon-supported pla num nanopar cles (Pt/CB, whereCB = carbon black) can be used as catalysts for both the anode as well as the cathode of polymer electrolyte fuel cells (PEFCs).• In order to obtain high mass ac vity of
platinum in fuel cells, it
Page B-160 of 177
Appendix B: Copy of DatabaseDetails on Preparation Method of Nanomaterial(s):
No data
Details on Tests Examining Physicochemical Property:
• The working electrode consisted of Pt/CB catalysts perfectly dispersed on a Au substrate• The pla num collecting electrode (1 x 4 mm) was used to detect H2O2. A platinum wire was used as the counter electrode. A reversible hydrogen electrode RHE(t) kept at the same temperature as that of the cell was used as the reference
electrode. The electrolyte solu on of 0.1 M HClO4 was prepared from reagent grade chemicals• An apparent ORR rate constant (kappa) and the activation energy (Ea) were determined using a channel flow double electrode (abbreviated below as CFDE) cell27–29 operated as a closed system with controlled oxygen concentration and at elevated temperatures. We quantified both ORR kinetics and the H2O2 production rate using a collecting electrode located at the downstream of the working electrode in the CFDE.
Individual Particle Diameters Tested (nm):
1.6, 2.6, 4.8
Solution characteristics (pH, cosolvents or other additives, sonication, ionic strength)
• pH: No data• Cosolvents or other addi ves: None• Sonica on: Yes, catalysts were suspended in Millipore water and sonicated prior to TEM size measurements• Ionic strength (conduc vity): No data
Min Diameter Tested (nm): 1.6
Max Diameter Tested (nm): 4.8
Specific Surface Area (SSA) (m2/g): No data
Bulk materials tested (≥ 1000 nm): No
Information on Analytical Methods Used to Determine Particle Size:
Average particle diameters and size distributions were studied by transmission electron microscopy (TEM) using a JEOL 2010F instrument. The Tanaka Pt/CB catalysts were dispersed in about 2 ml of Millipore water and sonicated. The suspension was dropped onto holy carbon grids and dried before the TEM measurements.
List of Relevant Findings: • It was found that the apparent ORR rate constants and the activation energies were independent of the particle size, and were identical to those for bulk platinum electrodes. The H2O2 yields were also identical to those for the
Nafion-coated bulk pla num electrode.• By 195Pt NMR, the surface peak posi ons and relaxa on rates showed only marginal variations with the particle size indicating that the Fermi level local density of states (Ef-LDOS) of
surface pla num atoms are iden cal.• By combining the NMR results with the ORR measurements, the electronic properties of the surface atoms on platinum nanoparticles do not show any particle size effect and therefore, their ORR activities are also particle size independent.
Size versus Effect Relationship Observed by Authors?:
None
Mathematical Relationship Identified in Paper (if applicable):
None
Author‐Identified 'Bright Line' Particle Size (diameter) Threshold (nm) ‐ List if applicable:
N/A
Notes on 'Bright Line' Threshold: N/A
ARCADIS Discussion of Results None
Nature of Size versus Effect Relationship (if applicable)
N/A
Physico‐chemical Property Investigated:
Reactivity
Priority of Property: High
Relevant for A1 Project?: Yes
Type of nanomaterial (eg, nanometal, nanometal oxide):
Supported nanometal
Particle Functionalization or Capping Agent (if applicable):
None
List Study Objective(s) Relevant to Investigated Physicochemical Property:
• Electrochemical ORR and [195Pt] EC-NMR measurements were performed for Pt/CB catalysts with three batches of Pt nanopar cles of diameters 1.6, 2.6, and 4.8 nm.• An apparent ORR rate constant (kappa) and the ac va on
energy (Ea) were determined using a channel flow double electrode (CFDE) operated as a closed system with controlled oxygen concentration and at elevated temperatures.
Yano et al. (2006)
Specific Details on Tested Nanomaterial(s)
• Platinum / Carbon black electrocatalyts (Pt/CB)
Page B-161 of 177
Appendix B: Copy of DatabaseDetails on Preparation Method of Nanomaterial(s):
• Nanocatalysts were provided to the study authors.
Details on Tests Examining Physicochemical Property:
• Oxygen reduction reaction (ORR) measurements were carried out using the Pt/CB catalyst dispersed on an Au substrate electrode as the working electrode. The platinum collecting electrode (1 x 4 mm) was used to detect H2O2. A platinum wire was used as the counter electrode. A reversible hydrogen electrode RHE(t) kept at the same
temperature as that of the cell was used as the reference electrode. The electrolyte solu on was 0.1 M HClO4.• Hydrodynamic voltammograms at the working electrode under a flow of O2-saturated 0.1 M HClO4 solution (mean flow rate = 10–50 cm/s) were recorded by scanning the potential from 0.3 to 1.5 V vs. RHE(t) at 0.5 mV/s. The potential of the collecting electrode was set at 1.2 V where H2O2 was oxidized under a diffusion control condition.
Individual Particle Diameters Tested (nm):
1.6, 2.6, 4.8
Solution characteristics (pH, cosolvents or other additives, sonication, ionic strength)
Not applicable
Min Diameter Tested (nm): 1.6
Max Diameter Tested (nm): 4.8
Specific Surface Area (SSA) (m2/g): No data
Bulk materials tested (≥ 1000 nm): No
Information on Analytical Methods Used to Determine Particle Size:
X-ray diffrac on measurementswere carried out using a spectrometer with Cu Ka radia on (1.54 nm, 50 kV, 300 mA). Average particle diameters and size distributions were studied by transmission electron microscopy (TEM). The Tanaka Pt/CB catalysts were dispersed in about 2 mL of Millipore water and sonicated. The suspension was dropped onto holy carbon grids and dried before the TEM measurements.
List of Relevant Findings: • It was found that the apparent ORR rate constants and the activation energies were independent of the particle size, and were identical to those for bulk platinum electrodes. The H2O2 yields were also identical to those for the
Nafion-coated bulk pla num electrode.• The electronic proper es of the surface atoms on pla num nanopar cles do not show any particle size effect and therefore, their ORR activities are also particle size independent.
Size versus Effect Relationship Observed by Authors?:
None
Mathematical Relationship Identified in Paper (if applicable):
N/A
Author‐Identified 'Bright Line' Particle Size (diameter) Threshold (nm) ‐ List if applicable:
N/A
Notes on 'Bright Line' Threshold: N/A
ARCADIS Discussion of Results None
Nature of Size versus Effect Relationship (if applicable)
N/A
Physico‐chemical Property Investigated:
Reactivity
Priority of Property: High
Relevant for A1 Project?: Yes
Type of nanomaterial (eg, nanometal, nanometal oxide):
Encapsulated nanometal
Particle Functionalization or Capping Agent (if applicable):
List Study Objective(s) Relevant to Investigated Physicochemical Property:
• Platinum dendrimer-encapsulated nanoparticles (DENs) were prepared within sixth-generation, hydroxyl- terminated, poly(amidoamine) dendrimers.• These DENs were immobilized on glassy carbon electrodes, and the
effect of particle size on the kinetics of the oxygen reduction reaction (ORR) was quantitatively evaluated using rotating disk voltammetry.
Ye et al. (2007)
Specific Details on Tested Nanomaterial(s)
• Pla num (Pt)• hydroxyl-terminated, poly(amidoamine) dendrimers dendrimer encapsulated
Page B-162 of 177
Appendix B: Copy of DatabaseDetails on Preparation Method of Nanomaterial(s):
• A 100 uM aqueous solution of G6-OH dendrimer and a 50 mM aqueous solution of K2PtCl4 were added to water in a vial. The final concentration of the G6-OH dendrimer was always 10 uM and the final concentration of K2PtCl4
ranged from 0.55 to 2.4 mM to achieve metal:dendrimer ra os of 55:1, 100:1, 147:1, 200:1, and 240:1.• These solutions were stirred for 3 days to ensure Pt2+ binding to intradendrimer tertiary amines, and then a stoichiometric excess of freshly prepared, aqueous 1.0 M NaBH4 was added to reduce Pt2+. The final concentration of NaBH4 was 20 mM. After addition of NaBH4, the solutions were kept in sealed vials for 24 h to maximize
reduc on of Pt2+.• Finally, the solu ons were dialyzed for 24 h using a cellulose dialysis sack having a molecular weight cutoff of 12 000 to remove impurities. The DENs resulting from this procedure are denoted as G6-OH(Pt55), G6-OH(Pt100), G6-OH(Pt147), G6-OH(Pt200), and G6-OH(Pt240), where the numerical subscript represents the original PtCl4 2-:G6-OH ratio used for the synthesis and hence the average number of Pt atoms in each DEN.
Details on Tests Examining Physicochemical Property:
• Glassy carbon and Pt rotating disk electrodes were used for electrochemical experiments. The electrodes were prepared by successive polishing with 1.0 and 0.3 um alumina powder on a polishing cloth followed by sonication
in water for 5 min. The electrodes were then rinsed with water and dried under flowing N2 gas.• All electrochemical experiments were performed in a single-compartment, glass cell using a standard three-electrode configuration with a Pt-gauze (for Pt DEN immobilization) or an Au coil (ORR, H-adsorption/desorption, and CO
stripping experiments) counter electrode and a mercury/mercurous sulfate reference electrode.• For convenience, measured potentials are always converted to the potential of the reversible hydrogen electrode (RHE). Cyclic voltammetry and rotating disk voltammetry were performed using a computer-controlled Pine Instruments AFRDE4 potentiostat and ASR rotator. All electrochemical experiments were performed at 22 +/- 1 deg C.
Individual Particle Diameters Tested (nm):
1.44, 1.52, 1.66, 1.79, 1.90
Solution characteristics (pH, cosolvents or other additives, sonication, ionic strength)
• pH: No data• Cosolvents or other addi ves: No data• Sonica on: Used for prepara on of the electrode• Ionic strength (conductivity): No data
Min Diameter Tested (nm): 1.44
Max Diameter Tested (nm): 1.9
Specific Surface Area (SSA) (m2/g): No data
Bulk materials tested (≥ 1000 nm): No
Information on Analytical Methods Used to Determine Particle Size:
Transmission electron microscopy (TEM) was used to characterize nanoparticles. TEM measurements were performed using a JEOL-2010F TEM. Samples were prepared by placing several drops of solution on a carbon-coated CuTEM grid and allowing the solvent to evaporate in air.
List of Relevant Findings: • Using CO oxidation and H-desorption measurements at both 0.80 V and 0.85 V it was found that smaller encapsulated Pt nanopar cles had lower specific ac vi es for the ORR than larger NPs.• Bulk Pt electrodes had
the greatest specific activity for the ORR reaction at both 0.80 and 0.85 V.
Size versus Effect Relationship Observed by Authors?:
Yes
Mathematical Relationship Identified in Paper (if applicable):
None
Author‐Identified 'Bright Line' Particle Size (diameter) Threshold (nm) ‐ List if applicable:
None
Notes on 'Bright Line' Threshold: The tested particle size range is too small to determine a 'bright line' particle size threshold.
ARCADIS Discussion of Results The very small size range tested (1.44 to 1.90 nm) precludes a meaningful result to be extracted within the context of this project.
Nature of Size versus Effect Relationship (if applicable)
The specific activity of the NP catalyst increases with increasing size of the encapsulated nanoparticle catalyst.
Page B-163 of 177
Appendix B: Copy of Database
Physico‐chemical Property Investigated:
Photocatalytic activity
Priority of Property: High
Relevant for A1 Project?: Yes
Type of nanomaterial (eg, nanometal, nanometal oxide):
Nanocomposite thin film
Particle Functionalization or Capping Agent (if applicable):
PVP
List Study Objective(s) Relevant to Investigated Physicochemical Property:
• To investigate the size effects of Au nanoparticles (AuNPs) on the TiO2 crystalline phase of nanocomposite AuNPs-embedded TiO2 (Au-TiO2) thin films, their adsorption ability, and photocatalytic activity.
• AuNPs stabilized by PVP (K-25) were synthesized by chemically reducing AuCl4 with an NaBH4 solution in a PVP aqueous solution. NaAuCl4.2H2O (16 mM, 20 mL Milli-Q-water) was added to a 106.4 mg PVP aqueous solution
(300 mL) with s rring for 30 min, producing a yellow solu on.• TiO2 film and AuNPs-embedded TiO2 composite (Au-TiO2) films were prepared by a sol gel method. First, NH(C2H4OH)2 and a half amount of C2H5OH were mixed for 30 min, followed by adding Ti(O-i-C3H7)4 with stirring for 30 min at room temperature (solution A). Another solution B prepared by mixing the remaining C2H5OH with H2O was dropped into solution A for 30 min with
s rring, followed by s rring for a further 60 min.• To prepare an Au-TiO2 composite film, the prepared AuNPs@PVP ethanol solution including H2O was used, leading to the sol solution with a final gold concentration of 5.5 mol %. A quartz glass substrate (9 x 70 x 1mm^3) was dipped into the resulting sol solution, and then drawn up at the rate of 0.5 mm/s, followed by drying at 100 deg C for 10 min and heating at 300 deg C for 10 min. This
process was repeated 8 mes and the resul ng gel film was heated at various temperatures for 3 h.• Finally, a total of 18 films of TiO2 (Tx), sAuNPs-embedded TiO2 (sATx), and LAuNPs-embedded TiO2 (LATx) were obtained by heat treatment at temperatures of x = 400, 500, 600, 700, 800, and 900 deg C.
Details on Tests Examining Physicochemical Property:
• A methylene blue (MB) aqueous solution of 1.63E05 M was photocatalyzed in a quartz cell (10 x 10 x 65 mm^3) at 25 deg C. The film immersed in the solu on was irradiated by a 365 nm UV lamp.• A Shimadzu UV-1700 UV vis
spectrophotometer was used to measure absorption spectra of the MB aqueous solution as a function of the UV irradiation time. The MB aqueous solution was bubbled with O2 gas for 20 min prior to the irradiation and the bubbling was continued during irradiation.
Individual Particle Diameters Tested (nm):
2.0, 7.9
Solution characteristics (pH, cosolvents or other additives, sonication, ionic strength)
• pH: No data• Cosolvents or other addi ves: PVP (protec ng agent)• Sonica on: Not performed• Ionic strength (conductivity): No data
Min Diameter Tested (nm): 2
Max Diameter Tested (nm): 7.9
Specific Surface Area (SSA) (m2/g): No data
Bulk materials tested (≥ 1000 nm): No
Information on Analytical Methods Used to Determine Particle Size:
Transmission electron microscopy (TEM) was used to determine particle size.
List of Relevant Findings: • The film doped with the smaller AuNPs@PVP and annealed at 500 deg C showed the highest photocatalytic activity among the obtained films because it had the well-crystallized anatase phase and the high adsorption ability, which was attributed to the existence of a five-coordinated Ti site that was revealed from Ti K-edge XANES measurements.
Page B-164 of 177
Appendix B: Copy of DatabaseSize versus Effect Relationship Observed by Authors?:
Yes
Mathematical Relationship Identified in Paper (if applicable):
None
Author‐Identified 'Bright Line' Particle Size (diameter) Threshold (nm) ‐ List if applicable:
None
Notes on 'Bright Line' Threshold: Au-TiO2 films of size 2 and 7.9 nm were tested and the photocatalytic reaction rate for methylene blue was higher for 2 nm particles. A 'bright line' particle size threshold cannot be established from these data.
ARCADIS Discussion of Results None
Nature of Size versus Effect Relationship (if applicable)
Photocatalytic activity increased with decreasing particle size.
Physico‐chemical Property Investigated:
Reactivity
Priority of Property: High
Relevant for A1 Project?: Yes
Type of nanomaterial (eg, nanometal, nanometal oxide):
Nanometal
Particle Functionalization or Capping Agent (if applicable):
None
List Study Objective(s) Relevant to Investigated Physicochemical Property:
• To determine the size-dependent reactivity of aluminum nanoparticles measured by single-particle mass-spectrometry.
Zachariah et al. (2004)
Specific Details on Tested Nanomaterial(s)
• Aluminum oxide (Al2O3)
Details on Preparation Method of Nanomaterial(s):
• Aluminum nanoparticles used were either generated in-house by DC arc discharge or laser ablation methods, or by use of commercial aluminum nanopowders.
Details on Tests Examining Physicochemical Property:
• Nanoparticles were oxidized in a flow reactor in air for specified residence time (25 ~ 1100 deg C) and subsequently sampled by the SPMS.• The mass spectra obtained were used to quan ta vely determine the
elemental composition of individual particles and their size.
Individual Particle Diameters Tested (nm):
No data
Solution characteristics (pH, cosolvents or other additives, sonication, ionic strength)
Not applicable
Min Diameter Tested (nm): ca. 15
Max Diameter Tested (nm): 150
Specific Surface Area (SSA) (m2/g): No data
Bulk materials tested (≥ 1000 nm): No
Information on Analytical Methods Used to Determine Particle Size:
No data
List of Relevant Findings: • The authors found that the reactivity of aluminum nanoparticles is enhanced with decreasing primary particle size. Aluminum nanoparticles produced from the DC arc, which provided primary particle size of the smallest size (~15 nm), were found to be the most reactive (~99% aluminum nanoparticles oxidized to aluminum oxide at 900
deg C).• In contrast, nanopowder with primary par cle size greater than ~80 nm was not fully oxidized even at 1100 deg C.•The authors also determined the size dependent reac on rate constants and Arrhenius parameters
(activation energy and pre-exponential factor). As particle size decreased, the reaction rate constant increased and the activation energy decreased. For example, the activation energy for oxidation of DC arc-generated aluminum nanoparticles was only 24 kJ/mol for particles smaller than 50 nm, but increased to 94 kJ/mol for particles in the size range from 100 to 150 nm.
Page B-165 of 177
Appendix B: Copy of DatabaseSize versus Effect Relationship Observed by Authors?:
Yes
Mathematical Relationship Identified in Paper (if applicable):
None
Author‐Identified 'Bright Line' Particle Size (diameter) Threshold (nm) ‐ List if applicable:
ca. 80
Notes on 'Bright Line' Threshold: Aluminum nanopowder with primary particle size greater than ~80 nm was not fully oxidized even at 1100 deg C.
ARCADIS Discussion of Results None
Nature of Size versus Effect Relationship (if applicable)
The rate of oxidation of Al NPs increases with decreasing particle size.
Physico‐chemical Property Investigated:
Reactivity
Priority of Property: High
Relevant for A1 Project?: Yes
Type of nanomaterial (eg, nanometal, nanometal oxide):
Nanometal
Particle Functionalization or Capping Agent (if applicable):
None
List Study Objective(s) Relevant to Investigated Physicochemical Property:
• To investigate the relationship between the surface properties (porosity, adsorption, catalytic activity) of TiO2 nanoparticles with particle diameter.
Zaki et al. (2011)
Specific Details on Tested Nanomaterial(s)
• Titanium dioxide (TiO2)• anatase
Details on Preparation Method of Nanomaterial(s):
• Nanoparticles were obtained after annealing of an ambient dried titania xerogel at 300, 400 and 500 deg C for 24 h in air. The TiO2 samples were kept dry over silica gel until further use and were found by ICP and CHNSO analyses to be >98.9% pure TiO2.
Details on Tests Examining Physicochemical Property:
• TEM micrographs were recorded for the three test samples; the TEM of TiO2-8 reveals agglomerates of nano-sized crystallites (5-10 nm); the TEM of TiO2-19 visualizes agglomerates of larger crystallites (20–25 nm) assuming
polyhedral habits and shapes and exposing well defined crystal edges.• Cataly c ac vity proper es of the three titania samples were measured by means of in situ IR spectroscopy. The IR spectra were taken of the gas phase of MBOH/titania at RT and following heating the interface at 200 deg C for 5 min (and cooling back to RT).
Individual Particle Diameters Tested (nm):
8, 14, 19
Solution characteristics (pH, cosolvents or other additives, sonication, ionic strength)
Not applicable
Min Diameter Tested (nm): 8
Max Diameter Tested (nm): 19
Specific Surface Area (SSA) (m2/g): 30, 41, 80
Bulk materials tested (≥ 1000 nm): No
Information on Analytical Methods Used to Determine Particle Size:
Particle diameters were assessed by X-Ray Diffraction.
List of Relevant Findings: • The analytical absorption peak used, whose integrated area was measured, was the alcohol OH-absorption at 3644/cm.• Higher turnover number (TON; number of molecules decomposed per m^2 per min) for the alcohol
decomposition on TiO2-8 than on both TiO2-14 and TiO2-19. Relatively speaking, however, higher TON values have been brought about for MBOH decomposition on TiO2-14 than on TiO2-19. The TON values were 150, 20 and 8 for
TiO2 NPs with diameters of 8, 14 and 19 nm.• Since the TON is an intrinsic quan ty, the smaller the par cle size of the test titania the larger the number and/or energy of the catalytically active sites.
Page B-166 of 177
Appendix B: Copy of DatabaseSize versus Effect Relationship Observed by Authors?:
Yes
Mathematical Relationship Identified in Paper (if applicable):
None
Author‐Identified 'Bright Line' Particle Size (diameter) Threshold (nm) ‐ List if applicable:
None
Notes on 'Bright Line' Threshold: As the particle diameter decreases, the number and/or energy of the catalytically active sites increases. A 'bright line' threshold cannot be inferred from these data.
ARCADIS Discussion of Results None
Nature of Size versus Effect Relationship (if applicable)
The smaller the particle size the larger the number and/or energy of the catalytically active sites.
Physico‐chemical Property Investigated:
Reactivity
Priority of Property: High
Relevant for A1 Project?: Yes
Type of nanomaterial (eg, nanometal, nanometal oxide):
Nanometal
Particle Functionalization or Capping Agent (if applicable):
None
List Study Objective(s) Relevant to Investigated Physicochemical Property:
• To compare the cataly c behavior of these two types of catalysts in the reac on of CO oxida on.• To determine the calcina on temperature for which these catalysts are the most ac ve for this reac on.• To determine the
oxidation state of the gold species active in this reaction.
Zanella et al. (2004)
Specific Details on Tested Nanomaterial(s)
• Gold/titanium dioxide (Au/TiO2) catalysts
Details on Preparation Method of Nanomaterial(s):
• Titania Degussa P25 was used as support (45 m2/g, nonporous, 70% anatase and 30% rutile) and solid HAuCl4∙3H2O as the Au precursor.• For the Au/TiO2 prepara ons by deposi on-precipita on with NaOH (DP
NaOH), 100 mL of an aqueous solution of HAuCl4 (4.2 × 10⁻³ M) was heated to 80 deg C, the pH was adjusted to 7, then 1 g of TiO2 was dispersed in the solution and the pH was readjusted to 7. The suspension thermostatted at 80
deg C was vigorously s rred for 2 h.• For the Au/TiO2 prepara ons by deposi on-precipita on with urea (DP Urea), 1 g of TiO2 was added to 100 mL of an aqueous solution containing HAuCl4 and urea. The initial pH was ~2. The suspension thermostatted at 80 deg C was vigorously stirred for 16 h. Urea decomposition leads to a gradual rise in pH from 2 to 7. In both DP NaOH and DP Urea preparations, the amount of gold in solution corresponds to a
maximum gold loading of 8 wt% on TiO2.• The solids were gathered by centrifuga on (12,000 rpm for 10 min), washed in 100 mL of distilled water under stirring for 10 min at 50 deg C, and then centrifuged. The operation was repeated four times. The solids were dried under vacuum at room temperature for 16 h or at 100 deg C for 2 h or in air at room temperature for 48 h. The dried samples were stored away from light and under vacuum in a desiccator. Before characterization, the dried samples were calcined at various temperatures, between 150 and 400 deg C for 4 h.
Details on Tests Examining Physicochemical Property:
• Catalytic measurements of CO oxidation were carried out in a fixed-bed reactor using ~25 mg of DP NaOH catalysts and ~15 mg of DP Urea catalysts, but accurately weighed for each sample. The catalysts previously dried at 100 deg C were calcined at the 100, 150, 200, 300 or 400 deg C for 4 h. After calcination, the reactor was cooled to 5 deg C under air, which was replaced by a gas mixture consisting of 1% vol CO and 4% O2 balanced with N2 to 1
atm (99.3 mL/min). CO was analyzed at the outlet of the reactor with an IR detector.• The turnover frequency (TOF), number of molecules of CO converted per surface atom of gold particles and per second, was calculated for the two series of catalysts with the assumption that gold particles were cubo-octahedra. This hypothesis is supported by HRTEM observation.
Solution characteristics (pH, cosolvents or other additives, sonication, ionic strength)
• pH: ca. 2 to 7 (prepara on)• Cosolvents or other addi ves: None• Sonica on: Not performed• Ionic strength (conductivity): No data
Page B-167 of 177
Appendix B: Copy of DatabaseMin Diameter Tested (nm): 1.1
Max Diameter Tested (nm): 3.5
Specific Surface Area (SSA) (m2/g): No data
Bulk materials tested (≥ 1000 nm): No
Information on Analytical Methods Used to Determine Particle Size:
Transmission electron microscopy (TEM) was used to determine particle sizes.
List of Relevant Findings: • The average gold particle size increases with the calcination temperature. The activity of both series of catalysts varies with the calcination temperature as follows: 200 > 300 > 400 > 150 deg C. The DP NaOH catalyst calcined at 100 deg C presents a very low activity during the first hours of reaction and then becomes inactive, whereas the DP
Urea catalyst calcined at 100 deg C is fully inac ve.• The decrease of ac vity for calcina on temperatures higher than 200 deg C obviously cannot be due to the evolution of the oxidation state of gold because it is already purely
metallic. It can be related to the varia on of the par cle size which increases with the calcina on temperature.• The catalytic activity for CO oxidation starts when metallic gold starts forming. It is maximum after a calcination temperature of 200 deg C, for both types of preparation, when all the gold is metallic.
Size versus Effect Relationship Observed by Authors?:
Yes
Mathematical Relationship Identified in Paper (if applicable):
None
Author‐Identified 'Bright Line' Particle Size (diameter) Threshold (nm) ‐ List if applicable:
2 - 2.5
Notes on 'Bright Line' Threshold: The maximum catalytic activity was achieved for gold nanoparticles calcined at 200 deg C, which corresponds to a particle diameter of ca. 2 nm for DP NaOH and ca. 2.4 nm for DP Urea nanoparticles.
ARCADIS Discussion of Results None
Nature of Size versus Effect Relationship (if applicable)
The catalytic activity reaches a maximum at a particle size of ca. 2- ca. 2.5 nm.
Physico‐chemical Property Investigated:
Crystalline structure (structure)
Priority of Property: High
Relevant for A1 Project?: Yes
Type of nanomaterial (eg, nanometal, nanometal oxide):
Nanometal oxide
Particle Functionalization or Capping Agent (if applicable):
None
List Study Objective(s) Relevant to Investigated Physicochemical Property:
• To understand the impact of particle size on phase stability and phase transformation during growth ofnanocrystalline aggregates.
• Dry titania (TiO2) was synthesized by the sol-gel method.
Details on Tests Examining Physicochemical Property:
• Samples of anatase ca. 40 mg each were put into small alumina crucibles and then heated in air at temperatures between 480 and 580 deg C at an interval of 20 deg C for different periods of time. The phase contents and the average particle sizes of the nanophases of the heated samples were analyzed using XRD data following the approach from the literature.
Individual Particle Diameters Tested (nm):
No data
Solution characteristics (pH, cosolvents or other additives, sonication, ionic strength)
Not applicable
Page B-168 of 177
Appendix B: Copy of DatabaseMin Diameter Tested (nm): <11
Max Diameter Tested (nm): >35
Specific Surface Area (SSA) (m2/g): No data
Bulk materials tested (≥ 1000 nm): No
Information on Analytical Methods Used to Determine Particle Size:
X-Ray Diffraction (XRD) was used to determine particle size.
List of Relevant Findings: • For general titania samples, the transformation sequence among anatase and brookite depends on the initial particle sizes of anatase and brookite, since particle sizes determine the thermodynamic phase stability at ultrafine
sizes.• If par cle sizes of the three nanocrystalline phases are equal, anatase is most thermodynamically stable at sizes less than 11 nm, brookite is most stable for crystal sizes between 11 and 35 nm, and rutile is most stable at sizes greater than 35 nm.
Size versus Effect Relationship Observed by Authors?:
Yes
Mathematical Relationship Identified in Paper (if applicable):
None
Author‐Identified 'Bright Line' Particle Size (diameter) Threshold (nm) ‐ List if applicable:
11, 35
Notes on 'Bright Line' Threshold: Nanoparticle diameters of 35 and 1 nm mark the phase transformation sizes of TiO2 from rutile to brookite (35 nm) and from brookite to anatase (11 nm).
ARCADIS Discussion of Results No information on the actual particle sizes that were investigated is presented. They only report the initial particle size and mention that particles will coarsen with calcination.
Nature of Size versus Effect Relationship (if applicable)
As the size of nanoparticles decreases from 35 to <11 nm, the most stable phase transforms from rutile to brookite to anatase.
Physico‐chemical Property Investigated:
Crystalline structure (structure)
Priority of Property: High
Relevant for A1 Project?: Yes
Type of nanomaterial (eg, nanometal, nanometal oxide):
Nanometal oxide
Particle Functionalization or Capping Agent (if applicable):
None
List Study Objective(s) Relevant to Investigated Physicochemical Property:
• To investigate the particle size effects on the activation energy and the pre-exponential factor for the phase transformation of nanocrystalline anatase to rutile.
Zhang and Banfield (2005)
Specific Details on Tested Nanomaterial(s)
• Titanium dioxide (TiO2)• crystalline
Details on Preparation Method of Nanomaterial(s):
• Samples of nanocrystalline anatase of different average sizes (8-21 nm) were prepared by heating nanometer-sized amorphous titania at various temperatures. Nanometer-sized amorphous titania powders were produced by
hydrolysis of tanium ethoxide in water at 0 °C.• Subsamples of the amorphous tania were heated in air for 3 h at several temperatures between 375 and 550 °C, producing amorphous free single-phase nanocrystalline anatase of various average particle sizes in the range of 8-21 nm, as determined from X-ray diffraction (XRD) data using the
Scherrer equa on. • Transmission electron microscopy examina on showed that the nanopar cles are close to spherical.
Details on Tests Examining Physicochemical Property:
• Samples of anatase ca. 40 mg each were put into small alumina crucibles and then heated in air at temperatures between 480 and 580 °C at an interval of 20 °C for different periods of time. The phase contents and the average particle sizes of the nanophases of the heated samples were analyzed using XRD data following the approach from the literature.
Individual Particle Diameters Tested (nm):
8.2, 8.2, 12.1, 12.4, 17.0, 18.0, 21.4
Solution characteristics (pH, cosolvents or other additives, sonication, ionic strength)
• pH: No data• Cosolvents or other addi ves: No data• Sonica on: No data• Ionic strength (conduc vity): No data
Page B-169 of 177
Appendix B: Copy of DatabaseMin Diameter Tested (nm): 8.2
Max Diameter Tested (nm): 21.4
Specific Surface Area (SSA) (m2/g): 86.2, 97.0 (ca. 12 nm particles)
Bulk materials tested (≥ 1000 nm): No
Information on Analytical Methods Used to Determine Particle Size:
A Scintag PADV diffractometer with Cu KR radiation (lambda= 0.15419 nm) operated at 35 kV and 40 mA was used to collect X-ray diffraction patterns of nanoparticles dispersed on a low-background quartz plate. An accelerated surface area and porosimetry system (Micrometrics ASAP 2010) was used to determine the adsorption/desorption isotherms of nitrogen gas at 77 K on nanocrystalline anatase samples. The Brunauer- Emmett-Teller (BET) equation was used to calculate the specific surface areas of samples from the adsorption isotherms. The pore size distribution was calculated using the Barrett-Johner-Halenda (BJH) method.
List of Relevant Findings: • Particle size has an effect on the phase transformation rate (strong effect) constant and the required activation energy (weaker effect); the smaller the particle size the higher the rate constant and the higher the activation
energy.• The rela onship between the phase transforma on rate constant and temperature is described by the Arrhenius equation, which includes both an exponential factor and a pre-exponential factor. The pre-exponential factor increases dramatically as the particle size decreases. The high concentration of particle-particle contacts per unit volume in small anatase accounts primarily for the large pre-exponential factor.
Size versus Effect Relationship Observed by Authors?:
Yes
Mathematical Relationship Identified in Paper (if applicable):
None
Author‐Identified 'Bright Line' Particle Size (diameter) Threshold (nm) ‐ List if applicable:
None
Notes on 'Bright Line' Threshold: The anatase to rutile phase transformation rate increases with decreasing particle size while the activation energy required for the anatase to rutile phase transformation increases slightly. However, a 'bright line' particle size threshold cannot be established based on these data.
ARCADIS Discussion of Results Explana on in paper on why ac va on energy increases for anatase TiO2 nanopar cles: At a solid surface, coordination numbers of atoms are generally lower than those in the bulk. Due to the reduced coordination, forces exerted on surface atoms from neighbors are unbalanced in the direction normal to the surface, generating a net force acting upon atoms in the interior of the solid. The magnitude of the force on the surface per unit length is termed surface stress, (f). In a small solid particle, the unbalanced forces existing on the surface produce an excess pressure (Pexc), which compresses the particle, resulting in a contraction in the Ti-O bond, as revealed by conventional X-ray diffraction study and synchrotron X-ray absorption near-edge structure (XANES) study, and hence a stronger binding between Ti and O atoms. The effect is likely to be most pronounced at the surface. As a consequence, more thermal energy is needed to break and rearrange bonds to nucleate rutile at nanoparticle surfaces. This causes an increase in the activation energy that can be assumed to be proportional to the excess pressure.
Nature of Size versus Effect Relationship (if applicable)
Phase transformation rate constant increases with decreasing size and the activation energy increases slightly with decreasing size.
Physico‐chemical Property Investigated:
Photocatalytic activity
Priority of Property: High
Relevant for A1 Project?: Yes
Type of nanomaterial (eg, nanometal, nanometal oxide):
Nanometal
Particle Functionalization or Capping Agent (if applicable):
Particles doped with metal ion
List Study Objective(s) Relevant to Investigated Physicochemical Property:
A systematic study on the role of particle size in pure and doped nanocrystalline TiO2 photocatalysts, which was made possible by a versatile wet-chemical process capable of generating near agglomeration-free TiO2 with well-controlled particle sizes and dopant dispersion.
Zhang et al. (1998)
Specific Details on Tested Nanomaterial(s)
• Titanium dioxide (TiO2)• Nanocrystals (samples HA and HB: mostly anatase with a minor brookite component, Sample SA: pure anatase)• Doped with Fe3+
Page B-170 of 177
Appendix B: Copy of DatabaseDetails on Preparation Method of Nanomaterial(s):
• Nanocrystalline TiO2 samples were prepared through sol-gel hydrolysis precipitation of titanium isopropoxide (Ti(OCH(CH3)2)4), followed by hydrothermal treatment or post-calcina on.• Nine milliliters of Ti(OCH(CH3)2)4
(Alfa AESAR, 97%) dissolved in 41 mL of anhydrous ethanol was added dropwise to a mixed solution of 50 mL of deionized water and 50 mL of ethanol under vigorous stirring at room temperature. The as-precipitated gel was amorphous. In the hydrothermal treatment route, the gel suspension was directly transferred into high-pressure tubes and subjected to crystallization at 80 deg C for 24 h or 180 deg C for 96 h. The nanocrystalline TiO2 samples thus obtained were labeled as HA and HB, respectively. The hydrothermally treated suspension was then centrifuged for powder separation, washed several times with ethanol (to minimize agglomeration by breaking hydrogen bonding between particles), and dried at room temperature. In the post-calcination route, the gel precipitate was separated from the sol, washed with ethanol, and dried overnight at 110 deg C. Crystallization was achieved by calcination of the amorphous gel precipitate at 450 deg C for 2 h in flowing O2. The powder derived in this way was labeled as SA.
Details on Tests Examining Physicochemical Property:
• The current bottleneck in photocatalysis lies in its low quantum yield, which depends on the ratio of the surface charge carrier transfer rate to the electron-hole (e-/h+) recombination rate. To increase the quantum yield of nanocrystalline photocatalysts, the e-/h+ recombination has to be reduced. An effective method to achieve the separation of e- and h+ is to introduce defects into TiO2 lattice through selective metal ion doping. Dopant (Fe3+)
was incorporated into the TiO2 matrix at the following concentra ons: 0.0, 0.02, 0.05, 0.1, 0.2, 0.5 and 1.0 at. %• The reactivities of the various nanocrystalline catalytic systems (0.5 g/L loading rates) were characterized for the liquid-phase photocatalytic decomposition of CHCl3 (at 12 mM), and compared to that of the commercially available Degussa P25 TiO2 material, a 30-min UV irradiation testing system was employed
Individual Particle Diameters Tested (nm):
6.2, 10.1, 22.1
Solution characteristics (pH, cosolvents or other additives, sonication, ionic strength)
• pH: 11 (ini al pH during reac on)• Cosolvents or other addi ves: ethanol• Sonica on: 1 g of TiO2 powder was suspended ultrasonically in 200 mL of aqueous solution containing the desired amount of H2PtCl6 and 4 mL of methanol as the reducing agent
Min Diameter Tested (nm): 6.2
Max Diameter Tested (nm): 22.1
Specific Surface Area (SSA) (m2/g): No data
Bulk materials tested (≥ 1000 nm): No
Information on Analytical Methods Used to Determine Particle Size:
Average grain sizes were calculated from the broadening of the (101) X-Ray Diffraction (XRD) peak of anatase phase. As for the samples with dopant concentrations of interest to this work (0.02-1.0% for Fe3+), we did not observe any secondary phase, and the minor variation in particle size due to different doping levels was within the experimental uncertainty.
List of Relevant Findings: • Pure TiO2: The sample with an average diameter of 11 nm showed the highest photonic efficiency, while the 6-nm sample showed a photoreactivity that was 26% lower. The TiO2 sample with an average diameter of 21 nm and
the lowest surface area gave the lowest photoreac vity.• Fe3+ Doped: For samples with an average diameter of 6 nm, a small amount of Fe3+ dopants significantly enhanced the photoreactivity. The highest conversion for the 6-nm TiO2 sample was achieved at an Fe3+ concentration of 0.2%; Fe3+ doping became detrimental when the dopant concentration was 0.5% or higher. A similar behavior was observed in TiO2 with an average diameter of 11 nm, but the optimal Fe3+ concentration was 0.05%, which was lower than the optimal dopant concentration of 0.2% for 6-nm TiO2
Size versus Effect Relationship Observed by Authors?:
Yes
Mathematical Relationship Identified in Paper (if applicable):
None
Author‐Identified 'Bright Line' Particle Size (diameter) Threshold (nm) ‐ List if applicable:
11
Notes on 'Bright Line' Threshold: For pure TiO2 catalysts, the photoreactivity of pure TiO2 increases when particle size is reduced from 22.1 to 10.1 nm, but decreases when it is further reduced to 6.2 nm. A particle size of about 10 nm might be the optimal value for pure TiO2 photocatalyst in liquid-phase decomposition of CHCl3.
ARCADIS Discussion of Results None
Nature of Size versus Effect Relationship (if applicable)
The photonic efficiency of pure TiO2 reached a maximum at a particle diameter of 11 nm.
Page B-171 of 177
Appendix B: Copy of Database
Physico‐chemical Property Investigated:
Photocatalytic activity
Priority of Property: High
Relevant for A1 Project?: Yes
Type of nanomaterial (eg, nanometal, nanometal oxide):
Nanometal
Particle Functionalization or Capping Agent (if applicable):
Particles doped with metal ion
List Study Objective(s) Relevant to Investigated Physicochemical Property:
A systematic study on the role of particle size in pure and doped nanocrystalline TiO2 photocatalysts, which was made possible by a versatile wet-chemical process capable of generating near agglomeration-free TiO2 with well-controlled particle sizes and dopant dispersion.
Zhang et al. (1998)
Specific Details on Tested Nanomaterial(s)
• Titanium dioxide (TiO2)• Nanocrystals (samples HA and HB: mostly anatase with a minor brookite component, Sample SA: pure anatase)• Doped with Nb5+
Details on Preparation Method of Nanomaterial(s):
• Nanocrystalline TiO2 samples were prepared through sol-gel hydrolysis precipitation of titanium isopropoxide (Ti(OCH(CH3)2)4), followed by hydrothermal treatment or post-calcination.
Details on Tests Examining Physicochemical Property:
• The current bottleneck in photocatalysis lies in its low quantum yield, which depends on the ratio of the surface charge carrier transfer rate to the electron-hole (e-/h+) recombination rate. To increase the quantum yield of nanocrystalline photocatalysts, the e-/h+ recombination has to be reduced. An effective method to achieve the separation of e- and h+ is to introduce defects into TiO2 lattice through selective metal ion doping. Dopant (Nb5+)
was incorporated into the TiO2 matrix at concentra ons of: 0.0, 0.1, 0.2, 0.5 and 1.0 at.%• Pla num was loaded to pure TiO2 and Nb5+-doped TiO2 at 0.0 or 0.5 wt%• The reac vi es of the various nanocrystallinecatalyst
systems (0.5 g/L loading rate) were characterized for the liquid-phase photocatalytic decomposition of CHCl3 (at 12 mM), and compared to that of the commercially available Degussa P25 TiO2 material, a 30-min UV irradiation testing system was employed
Individual Particle Diameters Tested (nm):
6, 11, 21
Solution characteristics (pH, cosolvents or other additives, sonication, ionic strength)
• pH: 11 (ini al pH during reac on)• Cosolvents or other addi ves: ethanol• Sonica on: 1 g of TiO2 powder was suspended ultrasonically in 200 mL of aqueous solution containing the desired amount of H2PtCl6 and 4 mL of methanol as the reducing agent
Min Diameter Tested (nm): 11
Max Diameter Tested (nm): 21
Specific Surface Area (SSA) (m2/g): No data
Bulk materials tested (≥ 1000 nm): No
Information on Analytical Methods Used to Determine Particle Size:
Average grain sizes were calculated from the broadening of the (101) X-Ray Diffraction (XRD) peak of anatase phase. As for the samples with dopant concentrations of interest to this work (0.1-1.0% for Nb5+), we did not observe any secondary phase, and the minor variation in particle size due to different doping levels was within the experimental uncertainty.
List of Relevant Findings: • Pure TiO2: The sample with an average diameter of 11 nm showed the highest photonic efficiency, while the 6-nm sample showed a photoreactivity that was 26% lower. The TiO2 sample with an average diameter of 21 nm and
the lowest surface area gave the lowest photoreac vity.• Nb5+ Doped: For both 11- and 21-nm TiO2 samples, the photoreactivities were reduced by sole Nb5+ doping, and the photonic efficiencies decreased monotonically with
increasing Nb5+ concentra on for dopant concentra ons of less than 1.0%.• Pt Loaded TiO2: For both 11- and 21-nm TiO2 systems, a small amount (0.5 wt%) of Pt loading on TiO2 particle surface significantly enhanced the photoreactivities. The photoreactivity of the 21-nm TiO2 sample loaded with 0.5 wt% Pt was further increased when a small amount (0.2-0.5%) of Nb5+ dopants was introduced into the TiO2 matrix. However, when Nb5+ dopant concentration was increased to 1.0 at. %, a negative effect on photonic efficiency was noted. The optimal Nb5+ concentration for 0.5 wt% Pt-loaded 21-nm TiO2 was found to be 0.5 at. %.
Page B-172 of 177
Appendix B: Copy of DatabaseSize versus Effect Relationship Observed by Authors?:
Yes
Mathematical Relationship Identified in Paper (if applicable):
None
Author‐Identified 'Bright Line' Particle Size (diameter) Threshold (nm) ‐ List if applicable:
11
Notes on 'Bright Line' Threshold: For pure TiO2 catalyst, the photoreactivity of pure TiO2 increases when particle size is reduced from 21 to 11 nm, but decreases when it is further reduced to 6 nm. A particle size of about 11 nm might be the optimal value for pure TiO2 photocatalyst in liquid-phase decomposition of methylene chloride.
ARCADIS Discussion of Results None
Nature of Size versus Effect Relationship (if applicable)
For pure TiO2, the photoefficiency reached a maximum at 11 nm and decreased with both increasing and decreasing particle size.
Physico‐chemical Property Investigated:
Crystalline structure (structure)
Priority of Property: High
Relevant for A1 Project?: Yes
Type of nanomaterial (eg, nanometal, nanometal oxide):
Nanometal oxide
Particle Functionalization or Capping Agent (if applicable):
None
List Study Objective(s) Relevant to Investigated Physicochemical Property:
• This study reports the preparation of nanoparticles of cerium oxide with a narrow size distribution and investigates size-dependence of the nanoparticles on the lattice parameter.
Zhang et al. (2002)
Specific Details on Tested Nanomaterial(s)
• Cerium oxide (CeO2)
Details on Preparation Method of Nanomaterial(s):
• Ceria nano-particles of narrow size distribution were prepared by mixing equal volumes of solutions of 0.0375 M Ce(NO3)3 and 0.5 M hexamethylenetetramine at room temperature. By controlling the reaction time, batches of particles with sizes in the range of 3-12 nm are obtained. Larger particles are made by sintering at 400- 800 deg C for 30 min. By measuring over 100 with TEM, the full width at half maximum (FWHM) of the size distribution peak of each batch is found to be less than +/- 15% of the median size.
Details on Tests Examining Physicochemical Property:
• Ceria, of cubic fluorite structure, gives isolated peaks in x-ray diffraction. By plotting the lattice parameter calculated from each (hkl) reflec on against cos^2(theta), we obtain the la ce parameter.• All the x-ray
diffraction experiments are performed using a Scintag X2 diffractometer using the Cu Ka line with scan rate of 0.025 deg/step and 5 s/step. Five peaks are selected with 2u ranging from 80 to 140 deg.
Individual Particle Diameters Tested (nm):
ca. 5, ca. 7, ca. 9, ca. 10, ca. 15, ca. 25, ca. 80
Solution characteristics (pH, cosolvents or other additives, sonication, ionic strength)
Not applicable
Min Diameter Tested (nm): ca. 5
Max Diameter Tested (nm): ca. 80
Specific Surface Area (SSA) (m2/g): No data
Bulk materials tested (≥ 1000 nm): No
Information on Analytical Methods Used to Determine Particle Size:
Particle sizes are also determined from x-ray diffraction (XRD) results using the Scherrer equation.
List of Relevant Findings: • A comparison of x-ray spectra from nanosized and micron-sized ceria shows a peak shift towards lower angles and peak broadening in nanopar cle ceria.• Compared with micron-size CeO2 par cles (~5000 nm), the la ce
parameter of 6.1 nm particles increases from 0.54087 nm (bulk) to 0.54330 nm (i.e., by 0.45%). From high-resolution TEM results, this lattice constant change is not caused by defects such as disclinations in multiple-
twinned par cles or volume expansion in high angle boundaries.• Within the size range tested in this study, the lattice parameter significantly increases with decreasing particle size when the particle size is smaller than 20 nm.
Page B-173 of 177
Appendix B: Copy of DatabaseSize versus Effect Relationship Observed by Authors?:
Yes
Mathematical Relationship Identified in Paper (if applicable):
None
Author‐Identified 'Bright Line' Particle Size (diameter) Threshold (nm) ‐ List if applicable:
20
Notes on 'Bright Line' Threshold: Within the size range tested in this study, the lattice parameter significantly increases with decreasing particle size when the particle size is smaller than 20 nm.
ARCADIS Discussion of Results None
Nature of Size versus Effect Relationship (if applicable)
The lattice parameter significantly increases with decreasing particle size ca. 5 to ca. 80 nm.
Physico‐chemical Property Investigated:
Crystalline structure (structure)
Priority of Property: High
Relevant for A1 Project?: Yes
Type of nanomaterial (eg, nanometal, nanometal oxide):
Nanometal oxide
Particle Functionalization or Capping Agent (if applicable):
None
List Study Objective(s) Relevant to Investigated Physicochemical Property:
• In this paper, the size dependent phase stability of ZrO2 is explored experimentally and theoretically associated with t→m transforma on by taking considera on of ‘excess volume’ of an interface
Zhang et al. (2006)
Specific Details on Tested Nanomaterial(s)
• Zirconium dioxide (ZrO2)• amorphous, hydrated
Details on Preparation Method of Nanomaterial(s):
• Amorphous hydrated ZrO2 was precipitated from a hot solution of ZrOCl2∙8H2O with NH3, washed by the distilled water, and dried for 48 h at around 100 deg C.
Details on Tests Examining Physicochemical Property:
• In order to obtain nano-sized particles with various grain sizes, the as-prepared amorphous powders were heated for different me in a furnace preheated to 1300 deg C and then quenched.• in order to survey the stability of t-
ZrO2 further, the powders are a erward grinded in an agate mortar and immerged into liquid nitrogen.• To elucidate the relationship between the structural stability and grain size, the Gibbs free energy of t- and m-particles in the equilibrium state are calculated.
Individual Particle Diameters Tested (nm):
14, 16, 18, 21, 22, 29, 31
Solution characteristics (pH, cosolvents or other additives, sonication, ionic strength)
Not applicable
Min Diameter Tested (nm): 14
Max Diameter Tested (nm): 31
Specific Surface Area (SSA) (m2/g): No data
Bulk materials tested (≥ 1000 nm): No
Information on Analytical Methods Used to Determine Particle Size:
The average grain sizes in diameter (d) of the powders were determined from the (111) peak of X-ray diffraction (Dmax-rC) using the Scherrer formula: d = 0.89λ/B cos θ, where is the wavelength of X-ray (Cu K 1), B is the corrected half-width of diffraction peak and θ is the diffraction angle, respectively. The grain sizes were also verified by the transmission electron microscopy (TEM).
List of Relevant Findings: • The powders were found composed of monoclinic (m) phase when the particle size (d) is larger than 31 nm, whereas tetragonal (t) phase remains stable at room temperature when particle size is less than 14 nm. The
mixture of the t and m phases is observed when average par cle size locates between 14 and 31 nm.• Thermodynamic calculation indicates that the surface free energy difference between tetragonal and monoclinic phases surpasses the volume chemical free energy difference between two phases at room temperature when the
par cle size of zirconia decreases below13 nm.• The ZrO2 par cles with 14 < d < 31 nm are metastable possibly due to a kinetic nucleation barrier.
Page B-174 of 177
Appendix B: Copy of DatabaseSize versus Effect Relationship Observed by Authors?:
Yes
Mathematical Relationship Identified in Paper (if applicable):
None
Author‐Identified 'Bright Line' Particle Size (diameter) Threshold (nm) ‐ List if applicable:
13
Notes on 'Bright Line' Threshold: For particle diameters smaller than 13 nm, the tetragonal phase is thermodynamically favorable (lower surface energy, lower Gibbs free energy) while for particle diameters greater than 13 nm and smaller than 31, the monoclinic phase is favorable (lower Gibbs free energy).
ARCADIS Discussion of Results None
Nature of Size versus Effect Relationship (if applicable)
For particle diameters smaller than or equal to 18 nm, the tetragonal phase is thermodynamically favorable (lower surface energy, lower Gibbs free energy) while for particle diameters greater than 21 nm and smaller than 31, the monoclinic phase is favorable (lower Gibbs free energy).
Physico‐chemical Property Investigated:
Crystalline structure (structure)
Priority of Property: High
Relevant for A1 Project?: Yes
Type of nanomaterial (eg, nanometal, nanometal oxide):
Nanometal oxide
Particle Functionalization or Capping Agent (if applicable):
None
List Study Objective(s) Relevant to Investigated Physicochemical Property:
•The current study derived formulas to relate surface free energy and surface stress for nanopar cles.• Apply the formulas to X-ray diffraction (XRD)-based measurements of lattice contraction to determine the surface free energies of nanometer-sized TiO2 and examine their size dependence.
• Nanocrystalline anatase (average diameter >5 nm) was synthesized from amorphous titania. The amorphous precursor was prepared by hydrolysis of titanium ethoxide in water at 0 deg C. Twenty-nine milliliters of water containing 4 drops of acetic acid was quickly added to a mixture of titanium ethoxide (21 mL) and ethanol (25 mL) under stirring. The formed amorphous precipitate was centrifuged, washed and dried. The amorphous product was then heated for 3 h between 375 and 550 deg C. Upon heating, the amorphous precursor of titania crystallized into
nanocrystalline anatase.• Small nanocrystalline anatase (average diameter <5 nm) was prepared by hydrolysis of isopropoxide in an aq. HCl solution. Twenty milliliters ethanol solution of titanium isopropoxide (~10% in volume) was dripped into 200 mL aq. HCl (pH ~ 1) under magnetic stirring. Titania precipitated as the result of the hydrolysis of titanium isopropoxide. The precipitates were separated from the solution by filtration and dried. The obtained titania powder was purified and dried at 30 deg C for 2 days; nanoparticles produced from this route are 3–5 nm in diameter.
Details on Tests Examining Physicochemical Property:
• X-Ray diffraction (XRD) was used to identify the phase of the nanocrystalline titania and to determine its lattice parameters.• A small amount of silicon powder was added to each tania sample for accurate determina on of
the lattice parameters of the sample. The mixture was ground and mixed well in acetone and then dripped onto a low X-ray scattering background silica plate. After drying, the powders dispersed well on the plate. The plate was loaded into the sample holder of an X-ray diffractometer operated at 40 kV and 40 mA with a Co Ka radiation X-ray source (wavelength = 0.17903 nm). The XRD pattern was collected in the 2theta range of 15–85 deg with a
scanning rate of 11/min.• The XRD determina on of cell parameters was repeated eight mes for each sample.
Individual Particle Diameters Tested (nm):
<5, ca. 4-34
Solution characteristics (pH, cosolvents or other additives, sonication, ionic strength)
• pH: For preparation of NPs < 5 bm, titanium isopropxode was dipped in ph 1 HCl for hydrolysis. No data on the pH during the experiment.• Cosolvents or other addi ves: ethanol (for par cles > 5 nm)• Sonica on:
Nanopar cles were sonicated prior to transmission electron microscopy (TEM) analysis.• Ionic strength (conductivity): No data
Page B-175 of 177
Appendix B: Copy of DatabaseMin Diameter Tested (nm): ca. 4
Max Diameter Tested (nm): 34
Specific Surface Area (SSA) (m2/g): No data
Bulk materials tested (≥ 1000 nm): No
Information on Analytical Methods Used to Determine Particle Size:
Transmission electron microscopy (TEM) characterization of the nanocrystalline anatase was done with a Philips CM200 high-resolution transmission electron microscope operated at 200 kV. A TEM specimen was prepared by depositing a drop of water containing ultrasonically dispersed titania nanoparticles onto a carbon-coated copper TEM grid that was then dried in air. TEM images were recorded on negatives that were subsequently digitized for analysis.
List of Relevant Findings: • The lattice parameter (a) was significantly reduced (lattice contraction) smaller than a particle diameter of ca. 5 nm. From a par cle size range of ca. 5 to 34 nm, there is not a sta s cal difference in the la ce parameter (a).•
The lattice parameter (c) continuously increased (lattice expansion) over the range of ca. 4 to 34 nm.
Size versus Effect Relationship Observed by Authors?:
Yes
Mathematical Relationship Identified in Paper (if applicable):
None
Author‐Identified 'Bright Line' Particle Size (diameter) Threshold (nm) ‐ List if applicable:
None
Notes on 'Bright Line' Threshold: While not stated in the paper, a particle size threshold appears to exist for lattice parameter (a) around a diameter of 5 nm as this is the only statistically significant decrease in this (a) parameter over the entire size range tested. The lattice parameter (c) decreases as a function of size in what appears to be a semi-linear relationship; therefore, no 'bright line' particle size threshold can be determined for the (c) parameter.
ARCADIS Discussion of Results None
Nature of Size versus Effect Relationship (if applicable)
Lattice contraction occurs as the particle size decreases, particularly below 5 nm for parameter (a).
Physico‐chemical Property Investigated:
Reactivity
Priority of Property: High
Relevant for A1 Project?: Yes
Type of nanomaterial (eg, nanometal, nanometal oxide):
Nanometal
Particle Functionalization or Capping Agent (if applicable):
None
List Study Objective(s) Relevant to Investigated Physicochemical Property:
• The size-dependence of Au NP activity in both the catalytic product formation reaction and the product dissocia on reac on was examined.• The size-dependence of Au NP selec vity in the two parallel product
dissocia on pathways, and of their surface-restructuring-coupled cataly c dynamics is examined.• The size-dependence of Au NP surface-restructuring-coupled catalytic dynamics is examined.
Zhou et al. (2010)
Specific Details on Tested Nanomaterial(s)
• Gold (Au)
Page B-176 of 177
Appendix B: Copy of DatabaseDetails on Preparation Method of Nanomaterial(s):
• All commercial materials were used as received unless specified.• The three different-sized Au-nanopar cles, prepared from citrate reduction of HAuCl4 in aqueous solutions, were purchased from British Biocell International/Ted Pella.
Details on Tests Examining Physicochemical Property:
• The ability of Au NPs to catalyze the transformation of resazurin to resorufin was investigated at the single molecule scale.• A flow cell, 100 μm (height) × 2 cm (length) × 5 mm (width), formed by double-sided tapes
sandwiched between a quartz slide and a borosilicate cover slip, was used to hold aqueous reactant solutions for single-molecule fluorescence measurements. The quartz slide was amine-functionalized by an aminoalkylsiloxane reagent to have a positively charged surface to immobilize the negatively charged Au-nanoparticles. Reactant solutions were supplied in continuous flow at 5 μL/min using a syringe pump. All single-molecule imaging experiments of nanoparticle catalysis were carried out at room temperature with a saturating NH2OH
concentra on of 1 mM at neutral pH.• Single-molecule fluorescence measurements were performed using a home- built prism-type total internal reflection fluorescence microscope. A continuous wave circularly polarized 532 nm laser beam of 2-6 mW was focused onto an area of ∼50 × 90 μm^2 on the sample to directly excite the fluorescence of resorufin. The fluorescence was collected by a 60× NA1.2 water-immersion objective, filtered, and detected by an ANDOR Ixon EMCCD camera operated at 50 ms frame rate.
Individual Particle Diameters Tested (nm):
6, 9.1, 13.7
Solution characteristics (pH, cosolvents or other additives, sonication, ionic strength)
Not applicable
Min Diameter Tested (nm): 6
Max Diameter Tested (nm): 13.7
Specific Surface Area (SSA) (m2/g): No data
Bulk materials tested (≥ 1000 nm): No
Information on Analytical Methods Used to Determine Particle Size:
Transmission electron microscopy (TEM) was used to determine the size of the nanoparticles.
List of Relevant Findings: • Two reactions describe the overall catalytic activity of Au NPs: the catalytic product formation reaction (formation of resorfurin from resazurin) and the product dissocia on reac on (resorfurin dissocia on from Au NPs)• For the
catalytic product formation reaction, γ(eff), the single particle catalytic rate constant, decreases with decreasing size, indicating the lower catalytic reactivity per particle for smaller nanoparticles. This decrease of γ(eff) mainly results from the smaller surface area (i.e., fewer surface catalytic sites) of the smaller nanoparticles, because the catalytic reactivity per surface area, γ(eff)/A (A is the nanoparticle surface area), increases with decreasing size. This increase in reactivity per surface area reports the higher catalytic reactivity per catalytic site for smaller nanoparticles and is accompanied by a decrease of substrate adsorption equilibrium constant at each site (K1). Therefore, for the Au-nanoparticles studied here, higher catalytic reactivity is correlated with weaker substrate
binding to the cataly c site.• For the product dissocia on reac on, the rate constants of both the substrate-assisted dissociation pathway (k2) and the direct dissociation pathway (k3) decrease with decreasing particle size. These decreases in product dissociation rate constants suggest a stronger binding of the product resorufin to the
nanopar cle surface, in contrast with the weaker binding of the substrate resazurin, for smaller nanopar cles.• In contrast, the product binding affinity increases with decreasing particle size, reflected by a decrease of the rate constants in the two product dissociation pathways.
Size versus Effect Relationship Observed by Authors?:
Yes
Mathematical Relationship Identified in Paper (if applicable):
Yes - There are too many complex equations to reproduce in this spreadsheet.
Author‐Identified 'Bright Line' Particle Size (diameter) Threshold (nm) ‐ List if applicable:
None
Notes on 'Bright Line' Threshold: Both the catalytic production formation and product dissociation reaction rate constants decrease with decreasing particle size of the Au catalyst; however, these relationships do not allow for the determination of a 'bright line' particle size threshold for the particle size range tested.
ARCADIS Discussion of Results None
Nature of Size versus Effect Relationship (if applicable)
Both the catalytic production formation and product dissociation reaction rate constants decrease with decreasing particle size of the Au catalyst.


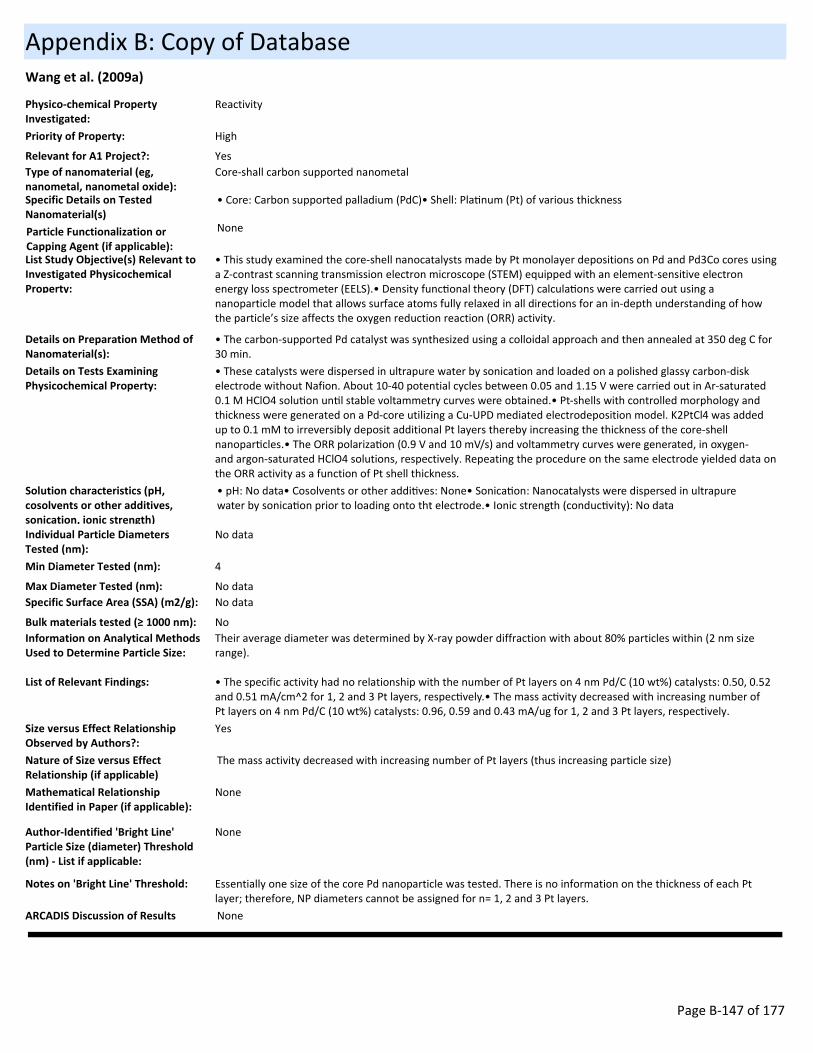


![research for RIJKSINSTITUUT VOOR VOLKSGEZONDHEID ... - …current report is a valuable addition to the approach as followed by Blok et al. [1999]. page 12 of 40 RIVM report 601503](https://static.documents.pub/doc/80x56/5e5768e0433a311b291010aa/research-for-rijksinstituut-voor-volksgezondheid-current-report-is-a-valuable.jpg)


