10/11/2016 1 Network Diagram 1 11/10/2016 WORK BREAKDOWN STRUCTURE (WBS) A work breakdown structure is a key project deliverable that organizes the team's work into manageable sections. The Project Management Body of Knowledge (PMBOK) defines the work breakdown structure as a "deliverable oriented hierarchical decomposition of the work to be executed by the project team." The work breakdown structure visually defines the scope into manageable chunks that a project team can understand, as each level of the work breakdown structure provides further definition and detail. 11/10/2016 Engr. Shehroze Ali 2
Transcript
10/11/2016
1
Network Diagram
1 11/10/2016
WORK BREAKDOWN STRUCTURE (WBS)
A work breakdown structure is a key project deliverable that organizes the team's work into manageable sections. The Project Management Body of Knowledge (PMBOK) defines the work breakdown structure as a "deliverable oriented hierarchical decomposition of the work to be executed by the project team." The work breakdown structure visually defines the scope into manageable chunks that a project team can understand, as each level of the work breakdown structure provides further definition and detail.
11/10/2016 Engr. Shehroze Ali 2
10/11/2016
2
WBS Dictionary WBS Dictionary describes each component of the WBS e.g.
• Milestone
• Deliverables
• Activities
• Scope
• Resources
• Quality
• Cost
• Sometime dates
11/10/2016 Engr. Shehroze Ali 3
WORK BREAKDOWN STRUCTURE (WBS)
11/10/2016 Engr. Shehroze Ali 4
10/11/2016
3
ORGANIZATION BREAKDOWN STRUCTURE (OBS)
The OBS displays organizational relationships and then uses them for assigning work to resources in a project. The hierarchical nature of the Organizational Breakdown Structure allows for the appropriate resources and responsibilities to be assigned. It allows an at-a-glance look at the organizational resources structured in a hierarchical manner. An OBS is helpful in:
· Project Management
· Workforce Management
· Work Breakdown Structure
· Having a visual reference of the resources for any project
· Viewing costs by resource
· Viewing responsibilities by resource
11/10/2016 Engr. Shehroze Ali 5
ORGANIZATION BREAKDOWN STRUCTURE (OBS)
11/10/2016 Engr. Shehroze Ali 6
10/11/2016
4
RESPONSIBILITY ASSIGNMENT MATRIX (RAM)
RAM uses the WBS and OBS to link deliverables and/or activities to resources. The RAM provides a realistic picture of the resources needed and can identify if you have enough resources for the project.
11/10/2016 Engr. Shehroze Ali 7
RESPONSIBILITY ASSIGNMENT MATRIX (RAM)
11/10/2016 Engr. Shehroze Ali 8
10/11/2016
5
BASIC TERMINOLOGIES Activity:
Activity represent work to be done in order to complete a project.
OD (original duration) and RD (remaining duration):
The estimated time required to complete an activity is called OD. The amount of time left to complete an activity after it has started is known as RD.
Critical Path
The Critical Path of a project is the sequence of activities that determine the project completion date – any delay in an activity or activities comprising the critical path will delay the project by a corresponding amount of time. It has zero float and is the longest path in the network.
Predecessor:
An activity that must occur before another activity. A predecessor activity controls the start or finish date of its successor (s). An activity can have multiple predecessors, each with different relationship to it.
Successor:
An activity that must occur after another activity. An activity can have multiple successor, each with different relationships to it.
Relationships/Task Dependencies:
Any sort of connection between two activities is known as relationship. There are four types of relationships:
SS (start to start)
FS (finish to start)
FF (finish to finish)
SF (start to finish) 11/10/2016 Engr. Shehroze Ali 9
BASIC TERMINOLOGIES
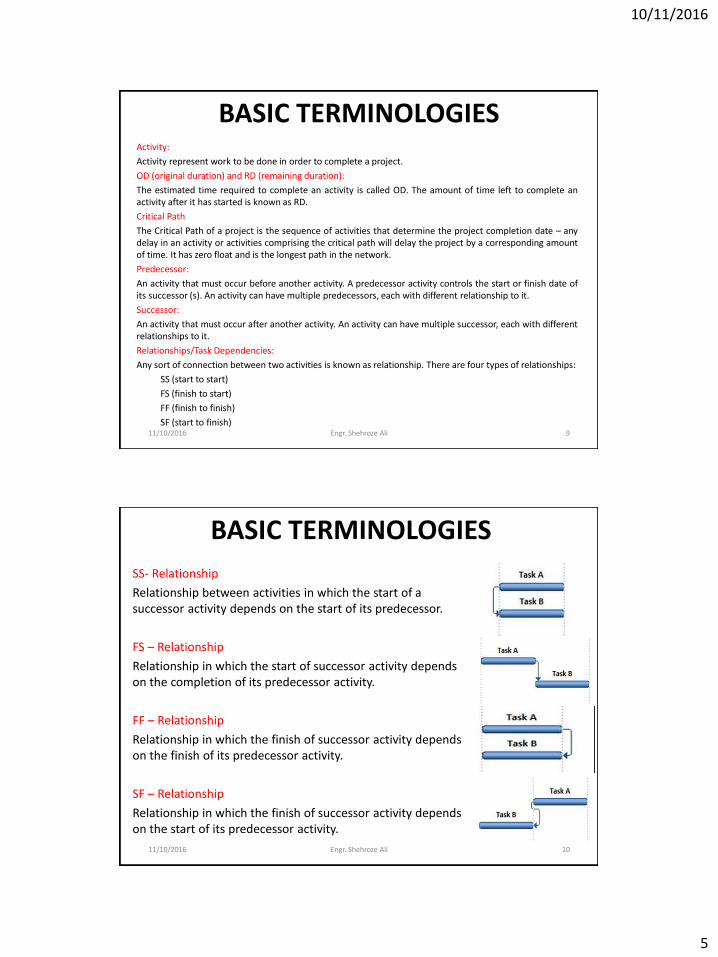
SS- Relationship
Relationship between activities in which the start of a successor activity depends on the start of its predecessor.
FS – Relationship
Relationship in which the start of successor activity depends on the completion of its predecessor activity.
FF – Relationship
Relationship in which the finish of successor activity depends on the finish of its predecessor activity.
SF – Relationship
Relationship in which the finish of successor activity depends on the start of its predecessor activity.
11/10/2016 Engr. Shehroze Ali 10
10/11/2016
6
BASIC TERMINOLOGIES Lag:
Delay from an activity to its successors is known as Lag.
Lead:
To start an activity before the predecessor activity is completed is called Lead.
TF (Total Float):
Duration, measured in planning units, the activity can be delayed without affecting the project finish date. Zero Total Float indicates that timely completion of the activity is critical to the completion of the project. Such activities are called Critical Activities.
FF (Free Float)
The amount of time, measured in planning units, the early start of an activity can be delayed without delaying early start of a successor activity. Such activities are called Non-Critical Activities.
Baseline
The project’s baseline is used to measure how performance deviates from the plan. Your performance measurement would only be meaningful if you had an accurate baseline. A project’s baseline is defined as the original scope, cost and schedule. The project’s baseline must be completely defined and documented before the project execution and control activities can begin.
11/10/2016 Engr. Shehroze Ali 11
BASIC TERMINOLOGIES Schedule Compression Schedule compression is used when the desired result is to create output faster than indicated in the original project, without having to change the project scope. This is particularly beneficial if a competitor is working on the same type of project and you need to finish first or may be a company decision. The schedule compression techniques are: Crashing When the crashing approach is used, any additional costs associated with rushing the project are reviewed against the possible benefits of completing the project on a faster timeline. Adding more resources for the project, Allowing additional overtime, Paying extra to receive delivery of critical components more quickly, etc. Crashing may not work in situations like "the concrete in the foundation has to dry for 3 days”. Fast Tracking Re-Scheduling various activities within the project to be worked on simultaneously instead of waiting for each piece to be completed separately. This method is best used when activities can be overlapped. Problem is dependencies. So if you work on design and production at the same time your risk is that you need to rework production if the design is changed half way through the process.
11/10/2016 Engr. Shehroze Ali 12
10/11/2016
7
RESOURCES
Resources include the personnel and equipment that perform work on activities across all projects. Resources are generally reused between activities and/or projects. In the Project Management module, you can create a resource pool that reflects your organization's resource structure and supports the assignment of resources to activities. The Project Management module also enables you to distinguish between labor, material, and non-labor resources. Labor and non-labor resources are always time-based, and material resources, such as consumable items, use a unit of measure you can specify. You can create and assign resource calendars and define a resource's roles, contact information, and time-varying prices. If a resource uses Timesheets, you can also assign a login name and password to the resource.
Over Allocation
Over Allocation is when a project calls for more time than a team member has.
Resource Leveling
To get the best performance and results from resources, you need to manage resource workloads to avoid over-allocations and under-allocations. Over Allocation can be solved by number of ways for example: Changing the relationships i.e. (SS, FS, SF, FF), Changing lag to “zero” or change it to lead, Changing working time, Changing Units, Adding extra overtime hours to that particular resource.
BASIC TERMINOLOGIES
11/10/2016 Engr. Shehroze Ali 13
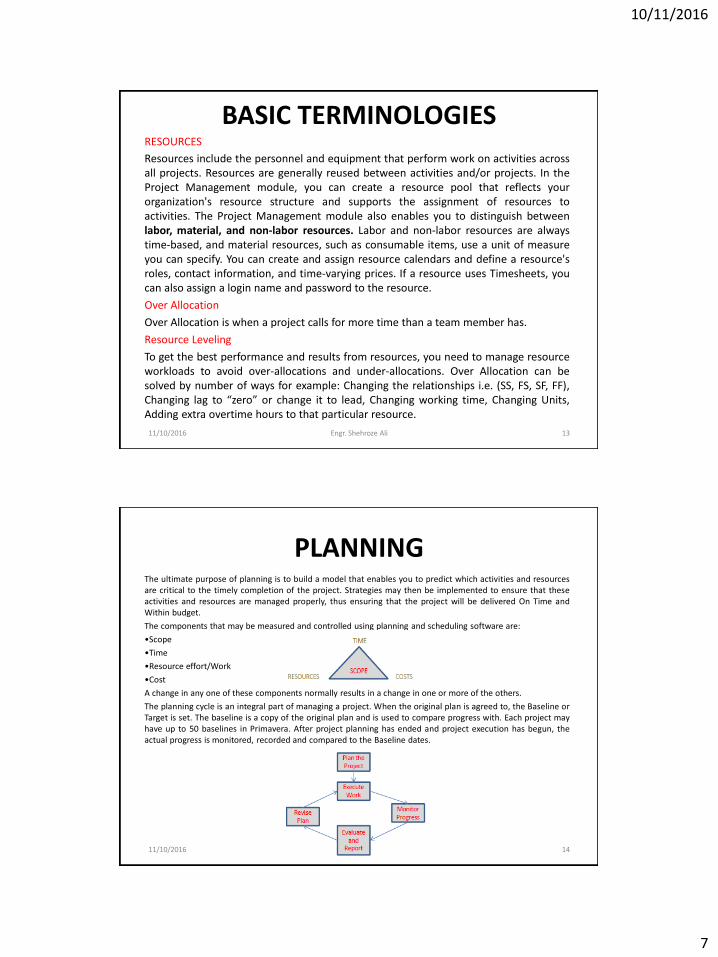
PLANNING The ultimate purpose of planning is to build a model that enables you to predict which activities and resources are critical to the timely completion of the project. Strategies may then be implemented to ensure that these activities and resources are managed properly, thus ensuring that the project will be delivered On Time and Within budget.
The components that may be measured and controlled using planning and scheduling software are:
•Scope
•Time
•Resource effort/Work
•Cost
A change in any one of these components normally results in a change in one or more of the others.
The planning cycle is an integral part of managing a project. When the original plan is agreed to, the Baseline or Target is set. The baseline is a copy of the original plan and is used to compare progress with. Each project may have up to 50 baselines in Primavera. After project planning has ended and project execution has begun, the actual progress is monitored, recorded and compared to the Baseline dates.
11/10/2016 14
10/11/2016
8
GANTT CHARTS
• Gantt charts provide a standard format for displaying project schedule information by listing project activities and their corresponding start and finish dates in a calendar format.
• Symbols include:
– Black diamonds: Milestones
– Thick black bars: Summary tasks
– Lighter horizontal bars: Durations of tasks
– Arrows: Dependencies between tasks
11/10/2016 Engr. Shehroze Ali 15
Gantt Chart for Project-X
11/10/2016 Engr. Shehroze Ali 16
10/11/2016
9
UNDERSTANDING PLANNING AND SCHEDULING SOFTWARE
Planning & Scheduling software enables the user to: •Enter the breakdown structure of the project deliverables or products into the software. This is often called a Work Breakdown Structure (WBS) or product Breakdown Structure (PBS), •Break a project down into the work required to create the deliverables and enter these into the software as the Activities under the appropriate WBS, •Assign durations, constraints, predecessors and successors of the activities and then calculate the start and finish date of all the activities, •Assign resources and/or costs, which represent people, equipment or materials, to the activities and calculate the project resource requirements and/or cash flow, •Optimize the project plan, •Set the Baseline Dates and Budget to compare progress against, •Use the plan to approve the commencement of work, •Record the consumption of resources and/or costs and re-estimate the resources and/or costs required to finish the project , and •Produce management reports.
11/10/2016 Engr. Shehroze Ali 17
Getting started with MS Project 2010
11/10/2016 Engr. Shehroze Ali 18
10/11/2016
10
Task Area Gantt Chart Area
Ribbon Tool Bar Time Scale Quick Access Toolbar
Status Bar Zoom Slider
View Shortcuts
11/10/2016 Engr. Shehroze Ali 19
11/10/2016 Engr. Shehroze Ali 20
10/11/2016
11
PRIMAVERA P6 ENVIRONMENT
11/10/2016 Engr. Shehroze Ali 21
NETWORK DIAGRAM & CRITICAL PATH METHOD ANALYSIS
The Network Diagram is about creating relationships between activities.
Relationships are also referred to as dependencies, the most basic is finish to start.
Task 1 is to create these dependencies by indicating the predecessors for each activity.
Task 2 is to test the logic by constructing the Network Diagram.
Task 3 is to determine the durations for each activity
Task 4 is to fill each Node
Task 5 is to calculate the forward and the backward pass
Task 6 is to determine the critical Path
11/10/2016 Engr. Shehroze Ali 22
10/11/2016
12
ACTIVITY DESCRIPTION
ACTIVITY IDENTIFIER
ACTIVITY DURATION
ES EF
LS LF
S L A C K
The CRITICAL PATH of a project is the
sequence of activities that determine the project
completion date – any delay in an activity or
activities comprising the critical path will delay
the project by a corresponding amount of time
EARLY START: When can the activity start at the earliest?
EARLY FINISH: When can the activity finish at the earliest?
LATE FINISH: When can the activity finish at the latest?
LATE START: When can the activity start at the latest?
SLACK: The time for which the project
activity can be delayed (also called float)
Project Network Diagrams: The Node
Koll Business Information Center
Activity Description Preceding Activity
Activity Duration
A Approval of Application None 5
B Construction Plans A 15
C Traffic Study A 10
D Service Availability Check A 5
E Staff Report B, C 15
F Commission Approval B, C, D 10
G Wait for Construction F 170
H Occupancy E, G 35
Project Network Diagram Example (Network Components and Details)
10/11/2016
13
A Forward Pass through the network determines the earliest times each activity can start and finish – ALSO DETERMINE THE TOTAL DURATION OF THE PROJECT
A Backward Pass through the network determines the latest times each activity can start and finish without delaying completion of the project – WITH THIS INFORMATION WE CAN DETERMINE WHERE WE CAN DELAY ACTIVITIES (HAVE SLACK) AND WHERE WE CANNOT
The Forward Pass
• The earliest start (EST) for the initial activity in a project is “time zero”
• The EST of an activity is equal to the latest (or maximum) early finish of the activities directly preceding it
• The EFT of an activity is equal to its EST plus the duration required to perform the activity.
The Backward Pass
• The latest finish (LFT) for the final activity in a project is equal to its EFT as determined by the forward pass
• The LFT for any other activity is equal to the earliest (or minimum) LST of the activities directly following (or succeeding) it
• The LST of an activity is equal to its LFT minus the time required to perform the activity.
NETWORK DIAGRAM & CRITICAL PATH METHOD ANALYSIS
11/10/2016 Engr. Shehroze Ali 25
Application
Approval
Construction
Plans
Traffic
Study
Service
Check
Commission
Approval
Staff
Report
Wait for
Construction
Occupancy
A
B
C
D
F
E
G
H
5
15
10
5
10
15
170
35
5 0
20 5
15 5
10 5
30 20
35 20
200 30
235 200
Forward Pass
ES + Duration = EF
20
15
10
20
15
200
35
5
5
5
30
Project Network Diagram Example (Determining the Forward Pass)
10/11/2016
14
Application
Approval
A
5
Construction
Plans
B
15
Traffic
Study
C
10
Service
Check
D
5
Commission
Approval
F
10
Staff
Report
E
15
Wait for
Construction
G
170
Occupancy
H
35
5 0
20 5
15 5
10 5
30 20
35 20
200 30
235 200
Backward Pass
LS + Duration = LF
5 0 10 20
20 5
20 15
30 20
200 185
200 30
235 200
20
20
20
200
5
10
15
30
200 185
185
Project Network Diagram Example (Determining the Bckward Pass)
NETWORK DIAGRAM & CRITICAL PATH METHOD ANALYSIS
DETERMINING THE CRITICAL PATH
• Critical activities have zero slack and cannot be delayed without delaying the completion of the project
• The slack for non-critical activities represents the amount of time by which the start of these activities can be delayed without delaying the completion of the entire project (assuming that all predecessor activities start at their earliest start times)
• The longest path on the network
• Could also be those activities with the least slack.
11/10/2016 Engr. Shehroze Ali 28
10/11/2016
15
Application
Approval
A
5
Construction
Plans
B
15
Traffic
Study
C
10
Service
Check
D
5
Commission
Approval
F
10
Staff
Report
E
15
Wait for
Construction
G
170
Occupancy
H
35
5 0
20 5
15 5
10 5
30 20
35 20
200 30
235 200
5 0 10 20
20 5
20 15
30 20
200 185
200 30
235 200
Slack = LS – ES Slack = LF - EF
0
0
5
10
0
165
0
0
Project Network Diagram Example (Determining Slack and the Critical Path)