Requirements on ConsumerInformation aboutProduct Carbon Footprint
For the benefit of the environment, this document has been optimised for
double-sided printing.
Consumer Information about PCF
III
Table of contents
List of tables IV
List of figures V
1 Executive Summary 1
2 Introduction 7
3 Definition of Product Carbon Footprint (PCF) 83.1 Targets, usage and fields of application of PCF 83.2 PCF/CO2e indicators versus energy indicators 10
4 General views on the suitability of the LCA approach forenvironmental labelling – what are the consequences for thePCF approach? 11
4.1 Advantages of the LCA/PCF for environmental labelling 124.2 Disadvantages of the LCA/PCF for environmental labelling 144.3 Conclusions 19
5 Identification and prioritisation of consumer information 205.1 General needs of consumers concerning information on Product
Carbon Footprint (PCF) 205.2 PCF information – experiences concerning different label types 235.2.1 Overview on currently used Carbon Labels 235.2.2 ISO labels in the context of PCF (type I, II and III) 285.2.3 Mandatory labels in the context of PCF 315.2.4 Other forms of information 325.3 Conclusions 33
6 Overview of the relevance of PCF in different product groups 346.1 General prioritisation 346.2 Category 1 (Energy consuming products), Example 1: Cars 386.3 Category 1 (energy using products) Example 2: Household
appliances 416.4 Category 2 (Energy saving products) Example 1: Insulation material 456.5 Category 3 (products with relevance to climate at production phase)
Example 1: Food 47
Consumer Information about PCF
IV
6.6 Category 3 (products with relevance to climate at production phase)Example 2: Textiles 54
6.7 Category 3 (products with relevance to climate at production phase)Example 3: Electricity supply 56
6.8 Category 3 (products with relevance to climate at production phase)Example 4: Paper 58
6.9 Conclusions as how global warming is best addressed in theanalysed product groups 59
7 Recommendations for input into standardisation or legislation 617.1 Open methodological questions concerning PCF 617.2 General recommendations to legislation and standardisation 63
8 Literature 67
List of tables
Table 1 Overview of the conclusions concerning how global warming is addressedbest 6
Table 2 Overview on different categories of carbon labels available on the market. 24
Table 3 Overview on the average greenhouse gas emissions connected to theproduction of different types of meat, cereals, vegetables and dairy. Source:GEMIS 2009 (www.gemis.de) 48
Table 4 Overview of the greenhouse gas emissions connected to the production ofdifferent types of milk products 49
Table 5 Overview on the greenhouse gas emissions in kg CO2e connected to the lifecycle of different types of (more or less) convenience food. Functional unit:1 kg of food. A “-“ indicates that for the respective life cycle phase data are notavailable. 50
Table 6 Overview of the conclusions concerning how global warming is addressedbest 60
Consumer Information about PCF
V
List of figures
Figure 1 Relative share greenhouse gas emissions in eight different product fieldsimportant for private consumption. Functional unit: consumption of onestatistical average household (2,1 persons per HH) in Germany in the year2005 (including production, use and end-of-life in 8 product fields). Source:Quack and Rüdenauer 2007 35
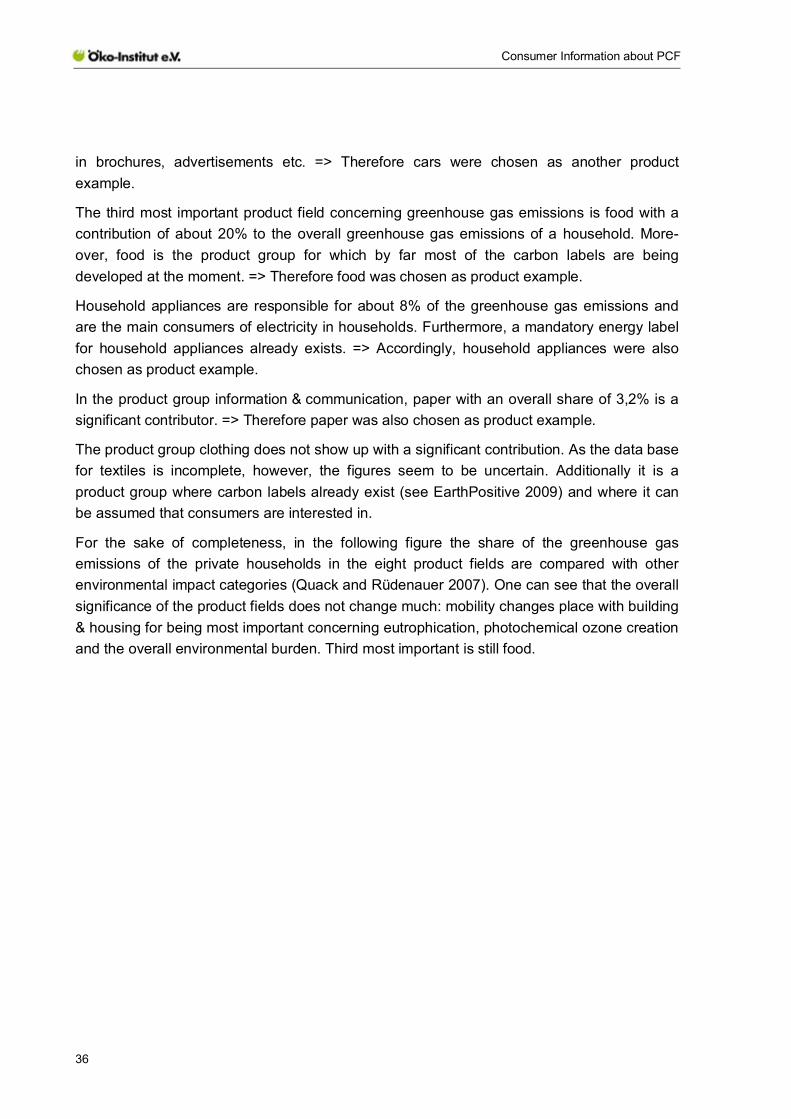
Figure 2 Relative share of environmental impact in different impact categories.Functional unit: consumption of one statistical average household (2.1persons/HH) in Germany in the year 2005 (including production, use and end-of-life in 8 product fields). Abbreviations: KEA: Cumulated Energy Demand;GWP: Global Warming Potential; AP: Acidification Potential, EP:Eutrophication Potential; POCP: Photooxidative Potential. 37
Figure 3 Overview of the annual global warming potential connected with the life cycleof different household appliances. (Source: own calculations Öko-Institut2009) 42
Figure 4 Overview on the greenhouse gas emissions in kg CO2e connected to the lifecycle of different types of (more or less) convenience food. Functional unit: 1kg of food. A missing life cycle phase indicates that the respective data are notavailable. 51
Consumer Information about PCF
1
1 Executive Summary
The term ‘carbon footprint’ has become tremendously popular over the last few years. Avariety of different CO2 or climate protection labels partly tailored to certain product groups ismeanwhile available at the international level – e.g. Carbon Reduction Label/UK; CarrefourInitiative (France), Stop Climate Change Label/Germany; KRAV Climate Marking Sweden(KRAV Sweden); Climatop-Migros Switzerland, Carbon Label Initiatives or programs inJapan (Japan Environmental Management Association for Industry), Korea (Korea Eco-Products Institute), Thailand (Thailand Greenhouse Gas Management Organization).Interestingly, the main focus lies on foods although individual foods are clearly less relevantto the climate than other product groups, i.e. household appliances or automobiles. Alreadyexisting labelling obligations as the Statutory Declaration of Carbon Footprint for Electricityare hardly covered by media and little-noticed by customers.
With climate change high up on the political and corporate agenda, carbon footprint calcula-tions are in strong demand. Nevertheless the focus on CO2-emissions does not only providepossibilities, but also bears some risks that might as well weaken environmental labellingapproaches in the future. These risks include for example the negligence of environmentalimpacts others than CO2, a disregard of product-quality aspects and the distortion of compe-tition caused by insufficiently detailed or asymmetric life cycle data.
The definitions and uses of the term “product carbon footprint” differ internationally. For theherewith presented study the following definition, that was also agreed upon within the scopeof the PCF Pilot Project Germany (PCF-Pilote 2009), seems most appropriate:
“Product carbon footprint describes the sum of greenhouse gas emissions accumulatedduring the full life cycle of a product (good or service)1 in a specified application.”
In this context, greenhouse gas emissions are understood as all gaseous materials for whicha Global Warming Potential coefficient was defined by the Intergovernmental Panel onClimate Change (IPCC). The life cycle of a product encompasses the whole value chain –from the acquisition and transportation of raw materials and primary products over productionand distribution to the use, recycling and disposal of the product. The term “product” is usedas a generic term for goods and services. The term Product Carbon Footprinting encom-passes the determination and assessment of one PCF.
At the moment, the standardisation process for the determination of one PCF is still ongoing(ISO 14067 „Carbon Footprint of Products“, quantification and communication). Thereforemost available resp. currently performed PCFs are done on the basis of PAS 2050:2008(Public Available Specification „Specification for the assessment of the life cycle greenhouse
1 In the following the term “product” always includes goods and services even if this is not explicitly written.
Consumer Information about PCF
2
gas emissions of goods and services“, a guideline below a British Standard) or resp. incombination with ISO 14040 / 14044 (LCA) and taking into consideration the GreenhouseGas Protocol Product / Supply Chain Initiative of World Resources Institute (WRI) and WorldBusiness Council for Sustainable Development (WBCSD).
Against this background the herewith presented study analysed the suitability of the LCA /PCF approach for environmental labelling, prioritisation of consumer information and therelevance of PCF in different product groups.
From these analyses the following general recommendations to standardisation andlegislation can be given:
Other environmental effects should not be disregarded
The narrow approach to only focus on greenhouse gas emissions bears the risk to overlookother relevant environmental impacts or even lead to wrong conclusions that increasenegative environmental effects in the worse case (e.g. in the case of electricity). Thereforescreening analyses of other environmental impacts must be included in a PCF.
The PCF is a fundamental indicator for some products or product groups. Still acomprehensive sustainability assessment of products cannot be carried out on the basis ofthe PCF alone. Other useful evaluation tools like life cycle assessments, eco-efficiencyanalyses and sustainability analyses can be used to complete the picture.
The screening of relevant other environmental impact categories besides global warmingpotential must thus be an obligatory component of a Carbon Footprint study.
ISO 14024 Type I labels like the Blue Angel should be retained as lead labels
The above considerations clearly support retention of eco-labels in accordance with ISO14024 (Type 1), such as the Blauer Engel eco-label, as lead labels. The advantages ofecolabels over CO2 labels are summarized again below (the arguments apply both to theBlauer Engel and by analogy to other national eco-labels and the European eco-label):
- easily understood and reliable information for consumers: from an overall environ-mental perspective an eco-labelled product is clearly better than comparableproducts;
- inclusion of all relevant environmental and health aspects;
- identification of criteria on the basis of LCAs and eco-toxicological assessments;
- subsequent discussion by a panel of experts;
Consumer Information about PCF
3
- final decision by an “environmental jury” on which relevant stakeholder groups arerepresented;
- certified award process and checking of the criteria for products marked with theecolabel.
Drawing up of Product Category Rules for particularly relevant products is essential
The main challenge of PCF meant for communication is to define the whole framework in away that all products belonging to one product group can be calculated in a as much aspossible defined way to assure the same approach even if the studies are performed bydifferent experts. This requires e.g. the same goals, the same system boundaries, the samecalculation rules and similar data quality for different studies. With a general ISO standardthis can not be achieved as it only provides generic rules. Therefore it essential for the futurethat product category rules (PCRs) will be developed that ensure a comparable proceedingwithin one product group. Such PCRs would have to be defined and adopted at theEuropean level. Given the many different product groups this will take time and needsprioritisation.
Basing on PCF it is not possible at the moment to perform product comparisons of multipleproducts carried out on behalf of different clients and by different practitioners as well aspublic comparison with competing products in ways that are acceptable under competitionlaw (e.g. through reporting of CO2e values or use of CO2e labels).
Methodological restrictions when using the LCA / PCF approach
For the PCF approach the same is true as for the general LCA approach: The assessment ofthe whole life cycle is a strength compared to other techniques. The approach can be used tocompare products with similar function but differing production and/or operating technologies.Still the methodology has some restrictions that have to be kept in mind when applying it:Like LCA also PCF is per definitionem a purely quantitative tool. As it has to be requestedthat at least a screening analyses on other environmental impacts then greenhouse gaseshas to be performed in a PCF study, the same problems occur as with LCA. Current LCA-approaches cannot exhaustively cover site-specific aspects: As greenhouse gases have aglobal impact and no site-specific one, this weakness does not apply to PCF studies in thenarrow sense. As for LCA the variability and reliability of data may represent a problemconcerning data quality (e.g. time-related, geographical and technology coverage), dataorigin, effort of data acquisition and possibly fast changes of supply chains. Spatial andtemporal variations are theoretically no obstacle for the applicability of LCA / PCF in productlabelling. Nevertheless, the things can get quite complicated a proper definition of thefunctional unit can be quite critical. Fast changes in supply chains are difficult to be
Consumer Information about PCF
4
accounted for in LCA / PCF since they require a functioning information system which is notyet in place. As for the calculation rules, there are still methodological questions to be solvedand consensus to be found among different existing approaches (see chapter above).Concerning the differences between different products from the same product group PCFresults may show only small deviations similar to that of LCA results. LCA as well as PCFcannot eliminate uncertainty. Due to these uncertainties (e.g. parameter or modeluncertainty) PCF results will always have a restricted precision. Therefore the display of asingle CO2e figure on a product is misleading.
Current CO2 labels neglect consumer comprehensibility, benchmarks and indicationof excellence
In order to be useful to consumers a CO2 label would have to
§ be comprehensible, e.g. by a well structured display, aggregation of the information,concentration on the gist. Additionally, have a standardised look thus enablingconsumers to quickly comprehend the information, compare different products andinclude the information on the climate impact in their purchasing decision.
§ include a rating scheme, enabling consumers to recognise if the products’ CarbonFootprint represents a relatively low greenhouse gas emission for the respectiveproduct group or a relatively high emission. It must be possible for consumers torecognise excellent products. Only then an effective reduction of the climate impactdue to “the right” purchasing decision can be achieved. Consumers are already wellacquainted with the A-G labelling scheme of the EU energy label, so this could be apromising starting point.
§ be third party certified. As credibility is of high importance for consumers, it is crucialthat a third party review should be requested for the PCF when used in product-relatedcommunication.
§ be backed-up by easy to access and transparent documentation of the PCF study thelabel is basing on. This includes the motivation for calculating a PCF and assumptionsand quantifiers used in the calculations. Any publication of the data must be clear,understandable, conclusive and open to scrutiny. It should ne noted to what extentPCF calculations are reliable and/or uncertain and whether other importantenvironmental impacts have been taken into consideration.
Single number CO2 labels make no sense
A static PCF stand-alone label providing a total CO2 footprint on products does not makesense and is not very relevant for consumer decision making. Although consumers areincreasingly aware of the relevance of climate impacts resulting from their purchasing
Consumer Information about PCF
5
behaviour and usage of products, the display of a total CO2e footprint figure alone would notbe of much help to them. It has to be stressed that a figure of this kind suggests a precisionand conclusiveness which cannot be achieved using the current state of methodology. At thecurrent state with only few products being labelled this even bears the risk that the sheerdisplay of such a label makes consumers believe that the product might be better thenanother without label.
Climate change might be addressed by other means than PCF
It is not always necessary to use PCF to address climate change issues. As CO2e emissionsare at the moment often highly correlated to the demand of electric and thermal energy andfuel consumption (e.g. in cars) climate change issues more easily can be addressed byenergy efficiency parameters. The latter is also cheaper and more reliable as it addresses akey parameter that can be directly measured and restricted e.g. by legislation. In othercases, like food for example, PCF is a good base for the development of generalrecommendation for consumers taking into account climate change issues (e.g. “eat regionaland seasonal food”, “eat less meat” etc.) but needs not be communicated as PCF.
Overall it can be concluded that in some cases there is no added value to the use of PCFand in other cases PCF should only serve as base for general recommendations.
Recommendations on how to address global warming best in the analysed productgroups
The following table summarises the results on how global warming is best addressed for thespecific product groups that have been analysed.
Consumer Information about PCF
6
Table 1 Overview of the conclusions concerning how global warming is addressed best
Product category Productgroup Best options to address global warming
Cars
The existing mandatory label on CO2 communication for themarketing of new passenger cars should be complemented by abenchmarking system e.g. in the form of a colour or letter code.Petrol consumption tests should be developed that are more inline with real driving and including also electric cars.Adequate measures to improve the outcome of the label in thesense of climate friendly purchase decisions by consumers.In later steps: include non CO2 greenhouse gases andprecombustion of fuel as well as production (in the from ofaverage data for different size classes of cars)
Energy consumingproducts
Householdappliances
EU energy label addresses energy efficiency and thereforeindirectly also CO2e emissions. An addition of CO2 values on thelabel is not helpful.Type I labels should include in-depth PCF studies as starting pointfor the development of criteria. To set CO2e values as a directlimit makes no sense.
Energy saving products Insulationmaterial
Instead of focussing on the PCF of insulation materials it will bemore successful to concentrate on energy certificates forbuildings. About 80 percent of climate relevant emissions relate tothe usage phase and correlate with the energy standard of thebuilding!
Electricity
The obligatory information of customers concerning of at leastCO2 emissions and radioactive waste resulting from the electricityproduction is purposeful.Adequate measures to improve the outcome of the obligatoryinformation in the sense that more consumers buy greenelectricity.Type I labels should include in-depth PCF studies as starting pointfor the development of criteria (CO2e, nuclear waste).Measures to reduce electricity consumption (e.g. communicationmeasures) are also beneficial.
Food
Development and communication of “simple” generalrecommendations taking into account climate change issues (PCFbased) concerning food purchase and preparation. In order to doso, further in-depth PCF studies are necessary.Basing on in-depth PCF studies integration of climate changeissues in the development of the standards for organic agriculture.The communication of CO2e figures on the product makes nosense and is not helpful to consumers.
PaperType I labels should include in-depth PCF studies as starting pointfor the development of criteria. To set CO2e values as a directlimit makes sense concerning the production processes.
Products with relevanceconcerning greenhousegas emissions atproduction phase
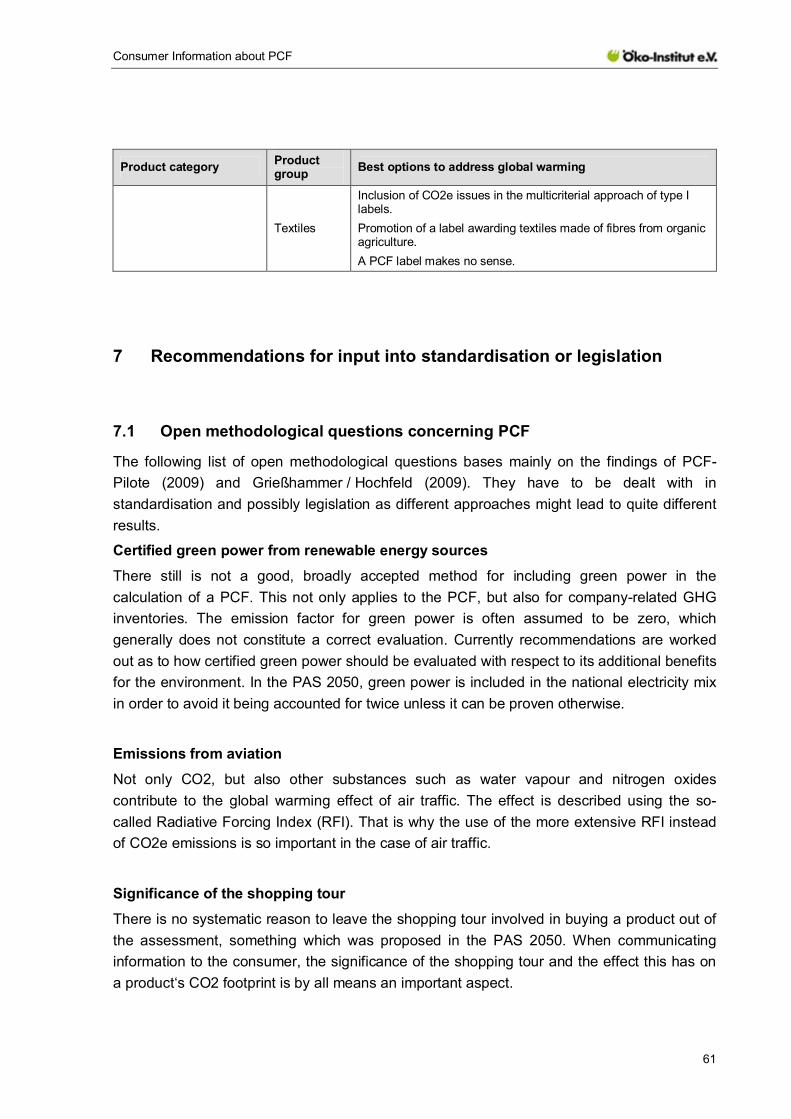
Textiles
Inclusion of CO2e issues in the multicriterial approach of type Ilabels.Promotion of a label awarding textiles made of fibres from organicagriculture.A PCF label makes no sense.
Consumer Information about PCF
7
2 Introduction
The term ‘carbon footprint’ has become tremendously popular over the last few years. Avariety of different CO2 or climate protection labels partly tailored to certain product groups ismeanwhile available at the international level – e.g. Carbon Reduction Label/UK; CarrefourInitiative (France), Stop Climate Change Label/Germany; KRAV Climate Marking Sweden(KRAV Sweden); Climatop-Migros Switzerland, Carbon Label Initiatives or programs inJapan (Japan Environmental Management Association for Industry), Korea (Korea Eco-Products Institute), Thailand (Thailand Greenhouse Gas Management Organization).Interestingly, the main focus lies on foods although individual foods are clearly less relevantto the climate than other product groups, i.e. household appliances or automobiles. Alreadyexisting labelling obligations as the statutory declaration of carbon footprint for electricity arehardly covered by media and little-noticed by customers.
With climate change high up on the political and corporate agenda, carbon footprint calcula-tions are in strong demand. Nevertheless the focus on CO2-emissions does not only providepossibilities, but also bears some risks that might as well weaken environmental labellingapproaches in the future. These risks include for example the negligence of environmentalimpacts others than CO2, a disregard of product-quality aspects and the distortion of compe-tition caused by insufficiently detailed or asymmetric life cycle data.
BSI has published the PAS 2050 as the first approach for a consistent method for assessingthe life cycle GHG-emissions of goods and services. It builds on existing methodsestablished through EN ISO 14040 and EN ISO 14044. ISO adopted a new work itementitled “Carbon footprint of products” which consists of 2 parts: part 1 on quantification andpart 2 on communication, in November 2008. WRI/WBCSD is standardising accountingframeworks for assessing CO2-emissions of corporate value chains (scope 3) and products.
Against this background, ANEC commissioned the Öko-Institut e.V. to conduct a researchstudy on various issues related to communication of PCF to consumers. The issues involve:
(a) conditions under which CO2-indicators/labels make sense or should be avoided;(b) conditions under which CO2-indicators/labels are useful consumer information;(c) options to address sustainability issues ignored by CO2-indicators/labels;(d) measures to ensure that efficiency is not neglected;(e) formats to ensure comprehensibility to consumers, including benchmarks and scales;(f) methods to address different energy mixes and conversion factors and their update;(g) conventions and methodological choices which need to be defined to ensure compara-bility and the necessary frameworks for this.
Consumer Information about PCF
8
3 Definition of Product Carbon Footprint (PCF)
3.1 Targets, usage and fields of application of PCF
The definitions and uses of the term “product carbon footprint” differ internationally. For theherewith presented study the following definition, that was also agreed upon within the scopeof the PCF Pilot Project Germany (PCF-Pilote 2009), seems most appropriate:
“Product carbon footprint describes the sum of greenhouse gas emissions accumulatedduring the full life cycle of a product (good or service)2 in a specified application.”
In this context, greenhouse gas emissions are understood as all gaseous materials for whicha Global Warming Potential coefficient was defined by the Intergovernmental Panel onClimate Change (IPCC). The life cycle of a product encompasses the whole value chain –from the acquisition and transportation of raw materials and primary products over productionand distribution to the use, recycling and disposal of the product. The term “product” is usedas a generic term for goods and services. The term Product Carbon Footprinting encom-passes the determination and assessment of one PCF.
At the moment, the standardisation process for the determination of one PCF is still ongoing(ISO 14067 „Carbon Footprint of Products“, quantification and communication). Thereforemost available resp. currently performed PCFs are done on the basis of PAS 2050:2008(Public Available Specification „Specification for the assessment of the life cycle greenhousegas emissions of goods and services“, a guideline below a British Standard) or resp. incombination with ISO 14040 / 14044 (LCA) and taking into consideration the GreenhouseGas Protocol Product / Supply Chain Initiative of World Resources Institute (WRI) and WorldBusiness Council for Sustainable Development (WBCSD).
As a consequence, the available studies and PCFs are far from being comparable at themoment. And there is still some dynamic concerning methodological aspects to be expectedin the future. In the PCF-Pilote Project (PCF-Pilote 2009) several PCFs of different productswere calculated in parallel in order to identify work steps that should be done in the sameway and others that have to be specific for a specific product group. It seems to be highlynecessary to define Product Category Rules for specific product groups (comparable toPCRs as defined in ISO 14025 for EPDs).
In the international debate different targets are discussed concerning the calculation ofPCFs: the quantification of CO2e for a CO2e-Label, the optimisation of processes withincompanies, the comparison of a broad variety of products in a retailer chain. In order toreach these targets, a number of methodological requirements concerning scope as well asdata gathering and data processing have to be fulfilled.
2 In the following the term “product” always includes goods and services even if this is not explicitly written.
Consumer Information about PCF
9
In general, it is claimed that PCF is able to reach the following targets:
§ Analyses of the greenhouse gas emissions that occur along the value chain of a goodor service.
§ Identification of the hot spots of greenhouse gas emissions over the life cycle of aproduct or service and of realisable reduction potentials.
§ Identification of the possible courses of action in order to achieve reduction potentialsfor different players along the value chain of a good or service: producers, customers,procurers, consumers, politicians etc..
§ Evaluation and comparison of different products of the same product group (e.g.different models of cars).
Within the study on hand it will be discussed in the following whether the listed targets can bereached by PCF and which problems occur.
Although climate change is very important to be addressed there is consensus that theanalyses and the assessment of greenhouse gas emissions have to be carried out takinginto account (all the) other environmental impacts of the specific product group underconsideration. This is only possible when broadening the perspective beyond the actual PCF.
The communication of PCF results to consumers is widely discussed (see e.g. ISO).Possible targets may be here
‒ the assessment of the greenhouse gas emissions of private households,
‒ the identification of the most important courses of action for consumers,
‒ the support for purchase decisions and usage of products.
The study of Prakash et al (2008) already pointed out the following advantages and dis-advantages of the use of CO2e indicators as single product information3.
Advantages / Pro‘s
§ CO2-indicators meet a high level of public awareness,
§ are easily understandable,
§ are in line with various new fiscal and legislative procedures in many countries,
§ are more precisely representing the environmental impact,
§ use a well-established aggregation method,
§ and avoid confusion with traditional energy indicators.
3 Prakash et al (2008) focused on the comparison between CO2e indicators and primary energy indicators. Formore detailed see http://www.anec.org/attachments/ANEC-R&T-2008-ENV-005final.pdf
§ Other environmental impacts of energy generation may get neglected.
§ Data availability for energy consumption is better than for CO2 emissions.
§ CO2 indicators might lead to a negligence of efficiency.
§ Energy indicators have a long tradition and are key characteristics of energy-usingproducts (EuPs).
§ CO2 indicators on national average data would cause problems with EuPs.
§ Concentration on, and improvement of energy or CO2 issues could shift negativeimpacts to other environmental areas.
§ No consumer guidance for the use phase of energy using products.
§ Need for regular updates as a result of changing conversion factors for primary energy.
3.2 PCF/CO2e indicators versus energy indicators
Besides CO2e indicators, energy indicators have been relatively well-known for years andare widely used for communication purposes. Examples are the European energy label forhousehold appliances that displays the electricity demand (end energy) of specificappliances measured under defined conditions. But also the primary energy demand (alter-natively the terms CED, cumulative energy demand, or “grey” energy are used) is fairlycommon at least for some products such as for building products.
The advantage of energy indicators is that they can directly address energy efficiency issueslike the electricity demand of an appliance or the thermal energy demand of a building. ACO2e indicator would need to include the specific supply process (e.g. electric grid, heatingsystem) in order to do so. Given an electric grid with a high share of renewable energies, thespecific CO2e emissions per kWh will be low compared to one with a high share of fossilfuels. As a consequence the differences between two products with a demand of thermal orelectric energy may mainly result from supply processes (e.g. different electric grids) but not(or much less) from their different energy demand. Therefore, energy efficient alternativescan not as easily be identified and promoted. Additionally, no pressure can be built uptowards more energy efficiency although energy demand that is avoided is the mostenvironmental and climate friendly one. The focus on CO2e indicators alone also bears therisk to privilege nuclear power. Therefore, this aspect has always to be considered whenaddressing electricity supply, e.g. in the form of nuclear waste or fuel mix.
On the other hand, the concentration on energy indicators alone will completely leave out thesupply system and the two ways the supply system can be optimised: to lower the emissionsof a fossil based system or to increase the share of renewable energies (e.g. wood, solarenergy, wind).
Consumer Information about PCF
11
Prakash et al. (2008)4 concluded: “There is a general dilemma when choosing between thetwo indicator-systems: While energy-indicators are unable to promote renewable energies,they are effective instruments to stimulate energy-efficiency. In contrast, CO2-indicators canstimulate a shift towards renewable energies, but also bear the risk of neglecting efficiencypotentials.”
As there is no elegant way leading away from this dilemma at this point, the CO2e indicatoris not able to substitute the energy indicator and vice versa. It has to be checked in eachindividual case which one of the two indicators is more suitable or whether both should beused.
Furthermore an eye has to be kept on the supply systems, e.g. when addressing the situa-tion in the EU it is more suitable to use an average European electricity mix instead of theelectricity mix of single countries (e.g. France with a low value, Poland with a high value forCO2 emissions).
Methodological questions have to be solved concerning “green” electricity and an agreementhas to be found concerning possible incentives for its use.
4 General views on the suitability of the LCA approach for environ-mental labelling – what are the consequences for the PCFapproach?
Prakash (2008) worked out in detail the strengths and weaknesses of the LCA approach ingeneral for environmental labelling purposes. As PCF is to be seen as an indeed focussedbut basically the same approach as LCA, the findings of Prakash (2008) will be shown in thefollowing (see excerpt of the original text in italics). It will be discussed whether theconclusions are the same for both the PCF and the LCA approach.
4 For a more detailed discussion on this issue see Prakash et al. 2008
Consumer Information about PCF
12
4.1 Advantages of the LCA/PCF for environmental labelling
Integration of all life cycle stages
“LCA is one of the few methodologies that are capable of dealing with all stages of a productlife cycle. Although the depth and breadth of the analyses widely depend on the scope andthe defined system boundaries, LCA is at least theoretically capable of summarising theenvironmental impacts of all process steps from cradle to grave. Therefore, LCA-methodology has in this respect a clear advantage over other labelling techniques, which isespecially effective for product groups featuring a variety of severe environmental impactsduring various life cycle stages.” Prakash 2008
For the PCF approach the same is true as for the general LCA approach: The assessment ofthe whole life cycle is a strength compared to other techniques. But it has to be mentionedthat according to PAS 2050 and labels basing on it (e.g. Carbon reduction label from CarbonTrust) only for B2C products the PCF is conducted over the whole life cycle (cradle to grave).For B2B products only a cradle to gate analysis is performed. Furthermore, as there is notyet consistency among the different labels on the market at the moment, there are carbonlabels around that not at all consider use and end-of life phase (e.g. Casino Carbon Indexdoes not cover use and end-of-life).
For in-depth PCF studies that aim at giving an overview of a products’ climate impact and atidentifying the hotspots of a product, it is important that they cover the whole life cycle.When, for example comparing industrially produced convenience food with food that iscooked in the consumers home it would give a wrong picture if the use phase (storage andpreparation) was left out. Such an in-depth PCF study is a very good starting point fordeveloping product criteria in the context of a type I label: What are the hotspots? Whataspects may be neglected?
If a products’ life cycle shows clear-cut hotspots concerning CO2e emissions, e.g. in theusage phase, it can be justified to restrict further PCF studies meant as base for a labelling tothat phase and leave out the others. Nevertheless it has to be kept in mind that thefundamental in-depth PCF study may have to be repeated from time to time if e.g. frameworkconditions change or if there are significant product innovations.
Consumer Information about PCF
13
Ability to compare products with similar functions but differing production and/oroperating technologies
“LCA-methodology is much better capable of comparing system alternatives and wouldtherefore be able to broaden labelling schemes to much wider defined product groups.Thereby, it would be possible to base product comparisons on the delivered functionsinstead of the technologies currently present on the market. Such an approach would bemuch more open to innovations that follow alternative technological approaches.
Nevertheless, it has to be added that even for such applications, LCA does not have to beapplied for each individual product covered by the labelling scheme separately. Especially fortype I ecolabels it seems much more practical to carry out an initial LCA comparing the dif-ferent system alternatives, which is than updated periodically. With this initial LCA, the envi-ronmentally worst system alternatives can be generally excluded from the labelling schemes.Than for the remaining system alternatives product related criteria5 can be developed.”Prakash 2008
For PCF the same system approach is applicable as for the LCA approach. Also for PCF itusually makes no sense to perform studies on many different single products of the sameproduct group. In order to draw general conclusions and to find the strong and weak points ofa solution it is sufficient to study in detail representative types of system alternatives. Ofcourse it has to be kept in mind that – due to the focus on greenhouse gases – the PCFapproach is to be complemented by a screening of other environmental impacts in order notto point in the wrong direction. As already mentioned earlier it may be justified to focus on themost relevant life cycle phase or to use alternatively another indicator that correlates to theCO2e emissions (such as electricity demand in the usage phase).
Due to general restrictions and also to the standardisation still being under development,figures on CO2e emissions from different PCF labels – e.g. Casino Carbon Index andCarbon Trust Carbon reduction label – cannot be compared directly at the moment.Moreover, the comparison of PCF studies done by different institutions most likely is notpossible as different data bases may be used, different user scenarios may be defined etc.This is a fundamental problem of PCF studies that would be changed partly when thestandardisation process is completed. Actually it would be fundamental that ProductCategory Rules (PCR) were defined as obligatory by standardisation. PCRs definefundamental rules concerning the scoping of a PCF study for products of the same productgroup (e.g. adequate user scenarios, data bases, relevance of other environmental impactsetc.). Additionally, their development includes stakeholder involvement.
5 Amendment: those criteria usually are non-LCA indicators and may concentrate on the relevant life cyclephase, such as electricity demand in the usage phase.
Consumer Information about PCF
14
Applicability for orientation purposes
“LCA is already widely used for orientation purposes in environmental labelling. Thereby, anLCA is carried out for a typical model of the product group to be labelled. The results give awidely objective overview on the various environmental impacts across the life cycle, andhelp to identify critical issues that have then to be addressed using production or use phaseindicators. Prominent examples are ecolabels and product ratings for cars: These labels andratings usually exclusively address environmental impacts in the use-phase and leave asideimpacts in production and end-of-life stage. This approach is justified with LCA-results show-ing that the use phase constitutes for at least two thirds of the total environmental impacts(Dauensteiner 2001, Gensch and Grießhammer 2004; Quack and Rüdenauer 2007).”Prakash 2008
Due to the restricted focus of PCF on greenhouse gases, the situation is somehow differentto the general LCA approach: Results of a PCF can be used for orientation purposes as wellbut they do not give an overview on the environmental performance of a product over its lifecycle. It only shows the very restricted view on climate impact. As the climate change issue isof such a large relevance this approach is justified if it is somehow backed-up by a screeningof other environmental impacts. It must be prevented that a reduction in PCF on the onehand leads to an increase of other significant environmental impacts on the other hand (e.g.switch to electricity from nuclear power instead of fossil fuels). Secondly, it has to be avoidedthat a product “looks good” but only due to its marginal PCF, leaving out the relevant impactsin other impact categories (e.g. photochemical ozone creation potential, POCP).
4.2 Disadvantages of the LCA/PCF for environmental labelling
Current LCA-approaches do not account for unquantifiable impacts
“LCA is a purely quantitative tool that is based on numeric calculations of environmentalimpacts across the life cycle. Nevertheless, there are certain environmental issues that can-not be sufficiently expressed with quantitative figures. Although this is in some cases feasiblefrom a purely scientific perspective, the task to conduct this for a whole product life cyclemakes the issue too complex to be achieved within usual time and financial resources.
Additional problems arise with environmental topics that are rooted in the precautionaryprinciple: Topics like electromagnetic radiation and the release of many persistent organicpollutants have in common that their precise impacts are not fully understood today. Never-theless, there is a broad agreement that the sheer likelihood of negative impacts in the futureis reason enough to reduce the release. Although some of these issues can be integrated inLCA, the tool does not facilitate the interpretation of such issues and has therefore limitedscientific added-value.” Prakash 2008
Consumer Information about PCF
15
Like LCA also PCF is a purely quantitative tool. As it leaves out per definitionem otherenvironmental impacts, the above critics on LCA only apply to a restricted extent: As it has tobe requested that at least a screening analyses on other environmental impacts thengreenhouse gases has to be performed in a PCF study, the same problems occur as withLCA.
Current LCA-approaches cannot exhaustively cover site-specific aspects
“An aggregation of certain issues across the life cycle of products does only partly give in-sights into the real environmental impacts. This is the case for environmental and healthimpacts that are highly site specific. This disregard of site-specific aspects is of conceptualnature and based on the fact that LCA seeks to aggregate environmental impacts over thewhole life cycle of products. This demand of comprehensive aggregation is currently onlyfeasible with the use of generic data, which by nature cannot address site-specific aspects.”Prakash 2008
As greenhouse gases have a global impact and no site-specific one, this weakness does notapply to PCF studies in the narrow sense. Again, as for the requested screening of otherrelevant environmental impacts the same problems must be stated as for LCA.
Variability and reliability of data
“In the phase of inventory analysis, main problems are data origin, effort of data acquisitionand data quality, especially for comparative assertions. In this case it is absolutely necessaryfor data quality requirements to fulfil certain qualifications, e.g. definition of time-related,geographical and technology coverage, precision, completeness, representativeness, consis-tency, sources of data and the uncertainty of the information. But these qualifications are notfurther specified in the ISO 14040/14044 standards.
Therefore, the individual environmental impact of a product might vary over time. Generally,these issues are subjects to be dealt with in the functional unit of a LCA. In addition, asensitivity analysis is the appropriate methodology to make judgements whether to includesuch variations in the LCA-calculations or not. Therefore, such spatial and temporalvariations are theoretically no obstacle for the applicability of LCA in product labelling.Nevertheless, the examples illustrate that things can get quite complicated and that a properdefinition of the functional unit can be quite critical.
Additionally, the assessment of primary and generic data follows a more or less lengthyprocedure, which lies in some cases within the time-range of process innovation cycles.
Furthermore, supply chains become increasingly flexible in modern economy so that evenassessments based on primary data can be outdated rather quickly. In some extremeexamples, such rapid shifts in supply chains can lead to significant changes in the total
Consumer Information about PCF
16
environmental impacts: Such changes are difficult to be accounted for in LCA, since theyrequire a functioning information system on supply chain changes, which is not yet in place.Furthermore, many supply chains are increasingly organised by highly flexible spot marketswhich make direct contacts between supplier and customer unnecessary. Under suchconditions, it is hard to imagine a satisfactory flow of primary process information suitable forLCA-applications.” Prakash 2008
As for LCA the acquisition of data on greenhouse gas emissions is time-consuming and cost-intensive. The same problems concerning outdating of data and possibly fast changes ofsupply chains occur. One advantage is that greenhouse gas emissions at present are highlycorrelated to energy generation, which is generally covered with relatively good datacompared to other impact categories and processes. That way, at least secondary data areavailable for many basic processes. For other processes, such as agriculture or foodprocessing only fragmentary data are available that are besides highly variable (dependingon farm size, farm equipment, storage of food etc.). The effort to gather representativeprimary data on food production is high, especially as for agricultural products fast changesof the supply chain occur often (e.g. due to weather changes, good or bad harvests) withpossibly high impacts on greenhouse gas emissions.
In general it is true that the PCF is subject to variances in the precision and reproducibility ofcalculations. This comes from the different quality or sources of data used or the definition ofcertain assumptions in the individual phases of the product‘s life cycle. Whether all of theuncertainties and assumptions that arise can be remedied by an internationally standardisedmethodology remains uncertain, if anything. The existence of PCRs would strongly supportthe comparability of results of different products within one product group. This is somethingthat is of particular importance when communicating the PCF.
As for the calculation rules, there are still methodological questions to be solved andconsensus to be found among different existing approaches, e.g.:
§ How to deal with storage of CO2e in products?
§ How to deal with direct and indirect land use change?
§ How to calculate greenhouse gas emissions for (partly) “green” electricity?
Consumer Information about PCF
17
Product differentiation is particularly difficult for narrowly defined product groups
“Typically LCA-practitioners use a combination of primary site-specific data and data fromexisting data-bases. Taking into account the complexity of product systems it is almost un-thinkable to conduct LCA without the support of such data bases that help to fill gap andsave time and resources. Nevertheless, the use of such data bases has one considerableconsequence for environmental labelling: Especially for narrowly defined product groups, inwhich system alternatives are not considered, many product features like material composi-tion will likely be very similar or even identical.The subsequent product differentiation will therefore be based on some few environmentalimpacts like content material and energy consumption in the use-phase. Nevertheless, exist-ing labelling schemes for computers already address these issues and differentiate productmodels accordingly. Therefore, in such cases LCA will not yield any added-value, but justhigher efforts for data collection and compilation.” Prakash 2008
Concerning the differences between different products from the same product group, such astwo desktop computers or two washing machines, PCF results show small deviations similarto that of LCA results. This is for two reasons:
On the one hand nobody is able to gather primary data for all materials, processes etc.necessary to produce a desktop computer or a washing machine. The costs would betremendous, studies unaffordable. Therefore the use of secondary data from commercial andnon commercial databases (e.g. EcoInvent, GaBi, GEMIS) is common practise. Anyway,supplier–producer relations may change rapidly which also justifies the use of generic data.One disadvantage, however, can be that effective differences of products in some casescannot be represented by the secondary data and therefore the calculated similarity does notcomply with reality and – as for LCA – even may exceed error margin.
On the other hand, it has to be acknowledged that two washing machine models in reality donot deviate so much from each other concerning their content of plastics, metals and evenelectronics, even if they are from different producers. Additionally, the use phase makes upabout 90% of the overall PCF of a washing machine and thus diminishes differences in theproduction phase again. The same can be stated for many other complex industrial products.Besides that the measurement of the energy consumption of a washing machine is based onvery detailed test protocols. Even then the results have a limit of accuracy of 10%. The useof such protocols – which has to be assured by Product Category Rules – is a prerequisite ofmaking even small differences visible.
Consumer Information about PCF
18
LCA cannot eliminate uncertainty
“Due to the iterative nature of LCA, decisions regarding the data to be included shall bebased on a sensitivity analysis to specify their significance. This analysis may result inexclusion of life cycle stages or of inputs and outputs that lack significance to the results ofthe study, or otherwise in inclusion of new unit processes, inputs and outputs that are shownto be significant. Nevertheless, there is always a danger of missing important flows. Datagaps of bottom-up LCAs can reach up to 50% of the total environmental exchanges(Christiansen et al. 2006). Another barrier of including all relevant data and primary dataorigin are the extraordinary charges which implies again (monetary) resources and time.Combined with the problems mentioned in the paragraphs above, this situation provides asevere hurdle to use LCA for product differentiation purposes in environmental labelling:Since it might not be feasible to provide an undisputable data base for product labelling, LCAcannot eliminate uncertainty. This is especially severe when the competitive nature ofenvironmental labelling is considered: Especially in product groups with only little latitude forproduct differentiation this will very likely lead to inquiries and complaints by disadvantagedproducers. While this could on the one side lead to massive additional data flows towards thelabelling scheme administration (which might overburden its capacity), judicial stepsquestioning the scope, system boundaries and data quality are also likely. At best, such legaldisputes will slow down the labelling process.” Prakash 2008
Uncertainties occur in LCA as well as in PCF studies, there is no principal difference. Theyresult from several sources. According to de Koning et al (2009) three types of uncertaintiescan be distinguished in LCA models:
§ Parameter uncertainty: uncertainty in observed or measured values used as inputmodel.
§ Model uncertainty: uncertainty about the way the interaction between technosphereand biosphere has to be modelled.
§ Scenario uncertainty: relates to choices made in constructing scenarios. Typicalchoices include choice of impact assessment method and allocation
Using the example of two detergents de Koning et al (2009) showed for the carbon footprintthat depending on the extent different parameters to calculate the PCF are fixed or left opento the person / institution performing the PCF the results differ. The more parameters arefixed the fewer uncertainties could be observed and vice versa. Additionally, the uncertaintiesare further reduced if the same person actually performs the study for the products to becompared. The actual results of the comparison of one compact and one liquid detergentwere quite different depending on the approach and could even lead to contradictorystatements.
Consumer Information about PCF
19
Against this background it is essential to include Product Category Rules as obligatoryelements in standardisation. PCRs allow at least to a certain extent to achieve comparableresults within one product group.
It has also to be kept in mind that PCF results will always have a restricted precision.Therefore the display of a single CO2e figure on a product is misleading.
4.3 Conclusions
For the PCF approach the same is true as for the general LCA approach: The assessment ofthe whole life cycle is a strength compared to other techniques. But if a products’ life cycleshows clear-cut hotspots concerning CO2e emissions, e.g. in the usage phase, it can bejustified to restrict further PCF studies meant as base for a labelling to that phase and leaveout the others.
It must be stressed that – due to the focus on greenhouse gases – the PCF approach is tobe complemented by a screening of other environmental impacts in order not to point in thewrong direction.
Due to general restrictions and also to the standardisation still being under developmentresults from different PCF studies cannot be compared directly at the moment. It wouldtherefore be fundamental that Product Category Rules (PCR) were defined as obligatory bystandardisation. PCRs define fundamental rules concerning the scoping of a PCF study forproducts of the same product group (e.g. adequate user scenarios, data bases, relevance ofother environmental impacts etc.). Additionally, their development includes stakeholderinvolvement.
It is generally true that the PCF is subject to variances in the precision and reproducibility ofcalculations. This results from the different quality of data sources used or the definition ofcertain assumptions in the individual phases of the product‘s life cycle. Whether all of theuncertainties can be remedied by an internationally standardised methodology may bedoubted. The existence of PCRs would strongly support the comparability of results ofdifferent products within one product group.
As for the calculation rules, there are still methodological questions to be solved andconsensus to be found among different existing approaches on PCF.
Against this background, it cannot be recommended at the moment to use single PCF figuresfor communication.
Consumer Information about PCF
20
5 Identification and prioritisation of consumer information
5.1 General needs of consumers concerning information on Product CarbonFootprint (PCF)
There is consensus among experts that consumers should consider a huge amount ofinformation in order to make an optimal purchase decision. In addition to this objective needof information further information should be taken into account by the consumer in order torealise a sustainable consumption. But: Is the consumer willing and able to use thisadditional information? After all, a general information overload can be observed. Therefore itmust be asked, in which way and by which approach the information should be delivered.Priority must be set on clarity, comparability and credibility of information. Against thisbackground vzbv (2004) used the differentiation into search goods, experience goods andcredence goods for a telephone survey among consumers on the purchase of five differentgoods (textiles, food, cars, electricity and investments). It must be pointed out that the terms“search goods” etc. are technical terms from economics. The term “goods” is thereby used inthe same way as the term products in this text: both encompass as well products asservices. In the following chapter the technical terms “search goods” etc. are used incombination with the term “products”.
A search good is a product with features and characteristics easily evaluated beforepurchase. An experience good is a product where product characteristics such as quality orprice are difficult to observe in advance, but these characteristics can be ascertained uponconsumption. A credence good is a product whose utility impact is difficult or impossible forthe consumer to ascertain. In contrast to experience goods, the utility gain or loss ofcredence goods is difficult to measure after consumption as well. The seller of the goodknows the utility impact of the good, creating a situation of asymmetric information.
A product usually possesses features belonging to all three above mentioned categories. Forexample a cars’ size and colour (search good), its fuel consumption (experience good) andits pollutant emission (credence good) may be relevant for consumers purchase decision.Information on the environmental impact of a product usually belongs to the categoriesexperience good (e.g. consumption of fuel, electricity, water) and credence good (e.g.environmentally friendly production, content of hazardous substances; see also DINConsumer Council 2008).
PCF in specific belongs to the category credence good which makes it all the more importantthat the delivered information on PCF is credible and plausible (relevance of third partycertification) and displayed in a standardised, comparable way.
Although the survey showed that consumers do not read all the information available e.g. onthe packages of food, they are not willing to do without. At least they want to have access toinformation. It was interesting that consumers were more content with the available
Consumer Information about PCF
21
information on cars then on food although – objectively – there are more pieces of informa-tion available on food then on cars. Vzbv (2004) concluded that the existing uncertaintyconcerning food leads to an information demand that exceeds the available offer ofinformation. The survey also showed that consumers would appreciate different additionalinformation connected to the environmental impacts of cars (important: declaration of CO2
and other emissions, less important: environmentally friendly production), textiles (important:allergenic substances, less important: environmentally friendly production), food (important:genetic engineering, allergenic substances, animal husbandry; less important: cultivation,origin of resources) and electricity (less important: environmental impact of electricity supply,display of environmentally friendly electricity offers). Depending on the specific productconsumers prefer the information to be delivered preferably in different ways: for food andtextiles consumers prefer it on the package, for cars they prefer it at the point of sale as wellas in brochures and for electricity the bill is the preferred place for additional information. Ingeneral it was interesting that the internet could be observed as a commonly acceptedsource for consumers to get information from.
Vzbv (2004) points out that it is helpful for consumers if the same piece of information isdelivered in a recognisable / standardised way on different products (e.g. the same schemeis used always) (e.g. product with the Blue Angel or without it). Thus the purchase decision issupported by an easy-to-make comparison of products.
Concerning information on cars it can be added from DIN Consumer Council (2008) thatconsumers are interested most in information on environmental features if they are also costrelevant: Together with reduced fuel consumption and CO2 emissions a reduction of costs isachieved at the same time. Other aspects (e.g. reduction in particle emissions) werementioned much less or not at all (e.g. environmental friendly production) in the setting withfocus groups.
Concerning general aspects on consumer information DIN Consumer Council (2008)emphasised that comprehensibility is a key feature: well structured display, aggregation ofthe information, concentration on the gist that helps to make a better purchase decision.
Prakash (2008) also stressed that clear benchmarks or scales have to be provided. Thecommunication of verifiable and accurate information that is not misleading is essential,thereby stimulating the potential for market-driven continuous environmental improvement.
Schmidt and Poulsen (2007) focus on Type III environmental declarations but summarisealso some general conclusions from a number of different studies from northern Europe onthe communication of environmental information to consumers. Some of the findingsmentioned above were also confirmed. Consumers are asking for environmental productinformation that they can use in purchasing situations. And they want comparable andreliable environmental information on environmental product qualities. Environmental aspectsare likely to receive higher attention when they are connected to individual aspects such as
Consumer Information about PCF
22
personal health (e.g. organic food products) and private economy (e.g. energy efficiency).Consumers’ acceptance of detailed and complex environmental information is higher formore complex and expensive products. Private consumers desire environmental productinformation in the form of simple symbols, without detailed information and text sections.Selecting environmental information and presenting it in a way which is understandable forcommon consumers is a challenge. On the one hand, the information should be simple, buton the other hand it should be sufficiently comprehensive and precise for the consumer tomake the “right” choice, distinguishing between products with different environmentalcharacteristics. Schmidt and Poulsen (2007) conclude that private consumers in generalprefer declarations that are much simpler than those developed in the framework ofISO 14025 and implemented in national or international EPD-schemes.
Interesting is a last aspect to be mentioned here: Schmidt and Poulsen (2007) assess anapparent risk of detailed quantified environmental product declarations creating a false senseof control that could benefit products with an environmental product declaration, regardlessof the content of the declaration. The same could be the case for products with a PCF labeland one without, making products with some kind of PCF label look better to consumers thenothers without such a label.
Besides general requirements concerning the communication of environmental information toconsumers in the last part of this chapter there will be a focus on the communication of PCFresults to consumers. In the German PCF Pilote Project (PCF-Pilote 2009) and in theMemorandum Product Carbon Footprint (Grießhammer and Hochfeld 2009) severalrequirements for climate-related product labelling were formulated. Among them aspects areincluded that were already mentioned earlier such as credibility, comparability, consistencyand understandability. PCF-Pilote (2009) concluded:
“Providing a total CO2 footprint figure in the form of a static carbon label, as is alreadypracticed by some companies, does not make sense and is not very relevant for consumerdecision making. A figure of this kind suggests a precision and conclusiveness which cannotbe achieved using the current state of methodology.”
Grießhammer and Hochfeld (2009) added that basing on PCF it is not possible at themoment to perform
§ product comparisons of multiple products carried out on behalf of different clients andby different practitioners,
§ public comparison with competing products in ways that are acceptable undercompetition law (e.g. through reporting of CO2e values or use of CO2e labels).
For methodological reasons alone it is therefore at present not possible to use CO2e labelsfor the purpose of comparing competing products. Even if further development has occurrede.g. in international standardisation and Product Category Rules this will only theoretically be
Consumer Information about PCF
23
possible, but in many cases it will continue to founder on the lack of sufficient data or theexcessive costs involved.
Against this background Grießhammer and Hochfeld (2009) recommended the retention ofeco-labels in accordance with ISO 14024 (Type I), such as the Blauer Engel eco-label, aslead labels. As advantages of ecolabels over CO2 labels the following aspects arementioned:
§ A type I label is easily understood and serves as reliable information for consumers:from an overall environmental perspective an eco-labelled product is clearly better thancomparable products;
§ all relevant environmental and health aspects are included;
§ the criteria are identified on the basis of LCAs and eco-toxicological assessments;
§ there is a subsequent discussion of the criteria by a panel of experts;
§ the final decision is taken by an “environmental jury” on which relevant stakeholdergroups are represented;
§ there is a certified award process and checking of the criteria for products marked withthe ecolabel.
5.2 PCF information – experiences concerning different label types
Results from a recent survey in Europe on sustainable consumption and production showthat consumers take environmental issues into account for purchasing decision usingecolabelling (Eurobarometer 2009): Almost half of EU citizens said that ecolabelling plays animportant role in their purchasing decisions; the proportion saying this is important rangedfrom 22% in the Czech Republic to 64% in Greece. Concerning carbon footprint the surveygives kind of contradictory results: On the one hand information about the total amount ofgreenhouse gas emissions released by a product – i.e. the carbon footprint – was consideredto be the least important information on an environmental label (selected by 10%, comparedto 38% for “recycle and reuse”). On the other hand there was a strong support for introducinga mandatory label indicating a product’s carbon footprint: Support ranged from 47% in theCzech Republic – the only country where less than half of respondents were in favour ofsuch labelling – to 9 in 10 respondents in Croatia and Greece.
5.2.1 Overview on currently used Carbon Labels
At the present time, there are no consistent regulations for the communication of PCF withconsumers or the labelling of PCF on goods and services. Still PCF-Pilote (2009) draw thefollowing conclusions: If fundamental requirements and recommendations are taken intoaccount in the communication process, Product Carbon Footprints can act as a strong basis
Consumer Information about PCF
24
for conveying product information which can, in turn, encourage carbon-conscious consump-tion habits. These requirements are presently not fulfilled by a Carbon Label.
In general communication and labelling of PCF-connected information is done in order toaddress one of the four aims shown in the following table.
Table 2 Overview on different categories of carbon labels available on the market.
Example of according labels on the marketNr. PCF-connected information is done in order to
. . . Name Website
1 Display the calculated PCF (with or withoutbenchmarking scale)
Casino Carbon Index /Groupe Casino IndiceCarbone(Delahaye 2008)
www.produits-casino.fr
2Display that the product belongs to the best inclass products concerning PCF without showingany figures (e.g. in connection with a type I label)
Climatop award for lowcarbon, best in classproducts (Schmid 2009)
www.climatop.ch
3Display the calculated PCF and planned orachieved reduction in PCF (as sheer commitmentor in the form of figures)
Carbon Trust Reductionlabel
www.carbon-label.com
4Display that the PCF generated by the product iscompensated, the product therefore is CO2-neutral
The number of international initiatives on CO2 labelling and climate-related product labellingincreased sharply in 2008. Against this background only single examples of the mostimportant type of labels will be discussed on the following, this list of examples is notexhaustive. As mentioned earlier, most carbon labels are currently developed for foodproducts. In the following the examples for labels given in Table 2 are described andanalysed more detailed:
(1) Casino Carbon Index / Groupe Casino Indice Carbone –(Delahaye 2008, http://www.produits-casino.fr):
Description:
The Casino Carbon Index belongs to the category of labels thatdisplay the calculated PCF – and in this case – together with abenchmarking scale.
The label is proprietary for Groupe Casino a major French Retailgroup. Aim of the label – according to its proprietary – is to
create transparency and to enable consumers to take informed decisions on climate-awareconsumption.
The Casino Carbon Index is symbolised by a green leaf and displayed in grams CO2e per100 g of product on the front side of the package. On the backside of the package Casino
Carbon Index is shown as a green band which gives the position of the environmental impactof the product on a scale of levels (weak impact – strong impact). The graduations are fixedin partnership with ADEME6. However it is not explained on the website what exactly thereference for this benchmarking is.
Background for the index is the calculation of the CO2e emissions of the respective productin the following life cycle phases: stages in production (agricultural for foodstuffs),manufacturing the product, transport from the field to Casino warehouses, packaging fromthe extraction of the raw materials to recycling, distribution from Casino warehouses to theconsumer’s home. The use phase (storage and preparation at consumer’s home) and end-oflife are not included. Casino plans to label all 3.000 food products that they offer with theCasino Carbon Index, currently 32 different products are labelled.
Critical acclaim:
Although the integration of a benchmarking scheme in the Casino Carbon Index in principalis helpful to consumers, the whole approach lacks transparency: Neither is informationavailable on how the displayed figure had been calculated nor where the benchmarkingscheme originates from. Does the green ruler show the market range for the very product inquestion of all competitors or only the range of Casino products? Is it connected to the veryproduct at all? There is no information on the product itself or on the website of Casino thatmight enable consumers to judge this. Besides that the ruler is mainly green thereforeconsumers may think that every product / figure is good enough. Anyway it has to bequestioned if the available data are precise enough to allow at all for such rating. It remainsunclear how other products of the same product group would perform and whether there is adifference at all. Within Casino products one might expect that the same method is appliedfor the calculation of the PCF of different products and therefore the results may be assumedbeing comparable somehow. Given labelled products from different retailers (e.g. in Francethe retailer E.Leclerc also displays PCF figures7) this will surely not be true. Additionally, thelabelling process does not include stakeholder involvement.
Summing up the Casino Carbon Index cannot be recommended as reasonable consumerinformation.
6 ADEME: Agence de l'Environnement et de la Maîtrise de l'Energie7 E.Leclerc bases its calculations on generic but not on specific LCA data which does allow for the comparison
of different product groups but not the comparison of single products within one product group.
Consumer Information about PCF
26
(2) Climatop award for low carbon, best in class products(Schmid 2009, www.climatop.ch):
Description:
Climatop belongs to the category of labels that display that theproduct belongs to the best in class products concerning PCF without showingany figures (e.g. in connection with a type I label).
A good or a service approved with the climatop carbon label has to cause significantly lowerCO2 emissions during its life cycle compared to relevant goods or services of the samecategory. Climatop aims at providing a basis for consumers' decision making. The labelbases on LCA data from EcoInvent database. A product can only be labelled if it has an atleast 20 percent lower CO2e emission then comparable products of its product group. Inaddition, the product has to fulfil several other requirements regarding environmental andsocial standards. The label does not display any figures on CO2e emissions. The number ofproducts awarded the climatop label is increasing continuously, including besides productsfrom Migros also products from other providers. At the moment, five food products arelabelled (salt, organic raw cane sugar, organic cane sugar, crème légère, fresh asparagus).
Critical acclaim:
The approach to award only the best product the climatop label without displaying anydetails, makes it easy for consumers to use it as support for their purchase decision. Also,there is no precision pretended that cannot be redeemed. It has to be positively remarkedthat the climatop website provides factsheets and critical reviews on the LCA studies thelabel is basing on. That way it is assured that the calculation is scientifically based andconsumers have access to background data (e.g. range of PCF of different products withinone product group). The label itself does not display any figures but shows only that thecertified product belongs to the best performing products within one product group. In part ofthe product groups the rating bases only on products offered by one retailer (e.g. washingpowder, toilet paper sold by Migros), which bears the risk of ignoring relevant products on themarket with a principally better or worse performance. Additionally, there is no stakeholderinvolvement foreseen in the process of labelling.
The Carbon Reduction Label belongs to the category of labelsthat display the calculated PCF and planned or achievedreduction in PCF (as sheer commitment or in the form offigures). The responsible body for the label is Carbon Trust /Carbon Trust Footprinting Company. The label shows the totalgreenhouse gas emissions in grams per indicated functionalunit from every stage of the product's lifecycle, includingproduction, transportation, preparation, use and disposal. ForB2B products the PCF is done only cradle-to-gate. Thecalculation of the PCF builds upon PAS 2050. The Labelincludes a reduction element whereby the company iscommitted to further reduce the carbon footprint over the
following two years. If the commitment is not met, the company will no longer be able to usethe label. Additionally, information can be given on the label concerning the comparison toother products and the possibilities for consumers to reduce the carbon footprint by theirbehaviour. The label can be placed on the package of the product or alternatively used at thepoint of sale or in the internet. The Carbon Trust label is the most prominent label at themoment in the carbon reduction category.
Critical acclaim:
The display of CO2e figures can in general not be seen as useful for consumers at themoment: it pretends a precision that is not available at the moment, figures for differentproducts are not comparable and in general such figures are of little or no help to consumers.Additionally, the focus on reduction must be seen as problematic: a fundamental problem isthat good performers cannot easily reduce whereas bad performers are able to. As aconsequence the “wrong” may get rewarded. Then it is unclear who verifies the reduction. Asthe reduction is only a commitment, a company may label their products with the reductionlabel even if they do not reduce their emissions at all. Only after two years they will loose thelabel. In general it can be added that the choice of products labelled with the Carbon TrustReduction label is at random, therefore not addressing the most relevant products butproducts such as crisps. Furthermore the label lacks a benchmark or scaling system thatenables consumers to judge the relative performance of a specific product. One single figurealone does not give evidence.
Summing up the Carbon Trust Reduction Label cannot be recommended.
(4) Certified Carbonfree – a CO2e-neutral label(www.carbonfund.org)
Description:
The label “certified Carbonfree” belongs to the category of labels thatdisplay that the PCF generated by the product is compensated, the
product therefore is CO2-neutral. Carbonfund, a charitable non-profit organisation isresponsible for the Cabonfree label.
The process to certify a product encompasses three steps: first the carbon footprint of theproduct is calculated. Then the determined amount of greenhouse gas emissions is offsetwith a project type chosen by the producer (reforestation, energy efficiency, renewableenergy). The projects are certified by third party standards. In the last step the partnership iscommunicated (CarbonFree logo, blogs and newsletter articles, website). Concerning themethodology for the calculation of the carbon footprint Carbonfund refers to the WBCSD/WRIProtocol. There exist a number of different certified products, e.g. mobile phone, T-Shirt,sugar, coffee.
Critical acclaim:
The discussion on offsetting in general is still ongoing and shall not be represented here.PAS 2050 e.g. does not allow offsetting at all when calculating a PCF. Anyway focus must beon the reduction of CO2e emissions over the life cycle of a product and the identification ofproducts that have comparably low CO2e emissions. The compensation of its CO2 emissionsalone does not decrease the carbon footprint of a product. Concerning carbon offset projectsused for compensation the main critics are related to the following points: Are the carbonoffset projects real and additional, not covered by regulation e.g.? Does offsetting set theright course in developed and developing countries (e.g. concerning infrastructure)? Or doesit actually hinder sustainable development for the future in both?
Against this background carbon neutral labels are not recommended as reasonableconsumer information and decision support concerning climate relevant emissions.
5.2.2 ISO labels in the context of PCF (type I, II and III)
Differing from the labels described in the previous chapter the following three label types aredefined by ISO standards. Subsequently, it is discussed whether the PCF found its way inthose labels.
Type I Environmental Labels (ISO 14024)
§ Include environmental labels like the Blue Angel, Nordic Swan, EU environmental label.
§ The certified products are amongst the least environmentally harmful products in theircategory, since they meet strict environmental requirements.
§ The labels base on a multi-criteria approach, in which the criteria are decided upon byan independent group of interested stakeholders.
§ Products are certified by a third party.
§ Labels enjoy a high credibility by their target groups, which are consumers and publicprocurement.
At the moment, information on PCF or CO2e emissions on the bases of an LCA or PCF areused to check the overall impacts of a product over its life cycle. Then, criteria are developedfor the identified hotspots. Those criteria usually do not refer to CO2e emissions directly butrather indirectly, setting limits for e.g. electricity demand or excluding certain productsolutions at all because of their high PCF value.
There is one prominent example for a type I label that strongly focuses on climate relevantemission: the German Blue Angel was re-launched in 2008 in four different thematic clusters,one of them being the cluster “Blue Angel, protects the climate” (“Blauer Engel, schützt dasKlima”). Products belonging to this cluster are of high relevance concerning their climateimpact, e.g. energy consuming products like household appliances or energy relatedproducts like solar-powered appliances. Figures on the PCF are not displayed or directlyused as limit values for criteria. But even for this specific “Blue Angel, protects the climate”, amulticriterial approach is applied which means that all relevant environmental impacts areconsidered, not only greenhouse gases.
It may generally be concluded that for type I labels
§ in-depth PCF studies serve very well as starting point for the identification of hotspotsand the development of criteria. The PCF value over the whole life cycle is not suitableas limit, CO2 emission values for single life cycle phases may be suitable for individualproduct groups (see e.g. EU ecolabel for paper with its CO2e limit for production);
§ instead of CO2e limits, the results of the in-depth PCF study will rather serve to identifysuitable production and use phase indicators like hazardous substances in productionand electricity demand in the use phase. Moreover, hazardous substances in theproduct (e.g. flame retardants in plastic parts) and quality issues may be added;
§ the multicriterial approach has proven successful and will also be followed in the future.As other relevant environmental impacts could be missed, it would be counter-productive and expedient to focus on CO2e emissions alone.
Type II Self Declarations (ISO 14021)
§ Are a self declaration of companies on environmental features of their products
§ Usually address consumers (B2C)
§ Mostly address single properties of the product (e.g. share of recycling material,chlorine free bleaching or CO2e emission)
Consumer Information about PCF
30
§ Criteria are chosen by the companies themselves and are not necessarily agreed uponon a broader level (e.g. industry associations). A broad stakeholder involvement is notnecessary.
§ A third party certification does not take place. The credibility of the labels is thereforerestricted.
Carbon footprints or CO2e emissions increasingly play a role in type II labels including theaspect of CO2e compensation. The above described Casino Carbon Index is one example ofsuch a label. There is a proliferation of such labels that make it confusing for consumers totry to integrate climate reduction in their purchasing decision. At large, the variety of labelsbears the risk that consumers lose confidence, mix up their purchase decisions or even looseinterest in considering climate impact in their purchase decisions at all.
It may be generally concluded that for type II labels
§ it is problematic that companies can pick one specific aspect – in this case CO2eemissions / the climate change issue – which is then addressed by the label.Concerning other environmental impacts, the performance of that specific product maybe significantly worse or the focus on CO2e emission may actually be counter-productive. It even may not be the most relevant environmental impact of the product inquestion at all;
§ there is, besides that, no democratic stakeholder involvement foreseen.
Type III Environmental Product Declarations (ISO 14025)
§ EPDs base on the methodology of Life Cycle Assessment (ISO 14040) and give infor-mation on the environmental impacts of a product over its whole life cycle together withtechnical information on the product. Concerning the restrictions of this approach seePrakash et al. (2008) and chapter 5.1 of this study.
§ The covered impacts include the classical impact categories of LCA supplemented byadditional information on specific aspects of the particular product (e.g. radioactiveradiation, leaching behaviour etc.).
§ This complex set of information is given preferably to professional customers (B2B),communication to consumers is not yet very relevant.
§ The definition of Product Category Rules, which is necessary before generating anEPD includes stakeholder involvement.
§ Third party certification is obligatory if communication (B2C) is intended.
The information on CO2e emissions is included in an EPD as standard category amongother impact categories and parameters. As the development of ISO standards for thequantification of PCF is still ongoing, it is unclear whether the greenhouse gas emissionscalculated in a “traditional” EPD directly correspond to a specific PCF value calculated
Consumer Information about PCF
31
according to the current status of standards. Results probably can’t just be transferred. Aneye has to be kept on this aspect.
It may be generally concluded for type III labels that
§ they or EPDs are not suitable for consumer information. As aforementioned, privateconsumers generally prefer declarations that are much simpler than those developed inthe framework of ISO 14025 and implemented in national or international EPD-schemes;
§ in EPDs, benchmarking or scaling schemes are not available. Therefore, it is notpossible to judge the relative environmental performance of a product compared toanother one of the same product group. This also bears the risk that a product appearsto be climate friendly only because an EPD is available, hence, misleading consumersand customers.
For some product groups there exists an established mandatory labelling scheme concerningenergy demand and/or CO2-emissions:
§ for household appliances (Directive 92/75/EEC): includes household lamps, washingmachines, dishwashers, tumble dryers and cooling appliances: besides the display ofthe electricity demand per year or per process (e.g. per washing cycle), it is alsodisplayed how much water is used per process (if applicable) and to what extent theaspired function is fulfilled (e.g. cleaning performance). The used A-G rating schemeproved to be very instructive to support consumers in the purchase of energy efficientappliances. After the proposed revision the EU energy label will lose value as forspecific products only A grades, like A, A+, A++ and A+++ could be used. The additionof CO2e emission data would not add to the benefit of the EU energy label as they aredirectly correlated to the electricity consumption. Apart from the risk that the differentelectric grids of the different EU countries may cause difficulties: a low CO2e emissioncould be caused by a high energy standard or by a high degree of nuclear power withinthe power plant mix. Therefore, it would be better – if at all – to use the Europeanelectricity mix with its specific CO2e emissions for all EU countries as bases.
§ for cars (Directive 1999/94/EC): besides the demand of fuel per 100 kilometre, theCO2 emissions per kilometre for a new car have to be displayed at the point of saleand in advertisements, brochures etc. The displayed data refer to the so calledEuropean driving cycle, which is a defined mixture of inner-city, outer-city and highwaydriving. Probably no consumer actually will drive according to this driving cycle inreality. Hence, the figures only give limited support to consumers. Furthermore, it has
Consumer Information about PCF
32
to be noted that neither precombustion nor non-CO2 greenhouse gases are included.Most important for communication: there is no benchmarking scheme available thatwould allow consumers to judge the performance of a car by means of a simple colouror letter code.
§ for electricity (Directive 2003/54/EC): electricity suppliers have to deliver theircustomers’ information on the specific CO2 emissions and the amount of nuclear wasteconnected with the generation of the electricity purchased. Besides, they have to giveinformation on the fuel mix. In order to be able to rank the information, consumers alsohave to be provided with information on the average country mix and the residual mixof the provider. Altogether the information mix offered seems to be very instructive,concentrating on the relevant aspects concerning an environmentally friendly electricityproduct. Consumers are enabled to identify an electricity product with low greenhousegas emissions, that generates no nuclear waste and that bases on a high degree ofrenewable energy sources and/or cogeneration of heat and power. However, manyconsumers are still unaware of this chance.
5.2.4 Other forms of information
Besides labels there are also other forms of information that may include PCF results.
One case to be highlighted at this point is the use of PCF data as a base for generalrecommendations for a specific product group. This case will be discussed using theexample of the Swedish proposal for “environmentally effective food choices” (NFA 2009).Aim of these general recommendations of the National Food Administration is to supportconsumers to take purchasing decisions on food with reduced environmental and alsoclimate impacts. Therefore, these guidelines are not a carbon label but the integration ofaccomplished knowledge on the climate impact of food into general principles for arecommendable food choice. The Swedish National Food Administration worked out guide-lines that integrated – among other relevant environmental impact categories like a richdiversity of plant and animal life, toxic environment – also recommendations for a food choicewith reduced climate impact. The general recommendations encompass the following foodgroups:
§ Meat – beef, lamb, pork and chicken;
§ Fish and shellfish;
§ Fruits and berries, vegetables and leguminous plants;
§ Potatoes, cereals and rice;
§ Cooking fat;
§ Water.
Consumer Information about PCF
33
The recommendations have a rather simple form like “Eat less meat”, “Prefer locally grownanimals, reared on grasslands (in the case of beef and lamb)”, “Chicken and pork have alower climate impact then beef and lamb”. The background of each recommendation isexplained within the text and therefore is comprehensible.
At the moment, the proposal is being revised as the EU criticised the recommendation toprefer regional food as being a potential trade barrier.
5.3 Conclusions
Conclusions concerning the general needs of consumers concerning information onProduct Carbon Footprint (PCF):
§ In general private consumers prefer declarations that are much simpler than thosedeveloped in the framework of ISO 14025 and implemented in national or internationalEPD-schemes.
§ Comprehensibility is a key feature of labels: well structured display, aggregation of theinformation, concentration on the gist that helps to make a better purchase decision.
§ Clear benchmarks or scales have to be provided. Additionally it must be possible toidentify superior products.
§ The communication of verifiable and accurate information that is not misleading isessential, thereby stimulating the potential for market-driven continuous environmentalimprovement.
§ Providing a total CO2 footprint figure in the form of a static carbon label, as is alreadypracticed by some companies, does not make sense and is not very relevant forconsumer decision making. A figure of this kind suggests a precision and conclusive-ness which cannot be achieved using the current state of methodology.
§ For methodological reasons alone, it is presently not possible to use CO2eq labels forthe purpose of comparing competing products. This will only theoretically be possibleafter further development will have taken place, e.g. in international standardisation. Inmany cases, however, it will continue to founder due to the lack of sufficient data or theexcessive costs involved.
§ Therefore, it is recommended to retain eco-labels in accordance with ISO 14024(Type I) as lead labels. One main advantage of type I ecolabels over CO2 labels is thattype I labels are easily understood and serve as reliable information for consumers:from an overall environmental perspective an eco-labelled product is clearly better thancomparable products.
Consumer Information about PCF
34
Conclusions concerning PCF information – experiences concerning different labeltypes:
The use of PFC in labels is problematic and only recommendable in some cases:
§ The currently available Carbon labels are mainly privately owned and are critical fromthe point of view of methodological questions (e.g. product category rules, precision,comparability, data base), differentiation of products, transparency (e.g. availability ofdocumentation and background studies), and lack stakeholder involvement.
At the moment, mainly two ways of using PCF results for communication purposes seem tobe promising and recommendable:
§ Using of fundamental PCF studies as a starting point for the development of productcriteria in type I labels. The idea is not to use CO2e emission data directly as criteria /limits but to identify hotspots and to set criteria in an adequate manner, consideringclimate relevant emissions (e.g. addressing energy efficiency by limiting electricitydemand).
§ Using fundamental PCF studies as a base for general recommendations for specificproduct groups (e.g. food).
6 Overview of the relevance of PCF in different product groups
6.1 General prioritisation
Due to the focus on PCF in this study and the strong correlation of PCF to energy consump-tion, a categorisation of products makes sense when oriented at the relation of the productsto the energy consumption:
1) Energy consuming products: products that need electricity or other sources of energyto be operated, e.g. cars, household appliances, heating systems.
2) Energy saving products: products that help to reduce energy consumption duringtheir application, e.g. insulation material, time switches, programmable room thermo-stats.
3) Products with relevance concerning greenhouse gas emissions at production phase:products that do not need energy to be operated and do not influence energy demandindirectly, e.g. food, paper, textiles and electricity.
For each of the above product listed categories, examples for product groups were chosenand further analysed in the chapters 6.2 to 6.8. Subsequently, the rationale for the choices ofproduct fields is elucidated.
Consumer Information about PCF
35
The following figure shows the relevancy of the eight most important product fields for privateconsumption. It bases on a material flow analysis from Quack and Rüdenauer (2007) thatanalysed the environmental impacts of an average household in Germany in the year 2005.The analysis included the direct impacts from the actual consumption (e.g. emissions fromcar use or heating) as well as impacts from precombustion processes (e.g. resourcedepletion, production) and processes at the end of life (e.g. recycling, waste incineration).The latter impacts have been allocated for one year. Example: The average life span of a caris 12 years, therefore 1/12 of the production on one car is calculated for one year. For eachof the eight product fields it was defined in detail which processes had to be considered.
Basing on this material flow analysis it can be shown that building & housing with a share of41% contributes most to the overall 16,5 tons of CO2e emissions per private household inthe year 2005 (Quack and Rüdenauer 2007). The supply of thermal energy for heating andwarm water is the most relevant cause. => Therefore, insulation material was chosen as oneexample.
Global Warming Potential
Building & Housing40,7%
Mobility25,8%
TV & Co.2,5%
Clothing0,3%
Information & Communication3,2%
Laundry washing & drying2,2%
Eating & drinking19,5%
Refrigerating, Cooking,Dishwashing
5,8%
Figure 1 Relative share greenhouse gas emissions in eight different product fields important for privateconsumption. Functional unit: consumption of one statistical average household (2,1 personsper HH) in Germany in the year 2005 (including production, use and end-of-life in 8 productfields). Source: Quack and Rüdenauer 2007
The product field mobility contributes with 26%, the car use being the most relevant share ofit. Above all, it is mandatory to display the CO2 emissions per kilometre at the point of sale,
Consumer Information about PCF
36
in brochures, advertisements etc. => Therefore cars were chosen as another productexample.
The third most important product field concerning greenhouse gas emissions is food with acontribution of about 20% to the overall greenhouse gas emissions of a household. More-over, food is the product group for which by far most of the carbon labels are beingdeveloped at the moment. => Therefore food was chosen as product example.
Household appliances are responsible for about 8% of the greenhouse gas emissions andare the main consumers of electricity in households. Furthermore, a mandatory energy labelfor household appliances already exists. => Accordingly, household appliances were alsochosen as product example.
In the product group information & communication, paper with an overall share of 3,2% is asignificant contributor. => Therefore paper was also chosen as product example.
The product group clothing does not show up with a significant contribution. As the data basefor textiles is incomplete, however, the figures seem to be uncertain. Additionally it is aproduct group where carbon labels already exist (see EarthPositive 2009) and where it canbe assumed that consumers are interested in.
For the sake of completeness, in the following figure the share of the greenhouse gasemissions of the private households in the eight product fields are compared with otherenvironmental impact categories (Quack and Rüdenauer 2007). One can see that the overallsignificance of the product fields does not change much: mobility changes place with building& housing for being most important concerning eutrophication, photochemical ozone creationand the overall environmental burden. Third most important is still food.
Consumer Information about PCF
37
0%
10%
20%
30%
40%
50%
60%
70%
80%
90%
100%
KEA GWP AP EP POCP Overall environmentalburden
Building & Housing Mobility Eating & drinking Refrigerating, Cooking, DishwashingClothing Laundry washing & drying Information & Communication TV & Co.
Figure 2 Relative share of environmental impact in different impact categories. Functional unit: consumption of one statistical average household (2.1persons/HH) in Germany in the year 2005 (including production, use and end-of-life in 8 product fields). Abbreviations: KEA: Cumulated EnergyDemand; GWP: Global Warming Potential; AP: Acidification Potential, EP: Eutrophication Potential; POCP: Photooxidative Potential.
Consumer Information about PCF
38
In order to complete the picture it has to be stated that other possible impacts on theenvironment (e.g. toxic impacts, noise, impacts on biodiversity) were not analysed in Quackand Rüdenauer (2007).
Against this background, in the subsequent chapters, the following seven product groups willbe analysed in detail:
§ Energy consuming products:
1. Cars,
2. Household appliances;
§ Energy saving products:
3. Insulation material;
§ Products with relevance concerning greenhouse gas emissions at production phase:
4. Electricity,
5. Food,
6. Paper,
7. Textiles.
6.2 Category 1 (Energy consuming products), Example 1: Cars
The overall relevance of PCF in the product group cars is high. Most important is the usagephase with a contribution of between 80 and 90% to the overall impact of a car, dependingon the specific car. The PCF of different car models differ significantly, therefore PCF cansupport decision making. It has to be added that – although there are also differences in theproduction phase – the differences in the usage phase are by far larger. Therefore, con-cerning the communication of car features connected to the carbon footprint, it may be usefulenough to concentrate on the usage phase in the first step. But as there is also a differencein the carbon footprint of different cars in the production phase depending e.g. on their size(e.g. small size car versus a SUV), the whole life cycle may be included in later steps.
As cars have a relatively long life time, consumers only rarely have to decide about thepurchase of a car. With one single decision the environmental impacts connected with carusage are decided upon for a long period of time. Therefore, consumers are willing to takesome time and effort before they decide on the purchase.
There exist a number of approaches to include CO2e emissions in the communication oncars:
§ The labelling Directive 1999/94/EC relating to the availability of consumer informationon fuel economy and CO2 emissions in respect of the marketing of new passenger cars(OJ L 12, 18.1.2000) requires the display of a label on fuel consumption and CO2
Consumer Information about PCF
39
emissions on all new cars, the publication of national guides on the fuel efficiency ofnew cars (for Germany see e.g. DAT 2009), the display of posters at the dealershipsand the inclusion of fuel efficiency information in printed promotional literature (EU2007). It has to be added at this point that the obligatory EU label is disregarding thefollowing points:
‒ Most important: there is no benchmarking system (such as for the EU energy labelor in the Swiss Energieetikette) that enables consumers to see whether a specificCO2 emission figure is low or high, resp. whether a specific car performs bad orgood. A colour or letter code would help immensely.
‒ Precombustion is not included (e.g. production of gasoline).
‒ Only CO2 is considered, no other climate relevant emissions.
‒ CO2 emissions of production and end-of-life are not included.
§ In Switzerland, the Energieetikette (energy efficiency label) is mandatory for cars and,apart from the fuel consumption, also displays the CO2 emissions in gram per kilometre(TCS 2009). For Germany, Verkehrsclub Deutschland e.V. proposed an A-G labellingscheme similar to the energy efficiency labelling related to the fuel consumption (VCD2007).
§ Apart from that, there exist several ranking lists for new cars8 from nongovernmentalinstitutions that include CO2 emissions as one criterion among several others (such asnoise, emission of NOx).
§ There even exists a Product Category Rule for passenger vehicles that would enablethe preparation of an EPD for cars9. Volvo published an EPD calculator for its two mostsold truck models10.
The extent of improvement potential concerning climate relevant emissions is high. The PCFof the use phase can be reduced significantly by buying an efficient car and by using itenvironmentally sound.
Also the potential of product differentiation is high. The differences in PCF, especially of theuse phase, between the available car models are rather large. The production and end-of-lifephase does not vary that much, taking into account the whole life cycle. Still it would makesense in later steps to determine basic data on the production of a restricted number ofdifferent size classes of cars (e.g. small, medium, large).
8 See e.g. www.autoumweltliste.ch (in German), www.ecomobiliste.ch (in french), or www.vcd.org (in German).9 PRODUCT-CATEGORY RULES (PCR) for preparing an environmental product declaration (EPD) for
“Passenger vehicles” PCR 2005:3 Version 1.0 2005-03-15. http://www.environdec.com/pcr/pcr0503_e.pdf.10 See http://www.volvo.com/trucks/uk-market/en-
The use phase of a car dominates its PCF with about 80 to 90% (Quack and Rüdenauer2004). Besides the principal features of the car (e.g. size, weight, fuel consumption), the PCFis highly variable due to the use pattern: the more kilometres are driven the higher the PCF,the more inner-city driving the higher the PCF, the more anticipatory the driving the lower thePCF. As a consequence the value given by the obligatory label only can be an aid toorientation but will not correspond to specific usage behaviour. Also there is a methodo-logical problem in that the European driving cycle does not correspond to the driving practiseof consumers; additionally it is measured under laboratory conditions, which again does notcorrespond to real life situations11. Therefore, it would be important to develop a petrolconsumption test that is more in line with real driving. Additionally, an approach for testinghas to be defined for electric cars too.
The preparation of a PCF covering the whole life cycle of a car including production and end-of-life for each model or product line of each producer would be far too costly compared to itsbenefit. The guidelines can be made clear on the basis of in-depth PCF studies coveringtypical products: In order to reduce the PCF of cars it is important to produce lightweightvehicles with efficient engines and low fuel consumption. Besides that, there are two otherreasons not to request for the display of the PCF of the whole life cycle of a car:
§ As different car models differ significantly in their CO2 emissions during the usagephase, expressed in gCO2/km, and there is no indication that this CO2 indicator maypoint into the wrong direction, in principle, this figure supports consumers buying anenvironmentally friendly car.
§ As the CO2 emissions support the purchase decision in the “right way” it makes moresense at the moment to concentrate on a better communication of these figures: Howto reach consumers in a better way so that they really consider it in their decisions? Inlater steps one might include other life cycle phases and address then reduction ofmaterial, reduction of energy for production, enhanced durability, best recyclingoptions, waste minimization, chemicals, etc.
As fuel consumption is directly linked to the PCF during the usage phase of a car, it would bean alternative to communicate the specific fuel consumption instead of CO2e emissions.However, one has to be aware that different fuels have different values in kg CO2e/liter(diesel: 2,6 kg CO2/Liter; benzine: 2,4 kg CO2/Liter). This would be similar if addressingelectric cars.
It has to be kept in mind that also environmental impacts other then climate change are ofrelevance when talking about cars: Noise, non greenhouse gas emissions (e.g. NOx,particles). Indirect effects due to infrastructure for the use of cars (e.g. roads, bridges): landuse, fragmentation of ecosystems, biodiversity losses.
11 See www.spritmonitor.de (in German) for data on CO2 emissions measured under real life conditions.
Still, the focus on CO2e / PCF does not bear the risk to adversely affect other environmentalaspects. As far as information is available, no adversely effects have to be expected bypreferring low CO2e emission cars. PCF points in the right direction and addresses one mainenvironmental problem connected with cars.
6.3 Category 1 (energy using products) Example 2: Household appliances
The relevance of household appliances is high as they account for the most relevantelectricity consumers (see e.g. white goods like washing machines, tumble dryers, dishwashers). Concerning the PCF of the whole life cycle, the usage phase contributes most(≈80-90% share, depending on specific appliance). The PCF of the usage phase is due toelectricity consumption and eventually consumption of water, detergents and – to a lowerextent – due to repair etc.
The following figure shows the global warming potential of different typical householdappliances over their life cycle. Although the share depends on the energy efficiency (see thedifferent results for tumble dryer with energy class C and A), it is obvious that the use phaseis most significant.
Consumer Information about PCF
42
-50
0
50
100
150
200
250
Washing machine Tumble Dryer(conventionel, class
C)
Tumble Dryer(condensation with
heat pump, class A)
Refrigerator (withoutfreezer, class A+)
Fridge-Freezer (2doors, class A+)
Coffee machine(fully automatic)
Coffee machine(portioned machine)
Glo
bal W
arm
ing
pote
ntia
l [kg
CO
2e/a
]
Production Use End-of-life
Figure 3 Overview of the annual global warming potential connected with the life cycle of different household appliances. (Source: own calculations Öko-Institut 2009)
Consumer Information about PCF
43
As household appliances have a relatively long life time, consumers only seldom have todecide about their purchase. Therefore, with few decisions, environmental impacts aredefined for a long period.
The following approaches in the sense of rankings, rating systems etc. already exist:
§ Directive 92/75/EEC12 (ELD) on the indication by labelling and standard productinformation of the consumption of energy and other resources by household appliancesis a framework that mandates the EU Commission (assisted by a RegulatoryCommittee) to adopt labelling implementing measures for specific householdappliances (Refrigerators, freezers and their combinations, washing machines, driersand their combinations, dishwashers, ovens, water heaters and hot-water storageappliances, lighting sources and air-conditioning appliances). The ELD requiresretailers to display a comparative label – A to G classes with A being the most energyefficient category – showing the level of consumption of household products toconsumers at the point of sale. At the moment the ELD is under revision.
§ Several type I labels (e.g. EU Flower, Blue Angel, Nordic Swan) exist for different typesof household appliances, e.g. refrigerators, washing machines. Until now, the numberof certified products is restricted (EU Flower: only light bulbs, Blue Angel: none, NordicSwan: dish washers, washing machines).
§ Additionally, EPDs exist for a few products (e.g. for a vacuum cleaner and a sewingmachine13).
In principle, a PCF includes the production, the use and the end-of-life phase of a householdappliance and therefore gives a complete picture of the greenhouse gas emissionsconnected to the specific household appliance under consideration. The current EU energylabel only includes the electricity demand in the use phase (potentially completed by thewater demand), and existing type I labels do not display the specific PCF of a product. Atleast for the large household appliances, it is known that the relevance of the production andend-of-life phase is low compared to the use phase. For smaller household appliances, theproduction phase might be more important, but only very few data are available (see e.g. theEPD example for the sewing machine13).
Concerning the energy demand in the use phase of household appliances and the PCFconnected herewith, there is still improvement potential. Concerning the other product
12 For an overview seehttp://europa.eu/legislation_summaries/consumers/product_labelling_and_packaging/l32004_en.htm.
13 EPD sewing machine: ENVIRONMENTAL PRODUCT DECLARATION (EPD): SEWING MACHINE PFAFF2046 (440). VSM Production, s.r.o. EPD Registration Number: S-EP-00027. Date of EPD verification:26.10.2005.EPD vacuum cleaner: ENVIRONMENTAL PRODUCT DECLARATION (EPD): FLOOR VACUUM CLEANERETA 1450 PROXIMO. ETA, a.s. EPD Registr. Number: S-EP-00026. Date of EPD verification: 3.10.2005.
phases, they must be considered low for large household appliances. This is probably thesame for small household appliances.
Various studies show that the differences between product models are large concerning theuse phase (e.g. up to 45% less energy demand of class A++ cooling appliances incomparison to class A cooling appliance), but only small concerning the production and end-of-life phase.
Specific usage behaviour can deviate from typical usage behaviour in the sense of usefrequency, program choice (e.g. temperature for washing machines and dishwashers), orloading (e.g. full or only half). Therefore, depending on the specific usage behaviour, thePCF of a household appliance in “real life” can differ significantly from the calculated valuebased on a typical behaviour. Still, the result most probably will be right in the sense that thecomparison of different products will lead to the same conclusions, even if usage behaviouris assumed for all products that is deviant from the typical one.
Even more important than the usage behaviour is the variation of greenhouse gas emissionsin the use phase connected to the electricity supply in different countries: depending onwhere an appliance is used, the related greenhouse gas emissions can be very different. Thelower the greenhouse gas emissions, the higher the share of renewable energy or – which ismore probable – the higher the share of nuclear power can be.
Against that background, the additional benefit of a PCF covering the whole life cycle isrestricted: overall, it seems to be sufficient to determine PCF data for representative productsof the different household appliances (e.g. typical washing machines, dishwashers,refrigerators etc.). But it is not of much additional help to ask the PCF for each single model.
As the electricity demand usually is directly connected to the greenhouse gas emissions ofthe use phase, addressing energy efficiency also includes the issue of climate change.Exceptions occur in connection to the electricity supply: depending on the offer, the green-house gas emissions can vary between zero and several hundred grams of CO2e perkilowatt-hour.
Additionally, one can address the greenhouse gas emissions due to the electricity supply.Focus should be on the support of low CO2e offers with high share of renewable energiesand without nuclear power. The latter not addressing the climate change issue but otherenvironmental risks.
It is useful to have access to data on an in-depth PCF study of representative products ofone product group (e.g. washing machines) as one knowledge base for the development ofcriteria for the type I label. But it is not necessary to have that data for each single model.
Which other environmental issues are relevant? From the point of view of resources, energyefficiency can be added here. Depending on the device, other aspects can also play a role:e.g. water demand during use phase, cooling agents, hazardous substances in productionand product.
Consumer Information about PCF
45
Overall, the PCF of household appliances does not bear the risk to generate adverse effects.But concerning electricity demand, PCF does not give a complete picture of the impacts ofelectricity consumption, as impacts connected with nuclear waste e.g. are not considered. Alow PCF may base on a high share of nuclear power plants (e.g. in France) with the herewithconnected risks.
Altogether, it can be concluded that for household appliances, in-depth PCF studies areuseful as background for type I labels in order to the identify hotspots and to derive criteriacorrelated to the carbon footprint (e.g. electricity demand in the usage phase).
Against the mentioned difficulties, a single PCF label or the inclusion of CO2e figures on theEU energy label makes no sense.
6.4 Category 2 (Energy saving products) Example 1: Insulation material
Insulation materials belong to the group of energy saving products. Energy saving productsare characterised in having no or very low CO2e emissions during the use phase. Their maindirect impacts occur during the production phase. In the case of insulation materials, thereduction of energy consumption in the system “building” during use due to insulationmaterial is the most important one. Even in most newly built houses, about 80 percent of theoverall CO2e emissions that occur over the life time result from the use phase (see e.g.IMPRO 2008 and Quack 2001). Therefore, production and end-of-life of all materials neededto build a house only contribute to about 20 percent to the overall result. This makes possiblereduction potentials due to the choice of a specific insulation material rather irrelevant.
As every building is different, it is difficult to specify the potential to reduce the thermalenergy demand during usage due to e.g. 1 kg of a particular insulation material.
Construction activities are usually done by professional companies; therefore, PCFinformation, displayed on insulation material, will usually not be realised by consumers. Thedecision which insulation material is to be chosen will mostly be made by the professionalcompany and not by the consumer himself. Still, consumers decide on the thickness of theinstalled insulation material (e.g. 10 cm or 30 cm) of private owned buildings and thereforehave a crucial influence on the energy performance of the building and thus also on the PCFof the insulation material.
There are several approaches, e.g. in the form of rankings or rating systems:
§ Indirect, as not the insulation material but the whole building is addressed: the Directive2002/91/EC on the Energy Performance of Buildings (EPBD) aims at promoting theenergy performance of buildings. Article 7 deals with energy performance certificates(EPC) and declares that a certificate is “to be made available to the owner or to theprospective buyer or tenant when a building is constructed, sold or rented out. […] Thecertificate is to contain reference values such as current legal standards andbenchmarks to allow comparison of the energy performance of buildings. It is to be
Consumer Information about PCF
46
accompanied by recommendations for the cost effective improvement of energyperformance.”
§ Type I labels like the Blue Angel (e.g. for insulation material from secondary resourcesand insulation material for inside application) certify a number of insulation materials.
§ There is a number of EPDs of insulation materials published (e.g. foam glass, mineralwool, mineral insulation boards). For an overview of the available EPD in Germany seehttp://bau-umwelt.de14.
§ Additionally, a variety of other labels from different organisations exist, the mostcommon now being the natureplus label15. The criteria for the natureplus label for partof the products also encompass limits on CO2e emissions for the production phase.
As the PCF in principal covers the whole life cycle of a product, it bears the possibility toinclude the reduction potential of insulation material during the use phase of a building.However, the consideration of the use phase is difficult from the methodological point ofview.
The improvement potentials are not so much related to the different insulation materialsthemselves but on the amount of insulation installed at the building. In brief: the thicker theinsulation layer, the lower the thermal energy demand and the higher the reduction potential.
Focussing only on the production phase of the insulation material, the differences can besignificant, e.g. between foam glass and wood fibre. But over the whole life cycle of thebuilding this difference turns out to be marginal. The important point is how much insulationmaterial practically can be applied: materials that insulate better have an advantage as theycan be applied in thinner layers to reach the same U-value as others that insulate less.
The variability of PCF results for different insulation materials derives from the amount ofinsulation material applied by the user and the therewith reached energy standard of therespective building. Depending on the decisions of the responsible person, the energystandard can vary widely between the basic legal requirements and passive house standard.As a consequence, the reduction potential of the insulation material during use phase candiffer significantly.
The effort to determine a specific PCF is always significant. Like for other products, it makessense to generate PCF data for exemplary products of the different types of insulationmaterial (e.g. glass wool, wood fibres, polystyrene) but it would be too great of a demand torequest PCF data for each single product.
14 For insulation material see:http://bau-umwelt.de/hp545/Daemmstoffe.htm?ITServ=C1036fdb1X124d3bf7960X14ba.
15 Launched by the Internationale Verein für zukunftsfähiges Bauen und Wohnen – natureplus e.V. (seewww.natureplus.de).
As in the context of insulation material a good energy standard of buildings is the crucialpoint in the avoidance of CO2e emissions, this issue can be addressed directly. Legalrequirements concerning insulation and information on the energy standard of buildings thatare for sale and for rent, information campaigns on how to renovate best, subsidies etc. areadequate measures to do this.
The PCF of insulation material – also as a starting point for type I labels – is of marginal helpas the key issue actually is the energy standard of the building it is built in and its energydemand during use. The PCF connected with the use of the building depends on twoaspects: the energy standard of the building (codetermined by the insulation material) andthe heating system. The latter can – independent of the used insulation material – have lowCO2e emissions (e.g. basing on an efficient wood pellets boiler) or high ones (e.g. basing onan inefficient oil boiler). Instead of PCF labels, it makes more sense to focus on energycertificates of buildings that became obligatory under the EPB Directive and on chemicals.
Depending on the insulation material, other environmental issues may be relevant: resourcedepletion, hazardous substances, or acidification potential.
The focus on CO2e bears the risk to adversely affect other environmental aspects. Theconcentration on PCF could – besides the fact that it favours a better insulation of buildings –also favour heating systems that base on renewable energies (e.g. wood pellets, solarenergy) and leave measures to improve the energy standard of the building undone.Therefore, the heating system used to calculate the use phase should base on fossil energysources (e.g. gas, oil) and not on renewable ones.
6.5 Category 3 (products with relevance to climate at production phase)Example 1: Food
As most activities currently flow into the carbon labelling of food products, the analyses ofthis product group are carried out in more detail as the other product groups.
Meat consumption
Due to the production systems for meat, a high greenhouse gas relevance is immanent, asone kilogram of meat output does not equal the input of one kilogram of feed, but seven(FMHW 2003). On top of that, methane emissions (especially for beef) during animals’ lifeplay their part in making meat a highly climate relevant figure (UNFCCC 2005). Between theproduction of several kinds of meat (e.g. bovine, pig, poultry) there are differences in thegreenhouse gas potential. This depends primarily on the high methane emissions of beefand on the different life times of each animal.
A change in the average EU diet, i.e. a shift away from meat, offers potential for sustain-ability. Factors accounting for GHG emissions, in respect to the aggregated product groups,clearly illustrate where potentials are (see table below).
Consumer Information about PCF
48
Table 3 Overview on the average greenhouse gas emissions connected to the production of differenttypes of meat, cereals, vegetables and dairy. Source: GEMIS 2009 (www.gemis.de)
Name Greenhouse gas potential [kg CO2e/kg]
MeatBovine 13.96Pig 3.25Poultry 3.48
Cereals 0.78Vegetables 0.14Dairy 8.20
It has to be kept in mind that the production of milk products is also connected to relativelyhigh greenhouse gas emissions. The average greenhouse gas emission of milk productionranges from 0,5 to 1,65 kg CO2e/kg milk, depending on the content of fat, the systemboundaries and the cultivation (organic or conventional). The more the milk is converted, themore the CO2e emissions increase. For example, the greenhouse gas emission of buttervaries between 22 and 23 kg CO2e/kg (cf. milk 0,5-1,65kg CO2/kg). Furthermore, theproduction of milk is correlated with the cattle breeding. A female cow has to be reared twoyears to become a heifer that can become in calf and thereupon gives milk. Duringupbringing, the cow also emits methane, and the production of the feed issues greenhousegases. Therefore, the milk production has to include the breeding in the calculation of thegreenhouse gas potential.
Additionally, the milk production is linked with the output of meat: the cow has to calve inorder to be able to give milk and the majority of the calves (all male calves, part of femalecalves) are processed as meat and do not stay in milk production.
Organic farming
The little information available concerning greenhouse gas emissions associated withorganic farming throughout the EU 27 complicates the compilation of any sustainabilitypotential, loading it with uncertainties. Therefore, no GHG reduction potential for increasedorganic share can be assumed.
Recently, there were some studies carried out by FiBL (2009) that explicitly comparedconventional with organic agriculture. Their results point out that organic agriculture ingeneral has lower greenhouse gas emissions than conventional agriculture. Therefore, PCFwould point in the “right direction”, even though it is a very limited approach. For example,the organic agriculture claims more land for cultivation and animal husbandry (IÖW 2008).
Agriculture versus food processing – life cycle view
The life cycle view of food also includes processing. At current status, only a restrictednumber of data sets on food processing is available. Therefore, general conclusions are notpossible. The following table shows some examples of processed food. In general it isimportant to state that a carbon label would be misleading if it would not contain precom-bustion from agriculture (see example “Lasagne” below) as these processes proved tocontribute significantly to the overall PCF of a food product. On the other side, the use phasemust be included, especially if one wants to compare convenient products (see exampleindustrial bread below) with home-made food (see example of home baking bread below). Itwould be unfair and misleading to include production in the plant on the one hand but not thepreparation at consumers’ home.
Consumer Information about PCF
50
Table 5 Overview on the greenhouse gas emissions in kg CO2e connected to the life cycle of differenttypes of (more or less) convenience food. Functional unit: 1 kg of food. A “-“ indicates that forthe respective life cycle phase data are not available.
a incl. retailerb incl. Shopping tour to the retailer, excl. storage at homec retailerd 0,02 retailer, 1,75 usee ride to the storef incl. production
The following figure illustrates the table and also shows that the total PCF varies significantly,being highest for meat, fish and milk products, and lowest for cereal products. These resultscan be seen as tendency, for a general conclusion more data have to be generated.
Consumer Information about PCF
51
-1,0
0,0
1,0
2,0
3,0
4,0
5,0
6,0
Lasa
gne
Muffins
Goulas
h
Indus
trial b
read (
wheat)
Home b
aking
brea
d (whe
at)
Yoghu
rt Van
illa
Fishfin
gers
Tomato
eketc
hup
Cornfla
kes
Honey
Glo
bal W
arm
ing
Pote
ntia
l [kg
CO
2e/k
g fo
od]
Precombustion agriculture Production / processing packaging transport Use (storage and preparation) End-of life
Figure 4 Overview on the greenhouse gas emissions in kg CO2e connected to the life cycle of different types of (more or less) convenience food.Functional unit: 1 kg of food. A missing life cycle phase indicates that the respective data are not available.
Consumer Information about PCF
52
General analyses on PCF of food
The overall relevance of the PCF of food is high. Food production (including agriculture)contributes with a relevant share of CO2e emissions to the overall emissions of privatehouseholds (e.g. approx. 20% in Germany: Quack and Rüdenauer 2007). But there are nosimple answers as too many different parameters influence the PCF of products (small orlarge farm / with or without cooling / dynamic due to time of purchase / usage behaviour (e.g.time of storage)). Generic data e.g. on carrots may be very different from the specific carbonfootprint of a product in the shop.
It is important to state that the focus on CO2e emissions alone neglects other importantaspects (e.g. pesticides, biodiversity).
The CO2e emissions connected to food are shared among many single shopping acts andmany different products. Therefore, consumers make very many single decisions during e.g.one year, each of it influencing the PCF only marginally.
The following approaches (e.g. rankings, rating system) already exist:
§ The most widespread and well-known approach is the bio-label for food from organicagriculture based on Council Regulation (EC) No 834/2007 of 28 June 2007 on organicproduction and labelling of organic products.This label takes into account environmental relevant aspects of cultivation (e.g. use ofpesticides and fertilisers, use of genetically engineered plants and animals) but makesno relation to greenhouse gas emissions. Besides the official label, a variety of bio-labels from different associations exist (e.g. Demeter, Naturland, Bioland), havingsimilar targets, but often being partly stricter. In Sweden, it is currently planned toinclude criteria on greenhouse gas emissions in the criteria for organic agriculture inthe future (KRAV).
§ Type I labels like Blue Angel, Nordic Swan etc. do not address food.
§ There are a few EPDs published on food (e.g. milk, mineral water, sparkling wine16).
In general, PCF on food is an interesting approach as it shows a new perspective concerningfood resp. agriculture besides the typically addressed ones (such as pesticides, fertilisers,animal welfare). Its importance is also connected to the fact that in agriculture, non-CO2egreenhouse gas emissions occur that are not related to energy demand (see e.g. CH4emissions in bovine or rice production).
On the bases of the currently available data, one can give simple recommendationsconcerning general choices of food, e.g. vegetables have a much lower PCF then bovine(see Table 3 above). As a sufficient database is still lacking, it is currently not possible todifferentiate the products much further (e.g. different bovine products, different ways of food
processing etc.). It is especially difficult to cover the variety of farms (e.g. small, large,different equipment) and the huge amount of different food products.
Even though some available studies that compare conventional with organic food (e.g. FiBL2009, IÖW 2008) come to the conclusion that the PCF of organic food is lower than ofconventional agriculture, this result cannot be expected right away for all product groups.
In general, it must be stated that a product differentiation is quite difficult:
§ For fruits and vegetables, the PCF is quite similar if the cultivation, production,transport etc. are consistent.
§ For other product groups, such as dairy products or meat, is it impossible to categorisethe PCFs because there are a lot of different data connected to, e.g. the differentnumber of production phases.
§ For converted products, such as frozen vegetables or dried potatoes, it is advisable tocategorise them with regard to their level of converting, e.g. frozen, tinned, peeled, orcooked products.
Also, the variability of PCF results is high. Main factors are:
§ Season. Example: the difference between the production of tomatoes seasonal (= fieldgrown: 0,0857kg CO2e/kg) and tomatoes outside the season (= grown in thegreenhouse: 1,5672kg CO2e/kg) (Taylor 2000).
§ Farm size, farm equipment. (See above.)
§ Location. The transport distance and the means of transportation influence the totalPCF of a product (share of contribution between below 1% and 57% (apples from NewZealand; ifeu 2009).
§ Cultivation. In (at least some) conventional agriculture, more GHG emissions occur(primarily because of the use of mineral fertilizer, that emits a lot of GHG duringproduction and use), whereas in organic agriculture, more land is used, which alsoleads to more CO2e emissions (IÖW 2008).
A PCF is cost-intensive but very helpful for exemplary products / production chains as itallows drawing general conclusions and guidelines in the sense of “regional and seasonal isbetter” / “ready made or home made is better” / “beef or pork is better”, etc. It will not beuseful and feasible to do specific PCF studies (on the bases of primary data) on all kinds ofdifferent food products.
As outlined before, PCF serves very well as a basis for general conclusions which then canbe part of general food guidelines like the ones from the Swedish “National Food
Consumer Information about PCF
54
Administration’s environmentally effective food choices”17. The Swedish guidelines aim tosupport food choices that lead to a “reduced climate impact, non-toxic environment, variedagricultural Iandscape and rich diversity of plant and animal life.” Therefore, greenhouse gasemissions are one important aspect, but by far not the only one: land use, water demand,eutrophication, acidification, toxic substances, biodiversity, soil erosion.
The focus on CO2e probably does not bear the risk to adversely affect other environmentalaspects. But this is still unclear due to the lack of data. Until now, no eye-catching adverselyeffect could be identified.
It can be concluded that guidelines like the Swedish ones on environmentally effective foodchoices – eat less meat in general and less beef in particular etc. – are more appropriatethan CO2 figures on products. Besides that, such guidelines can focus on the importantissues and the relevant products. Such information could also complement existing biolabelling. Perhaps graphical illustrations of typical food CO2 patterns as shown in Table 5and Table 6 (maybe placed in supermarkets) will be also useful.
6.6 Category 3 (products with relevance to climate at production phase)Example 2: Textiles
Due to the lack of data (statistical data on textile consumption and PCF data on differenttextiles), a concluding statement concerning the overall relevance of textiles and hometextiles in the context of climate relevant emissions cannot be given.
According to the available data, the PCF of textiles is relatively low compared to otherproduct groups like cars, food etc. (see e.g. Quack and Rüdenauer 2007). Additionally, ahigh share of the PCF of textiles (except for some home textiles) occurs during the usephase (see e.g. ISR 2009) which is already covered elsewhere (household appliances:washing machines, tumble dryers, vacuum cleaners).
There already exist the following approaches (e.g. rankings, rating system):
§ With the EU flower, textiles can be labelled that are manufactured in an environ-mentally friendly way and that cause less water pollution then conventionally manu-factured ones. There is a variety of different products currently labelled.
§ In Australia too, a type I Australian Ecolabel e.g. Woven Image (2009) exists, that takesinto account the whole life cycles of textiles.
17 The National Food Administration's environmentally effective food choices. LIVSMEDELS VERKETNATIONAL FOOD ADMINISTRATION. Proposal notified to the EU 15.05.09. Download available under:http://ec.europa.eu/enterprise/tris/pisa/cfcontent.cfm?vFile=120090292EN.DOC
§ There exists a variety of other labels from different organisations, the most commonare OEKO-Tex Standard 100 / OEKO-Text 1000 / OEKO-Tex 100plus18 that focus onchemicals harmful to human health (dyes, finishing) and/or on an environmentallyfriendly production.
§ There also exist some EPDs for textiles (e.g. Eurojersey 2009, see also Nieminen-Kalliala 2004 for a discussion of relevant environmental indicators for EPDs).
The additional value of PCF is small. From the point of view of the picture’s completeness,the PCF of textiles is helpful as it is one (small) piece of the whole puzzle concerning theslowing down of climate change. Due to the lack of data, it is unclear what improvementpotential can be expected. Furthermore, it is unclear how large product differentiations are.Taking into account the information in the catalogue from EarthPositive (2009), whichindicates that all clothes listed are made of organic cotton, it seems that the differentamounts of CO2e are due to different weights of the clothes, a T-Shirt being lightweightcompared to a Sweat Shirt. Hence the choice can not be done on the basis of the PCF asone either needs a T-Shirt or a Sweat Shirt. It would be more interesting to see a comparisonbetween products from organic and non-organic cotton and also synthetic materials. Untilnow a clear recommendation for consumers concerning the choice of material – e.g. naturalversus synthetic fibres – is not possible.
Variability due to different wearing and washing behaviour would lead to a different PCF. Thelifetime of a textile product, for example, can be very different due to different usagebehaviour. This can lead to conflicts as a T-Shirt with a long life time will be used andwashed more often, which results in a higher PCF then for a short-lived product. Althoughunclear at the moment, it is to be expected that the farming system influences the PCFresults of natural fibres (e.g. size of farm, application of chemicals versus manual work etc.).
As in other product groups it is important to determine the PCF of exemplary textile productsin order to get principal conclusions concerning the life cycle and the overall relevance. Itdoes not seem to be helpful for consumers to request the PCF for each single textile product.
The issue of climate change alternatively can be addressed at the following points (targetingdifferent groups): energy consumption in the textile chain (manufacturing processes),application of agrochemicals in cotton production, life time of textile products. Probably theapplication of certain chemicals (e.g. non-iron finishing) helps to reduce the PCF for washingand ironing (see e.g. BASF 2009).
As other environmental aspects are more relevant, PCF must not be addressed directly as acriterion but should be kept in mind in order to identify possible adverse effects early enough.
There is a variety of other environmental issues relevant in the context of textiles such aswater consumption (e.g. 7-20 m³ water/kg cotton) and use of pesticides for cotton production
18 „Öko-Tex International – Prüfgemeinschaft umweltfreundliche Textilien“ (Öko-Tex).
Consumer Information about PCF
56
as well as application of chemicals for textile dyes and finishing (water emissions, hazardoussubstances on the textile). For a discussion of the possible role of LCA in textile productionsee also Jödicke (2001), for an environmental assessment of textiles see Laursen et al.(2007).
At the moment, there is no evidence suggesting that adverse effects occur when optimizingaccording to PCF. However, data are still incomplete.
In summary, it can be concluded that a PCF label does not make sense, but that it is morereasonable to concentrate on type I labels with their multicriterial approach (e.g. focus onwater, pesticides, chemicals) on the one hand and on organic agriculture resp. textiles fromorganic grown fibres on the other hand.
6.7 Category 3 (products with relevance to climate at production phase)Example 3: Electricity supply
The CO2e relevance of the electricity production is high. The electricity consumption iscaused by many different energy using products in one household (e.g. washing machine,dishwasher, computer, heat pump etc.), the electricity, however, being delivered by onesupplier. Therefore, consumers have to make one decision and contract concerning theirsupplier and the specific electricity product they want to purchase.
The following approaches (e.g. rankings, rating system) exist:
§ According to EU Directive 2003/54/EC, electricity suppliers have to specify thecontribution of each energy source to the overall fuel mix of the supplier over thepreceding year in or by means of the bills and in promotional materials made availableto final customers. Furthermore, they have to indicate at least the reference to existingreference sources, such as web-pages, where information on the environmentalimpact, in terms of at least emissions of CO2 and the radioactive waste resulting fromthe electricity produced by the overall fuel mix of the supplier over the preceding year ispublicly available […] (see §3, 6.).
ð Remark: Within the project “Consumer Choice and Carbon Consciousness for Elec-tricity (4C Electricity)” it was analysed which kind of information is useful for consumersand SMEs and in which form it should be presented (for more information includingproject reports etc. see www.electricitylabels.com).
§ Concerning type I labels, the Blue Angel for green electricity is currently underdevelopment.
§ There exist a variety of other labels from different organisations, focussing on thecertification of green electricity with proved added value for the environment (for
Consumer Information about PCF
57
Germany see e.g. ok power19, Grüner Strom Label20), the latter meaning that itcontributes to the increase of the share of renewable energy in the electric grid beyondexisting legal requirements (e.g. proved by share of newly built power plants basing onrenewable energies).
§ Additionally, there exist market surveys that aim to give consumers orientationconcerning “good” green electricity products (for Germany see e.g. www.ecotopten.deor www.energie-vision.de).
The additional value of PCF compared to existing approaches is that it encompasses allgreenhouse gases and not only CO2.
Although there may be large differences in the electric grid between several Europeancountries, the improvement potential to increase the share of renewable energies in theelectric grid is generally still high. The differences between different electricity “products” forconsumers can be large. However, “green” alternatives are not available in all EU countries.
Against the background of legal requirements and available data bases, the effort todetermine the PCF of electricity products is still not to be underestimated. Moreover, thereare some methodological questions which are unsolved so far, at last referring to the trackingof the CO2e emissions of electricity from renewable energy sources (e.g. double countingmust be avoided as well as the contrary). PCF should relate to a defined period of time(usually one year, which corresponds to the existing labelling scheme). Then, no seasonalproblems should occur. One has to be aware that besides CO2e emissions, also otherenvironmental issues are relevant: nuclear waste, other emissions (e.g. SO2, particles). Forthe latter it can be stated that they are somewhat connected to CO2e emissions in the sensethat low CO2e emissions most likely relate to low SO2 emissions. For nuclear waste this isnot the case.
CCS (Carbon Dioxide Capture and Storage) is currently discussed as one means to reduceCO2e emissions of power plants. The technology is still not mature, but it is clear that CCSwill reduce efficiency of the power plants.
In addition to PCF, there are other means to address climate change: fuel mix information,information on share of newly built power plants for renewable energies. Indirectly, thereshould be a focus on energy efficiency (not used electricity is the most environmentallyfriendly one).
Overall, it can be concluded that the PCF is one crucial criterion a type I label for electricityproducts should base on. In order not to be misleading, other criteria have to be consideredas well: share of newly built power plants basing on renewable energies21, exclusion of
19 http://www.energie-vision.de/?show=infos&sub=okpower20 www.gruenerstromlabel.de21 Only newly built power plants for renewable energies that exceed the legally requested share ensure an
electricity from nuclear power plants, cogeneration of heat and power, restriction of electricityfrom coal and lignite power plants etc.
To exclusively communicate CO2e emissions bears the risk to favour electricity from nuclearpower plants. Therefore it must strictly be avoided to communicate solely CO2e figures.
6.8 Category 3 (products with relevance to climate at production phase)Example 4: Paper
Paper belongs to the category of products that do not use energy in the usage phase andthat do not influence energy demand of other products during their usage phase. However,they are still CO2e relevant due to impacts of production.
The production phase dominates the life cycle, during use impacts are marginal (e.g.printing). There are hints that meanwhile virgin paper production in some cases of bestavailable technology may even have a lower carbon footprint then recycling paper.
Consumers purchase ready made products like newspapers and books (purchase decisionbases on content), as well as paper for printing or copy purposes (purchase decision baseson quality of the paper itself).
There exist approaches, e.g. rankings and rating systems:
§ Type I label like EU Ecolabel, Nordic Swan and Blue Angel certify paper (e.g. tissuepaper). Focus is on the derivation of fibres relating to forestry, on recycling paper (BlueAngel) resp. the use of chemicals. In the EU Ecolabel there is a limit set for CO2emissions from non renewable sources in production (including electricity). Thecurrently valid criteria limit CO2 emissions to 1000 kg/t for integrated paper mills and1100 kg/t for non-integrated paper mills. They are under revision at present.
§ Forest Stewardship Council (FSC) also certifies paper.
CO2e emissions connected to the life cycle of paper are of additional help as they indicatee.g. the share of renewable energy sources used for paper production.
The improvement potential from virgin to recycling paper has decreased in the last years butis still significant (see Ifeu 2006). However, there are some new enzymatic techniques thatseem to significantly reduce the demand of energy and chemicals of virgin paper production(Skals et al. 2008). Therefore, in the future the distance might even further diminish.
At the moment, generic data are available that allow a rather general but significantdistinction of different paper grades, e.g. a distinction between recycling paper and virginpaper or groundwood paper. Product specific data are not available at the moment andtherefore it is difficult to judge the range of product differentiation within one paper grade.
The variability of PCF results due to seasonal changes etc. should be low. There is probablysome variety between different paper mills.
Consumer Information about PCF
59
In general, it is helpful to know the CO2e emissions over the life cycle of a product and therange of possible differences among different product types (e.g. virgin paper versusrecycling paper). However, it does not seem to be useful – having the therewith connectedcosts in mind – to request a PCF for each single product.
By promoting recycled paper in contrast to virgin paper and by addressing the reduction ofpaper consumption by consumers in general (e.g. by printing double sided) the climatechange issue can also be addressed.
PCF is one starting point for the development of criteria in type I labels. Other aspects are:resource demand (wood / recovered fibres) and herewith connected land use, waterconsumption (e.g. according to ifeu 2006 recycling paper needs 32 m³ less water per ton ofpaper for production than virgin paper), water emissions due to use of chemicals forprocessing (e.g. COD, AOX).
However, as far as data are available, no adverse effects are to be expected by focussing onlow CO2e paper, PCF pointing in the right direction.
Overall, it can be concluded that in-depth PCF studies can serve as a starting point for thedevelopment of criteria. A single CO2 centred label covering the whole life cycle of paper,however, would leave out too many important issues (like water consumption, chemicals)and include too many uncertainties resp. variables (such as. transport). Still the approach ofthe EU Ecolabel to address the production phase with a CO2 limit seems to make mostsense.
6.9 Conclusions as how global warming is best addressed in the analysedproduct groups
Against this background it can be concluded in general that PCF is particularly useful in thethree following cases:
Type I labels should include in-depth PCF studies as starting point for the development ofcriteria. It should then be checked whether the setting of CO2e values as a direct limit,makes sense for single life cycle phases (e.g. as for paper production) or if this is not thecase. The same can be stated for labels such as organic food label.
General recommendations on purchase behaviour and usage can be developed on thebases of the results of in-depth PCF studies and then be communicated to consumers(example: food).
Existing mandatory labels using CO2 values for communication (e.g. cars, electricity) shouldbe continued and be improved concerning their outcome, in order to convince consumers topurchase climate friendly products. The EU energy label in contrast should not be expandedto CO2 figures.
Consumer Information about PCF
60
PCF figures are not suitable for being displayed on a product.
The following table summarises the results on how global warming is best addressed for thespecific product groups that have been analysed.
Table 6 Overview of the conclusions concerning how global warming is addressed best
Product category Productgroup Best options to address global warming
Cars
The existing mandatory label on CO2 communication for themarketing of new passenger cars should be complemented by abenchmarking system e.g. in the form of a colour or letter code.Petrol consumption tests should be developed that are more inline with real driving and including also electric cars.Adequate measures to improve the outcome of the label in thesense of climate friendly purchase decisions by consumers.In later steps: include non CO2 greenhouse gases andprecombustion of fuel as well as production (in the from ofaverage data for different size classes of cars)
Energy consumingproducts
Householdappliances
EU energy label addresses energy efficiency and thereforeindirectly also CO2e emissions. An addition of CO2 values on thelabel is not helpful.Type I labels should include in-depth PCF studies as starting pointfor the development of criteria. To set CO2e values as a directlimit makes no sense.
Energy saving products Insulationmaterial
Instead of focussing on the PCF of insulation materials it will bemore successful to concentrate on energy certificates forbuildings. About 80 percent of climate relevant emissions relate tothe usage phase and correlate with the energy standard of thebuilding!
Electricity
The obligatory information of customers concerning of at leastCO2 emissions and radioactive waste resulting from the electricityproduction is purposeful.Adequate measures to improve the outcome of the obligatoryinformation in the sense that more consumers buy greenelectricity.Type I labels should include in-depth PCF studies as starting pointfor the development of criteria (CO2e, nuclear waste).Measures to reduce electricity consumption (e.g. communicationmeasures) are also beneficial.
Food
Development and communication of “simple” generalrecommendations taking into account climate change issues (PCFbased) concerning food purchase and preparation. In order to doso, further in-depth PCF studies are necessary.Basing on in-depth PCF studies integration of climate changeissues in the development of the standards for organic agriculture.The communication of CO2e figures on the product makes nosense and is not helpful to consumers.
Products with relevanceconcerning greenhousegas emissions atproduction phase
PaperType I labels should include in-depth PCF studies as starting pointfor the development of criteria. To set CO2e values as a directlimit makes sense concerning the production processes.
Consumer Information about PCF
61
Product category Productgroup Best options to address global warming
Textiles
Inclusion of CO2e issues in the multicriterial approach of type Ilabels.Promotion of a label awarding textiles made of fibres from organicagriculture.A PCF label makes no sense.
7 Recommendations for input into standardisation or legislation
7.1 Open methodological questions concerning PCF
The following list of open methodological questions bases mainly on the findings of PCF-Pilote (2009) and Grießhammer / Hochfeld (2009). They have to be dealt with instandardisation and possibly legislation as different approaches might lead to quite differentresults.
Certified green power from renewable energy sources
There still is not a good, broadly accepted method for including green power in thecalculation of a PCF. This not only applies to the PCF, but also for company-related GHGinventories. The emission factor for green power is often assumed to be zero, whichgenerally does not constitute a correct evaluation. Currently recommendations are workedout as to how certified green power should be evaluated with respect to its additional benefitsfor the environment. In the PAS 2050, green power is included in the national electricity mixin order to avoid it being accounted for twice unless it can be proven otherwise.
Emissions from aviation
Not only CO2, but also other substances such as water vapour and nitrogen oxidescontribute to the global warming effect of air traffic. The effect is described using the so-called Radiative Forcing Index (RFI). That is why the use of the more extensive RFI insteadof CO2e emissions is so important in the case of air traffic.
Significance of the shopping tour
There is no systematic reason to leave the shopping tour involved in buying a product out ofthe assessment, something which was proposed in the PAS 2050. When communicatinginformation to the consumer, the significance of the shopping tour and the effect this has ona product‘s CO2 footprint is by all means an important aspect.
Consumer Information about PCF
62
Direct and indirect Land use changes
The change of land use due to agricultural and forestry use of area changes the greenhousegas emissions due to the changed amount of carbon stored in the soil. Direct land usechanges (e.g. coffee is grown on an area that was natural wood before) contribute to thePCF as well as indirect land use changes (e.g. cultivation of plants for biofuels on placeswhere food was produced before may lead to the use of land for food production wherenatural wood was grown before). Direct as well as indirect land use changes influence thePCF of affected products. Experiences show that indirect land use changes can besignificant and should therefore be considered. In contrast PAS 2050 proposes only toinclude direct land use changes.
Storage of CO2 in products
PAS 2050 proposes to subtract CO2 stored in products according to a specified formula.Examples are products made of wood (e.g. furniture, construction material), paper (e.g.books) or geogenic carbon (e.g. cement/concrete, quicklime). As it is difficult to foresee thereal life time of a product, and therefore its real storage function, this is problematic.According to the understanding of IPCC and UN-FCC (United Nations FrameworkConvention on Climate Change) the intermediate storage of biogenic carbon is not seen ascarbon sink. Carbon emissions are only postponed to the next generation. Geogenic carboncould instead be more likely to be seen as sink, as it is more probable that constructions(really) last long and thus justify such a proceeding. Still in order to insure comparableproceeding, a product category rule should be requested.
Significance of capital goods
In general, capital goods are seen to be of little significance for the PCF and are thereforeoften neglected when undertaking life cycle assessments. Capital goods may very well berelevant for the result of PCF calculations for certain products, product groups or services. Ifthis is the case, they should be included in respective product-specific guidelines (potentiallyin Product Category Rules, PCR).
Allocation in cases of co-production
Emissions should be allocated to their actual source in accordance with the specifications ofthe ISO 14040ff standard and then substantiated in product-specific rules. The reasons forchoosing a particular allocation method must be outlined. What is more, it makes sense touse at least one other method and then present and analyse the differences in the results.
Consumer Information about PCF
63
Allocation in open loop recycling
When using materials and products for new production processes and their transformationinto other, new products (open loop recycling), a 50:50 allocation should be applied, unlessdifferent assumptions have been taken based on product-specific aspects.
7.2 General recommendations to legislation and standardisation
Even though the interest of consumers and other stakeholders in PCF is not necessarilyfocussed on the communication of specific PCF figures there can still be observed a generalincreasing concern regarding climate change and possible – individual – courses of action.
General recommendations to the legislator should therefore consider the following points:
Other environmental effects should not be disregarded
As stated before the narrow approach to only focus on greenhouse gas emissions bears therisk to overlook relevant other environmental impacts or even lead to wrong conclusions thatincrease negative environmental effects in the worse case (e.g. in the case of electricity).Therefore screening analyses of other environmental impacts must be included in a PCF.
The PCF is a fundamental indicator for some products or product groups. Still acomprehensive sustainability assessment of products cannot be carried out on the basis ofthe PCF alone. Other useful evaluation tools like life cycle assessments, eco-efficiencyanalyses and sustainability analyses can be used to complete the picture.
The screening of relevant other environmental impact categories besides global warmingpotential must thus be an obligatory component of a Carbon Footprint study.
ISO 14024 Type I labels like the Blue Angel should be retained as lead labels
The above considerations clearly support retention of eco-labels in accordance with ISO14024 (Type 1), such as the Blauer Engel eco-label, as lead labels. The advantages ofecolabels over CO2 labels are summarized again below (the arguments apply both to theBlauer Engel and by analogy to other national eco-labels and the European eco-label):
- easily understood and reliable information for consumers: from an overallenvironmental perspective an eco-labelled product is clearly better than comparableproducts;
- inclusion of all relevant environmental and health aspects;
- identification of criteria on the basis of LCAs and eco-toxicological assessments;
Consumer Information about PCF
64
- subsequent discussion by a panel of experts;
- final decision by an “environmental jury” on which relevant stakeholder groups arerepresented;
- certified award process and checking of the criteria for products marked with theecolabel.
Drawing up of Product Category Rules for particularly relevant products is essential
The main challenge of PCF meant for communication is to define the whole framework in away that all products belonging to one product group can be calculated in an as much aspossible defined way to assure the same approach even if the studies are performed bydifferent experts. This requires e.g. the same goals, the same system boundaries, the samecalculation rules and similar data quality for different studies. With a general ISO standardthis can not be achieved as it only provides generic rules. Therefore it is essential for thefuture that product category rules (PCRs) will be developed that ensure a comparableproceeding within one product group. Such PCRs would have to be defined and adopted atthe European level. Given the many different product groups this will take time and needsprioritisation.
Basing on PCF it is not possible at the moment to perform product comparisons of multipleproducts carried out on behalf of different clients and by different practitioners as well aspublic comparison with competing products in ways that are acceptable under competitionlaw (e.g. through reporting of CO2e values or use of CO2e labels).
Methodological restrictions when using the LCA / PCF approach
For the PCF approach the same is true as for the general LCA approach: The assessment ofthe whole life cycle is a strength compared to other techniques. The approach can be used tocompare products with similar function but differing production and/or operating technologies.Still the methodology has some restrictions that have to be kept in mind when applying it:Like LCA also PCF is per definitionem a purely quantitative tool. As it has to be requestedthat at least a screening analyses on other environmental impacts then greenhouse gaseshas to be performed in a PCF study, the same problems occur as with LCA. Current LCA-approaches cannot exhaustively cover site-specific aspects: as greenhouse gases have aglobal impact and no site-specific one, this weakness does not apply to PCF studies in thenarrow sense. As for LCA, the variability and reliability of data may represent a problemconcerning data quality (e.g. time-related, geographical and technology coverage), dataorigin, effort of data acquisition and possibly fast changes of supply chains. Spatial andtemporal variations are theoretically no obstacle for the applicability of LCA / PCF in product
Consumer Information about PCF
65
labelling. Nevertheless, the things can get quite complicated, and a proper definition of thefunctional unit can be quite critical. Fast changes in supply chains are difficult to beaccounted for in LCA / PCF since they require a functioning information system which is notyet in place. As for the calculation rules, there are still methodological questions to be solvedand consensus to be found among different existing approaches (see chapter above).Concerning the differences between different products from the same product group PCFresults may show only small deviations similar to that of LCA results. LCA as well as PCFcannot eliminate uncertainty. Due to these uncertainties (e.g. parameter or modeluncertainty) PCF results will always have a restricted precision. Therefore the display of asingle CO2e figure on a product is misleading.
Current CO2 labels neglect consumer comprehensibility, benchmarks and indicationof excellence
In order to be useful to consumers a CO2 label would have to
§ be comprehensible, e.g. by a well structured display, aggregation of the information,concentration on the gist. Additionally a standardised look thus enabling consumers toquickly comprehend the information, compare different products and include theinformation on the climate impact in their purchasing decision.
§ include a rating scheme, enabling consumers to recognise if the products’ CarbonFootprint represents a relatively low greenhouse gas emission for the resp. productgroup or a relatively high emission. It must be possible for consumers to recogniseexcellent products. Only then an effective reduction of the climate impact due to “theright” purchasing decision can be achieved. Consumers are already well acquaintedwith the A-G labelling scheme of the EU energy label, so this could be a promisingstarting point.
§ be third party certified. As credibility is of high importance for consumers, it is crucialthat a third party review should be requested for the PCF when used in product-relatedcommunication.
§ be backed-up by easy to access and transparent documentation of the PCF study thelabel is basing on. This includes the motivation for calculating a PCF and assumptionsand quantifiers used in the calculations. Any publication of the data must be clear,understandable, conclusive and open to scrutiny. It should ne noted to what extentPCF calculations are reliable and/or uncertain and whether other importantenvironmental impacts have been taken into consideration.
Consumer Information about PCF
66
Single number CO2 labels make no sense
A static PCF stand-alone label providing a total CO2 footprint on products does not makesense and is not very relevant for consumer decision making. Although consumers areincreasingly aware of the relevance of climate impacts resulting from their purchasingbehaviour and usage of products, the display of a total CO2e footprint figure alone would notbe of much help to them. It has to be stressed that a figure of this kind suggests a precisionand conclusiveness which cannot be achieved using the current state of methodology. At thecurrent state with only few products being labelled this even bears the risk that the sheerdisplay of such a label makes consumers believe that the product might be better thenanother without label.
Climate change might be addressed by other means then PCF
It is not always necessary to use PCF to address climate change issues. As CO2e emissionsare at the moment often highly correlated to the demand of electric and thermal energy andfuel consumption (e.g. in cars) climate change issues can be more easily addressed byenergy efficiency parameters. The latter is also cheaper and more reliable as it addresses akey parameter that can be directly measured and restricted e.g. by legislation. In othercases, like food for example, PCF is a good base for the development of generalrecommendation for consumers taking into account climate change issues (e.g. “eat regionaland seasonal food”, “eat less meat” etc.) but needs not be communicated as PCF.
Overall it can be concluded that in some cases there is no added value to the use of PCFand in other cases PCF should only serve as base for general recommendations.
Consumer Information about PCF
67
8 Literature
Andersson et al. 1998 Andersson, K.; Ohlsson, T.; LCA of bread produced on differentscales. Landsberg 1999.
BASF 2009 NON-IRON BED LINEN BY BASF SE GUP/CE LudwigshafenDocumentation. Case Study undertaken within the PCF PilotProject Germany. 2009http://www.pcf-projekt.de/files/1232962549/pcf_basf_bed_linen.pdf
Büsser, Jungbluth 2009 Büsser, S.; Jungbluth, N.; LCA of Ready-to-serve LasagneBolognese Packed in Aluminium Foil Containers. Uster 2009.
Casino Frankreich 2008 Casino Frankreich: Yoghurt Vanille. Saint-Etienne 2008.
Casino Frankreich 2008 Casino Frankreich: Blütenhonig. Saint-Etienne 2008.
Casino Frankreich 2008 Casino Frankreich: Cornflakes. Saint-Etienne 2008.
Christiansen et al. 2006 Christiansen, K.; Wesnæs, M.; Weidema, Bo P.; Consumerdemands on Type III environmental declarations. 2.-0 LCA con-sultants, commissioned by ANEC, Copenhagen 2006.
DAT 2009 Leitfaden zu Kraftstoffverbrauch und CO2-Emissionen aller neuenPersonenkraftwagenmodelle, die in Deutschland zum Verkauf an-geboten werden. Ausgabe 2009, 4. Quartal. Deutsche AutomobilTreuhand GmbH (DAT) Ostfildern 2009.Download: http://www.dat.de/leitfaden/LeitfadenCO2.pdf
Dauensteiner 2001 Dauensteiner, A.; Der Weg zum Ein-Liter-Auto: Minimierung allerFahrwiderstände mit neuen Konzepten. Berlin, Springer 2001.
Defra 2006 Defra: Environmental impacts of food production and consumption.Manchester 2006.
de Koning et al. 2009 de Koning, A.; Schowanek, D.; Dewaele, J.; Weisbrod, A.; Guineé,J.; Uncertainties in a carbon footprint model for detergents; quanti-fying the confidence in a comparative result. International Journalof Life Cycle Assessment, Vol. 15, No. 1, pp. 79–89.
Delahaye 2008 Delahaye, M. Gilbert; PRODUCTS AND CARBON FOOTPRINT:THE EXAMPLE OF A MAJOR RETAIL GROUP. Casino group(France). Contribution at the conference “Retail Trade as an Actorin Balanced Spatial Planning and Sustainable Development” 23–24October 2008 in Paris. For download underhttp://www.pme.gouv.fr/europe/pres2008/an/TR3/6_G_Delahaye_Anglais.pdf
DIN Consumer Council 2008 Umweltdeklaration von Produkten: Environmental Product Decla-ration (EPD) Wahrnehmung, Interpretation und Erwartungen vonVerbrauchern. Herausgeber: Verbraucherrat des DIN DeutschesInstitut für Normung e.V. Ingo Schoenheit, Markus Grünewald, NilsTiemann, imugBeratungsgesellschaft für sozial-ökologische Innovationen mbH.Berlin 2008.
EU 2007 Results of the review of the Community Strategy to reduce CO2emissions from passenger cars and light-commercial vehicles.COMMUNICATION FROM THE COMMISSION TO THE COUNCILAND THE EUROPEAN PARLIAMENT. Brussels, 7.2.2007COM(2007) 19 final.
Eurobarometer 2009 Eurobarometer. Europeans’ attitudes towards the issue of sustain-able consumption and production. Conducted by The GallupOrganisation, Hungary at the request of the Directorate-General forthe Environment. Flash EB Series #256. 2009.
Eurojersey 2009 ENVIRONMENTAL PRODUCT DECLARATION Sensitive®Products, Classic – Plus – Ultralight (in solid black and whiteversions and in black printed on white background) produced byEUROJERSEY Spa www.eurojersey.com. Version 05 dated10/07/2009.
FIBL 2009 Lindenthal, T. et al.; CO2e-Emissionen biologischer und konventio-neller Lebensmittel in Österreich, Forschungsinstitut für biolo-gischen Landbau (FiBL), Wien 2009. results of the diffeerent foddtypes seehttp://www.fibl.org/de/oesterreich/schwerpunkte-at/klimaschutz.html
FMHW 2003 Federal Ministry of Health and Women 2003: Austrian NutritionReport 2003
Grießhammer and Hochfeld 2009Grießhammer, R.; Hochfeld, C.; Memorandum Product CarbonFootprint. Position statement on measurement and communicationof the product carbon footprint for international standardization andharmonization purposes. Öko-Institut e.V. Berlin. 2009
Grothmann et al. 2009 Grothmann, T.; Krömker, D.; Homburg, A.; Siebenhüner, B.(Hrsg.); KyotoPlus-Navigator. Praxisleitfaden zur Förderung vonKlimaschutz und Anpassung an den Klimawandel – Erfolgs-faktoren, Instrumente, Strategie. Downloadfassung April 2009.www.erklim.de
ifeu 2006 ifeu (Institut für Energie- und Umweltforschung). Ökologischer Ver-gleich von Büropapieren in Abhängigkeit vom Faserrohstoff.Heidelberg 2006.
IMPRO 2008 Nemry, F., Uihlein, A. (IPTS – JRC); Colodel, C. M.; Wittstock, B.,Braune, A. (Lehrstuhl für Bauphysik LBP, Universität Stuttgart);Wetzel, C., Hasan, I., Niemeier, S., Frech, Y. (CalCon HoldingGmbH); Environmental Improvement Potentials of ResidentialBuildings (IMPRO-Building). Seville 2008.
IÖW 2008 Institut für Ökologische Wirtschaftsforschung. Klimawirkungen derLandwirtschaft in Deutschland. Berlin 2008.
ISR 2009 Life Cycle Assessment of a 100% Australian-Cotton T-Shirt In-stitute for Sustainable Resources Queensland University of Tech-nology 2009http://www.crdc.com.au/uploaded/file/E-Library/Climate ChangeJuly 09/Grace LCA Climate Change Cotton.pdf
Jödicke 2001 Jödicke, A.; Möglichkeiten und Grenzen der Ökobilanz beiChemikalienintensivenprozessen: Veredlung und Gebrauch einesBaumwoll-T-Shirts. Abhandlung zur Erlangung des Titels Doktorinder Naturwissenschaften der Eidgenössischen TechnischenHochschule Zürich. Zürich 2001.
Laursen et al 2007 EDIPTEX – Environmental assessment of textiles Søren EllebækLaursen and John Hansen Danish Technological Institute, Textile;Hans Henrik Knudsen and Henrik Wenzel IPU, Technical Uni-versity of Denmark; Henrik Fred Larsen DHI – Water Environment;Frans Møller Kristensen DTC Danish Toxicology Centre. WorkingReport No. 24. 2007http://www2.mst.dk/Udgiv/publications/2007/978-87-7052-515-2/pdf/978-87-7052-516-9.pdf.
NFA 2009 The National Food Administration's environmentally effective foodchoices. Livsmedels Verket National Food Administration. Sweden.Proposal notified to the EU 15.05.09. Download available under:http://ec.europa.eu/enterprise/tris/pisa/cfcontent.cfm?vFile=120090292EN.DOC.
Nieminen-Kalliala 2004 Environmental Indicators of Textile Products for Iso (Type III) Envi-ronmental Product Declaration. Eija Nieminen-Kalliala TampereUniversity of Technology, Institute of Fibre Materials Science POBox 589, 33101 Tampere, Finland.http://textilearticles.co.cc/0056.htm.
Öko-Institut 2009 Top 100 PROSA reports
PCF-Pilot 2009 Ergebnisbericht Product Carbon Footprinting – Ein geeigneter Wegzu klimaverträglichen Produkten und deren Konsum? Erfahrungen,Erkenntnisse und Empfehlungen aus dem Product CarbonFootprint Pilotprojekt Deutschland. Herausgeber: PCF PilotprojektDeutschland. www.pcf-projekt.de. Berlin 2009.
Prakash et al. 2008 Environmental product indicators and benchmarks in the context ofenvironmental labels and declarations. Öko-Institut e.V.: Prakash,S.; Manhart, A.; Stratmann, B.; Ökopol GmbH: Reintjes; N.. Studycommissioned by ANEC. December 2008.
Quack and Rüdenauer 2007 Quack, D.; Rüdenauer, I.; Stoffstromanalyse relevanter Produkt-gruppen – Energie- und Stoffströme der privaten Haushalte inDeutschland im Jahr 2005. Freiburg 2007
Quack and Rüdenauer 2004 Quack, D.; Rüdenauer, I.; Stoffstromanalyse relevanter Produkt-gruppen – Energie- und Stoffströme der privaten Haushalte inDeutschland im Jahr 2001. Freiburg 2004.
Quack 2001 Quack, D.; Einfluss von Energiestandards und konstruktiven Fakto-ren auf die Umweltauswirkungen von Wohngebäuden – eine Öko-bilanz. Dissertation at the RWTH Aachen, 2000.
Schmid 2009 Schmid, H.; Climatop Das Klima-Gütesiegel für zukunftsweisendeProdukt- und Dienstleistungs-Alternativen. 2009. Downloadavailable under:http://www.proofit.ch/fileadmin/user_upload/proofit/Downloads/090911_Heinz_Schmid.pdf.
Schmidt and Poulsen 2007 Schmidt, A.; Brunn Poulsen, P.; Benchmarking and additional en-vironmental information in the context of Type III environmentaldeclarations. Final report. FORCE Technology. Study com-missioned by: ANEC. Supervised by: Dr. Franz Fiala and GuidoHoff. December 2007.
Skals et al. 2008 Skals, P.B.; Krabek, A.; Nielsen, P.H.; Wenzel, H.; EnvironmentalAssessment of Enzyme Assisted Processing in Pulp and PaperIndustry. International Journal of Life Cycle Assessment, Vol. 13,No. 2, pp. 124–132.
Taylor 2000 Talor, C.; Ökologische Bewertung von Ernährungsweisen anhandausgewählter Indikatoren. Gießen 2000.
TCS 2009 Touring Club Schweiz (TCS) und EnergieSchweiz (ed.). infotechVerbrauchskatalog Fahrzeugliste mit Verbrauchsangaben. Bern2009.
UNFCC 2005 UNFCCC (United Nations Framework Convention on ClimateChange) 2005; Global Warming Potentials. Report of the Con-ference of the Parties serving as the meeting of the Parties to theKyoto Protocol on its first session, held at Montreal from 28November to 10 December 2005http://unfccc.int/resource/docs/2005/cmp1/eng/08a02.pdf.
VCD 2007 Informationen über Kraftstoffverbrauch und CO2-Emissionengemäß Richtlinie 1999/94/EGVCD-Vorschlag: Energieverbrauchs-kennzeichnung für PKW. Verkehrsclub Deutschland e.V. Presse-mitteilung vom 12.02.07.
vzbv 2004 Was Verbraucher wissen wollen. Ergebnisse einer empirischenStudie zum Informationsbedarf der Verbraucher. Herausgeber:Verbraucherzentrale Bundesverband e.V. (vzbv). Ingo Schoenheit.imug Institut für Markt-Umwelt-Gesellschaft e.V. Berlin 2004.