Jawaharlal Nehru Krishi Vishwa Vidyalaya Jabalpur 482004 (Madhya Pradesh) India JNKVV RESEARCH JOURNAL Number 2 Volume 46 May - August 2012 Contents Review Paper Research Paper Organic farming in India and challenges Growth dynamics of major crops in Madhya Pradesh Status and management of wheat root aphid Genetic variability, heritability and genetic advance in arboreum cotton ( L.) Evaluation of pearl millet genotypes for physiological efficiency and productivity Genetic divergence in rabi sorghum [ (L) Moench] landraces Correlation and Path analysis in rabi sorghum landraces Association of yield attributing traits with grain yield of transplanted rice Production efficiency and economics of different cropping systems as influenced by tillage, mulch and fertility levels in Kymore plateau and Satpura hills zone of Madhya Pradesh Relationship of phenological characters and seed cotton yield under moisture stress in cotton Evaluation of different rice based cropping system under irrigated condition of Rewa region Influence of doses of organic manure on direct seeded rice under condition of Kymore plateau zone of Madhya Pradesh 141 R.K. Tiwari, B.S. Dwivedi, Nirmala Singh, A.K. Pandey and S.K. Rao 160 A. Jayanta Kumar and S.B. Nahatkar 166 S.K. Shrivastava 172 Rajani Bisen and G.K. Koutu 176 M.S. Gurjar,A. S. Gontia, A. K. Mehta, Anubha Upadhyay and Sathrupa Rao 182 A.M. Langhi, S.B. Chaudhary, L.L. Mane, A.R. Gaikwad and U.C. Dhage 187 A.M. Langhi, S.B. Chaudhary, L.L. Mane, A.R. Gaikwad and U.C. Dhage 191 Monika Soni and K. K. Jain 196 Ashish Tiwari, V.B. Upadhyay, K.K.Agrawal and S.K. Vishwakarma 199 B.T. Ninganur, B.S. Janagodar and N.K. Biradarpatil 209 Sandhya Mishra, B.M. Maurya and P.S. Yadav 212 Nisha Sapre, Ruchi Tekam and Girish Jha Gossypium arboreum Sorghum bicolor
Transcript
Jawaharlal Nehru Krishi Vishwa Vidyalaya
Jabalpur 482004 (Madhya Pradesh) India
JNKVVRESEARCH JOURNAL
Number 2Volume 46 May - August 2012
Contents
Review Paper
Research Paper
Organic farming in India and challenges
Growth dynamics of major crops in Madhya Pradesh
Status and management of wheat root aphid
Genetic variability, heritability and genetic advance in arboreum cotton( L.)
Evaluation of pearl millet genotypes for physiological efficiency and productivity
Genetic divergence in rabi sorghum [ (L) Moench] landraces
Correlation and Path analysis in rabi sorghum landraces
Association of yield attributing traits with grain yield of transplanted rice
Production efficiency and economics of different cropping systems as influenced by tillage,mulch and fertility levels in Kymore plateau and Satpura hills zone of Madhya Pradesh
Relationship of phenological characters and seed cotton yield under moisture stress in cotton
Evaluation of different rice based cropping system under irrigated condition of Rewa region
Influence of doses of organic manure on direct seeded rice under condition of Kymore plateauzone of Madhya Pradesh
141R.K. Tiwari, B.S. Dwivedi, Nirmala Singh,A.K. Pandey and S.K. Rao
160A. Jayanta Kumar and S.B. Nahatkar
166S.K. Shrivastava
172
Rajani Bisen and G.K. Koutu
176M.S. Gurjar,A. S. Gontia,A. K. Mehta,Anubha Upadhyay and Sathrupa Rao
182A.M. Langhi, S.B. Chaudhary, L.L. Mane, A.R. Gaikwad and U.C. Dhage
187A.M. Langhi, S.B. Chaudhary, L.L. Mane, A.R. Gaikwad and U.C. Dhage
191Monika Soni and K. K. Jain
196
Ashish Tiwari, V.B. Upadhyay, K.K.Agrawal and S.K. Vishwakarma
199B.T. Ninganur, B.S. Janagodar and N.K. Biradarpatil
239A.K. Rai, Bharati Dass,A. Khare,A. Bisen and C.P. Kushwaha
245
Ragini Varme and A.K. Pande
248K.S. Kushwaha and Sharad K. Jain
253R.B. Singh, Ramkesh Meena, K.B. Tiwari and Mahesh Patidar
258
V.K. Verma, N.K. Khare, D.P. Rai and K.K. Saxena
265Shraddha Shrivastava, V.N. Gautam, B.S. Gehlaut and M.A. Quadri
268
Anju Nayak, Sunil Nayak, Varsha Sharma and R.P.S. Baghel
272Sunil Nayak, R.P.S. Baghel andAnju Nayak
Rhizoctonia solani)
Hyadaphis coriandriCoccinella sexmaculatus
Mentha piperita
Contents
Review Paper
Organic farming in India and challenges 141R.K. Tiwari, B.S. Dwivedi, Nirmala Singh, A.K. Pandey and S.K. Rao
Growth dynamics of major crops in Madhya Pradesh 160A. Jayanta Kumar and S.B. Nahatkar
Status and management of wheat root aphid 166S.K. Shrivastava
Research Paper
Genetic variability, heritability and genetic advance in arboreum cotton 172(Gossypium arboreum L.)Rajani Bisen and G.K. Koutu
Evaluation of pearl millet genotypes for physiological efficiency and productivity 176M.S. Gurjar, A. S. Gontia, A. K. Mehta, Anubha Upadhyay and Sathrupa Rao
Genetic divergence in rabi sorghum [Sorghum bicolor (L) Moench] landraces 182A.M. Langhi, S.B. Chaudhary, L.L. Mane, A.R. Gaikwad and U.C. Dhage
Correlation and Path analysis in rabi sorghum landraces 187A.M. Langhi, S.B. Chaudhary, L.L. Mane, A.R. Gaikwad and U.C. Dhage
Association of yield attributing traits with grain yield of transplanted rice 191Monika Soni and K.K. Jain
Production efficiency and economics of different cropping systems as influenced by tillage, 196mulch and fertility levels in Kymore plateau and Satpura hills zone of Madhya PradeshAshish Tiwari, V.B. Upadhyay, K.K. Agrawal and S.K. Vishwakarma
Relationship of phenological characters and seed cotton yield under moisture stress in cotton 199B.T. Ninganur, B.S. Janagodar and N.K. Biradarpatil
Evaluation of different rice based cropping system under irrigated condition of Rewa region 209Sandhya Mishra, B.M. Maurya and P.S. Yadav
Influence of doses of organic manure on direct seeded rice under condition of Kymore plateau 212zone of Madhya PradeshNisha Sapre, Ruchi Tekam and Girish Jha
Assessment of genetic purity of hybrid and their parents in rice using microsatellite markers 216Chanchal Mishra, Niraj Tripathi, D. Khare, N. Saini and G.K. Koutu
ISSN : 0021-3721Volume 46Number (2) 2012
JNKVVResearch Journal
(May - August 2012)
Effect of fertilizer doses on the intensity of aerial blight (Rhizoctonia solani) of soybean 220R.K. Varma, Kamlesh Patel and S.D. Sawarkar
Efficacy and economics of phyto extracts against Hyadaphis coriandri Das and 224Coccinella sexmaculatus on corianderR. Pachori, A. Tandekar, A.S. Thakur and A.K. Panday
Effect of insecticidal seed treatment on pearl millet seed viability during storage 228Y.H. Ghelani, K.K. Dhedhi, H.J. Joshi, K.L. Raghvani and C.J. Dangaria
Extent of participation of tribal farm women in decision making process related to agriculture 231operations in Seoni district Madhya PradeshTrupti Gokhe and N.K. Khare
Effect of dates of sowing on growth and heat use pattern of wheat cultivars 235Nirmala Singh, R.K. Tiwari and Sanjay Singh
Impact of Information Technology to enhance the agriculture productivity in India 239A.K. Rai, Bharati Dass, A. Khare, A. Bisen and C.P. Kushwaha
Technological gap in chickpea production technology among tribal farmers of Mandla district 245Madhya PradeshRagini Varme and A.K. Pande
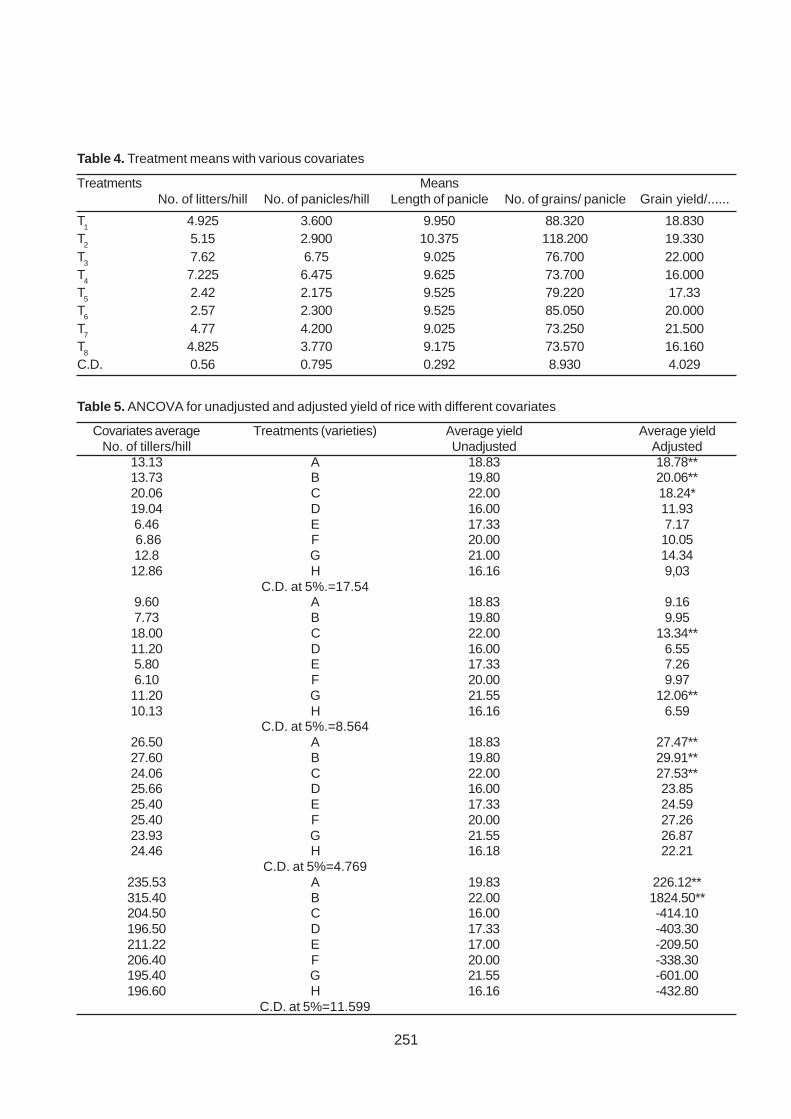
Evaluation of major characteristics towards yield of rice crop using ANCOVA technique 248K.S. Kushwaha and Sharad K. Jain
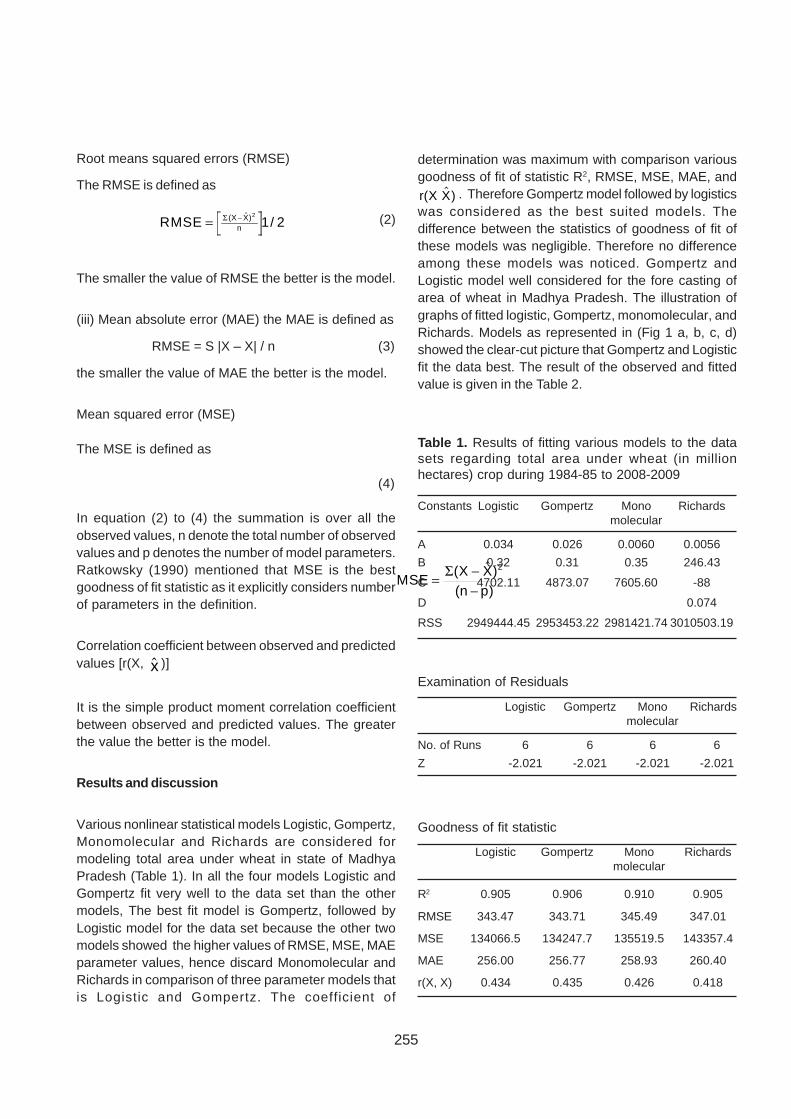
Non-linear model for prediction of area under wheat crop in Madhya Pradesh 253R.B. Singh, Ramkesh Meena, K.B. Tiwari and Mahesh Patidar
Studies on land use pattern changes in Betul tehsil during past decade using remote sensing 258techniqueV.K. Verma, N.K. Khare, D.P. Rai and K.K. Saxena
Hypocholestremic effects of garlic oil on serum and egg yolk of Jabalpur color birds 265Shraddha Shrivastava, V.N. Gautam, B.S. Gehlaut and M.A. Quadri
Counteracting adverse effect of ochratoxin on relative organ weights of broilers by 268Mentha piperita dry leaf powderAnju Nayak, Sunil Nayak, Varsha Sharma and R.P.S. Baghel
Effect of rock phosphate without and with aluminium on carcass yields of egg type starters 272Sunil Nayak, R.P.S. Baghel and Anju Nayak
Issued 31st December, 2012
STATEMENT OF OWNERSHIP
FORM IV(See Rule 8)
Place of Publication : Jabalpur (Madhya Pradesh), India
Periodicity of Publication : 3 issues per year (from 2012)
Publisher's Name : Dr. S.K. RaoIndianDean, Faculty of AgricultureJNKVV, Jabalpur 482 004 (M.P.), India
Printer's Name : M/s Fortune Graphics and Scanning CentreGolebazar, Jabalpur 482 002 (M.P.)
Editor's Name : Dr. Mohan S. BhaleIndianSenior ScientistDepartment of Plant PathologyJNKVV, Jabalpur 482 004 (M.P.), India
Name and address of individuals : Jawaharlal Nehru Krishi Vishwa Vidyalaya, JabalpurWho own the news papers andpartners of share holders holdingmore than one per cent of total capital
I, S.K. Rao, hereby declare that the particulars given above are true to the best of my knowledgeand belief.
Dated the 31st December, 2012 Sd/- S.K. RaoPublisher
A Publication ofJawaharlal Nehru Krishi Vishwa VidyalayaJabalpur 482 004 (Madhya Pradesh) India
Patron Prof. Vijay Singh TomarVice Chancellor, JNKVV, Jabalpur
Chairman Dr. S.K. RaoDean, Faculty of Agriculture, Jabalpur
Members Dr. P.K. MishraDirector Instruction, JabalpurDr. K.K. SaxenaDirector Extension Services, JabalpurDr. R.S. KhampariaDean, College of Agriculture, JabalpurDr. T.K. BhattacharyaDean, College of Agricultural Engineering, Jabalpur
Editor Mohan S. Bhale
Co-Editor Abhishek Shukla
General Information: JNKVV Research Journal is the publication of J.N. Agricultural University(JNKVV), Jabalpur for records of original research in basic and applied fields of Agriculture, AgriculturalEngineering, Veterinary Science and Animal Husbandry. It is published thrice a year (from 2012). Thejournal is abstracted in CAB International abstracting system, Biological Abstracts, Indian Science Abstracts.Membership is open to all individuals and organizations coping with the mission of the University and interestedin enhancing productivity, profitability and sustainability of agricultural production systems and quality ofrural life through education, research and extension activities in the field of agriculture and allied sciences.
Submission of manuscript for publication: Manuscripts should be submitted in duplicate to theEditor, JNKVV Research Journal, J.N. Agricultural University, Adhartal, Jabalpur 482 004 (M.P.) India.
Membership and subscription: The annual fee for individuals is Rs. 200/- for residents in Indiaand US$50 for residents outside India. The annual fee for Libraries and Institutions is Rs. 500/- for residentsin India and US$100 for outside. All authors must be subscribers. Payment should be made by DemandDraft in favour of Dean, Faculty of Agriculture, JNKVV payable at Jabalpur 482 004 MP to the Editor, JNKVVResearch Journal, JNKVV, Jabalpur (M.P.).
Exchange of the journal: For exchange of the journal, please contact the Librarian, UniversityLibrary, JNKVV, Jabalpur 482 004 (M.P.), India.
ISSN : 0021-3721 Registration No. : 13-37-67
Published by : Dr. S.K. Rao, Dean, Faculty of Agriculture, JNKVV, Jabalpur 482 004 (M.P.), IndiaPrinted at : M/s Fortune Graphics & Scanning Centre, Sahu Mohalla, Golebazar, Jabalpur (M.P.)
141
Abstract
Organic agriculture is one of the broad spectrum ofproduction methods, being considered in support of theenvironment and human health. The demand for organicfood is steadily increasing both in the developed anddeveloping countries with an annual average growth rate of20-25 %. Organic agriculture, is one of the fastest-growingsectors of agricultural production. However, there are certainissues that need to be addressed before we go for a large-scale conversion to organic agriculture. Some of theimportant issues are: Can organic farming produce enoughfood for everybody? Is it possible to meet the nutrientrequirements of crops entirely from organic farming? Is thefood produced by organic farming superior in taste andquality? Is economically feasible? This article presents acritical review on these aspects in India perspective.
Organic agriculture is a production system that avoidsor largely excludes the use of synthetic compounds viz.fertilizers, pesticides, growth-regulators and livestock-feedadditives, and thus offers some solution to the problemscurrently besetting the agricultural sector of industrialized orgreen revolution countries. The broader aims of organicfarming are: sustainability of natural resources, minimize thecost of cultivation, provide healthy food, augment farm profitsand improve soil health. Although in the market place toprovide clarity on the organic claim, the organic agriculturerequires certification, but broadly any system using themethods of organic agriculture and being based on four basicprinciples (the principle of health, ecology, fairness and care)may be classified as organic agriculture.
Organic agriculture is one among the broad spectrumof production methods that are supportive of theenvironment. Organic production system is based onspecific standards precisely formulated for foodproduction and aim at achieving agro-ecosystems,
which are socially and ecologically sustainable. It is basedon minimizing the use of external inputs through efficientuse of on- farm resources compared to industrialagriculture. Thus the use of synthetic fertilizers andpesticides is avoided.
Organic in organic agriculture is a labeling termthat denotes products that have been produced inaccordance with retain standards during foodproduction, handling, processing and marketing stages,and certified by a duly constituted certification body orauthority. The organic label is therefore a process claimrather than a product claim. It should not necessarilybe interpreted to mean that the foods produced arehealthier, safer or all natural. It simply means that theproducts follow the defined standard of production andhandling, although survey indicates that consumersconsider the organic label as an indication of purity andcareful handling.
Many definitions have been proposed for organicagriculture. Ethical issues such as fair labour practicesand animal ethics have also been included in organicagriculture definitions. To promote organic agricultureand to ensure fair practices in international trade oforganic food, the Codex Alimentarius commission, ajoint body of FAO/ WHO farmed certain guidelines forthe production, processing, labelling and marketing oforganically produced foods, with a view to facilitate tradeand prevent misleading claims. The codex AlimentariusCommission defines organic agriculture as a holisticfood production management system, which promotesand enhances agro ecosystem health, includingbiodiversity, biological cycles and soil biological activity.It emphasizes the use of management practices inpreference to the use of on- farm input, taking intoaccount that regional conditions require locally adaptedsystem. This is accomplished by using, agronomic,biological and or mechanical methods, as opposed tousing synthetic materials, to fulfill any specific functionwithin the system.
Organic farming in India and challenges
R.K. Tiwari, B.S. Dwivedi, Nirmala Singh, A.K. Pandey and S.K. RaoNational Project on Organic FarmingJawaharlal Nehru Krishi Vishwa VidyalayaKrishi Vigya KendraRewa 486 001(MP)
JNKVV Res J 46(2): 141-159 (2012)
142
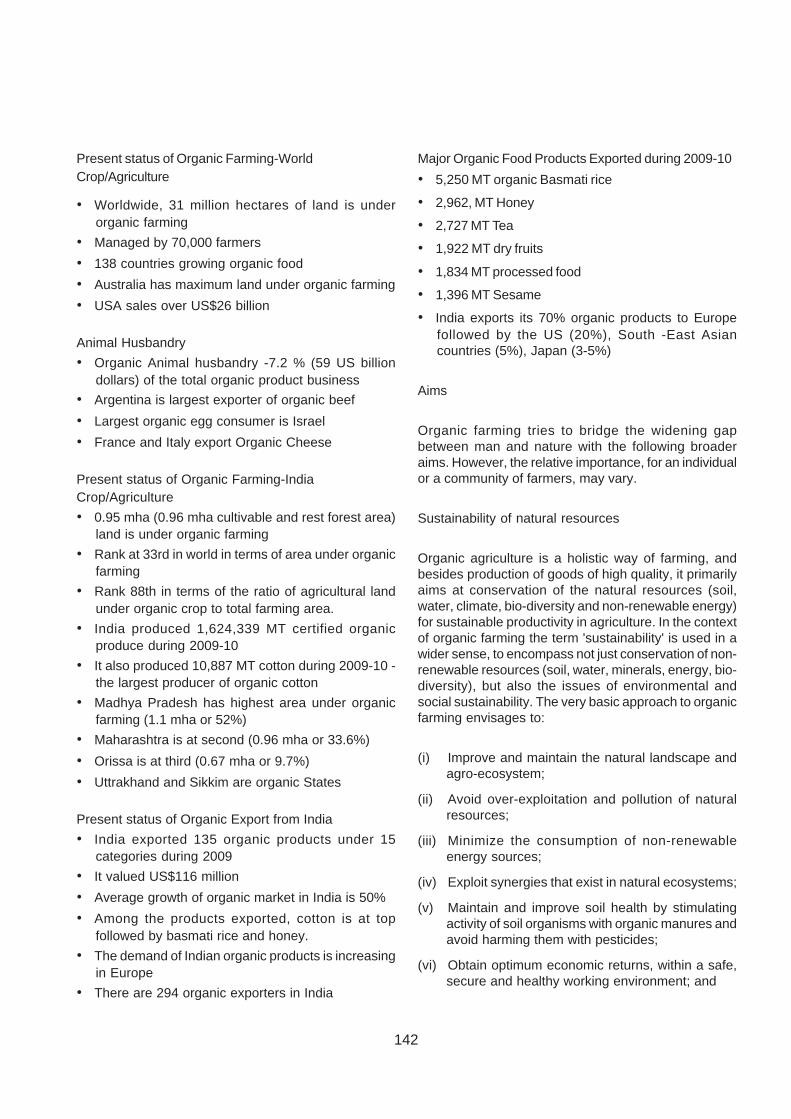
Present status of Organic Farming-WorldCrop/Agriculture
• Worldwide, 31 million hectares of land is underorganic farming
• Managed by 70,000 farmers• 138 countries growing organic food• Australia has maximum land under organic farming• USA sales over US$26 billion
Animal Husbandry• Organic Animal husbandry -7.2 % (59 US billion
dollars) of the total organic product business• Argentina is largest exporter of organic beef• Largest organic egg consumer is Israel• France and Italy export Organic Cheese
Present status of Organic Farming-IndiaCrop/Agriculture• 0.95 mha (0.96 mha cultivable and rest forest area)
land is under organic farming• Rank at 33rd in world in terms of area under organic
farming• Rank 88th in terms of the ratio of agricultural land
under organic crop to total farming area.• India produced 1,624,339 MT certified organic
produce during 2009-10• It also produced 10,887 MT cotton during 2009-10 -
the largest producer of organic cotton• Madhya Pradesh has highest area under organic
farming (1.1 mha or 52%)• Maharashtra is at second (0.96 mha or 33.6%)• Orissa is at third (0.67 mha or 9.7%)• Uttrakhand and Sikkim are organic States
Present status of Organic Export from India• India exported 135 organic products under 15
categories during 2009• It valued US$116 million• Average growth of organic market in India is 50%• Among the products exported, cotton is at top
followed by basmati rice and honey.• The demand of Indian organic products is increasing
in Europe• There are 294 organic exporters in India
Major Organic Food Products Exported during 2009-10• 5,250 MT organic Basmati rice
• 2,962, MT Honey
• 2,727 MT Tea
• 1,922 MT dry fruits
• 1,834 MT processed food
• 1,396 MT Sesame
• India exports its 70% organic products to Europefollowed by the US (20%), South -East Asiancountries (5%), Japan (3-5%)
Aims
Organic farming tries to bridge the widening gapbetween man and nature with the following broaderaims. However, the relative importance, for an individualor a community of farmers, may vary.
Sustainability of natural resources
Organic agriculture is a holistic way of farming, andbesides production of goods of high quality, it primarilyaims at conservation of the natural resources (soil,water, climate, bio-diversity and non-renewable energy)for sustainable productivity in agriculture. In the contextof organic farming the term 'sustainability' is used in awider sense, to encompass not just conservation of non-renewable resources (soil, water, minerals, energy, bio-diversity), but also the issues of environmental andsocial sustainability. The very basic approach to organicfarming envisages to:
(i) Improve and maintain the natural landscape andagro-ecosystem;
(ii) Avoid over-exploitation and pollution of naturalresources;
(iii) Minimize the consumption of non-renewableenergy sources;
(iv) Exploit synergies that exist in natural ecosystems;
(v) Maintain and improve soil health by stimulatingactivity of soil organisms with organic manures andavoid harming them with pesticides;
(vi) Obtain optimum economic returns, within a safe,secure and healthy working environment; and
143
(vii) Acknowledge the virtues of indigenous knowledgeand traditional farming system (ITKs).
Minimizing cost of cultivation
Organic farming is one of the environment-friendlyapproaches of reducing dependency on external inputsand achieving the optimum productivity by making thebest use of ecological principles and process, leadingto reduced costs of cultivation. This is very importantfor resource-poor farmers, especially for those who areoperating in high risk- prone areas of dryland and rainfedagriculture.
Healthy food
Healthy food means a food that is free from harmfulchemicals and heavy elements, and is tasteful andnutritious. Nevertheless, the organic agriculturepractices cannot ensure that products are 'completelyfree' of harmful residues, as they may possibly trespassinto the organic production systems through generalenvironmental pollution also. But this is one of the majoraims of organic farming and all feasible methods areused to minimize pollution of not only farm products butalso of surrounding environment, including air, soil andwater.
Augmentation of profits
Organically produced foods have a great demand inexport markets, especially those of European and NorthAmerican countries, and they fetch a sizeable premiumas compared with conventionally grown farm products.In domestic sector also, the demand for organic food isincreasing tremendously, especially among mid- andhigh- income segments, which has become morecautious about harmful effects of food grown with theuse of pesticides and synthetic fertilizers, and potentialhazards of environmental pollution caused due tomodern practices in agriculture.
Improvement in soil health
As such the objective of soil health and productionsustainability lies at the heart of organic farming and isone of the major considerations determining itsacceptability. In organic production systems the soilhealth is maintained and improved through stimulationof activity of soil organisms with organic manures andby avoiding harming them with the use of synthetic
pesticides as well as fertilizers. Some of the importantfeatures of organic farming in the context of soil healthand environment protection:
(i) Organically managed soils have a high potentialto counter soil degradation, erosion anddesertification, as they are more resilient both towater stress and nutrient loss.
(ii) Organic farming protects the long- term fertility ofsoils by maintaining organic matter levels, fosteringsoil biological activity, giving due importance to thebasic principles of crop rotation and intercropping,and providing crop nutrients indirectly by usingsources that are not readily soluble.
(iii) In organic farming, the supply of the nutrients ismore balanced, which helps to keep the plantshealthy and improve the biological activity of soil,which in turn improves nutrient mobilization fromorganic matter and native soil reserves andminimizes the losses of nutrients, thus protectingthe environment.
(iv) Microorganisms have a good feeding base andcreate a stable soil structure.
(v) Inclusion of legumes or cover crops, mulching,intercropping and agro- forestry, plays an importantrole in protection against soil erosion anddegradation.
(vi) Organic- agriculture technologies increase theorganic matter content of the soil, which has apositive effect on soil aggregation and water-holding capacity.
(vii) Animal manure, green-manure and compostsfavour the composition processes and canreplenish nutrients required by the crops andsupply the soil with essential organic matter.
(viii) Legume crops are a highly valuable source ofnitrogen. Closed nutrient cycles and efficient useof local resources (e.g. compost, dung or seeds)are especially important for subsistence farmersdepending on few and limited assets.
(ix) Water-retention capacity of the soil is increaseddue to their higher level of organic matter contentand permanent soil cover. Due to the resultingcapacity for higher moisture retention, the amountof water needed for irrigation is reduced.
(x) Organic agriculture helps to mitigate the climatechange, because it reduces emission ofgreenhouse gases, especially nitrous oxide,because no chemical nitrogen fertilizers are used
144
and nutrient losses are minimized.
(xi) Minimizes energy consumption by 30-70% per unitof land by eliminative the energy required tomanufacture synthetic fertilizers and pesticides,and by using internal farm inputs, thus reducingthe amount of fuel used for transportation.
(xii) Organic agriculture helps farmers to adopt climatechange because it prevents nutrient and water lossthrough high organic matter content and soilcovers, thus making soils more resilient to droughtsand land- degradation processes
(xiii) Preserves seed and crop diversity, which promotesnatural cycles in the production systems.Maintenance of diversity also helps farmers toevolve contingent cropping systems for adaptingclimatic changes.
(xiv) Organic agriculture encourages natural habitatsof agriculturally beneficial flora and fauna andforbids the clearances of primary ecosystems.
Perspectives of organic farming in India
After nearly four decades of globally acclaimed agrotechnological revolution termed as 'Green Revolution',Indian agriculture is again at crossroads. On one sideof the spectrum are the developed countries with almosta zero growth rate of agriculture and of environmentaldegradation owing to extensive industrialization andindiscriminate use of agricultural chemicals. On theother side a developing country, with population growthoutstripping agricultural productivity growth, requiredto produce more and more food, fiber and fuel from evershrinking agricultural land. The post-Green Revolutionproblems, presently threatening the sustainability ofIndian agriculture as a whole and raising a seriousconcern about national food security include: stagnationor even decline in production and productivity growthrates of major crops, receding groundwater tables inmany agriculturally important areas, deterioration of soilfertility, decline in factor productivity, low diversity ofproduction systems, and increasing production costs,leaving agriculture as an economically on-viableenterprise for resource-poor farmers. It is due to theseproblems that the echo of sustainable and eco- friendlyagriculture became louder. In the name of sustainabilityand eco- friendliness, various new farming concepts,viz. organic agriculture, natural farming, biodynamicagriculture, eco-farming, do-nothing agriculture, homa-farming etc. collectively known as 'organic farming' havebeen proposed in recent years, with the essential featureremaining same i.e. back to nature.
The primary concern of all organized communitiesand civilized societies is to meet the food requirementsof its people. The cultivated area, required to maintainthe present level of food grain production in India withoutusing the fertilizers, reaches more than the totalgeographical area of the country. At present, there is agap of nearly 10 m t between annual addition andremoval of nutrients by crops which is met by miningnutrients from soil. A negative balance of about 8 mt ofNPK is foreseen in 2020, even if we continue to usechemical fertilizers, maintaining present growth ratesof production and consumption. The most optimisticestimates at present show that only about 20-30%nutrient needs of Indian agriculture can be met byutilizing various organic sources. On long-term basis,conjoint application of inorganic fertilizers along withvarious organic sources is capable of sustaining highercrop productivity, improving soil quality and soilproductivity. The organic sources should be used inintegration with chemical fertilizers to narrow down thegap between addition and removal of nutrients by cropsas well as to sustain soil quality and to achieve highercrop productivity. The food security demand of thecountry requires that inorganic fertilizers be used inbalanced doses.
Organic farming has the twin objectives of thesystem being sustainable and environmentally benign.To achieve these two goals, it has developed some rulesand standards which must be strictly adhered to. Thereis a major scope for change and flexibility. Organicfarming thus, does not require best use of optionsavailable but the best use of approved options. Theseoptions are usually more complex and less effectivethan the conventional ones. The Indian farmer shouldget the advantage of emerging global market on organicfarming which is at present around 26 billion US $, andis expected to grow to 102 billion US $ in 2010 (NAAS,2005). Currently, 130 countries are producing certifiedorganic products. Organic farming as a concept/philosophy is well tested in some of the westerncountries though the same is not unknown to most ofthe nations. But in the Indian context, it needs to belooked into more critically seeking answers to thefollowing questions: What level of crop productivity isacceptable? Is it suitable for a country like India withsuch a large population to feed or can it fit in the nicheareas? Are available organic sources of plant nutrientssufficient for organic farming in the form it is advocated?Are organic farming technologies sustainable in the longrun? Is there any scope for promotion of organic farmingin the export market, without compromising with thenational food security that exists in the country?
145
Organic farming and crop productivity level
A number of studies showed that under droughtconditions, crops in organic agriculture systems producesignificantly higher yields than comparable conventionalagricultural crops (Pretty 2000, Subba Rao 1999). Ithas also been established that organic systems haveless long-term yield variability. A survey of 208 projectsin developing tropical countries, in which contemporaryorganic practices were introduced, showed averageyield increase of 5-10% in irrigated crops and 50-100%in rainfed crops.
The so-called organic transition effect, in whicha yield decline in the first 1-4 years of transition toorganic agriculture, followed by a yield increase whensoils have developed adequate biological activity hasnot been born out in some reviews of yield comparisonstudies. However, it is generally propagated that theorganic farming sustains higher yields as compared toconventional farming using inorganic fertilizers andplant- protection chemicals. There are dependableresearch evidences to show that balanced inorganicfertilization and integrated nutrient management havesustained crop yields on long - term basis (Dwivedi et al.2001, Nambiar 1994, Swarup and Wanjari 2000), butconvincing and clinching evidences are still to be foundout to show that higher crops yields could be obtainedunder organic farming systems.
Crop production essentially represents extractionof resources from soil. Unless these are replaced, thesoil will become depleted and infertile. The question ishow fast and in what quantities these are replenishedthrough organic sources? This becomes crucial to meetthe demand of food and fibre of ever increasingpopulation. The sustainable yield targets, which aresatisfactory today, may not be tenable 10 years hence,best results world over in productivity and economicgains have been obtained with the conjoint use oforganic sources and inorganic fertilisers.
Trewaves (2001) pointed out the hazards ofrelying solely on organic sources for nutrients. Manurebreak down can not be synchronized with crop growthas is desirable, but continues throughout the growingseason. Manure is variable in composition and may yieldunpredictable nutrition for crops growth. Long-termapplication of inorganic fertilizers is known to increaseorganic carbon owing to higher root biomass production.Soil organisms are for their role as nutrients recyclers.
At the global level, especially in developingcountries with high population pressure, and with thepresent state of knowledge and technology, organic
farming cannot produce enough food for everybody.
Organic Certification Agencies
There are two types of certification agencies -
Indian Certification Agencies
Government of India through Director General ofForeign Trade, New Delhi, allowed the export of organicproducts only if they are produced, processed andpacked under a valid organic certificate issued by acertification agency accredited by one of the accreditedagencies designated by the Government of India. TheGovernment of India has already recognized theagencies viz,
Tamil Nadu Organic Certification Department - http://www.tnocd.org/index.html
Agricultural and Processed food products ExportDevelopment Authority (APEDA) - http://www.apeda.com/apedawebsite/index.asp
Imported organic produce from Latin America is subjectto certification standards and guidelines just as stringentas produce produced in the United States. Under theUS Organic Foods Production Act of 1990 (OFPA), theUSDA is required to review the certifiers of importedorganic produce, in order to ensure that they meet therequirements of the US National Organic Program(NOP).
Foreign certification agencies may apply directlyto the USDA for recognition and are evaluated on thesame criteria as domestic agencies. Alternately, foreigngovernments may apply to the USDA or the USgovernment for recognition of equivalency in theirorganic oversight program. Once accreditation orrecognition is granted, organic products produced underthe supervision of the certifying agent or foreigngovernment will be eligible for import to the US as
146
certified organic. The following are the some of theInternational agencies involved in certification of organicproducts.
Argencert
Argentina's leading certification agency was created in1992. In 1997, Argencert became the first Argentineagency accredited by IFOAM.
California Certified Organic Farmers (CCOF)
CCOF's purpose is to promote and support organicagriculture in California and elsewhere.
International Federation of Organic Agriculture Movements(IFOAM)
The federation's main function is coordinating the networkof the organic movement around the world. IFOAM is ademocratic, grassroot oriented federation.
The Ecological Farming Association
Formerly the Committee for Sustainable Agriculture is anonprofit educational organization that promotesecologically sound agriculture.
Organic Farming Research Foundation (OFRF)
Sponsors research related to organic farming practices,disseminates research results to organic farmers andto growers interested in adopting organic productionsystems, and educates the public and decision-makersabout organic farming issues.
Organic trade Association
It is a national association representing the organicindustry in Canada and the United States, Membersinclude growers, shippers, processors, certifiers, farmerassociations, brokers, consultants, distributors andretailers.
Community Alliance with Family Farmers
CAFF political and educational campaigns are building amovement of rural and urban people who foster family-scale agriculture that cares for the land, sustains localeconomics, and promotes social justice.
Institute for Marketecology (IMO)
It is one of the first and most renowned internationalagencies for inspection, certification and qualityassurance of ecofriendly products. Since more than 20years, IMO has been active in the field of organiccertification but it is also expert in the sectors of naturaltextiles, sustainable forestry, and social accountabilitymonitoring. IMO is closely co-operating with the popularprivate label Naturland (IFOAM accredited) andconducts Naturland inspections world-wide. In the fieldof agriculture, IMO is certifying all types of agriculturalproducts, from traditional produce such as coffee, tea,spices, cocoa, nuts, fruits, vegetables, cereals, pulses,cotton, dairy products, honey, fish & seafood. This alsoincludes all types of food processing, productmanufacturing and international trading activities.
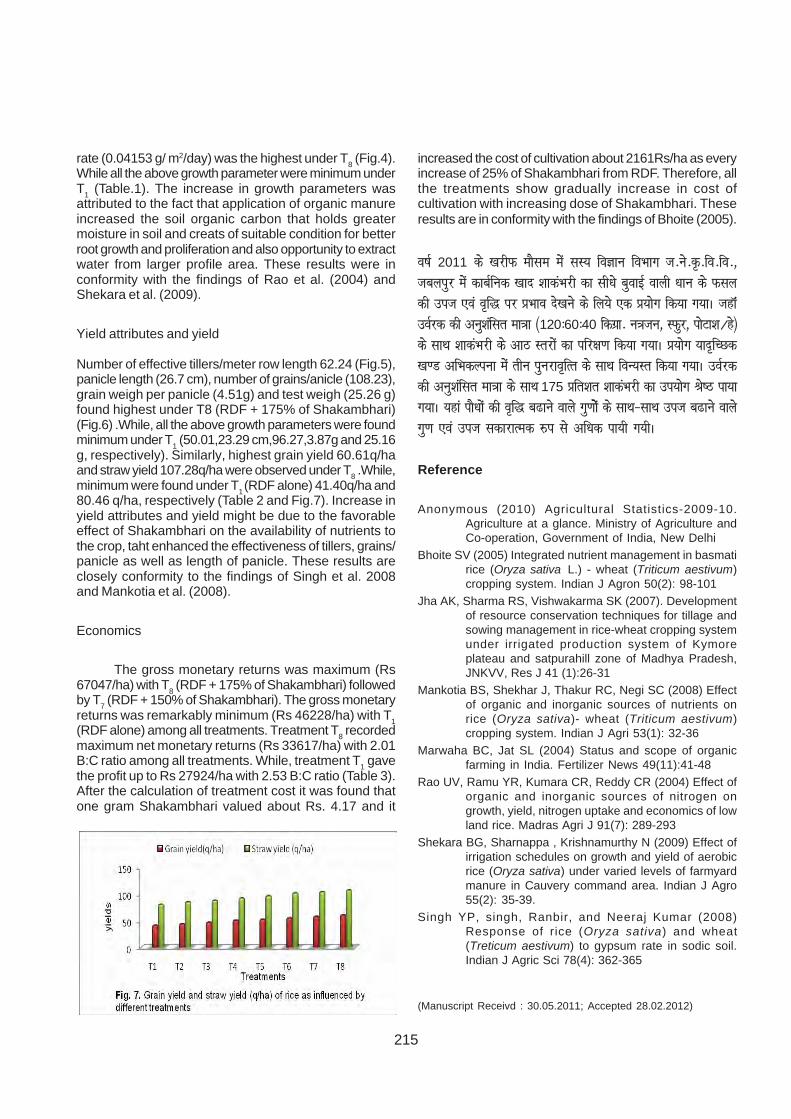
SKAL
Skal International, Netherlands is a certification andinspection organisation, which certifies organicproducts, processes and inputs. Further sustainableforest/wood and textile are certified. Skal Internationaloperates worldwide in Western and Eastern Europe,South America and Southern Asia. Through the networkof the shareholder nearly all countries in the world canbe covered.
ECOCERT INTERNATIONAL
ECOCERT is an inspection and certification bodyaccredited to verify the conformity of organic productsagainst the organic regulations of Europe, Japan andthe United States. The ECOCERT certification mark isone of the leading international organic certificationmarks, enjoying a good reputation and trusted by bothconsumers and the organic industry. Besides thecertification of organic production, they provide allnecessary information about the requirements of theorganic regulations in Europe, Japan, United States andapplicable national standards to their clients. They alsoassist in obtaining EU import authorizations for certifiedcommodities.
DEMETER
Demeter is a world wide certification system, used toverify to the consumers in over 50 countries that foodor product has been produced by biodynamic methods.The Bio Dynamic Farming and Gardening Associationis the certifier in New Zealand. (The Association
147
registered Demeter as a certification trademark in 1984.)Inspectors visit the operators (farmers and processors)annually to collect information about their methods. Acommittee of assessors then decides whether to grantcertification. Most committee members are experiencedbiodynamic farmers and/or processors. The DemeterStandards are a published statement of the allowed andthe required practices for certified biodynamic operators.All persons working towards Demeter certification arerecommended to obtain a copy from the Bio DynamicFarming and Gardening Association.
Certification process
Third party certification process
To certify a farm, the farmer is typically required toengage in a number of new activities, in addition tonormal farming operations:
• Study the organic standards, which cover in specificdetail what is and is not allowed for every aspect offarming, including storage, transport and sale.
• Compliance - farm facilities and production methodsmust comply with the standards, which may involvemodifying facilities, sourcing and changing suppliers,etc.
• Documentation - extensive paperwork is required,detailing farm history and current set-up, and usuallyincluding results of soil and water tests.
• Planning - a written annual production plan must besubmitted, detailing everything from seed to sale:seed sources, field and crop locations, fertilizationand pest control activities, harvest methods, storagelocations, etc.
• Inspection - annual on-farm inspections are required,with a physical tour, examination of records, and anoral interview.
• Fee - an annual inspection/certification fee (currentlystarting at $400-$2,000/year, in the US and Canada,depending on the agency and the size of theoperation).
• Record-keeping - written, day-to-day farming andmarketing records, covering all activities, must beavailable for inspection at any time.
In addition, short-notice or surprise inspections can be
made, and specific tests (e.g. soil, water, plant tissue)may be requested.
For first-time farm certification, the soil must meetbasic requirements of being free from use of prohibitedsubstances (synthetic chemicals, etc.) for a number ofyears. A conventional farm must adhere to organicstandards for this period, often two to three years. Thisis known as being in transition. Transitional crops arenot considered fully organic.
Certification for operations other than farmsfollows a similar process. The focus is on the quality ofingredients and other inputs, and processing andhandling conditions. A transport company would berequired to detail the use and maintenance of itsvehicles, storage facilities, containers, and so forth. Arestaurant would have its premises inspected and itssuppliers verified as certified organic.
Participatory certification
"Participatory Guarantee Systems are locally focusedquality assurance systems. They certify producersbased on active participation of stakeholders and arebuilt on a foundation of trust, social networks andknowledge exchange"[2] (IFOAM definition 2008).
Participatory Guarantee System (PGS) representan alternative[3] to third party certification, especiallyadapted to local markets and short supply chains. Theycan also complement third party certification with aprivate label that brings additional guarantees andtransparency. PGS enable the direct participation ofproducers, consumers and other stakeholders in:
• the choice and definition of the standards
• the development and implementation of certificationprocedures
• the certification decisions
Participatory Guarantee Systems are also referred toas "participatory certification".
Certification and product labeling
In some countries, organic standards are formulatedand overseen by the government. The United States,the European Union, Canada and Japan havecomprehensive organic legislation, and the term"organic" may be used only by certified producers. Being
148
able to put the word "organic" on a food product is avaluable marketing advantage in today's consumermarket, but does not guarantee the product islegitimately organic. Certification is intended to protectconsumers from misuse of the term, and make buyingorganics easy. However, the organic labeling madepossible by certification itself usually requiresexplanation. In countries without organic laws,government guidelines may or may not exist, whilecertification is handled by non-profit organizations andprivate companies.
Standards
Standards regulate production methods and in somecases final output for organic agriculture. Standards maybe voluntary or legislated. As early as the 1970s privateassociations certified organic producers. In the 1980s,governments began to produce organic productionguidelines. In the 1990s, a trend toward legislatedstandards began, most notably with the 1991 EU-Eco-regulation developed for European Union, which setstandards for 12 countries, and a 1993 UK program.The EU's program was followed by a Japanese programin 2001, and in 2002 the U.S. created the NationalOrganic Program (NOP). As of 2007 over 60 countriesregulate organic farming (IFOAM 2007:11). In 2005IFOAM created the Principles of Organic agriculture,an international guideline for certification criteria.Typically the agencies accredit certification groupsrather than individual farms.
Organic production materials used in and foodsare tested independently by the Organic MaterialsReview Institute.
Steps to a Successful Organic Transition
The transition from conventional to organic farmingrequires numerous changes. One of the biggestchanges is in the mindset of the farmer. Conventionalapproaches often involve the use of quick-fix remediesthat, unfortunately, rarely address the cause of theproblem. Transitioning farmers generally spend toomuch time worrying about replacing synthetic input withallowable organic product instead of consideringmanagement practices based on preventativestrategies. Here are a few steps new entrants shouldfollow when making the transition to organic farming:
A) Understand the basics of organic agriculture and theorganic farming standards
Since organic production systems are knowledge based,new entrants and transitional producers must becomefamiliar with sound and sustainable agriculturalpractices. Transitional producers should be preparedto read appropriate information, conduct their own trialsand participate in formal and informal training events.As mentioned, switching from conventional to organicfarming is more than substituting synthetic materials toorganic allowed materials. Organic farming is a holisticsystem that relies on sound practices focused onpreventative strategies. Since there are often feworganic remedies available to organic producers forcertain problems, prevention is the key element inorganic production.
B) Identify resources that will help you
Existing organic farmers are generally very helpful insharing valuable technical information. A good mentorshould be able to provide transitional producers withknowledge, practical experience and suggestappropriate reading materials. Mentors are able toidentify some of the most important challengestransitional farmers will be confronted with. Mentors mayalso help source production materials that are otherwisedifficult to find. Producers should also contactagrologists, veterinarians and other agricultural andfinancial consultants, in order to learn ways to improvetheir current farming practices.
The Internet is a valuable source of information,especially to new organic farmers. A broad range ofreading materials are available from many organic/ecological organizations such as the Organic AgricultureCentre of Canada (OACC), the Atlantic CanadianOrganic Regional Network (ACORN), the CanadianOrganic Growers (COG), the Certified OrganicAssociations of British Columbia (COABC), the NationalSustainable Agriculture Information Services/Appropriate Technology Transfer for Rural Areas(ATTRA), the Sustainable Agriculture Research andEducation (SARE), and the Agri-réseau/agriculturebiologique- Quebec. Consider joining an organicorganization or network to access these valuableresources and establish good working contacts.
C) Plan your transition carefully
Develop a transitional plan with clear and realistic goals.The plan should clearly identify various steps to be takenin making the transition to organic and be sure to includerealistic timeframes. Identify your strengths and
149
weaknesses. Consider ways to address any weaknesses,while building on strengths. The business side of thetransitional plan should contain a multiple year budgetand an effective/realistic marketing strategy. Make sureyour list of expenses is comprehensive. Include allprerequisites to begin the transition; such as, mechanicalweeding equipment, specialized composting equipmentand applicators, additional handling equipment dedicatedto the organic products, and processing equipment.Although the demand for organic products is continuallygrowing, growers need to make sure they have a reliablemarket for the organic products they plan to produce.
Careful planning is very important. During the earlypart of the transitional period, yields are often depressedand premium prices for certified organic products aregenerally not yet obtainable. Use realistic yields and priceswhen evaluating the feasibility of your project.
In some instances, it is preferable to continue usingconventional measures early on in the transitional processin order to avoid dramatic yield reduction which couldjeopardize the financial well-being of the operation.Farmers who are planning to convert their livestockoperation should consider certifying their fields first. Thisallows time to learn more about organic livestockmanagement requirements while, at the same time,starting to produce organic feeds.
Although organic certifiers generally want to seethe entire farm become organic, certifiers generally allownew entrants several years of transition time before thewhole farm is fully certified.
Parallel production is the simultaneousproduction, processing or handling of organic andnonorganic crops, livestock and other products of asimilar nature. Although this type of activity is highlydiscouraged by certifiers, some allow it, especiallyduring the transition period. If permitted to practiceparallel production, producers must be prepared to dealwith significant record keeping in order to ensuretraceability and organic integrity.
D) Understand your soils and ways to improve them
Since soil is the heart of the organic farming system, itis crucial that new entrants understand the variouscharacteristics and limitations of the soils found on theirfarm. Soil suitability may vary significantly from one fieldto the next. Fields with good drainage, good level offertility and organic matter, adequate pH, biologicalhealth, high legume content, and with less weed andpest pressure, are excellent assets. Often these fieldsare the first ones ready for transition and certification.
Many tools exist to assess soils. Soil chemical,physical and biological analyses, soil survey andlegume composition field assessments, and field yieldhistories are very important and should be consideredearly in the transition. Unhealthy soils require particularattention.
If farmers plan to grow crops without raising anylivestock, it may be necessary for them to sourceallowable soil amendments such as composted manure,limestone, rock dust, and supplementary sources ofnitrogen, phosphorus, potassium and micro-nutrients.Even with the best of crop rotations that include greenmanure crops like legumes (nitrogen fixing crops),transitional growers will be challenged if they want toobtain optimal yields without additional livestockmanure, compost and/or other off-farm soil inputs. Whenthese inputs are scarce or expensive, producers maybenefit from integrating livestock on their farm.
Let's not forget, under organic production,farmers must be able to recycle nutrients through propernutrient management practices: recycling through goodmanure and compost utilization, crop rotations, covercrops (green manure, catch, and nitrogen fixing crops),and by reducing nutrient losses due to leaching, over-fertilization, as well as poor manure and compostmanagement (storage, handling, and spreading).
E) Identify the crops or livestock suited for your situation
Before growing a crop or raising any livestock, considerthe following: degree of difficulty to grow or raise theproduct organically, land and soil suitability, climatesuitability, level of demand for the product, marketingchallenges, capital required, current prices forconventional, transitional and organic products, andprofitability over additional workload.
F) Design good crop rotations
Once the crops are chosen, carefully plan the croprotation(s) and select the most suitable cover crops(green manure, winter cover crops, catch crops, smothercrops, etc.). Crop rotations are extremely importantmanagement tools in organic farming. They can interruptpest life cycles, suppress weeds, provide and recyclefertility, and improve soil structure and tilth. Somerotational crops may also be cash crops, generatingsupplemental income.
On some farms, land base availability may be a limiting
150
factor when planning your crop rotations. The transitionalplan should, therefore, include crop rotation strategies.Responding to external forces such as new marketopportunities may also have a significant impact on croprotations, so farmers need to consider the effect thatgrowing new crops has on their crop rotations and landbase availability.
G) Identify pest challenges and methods of control
It is important to know the crop's most common pests,their life cycles and adequate control measures. Forinstance, Colorado potato beetle may be a pest ofsignificant importance when growing potatoes;cucumber beetles in cucurbitaceous crops (cucumber,squash, and melons); flea beetle in many seedlingscrops; clipper weevil and Tarnish Plant Bug in strawberrycrops.
There are several measures available to reducepest pressure: crop rotation, variety selection,sanitation, floating row covers, catch crops, flamers,introduction of beneficial insects, bio pesticides, andinorganic pesticides. Transitional growers should beprepared to use and experiment with some of theseoptions. When considering a new type of production,discuss pest issues with your agrologists, IPMspecialists and/or other existing organic producers tooptimize your chances of success.
Availability of organic supplies has improvedsignificantly over the past few years. New pest controlproducts containing B.t., spinosad, kaolin clay areeffective and currently available to organic growers. Itis often reported that the types of weeds found on thefarm evolve with time as growers change the way theygrow their crops and control their weeds. By keepingtrack of the weed population, growers will be able torefine their crop rotations and improve their controlmeasures.
Under organic livestock management, cattlemenmust provide attentive care that promotes health andmeets the behavioral needs of various types of livestock.With good herd health practices, farmers rarely needto rely on conventional medicine. Organic cattlemenshould, however, try to familiarize themselves withalternative remedies such as herbal/aroma therapies,homeopathy, and immune system promoters.
H) Be ready to conduct your own on-farm trials
Successful organic farmers continuously try new and/or innovative management practices. Practices such as
cover cropping, inter-planting, and use of various soil andpest control materials need to be evaluated regularly byorganic farmers. Be prepared to try new approaches.
I) Be ready to keep good records
Record keeping is one of the most importantrequirements to maintain organic integrity. Farmers areexpected to keep detailed production, processing andmarketing information. This information includeseverything that enters and exits the farm. Third party,independent inspectors require farmers to present theabove mentioned documentation when inspecting thefarm operation. Once the record-keeping requirementsare understood and the reporting procedure established,paperwork becomes routine.
J) Avoid these common mistakes
• Underestimating the need for good transitional andmarketing plans.
• Underestimating the need to fully understand theOrganic Standard. Organic producers mustunderstand the standard in order to know what ispermitted and prohibited.
• Failing to think prevention. Transitional farmersshould consider improving their crop rotation, soiland crop management skills, livestock managementpractices (feeding program, heard health program,grazing system, housing facilities, and husbandry).
Organic farming vs potential of organic manures
Both food and therefore nutrient needs of India areexpected to go up consistently in the future without abreak. The net cropped area has more or lessestablished at 143 m ha. The population of 1 billionplus is expected to grow by 14 to 15 m each year. Landis limited and shrinking whereas human and animalpopulation are increasing. The land to man ratio hasfallen rapidly in the past half century from 0.34 ha in1950 to 0.14ha, and is projected to be 0.10 ha in 2025.At present, each hectare or net sown area has to supportmore than 7 persons. This pressure will only increasein the coming years. It is also disquieting that duringthe 1999s India witnessed rates of growth in yield andproduction compared to world averages. Keeping inview the conservative population estimate of 1.4 billion by2025 and minimum caloric requirement of food, the country
151
will need to produce at least 300 mt of food grain. For thispurpose, it will be necessary to use 30 to 35 mt of NPKfrom various sources. In addition according to NationalAcademy of Agricultural Sciences (NAAS, 1997) theexpert on horticulture, vegetable, plantation crops,sugarcane, cotton, oilseeds and potato have projectedthat by 2025, the demand for fertilizers for these highvalue crops, which also have high export potential andclaim fertilizer use on priority basis, will rise to 3.0, 2.0,3.2, 0.9, 3.1, 1.5 and 1.0 mt respectively. This adds tothe total nutrient needs by another 14 to 15 mt NPK.Thus, the country will be required to arrange for the supplyof about 40 to 45 mt of nutrients by 2025.
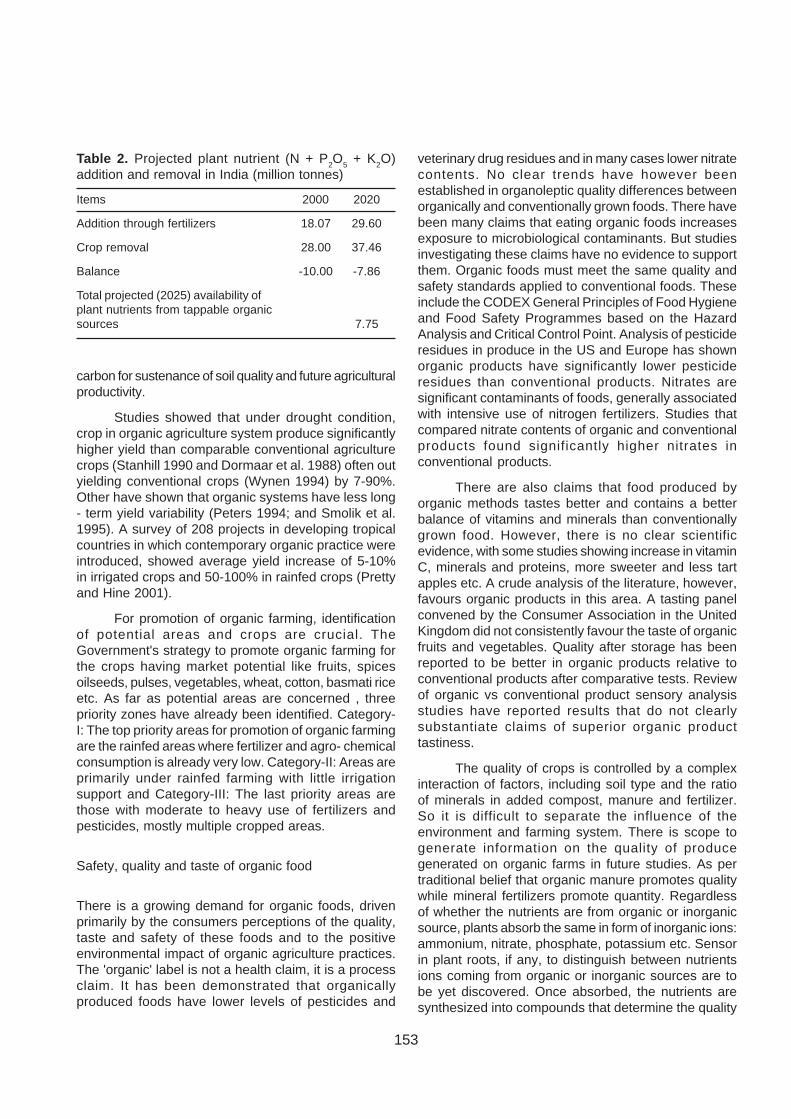
It is neither possible nor feasible to replacechemical fertilisers completely to sustain present levelof crop production. Projections on the availability of plantnutrients from organic sources for agriculture in Indiaduring 2000-2025 as worked out by Tandon (1997) aregiven in the Table 1 and projected plant nutrient (NPK)addition and removal as per Katyal (2001) in the Table2. These figures apparently reveal that all trappablenutrients from organic sources will be barely able tomeet the deficit of nutrients in soil after crop removal atpresent level of production. Ensuring nutrient supply of45 m t to produce 300 m t of food grain and othercommodities by 2025 would merely be a dream.
Organic agriculture: Scope and area approach
Only 30% of India's total cultivable area is covered withfertilizers where irrigation facilities are available and inthe remaining 70% of arable land, which is mainlyrainfed, negligible amount of fertilizers is being used.Farmers in these areas often use organic manure as asource of nutrients that are readily available either intheir own farm or in their locality. The north - easternregion of India provides considerable opportunity fororganic farming due to least utilization chemical inputs.It is estimated that 18 m ha of such land is available inthe N-E, which can be exploited for organic production.With the sizable acreage under naturally organic/default organic cultivation, India has tremendouspotential to grow crops organically and emerge as amajor supplier of organic products in the world's organicmarket.
The agro-chemicals used in agriculture areexhaustive source of energy and their timely availabilityin desired quantity is question marked for future becausemining of the earth is the only source of their availability.The tremendous increasing trend in cost of these agro-chemicals is beyond the reach of resource poor farmersalso. Under such circumstances, a change from
chemically intensive agriculture to a more sustainableform of organic agriculture is desirable in presentsituation. JNKVV work on above aspects with help ofM.P. Government, and ICAR projects under training anddemonstration and research.
The state occupies prime position in terms ofhaving more than 1.48 Lakh ha area under certifiedorganic out of a total certified area of 3.40 Lakh ha inthe country. According to an estimate 5.86 Lakh MT ofproduction was organically produced in the country outof which 19456 MT was exported worth Rs. 300 Millionduring the year 2007 - 08. In the recent past a staggeringgrowth of 39% has been registered in terms of certifiedarea under organics country wide taking it over 12 Lakhha as per ICCOA and a target of 20 Lakh ha is set by2012. India commits for taking its global share in organicexports from 0.2% to 2.5%. This provides greatopportunity for the state to maintain its lead and continueto harness its potential. The state has large area underextremely low external and chemical input agricultureof tribal population both in the eastern and westernextremes of the state, natural grasslands, forests provesto be organic and or natural niches by "default". Theexternal input use especially inorganic fertilizers, agro- chemicals and hybrids and genetically modifiesspecies remain well below national average. Ecosystemconsists of mainly floral and faunal biodiversity, habitatdiversity and landscape conservation. The findings ofmany studies suggest that organic farming clearlyperforms better than conventional farming in respect tofloral and faunal. MP State Organic Farming Policy isthe statement of intent to create, facilitate, andstrengthen the enabling environment for developingintegrated value chains of the organic farm produceencompassing end-to-end solutions for both primaryproducers and consumers. The policy entails on "farm- to - fork" approach reassuring abundant supply of"healthy food for all". The policy statement providesconcurrent thinking of the state with its futuristic,pragmatic pro-farmer initiatives.
Market of organic farming
• No market structure is there
• Emphasis on
(i) Creation of awareness
(ii) Producer - consumer meeting, organization oforganic bazar/hat/mela
(iii)Change of mindset
152
(iv)Utilization of spiritual group, health care groupetc.
Socio -economic opportunity
• Contributes to preservation of biodiversity.
• Produces healthy food.
• Ensures jobs in agriculture, food processing andmarketing.
• Improves health of soil
• Low water consumption
• Low input cost
• High produce cost (Improve economic status )
• High demand due to social awareness
• Huge export potential
• Promotion of sustainable agriculture for smallfarmers
Facility used
Under JNKVV following facility available for the farmers
• Vermicomost unit
• NADEP unit
• KVK
• Demonstration plot organic farming
• Training centre
• Soil analysis facility
• Availability of biofertlizers
• MP organic certification agency for certification
• Collaboration with Regional center for organicfarming Govt of India
Physical and mental awareness programme
• Training on preparation of Vermicomost.
• Training on preparation of different organic manures
• Training on biofertilizers
• Training on organic pest management
• Awareness on organic cultivation of fruit crops
• Awareness on organic cultivation of cereals crops
• Awareness on organic cultivation of vegetable crops
Awareness on Integrated Farming system
The report of the Task Force on organic farmingappointed by the Government of India also observedthat in vast areas of the country, where limited amountof chemicals is used and have low productivity, couldbe exploited as potential areas for organic agriculture.Arresting the
Table 1. Some projections on the availability of organicresources for agriculture in India during 2000-2025
Items 2000 2010 2025
Generators
Human population (million) 1,000 1,120 1,300
Livestock population (million) 498 537 596
Food grain production 230 264 315
Nutrients (theoretical potential, mt N + P2O3 + K2O)
Human excreta 2.00 2.24 2.60
Livestock dung 6.64 7.00 7.54
Crop residues 6.21 7.10 20.27
Nutrients ( considered tapable, mt N + P2O5+ K2O)
Human excreta 1.60 1.80 2.10
Livestock dung 2.00 2.10 2.26
Crop residues 2.05 2.34 3.39
Total 5.05 6.24 7.75
All data pertaining to nutrients in dung and inresidues are counted twice to the extent these are fedto the animals.
Tapable = 30% of dung, 80% of excreta, 33% of cropresidues
Decline of soil organic matter is the most potent weaponin fighting against unabated soil degradation andimperilled sustainability of agriculture in tropical regionsof India, particularly those under the influence of arid,semi-arid and sub-humid climate. Application of organicmanure is the only option to improve the soil organic
153
carbon for sustenance of soil quality and future agriculturalproductivity.
Studies showed that under drought condition,crop in organic agriculture system produce significantlyhigher yield than comparable conventional agriculturecrops (Stanhill 1990 and Dormaar et al. 1988) often outyielding conventional crops (Wynen 1994) by 7-90%.Other have shown that organic systems have less long- term yield variability (Peters 1994; and Smolik et al.1995). A survey of 208 projects in developing tropicalcountries in which contemporary organic practice wereintroduced, showed average yield increase of 5-10%in irrigated crops and 50-100% in rainfed crops (Prettyand Hine 2001).
For promotion of organic farming, identificationof potential areas and crops are crucial. TheGovernment's strategy to promote organic farming forthe crops having market potential like fruits, spicesoilseeds, pulses, vegetables, wheat, cotton, basmati riceetc. As far as potential areas are concerned , threepriority zones have already been identified. Category-I: The top priority areas for promotion of organic farmingare the rainfed areas where fertilizer and agro- chemicalconsumption is already very low. Category-II: Areas areprimarily under rainfed farming with little irrigationsupport and Category-III: The last priority areas arethose with moderate to heavy use of fertilizers andpesticides, mostly multiple cropped areas.
Safety, quality and taste of organic food
There is a growing demand for organic foods, drivenprimarily by the consumers perceptions of the quality,taste and safety of these foods and to the positiveenvironmental impact of organic agriculture practices.The 'organic' label is not a health claim, it is a processclaim. It has been demonstrated that organicallyproduced foods have lower levels of pesticides and
veterinary drug residues and in many cases lower nitratecontents. No clear trends have however beenestablished in organoleptic quality differences betweenorganically and conventionally grown foods. There havebeen many claims that eating organic foods increasesexposure to microbiological contaminants. But studiesinvestigating these claims have no evidence to supportthem. Organic foods must meet the same quality andsafety standards applied to conventional foods. Theseinclude the CODEX General Principles of Food Hygieneand Food Safety Programmes based on the HazardAnalysis and Critical Control Point. Analysis of pesticideresidues in produce in the US and Europe has shownorganic products have significantly lower pesticideresidues than conventional products. Nitrates aresignificant contaminants of foods, generally associatedwith intensive use of nitrogen fertilizers. Studies thatcompared nitrate contents of organic and conventionalproducts found significantly higher nitrates inconventional products.
There are also claims that food produced byorganic methods tastes better and contains a betterbalance of vitamins and minerals than conventionallygrown food. However, there is no clear scientificevidence, with some studies showing increase in vitaminC, minerals and proteins, more sweeter and less tartapples etc. A crude analysis of the literature, however,favours organic products in this area. A tasting panelconvened by the Consumer Association in the UnitedKingdom did not consistently favour the taste of organicfruits and vegetables. Quality after storage has beenreported to be better in organic products relative toconventional products after comparative tests. Reviewof organic vs conventional product sensory analysisstudies have reported results that do not clearlysubstantiate claims of superior organic producttastiness.
The quality of crops is controlled by a complexinteraction of factors, including soil type and the ratioof minerals in added compost, manure and fertilizer.So it is difficult to separate the influence of theenvironment and farming system. There is scope togenerate information on the quality of producegenerated on organic farms in future studies. As pertraditional belief that organic manure promotes qualitywhile mineral fertilizers promote quantity. Regardlessof whether the nutrients are from organic or inorganicsource, plants absorb the same in form of inorganic ions:ammonium, nitrate, phosphate, potassium etc. Sensorin plant roots, if any, to distinguish between nutrientsions coming from organic or inorganic sources are tobe yet discovered. Once absorbed, the nutrients aresynthesized into compounds that determine the quality
Table 2. Projected plant nutrient (N + P2O5 + K2O)addition and removal in India (million tonnes)
Items 2000 2020
Addition through fertilizers 18.07 29.60
Crop removal 28.00 37.46
Balance -10.00 -7.86
Total projected (2025) availability ofplant nutrients from tappable organicsources 7.75
154
of produce e.g. flavour, shelf-life etc., which is thefunction of genetic make-up of the plants (variety). Thus,any difference in taste of modern high - yielding varietiesfrom that of modern high - yielding varieties from that oftraditional low- yielding ones is due to difference ingenetic material of these varieties. There is no scientificevidence presented as yet to show that organicallyproduced food is of better quality and taste, and use ofinorganic fertilizer deteriorates it. The better taste ofthe organically grown food is of psychological nature,and could be attributed to 'Placebo effect' widely usedin drug testing, where harmless sugar pills administeredto control groups are known to cure patients of theirimaginary ailments, when told of their novelty andwonderful therapeutic properties. More someone paysfor it faster is the cure i.e. a clear case of 'mind overmatter'.
A general perception propagated in public mindsis that organically grown food is more nutritious, healthyand safe. There are no consistent and valid reports ofdifferences in the mineral contents of organic andconventional food. However, N applications generallyimprove both the protein and bread- making quality.There are many factors, environmental and cultural, thatinfluence the nutritional composition of the produce.There is no difference between the protein content andother quality parameters such as vitamins,nutraceuticals and trace minerals of conventionally andorganically grown crops, which at best could be linkedto the varietal characteristics. The genetically modified'golden rice' contains higher vitamin A content over thetraditional varieties will continue to have its superiornutritive value, irrespective of organic or inorganicfertilization. In the field of plant nutrient, the cry of onlynatural has no justification or scientific basis (Woese etal. 1997). The attitude that organic foods are safe andhealthy is based on misconception that hazards in foodare mainly derived from agro-chemical additives. In fact,microbes and not chemicals are the chemicals are themajor source of food borne disease viz. typhoid,gastroenteritis, dysentery, cystecurcosis etc. Whichcontain intestinal bacteria, many of which may presentsubstantial human health threats, can be an effective
nutrient source, but the pathogen risk must be an effectivenutrient source, but the pathogen risk must be seriouslyconsidered. Land application of manure is particularlyassociated with Salmonella, Escherichia coli and Taeniasoleum, which can contaminate the soil. These pathogensare known to survive in soil for a long period. They maybe carried on edible plant parts coming indirect contactwith soil and get into the food chain. They may also beintroduced into shallow surface waters as well as groundwater polluting potable water supply (Mikkelson and Gillian1995).
Organic farming and environment
Organic farming is eco-friendly and keeps the soilshealthy without polluting environment. It is well knownthat nitrate is the main end product of manuredecomposition, and it is continuously released fromorganic matter undergoing decomposition. Since nitraterelease is not synchronized with either crop demand itsuptake, it tends to accumulate in excessive amounts insoil and pose environmental risk. Nitrate, thus formedwithout being taken up by plants may leach pollutinggroundwater of may denitrify polluting atmosphere. Theions irrespective of their origin whether from organic orinorganic source will behave similarly. There is noevidence that NO3 ions from organic sources are lessmobile or have lower denitrification potential thaninorganic fertilizers. Trace elements and heavy metalconcentrations in animal wastes (manures) and sewagesludge's vary widely, and can be at times very high (Table3) and often exceed concentrations normally found ininorganic fertilizers. Field application of such organicmanures which have to be applied in very high quantitiesto meet the requirement of major plant nutrients maylead to heavy metal accumulation in soil polluting arableland. These will find way into edible plant parts and willget into the food chain becoming health hazard.
There is increasing evidence that warns that thegrowing push toward industrialization and globalizationof the world's agriculture and food supply imperils thefuture of humanity and the natural world. Industrial
Table 3. Total concentration (mg/kg of dry weight) of selected heavy metals and trace elements in fertilizers,manures and biosolids
Sources As Cd Cr Cu Pb Ni Zn
Cow manure - 8.1 58 62 16 29 71
Poultry manure 0.35-10.5 - 0.6-9.6 3.5 - - 51-538
Sewage sludge 3.6 2.3 35 511 65 22 705
155
agriculture which is corporate controlled, and promotesagrochemically based, monocultural, export-orientedsystems are negatively impacting public health,ecosystem integrity, food quality and nourishment,traditional rural livelihoods, and indigenous and localcultures, while accelerating indebtedness amongmillions of farmers, and their separation from lands thathave historically fed communities and families. Thistransition is increasing hunger, landlessness,homelessness, despair and suicides among farmers.Meanwhile, it is also degrading the planet's life supportsystems, and increasing alienation of peoples fromnature and the historic, cultural and natural connectionof farmers and all other people to the sources of foodand sustenance. Finally, it is also destroying theeconomic and cultural foundations of societies,undermines security and peace, and creates a contextfor social disintegration and violence.
Organic agriculture away from a dependence onchemical inputs, increase productivity, decrease inputcosts, and help reduce environmental problems. Despiteall the above problems associated with industrialagriculture, there are many optimistic developments.Thousands of new and alternative initiatives are nowflowering across the world to promote ecologicalagriculture, preservation of the livelihoods of smallfarmers, production of healthy, safe and culturallydiverse foods, and localization of distribution, trade andmarketing. Throughout the developing world there arestill microcosms of intact traditional agriculture whichrepresent millenary examples of successful forms ofcommunity-based local agriculture. These microcosmsof traditional agriculture offer promising models for otherareas as they promote biodiversity, thrive withoutagrochemicals, and sustain year-round yields. Suchsystems have fed much of the world for centuries, whileconserving ecological integrity through application ofindigenous knowledge systems and continue to do soin many parts of the planet. When agroecologicalprinciples are adopted, yield enhancement and stabilityof production are achieved, as well as a series ofecological services such as conservation ofagrobiodiversity, soil and water conservation andenhancement, improved biological pest control, etc.,regardless of scale or farm size. What varies are thetechnological forms utilized to optimize keyagroecological processes. This variation is best doneby farmers themselves; in industrial countries isexpressed as organic agriculture. Evidence indicates,however, agroindustrial inputs, such as capital-intensivetechnology, pesticides, and chemical fertilizers, hasnegatively impacted the environment and rural society.Most agriculturalists had assumed that the
agroecosystem/natural ecosystem dichotomy need notlead to undesirable consequences, yet, unfortunately,a number of "ecological diseases" have been associatedwith the intensification of food production. They maybe grouped into two categories: diseases of the ecotope,which include erosion, loss of soil fertility, depletion ofnutrient reserves, salinization and alkalinization,pollution of water systems, loss of fertile croplands tourban development, and diseases of the biocoenosis,which include loss of crop, wild plant, and animal geneticresources, elimination of natural enemies, pestresurgence and genetic resistance to pesticides,chemical contamination, and destruction of naturalcontrol mechanisms.
The interest in organic agriculture in developingcountries is growing because it requires less financialinput and places more reliance on the natural andhuman resources available. Studies to date seen toindicate that organic agriculture offers comparativeadvantage in areas with less rainfall and relatively lownatural and soil fertility levels. Labour is almost non-existent. Organic agriculture does not need costlyinvestments in irrigation, energy and external inputs,but rather organic agricultural policies have the potentialto improve local food security, especially in marginalareas.
Possibly, the greatest impact of organicagriculture is on the mindset of people. It uses traditionaland indigenous farming knowledge, while introducingselected modern technologies to manage and enhancediversity, to incorporate biological principles andresources into farming systems, and to ecologicallyintensify agricultural production. Instead of being anobstacle to progress, traditions may become an integralpart of it. By adopting organic agriculture, farmers arechallenged to take on new knowledge and perspectives,and innovate. This leads to an increased managementin farming which can trigger greater opportunities forrural employment and economic upliftment. Thusthrough greater emphasis on use of local resources andself- reliance, conversion to organic agriculture definitelycontributes to the empowerment of farmers and localcommunities.
The following conclusions can be drawn on importantissues regarding organic farming
Large scale conversion to organic agriculture wouldresult in food shortage with the present state ofknowledge and technology, as the yield reduction oforganic system relative to conventional agricultureaverage 10-15%, especially in intensive farming system.
156
However, in traditional rainfed agriculture, organic farminghas the potential to increase the yield since 70% of totalcultivable land falls in this category. Mere 5-10% increasein farm production would definitely help to achieve thetargeted growth rate of 4-5% in agricultural productionduring X five year plan.
Organic manure is an alternative renewable sourceof nutrient supply. A large gap exists between the availablepotential and utilization of organic wastes. However, it isnot possible to meet the nutrient requirements of cropsentirely from organic sources, if 100% cultivable land isconverted to organic farming.
Organic farming systems can deliver agronomicand environmental benefits both through structuralchanges and tactical management of farming systems.The benefits of organic farming are relevant both todeveloped nations (environmental protection,biodiversity enhancement, reduced energy use andCO2 emission) and to developing countries like India(sustainable resource use, increased crop yield withoutover - reliance on costly external inputs, environmentand biodiversity protection etc.).
Organic foods are proved superior in health andsafety but there is no scientific evidence to prove theirsuperiority in taste and nutrition, as most of the studiesare often inconclusive.
Organic farming is a holistic production systemthat has the advantage of efficient use and recycling oflocally available resources. It is best suited to rainfedareas with scarcity of water and light soils. Somemonopoly high value crops of rainfed areas like seedspices have great international demand, if produceorganically. Organic production in rainfed areas not onlyboost the economy of this region but also sustain theproductivity of natural resources. The need is tostrengthen research on development of processing andmarketing infrastructure, and financial as well astechnical support for quality organic production.
Future prospects in India
Despite all the benefits of organic cultivation, there aresome apprehensions among a group of people,including some scientists, which are often highlightedat different platforms to discourage the expansion oforganic farming. The important ones are:
• Can we sustain the food security to ever -increasingpopulation through organic farming?
• Is it possible to meet the nutrient requirements of thecrops entirely through organic sources?
• Are there any significant benefits of organic farming interms of food quality?
• Is organic farming economically viable?
• Is it possible to manage weeds, insect-pests anddiseases in organic farming to sustain yield levels?
It is very easy to answer all these queries at present inIndian context. But various FAO reports on organicagriculture unequivocally state that organic agriculturecan address local and global food-security challenges(Scialabba 2007). The report strongly points out that aworld - wide shift to organic agriculture can fight worldhunger and at the same time tackle climate change.Evidences presented to the FAO by Danish ResearchCenter for Food and Farming confirm the potential of anew organic farming paradigm to secure more thanenough food to feed the world, and reducedenvironmental impacts. The results, using a computermodel developed by International Food Policy ResearchInstitute, show that a 50% conversion to organic farmingin sub-Saharan region of Africa would not harm foodsecurity. Instead, it would help feed the hungry byreducing the need to import subsidized food, andproduce a diverse range of certified organic surplusesto be exported at premium profits. It says that conversionfrom chemically intensive farming to organic farmingcan initially decrease yields, but the adjustment evensout over time and provides numerous nonmaterialbenefits. Organic agriculture has the potential to reversethe on-going trends of soil and environmentaldegradation under conventional farming and reducecarbon dioxide, nitrous oxide and methane green -house gases that contribute to global warming. Organicagriculture could double the soil - carbon sequestrationin livestock based systems and decrease green- housegases by 48-60%. For example, organic systems havedecreased the use of fossil fuels by 10-70% in Europeand 29-37% in the USA.
In the backdrop of all these reported benefits,the Indian scientific community has to strive hard toprovide answers to some of these questions throughhard-core research in organic farming under tropicaland subtropical environments that exist in the country.There is greater need to undertake basic and appliedresearch on these aspects, for which more resourcesin the form of dedicated team of scientists, betterlaboratory facilities and working capital would berequired. The inputs from agronomists, soils scientists,
157
microbiologists, plant pathologists, entomologists andenvironmentalists would be highly critical. It is necessaryto undertake multi-location research to understand thescientific bases behind many organic farming practicesand identify technologies for improved yields, and toconduct some basic studies like; development ofinnovative crop - management practices and qualitydetailed nutrient budgets and indicators of improvementin soil quality (carbon sequestration, dehydrogenaseactivity, microbial biomass, C and N in major organic -based cropping systems); understand the nutrient -release patterns of different organic sources incombination and alone; develop relationship betweenthe crop N- demand and supply; screen crop orvegetable varieties, and to develop and assess bio-agents and bio - pesticide for effective control of insectpests and diseases of organic - based croppingsystems.
Considering the global scenario of organicagriculture, National Policy for Farmers-2007(Government of India) has clearly favoured thedevelopment of organic farming in India. The policy hasplaced high emphasis on organic farming , but it hascategorically mentioned that organic farming movementin India suffers from a lack of adequate institutionalsupport in the areas of research, extension, certificationand marketing and it requires more scientific supportthan chemical farming. Similarly, according to WorkingGroup on Horticulture, Plantation Crops and organicFarming for the XI Five - year Plan (PlanningCommission, GOI, New Delhi, 2007) healthy growthrates in organic farming are expected to continue in thecoming years, and ever-growing demand for organicproducts offers attractive opportunities for producers,especially those in less- developed areas. It is expectedthat spread of organic farming on 1-5% area in the highproductive zone and large spread in the less-exploitedareas such as, rainfed and hill areas, would helpstrengthen the organic movement. It will furtherstrengthen our export- oriented programme under WTOregime.
On the contrary, in general , there is considerable latentinterest among farmers in conversion to organic farming.However, they become reluctant todo so because ofthe following factors
• Perceived high costs of organic farming, which ismainly due to incomplete knowledge about principlesand practices of organic agriculture among farmers.Farmers often seek for off-farm inputs, leading toescalation in production costs, which is against the
basic philosophy of organic agriculture. Moreover, veryhigh government subsidies on chemical fertilizers inconventional agriculture are not taken into accountwhile comparing the production costs.
• Non-availability of adequate quantities of organicmanures and other organic inputs in the local marketfrom reliable sources. Farmers are , more often thannot, forced to recycle major quantities of cropresidues as animal fodder and animal dung assources of household energy. Sizable quantities ofcrop residues are also sold off to paper andcardboard industry to earn cash for householdneeds.
• • Complete knowledge about organic farmingprinciples, practices and advantages accrued togrower as well as mankind is not filtered down tothe small farmers, which should be the actual targetand potential beneficiary of organic farming. Further,whatsoever information reaches the target groupsis very often not backed by scientifically provenresults in tropical or subtropical climatic conditionsand different farming situations prevailing in Indiansubcontinent.
• Complex and costly procedures of certification.
• The risks involved in marketing of organic produceas premium rates for organic produce are notavailable in domestic markets.
Strategies
In Indian context, to promote and make organic farmingeconomically viable, the following issues are neededto be addressed immediately
• Adequate research and extension support needs tobe provided for improving the region -specific farmingtechniques and disseminating the findings forconversion and management of organic farms infarming-system mode.
• Researchers should study and quantify the role oforganic agriculture in mitigating the climate changeand ill-effects of modern agriculture, and alsoimprove the resource sustainability.
• Central and state governments should acknowledgeorganic agriculture as an effective mechanism toreduce green house gases and sequester soilcarbon. They should help farmers by promoting
158
organic agriculture through research and extensionservices.
• The governments should recognize organicagriculture in Kyoto-Protocol carbon - creditmechanisms.
• Organic market development sector needs majorthrust on development of supply chains and relatedinfrastructure to ensure competitive price of organicproduce to the grower in domestic and internationalmarkets.
• Mission -mode programmes for on- farmdemonstrations, training for capacity building ofinstitutions, organic farmers, service providers,NGOs and processing or packing industry, with fullresearch back-up are needed. Model organic farmsare need to be established in public- private-partnership mode.
• Government support is required for cheaper accessto organic certification of farms.
tSfod [ksrh mRiknu fof/k dh ,d foLr`r Ja[kyk gS A tks fd i;kZoj.k,oa ekuo LokLFk ds leFkZu esa Lohdkj dh tkrh gS A fodflr ,oafodkl'khy ns'kksa esa 20-25% okf"kd o`f) nj ds fglkc ls tSfod[kk| dh ekax mUrjksÙkj c<+rh tk jgh gS A tSfod -f"k] -f"kr mRiknudk ,d lcls vf/kd o`f) djus okyk fgLlk gS A tcfd foLr`r {ks=esa tSfod :ikUrj.k ls igys ;g vko';d gS fd dqN eq[; fcUnqvksaij fopkj fd;k tk, tSls&D;k tSfod [ksrh ds mRiknu ls lHkh dksi;kZIr Hkkstu fey ldrk gS \ D;k tSfod [ksrh }kjk Qlyksa dksvko';d iks"kd rRoksa dh iwfrZ laHHko gS \ D;k tSfod [ksrh }kjkmRikfnr mRikn Lokn ,oa xq.k es csgrj gksrk gS \ D;k ;g vkfFkZd:i ls O;ogkfjd gS \ ;g ys[k Hkkjrh; ifjos'k es bu fcUnqvksa ijlw{e leh{kk izLrqr djrk gS A
tSfod —f"k ,d mRiknu i)fr gS A ftlesa la'ysf"kr ;kSfxd tSls&moZjd]O;kf/kuk'kd] o`f)dkjd ,oa i'kq/ku gsrq HkksT; lfEeJ.k izk-frd lalk/kuksa dk fVdkÅiu [ksrh dh ykxr dks de djuk] LoLF; Hkkstu dhmiyO/krk] iz{ks= dk ykHk c<+kuk ,oa e`nk LokLF; lq/kkj A tcfdcktkj esa tSfod nkos ij lqj{kk iznku djuk] tSfod —f"k ds izek.khdj.kdh vko';drk gS A ysfdu foLr````r :i ls tSfod —f"k fof/k mi;ksxdjus okyh dksbZ Hkh i)fr pkj vk/kkjHkwr fl)kUrksa ij vk/kkfjr gS¼LokLF;] ifjfLFkrdh] xq.koÙkk ,oa ns[kjs[k dk fl)kUr½ ftUgs tSfod—f"k esa oxhZ—r dj ldrs gS A
References
Dormaar JF, Lindwall CW, Kozub GC (1988) Effectivenessof manure and commercial fertilizer in restoringproductivity of an artificially eroded dark brownchernozemic soil under dryland conditions. CanadianJournal of Soil Science 68 : 669-697
Nambiar KKM (1994) Soil fertility and crop productivity underlong -term fertilizer use in India. ICAR, New Delhi :144
National Academy of Agricultural Sciences (NAAS) (1997)Proceedings. Symposium on "Plant Nutrient Needs,Supply, Efficiency and Policy Issues; 2025 ' Summaryand Recommendation
National Academy of Agricultural Sciences (NAAS) (2005)Policy Paper (30) on organic Farming: Approach andPossibilities in the context of Indian Agriculture
Peters SE (1994) Conversion to low-input farming systems inPennsylvania, USA. An evaluation of the RodalFarming Systems Trial and related economic studies.(In) Economics of Organic Farming (Eds LampkinNH and Padel S), CAB, Wallingford, UK : 265-284
Petersen C, Drink water L, Wagoner P (1999) The RodaleInstitute Farming System Trail: The first 15 years.Publisher: The Rodale Institute, Kutztown, PA, pp40. www. Rodale institute.org
PrettyJ, Hine R (2001) Reducing food poverty with sustainableagriculture: A summary of new evidence, SAFEResearch Project, University of Essex, WivenhoePark, UK pp 136
Pretty J (2000) The real costs of modern farming. Agriculturalsystems 65 : 113-136
Smolike JD, Dobbs TL, Rickerl DH (1995) The relativesustainability of alternative, conventional andreduced till farming system. American Journal ofAlternative Agriculture 10 :25
Stanhill G (1990) The comparative productivity of organicagriculture. Agriculture Ecosystem and Environment30 : 1-26
Subba Rao IV (1999) Soil and environmental pollution- A threatto sustainable agriculture J Indian Soc Soil Sci 47 :611-633
Swarup A, Wanraj RH (2000) Three decades of All Indiacoordinated Research Project on LTFEs to studychanges in soil quality, crop productivity andsustainability IISS, Bhopal : 59
159
Tandon HLS (1997) Proceedings, Symposium on PlantNutrient Need, Supply, Efficiency and Policy issues:2000-2025 (Eds Kanwar JS, Katyal JC). NationalAcademy of Agricultural Sciences, New Delhi
Trewaves A (2001) Urban myths of organic farming, Nature410: 409-410
Woese KD, Lange CB, Bogel KW (1997) A comparison oforganically and conventionally grown foods-Resultsof a review of the relevant literature. J Sci Food andAgric 74 : 281-293
Wynen E (1994) Economics of organic farming in Australia.(In) The Economics of Organic Farming (EdsLampkin NH, Padel S) CAB, Wallingford, UK : 185-199
Agricultural growth throughout global history has been thepro-genitor of broad-based economic growth anddevelopment, as linkages between farm and non-farmeconomies generated widely-based employment, income, andgrowth. Agricultural growth shall thus in the future also be thesine qua non for alleviation and eradication of rural povertyand hunger in those states that have not yet fully achievedtheir broad-based growth. The state of Madhya Pradesh isalso marching towards broad-based growth. The state ofMadhya Pradesh is the second largest state of the country interms of its geographical spread. It is primarily an agricultureState. The agriculture and allied services contributes about23 per cent share in state economy and 65 per cent of itsworking force is directly engaged in agriculture. This statehas a great production potential since yield gap - II is veryhigh for most of the crops grown in the state and therefore,the study on growth dynamics of major crops was undertaken.The secondary data of 13 major crops were collected for area,production and productivity in Madhya Pradesh for 30 yearsi.e. 1980-81 to 2009-2010. The whole period was divided intotwo sub-period as pre-globalization - P1 period (1980-81 to1994-95) and post-globalization - P2 period (1995-96 to 2009-10). The results show that the compound growth rate ofcereals was higher during P1 period as compared to P2 period,except for Sorghum. But in case of pulses, the growth inproduction of Black gram was higher during P2 period while itwas higher for Chickpea, Lentil and Pea during P1 period.Oilseed crop also registered high growth rate during P1 periodas compared to P2 period. In case of Cotton, highly significantgrowth was recorded in the state on account of significantpositive growth in productivity due to adoption of Bt Cottonproduction technology during P2 period. Total food grains andoilseeds shows higher growth during P1 period as comparedto P2 period. The relative change in output of cereals mainlyWheat and Maize was observed to be higher as compared toPaddy and Sorghum during both the period despite of marginalreduction in area of Wheat during P2 period. Among the pulses,chickpea, lentil and pea shows higher relative change,especially, during P2 period and Black gram which wasregistered negative relative change during P1 period turn outto be positive during P2 period. Pigeon pea crop showsnegative relative change during the entire period of study.
The growth of agriculture in the State of Madhya Pradesh isstill having great potential since it is not negative.
Keywords: Major crops, area, production, productivity,growth and relative change
Agricultural growth throughout global history has beenthe pro-genitor of broad-based economic growth anddevelopment, as linkages between farm and non-farmeconomies generated widely-based employment,income, and growth. Agricultural growth shall thus inthe future also be the sine qua non for alleviation anderadication of rural poverty and hunger in those statesthat have not yet fully achieved their broad-basedgrowth. This is particularly so in Madhya Pradesh, wherethe numbers of rural poor including the land-less andthose farming sub-marginal holdings are so large(>60%). The state of Madhya Pradesh has been thecentre of agriculture excellence in selected crop likeSoybean, Chickpea, quality Wheat. The totalgeographical area of the state is 30.82 million hectares(2009-10). The forests occupies 8.59 million hectareswhich is 27.87 per cent of the geographical area of thestate, whereas, the cultivated area is about 49 per centof the total geographical area which is 12.94 millionhectares (2009-10). The state of Madhya Pradesh isthe second largest state of the country in terms of itsgeographical spread. It is primarily an agriculture State.About 70 per cent population of the state is rural, whichis directly or indirectly depends on agriculture. Thus,agriculture sector is the mainstay of the state economy.The agriculture and allied services contributes about23 per cent share in state economy and 65 per cent ofits working force is directly engaged in agriculture. Theeconomy of India witnessed positive change aftereconomic liberalization. The performances of agriculturesector of Madhya Pradesh in particular need such typesof estimates and therefore the present study wasundertaken.
Growth dynamics of major crops in Madhya Pradesh
A. Jayanta Kumar and S.B. NahatkarDirectorate of Research ServicesJawaharlal Nehru Krishi Vishwa VidyalayaJabalpur 482004 (MP)
JNKVV Res J 46(2): 160-165 (2012)
161
Research Methodology
The study area pertains to the state of Madhya Pradeshexcluding the area of Chhattisgarh which was carvedout of Madhya Pradesh in the year 2000. Efforts areput to ensure actual data for Madhya Pradesh, the entireseries (1980-81 to 1998-99) are tabulated for analysispurpose by deducting the data of the selected variablesfor the districts merged into Chhattisgarh i.e., the dataof Bastar, Bilaspur and Raipur division. The data ofremaining districts of state are pooled together to forma common figure for the state during that period. Thestate has a diversified cropping pattern in different agro-climatic regions and hence all the important cereals,pulses and oilseeds were selected for the present study.Thus, the study was restricted to principal crops withthe assumption that the excluded crops do not affectthe cropping pattern and in turn would not vitiate themain conclusions of the study. The secondary data of13 major crops (viz. Paddy, Wheat, Maize, Sorghum,Pigeon Pea, Black gram, Chickpea, Lentil, Pea,Mustard, Soybean, Linseed and Cotton) were collectedon area, production and productivity for 30 years i.e.1980-81 to 2009-2010 from the published documentsof Government of India, Government of MadhyaPradesh and various Directorates, Commission andBoards. Website of the Department of Farmers Welfareand Agriculture Development, Government of MadhyaPradesh, Publications such as Area, Production andProductivity of Major crops in Madhya Pradesh, Tables
of Agricultural Statistics of Madhya Pradesh andAgricultural Statistics at a Glance. The whole periodwas divided into two sub-period as Pre-Globalization -P1 Period (1980-81 to 1994-95), Post-Globalization -P2 Period (1995-96 to 2009-10) and P3 Period (1980-81 to 2009-10). The relative change and compoundgrowth rate for Sub-periods and pooled period wereanalysed.
Results and Discussion
The relative change and compound growth rate inpercentage for area, production and productivity ofthirteen major crops viz. Paddy, Wheat, Maize,Sorghum, Pigeon Pea, Black gram, Chickpea, Lentil,Pea, Mustard, Soybean, Linseed and Cotton during1980-81 to 2009-2010 was worked out and data on thesame are presented in the following Sub-heads.
Relative change
Cereals
The relative change in output of cereals mainly Wheatand Maize was observed to be higher as compared toPaddy and Sorghum during both the period despite ofmarginal reduction in area of Wheat during P2 period.During P1 period, in rabi season highest relative change
Table 1. Relative change in production of major crops in Madhya PradeshCerealsCrops Period P1 P2 P3
P1: Pre-globalization period of 1980-81 to 1994-95, P2: Post-globalization period of 1995-96 to 2009-10, P3: Period of entirestudy ranging from 1980-81 to 2009-10, BY: Base Year (Triennium), CY: Current Year (Triennium), RC: Relative Change inPercentage
163
in production of wheat was recorded (89.1%) and thiswas mainly due to 17.89 percent increase in areafollowed by 61.4 percent increase in productivity ofwheat, revealing that during this periods growth inproduction of wheat was technology driven. While inkharif season, during P1 period, relative change inproduction of maize was promising (62.7%) and thiswas mainly contributed to higher relative change inproductivity (41.5%). Sorghum crop which was mainlyreplaced by Soybean as observed from negative relativechange of acreage of Sorghum (-43.4%) in the state.During P2 period, relative change in production of maizewas highest (15.5%) followed by paddy (10.10%)despite of reduction in acreage of paddy marginally(-3.3%). During overall period, wheat and maizeregistered higher relative change in production 121.80and 66.10 percent respectively. The overall relativechange in production of total cereals was 34.08 percentdespite of reduction in acreage by 17.98%.
Pulses
Among the pulses, chickpea, lentil and pea showshigher relative change, especially, during P2 period andBlack gram which was registered negative relativechange during P1 period turn out to be positive duringP2 period. Pigeon pea crop shows negative relativechange during the entire period of study, and this wasmainly attributed to yield reduction in P2 period and areareduction in P1 period. During P1 period, relative changein production of lentil was highest (68.50%) followedby pea (61.3%) and chickpea (55.1%). In chickpea, thischange was due to productivity enhancement, while inlentil and pea it was due to area expansion. During P2period, pea and blackgram registered higher relativechange in production reflecting towards inclination offarmers towards these two pulses. During overall period,pea (193.50%), lentil (130.6%) and chickpea (109.7%)shows higher relative change in production, whilepigeonpea crop registered negative relative change of
Table 2. Growth rates of Major crops in Madhya Pradesh (%)
P1: Pre-globalization period of 1980-81 to 1994-95, P2: Post-globalization period of 1995-96 to 2009-10, P3: Period of entirestudy ranging from 1980-81 to 2009-10, A: Area, P: Production, Y: Yield ** Significant at 1% level of probability, * Significantat 5% level of probability
164
34.80 percent. The total pulses also registered higherrelative change in production during P1 period (25.93%)as compared to P2 period (16.93%). The total food grainsproduction also registered higher relative change duringP1 period (29.11%) as compared to P2 period (7.39%)despite of marginal reduction in acreage during boththe periods.
Oilseed and Commercial crop
Among the oilseeds, Soybean and Mustard show highrelative change during the entire period of the studybut there was negative relative change in Linseedacreage and production. In case of Cotton, area,production and productivity shows higher relativechange during P2 period as compared to P1 period andthis was mainly due to introduction of Bt Cottonproduction technology. Amongst the oilseeds in thekharif soybean (1380.10%) and in rabi mustard(309.50%) registered higher relative change inproduction during P1 period, while in P2 period, relativechange in production of soybean in kharif and mustardin rabi are at par (41%). But contribution of productivitywas higher in mustard crops as against contribution ofacreage in soybean crop. Total oilseeds shows positiverelative changes in acreage, production and productivityrevealing that most of the cereals were replaced byoilseeds and pulses crop in the state. In cotton, despiteof reduction in acreage during P1 and overall periodpositive relative change in production attributed towardscotton growers' responses to technological adoption,specially Bt technology during P2 period and hybridtechnology during P1 period.
Compound Growth rates
The data on compound growth rate on area, productionand productivity of major crops are presented in theTable 2.
Cereals
It was found that the growth in production of cerealswas higher during P1 period as compared to P2 periodexcept for Sorghum. The growth rates of Cerealsproduction and productivity was positive and highlysignificant during period of 1980 to 1995 but it wassluggish during period 1996-2010, revealing that theCereal crops were replaced by other commercial andmarketed crops like cotton, oilseeds and pulses. Thegrowth in production of wheat (5.1%) was observed to
be highest during P1 period and during overall period alsothis crop registered highest growth rate (2.8%), followedby maize (1.2%) and paddy (1.2%).
Pulses
But in case of pulses, the growth in production ofBlackgram was higher during P2 period while it washigher for Chickpea, Lentil and Pea during P1 period.The lentil crop registered highest growth rate (4.6%)during P1 period followed by chickpea (3.9%) and pea(3.6%) while pigeoapea and blackgram registerednegative growth in production. This revealed that mostof the kharif pulses are replaced by oilseeds especiallyby soybean crop in the state, while during rabi most ofthe pulses are gaining popularity among farmers assource of income. Even during P2 period, when Soybeancrop was well established in the cropping pattern of thestate, the growth in area of blackgram in kharif in nonsoybean growing areas registered significantly (3%) andduring rabi season, pea (3.1%), chickpea (1.9%) andlentil (1.3%) registered significant positive growth in theiracreage. The production growth in total pulses waspositive and significant during both the periods.However, the growth of total food grain production waspositive during P1 period and it was significantly higheras compared to P2 period.
Oilseeds and Commercial crop
Oilseeds crop also registered high growth rate duringP1 period as compared to P2 period. In case of Cotton,highly significant growth was recorded in the state onaccount of significant positive growth in productivity dueto introduction of Bt Cotton production technology duringP2 period. Total food grains and oilseeds shows highergrowth during P1 period as compared to P2 period.Soybean and mustard registered positive and significantgrowth in area, production and productivity during boththe periods along with highly significant growth inproduction of total oilseeds. The cotton crop productionalso registered significant growth during both the periodbut growth in production was higher during P2 periodas compared to P1 period.
The rate of reduction of acreage of Cereals was almostsame during 1981-1995 and 1996-2010, but growth ofproduction of Cereals was higher during 1981-1995 ascompared to 1996-2010 and this was mainly attributed tohigher productivity growth. The growth in acreage of pulseswas higher during 1996-2010 but productivity of pulsesregistered higher growth during 1981-1995 and it is very
165
interesting to observe that kharif pulses especiallypigeonpea replaced by soybean and rabi pulses likechickpea, pea and lentil replaced wheat acreagemarginally and also used rabi fallow land due to increasein irrigation facilities. Cotton area which starts decliningduring 1981-1995 again gained momentum and increasedsignificantly during 1996-2010 period. This show thatcropping pattern of the state is changing and farmers areresponsive to price and technological changes especiallyin case of rabi pulses, oilseeds and cotton.
lewps fo'o ds bfrgkl esa vkfFkZd o`f) ,oa fodkl] d`f"k o`f) ij fuHkZjjgk gS D;ksafd d`f"k ,oa xSj d`f"k vk/kkfjr vkfFkZdh jkstxkj] vk; ,oao`f) ds l`tu gSA mu jkT;ksa us tgkWa vHkh rd iwjh rjg ls O;kid o`f)gkfly ugh dh gS Hkfo"; esa mu jkT;ksa esa xjhch ,oa Hkw[k ds mUewyuds fy, d`f"k fodkl vfuok;Z gSA e/;izns'k jkT; Hkh O;kid fodkl dhvksj vxzlj gS A e/;izns'k HkkSxksfyd izlkj dh n`f"V ls ns'k dk nwljklcls cM+k jkT; gS A ;g eq[; :i ls d`f"k vk/kkfjr jkT; gSA jkT;dh vFkZ O;oLFkk esa —f"k ,oa —f"k ls lacaf/kr lsokvksa dh 23 izfr'krdk ;ksxnku gS ,oa leLr dk;Zcy dk 65 izfr'kr fgLlk izR;{k :i lsdf"k esa yxk gqvk gSA bl jkT; esa Hkfo"; esa vf/kd mRiknu dh laHkkouk,WagSaA vf/kdrj Qlyksa esa mit varj &II vf/kd gS] vr% izeq[k Qlyksa dhmRiknu dh xfr'khyrk ij v/;;u fd;k x;k gS A e/;izns'k esa 30 o"kksZads fy, 1995&96 ls 2009&10 rd izeq[k 13 Qlyksa dk {ks=] mRiknu,oa mRikndrk dk f}rh;d MkVk laxzg fd;k x;k A iwjh vof/k dks nksmi vof/k;ksa esa foHkkftr fd;k x;k gS A izFke oS'ohdj.k ds iwoZ ih&1vof/k ¼1980&81 ls 1994&95 rd½ ,oa oS'ohdj.k ds ckn ih&2vof/k ¼1995&96 ls 2009&10½ rd A ifj.kke ;g crkrs gSa fd ih&2vof/k dh rqyuk esa ih&1 vof/k ds nkSjku Tokj dks NksM+dj vukt okyhQlyksa dh o`f) nj vf/kd Fkh A ih&2 vof/k ds nkSjku nyguh Qlyksaesa mM+n ds mRiknu esa o`f) vf/kd Fkh tcfd puk] elwj ,oa eVj dsmRiknu esa ih&1 vof/k ds nkSjku vf/kd FkhA dikl ds ekeys esa ih&2
vof/k ds nkSjku chVh dikl mRiknu rduhdh vaxhdj.k ls izns'k esadikl mRikndrk esa vf/kd ldkjkRed o`f) ntZ dh xbZ A ih&2 vof/k dh rqyuk esa ih&1 vof/k ds nkSjku lEiw.kZ vukt ,oa fryguh Qlyksads mRiknu esa vf/kd o`f) gqbZ A nksuks vof/k ds nkSjku /kku ,oa Tokjdh rqyuk esa xsgwWa ,oa eDds dh mRikndrk esa vf/kd ldkjkRed ifjorZuns[kk x;k] tcfd ih&2 vof/k ds nkSjku xsgwWa ds mRiknu {ks= esa deh ns[khxbZ A eq[;r% ih&2 vof/k ds nkSjku nyguh Qlyksa esa puk] elwj ,oaeVj esa vf/kd ldkjkRed ifjorZu ns[kk x;k A mM+n esa ih&1 vof/k ds nkSjku udkjkRed lkis{k ifjorZu ntZ fd;k x;k tcfd ih&2 vof/k ds nkSjku ldkjkRed ifjorZu ntZ fd;k x;k A vjgj Qly v/;;udh iwjh vof/k ds nkSjku _.kkRed lkis{k ifjorZu dks n'kkZrh gS A e/;izns'k esa d`f"k esa o`f) dh vf/kd laHkkouk;sa gSa D;ksafd izeq[k Qlyksa dho`f) nj vHkh Hkh /kukRed gSA
References
Alauddin Md, Rao DSP, Headey D (2002) ExplainingAgricultural Productivity Levels and Growth, aninternational perspective, Centre for Efficiency andProductivity Analysis, School of Economics, TheUniversity of Queensland, Brisbane, Qld 4072,Australia
Barot Bharat (2001) Growth and business cycles for theSwedish economy. J Con Res 3(2): 217-253
Kumar Praduman, Mittal Surabhi, Hossain Mahabub (2008)Agricultural growth accounting and Total FactorProductivity in South Asia: A review and policyimplications, Agric Econ Res Rev 21: 145-172
Rangi PS, Sidhu MS (1999) Growth of Punjab agriculture aneconomic analysis. Agric Econ Res Rev 12(1): 25-35
S.K. ShrivastavaDirectorate of Research ServicesJawaharlal Nehru Krishi Vishwa VidyalayaJabalpur 482 004 (MP)
Wheat (Triticum L.) is an important cereal crop in India,growing on 29 million ha and producing 93.9 million toneswith productivity of 3140 kg per ha. It is cultivated in 4.89million ha in Madhya Pradesh with production 12.75 milliontons and productivity 2609 kg/ha. More than a dozen insectpests including non insect pest (mite) are associated withwheat crop in Madhya Pradesh. Among these termites,brown wheat mite (Petrobia latens), Shoot fly (Atherigona
bituberculata Malloch) and root aphid (Rhapalosiphum
rufiabdominals Sos) were major insect pests (Rawat andSahu 1970).
Root aphid (Rhapalosiphum rufiabdominals Sos)reported for the first time infesting roots of wheat seedlingin Madhya Pradesh under un-irrigated condition in 1965and 1968 (Rawat and Sahu 1970). During recent years ithas been found infesting roots of un-irrigated as well asirrigated wheat crop from December to February (Vermaet al. 1995). Efforts have been made to pool together theavailable information on this pest which could help todevelop strategies for the sustainable management of rootaphid (Rhapalosiphum rufiabdominals Sos).
Common Name: Wheat root aphid, Cereal root aphid,Red rice root aphid and Rice root aphid
R. rufiabdominals was first described by Sasaki asToxoptera rufiabdominalis in Japan in 1899. Doncaster(1956) reviewed the subsequent descriptions of this aphidfrom around the world and the confusion in the literature,largely due to its similarity to other Rhopalosiphumspecies. Doncaster (1956) and Tanaka (1961) re-describedthe aphid.
Geographic Distribution
R. rufiabdominals is virtually worldwide in distribution, butis of economic importance only in warmer climates,particularly upland rice in Japan. It is widespread in Northand East Africa, North and South America, Middle Eastand India.
Europe : Italy (Ciampolini et al. 1993); Portugal; Azores;Madeira; Russia (CIE 1971); Spain (Melia 1986).
167
Asia
Bangladesh (APPPC, 1987),
China : Fujian (CIE 1971); Hong Kong (APPPC 1987;CIE 1971); Taiwan (CIE 1971); Yunnan (Ding 1985);Zhejiang (CIE 1971).
India : Bihar (Misra et al. 1985); Himachal Pradesh (Misra& Parihar 1983); Punjab (Singh et al.1994); Kerala (Paiet al. 1980); Madhya Pradesh (Rawat and Sahu 1970;CIE 1971); Maharashtra; Orissa; Rajasthan; UttarPradesh; West Bengal (CIE,1971).
Indonesia : (CIE 1971); Java (CIE 1971); Iran (Hodja 1984);Iraq (CIE 1971); Israel (CIE 1971).
Japan : Hokkaido; Honshu; Kyushu; Ryukyu; Archipelagoand Shikoku (CIE 1971).
Jordan : (CIE 1971); Korea (CIE 1971); Korea (APPPC1987); (CIE 1971); Malaysia (CIE 1971); Nepal (CIE,1971); Pakistan (CIE 1971); Philippines (CIE 1971); SriLanka (CIE 1971); Thailand (CIE 1971); Turkey (CIE 1971).
Africa : Cameroon (CIE 1971); Egypt (CIE 1971); Ghana(CIE 1971); Kenya (CIE 1971); Morocco (CIE 1971);Nigeria (CIE 1971); South Africa (CIE 1971); Tanzania(CIE 1971); Zambia (CIE 1971).
Western Hemisphere
Argentina (CIE 1971); Brazil; Sao Paulo (CIE 1971);Ontario (Paliwal 1980); Chile (CIE 1971); Colombia (CIE1971); Cuba (CIE 1971); Jamaica (CIE 1971); Mexico(CIE 1971); Peru (CIE 1971); Puerto (CIE 1971);Suriname (CIE 1971).
USA
Alabama; Arkansas; California; Colorado; Florida; Georgia;Hawaii; Indiana; Kansas; Maryland; Mississippi; Missouri;Nebraska; New Mexico; North Carolina; Ohio; Oklahoma;Oregon; South Carolina; South Dakota; Tennessee; Texas;Utah; Virginia; Wyoming; Venezuela (CIE 1971).
Oceania [Australia]
Australian Northern Territory; New South Wales;Queensland; South Australia; Tasmania; Victoria; WesternAustralia; New Zealand; Papua New Guinea (CIE 1971).
Host Range: (Primary/ Wild Hosts)
R. rufiabdominals is found on the leaves of its winter(primary) hosts (Prunus spp.) and on the roots of summer
(secondary) hosts, where aphids are usually located. Theaphids are generally not seen on aerial parts of rice exceptin some limited periods and situations. They are observedon the lower part of stems and on roots, in wheat andbarley; however they may also be seen on leaves of youngplants.
Winter hosts of R. rufiabdominals are Prunusspecies, including P. cerasiferum, P. mume, P.yedoensis, P. donarium varieties, P. salicina and P.persica. Tanaka (1961) listed ten species of Prunus asprobable winter hosts. Torikura (1991b) reported Malussp., Pyrus sp. and Rhodotypos sp. as occasional winterhosts.
Summer hosts include numerous species ofPoaceae (particularly rice and other cereals), Cyperaceae,some dicots, particularly Solanaceae (potato, tomato)and, occasionally, Compositae. Doncaster (1956) andGrist and Lever (1969) list many alternative host plants.
R. rufiabdominals has become a pest of plantsgrown in hydroponic systems in greenhouses, in the USAand elsewhere (e.g. Etzel and Petitt 1992), and underthese circumstances can infest plants outside its usualhost range.
Affected Plant Parts: Whole plant, stems, and roots.
Nature of Damage
In rice, plants wilt and die if large numbers of R.rufiabdominals occur on the upper parts of roots. Theusual effect of aphid feeding is less extreme, however,with plants becoming yellow and distorted.
In wheat, at seedling stage both nymphs as wellas adults suck the cell sap from the root and from theunderground-basal portion of the stems resulting in with-ering and discoloration of lower leaves and stunted plant
growth (Rawat and Sahu 1970; Parsai and Shrivastava1997).
Pest Status and Economic Importance
In wheat, R. rufiabdominals causes on an average lossof 8.4% in plant height, 28.8% in number of ears, 41.9%in number of grains, 27.3% in grain yield and 3.08% ingrain weight (Verma et al. 1995).
R. rufiabdominals is an economic pest of uplandrice, particularly in Japan, but is not a pest of irrigatedrice anywhere in the world (Grist and Lever 1969). Injuryto upland rice can be severe in Japan, with losses of upto 50-70% (Yano et al. 1983). Occurrence was related tothe cultivars of upland rice in China, where aphids causedlight damage at the seedling stage and heavy damage atthe tillering stage (Ding 1985). Generally, aphids causemore serious damage during the early growth stages(Yano et al. 1983).
R. rufiabdominals infests the roots of a range ofother crops worldwide, including barley in Turkey, wheatin India, North America and Africa (Doncaster, 1956; Singhet al. 1994), aubergines in Spain (Melia 1986), cotton inAfrica and the USA (Doncaster 1956; Duviard andMercadier 1973) and sugarcane in Japan. It is reportedfairly infrequently on cereals, but its subterranean habitatmay mean that it is frequently overlooked.
R. rufiabdominals has become a pest of plantsgrown in hydroponic systems in greenhouses, in the USAand elsewhere (e.g. Etzel and Petitt 1992) and under thesecircumstances can infest plants outside its usual hostrange.
R. rufiabdominals is a vector of barley yellow dwarfvirus (BYDV) (Paliwal 1980), which contributes to itseconomic importance as a pest of barley in Turkey andNorth America. Singh (1977) presented evidence of R.rufiabdominals being a vector of maize mosaic virus inIndia. It is also thought to be a non-persistent vector ofcucumber mosaic virus, which causes serious damageto tobacco in some areas in Taiwan (Chen and Weng1969).
Morphology & Marks of Identification
The abdomen of alatae are similarly coloured. Apteraeand alatae 1.2-2.2 mm (Blackman and Eastop 1985).Apterae found on roots of secondary host plants, are darkgreen, olive or brownish with usually a reddish area at theposterior end of the abdomen between and around thesiphunculi. Apterous and alate virginoparae with long fine
hairs on the body and antennae. Cauda conical, withbroad base narrowing to middle and distal half finger-shaped. Hind wings of alate with two oblique veins(Doncaster 1956). Apterous viviparae usually with marginaltubercules only on first and seventh abdominal segments.Appendages are brown. Body in life dark-brown, with muchpowdery wax (Torikura 1991b).
Alate viviparae (emigrants and gynoparae) withmarginal tubercules only on first and seventh abdominalsegments. Siphunculus stout, wider than hind femur atbasal half. Cauda triangular (Torikura 1991b). Alate maleswith antennal flagellum 0.7-0.9 times as long as the body.Ovipara with antennal processus terminalis 1.4-2.1 timesas long as third antennal segment.
Similarities with other Spp.
R. rufiabdominals is closely related to R. padi and R.insertum. It has been confused with other Rhopalosiphumspecies, particularly R. padi by various authors (Yano etal. 1983). Doncaster (1956) summarized how it differsfrom related species on summer hosts, most importantlyby having characteristic long, fine hairs on the body andantennae; while Torikura (1991b) provided keys forRhopalosiphum found in Japan, emphasizing differencesbetween morphs on primary hosts.Bio ecology
R. rufiabdominals is heteroecious holocyclic (host-alternating with sexual phase during life-cycle) betweenPrunus and roots of many plants, especially Poaceae, inJapan and other countries where a primary (winter) hostis present. Emigrants and apterous fundatrigeniae areobserved as late as July on winter hosts in Japan (Torikura1991a). However, in most parts of the world, R.rufiabdominals is anholocyclic on roots of secondary(summer) host plants. Colonies developing on Poaceaeand Solanaceae can migrate in spring to other summerhosts, e.g. from weeds to rice and other crops.
Tanaka (1961) described the life cycle in Japan,where R. rufiabdominals has a brief period of abundancein June-early July, with over 100 nymphs occurring oneach plant in some cases. A total of 16-23 generations ayear occur on upland rice. Alatae (winged forms) settleon leaves of summer hosts and descend to roots, wherecolonies develop at a depth of 2-3 cm. They have recordedassociations with ants on roots of various hosts and areoften found in nests of Tapinoma in the Middle East(Bodenheimer and Swirski 1957). The ant Lasius nigerwas observed in Japan to transfer aphids to roots (Tanaka1961).
170
Hsieh (1970) studied the population biology of R.rufiabdominals on rice in Taiwan, where reproductioncontinued throughout the rice-growing season.Development of nymphal instars can be completed in 4days (Tanaka, 1961) or about 7 days (Hsieh 1970).Becerra (1994) found in a laboratory study in Colombia(28.5°C and 86% RH) that 1st - 7th nymphal instars lasted1.33, 1.48, 1.68, 1.49, 1.53, 1.47 and 1.00 days,respectively, while adult longevity was 3.43 days. Adultsbegin to reproduce after 1-2 days.
Management
Resistant varieties
Use less susceptible wheat variety DL 788 -2 under latesown condition.
Rice cultivars have been shown to have differentlevels of resistance to R. rufiabdominals. Dani andMajumdar (1978) found the Indian rice cultivar Jaya to beresistant to R. rufiabdominals.
Cultural Control
Late sowing of rice is recommended and application ofammonium sulphate and manure considered useful (Gristand Lever 1969). The practice of increasing the seedlingrate to compensate for crop loss has declined withincreased insecticide use (Grist and Lever 1969). Tanaka(1961) discussed other cultural practices.
Application of zinc @ 5-20 kg/ha in wheat cropenhanced the root aphid population, while phosphorusalone was found to suppress it (Verma et al. 1995).
Normal sowing of irrigated wheat (November) isrecommended, as late sown (December) received moreinfestation (Verma et al. 1995; Parsai and Shrivastava1997).
Biological Control
Natural enemies
Parasitoids
Aphelinus, attacking: nymphs, adults, in Japan
Aphidius, attacking: nymphs, adults, in China, Japan
Pathogens
Verticillium lecanii, attacking: nymphs, adults, in USA,Venezuela
The root-feeding location of R. rufiabdominalsmeans that it is relatively protected from the natural enemycomplexes that attack other economically importantaphids. Ding (1985) found 57.4-100% parasitism by abraconid parasite, Aphidius sp. in a study of upland ricein China. Miyahara et al. (1968) reported only low rates ofparasitism by Aphelinus sp. in upland rice in Japan.Coccinellids may be of minor importance in some areas,e.g. rice in Japan and Nigeria.
Effective control of R. rufiabdominals on squash ingreenhouses in Florida was obtained using the fungalpathogen Verticillium lecanii (Etzel and Petitt 1992). Littleinformation is available concerning natural enemies of thisaphid, largely due to its subterranean habitat. Yano et al.(1983) described natural enemies of rice aphids in general,some of which may be predators of varying degrees ofeffectiveness.
Botanicals
Amongst the botanicals, the application of neem oil @3.05 kg a.i./ha with irrigation water at 21 days after plantingfound to be the most effective in controlling R.rufiabdominals in wheat (Verma and Shrivastava 2000).
Chemical Control
Systemic insecticides are commonly used to control R.rufiabdominals. For example, oxydemeton-methyl,monocrotophos and dimethoate are used in potatoes inIndia (Misra et al. 1985). Granular formulation of carbofuranprovided the most effective control in rice in India(Majumdar and Dani 1983). However, chemical control inrice is not generally successful (Yano et al. 1983), exceptfor certain soil applications which also kill the associatedant fauna (Miyahara et al. 1968).
The application of chlorpyriphos @ 0.20 kg a.i./hawith irrigation water at 21 days after planting found to bethe most effective (ICBR: 17.14) in controlling R.rufiabdominals in wheat (Verma and Shrivastava 2000).
References
APPPC (1987) Insect pests of economic significance affectingmajor crops of the countries in Asia and the Pacificregion. Technical Document No. 135. Bangkok,Thailand: Regional FAO Office for Asia and thePacific (RAPA)
Becerra GFP (1994) Life cycle of the aphid Rhopalosiphumrufiabdominalis (Homoptera, Aphididae). Arroz 43(391): 34-37
171
Blackman RL, Eastop VF (1984) Aphids on the World'sCrops. An Identification and Information Guide.Chichester UK: John Wiley
Bodenheimer FS, Swirski E (1957) The Aphidoidea of theMiddle East. Israel: The Weizmann Science Pressof Israel 283-284
Chen C, Weng CH (1969) Studies on species and occurrenceof winged aphids on tobacco. Plant Prot Bull Taiwan11 (2): 71-76
Ciampolini M, Perna V di, Maiulini C, Di-Perna V (1993)Damage by root aphids to vegetable crops ingreenhouses in Lazio. Informatore Agrario 49 (24):59-63
CIE (1971) Distribution Maps of Pests. Series A (Agricultural)No 289. Wallingford UK: CAB International
CIE (1971) Distribution Maps of Plant Pests, No. 289.Wallingford UK: CAB International
Dani RC, Majumdar N (1978) Preliminary observations onthe incidence of root aphids on different ricecultivars. Sci and Cul 44 (2): 88-89
Ding HS (1985) A survey on the occurrence of root aphidsand their damage to upland rice. Insect Knowledge(Kunchong Zhishi) 22 (6): 255
Doncaster JP (1956). The rice root aphid. Bull Ent Res 47:741-747
Duviard D, Mercadier G (1973) Seasonal invasions of aphidsin cotton fields: origin and mechanics. Cotton etFibers Tropical 28 (4): 483-491
Etzel RW, Petitt FL (1992) Association of Verticillium lecaniiwith population reduction of red rice root aphid(Rhopalosiphum rufiabdominalis) on aeroponicallygrown squash. Florida Ent 75 (4): 605-606
Grist DH, Lever RJAW (1969) Pests of Rice. London UK:Longman
Hodjat SH (1984) Key to the species of Rhopalosiphum Kochand notes on Schizaphis Borner (Hom.:Aphidoidea)species in Iran. Ent Soc Iran 7 (1-2): 13-14, 57-79
Hsieh CY (1970) The aphids attacking rice plants in Taiwan(II). Studies on the biology of the red rice root aphid,Rhopalosiphum rufiabdominalis (Sasaki) (Aphidae,Homoptera). Plant Prot Bull Taiwan 12 (2): 68-78
Majumdar N, Dani RC (1983) Rice root aphids and theircontrol. Pranikee 4: 316-319
Melia A (1986) Contribution to the knowledge of the aphids(Homoptera, Aphidoidea) on agricultural and forestplants in Spain. Boletin de Sanidad Vegetal Plagas12 (2): 335-342
Misra SS, Nagia DK, Ram G (1985) Efficacy of systemicinsecticides against root aphid, Rhopalosiphumrufiabdominalis Sasaki on potato crop. Pesticides19 (10): 63-65
Misra SS, Parihar SBS (1983) Aphids on some host plantsduring winter around Simla. Indian Plant Prot. 11(1-2): 148-149
Miyahara Y, Kawahara S, Ueno N (1968) In-furrow treatmentsof aldrin and disyston for control of the rice root aphid,Rhopalosiphum rufiabdominalis Sasaki, in relationto the applied sites in soil. Procee Assoc PlantProtec Kyushu 14:31-34
Pai CGA, Prabhoo NR, Agarwala BK, Raychaudhuri DN(1980) Notes on a collection of root-infesting aphids(Homoptera: Aphididae) from Kerala, South India.Entomon 5 (3): 201-202
Paliwal YC (1980) Transmission of barley yellow dwarfisolates by the cereal root aphid Rhopalosiphumrufiabdominalis. Canadian J Plant Patho 2 (2): 90-92
Parsai SK, Shravastava SK (1997) Insect pests of wheat inMadhya Pradesh - A Review. Bhartiya KrishiAnushandhan Patrika 12 (3): 137-143
Rawat RR, Sahu HR (1970) Insect pests of wheat crop inMadhya Pradesh and their control. Farm J 11 (4):7-8
Singh CAK (1977) Rhopalosiphum rufiabdominalis Sasaki,an additional vector of maize mosaic virus in India.Sci and Cul 43 (1): 37
Singh J, Malhi SS, Sekhon SS, Chandi JS (1994) Record ofrice root aphid, Rhopalosiphum rufiabdominalis(Sasaki): on the roots of wheat in Punjab (India).Ent Res 18 (2): 175
Tanaka T (1961) The rice root aphids, their ecology andcontrol. Spec Bull. Coll Agric Utsunomiya 10:1-83
Torikura H (1991) Revisional notes on JapaneseRhopalosiphum, with keys to species based on themorphs on the primary host. Japanese J Ent 59 (2):257-273
Torikura H (1991a) Seasonal occurrence of some morphsof Rhopalosiphum spp. (Homoptera: Aphididae) onthe primary host in Hokkaido. Annual Report SocPlant Prot of North Japan 42: 114-116
Verma R, Shrivastava SK (2000) Effect of insecticides andmethods of application on the incidence ofRhopalosiphum rufiabdominalis (Sos.) on irrigatedwheat. Pestology 24 (12): 53-54
Verma, Rajesh, Shrivastava, SK, Parsai SK (1995)Assessment of losses and effect of culturalpractices on the incidence of root aphid,Rhopalosiphum rufiabdominalis (Sos.) in wheat. JInsect Sci 8 (2): 185-87
Yano K, Miyake T, Eastop VF (1983) The biology and economicimportance of rice aphids (Hemiptera: Aphididae):a review. Bull Ent Res 73 (4): 539-566
Genetic variability, heritability and genetic advance in arboreumcotton (Gossypium arboreum L.)
Rajani Bisen and G.K. KoutuKrishi Vigyan KendraDepartment of Plant Breeding & GeneticsJawaharlal Nehru Krishi Vishwa VidyalayaJabalpur 482 004 (MP)
Abstract
Forty five genotypes of arboreum cotton were evaluated inrandomized complete block design with three replicationsduring Kharif season in three subsequent years of 2004 to2006. Five competitive plants were randomly selected in eachgenotype, each replication and each environment forrecording observations on seed cotton yield / plant and itscomponent characters along with quality parameters. Themagnitude of genetic variability for each character differedfrom environment to environment and it was lower thancorresponding phenotypic variability for all the yieldcomponent characters and lint quality parameters in eachenvironment. Thus, the genotypic and phenotypic coefficientof variation recorded in pooled analysis over environmentsshowed the real heritable variation. Monopodia / plant,sympodia / plant, bolls / plant, ginning percentage and seedindex showed comparatively high estimates of genotypic andphenotypic coefficient of variation in pooled analysis. On theother hand, uniformity ratio, micronaire value, fibre strengthand fibre elongation exhibited comparatively low magnitudeof genetic variation. Majority of the characters showed highestimate of heritability. However, high values of geneticadvance as percentage of mean were recorded formonopodia / plant, seed index, ginning percentage andsympodia / plant.
Cotton is an important commercial crop of the countryand occupies a prime position as fibre crop of masses ofthe world. It plays an important role in the nationaleconomy in terms of contribution in trade, industrialactivities, employment and foreign exchange earnings inIndia (Gite et al. 2006). Keeping in view the future needs
of the country, cotton research needs to be versatile andaccelerated to develop more productive cotton genotypesfor various agro-ecological production areas of India. Thedevelopment of cultivars of Gossypium arboreum L. havinggreater yield potential with acceptable fibre characteristicsis one of the objectives of cotton breeder. Yield of cottonis affected by genetic and environmental factors, and thusinteraction between them makes it difficult to select theplants with increased yield. These factors contribute toseed cotton production both directly and indirectly andthe breeder is naturally interested in explaining the extentand type of association of such traits. Johnson et al. (1955)and Lerner (1958) have emphasized that heritabilityestimates when studied in conjunction with geneticadvance, would provide more appreciable information thanthe study of heritability alone. Singh (1981) studiedheritability and genetic advance for yield components withquality traits and observed high heritability with low geneticadvance for boll weight, seed index and ginning out turnin cotton. Khorgade and Ekbote (1986) found medium tohigh estimate of heritability for plant height, number ofsympodia, number of bolls per plant, seed index, lint index,ginning percentage and yield / plant in cotton. Highestimates of genetic advance have been reported byKhordade and Ekbote (1986) and Singh and Singh (1981)for plant height, number of bolls / plant, lint index, ginningpercentage, yield / plant in American cotton but no orlimited work has been done on arboreum cotton. In thepresent study, an attempt is, therefore, made to determinethe extent of heritable variation for yield components andfibre quality traits in newly developed genotypes ofGossypium arboreum in different environments as wellas over environments after deleting the genotypeenvironment interaction.
173
Table 1. Genotypic and phenotypic coefficients of variation for seed cotton yield, its component traits and quality parametersduring different years and over environments
Character Genotypic coefficient of variation Phenotypic coefficient of variation2004 2005 2006 Pooled 2004 2005 2006 Pooled
The present investigation was carried out at All IndiaCoordinated Cotton Improvement Project, Main Centre,JN Krishi Vishwa Vidyalaya, Regional Research Station,Khandwa, MP, India during Kharif Season in RandomizedComplete Block Design with three replications of threesubsequent years of 2004 to 2006. Forty five genotypesof cotton were selected on the basis of geographicaldiversity. The climate of the district Khandwa is subtropicalmoderate. The rainy season starts in the middle of theJune after commencement of South-West monsoon andlasts up to September. Soil of experimental site wasshallow to medium black with loamy to clay texture andpH of 7.4. The topography is rolling to undulating with lowwater retention capacity. The available nitrogen,phosphorus and potash is low, medium and highrespectively. Each genotype was grown in six row plot of5.0 m length. The data in respect of various characterswere analysed for analysis of variance using the methodgiven by Panse and Sukhatme (1967). Heritability in broadsense was calculated by the method given by Hanson etal. (1956) and genetic advance as percentage of meanby formula given by Johnson et al. (1955). Genotypic andphenotypic coefficients of variation were calculated usingthe formula given by Burton (1952).
Results and discussion
Analysis of variance revealed significant differences amongthe genotypes for all the studied characters including seedcotton yield, its component traits and quality parametersin each environment and pooled over environments.Genotypic coefficient of variation ranged from 2.5 to 42.04,2.21 to 42.57 and 2.45 to 40.09 per cent in threeenvironments. Uniformity ratio exhibited the lowestvariation, while lint yield / plant exhibited the highestgenetic variation in the present material. In general, theheritable variation was low to moderate for majority of thecharacters in all the environments. The phenotypiccoefficient of variation, ranging from 2.61 to 44.75, 2.61to 44.75 and 2.59 to 42.44 during 2004, 2005 and 2006,respectively, followed more or less similar trend togenotypic coefficient of variation (Table 1). The magnitudeof genetic variability for each character differed fromenvironment to environment. It may be due to existenceof differential genotype-environment interaction in varyingenvironments. The magnitude of genetic variability waslower than corresponding phenotypic variability for all theyield component characters and fibre quality parametersin each environment. It may also be due to the maskinginfluence of environmental factors in phenotypicexpression of individual character.
174
Table 2. Heritability and genetic advance as percentage of mean for seed cotton yield, its attributing characters and qualitytraits during different years and over years
Character Genotypic coefficient of variation Phenotypic coefficient of variation2004 2005 2006 Pooled 2004 2005 2006 Pooled
The estimates of genetic variability recorded overenvironments were lower in magnitude in comparison tothose computed in individual environment. It may beattributed due to the presence of genotype-environmentinteraction in the computation of genetic variability in eachenvironment (Johnson et al. 1955). Thus, the genotypicand phenotypic coefficients of variation recorded in pooledanalysis over environments are the real heritable variation.Monopodia / plant, sympodia / plant, bolls / plant, ginningpercentage and seed index showed comparatively highestimates of genotypic and phenotypic coefficient ofvariation in pooled analysis thus, offer good scope for theselection of desirable genotypes from the presentmaterial. On the other hand, uniformity ratio, micronairevalue, fibre strength and fibre elongation exhibitcomparatively low magnitude of genetic variation. Hence,the probability of selection for these quality characters islimited from present material.
Selection capacity of a population depends onheritable variation, measured as heritability in the presentstudy. The heritability estimates provide no indication onexpected genetic improvement that would result fromselection of best individual genotypes. Hence, theknowledge of genetic gain together with heritabilitybecomes more important. In this study, the estimate ofheritability was high, in general, for all the characters in
each environment (Table 2). It ranged from 60.50 to 99.50,70.70 to 98.50 and 35.80 to 97.70 during 2004, 2005 and2006, respectively. Similarly, genetic advance varied from4.98 to 83.41, 4.98 to 83.41 and 4.78 to 78.02 in threeenvironments. Seed cotton yield / plant, lint yield / plant,bolls / plant, monopodia / plant, sympodia / plant exhibitedcomparatively high heritability coupled with high estimatesof genetic advance as percentage of mean indicating thatthese traits are mainly under control of additive genes,hence, selection based on phenotypic performance ofthese characters will be more effective (Panse 1967).Uniformity ratio, fibre strength, fibre elongation, ginningpercentage and staple length showed high heritabilitycoupled with low genetic advance. It indicates that non-additive genes play major role in the inheritance of thesecharacters, thus, the direct selection based on thesecharacters will not be appropriate and reliable. Theseresults are in agreement with the findings of Girase andMehetere (2002), Pandey et al. (2002) and Kumari andChamundeswari (2005).
In the present study, majority of the charactersshowed high estimate of heritability. However, the highvalues of genetic advance as percentage of mean wererecorded for monopodia / plant, seed index, ginningpercentage and sympodia / plant. This indicates thepredominance of additive genetic variance in thephenotypic expression of these characters, thus, offer
175
good scope for direct selection. On the other hand, shortfibre index, staple length, fibre strength, oil percentageand seed cotton yield / plant showed high heritability withlow magnitude of genetic advance as percentage of mean.It revealed the existence of dominant genes or epistaticgene interaction in the phenotypic expression of thesecharacters. These characters can be improved followingselection-breeding methods such as diallel selectivemating, biparental mating and recurrent selection.Kowsalya and Raveendran (1996), Girase and Mehetere(2002) and Sambamurthy et al. (2004) have also reportedmore or less similar results based on their experimentsconducted in single environment. However, the presentstudy indicates the real picture of heritable variation; thus,the conclusions drawn are more reliable and realistic.
Thus, it can be concluded that characters viz.,monopodia / plant, sympodia / plant, bolls / plant, ginningpercentage and seed index showed high magnitude ofgenotypic and phenotypic coefficient of variation,heritability and genetic advance as percentage of meanover environments, thus, offer good scope for selection ofdesirable donors from present material. Boll weight, bolls/ plant, sympodia / plant, nodes / plant and monopodia /plant contribute towards seed cotton yield, while bolls /plant, boll weight, nodes / plant and first reproductivenodes / plant determine the lint yield over environmentshence, the indirect selection in the form of selectionindices based on these attributes may accelerate thegenetic gain for seed cotton yield and lint yield / plant inG. arboreum for rainfed farming.
References
Burton G W (1952) Quantitative inheritance in grasses Proc6th Intl Grassland Congr 1: 273-283
Girase VS, Mehetere SS (2002) Variability, heritability andgenetic advance studies in cotton (Gossypiumhirsutum L.) J Cotton Res Dev 16: 81-82
Gite VK, Misal M B, Kalpande HV (2006) Correlation and pathanalysis in cotton (Gossypium hirsutum L) J CottonRes Dev 20(1): 51-54
Johnson HW, Robinson HF, Comstock RE (1955) Genotypic,phenotypic correlations in soybean and theirimplication in selection Agron J 47: 477-483
Khorgade PW, Ekbote AP (1986) Path coefficient analysis inupland cotton. Indian J agric Sci 50:6-8.
Kowsalya R, Raveendran TS (1996) Genetic variability andD2 analysis in upland cotton Crop Res 12: 36-42
Kumari SR, Chamundeswari N (2005) Studies on geneticvariability, heritability and genetic advance in cotton(Gossypium hirsutum L.) Res Crops 6: 98-99
Evaluation of pearl millet genotypes for physiological efficiency andproductivity
M.S. Gurjar, A.S. Gontia, A.K. Mehta, Anubha Upadhyay and Sathrupa RaoDepartment of Plant PhysiologyJawaharlal Nehru Krishi VishwaVidyalayaJabalpur 482004 (MP)
JNKVV Res J 46(2): 176-181 (2012)
Abstract
The investigations were carried out at the experimental fieldof All India Co-ordinated Forage Improvement Project underDepartment of Plant Breeding and Genetics, JNKVV, Jabalpurduring the Kharif season of 2010-11. Results indicated thatGenotype AVTPM 4 possessed higher net photosynthesis(1.92 μmol/m2/s), a comparatively higher chlorophyll index(35.13 g/m2) resulted in a quite higher tiller number (2.68),cob number/plant (5.98), grain number/cob (989.66) and coblength (26.36 cm) reflected in highest grain yield (93.33 g/plant and 33.10 q/ha). AVTPM 5 was ranked second in yieldperformance (70.33 g/plant and 32.90 q/ha). GenotypesAVTPM 1 for higher chlorophyll index (35.61g/m2), protein(%) (9.72), CO2 utilization (29.93 ppm) and radiation useefficiency (0.0557 g/μmol/m2/s), AVTPM 3 - fat (%) (4.13),carbohydrate (%) (70.77) and fibre (%) (1.80), AVTPM 2 -PAR absorption (1203 μ mol/m2/s), Giant bajra - H2Outilization (6.42 KPa) and water use efficiency (0.48 μmol/mmol), may be utilized in a breeding programme for varietalimprovement.
Keywords: Photosynthetically Active radiation, radiationuse efficiency, water use efficiency
The productivity of a crop stand depends on its capacityfor photosynthesis, its photosynthesis area and the cropcanopy. The genetic variability of yield differencesamongst the cultivars may be related to some of thegrowth parameters, like net assimilation rate, crop growthrate, relative growth rate, leaf area index, specific leafarea, and leaf weight ratio and the partitioning of the drymatter into the sink. In graminaceous crops the grainyield is a product of grain weight per cob and cob numberper unit area. However any attempt to increase eitherone or both is compensated by proportional decrease inone or both the factor, hence the grain yield remainsunchanged over a wide range. Therefore, a physiologicalapproach to overcome this problem is a prerequisite.
The relationship between photosynthetic efficiencyand crop yield is a complex phenomenon. The yield is anintegrated effect of numerous physiological processes andmorphological components. The grain yield is mainlydependent on photosynthesis and utilization of its productby achieving better adaptation to many environmentalfactors including the hazards of diseases, lodging andrains.
In order to screen out the pearl millet genotypeshaving physiological superiority a physiological approachis needed. Efforts are also being made to identifyconstraints of productivity and ways to ameliorate them.Though few studies have been conducted on growthanalysis in pearl millet crop, scanty information isavailable with regards to influence of various physiologicaltraits and mechanisms viz., chlorophyll index,photosynthetic rate, stomatal conductance, water useefficiency and radiation use efficiency on economicproductivity in pearl millet. Keeping in view of the abovementioned facts the present investigations wereundertaken
Material and methods
The present investigations were carried out at theexperimental field of All India Co-ordinated ForageImprovement Project under Department of Plant Breedingand Genetics, JNKVV, Jabalpur during the Kharif seasonof 2010-11 in a Randomized Block Design (RBD)replicated thrice. The experimental material consisted of7 Pearl Millet genotypes viz.; Raj. Bajra chari 1 (G1), Giantbajra (G2), AVTPM 1(G3), AVTPM 2 (G4), AVTPM 3 (G5),AVTPM 4 (G6) and AVTPM 5 (G7).
The chlorophyll index was worked out by usingchlorophyll meter (Model-CCM 200), whereas the leaf areaindex (LAI) was quantified as per formula given by Gardneret al. (1985). The leaf area was recorded by using Laserarea meter (LI-300) whereas, the physiological traits viz.,
177
Table 2. Total dry weight (g/plant) of pearlmillet genotypes at successive growth intervalsGenotypes 30 DAS 45 DAS 60 DAS 75 DAS Mean
net photosynthesis, photosynthetic active radiationabsorption, H2O and CO2 utilization in photosynthesis andother physiological processes were recorded with the helpof infrared gas analyzer (IRGA) Li-Cor -6400 (Li Corinstruments USA) as per method suggested by Kannanet al. (2007). Radiation and water use efficiencies weredetermined as per unit of intercepted radiation as perspecifications of Sinclair and Muchow (1999), and Thakurand Kaur (2001), respectively.
Results and discussion
Chlorophyll index (g/m2)
The leaf serves the major photosynthetic organs of pearlmillet and much of the differences in the rate ofphotosynthesis was due to variation in leaf chlorophyllcontent. The photosynthetic capability of plant increasedwith increase in chlorophyll concentration. Chloroplastaccounts for 25% of total dry matter production and 40%of the total nitrogen of leaves (Bonner 1952). Thechlorophyll a/b was found to be correlated with the grainsdevelopment of a crop (Kongika and Mathis 1995). Thechlorophyll content had significant decrease due to water
stress than it corresponding control. The maximum leafchlorophyll content was achieved in young fully expendedleaf and gradually started to decline with the advancementof age and senescence Nair et al. (2006).
The investigations showed (Table 1) that thegenotype AVTPM 4 possessed the highest chlorophyllindex (35.13 g/m2) which reveals its higher photosyntheticefficiency as earlier investigations revealed a positivecorrelation between chlorophyll index and yield (Ghoshet al. 2000).
Net photosynthesis (μmol/m2/s)
The net photosynthesis was maximum at flowering stageand declined at pod development stage. The genotypesproduced higher seed yield also showed higher value forPn and stomatal conductance Kalpana et al. (2003). Therate of photosynthesis was positively correlated withstomatal conductance, rate of transpiration, leaftemperature and grain yield Singh et al. (1997). Theassimilates obtained through the photosynthesis are
stored only for a certain period of time in the plant butvery soon consumed in maintenance respiration andgrowth respiration to provide the energy for growth anddevelopment of structural components of plants Gardneret al. (1985).
Varieties significant at 100, 200, 300 and 400 ppmCO2 both stomatal resistance and mesophyll resistanceof diffusion of CO2 were different among genotypes Garyand Shibles (1970). Crop yield was closely related to netphotosynthesis assimilation throughout an entire season
178
Table 3. Leaf area index (LAI) of pearl millet genotypesduring successive growth intervalsGenotypes 45 DAS 60 DAS 75 DAS Mean
but instaneous measurement of photosynthesis may bemisleading increasing the rate of photosynthesis andtranslocation and enlarging the storage capacity byselection and breeding may bring large which increasesin yield Isreal (1982).
The investigations revealed (Table 4) that AVTPM4 (1.92 μmol/m2/s) possessed the highest netphotosynthesis over the other genotypes. The genotypeAVTPM 4 can be utilized in a breeding programme forevolving the varieties of higher photosynthetic efficiencies.
Photosynthetically active radiation (μmol/m2/s)
Agricultural systems are basically photosyntheticsystems and must be assessed for their efficiency inconversion of solar irradiance in terms of both primaryproductivity, useful and products. The morphologicalfeatures as characterized by geometrical structure of plant
communities, PAR interception and its utilization have agreat influence on the productivity which is an interactionbetween plants and environment through the modificationand interception of fluxes of radiation, heat, CO2 etc. ThePAR interception by the whole canopy was maximum inthe morning and afternoon during fruit development stageof the crops (Mukherjee et al. 2003).
The PAR indicates the wavelength range of light(400-700 nm) which can excite the chlorophyll moleculewhich results in release of electrons involved in productionof ATP and NADPH2 required for reduction of CO2 in thedark reaction of photosynthesis.
The present study revealed (Table 4) that AVTPM2 exhibited the highest (1203.0 μmol/m2/s) PAR uptake
which was attributed to higher LAI of the genotype (Table3), efficient canopy architecture and efficiency of absorbingtissues.
CO2 utilization (ppm)
The relationship between the daily net and gross canopyCO2 exchange rate and daily absorption of PAR werelinear. Higher daily net and gross CO2 exchange ratesand photomass value in the narrow spaced canopies wereattributed to a greater quantity of daily absorbed PARthrough the season rates than difference in the efficiencyof the various canopy structure (Wall et al. 2000).
The earlier studies indicated that the daily averagenet photosynthesis increased by 20.8 and 29.7% at theearly stage under CO2 levels of 550 and 750 μmol/m2/scompared with the ambient air CO2 concentration Lin etal. (2005).
179
Table 5. Yield and its components of pearl millet genotypes
Genotypes Plant height Number of Number of Number of Cob length Grain yield(cm) tillers/plant cobs/ plant grains/ cob (cm) (g/plant) (q/ha)
In the present investigations (Table 4) genotypeAVTPM 1 (29.93 ppm) was found to be associated withmaximum CO2 use a positive character for breedingpurpose. Giant bajra (18.29 ppm) possessed the minimumCO2 utilization. The genotypes produced higher seed yieldshowed higher values for CO2 utilization Kalpana et al.(2003).
H2O Utilization (KPa)
H2O utilization is associated with enzymatic reactionsrequired for every physiological mechanism. Low H2O usemay results in retardation of electron transport processneeded for production of ATP and NADPH2 which arerequired for CO2 reduction in dark reaction ofphotosynthesis.
The water has been found to be an importantconstituent of plant system influencing the kinetics ofbiochemical reactions through enzyme activation. Theelectrons which are required for CO2 reduction inphotosynthesis are also obtained from water. In thepresent study (Table 4) genotype Giant bajra (6.42 KPa)
exhibited the highest water utilization resulted in maximumdry matter yield. On the other hand minimum wasregistered in AVTPM 1 (3.52).
Radiation use efficiency (g/μmol/m2/s)
Radiation use efficiency in crops is determined as drymatter produced per unit of intercepted radiation, can beefficiently used in the analysis of crop growth andcalculation of crop simulation models. Radiation sueefficiency is often modulated on the basis of currentspecific leaf nitrogen (SLN g N/m2 of leaf area) averagedfor the canopy Sinclair and Muchow (1999) observed inexploring the significance of N gradients on the relationshipbetween radiation use efficiency and average canopy SLNthe specification which scales from photosynthesis atradiation use efficiency which is approximately constantfor forest and natural ecosystem, and particularly for cropswhen growth is not limited by water or nutrient shortageefficiency of metabolic and other processes that determineradiation use efficiency Ruimy et al. (1995).
180
The present study revealed (Table 4) that thegenotype AVTPM 1 (0.0557) exhibited the highestradiation use efficiency which was attributed to the higherdry matter production by the genotype (Table 2) relativeto the magnitude of PAR uptake. This genotype can beused for evolving the pearl millet genotypes having higherradiation use efficiency. AVTPM 4 (0.0331) registered theminimum.
Water use efficiency (mol/mmol)
Identification of genotypes that have a greater ability touse limited water and tolerate higher temperature isimportant to enhance productivity of the crop. Water useefficiency is an important trait which can contribute toproductivity when water resources are scare Babitha etal. (2006). It has been proved to be an important traitparticularly in adverse environmental conditions.Screening of genotypes for higher water use efficiency isa need of the day. In the present experiment (Table 4)Giant bajra (0.48) was found to be associated with higherwater use efficiency revealing its drought resistantcharacteristics and suitability for drought sensitive areas.On the other hand AVTPM 2 (0.28) recorded theminimum.
Grain yield
Grain yield in cereals depends on number of cobs/plant,number of grains/cob. It has been observed that if anattempt is made to increase one component, there iscompensatory decrease in other component and yieldremains more or less same suggesting that there is somemechanism operating in plant system which is acting asconstraints in controlling the productivity.
The present investigation revealed (Table 5) thatgenotype AVTPM 4 outyielded (93.33 g/plant and 33.10q/ha) other genotypes for grain owing to its higher numberof tillers/plant (2.68), number of cobs/plant (5.98), numberof grains/cob (989.66) and cob length (26.36cm). AVTPM5 (70.33 g/plant and 32.90 q/ha) stood second in yieldperformance which may be attributed to its highest coblength (26.50 cm) and a quite higher number of grains/cob (989.66). Rajbajra chari 1 possessed the minimum(48.33 g/plant and 31.08 q/ha) grain yield owing to anaverage performance of yield components. A highestnumber of tillers/plant (3.00) in AVTPM 3, number of cobs/plant (6.27) and number of grains/ear (997.0) in Giantbajra did not contribute in higher grain productivity which
may be attributed to their less 1000 grain weight.
The quantification of seed quality characteristicsindicated variable response. Maximum protein content(Table 6) was registered in genotype AVTPM 1 (9.72%),fat (4.13%), fibre (1.80%) and carbohydrate in AVTPM 3(70.77) and ash in Rajbajra chari (4.65%).
Conclusions
Thus the investigations revealed that Genotype AVTPM4 possessed higher net photosynthesis (1.92 μmol/m2/s), a comparatively higher chlorophyll index (35.13 g/m2)resulted in a quite higher magnitudes of tiller number(2.68), cob number/plant (5.98), grain number/cob (989.66)and cob length (26.36 cm), which in turn had reflected inhighest grain yield (93.33 g/plant and 33.10 q/ha). AVTPM5 was ranked second in yield performance (70.33 g/plantand 32.90 q/ha). Genotypes AVTPM 1 for higherchlorophyll index (35.61g/m2), protein (%) (9.72), CO2utilization (29.93 ppm) and radiation use efficiency (0.0557g/μmol/m2/s), AVTPM 3 - fat (%) (4.13), carbohydrate(%) (70.77) and fibre (%) (1.80), AVTPM 2 - PARabsorption (1203 μmol/m2/s), Giant bajra - H2O utilization(6.42 KPa) and water use efficiency (0.48 μmol/mmol)may be utilized in a breeding programme for varietalimprovement.
Bahbita M, Sudhkar P, Latha P, Reddy PU, Vasanthi RP (2006)Screening of groundnut genotypes for higher wateruse efficiency and temperature tolerance. Indian JPlant Physiol 11 (1) : 63-74
Bonner E (1952) Formation of nodules on S Lispicta M,Devoid of specific strain of Rhizobium. Bull InstAgron Gen Bloux 18: 218-219
Gardner FP, Pearce RB, Mitchell RL (1985) Growth anddevelopment In Physiology of Crop Plants. The IowaState Uni Press 187-208
Gary M Dornhoff, Shibler RM (1970) Study the varietaldifferences in net photosynthesis of soybean leaves.Crop Sci Soc America 10 : 42-45
Ghosh D, Thapliyal Thangamni Manisha, Yasodhai R,Gurumurthi K (2000) Solution of Androgrphispaniculata leaf protein with Antifugal property. Actaphytopatho Entomol Hungarica 4(29): 37 -329
Isreal (1982) Investigation of the role of phosphorus insymbiotic nitrogen fixation. Plant Physiol 84: 835-840
Kalpana M, Chetti MB, Ratnum BP (2003) Phenologicalchanges in photosynthetic rate, transpiration andstomatal Conductance and their relationship withseed yield in cowpea. Indian J Plant Physiol 8(2) :160-164
Kannan CS, Warrier Ganesan M, Venkataramanan KS (2007)Gas exchange characteristics in casurina clones.Indian J Plant Physiol 12 (1) : 83-87
Kongiika E, Mathis P (1995) Photosynthetic characteristicsof some varieties and mutants of wheat as the yieldcomponents Photosynthesis from light to biosphere.V Proc Xth Int Photosynthe Cong Montpelli France20-235 August pp 801-804
Lin WX, Wu ZP, Lin JX (2005) High yielding cultivationtechnology of rice. J Fujian Agric Col 18 (30) : 269-274
Mukherjee J, Sastri CVS (2003) PAR distribution and radiationuse efficiency in tomato crop canopy. J Agrometeo5(2) : 62-67
Nair NC, Padmakumari G, Koshi MM (2006) The responseof two high yielding varieties of rice to NPKapplication in acid peat soil of Kerala. Agri Res JKerala 7 : 10-13
Ruimy A, Jarvis PG, Baldocchi DD, Saugier B (1995) CO2fluxes over plant canopies and solar radiation. AdvEcol Res 26 : 1-68
Sinclair TR, Ludlow MM (1986) Influence of soil water supplyon the plant water balance of four tropical grainlegumes. Aust J Plant Physiol 13 : 329-341
Singh SP, Ram RS, Lal KB, Singh GS (1997) Physiologicalvariability and inter relationship in chickpea. AgriSci Dig 17 : 97-100
Thakur PS, Kaur H (2001) Variation in photosynthesis,transpiration, water use efficiency, lighttransmission and leaf area index in multipurposeagroforestry tree species. Indian J Plant Physiol 6(3): 249-255
Wall SW, Kanemasu ET (2000) Carbon dioxide exchangerates in wheat canopies. J Agril For meteorol 49(2): 103-122
Genetic diversity among 196 rabi Sorghum (Sorghum Bicolor)genotypes and landraces of Maharashtra State was studiedwith checks for quantitative characters to study geneticdiversity employing D² analysis with respect to grain yield and13 cluster and 3 ungrouped genotype, namely RSLG-568,RSLG-589, RSLG-679 belongs to three ungrouped clusterXIV to XVI. The D² statistic showed that there was adequatediversity among the genotypes with D² values ranging from7.73 to 723.97 . Clustering pattern of these genotypes did notnecessarily follow the geographical distribution. On the basisof path analysis, inter cluster distances, cluster means, andper se performance observed in the present study, genotypesRSLG-573, RSLG-575, RSLG-679, RSLG-579, RSLG-574,RSLG-581, RSLG-628, RSLG-568, RSLG-679, RSLG-587,RSLG-740, RSLG-589, RSLG-734 and RSLG-654 were foundto be overall superior genotypes for hybridization programme.
Keywords : Genetic diversity, Sorghum, Cluster
So for breaking this barrier and increasing the food grainproduction, we have to look at the dry land agriculturefor the second green revolution. Sorghum cultivationhas been the heart of dry land agriculture from yearstogether. Being a C4 plant, it can utilize sunlight andwater very efficiently.
These and other specialized physiological features,make it a drought resistant species. It is also called as“Camel of plant world”. Genetic divergence which is dueto genetic factors is the basis for heritable improvement.The plant breeder have always, therefore beenfascinated great amount of diversity in crop plants. Theprecise information about the genetic divergencetherefore, is crucial for productive breedingprogramme.The genetically diverse parents are knownto produce high heterotic effects and consequently givedesirable recombinants in the breeding material or widespectrum of transgress segregates in segregating
generation. Multivariate analysis (D² statistic) is measurethat asses the genetic variability quantitatively among aset of genotypes ( Rao 1952). Thus, present investigation, attempt has been made to study the nature of diversityamong the 196 genotypes of rabi sorghum and theirsuitability for hybridization programme obtained fromdifferent parts of Maharashtra.
Material and Method
An experiment material for the present investigationconsist of 196 different germplasm of rabi sorghumavailable with Senior Sorghum Breeder, SorghumImprovement Project, MPKV, Rahuri which are collectedfrom the different places of of major Sorghum trade ofMaharashtra state along with three checks i.e. PhuleChitra, Vasudha and M-35-1 in 14 × 14 double latticedesign during rabi 2008-09 with two replications atSorghum Improvement Project, MPKV, Rahuri. All theagronomic practices were followed to raise the crop.Observations were recorded 14 different charactersthose are yield and yield contributing traits from eachplots ten randomly plants were tagged for takingobservation. The analysis was done followed by D²statistic proposed by Mahalnobis (1928, 1936 )clustering of genotypes was done by Tauscher’s methodas described by Rao (1952).
Results and Discussion
In this present study V ( Stat ) calculated for D2 analysisand tested by via significant differences between themeans in respect of the pooled effect of 14 thecharacters among 196 genotypes under study. Therange of D2 value was from 7.73 (between genotypesRSLG-709 and RSLG-725 and 723.97 (betweengenotypes RSLG-655 and RSLG-726) presenting in Table-
Genetic divergence in rabi sorghum [Sorghum bicolor (L)Moench] landraces
A.M. Langhi, S.B. Chaudhary, L.L. Mane, A.R. Gaikwad and U.C. DhageAgricultural Research Station SavalvihirMahatma Phule Krushi VidyapeethRahuri 413722 (India)
183
1. Narkhede et al. (2000b) reported that D2 range as from35.69 to 15270.60. Kadam et al. (2001) found D2 rangefrom 0.856 to 70.13. Patankar et al. (2005) found D2 rangefrom 35.37 to 7956.40.
In present investigation, one hundred ninety sixgenotypes were grouped into sixteen clusters (Table No1.) The cluster I was the highest number of genotypesi.e. 56 followed and maximum intracluster distance(100.82) indicating diversity within the group but not tothe extent so that they can from separate cluster as thisexisted genetic similarities among themselves on thebasis of multiple characters causing them to belong intoa single cluster and cluster II (36), III (34) IV (21), V(10), VI (9), VII (7), VIII (6), IX (4), X (3), XI (3), XII (2)and XIII (2) and remaining clusters were solitary. Themaximum distance (204.10) was observed betweencluster 14 & 16 (Table- 3) with contrasting meanperformance for stem diameter , leaf length, plant height,time of panicle emergence, panicle length, 100 grainweight and grain yield compared to the meanperformance of genotypes (Table-2). Among thegenotypes that could be grouped is to 13 different clusterthe maximum inter-cluster distance (331.50) wasobserved between cluster 6 and 13 which exhibitingcontrasting mean performance for the character plantheight , time of panicle emergence ,panicle length, 1000grain weight and grain yield/plant. The next higher intercluster distance (323.20) was observed between cluster3 & 13 were as the smallest inter cluster distance (84.38)was observed between 4 & 8 they exhibited thedifference in performance with plant height , time ofpanicle emergence ,panicle length, 1000 grain weightand grain yield/plant. Sarawate (1985) grouped twentytwo genotypes in fourteen cluster while Barhate (1996)grouped fifty genotypes into thirteen and sixteen clustersunder light and medium soil conditions respectively.Hendre (1998) grouped seventy-five genotypes intonine clusters. Narkhede (2000a) grouped sixty-fourgenotypes into nineteen clusters. Patankar et al. (2005)grouped forty-one genotypes in to ten clusters.
The characters which contributed maximumtowards the total diversity in the present study werepanicle length (18.55), time of panicle emergence (3.58),length of branches of panicle (25.11), plant height(3.86), 1000 seed weight (10.47) and grain yield perplant (33.22) were the measures contributing towardsthe genetic divergence in one hundred ninety sixgenotypes of sorghum.
Source Times ContributionRanked (%)
1stDays to maturity 15 0.08%Stem diameters 211 1.10%No. of leaves/plant 278 1.45%Leaf length (cm) 48 0.25%Leaf width (cm) 128 0.67%Plant height 738 3.86%No. of internodes/plant 102 0.53%Time of panicle emergence 685 3.58%Panicle length (cm) 3544 18.55%Panicle width (cm) 71 0.37%1000 seed weight (g) 2000 10.47%Length of branches of panicle 4799 25.11%Incidence of shoot fly 143 0.75%Grain yield/plan (g) 6348 33.22%
Similar results were reported by Sisodia et al.(1983) for days to maturity and plant height; Sarawate(1985) for plant height and seed weight, Barhate (1996)for 1000 seed weight, plant height and flag leaf area;Hendre (1998) for plant height, 1000 seed weight andgrain yield; Narkhede et al. (2000a) for 1000 grain weight,plant height and panicle length; Umaknath et al. (2002)and Patankar et al. (2005) for plant height and grain yield.
Characters Source (clusters) No. of genotypes Name of genotypesDays to maturity XII, VVI, VIII 4 RSLG-573, 575, 679, 579Time of panicle emergence XII, XVII, IV 5 RSLG-573, 575, 574, 581, 628No. of internodes per plant XIII, XIV, XVI 4 RSLG-574. 581, 568, 679Panicle length XI, XV, VIII 4 RSLG-587, 740, 589, 734No. of leaves /plant XV, XI, XII 5 RSLG-589, 587, 740, 573, 575Length of branches of panicle XV, XVI, XI 4 RSLG-589, 679, 587, 740Leaf width XIV, XIII, VI 4 RSLG-568, 574, 581, 654
184
Clu
ster
1C
lust
er 2
Clu
ster
3C
lust
er 4
Clu
ster
5C
lust
er 6
Clu
ster
7C
lust
er 8
Clu
ster
9C
lust
er 1
0C
lust
er 1
1C
lust
er 1
2C
lust
er 1
3C
lust
e r 1
4C
lust
er 1
5C
lust
er 1
6
RSL
G-5
55R
SLG
-583
RSL
G-5
61R
SLG
-564
RSL
G-5
56R
SLG
-552
RSL
G-5
72R
SLG
-601
RSL
G-5
57R
SLG
-558
RSL
G-5
87R
SLG
-573
RSL
G-5
74R
SLG
-568
RSL
G-5
89R
SLG
-67 9
RSL
G-5
59R
SLG
-590
RSL
G-5
67R
SLG
-582
RSL
G-5
70R
SLG
-554
RSL
G-5
79R
SLG
-684
RSL
G-6
04R
SLG
-594
RSL
G-7
40R
SLG
-575
RSL
G-5
81R
SLG
-562
RSL
G-5
92R
SLG
-593
RSL
G-6
14R
SLG
-571
RSL
G-5
85R
SLG
-653
RSL
G-6
86R
SLG
-656
RSL
G-6
87R
SLG
-749
RSL
G-5
65R
SLG
-595
RSL
G-5
97R
SLG
-619
RSL
G-5
77R
SLG
-638
RSL
G-6
55R
SLG
-731
RSL
G-7
57R
SLG
-566
RSL
G-6
11R
SLG
-603
RSL
G-6
24R
SLG
-578
RSL
G-6
50R
SLG
-678
RSL
G-7
32R
SLG
-576
RSL
G-6
12R
SLG
-606
RSL
G-6
28R
SLG
-580
RSL
G-6
51R
SLG
-715
RSL
G-7
34R
SLG
-584
RSL
G-6
13R
SLG
-607
RSL
G-6
33R
SLG
-630
RSL
G-6
54R
SLG
-758
RSL
G-5
86R
SLG
-615
RSL
G-6
08R
SLG
-652
RSL
G-6
57R
SLG
-759
RSL
G-6
02R
SLG
-618
RSL
G-6
09R
SLG
-662
RSL
G-7
55R
SLG
-767
RSL
G-6
05R
SLG
-620
Che
ck-1
RSL
G-6
69R
SLG
-756
RSL
G-6
16R
SLG
-623
RSL
G-6
22R
SLG
-682
RSL
G-6
17R
SLG
-625
RSL
G-6
32R
SLG
-689
RSL
G-6
21R
SLG
-626
RSL
G-6
34R
SLG
-693
RSL
G-6
31R
SLG
-627
RSL
G-6
36R
SLG
-696
RSL
G-6
35R
SLG
-645
RSL
G-6
39R
SLG
-702
RSL
G-6
37R
SLG
-646
RSL
G-6
41R
SLG
-707
RSL
G-6
42R
SLG
-648
RSL
G-6
44R
SLG
-708
RSL
G-6
43R
SLG
-661
RSL
G-6
58R
SLG
-717
RSL
G-6
47R
SLG
-663
RSL
G-6
68R
SLG
-725
RSL
G-6
49R
SLG
-671
RSL
G-6
72R
SLG
-728
RSL
G-6
64R
SLG
-674
RSL
G-6
73R
SLG
-744
Che
ck-2
RSL
G-6
75R
SLG
-677
RSL
G-6
66R
SLG
-676
RSL
G-6
88R
SLG
-670
RSL
G-6
90R
SLG
-691
RSL
G-6
80R
SLG
-700
RSL
G-6
92R
SLG
-681
RSL
G-7
06R
SLG
-695
RSL
G-6
83R
SLG
-711
RSL
G-7
19R
SLG
-685
RSL
G-7
23R
SLG
-722
Tab
le 1
. C
ompo
sitio
n of
196
Sor
ghum
gen
otyp
es in
to 1
6 di
ffere
nt C
lust
ers
as p
er M
ahal
nobi
s D
2 Sta
tistic
s (1
936)
Clu
ster
1C
lust
er 2
Clu
ster
3C
lust
er 4
Clu
ster
5C
lust
er 6
Clu
ster
7C
lust
er 8
Clu
ster
9C
lust
er 1
0C
lust
er 1
1C
lust
er 1
2C
lust
er 1
3C
lust
er 1
4C
lust
er 1
5C
lust
er 1
6R
SLG
-694
RSL
G-7
24R
SLG
-727
RSL
G-6
97R
SLG
-729
RSL
G-7
35R
SLG
-698
RSL
G-7
30R
SLG
-736
RSL
G-6
99R
SLG
-738
RSL
G-7
37R
SLG
-701
RSL
G-7
39R
SLG
-743
RSL
G-7
03R
SLG
-741
RSL
G-7
54R
SLG
-704
RSL
G-7
46R
SLG
-705
RSL
G-7
63R
SLG
-709
RSL
G-7
10R
SLG
-712
RSL
G-7
13R
SLG
-714
Cha
ck-3
RSL
G-7
16R
SLG
-718
RSL
G-7
21R
SLG
-747
RSL
G-7
48R
SLG
-750
RSL
G-7
51R
SLG
-752
RSL
G-7
53R
SLG
-760
RSL
G-7
62R
SLG
-764
RSL
G-7
65R
SLG
-766
Clu
ster
1C
lust
er 2
Clu
ster
3C
lust
er 4
Clu
ster
5C
lust
er 6
Clu
ster
7C
lust
er 8
Clu
ster
9C
lust
er 1
0C
lust
er 1
1C
lust
er 1
2C
lust
er 1
3C
lust
e r 1
4C
lust
er 1
5C
lust
er 1
656
3634
2110
97
64
33
22
11
1
185
Ta
ble
2. C
lust
er m
ean
perfo
rman
ce
Inci
denc
eS
tem
No.
of
Leaf
Leaf
Pla
ntN
o. o
fTi
me
ofP
anic
leP
anic
leD
ays
to10
00 s
eed
Leng
th o
fG
rain
Cha
ract
ers
of s
hoot
diam
eter
leav
es/
leng
thw
idth
heig
htin
tern
odes
/pa
nicl
ele
ngth
wid
thm
atur
ityw
eigh
tbr
anch
es o
fyi
eld/
flypl
ant
(cm
)(c
m)
(cm
)pl
ant
emer
genc
e(c
m)
(cm
)(g
)pa
nicl
epl
ant
CL-
148
.22
1.71
9.64
63.7
66.
6717
0.73
8.63
79.7
117
.26
8.49
128.
2535
.59
5.80
62.3
6C
L-2
47.0
61.
719.
7564
.97
7.08
193.
788.
5379
.19
16.4
28.
5712
6.61
35.6
55.
8756
.21
CL-
348
.06
1.75
9.44
66.6
07.
0218
4.65
8.97
79.8
516
.54
8.00
128.
2136
.48
5.81
81.0
0C
L-4
42.5
11.
759.
8664
.03
7.05
174.
718.
9074
.76
17.6
08.
6512
9.14
34.0
15.
8837
.25
CL-
543
.51
1.68
9.80
65.3
27.
2113
8.20
8.00
77.0
013
.56
7.78
129.
2035
.88
5.97
70.7
4C
L-6
39.7
91.
859.
0066
.56
8.18
163.
448.
7883
.56
15.6
18.
7112
9.44
35.1
15.
5984
.96
CL-
747
.34
1.64
7.86
61.2
77.
2715
4.86
8.43
85.2
916
.16
8.57
123.
2938
.61
5.18
37.5
7C
L-8
58.4
31.
658.
8365
.00
6.63
205.
508.
5076
.00
17.6
38.
4712
9.00
33.6
66.
1937
.17
CL-
965
.20
1.69
9.00
63.2
07.
0814
8.50
7.50
84.5
016
.08
8.35
131.
0033
.37
5.39
72.8
5C
L-10
36.6
11.
699.
3365
.80
7.50
197.
338.
0085
.00
15.3
08.
5312
6.00
39.0
15.
3631
.27
CL-
1174
.97
1.57
11.0
062
.27
7.53
184.
676.
3378
.67
19.8
38.
3312
4.00
32.5
96.
3643
.20
CL-
1252
.21
1.68
10.0
076
.55
7.05
129.
008.
0071
.00
10.0
08.
9012
3.00
40.2
95.
6651
.60
CL-
1334
.83
1.17
8.50
70.4
58.
6014
8.00
9.00
71.0
012
.90
7.70
127.
5051
.58
5.94
54.5
0C
L-14
58.9
02.
068.
0083
.40
9.40
155.
009.
0086
.00
11.7
08.
2013
8.00
50.2
05.
4088
.80
CL-
1582
.93
1.52
12.0
072
.40
7.10
224.
008.
0080
.00
17.9
09.
8012
6.00
45.2
16.
8075
.20
CL-
1650
.44
1.78
9.00
56.2
07.
2027
2.00
9.00
79.0
017
.10
10.0
012
3.00
35.3
66.
4083
.40
Gra
nd m
ean
51.9
31.
689.
4466
.74
7.41
177.
778.
3579
.41
15.7
28.
5712
7.60
38.2
95.
8560
.50
Ta
ble
3. In
tra a
nd In
ter c
lust
er D
2 val
ues
C
L-1
CL-
2C
L-3
CL-
4C
L-5
CL-
6C
L-7
CL-
8C
L-9
CL-
10C
L-11
CL-
12C
L-13
CL-
14C
L-15
CL-
16
CL-
110
0.82
4211
4.67
9112
9.93
9913
5.03
2113
2.99
1713
7.44
0518
1.43
2113
8.83
312
2.05
0216
5.35
4511
9.45
2317
7.65
9126
3.48
517
0.44
4511
4.62
2722
1.71
38C
L-2
11
6.21
1715
3.94
1512
4.65
8814
7.05
0717
0.70
5318
5.02
9211
7.28
9915
7.18
3714
3.54
2112
0.70
1919
8.74
0827
9.41
5721
6.38
1913
0.21
9420
9.67
CL-
3
11
5.06
6822
2.86
1617
9.23
711
4.90
8728
4.19
9822
0.05
0313
5.73
0926
9.62
2618
5.09
1524
1.94
9432
3.20
0714
9.95
9792
.712
3517
1.69
71C
L-4
84
.355
614
8.24
3324
4.78
6514
1.36
1284
.389
620
1.40
497
.114
110
7.95
6817
6.08
2926
7.15
9329
6.35
3320
8.77
0531
4.83
14C
L-5
152.
8342
151.
0212
224.
0326
225.
9445
131.
5533
230.
2447
195.
715
123.
566
241.
062
142.
861
176.
005
352.
01C
L-6
11
1.71
2529
2.27
0225
4.32
312
5.40
7829
0.00
0420
9.91
6723
5.13
331.
5061
133.
7112
1.81
8920
3.81
11C
L-7
150.
3695
150.
3598
212.
1936
118.
3416
0.09
5717
9.52
5725
7.71
527
0.90
4327
7.61
7144
9.98
CL-
8
81.3
4621
0.66
6392
.683
810
1.22
5621
4.08
3329
4.13
7531
1.70
6718
9.72
6726
6.73
5C
L-9
119.
1117
235.
7825
151.
5725
179.
285
304.
8113
135.
9975
144.
1375
289.
0425
CL-
10
81.3
214
2.78
4418
0.71
523
5.12
8329
5.74
6724
6.16
6736
7.52
67C
L-11
85.2
321
6.79
8330
3.57
1726
3.51
6714
8.23
258.
1667
CL-
12
83.2
717
3.23
2516
5.91
249.
1650
1.14
5C
L-13
288.
7520
4.10
527
6.78
552
4.72
5C
L-14
0
117.
7832
5.01
CL-
15
0
95.1
1C
L-16
0
186
Relative Contribution of different characters towardsgenetic divergence
Taking into account the path analysis, cluster means,cluster distances and per se performance, the variousclusters which can provide the desired parents forhybridization for improvement in characters and highyielding genotypes are listed below.
The clustering pattern indicating wide diversitybetween different groups of genotypes. The grater thedistance between two cluster, wider the expectedgenetic distance between the genotype. Therefore,identification of genetic diverse genotype would help inselecting desirable parents for hybridization programme.
In the present study hybridization betweengenotypes having higher inter D-distance and pathanalysis are expected to generate exploitable variabilityfor the improvement in the yield and yield relating traitsas well as are likely to through desirable transgresssegregates in later generation of hybridization, pathanalysis, inter cluster distances, cluster means, and perse performance observed in the present study,genotypes RSLG-573, RSLG-575, RSLG-679, RSLG-579, RSLG-574, RSLG-581, RSLG-628, RSLG-568,RSLG-679, RSLG-587, RSLG-740, RSLG-589, RSLG-734 and RSLG-654 were found to be overall superiorgenotypes for hybridization programme. If they are utilizedinto multiple crossing programme would yield promisingresult in bringing together different desirable gene intothe common genetic background.
References
Kadam DE, Patil, FB, Bhor TJ, Harer PN(2001) Geneticdiversity studies in sweet sorghum. J Maharashtraagric Univ 26 (2) : 140-143
Mahalanobis PC (1928) A statistical studies of Chinese headmeasurement. J Asiatic Soc Bengal 25 : 301-377
Mahalanobis PC (1936) On generalized distance in statistics.Procd Nat Inst Sci India 2 : 49-55
Patil RC, Thombre MV, Patil FB ,Dumbre AD (1993) Geneticdiversity in sorghum. J Maharashtra agric Univ 8 (1): 141-142
Rao CR(1952) Advanced statistical methods in biometricresearch. John Wiley & Sons Inc New Delhi.
Sarawate DC(1985) Genetic analysis of yield and yieldcontributing characters in sorghum. Study of geneticdivergence in sorghum. MSc (Agri) thesis MPKVRahuri
Sisodia NS, Henry A , Gupta YK(1983) Genetic divergence ingrain sorghum. Madras agric J 70 (10) : 678-680
To understand the association of yield and yield contributingto each other 196 genotypes including three check varietieswere evaluated in 14 X 14 double Lattice design. The data of10 random plants of each genotype were recorded on 14quantitative characters, including grain yield and its componentcharacters. The phenotypic coefficient of variation was highfor most of the characters especially, incidence of shoot fly(21.89), panicle width (21.79) length of branches of panicle(21.34) and grain yield per plant (27.59).Correlation co-efficientanalysis reveled that, the days to maturity at genotypic levelshowed significant and positive correlation with grain yield .Path coefficient analysis days to maturity traits that showedhighest positive direct effect towards the grain yield
Keywords: Correlation, Path analysis, Sorghum
Sorghum is an important food crop for dry land area.Grain yield of Sorghum is a complex character affecteddirectly or indirectly by every gene present in plant .Genotypic and phenotypic correlation indicates thedegree is which various morpho-physiologicalcharacters are associate with economic productivity.Expression of complex traits yield upon theinterrelationship of the component traits . The selectionprogramme for high
Yield requires not only the understanding aknowledge of the variability present in the germplasm /landraces of the crop, but also the association andcontribution of various plant attributes which grain yieldtherefore in the present investigation we have shortlisted important traits which have among associationwith grain yield . Hence, an attempt was made to study14 quantitative characters, their correlations and effectson 196 genotypes of rabi sorghum. Since beginning ofagriculture, cultivated crops have been subjected tointensive natural and human selections and the trendcontinues. This has resulted in huge collection ofdifferent crop species, land races and varietiesdistributed throughout the world, which comprisesvaluable germplasm collection. Information regarding
genetic variability present in a population and estimatesof heritability are prerequisites for improvement of anycrop.
Material and methods
An experiment material consist of 196 differentgermplasm of rabi sorghum available with SeniorSorghum Breeder, Sorghum Improvement Project,MPKV, Rahuri which are collected from the differentplaces of major rabi Sorghum growing area ofMaharashtra state and the material was evaluated in14 × 14 double lattice design with three checks i.e. PhuleChitra, Vasudha and M-35-1 during rabi 2008-09 withtwo replications at Sorghum Improvement Project,MPKV, Rahuri. Recommended cultural practices werefollowed to raise good crop of Sorghum. Observationson qualitative difference 14 characters on ten randomlyselected plants. The appropriate variances and co-variances were used for calculating phenotypiccorrelation coefficient (Johnson et al. 1955) and toestablish the cause and effect relationship, thegenotypic and phenotypic correlation coefficients werepartitioned in to direct and indirect effects by pathanalysis as suggested by De Way and Lu (1959).
Results and Discussion
The analysis of variance for fourteen quantitativecharacter present in Table-1. The mean squares due toall characters studied were highly significant Suggestingthe presence of undesirable variability for differentcharacters among Sorghum accession underinvestigation. The estimates of phenotypic co-efficientof correlation among the 14 character are presented inTable-2. The correlation co-efficient were calculated forall possible pairs of 14 characters giving rise to a totalof all pairs of characters, only 66 combinations ofcharacters, the correlation co-efficient were notsignificant suggesting that such characters are notassociate and selection for one trait will not be effect this
JNKVV Res J 46(2): 187-190 (2012)
Correlation and Path analysis in rabi sorghum landraces
A.M. Langhi, S.B. Chaudhary, L.L. Mane, A.R. Gaikwad and U.C. DhageMahatma Phule Krushi VidyapeethRahuri 413 722 (India)
188
programme of other trait . Therefore, only correlation co-efficient among 25 pair combinations of character areimported to be interpreted. Out of this significantcorrelation co-efficient, only one combinations i.e.panicle length showed significant negative correlationco-efficient. This suggests that there was nocorresponding increase in grain yield with increase inpanicle length. All the character except stem diameter,plant height, No. internodes per plant, panicle lengthshould significant positive correlation with grain yield.This suggests that increase in the intensity of theircharacters may being about increase in grain yield.
Days to maturity, which showed the maximumdegree of correlation with grain yield and seems to bethe important trait for improving the grain yield. Thissuggested that increase in these characters wasresponsible for increase in grain yield.
The estimates of direct and indirect effects ofvarious characters on grain yield are presented in Table-3. The path Co-efficient analysis appeared to provide aclue to the contribution of various components of yieldto over all grain yields in the genotypes under study. Itprovides an effective way of finding out direct andindirect sources of correlate. It was revealed in thepresent study that the genotypic correlation coefficientswere higher in magnitude than the phenotypiccorrelation coefficients between most of the characters.This indicated the strong inherent association between
the various characters studied and the genotypicexpression of the correlation was comparatively lessinfluenced by the environmental deviation.
Thus to summaries, the characters viz., days tomaturity was positively and significantly correlated withgrain yield per plant and the character viz., paniclelength was negatively and significantly correlated withgrain yield per plant. Considering the 196 genotypesstudied the desirable plant type in sorghum should bewith maximum days to maturity and minimum paniclelength for high grain yield per plant as the most ofgenotypes having loose panicle.
The positive significant correlation was observedbetween grain yield per plant with the days to maturityand panicle width at genotypic level, Prabhakar (2001)reported similar results for days to 50 per cent floweringand days to maturity. The negative significant correlationwas observed between grain yield per plant with thepanicle length at both phenotypic and genotypic level.Rajkumar et al. (2007) reported similar result for paniclelength.
In the present studies days to maturity had highpositive direct effect on grain yield per plant at the sametime this trait also had significant and positive correlationwith grain yield per plant. This characters also hadpositive indirect effects on grain yield per plant via leafwidth indicating importance of these character duringselection programme.
Table 1. Analysis of variance for 14 quantitative characters of 196 Landraces with 3 check varieties
M.S.S.
Characters Treatments Error Blocks in Intrablock(unadjusted) (r.c.b.) replication error
*Significant at 5 % level ** Significant at 1 % level
189
Ta
ble
2. E
stim
ates
of P
heno
typi
c an
d ge
noty
pic
corre
latio
n co
effic
ient
s am
ong
14 q
uant
itativ
e ch
arac
ters
in ra
bi s
orgh
um
Day
s to
Ste
mN
o. o
fLe
afLe
afPl
ant
No.
of
Tim
e of
Pani
cle
Pani
cle
1000
Leng
th o
fIn
cide
nce
Gra
inC
hara
cter
sM
atur
itydi
amet
erle
aves
/Le
ngth
wid
thhe
ight
inte
rnod
es/
pani
cle
leng
thle
ngth
seed
wt.
bran
ches
fof
sho
otyi
eld/
plan
t(c
m)
(cm
)(c
m)
plan
tem
erge
nce
(cm
)(c
m)
(g)
of p
anic
lefly
plan
tD
ays
to m
atur
ityP
1-0
.038
8-0
.063
6-0
.060
7-0
.076
3-0
.070
1-0
.047
4-0
.113
20.
1779
*-0
.017
30.
0648
-0.0
409
-0.0
722
0.07
88G
1-0
.116
0.07
46-0
.235
1**
-0.0
728
-0.0
851
-0.4
209*
*-0
.198
6**
0.25
77**
-0.0
936
0.14
64*
-0.1
101
-0.0
913
0.16
19*
Ste
m d
iam
eter
P1
-0.1
029
0.00
99-0
.087
60.
010
0.03
66-0
.020
20.
1049
0.03
36-0
.034
20.
1139
-0.0
3-0
.040
1G
1-0
.113
5-0
.000
5-0
.157
8*-0
.007
70.
0912
-0.0
158
0.14
61*
0.05
52-0
.063
50.
1414
*-0
.035
9-0
.037
8N
o of
leav
es/ p
lant
P1
0.00
690.
0375
0.03
88-0
.014
7-0
.089
10.
0563
0.02
330.
0558
0.17
01*
0.05
80.
0634
G1
0.06
040.
0625
0.04
15-0
.060
9-0
.166
8*0.
0591
0.05
64-0
.073
40.
1993
**0.
0528
0.07
95Le
af le
ngth
(cm
)P
10.
2382
**-0
.076
20.
2064
**-0
.001
60.
0272
0.02
86-0
.028
4-0
.114
70.
0285
0.04
22G
10.
3787
**-0
.132
10.
4576
**0.
016
0.03
20.
0703
-0.0
345
-0.1
593*
0.00
760.
0613
Leaf
wid
th (c
m)
P1
0.00
550.
169*
0.08
88-0
.134
7-0
.094
10.
0781
-0.0
547
0.08
420.
0637
G1
-0.0
347
0.41
37**
0.16
41*
-0.1
327
-0.1
518*
0.07
01-0
.048
30.
0851
0.08
05Pl
ant h
eigh
tP
10.
0606
-0.1
163
0.21
89**
-0.0
25-0
.095
70.
0685
0.03
85-0
.049
6G
10.
2449
**-0
.115
0.25
17**
-0.0
459
-0.1
235
0.06
890.
0398
-0.0
496
No
of in
tern
odes
/ pla
ntP
1-0
.029
7-0
.128
4-0
.101
10.
0432
-0.0
328
0.00
35-0
.022
7G
1-0
.354
9**
-0.2
208*
*-0
.258
3**
0.09
95-0
.062
-0.0
013
-0.0
342
Tim
e of
Pan
icle
em
erge
nce
P1
-0.0
860.
1316
-0.0
294
-0.0
869
0.01
480.
1185
G1
-0.1
007
0.16
2*-0
.035
5-0
..113
30.
0148
0.13
33Pa
nicl
e le
ngth
(cm
)P
10.
0471
-0.1
075
0.12
-0.0
399
-0.1
46*
G1
0.07
54-0
.110
70.
1251
-0.6
693
-0.1
498*
Pani
cle
wid
th (c
m)
P1
-0.0
186
-0.1
469*
-0.0
314
0.01
46G
1-0
.021
8-0
.182
5**
-0.1
611
0.01
1810
00 s
eed
wt.
(g)
P1
0.06
06-0
.055
50.
0345
G1
0.06
34-0
.085
20.
0332
Leng
th o
f bra
nche
s of
pan
icle
P1
0.00
650.
0049
G1
0.01
490.
0078
Inci
denc
e of
sho
ot fl
yP
10.
0065
G1
0.01
49G
rain
yie
ld /
plan
tP
1G
1
* Sig
nific
ant a
t 5 %
leve
l**
Sig
nific
ant a
t 1 %
leve
l
190
Selection for this trait could be rewarding, similarresults were found by Prabhakar (2000) for days tomaturity and Veerbhadhiran and Kennedy (2001b) for1000 seed weight and days to 50 % flowering paniclelength had high negative direct effect while it wasnegative correlated with grain yield per plant whichreveals that selection for these traits could not yieldmuch breeding objectives.
In the present study the high residual effectsuggested that the characters included in the study werenot sufficient to explain the variability in the dependentvariable.Based on findings of the present investigation,the most desirable ideotype of sorghum should possesmore days to maturity and low panicle length selectionon the basis of these criteria would improve theefficiency of selection programme.
References
Choudhary L, Sharma V, Vyas Mukesh Sharma H( 2001)Variability and path coefficient in sorghum. Indian JAgric Res 35 (2) : 124-126
DeWey D R, Lu HK (1959) A correlation and path analysis ofcomponents of crested wheat grass seedproduction. Agron J 51 (6) : 515-518
Iyanar K, Gopalan A , Ramaswamy P (2001) Correlation andpath analysis in sorghum. Annals Agric Res 22 (4): 495-497
Association of yield attributing traits with grain yield of transplantedrice
Monika Soni and K. K. JainDepartment of AgronomyJawaharlal Nehru Krishi Vishwa VidyalayaJabalpur 482 004 (MP)
Abstract
The present investigation was made out during kharif, 2010and 2011 with 18 treatments in split plot design with threereplications on the same site without changing the layoutplan. The treatment consisted with 6 weed control practicesviz., bispyribac sodium @ 20 ml ha-1, penoxsulam @ 20 mlha-1, pyrazosulfuron-ethyl @ 25 ml ha-1, cyhalofop-butyl @ 75ml ha-1 + almix @ 4 ml ha-1 and fenoxaprop-p ethyl @ 60 mlha-1 + almix @ 4 ml ha-1 and weedy check as main plottreatment and three day time application (morning, afternoonand evening) as sub plot treatment. These herbicides wereapplied as post emergence i.e. 15 days after transplanting(DAT). The experimental soil was neutral in reaction (pH7.12), medium in organic carbon (0.68 %), N (272 kg ha-1), P(15.50 kg P2O5 ha-1) and high in available K (295 kg K2O ha-1)content. The yield attributing traits viz., plant height, numberof effective tillers, length of panicle and 1000 grain weightwere recorded at harvest and leaf area index (LAI at 60-90DAT) during both the years. The result revealed that amongstthe yield attributing traits LAI recorded the highest and positivecorrelation (0.908 and 0.879) with the grain yield of rice duringboth the years. However the regression studies revealedthat the increases in one unit of LAI there was 0.82 and 0.75t ha-1 increase in grain yield of rice followed by 100 grainweight (0.36 and 0.33 t ha-1).
Keywords: grain yield
Rice (Oryza sativa L.) is one of the most important staplecrops occupying first position among cereal crops.Madhya Pradesh the rice occupies 1.45 mha area forcultivation and contributes 3.45% in the production of India.Transplanted rice production affected by various bioticand abiotic factors. Weeds are one of the biotic factorsthat limit the production of transplanted rice in severeinfestation (singh et al. 2008). Among all the weed controlpractices chemical weed control in transplanted rice is ofprime important for prompting the growth and developmentof crop and less dependence on labour, those availability
on peak period of crop-weed competition increasing dayby day which finally, results yield reduction in transplantedrice. There is reduction in grain yield of rice by 25.9%due to major weeds (Mishra et al. 2007). Severalresearches initiating for evaluate the post emergenceherbicides which found more effective to reducing the weeddensity in addition to the numerous factors that affectherbicide performance viz., rate, temperature, weed height,adjuvant, relative humidity, day time (morning afternoonand evening) and dew. Research has shown that therelative importance of these factors vary among herbicides.Day time application is one of the important factors thataffect the efficacy of post emergence herbicides (BobHartzler 2003). Crop growth parameters play an importantand positive role in getting higher rice grain production(Jain and Sharma 2011). Hence, the present study wasunder taken.
Material and methods
A field experiment was conducted during kharif season,2010 and 2011 with 18 treatments in split plot designwith three replications on the same site without changingthe layout plan. Jabalpur lies between 220 49' to 240 8'North latitude and 780 21' to 800 58' East longitude with411.78 meters above the mean sea level. Jabalpur belongsto Kymore Plateau and Satpura Hills agro climatic zoneas per classification by National Agricultural ResearchProject. Recently, this area has classified as agro-ecological sub region number 10.1 (Vindhyan scarplandsand Baghelkhand and Narmada valley, hot dry sub-humidecological sub region with medium deep clayey blacksoils. Jabalpur enjoys a typical subtropical climate withhot dry summers and cool dry winters. Temperatureextremes vary between minimum temperatures of 20C inthe month of December-January to maximum temperatureof 450C in the month of May-June. The monsooncommenced in the third week of June and terminated in
192
Table 1. Correlation matrix between yield attributing traits and grain yield (t ha-1)
Character Plant height Effective tillers Length of 1000 grain Grain yieldpanicle weight
Fig. 1. Regression of yield attributing parameters on grain yield (t ha-1) of rice
2010 2011
2010 2011
2010 2011
194
Fig. 2. Regression of yield attributing parameters on grain yield (t ha-1) of rice
2010 2011
2010 2011
the last week of September. The total rainfall receivedduring the crop season was 2578.60 and 1834.50 mm,which was equally distributed in 55 and 63 rainy daysfrom June to third week of September in 2010 and 2011years, respectively. Minimum and maximum meantemperature ranged from 16.50 to 33.5 0C and 35.40 to11.40 0C in the 2010 and 2011 years, respectively. Therelative humidity ranged from 31 to 94% in 2010 and 30to 94% in 2011. It is evident that weather conditions werealmost favorable for the growth and development of rice.The soil of the experimental field was neutral in reaction(pH 7.12), medium in organic carbon (0.68 %) and availableN (272 kg ha-1), and available P (15.50 kg P2O5 ha-1) andhigh in available K (295 kg K2O ha-1) content. Thetreatments consisted with 6 weed control practices weedy
check, bispyribac sodium @ 20 ml ha-1, penoxsulam @20 ml ha-1, pyrazosulfuron-ethyl @ 25 ml ha-1, cyhalofop-butyl @ 75 ml ha-1 + almix @ 4 ml ha-1 and fenoxaprop-pethyl @ 60 ml ha-1 + almix @ 4 ml ha-1 as main plottreatment (as post emergence) and three day timeapplication (morning, afternoon and evening) as sub plottreatment. The field preparation was done by puddlingthe land once with the help of cultivator under well moistcondition of the field. The 15 days old seedlings of ricecv.WGL 32100 were transplanted manually in 20 cm x20 cm planting geometry by using 2-3 seedlings per hill.The yield attributing traits were recorded at harvest andthe LAI was taken at 60-90 days after transplanting (DAT).After that the correlation and regression study wasperformed.
195
Crop-Weed Correlations
Correlation matrixes amongst yield attributing charactersand grain yield, weed parameters and grain yield werecomputed. In order to predict the effects of differentvariables on yield, simple regression and regressionmodels were used and coefficients were computed tointerpret quantitative changes on yield in a crop-weedecosystem.
The correlation coefficient (r) is calculated assuggested by Sendecor and Cochran (1967).
Correlation coefficient (r)
Results and discussion
Correlation studies
The different yield attributing traits with grain yield hadpositive correlation during both the years (Table 1). Thecorrelation of different yield attributing traits with grainyield indicated that the leaf area index had highest positive(0.908 and 0.879) correlation amongst different yieldattributing traits followed by number of effective tillers(0.854 and 0.865), 1000 grain weight (0.831 and 0.802),plant height (0.721 and 655) and length of panicle (0.476and 457) during both the years.
Regression studies
Amongst different yield attributing traits, the linearincrease in yield was predicted with leaf area index, plantheight, number of effective tillers, length of panicle and1000 grain weight during both the years (Table 2). Theincrease in yield could be predicted by 0.82 and 0.75;9.77 and 7.65 x 10⁻²; 1.99 and 1.76 x 10⁻²; 6.56 and 5.48x 10⁻²; 0.36 and 0.33 during both the years.
The results revealed that the different yieldattributing traits, leaf area index was the most importantyield attributing traits for resultant of higher grain yield oftransplanted rice followed by 1000 grain weight duringboth the years.
Refferences
Bob Hartzler (2003) Effect of Application timing on herbicideefficacy, Iowa State University
Jain KK, Sharma HL (2011) Correlation and regressionstudies of guava based agroforestry in paddy-weedecosystem. J Trop For 27 (IV) 64-68
Mishra JS, Dixit A, Varshney JG (2007) Efficacy of penoxsulamon weeds and yield of transplanted rice (Oryzasativa). Indian J Weed Sci 39 (1/2): 24-27
Singh C, Singh P, Singh R (2008) modern techniques ofraisning filed crops 3-54
Snedecor GW, Cochran WG (1967) Statistical Methods.Oxford and IBH publication. Sixth edition 325-330
Production efficiency and economics of different cropping systemsas influenced by tillage, mulch and fertility levels in Kymore plateauand Satpura hills zone of Madhya Pradesh
Ashish Tiwari, V.B. Upadhyay, K.K. Agrawal and S.K. VishwakarmaDepartment of AgronomyJawaharlal Nehru Krishi Vishwa VidyalayaJabalpur 482 004 (MP)
Abstract
Field investigations were made at Research Farm, Adhatral,Jawaharlal Nehru Krishi Vishwa Vidyalaya, Jabalpur, MadhyaPradesh during 2010-11 and 2011-12 on sandy clay loamsoils. Production efficiency of 52.36 kg/ha/day monetaryreturns of Rs 88233/ha with a B:C ratio of 2.72 were recordedmaximum when rice-wheat cropping system received theminimum tillage, without mulching and recommended doseof fertilizers to both crop component followed by samecropping system with minimum tillage, mulching andrecommended dose of fertility 25% N with organic manures.The former treatment was recorded the maximum (133.52q/ha/year) rice equivalent yield than the other treatmentcombinations. Higher net monetary returns (88233.05) andB:C (2.72) ratio was observed with former treatments.
Keywords: Production efficiency economics, croppingsystems
Lesser agricultural productivity, rural employment andeconomic status has been reported from Madhya Pradesh,compared to other states of the country. Farmers of thestates follows the mono cropping system. Though thearea under cultivation is greater. During Kharif, growing ofrice has been a traditional practices and is widelyaccepted. Rice-wheat and rice-chickpea is 1st and 2nd pre-dominant cropping systems of the region. In MadhyaPradesh with lowest productivity varying with the variationof rainfall in different years, low productivity in upland riceis a result of crop depending on rains mostly results tomoisture stress, absence of surface water accumulation,direct seeding, heavy infestation of weeds, insect pests
and diseases. The occurrence of drought during cropgrowth period may vary and occurs at any crop growthstage. However, early drought, mid season and terminaldrought after flowering are most common in rainfed uplandrice crop.
Material and methods
On station experiment was conducted at Research Farmof Jawaharlal Nehru Krishi Vishwa Vidyalaya, Jabalpur,Madhya Pradesh during kharif 2010-11 and 2011-12 onsandy clay loam soil (pH 7.5, EC 0.48 dS/m and 0.68%OC). Two tillage operations (T1 minimum and T2conventional) and four cropping systems (CS1 - rice-wheat,CS2 - rice-berseem; CS3 - maize-wheat and CS4 -sorghum-wheat) were kept as main-plot treatments andtwo mulches (Mo - No mulch and M1 with mulch) and twofertility levels (F1 - RDF and (F2 - RDF + 25% N throughorganic manures) were kept as sub-plot treatment. Thetotal 32 treatments combinations were evaluated in a split-plot design under three replications under two fertilitylevels. The recommended dose of fertilizer for rice andwheat were 120:60:40 kg N, P2O5 and K2O/ha maize andsorghum 100:60:40 kg N, P2O5 and K2O/ha and under F2- fertility levels recommended dose of fertilizer + 25% N,6t FYM to rice and wheat, 5t FYM to maize and sorghumand 1t FYM to berseem were applied prior to final seedbed preparation. The crop variety Kranti, HQPM1, JS2020,GW273 and JB3 were used for rice, maize, sorghum,wheat and berseem, respectively. Rice, maize, sorghumand wheat were sown in line in a plot size of 5.0 x 4.20 mand broad cast method was adopted for sowing ofberseem.
197
Tab
le 1
. Pro
duct
ion
effic
ienc
y, ri
ce e
quiv
alen
t yie
ld a
nd e
cono
mic
s of
diff
eren
t cro
ppin
g sy
stem
influ
ence
d by
tilla
ge, m
ulch
and
ferti
lity
leve
ls
Trea
tmen
tsC
ost o
f cul
tivat
ion
Ric
e eq
uiva
lent
Pro
duct
ion
effic
ienc
yG
ross
mon
etar
yN
et m
onet
ary
B:C
ratio
yiel
d (q
/ha/
year
)(k
g/ha
/day
)re
turn
s (R
s/ha
/yea
r)re
turn
s (R
s/ha
/yea
r)T 1
T 1CS
1M0F
151
230
133.
5252
.36
1394
63.0
588
233.
052.
72T 2
T 1CS
1M0F
257
830
115.
0645
.12
1438
2985
999.
002.
48T 3
T 1CS
1M1F
153
230
113.
0244
.32
1412
87.6
8805
7.60
2.65
T 4T 1C
S1M
1F2
5983
011
5.82
45.4
114
4789
.384
959.
302.
42T 5
T 1CS
2M0F
157
925
99.6
932
.68
1246
2266
697.
002.
15T 6
T 1CS
2M0F
261
775
104.
0634
.11
1300
85.2
6831
0.20
2.10
T 7T 1C
S2M
1F1
5992
510
1.75
33.3
612
7196
.567
271.
502.
12T 8
T 1CS
2M1F
263
775
105.
2034
.49
1315
17.5
6774
2.50
2.06
T 9T 2C
S1M
0F1
5463
011
3.38
44.4
614
1738
.487
108.
402.
59T 10
T 2CS
1M0F
261
230
117.
1245
.92
1464
11.9
8518
1.90
2.39
T 11T 2C
S1M
1F1
5663
011
4.23
44.7
914
2801
.186
171.
102.
51T 12
T 2CS
1M1F
263
230
118.
6546
.52
1483
2385
093.
002.
34T 13
T 2CS
2M0F
161
325
105.
5134
.59
1318
99.2
7057
4.20
2.15
T 14T 2C
S2M
0F2
6517
510
7.89
35.3
713
4878
6970
3.00
2.06
T 15T 2C
S2M
1F1
6332
510
6.55
34.9
313
3203
.269
878.
202.
0T 16
T 2CS
2M1F
267
175
109.
0035
.73
1362
56.5
6908
1.50
2.02
T 17T 1C
S3M
0F1
4740
986
.55
39.3
410
8199
.960
790.
902.
28T 18
T 1CS
3M0F
253
459
88.5
940
.26
1107
51.3
5729
2.30
2.07
T 19T 1C
S3M
1F1
4940
987
.87
39.9
410
9838
.560
429.
502.
22T 20
T 1CS
3M1F
255
459
90.3
941
.08
1129
9457
535.
002.
03T 21
T 2CS
3M0F
150
809
89.8
740
.85
1123
42.9
6153
3.90
2.21
T 22T 2C
S3M
0F2
5685
992
.02
41.8
211
5028
.658
169.
602.
02T 23
T 2CS
3M1F
152
809
91.0
441
.38
1138
11.7
6100
2.70
2.15
T 24T 2C
S3M
1F2
5885
963
.19
28.7
211
6498
.757
639.
701.
97T 25
T 1CS
4M0F
147
196
84.0
335
.01
1050
46.9
5785
0.90
2.22
T 26T 1C
S4M
0F2
5324
687
.66
36.5
210
9590
.456
344.
402.
05T 27
T 1CS
4M1F
149
196
84.9
335
.38
1061
71.8
5697
5.80
2.15
T 28T 1C
S4M
1F2
5524
689
.39
37.2
411
1747
.05
5650
1.00
2.02
T 29T 2C
S4M
0F1
5059
689
.88
37.4
511
2362
.661
766.
602.
22T 30
T 2CS
4M0F
256
646
94.1
339
.22
1176
76.4
6103
0.40
2.07
T 31T 2C
S4M
1F1
5259
691
.25
38.0
211
4076
.361
480.
302.
16T 32
T 2CS
4M1F
258
646
95.2
739
.69
1191
00.7
6045
4.70
2.03
Cos
t of t
illage
ope
ratio
nT 1 -
min
imum
= R
s 22
00/h
aT 2 -
con
vent
iona
l till
age
= R
s 39
00/h
aC
ost
of s
eeds
/ha
Ric
e =
Rs
2500
; Mai
ze =
Rs
500;
Sor
ghum
= R
s 30
0; W
heat
= R
s 25
00; B
erse
em =
Rs
4000
Cos
t of
nut
rient
sFY
M =
Rs
550/
t; N
itrog
en =
Rs
12.3
0/kg
; Pho
spho
rus
= R
s 32
.50/
kg; P
otas
h =
Rs
21.6
0/kg
Labo
ur c
harg
e R
s 12
5/m
anda
yV
alue
of
grai
ns (
Rs/
q)R
ice
= R
s 12
50; M
aize
= R
s 11
85; S
orgh
um =
Rs
1100
; Whe
at =
Rs
1285
; Ber
seem
= R
s 12
000
Val
ue o
f st
raw
/sto
ver
(Rs/
q)R
ice
= R
s 50
; Mai
ze a
nd S
orgh
um +
Rs
90; W
heat
= R
s 15
0M
ulch
ing
8 m
anda
ys/h
a =
Rs
1000
/ha
198
Results and discussion
Production-efficiency
The highest production efficiency of 52.36 kg/ha/day wasrecorded under least tillage operation with rice-wheatcropping system and recommended dose of fertilizer withno mulch (T1) was applied followed by conventional tillagewith rice-wheat cropping systems with mulch andrecommended dose of fertilizer with 25% N throughorganic sources (T12). Similar views were reported byRamesh et al. (2009) and Upadhyaya et al. (2011). Theminimum production efficiency of 32.68 kg/ha/day wasrecorded under T5 - treatment where minimum tillage tomaize-wheat cropping system with no mulch andrecommended dose of fertilizer (F1) was applied. Similarobservations were made by Ahmad and Ali (1992); andChopra and Angiras (2007).
System productivity
While comparing the total productivity of cropping systemsin terms of rice equivalent yield (REY), sorghum-wheatunder minimum tillage, no mulch with recommended doseof fertilizer to both crop components was the least (84.03q/ha/year) productive among all cropping systems andnutrient management. Similar views were reported byGupta et al. (2007). It was due to less price of sorghum inthe prevailing markets as compared to other crops tested.Highest rice equivalent yield (133.52 q/ha/year) wasrecorded under T1 treatment (T1CS1M0F1) followed by T10,T4 and T3.
Economics
Higher net monetary returns (Rs 88233/ha/year) wasobtained under recommended dose of fertilizer(T1CS1M0F1) to rice-wheat cropping sequence withoutmulching and least tillage operation with higher B:C ratioof 2.72. The minimum (Rs 56344/ha/year) net monetaryreturns was observed under sorghum-wheat croppingsystem, minimum tillage, no mulch with recommendeddose of fertilizer to both crops along with 25% N throughorganic manures.
t-us-—-fo-fo-] tcyiqj ¼e iz½ ds cyqbZ nkseV feêh okys vuqla/kkuiz{ks= esa /kku&xsgw¡] /kku&cjlhe] eDdk&xsgw¡ ,oa Tokj&xsgw¡ Qly iz.kkyhdks de ,oa lqpk: tqrkbZ fcuk fcNkou ,oa fcNkou rFkk vuq'kaflrmoZjkdsa dh ek=k rFkk vuq'kaflr moZjdksa dh ek=k ,oa 25% vf/kdek=k dkcZfud [kknksa] mn~ns'; ls o"kZ 2010&11 ,oa 2011&12 ds }kjkiz;ksx fd;k x;k A izfr gsDVj izfrfnu vf/kdre iSnkokj ¼52-36 fdyks½/kku&xsgw¡ Qly iz.kkyh ls izkIr gqbZ] /kku&xsgw¡ ij de [ksr rS;kj] fcukfcNkou ,oa vuq'kaflr [kkn dh ek=k nksuksa Qlyksa dks nh xbZ Fkh A /kku&xsgw¡ Qly iz.kkyh] lqpk: tqrkbZ] fcNkou ,oa vuq'kaflr [kkn dhek=k $ 25% dkcZfud [kkn mRiknu dh n`f"V ls nwljs uEcj ij jghA vf/kd equkQk ,oa Qk;nk [kpZ dk vuqikr esa Hkh igys okyk iz;ksxloZizFke jgk A
References
Ahmad S, Ali A (1992) Zero tillage in maize-wheat croppingsystem. J Agril Res 30(2) : 197-204
Chopra P, Angiras NN (2008) Effect of tillage and weedmanagement on productivity and nutrient uptake ofmaize (Zea mays). Indian J Agron 53(1) : 66-69
Gupta Meenakshi, Bali Amarjit S, Sharma BC, Kachroo D,Bharat Rajeev (2007) Productivity, nutrient uptakeand economics of wheat (Triticum aestivum) undervarious tillage and fertilizer management practices.Indian J Agron 52(2) : 127-130
Ramesh P, Panwa NR, Singh AB, Ramanna S (2009)Production potential, nutrient uptake, soil fertility andeconomics of soybean (Glycine max) basedcropping systems under organic chemical andintegrated nutrient management practices. IndianJ Agron 54(3) : 278-283
Upadhyay VB, Jain Vikas, Vishwakarma SK, Kumar AK (2011)Production potential, soil health water productivityand economics of rice (Oryza sativa) basedcropping system under different nutrient sources.Indian J Agron 56(4) : 311-316
Fifty-two genotypes belonging to G. hirsutum, G. herbaceumand G.arboreum were studied for influence of moisture stresson phenological characters and yield using line sourcesprinkler irrigation technique. Increased moisture stressdecreased the number of days to 50 per cent squaring andflowering, first boll formation, 50 per cent boll opening andmaturity irrespective of species. First boll formation and 50per cent boll opening were positively correlated with meanseed cotton yield and thus indicating early boll formation andboll opening are important phenological characters in cottonunder moisture stress. G.arboreum and G. herbaceumperformed better at high moisture stress levels compared toG. hirsutum genotypes. The genotypes MSKD-26, LH-900,LRA-5166, TCH-1002, AH-107 and Abadhita in G. hirsutum,Kumta, RAHS-14, H-111, R-51andH-119in G. herbaceum,AKA-5, CAN-4, SIMA-302 and AK-235 in G. arboreum gavesignificantly higher yield across the moisture regimes.
Cotton is an important cash and fiber crop of India grownon 8.0 million hectares. The average yield of cotton is570 kg/ha whereas, world average is 600 kg/ha (Anon2007).There are many reasons for low productivity ofcotton. Area under rainfed cotton predominates overirrigated area and more than 50 per cent of rainfedcotton is grown under erratic low rainfall conditions.Developmental pattern in cotton is an important aspectas phenological characters are varied and distinct. Thephenology of cotton is very sensitive to prevailingenvironmental conditions (Constable 1976). Yield ofseed cotton is dependent on phenological characterslike number of days to 50 per cent square initiation,flowering, boll formation, rate of development of bollsand size of bolls. These characters vary with variety,environmental conditions and cultural practices(Kannayan and Veluswamy 1967 ; Kadapa 1975). Thisexperiment was conducted to study the relationship ofphenological characters and seed cotton yield in cotton
(Gossypium spp.) genotypes under increasing moisturestress.
Material and methods
The line source sprinkler irrigation technique was laidout following the method developed by Hanks et al. (1976)in Golden Jubilee Block of Main Agricultural ResearchStation, Dharwad, which is situated in agro-ecologicalnorthern transition zone (Zone 8) of Karnataka. Soil wasred sandy loam in texture containing 41% coarse sand,30% fine sand, 15% silt and 14% clay with PH of 5.92.The field experiment was conducted with 52 genotypesbelonging to three species of Gossypium. The lines weremarked at 60 cm distance across the line source lay out.The recommended dose of 12.5 tones of compost and80:40:40 NPK kg per hectare was uniformly applied inthe lines. The seeds of different genotypes were sownat a distance of 20 cm in a row. Two rows on eitherends of plot were sown with local check, Abadhita. Thefield was irrigated through line source kept at 6 mintervals on alternate days to provide uniform irrigationto the plot. The treatment of water gradient levels wasimposed on 21st day after sowing.
Each genotype was raised in a single row of 7mlength with a spacing of 60cm x 20 cm perpendicular tothe line source on either side of the LS system withrandomization. Each row was divided into 5 parts (M1,M2, M3, M4 and M5 moisture regimes) each of 1.4m lengthwhich consisted of 7 plants. The water catch cans wereplaced perpendicular to LS system between rows in themiddle of each part (moisture level) in line with sprinklerheads to estimate receipt of moisture levels. The watercollected in each can was computed as,
Water collected in each can in ml (cm3)Water applied (cm) = ———-------————————————
Area of the can (cm2)
Relationship of phenological characters and seed cotton yield undermoisture stress in cotton
B.T. Ninganur, B.S. Janagodar and N.K. BiradarpatilDepartment of Crop PhysiologyUniversity of Agricultural SciencesDharwad-580005, Karnataka
JNKVV Res J 46(2): 199-208 (2012)
200
The amount of water applied to each sub plot wasaccumulated over the duration of treatment .Any rainfallduring the imposition of drought treatment was added towater input in all sub plots (Table 1).
Cumulative pan evaporation during the experimentation=82.40 cm
Water deficit created relative to the open panevaporation that occurred during the treatment periodwas calculated using the formula,
X1 - X2 Water deficit (%) = ———— x 100
X1
Where ,
X1= Cumulative open pan evaporation during theexperimental period (cm),
X2= Cumulative amount of water applied (including rain)for the experimental period (cm).
Five middle plants in each treatment wereselected for recording days to 50 per cent squareinitiation, flowering, first boll formation, boll opening anddays to maturity.
Results and Discussion
Days to 50 per cent square initiation
The square formation in cotton is the beginning ofreproductive phase and squares are the importantcomponents for yield in cotton. The data on days to 50per cent square initiation as influenced by genotypesand moisture levels is presented in Table 2. In general,it was observed that increasing moisture stress levelresulted in decreased days to 50 per cent square initiationirrespective of species. Among the species, on an average,
G. herbaceum genotypes took highest number of daysto 50 per cent square initiation compared to G.hirsutumand G. arboreum. At M1 moisture level, G. herbaceumtook on an average more number of days (55.9) to 50 percent square initiation compared to G.hirsutum (48.4) andG. arboreum (49.9). Further, it was found that in generalG. herbaceum genotypes recorded highest number ofdays to 50 per cent square initiation particularly at M4and M5 moisture levels compared to other species.
Among the genotypes, H-119 took significantlyhigher number of days to 50 per cent square initiation(56.6) followed by H-18 (56.5), Saj 4-3-4 (54.4), SurthiBroach (53. 7), H-6 (53.6), RAHS-14 (53.4), H-124(52.8), DB-3-12 (52.4), Jayadhar (52.2) and H-135(51.9) in G. herbaceum. The number of days to 50 percent square initiation was less in MCU-5 (45.2) followedby AH-107 (45.5), Sharada (46.0), HLS- 32179 (46.1)and Allepo x Rex (46.3) in G. hirsutum. The genotypesPA-183 and B.Desh-87 took significantly less numberof days to 50 per cent square initiation in G. arboreum,indicating their sensitivity to moisture stress.
The interaction effects between moisture levelsand genotypes were found significant. The genotypeSaj 4-3-4 recorded significantly highest number of daysto 50 per cent square initiation at M1 moisture level andsignificantly lower number of days to 50 per cent squareinitiation was found in MCU-5 (44.5) at M5 moistureregime. At M5 moisture regime, the genotypes R-51(51.0), Kumta (48.5), Saj-4-3-4 (48.5), H-119 (48.0) andH-18 (48.0) recorded significantly higher values fornumber of days to 50 per cent square initiation ascompared to other genotypes. Across the moistureregimes, G. herbaceum had maximum number of days(51.8) to 50 per cent square initiation followed by G.arboreum (48.3) and G. hirsutum (46.9).
Days to 50 per cent flowering
It was observed that increasing moisture stress levelsresulted in decreased number of days to 50 per cent
Table 1. Particulars of water use in line source irrigation method
Particulars M1 M2 M3 M4 M5
Amount of water supplied (ml) 10268 7707 4870 2100 548Amount of water by rains (ml) 2025 2025 2025 2025 2025Total amount of water (ml) 12293 9732 6895 4025 2566Amount of water on weight basis (g)1ml=0.997g 12256 9702 6874 4113 2563Amount of water (cm) 85.95 68.05 48.25 28.85 18.00Moisture deficit (%) 4.31 -17.42 -41.44 -69.99 -78.14
201
flowering irrespective of species (Table 3). It was from63.4 days in M1 to 58.6 days in M5. Across the moistureregimes, G. herbaceum genotypes took highest numberof days (63.9) compared to G. hirsutum (54.4) and G.arboreum (58.1).
Among the genotypes, Saj 4-3-4 recordedsignificantly higher number of days to 50 per centflowering (69.8) followed by RAHS -14 (69.0), Dig-6-3-13 (68.1), DB-3-12 (66.0), Surthi Broach (65.6) and R-51 (64.9). The number of days to 50 per cent floweringwas significantly less in LH-900 (50.8) followed byCNHPT-2 (51.2), CPD-446 (51.3), CPD-473 (52.3) andAllepo x Rex (52.3).
The interaction effects between moisture levelsand genotypes were found significant. The genotype,Saj 4-3-4 recorded significantly highest number of daysto 50 per cent flowering at M1 moisture level andsignificantly lower number of days was observed inAllepo x Rex, LH-900 and CPD-473 (48.5) at M5moisture regimes. At M5 moisture level, the genotypes,Dig-6-3-13 (65.0) RAHS-14 (65.0), Jaydhar (63.5),RAHS-2 (63.0) and Surthi Broach (61.5) recordedsignificantly higher values for number of days to 50 percent flowering as compared to other genotypes.
Days to first boll formation
Increased moisture stress caused decrease in numberof days to first boll formation irrespective of species(Table 4). Number of days to first boll formation hadnegative correlation with yield under moisture stresslevels indicating early varieties are suited to stresssituations. Across the moistures regimes G. herbaceum(76.5) genotypes took highest mean number days tofirst boll opening compared to G. hirsutum (62.6) andG. arboreum (72.1).
Across the moisture regimes, Jayadhar recordedsignificantly higher mean number of days to first bollformation (81.9) followed by Surthi Broach (80.8), H-111 (80.8), H-111 (80.0), H-18 (79.6), H-119 (79.0), H-129 (78.8), Dig-6-3-13 (78.1), H-135 (77.6) and RAHS-2 (77.5). The number of days to first boll formation wassignificantly less in CPD-446 (56.8), followed by LRA-5166 (58.2), Allepo x Rex (59.2), Sharada (59.4) andMSKD-26 (59.6). They were early in first boll formationunder moisture stress conditions. The interaction effectsbetween moisture levels and genotypes were foundsignificant. The genotypes DB-3-12 recordedsignificantly highest days to first boll formation (93.5)and significantly lower number of days to first boll formationwas found in CPD-446 (51.5). At M5 moisture level, the
genotype Jayadhar (72.0), Surthi Broach (70.0), Dig-6-3-13 (69.0), H-18 (69.0) and H-111 (68.5) recordedsignificantly higher values for number of days to first bollformation as compared to other genotypes indicating theirtolerance to drought.
Days to 50 per cent boll opening
Among the species, to G. herbaceum took maximummean number of days (100.8) to 50 percent boll openingfollowed by G. arboreum (99.9) and G. hirsutum (95.6).But they did not differ significantly, showing no effect ofmoisture stress on boll opening behaviour across thespecies (Table 5).
However, among the moisture regimes, M1recorded significantly higher values for number of days(106.0) to 50 per cent boll opening followed by M2. M3,M4 and M5. These treatments differed significantlyamong themselves.
Among the genotypes, Dig-6-3-13 recordedsignificantly higher number of days (103.8) to 50 percent boll opening followed by Jayadhar (102.1), H-10(102.0), H-131 (100.7), RAHS-2 (100.7) and Saj-4-3-4 (100.6). The number of days to 50 per centbollopening was significantly less in Abhadita (93.3)followed by HLS-321729 (93.3), Anjali (93.7), CPD-418(94.3) and ACP-71 (94.4). This indicates the existenceof genotypic variation with respect to 50 per cent bollopening under stress situations. The interaction effectbetween moisture levels and genotypes was foundsignificant. The genotype Dig-6-3-13 recordedsignificantly highest number of days to 50 per cent bollopening at M1 moisture level (103.8) and significantlylower number of days to 50 per cent boll opening wasfound in Sharada (85.0) at M5 moisture level.
At M5 moisture level, the genotypes H-10 (95.5), H-131(95.5), H-18 (95.5), Kumta (95.0) and Dig-6-3-13 (95.0)recorded significantly higher values for number of daysto 50 per cent boll opening as compared to othergenotypes.
Days to maturity
The data on number of days to maturity as influencedby genotypes and moisture levels is presented in Table6. It was observed that increasing moisture stress levelsresulted in decreased number of days to maturityirrespective of species. Among all the moisture regimes,G. herbaceum genotypes took the highest number ofdays to maturity (192.0) compared to G. hirsutum (167.2)
202
Table 2. Days to 50 per cent square initiation in cotton genotypes as influenced by different moisture levels
and G. arboreum (184.9). Among the moisture levels,M1 recorded significantly higher values for number ofdays to maturity followed by M2, M3, M4 and M5 and thesemoisture levels differed significantly.
Among the genotypes, Jaydhar recorded thehighest number of days to maturity (196.3) followed byDB-3-12 (195.7), R-51 (195.1), DDhC-11 (194.4), H-119 (193.9) in G. herbaceum. The number of days tomaturity was significantly less in LH-900 (151.5)followed by TCH-1002 (154.0), Allepo x Rex (159.9),ACP-71 (160.8) and AH-107 (164.0) in G. hirsutum. Thenumber of days to maturity was significantly high in PA-183, Virnar-79, No.23, No.30802, CNA-4, B.Desh-87,SIMA-302, No.3282 and AK-235 in G. arboreum whencompared to all other genotypes. The genotype,Jaydhar recorded significantly highest number of daysto maturity (204.0) at M1 moisture level and significantlylower number was observed in TCH-1002 (144.0) atM5 moisture level. At M5 moisture level, the genotypesR-51 (190.0), DB-3-12 (190.0), Jaydhar (189.9). DDhC-11 (189.0) and RAHS-2 (188.5) recorded significantlyhigher values for number of days to maturity ascompared to other genotypes indicating their toleranceto drought.
G. arboreum, G.herbaceum and G. hirsutum tookmore number of days 50 per cent squaring, floweringfirst boll formation, 50 per cent boll opening and maturityat M1 (no stress) moisture level, while they took lessnumber of days with increased moisture stressindicating stress caused early maturity. Among the threecotton species, higher moisture level (M1) recorded non-significant difference in yield. However, at highermoisture stress especially at M5 (severe stress) seedcotton yield differed significantly among the speciesrecording significantly higher yield in G. arboreum (10.3g/plant), followed by G. herbaceum (9.6 g/plant)compared to least yield of G.hirsutum (8.7 g/plant).
The high yielding G. arboreum and G. herbaceumgenotypes took more number of days for all thephonological phases compared to G. hirsutum at highermoisture stress level (M5), thus indicating the relationshipof longer the duration higher the yield under moisturestress which is not so under optimum irrigated conditions.Thus, these parameters could be used as criteria for
breeding programme in developing drought tolerantvarieties under rainfed condition. These studies are inconformity with Villareal( 1991) who also noticed the samerelationship.
ykbu lkslZ Vid flpk¡bZ rjhds ls xk¡flfi;e fgjlqIe] xk- gjusfl;erFkk xk- vkjcksje ds ckWou iztkfr;ksa dk ekWbLpj LVªsl dk QhuksyktkfdyrFkk xz.kksa ij izHkko ekik x;k ekWbLpj LVªsl ds dkj.k ipkl izfr’krQwy [kqyus] ckWy cuus] [kqyus rFkk espqfjVh ij vlj iM+k AthuksVkbi MSKD 26, LH 900, LRA 5166, TCH 1002, AH107, Aaadhita rFkk Kumata RAHS 14, HIII, R 51 rFkk H119,AKA5, CAN4, SIMA302, AK235 iztkfu;ksa esa ekbLpj LVªsl esaHkh vkf/kd mit ekih x;h A
References
Anonymous(2007) All India Coordinated Cotton ImprovementProject Project Coordinator’s Report
Constable GA (1976) Temperature effects on the early fielddevelopment of cotton. Australian J Exp Agric &Animal Husb 16: 905-910
Das VLD (1982) Studies in Egyptian Cotton (G. barbadenseL.) and their yield components. Cotton Devel 11:7-24
Kadapa SM (1975) Earliness in cotton: a study of componentcharacters. Mysore J Agric Sci 9: 219-229
Kannayan KA ,Veluswamy(1969) A study on flowering andfruiting in G. hirsutum L. varieties of cotton. MadrasAgric J 56 : 391-400
Patil MS (1974) Association between some qualitativecharacters in 6 x 6 diallel cross population of cotton(G. herbceum L.). Mysore J Agric Sci10-17-21
Tewolde H. , Fernandez CJ ,Foss DC(1994) Maturity onnitrogen and phosperous deficient Pima cotton. AgroJ 86 (2) : 303-309
Villareal JM( 1991) Inheritance and co-relation of somequantitative traits associated with earliness in uplandcotton (Gossypium hirsutum L.). College Leguna(Philippines) 135 leaves
The present field experiment was conducted during the year2010-11 under integrated farming system research project,Kuthulia farm of JNKVV Rewa. The study reveals that therice varieties Pro Agro 6444 and Pro Agro 6201 were foundbetter than Kranti and PS- 5 varieties of rice. The garlic cropgave maximum rice equivalent yield in Rabi which wassignificantly superior rest of the crops tried in Rabi followedby Potato, berseem and lentil. These cropping systems gavehigher rice equivalent yield than wheat. The crops likechickpea, linseed, pea and mustard were found inferior thanwheat. The rice- garlic cropping system gave gross monetaryreturn of ` 237600/ha and net monetary return Rs. 106196/ha which was higher than all the rice based cropping system.However, benefit; cost ratio was 2.2 in rice- lentil, 2.0 in rice-potato, 1.9 in rice – mustard and 1.8 in rice- garlic croppingsystems. Rice- Linseed cropping system gave benefit : costratio less than one.
Keywords : Rice, farming system
Rice- wheat, rice-gram and rice-lentil are the majorcropping system in Rewa region of Madhya Pradesh.These cropping system are widely adopted by thefarmers due to stable production and less labourrequirement (Kumar et al. 2001). But continuous adoptionof these cropping systems has lead to the problem ofspecific weeds, reduced soil fertility in specific root zone,development of soil sickness and infestation of similarkind of pest which ultimately resulted in decline theefficiency and productivity of system (Katyal 2003 andKumar and Yadav 2005). Rice is the predominant crop inRewa region of Madhya Pradesh. It is difficult to replacethe rice by any other crop in rainy season due to soil andclimatic condition. Hence, only option left is to replacewheat, gram and lentil crop in winter season for
diversification of rice based cropping systems which havenot been evaluated for Rewa region of Madhya Pradesh.
Material and Methods
The present field experiment was conducted during 2010-11 at JNKVV farm of Kuthulia under all India coordinatedresearch project on farming system. The soil of experimentfield was silty loam in texture which was low in availablenitrogen (224 kg/ha) and phosphorus (8.2 kg/ha) and highin available potash (315 kg/ha). Ten cropping system (rice-wheat, rice- gram, rice- berseem, rice- potato, rice – garlic,rice—lentil, rice- linseed, rice- pea, rice-linseed + chickpeaintercropping and rice- mustard) were taken in randomizedblock design with four replication. The fertilizer dose was150 kg N, 75 kg P2O5 and 50 kg K2O per ha, for hybridrice (Pro-Agro 6201 and Pro- Agro 6444). The fertilizerdose was 120 kg N, 60 kg P2O5 and 40 kg K2O per ha inrice variety Kranti and Pusa sugandha- 5. The rice cropwas transplanted at the spacing of 20cm x 15 cm, on 26July 2010. The gross plot size was 4.5 m x 6m, in differentcropping system. Rabi crops were planted atrecommended spacing with recommended fertilizer dose.The sowing of different Rabi crops were done on 16thNovember 2010-11. The number of irrigation were oneirrigation in gram, pea and linseed, five irrigation in wheat,berseem and two irrigation in mustard and potato. All theother recommended package of practices were adopted.
Result and Discussion
The yield data of rice and different rabi crops havebeen given in Table 1. It is evident from the result thatrice yield was differed significantly under differentcropping systems. The rice variety Pro Agro 6444 gave92.75 q/ha grain yield which was significantly superior
Evaluation of different rice based cropping system underirrigated condition of Rewa region
Sandhya Mishra, B.M. Maurya and P.S. YadavAll India Coordinated Research Project on Farming SystemCollege of AgricultureJawaharlal Nehru Krishi Vishwa VidyalayaRewa 486 001 (MP)
210
to all the rice variety in different cropping system followedby 85.34 q/ha in Pro Agro 6201 in rice –pea and 82.5 q/ha in rice – potato cropping system. The rice variety ProAgro 6444 in rice- garlic and Pro Agro 6201 in differentcropping system gave 23.01% and 9.41 % higher grainyield as compared to rice variety Kranti in rice- wheatcropping system.
The data on rice equivalent yield under differentcropping system has been given in Table 1. It is clearfrom the result that the garlic gave 187.11% higher riceequivalent yield than wheat followed by 71.5% in potato,8.83% in berseem and 8.86% in lentil as compared torice-wheat cropping system. The rice equivalent yieldwas decreased by 32.47% in chickpea, 62.21% inlinseed, 9.06% in pea and mustard and 41.72% inchickpea + linseed intercropping as compare to wheat.It is because of the facts that the quantity of produceand market price of produce were higher in garlic andpotato. The lower yield of rice variety Pusa Sugandha5 in rice- linseed, rice-lentil and rice- mustard croppingsystem was the major reason for low productivity ofthese systems (Sharma et . al. 2004).
Data on gross monetary return, net monetary return andB:C ratio have been given in Table 1. It is clear from theresult that rice- garlic system gave higher grossmonetary return 237600/ha but it required higher costof cultivation. The net monetary return 106196/ha wasalso maximum in rice- garlic system followed by rice-potato ` 74006/ha and rice- lentil ` 49322/ha. Thebenefit :cost ratio was maximum in rice- lentil system(2.2) followed by rice- potato (2.0), rice- mustard (1.9),rice- garlic (1.8) and rice- wheat (1.69). While, rice-linseed gave minimum benefit :cost ratio (0.83). Thecropping system rice (Pro Agro 6444)- garlic, rice (ProAgro 6201)- potato, rice (Pro Agro 6201)- berseem andrice (PS- 5) – mustard were found fit for cropdiversification in rabi season as compared to rice- wheatcropping system for Kymore Satpure Agro climatic zoneof Madhya Pradesh. The similar findings were alsoreported by Sharma and Jain (1997) and Uppadhaya etal. 2007.
/kku&elwj Qly pØ ls izkIr gksrk gSA tcfd lcls de equkQk /kku&vylh Qly pØ ls izkIr gqvkA fofHkUu Qly dzeksa esa /kku&vkyw] /kku&ljlks ,oa /kku&yglqu ls vk;&O;; vuqikr 1-8 ls 2-0 rd izkIrgqvkA vr% mudh [ksrh Hkh /kku & xsgwW Qly Øe dh rqyuk esa ykHknk;hgSA
References
Katyal JC (2003) Soil fertility management. A key to preventdesertification. J Soc Soil Sci 51 : 378- 387
Kumar A, Yadav DS (2005) Influence of continuous croppingand fertilizer on nutrient availability and productivityalluvial soil. J Indian Soc Soil Sci 53 : 194 –198
Kumar A, Yadav DS, Singh RM, Achal R (2001) Productivity,profitability and stability of rice (Oryza sativa) basedcropping system in eastern Uttar Pradesh. Indian JAgron 46 (4) : 573-577
Sharma RP, Pathak SK, Haque M, Raman KR (2004)Diversification of traditional rice (Oryza Sativa)based cropping system for sustainable productionin south Bihar alluvial plains. Indian J Agron 49 (4): 218-222
Sharma RS, Jain KK (1997) Agronomic research advancesin rice- wheat system in M.P. Advances in AgriculturalResearch in India 7 : 139-151
Upadhyay VB, Jain V, Vishwakarma SK, Kumar AK (2007)Diversification of rice based cropping system forKymore Plateau and Satpura hills zone of MadhyaPradesh, sustainable Agriculture production.Extended summaries, 3rd National Symposium onintegrated farming system p 128-130
Influence of doses of organic manure on direct seeded rice undercondition of kymore plateau zone of Madhya Pradesh
Nisha Sapre, Ruchi Tekam and Girish JhaDepartment of AgronomyJawaharlal Nehru Krishi Vishwa VidyalayaJabalpur 482 004 (MP)
Abstract
A field experiment was conducted at Department ofAgronomy, JNKVV, Jabalpur (M P) during, kharif of 2011 tostudy the effect of shakambhari on growth and yield of directseeded rice. Eight treatments comprising of recommendeddose of fertilizer (120:60:40 kg NPK/ka) with different levelsof shakambhari was evaluated in a randomized block designwith three replications. RDF + 175% of Shakambhari werefound superior. All the growth parameters, yield attributingcharacters and yield were significantly superior.
Keywords : Organic manure, rice
Rice (Oryza sativa L.) is the most important staple foodfor 65% of the population in India and most popular foodof the developing world. In India it is grown on nearly 41.9million hectare with the production of 89.13 million tonesand productivity 2130 Kg/ha (Anon 2010). Direct seededrice cultivation has become popular and promises asalternative to transplanted rice as it reduces about 30%cost of cultivation. It is practiced nearly one third of thetotal rice area of the country in spite of constrains becausetransplanting being a labour intensive and costly (Jha etal. 2007). Organic farming has entirely different perspectivebetween developed and developing countries. It canprovide high quality food material. That has been producedwithout any serious ecological impact and harmfulresidues (Marwaha and Jat 2004). Incorporation of organicmanures and bio-fertilizer has exhibited a hope to reducethe cost of cultivation and minimize the adverse effects ofchemical fertilizers. Hence, the present study wasconducted to study the effect of different dose of organicmanure Shakambhari in rice.
Material and methods
A field experiment was conducted at Product testing Unit,Department of Agronomy, JNKVV, Jabalpur, during, kharif
season of 2011. Aimed to assess the productivity of riceunder recommended dose of fertilizer (RDF) with differentdoses of Shakambhari and their subsequent effect onsoil properties and plant. The soil of experimental fieldwas clayey in texture, neutral in reaction (pH-7.3) withnormal EC (0.31) and low OC (0.64). NPK availability ofsoil were medium (392 kg/ha), low (17.45 kg/ha) and high(297 kg/ha), respectively. The rainfall was 1451.2 mmand weather condition was normal thought out the cropseason.
Eight treatments comprising of recommendeddose of fertilizer (RDF) with different dose of organicmanure Shakambhari viz., T1-RDF alone (120:60:40 kgNPK ha-1), T2-RDF + 25% of Shakambhari, T3-RDF + 50%of Shakambhari, T4-RDF + 75% of Shakambhari, T5-RDF+ 100% of Shakambhari, T6-RDF + 125% of Shakambhari,T7-RDF + 150% of Shakambhari, T8-RDF + 175% ofShakambhari, were tested in a randomized block designshaving 3 replications. Rice var. IR 64 was sown directlyat 20 cm row spacing on July 7, 2011. Fertilizers andShakambhari were applied as per the treatments atdifferent intervals. The crop was grown under assuredirrigation. Weed control and other protection measureswere under all treatments as recommended package ofpractice. The crop was harvest on November first week,2011. Finally economic viability of the treatments wascalculated.
Results and Discussion
Growth parameters
Treatment T8 (RDF + 175% of Shakambhari) exhibitedsignificantly higher plant height 75.7 cm over T1 (RDFalone) 71.6 cm at maturity of crop (Fig.1). Similarly,Number of tillers/ meter row length 75.75 (Fig.2), leaf areaindex 7.21 and crop growth rate 13.55 g/day/m2 (Fig.3),relative growth rate (0.0484 g/g/day/m2), net assimilation
213
Table 1. Growth and growth parameters of rice as influenced by different treatments
Treatments Plant height No. of LAI CGR RGR NAR(cm) tillers/mrl (g/day/m2) (g/g/day/m2) (g/m2/day)
Table 3. Economics of rice cultivation as influenced by different treatments
Treatments GMR (Rs/ha) Total expenditure (Rs/ha) NMR (Rs/ha) B:C Ratio
T1-RDF alone 46228 18304 27924 2.53T2-RDF + 25% of Shakambhari 49245 20465 28780 2.41T3-RDF + 50% of Shakambhari 52157 22626 29531 2.31T4-RDF + 75% of Shakambhari 56224 24787 31437 2.27T5-RDF + 100% of Shakambhari 58285 26948 31337 2.16T6-RDF + 125% of Shakambhari 61319 29408 31911 2.09T7-RDF + 150% of Shakambhari 64153 31269 32884 2.05T8-RDF + 175% of Shakambhari 67047 33430 33617 2.01
214
215
rate (0.04153 g/ m2/day) was the highest under T8 (Fig.4).While all the above growth parameter were minimum underT1 (Table.1). The increase in growth parameters wasattributed to the fact that application of organic manureincreased the soil organic carbon that holds greatermoisture in soil and creats of suitable condition for betterroot growth and proliferation and also opportunity to extractwater from larger profile area. These results were inconformity with the findings of Rao et al. (2004) andShekara et al. (2009).
Yield attributes and yield
Number of effective tillers/meter row length 62.24 (Fig.5),panicle length (26.7 cm), number of grains/anicle (108.23),grain weigh per panicle (4.51g) and test weigh (25.26 g)found highest under T8 (RDF + 175% of Shakambhari)(Fig.6) .While, all the above growth parameters were foundminimum under T1 (50.01,23.29 cm,96.27,3.87g and 25.16g, respectively). Similarly, highest grain yield 60.61q/haand straw yield 107.28q/ha were observed under T8 .While,minimum were found under T1 (RDF alone) 41.40q/ha and80.46 q/ha, respectively (Table 2 and Fig.7). Increase inyield attributes and yield might be due to the favorableeffect of Shakambhari on the availability of nutrients tothe crop, taht enhanced the effectiveness of tillers, grains/panicle as well as length of panicle. These results areclosely conformity to the findings of Singh et al. 2008and Mankotia et al. (2008).
Economics
The gross monetary returns was maximum (Rs67047/ha) with T8 (RDF + 175% of Shakambhari) followedby T7 (RDF + 150% of Shakambhari). The gross monetaryreturns was remarkably minimum (Rs 46228/ha) with T1(RDF alone) among all treatments. Treatment T8 recordedmaximum net monetary returns (Rs 33617/ha) with 2.01B:C ratio among all treatments. While, treatment T1 gavethe profit up to Rs 27924/ha with 2.53 B:C ratio (Table 3).After the calculation of treatment cost it was found thatone gram Shakambhari valued about Rs. 4.17 and it
increased the cost of cultivation about 2161Rs/ha as everyincrease of 25% of Shakambhari from RDF. Therefore, allthe treatments show gradually increase in cost ofcultivation with increasing dose of Shakambhari. Theseresults are in conformity with the findings of Bhoite (2005).
Anonymous (2010) Agricultural Statistics-2009-10.Agriculture at a glance. Ministry of Agriculture andCo-operation, Government of India, New Delhi
Bhoite SV (2005) Integrated nutrient management in basmatirice (Oryza sativa L.) - wheat (Triticum aestivum)cropping system. Indian J Agron 50(2): 98-101
Jha AK, Sharma RS, Vishwakarma SK (2007). Developmentof resource conservation techniques for tillage andsowing management in rice-wheat cropping systemunder irrigated production system of Kymoreplateau and satpurahill zone of Madhya Pradesh,JNKVV, Res J 41 (1):26-31
Mankotia BS, Shekhar J, Thakur RC, Negi SC (2008) Effectof organic and inorganic sources of nutrients onrice (Oryza sativa)- wheat (Triticum aestivum)cropping system. Indian J Agri 53(1): 32-36
Marwaha BC, Jat SL (2004) Status and scope of organicfarming in India. Fertilizer News 49(11):41-48
Rao UV, Ramu YR, Kumara CR, Reddy CR (2004) Effect oforganic and inorganic sources of nitrogen ongrowth, yield, nitrogen uptake and economics of lowland rice. Madras Agri J 91(7): 289-293
Shekara BG, Sharnappa , Krishnamurthy N (2009) Effect ofirrigation schedules on growth and yield of aerobicrice (Oryza sativa) under varied levels of farmyardmanure in Cauvery command area. Indian J Agro55(2): 35-39.
Singh YP, singh, Ranbir, and Neeraj Kumar (2008)Response of rice (Oryza sativa) and wheat(Treticum aestivum) to gypsum rate in sodic soil.Indian J Agric Sci 78(4): 362-365
Microsatellite markers were used for fingerprinting and testingof genetic purity of hybrid and their parents in rice. 56 sequencetagged microsatellite sites (STMS) markers were employedfor fingerprinting six hybrids and their parental lines (4x3).Twelve STMS markers were found polymorphic across thehybrids. All the 12 were amplified as heterozygous in all thehybrids, whereas eight (JGT 3 - 36.1, RM 15331, RM 423,RM 449, RM 510, JGT 04 -18.1, RM 8126, and JGT 11 -16.3) may differentiate the lines as Restorer or Female (Aline). Female parents (IR 58025A, IR 68886 A, IR 68897Aand Pusa 6A) may be differentiated by primer RM 6938, RM28157 and JT 02 - 9.1 whereas male parents (NPT 10, NPT65 and NPT 70) by RM-6938 and few hybrids by JGT 02 - 9.1,JGT 04 -18.1 and RM 28157.
Rice is the principal food crop, feeding more than halfof the world’s population (Virmani 1999). Phenomenonof heterosis is exploited commercially for yieldenhancement in rice primarily based on three-linesystem. Assessment and maintenance of genetic purityof the parental lines and hybrids is crucial for thesuccessful adoption of hybrid rice technology. Molecularmarkers have the potential in achieving this goal(Yashitola et al. 2002; Rajendrakumar et al. 2007).
Identification and verification of elite crop varietiesand hybrids is essential for seed production, certification,and maintenance breeding and ultimate protection. Atpresent National Test Guidelines based on the expressionof morphological traits is currently used for verification,estimation of distinctiveness and protection of a variety.Expressions of listed traits in the guidelines are sensitiveto environment. Molecular markers provide an unbiased
means of identifying crop varieties (Yashitola et al. 2002).The Biochemical and Molecular Techniques Group of theInternational Union for the Protection of New Varieties ofPlants (UPOV) is evaluating different DNA markerparameters prior to its routine use in establishingdistinctness, uniformity and stability of plant varieties(UPOV-BMT 2002).
To test the genetic purity of hybrid seeds, one mustbe able to distinguish, within a random sample of seed,those formed by crossing the female and male parents(hybrid seed); seed formed by a self-pollinated femaleparent (B line); the seed of male parent (A line) mixedby error; seed of other genotype or the seed is hybridbut not of designated one. The genetic heterogeneity,if any, within the parental lines could lead to lack ofuniformity in the commercial F1 seeds resulting into pooracceptance of the hybrid produced and adverse mutantvalues. Since the STMS markers are co-dominant, theycan be used for unambiguous identification of both thehomozygotes and the heterozygotes at a particularmarker locus. Thus, these markers have the potentialto test genetic heterogeneity within the parental lines.Among the various DNA based markers currentlyavailable, genetically mapped sequence taggedmicrosatellite sites (STMS) are the markers of choicein rice because of their abundance, co-dominant natureand uniform distribution throughout the genome(McCouch et al. 2002). Higher level of polymorphismamong rice varieties and hybrid with AFLP, ISSR andSSR marker (Saini et al. 2004; Nandkumar et al. 2004;Sundaram et al. 2008) have been reported for distinctnessand hybridity test.
The primary objective of the present study was toidentify the six rice hybrids of JNKVV, Jabalpur anddifferentiation of their parental lines by employing STMSmarkers, and to provide bases for protection of restorer
Assessment of genetic purity of hybrid and their parents in riceusing microsatellite markers
Chanchal Mishra, Niraj Tripathi*, D. Khare, N. Saini* and G.K. KoutuDepartment of Plant Breeding and Genetics*Biotechnology CentreJawaharlal Nehru Krishi Vishwa VidyalayaJabalpur 482 004 (MP)
217
lines developed from indica X japonica crosses with theselection pressure towards New Plant Type.
Material and Methods
DNA from the young leaves and seedlings of six ricehybrids developed by JNKVV, Jabalpur and theirparental lines (Table 1) were isolated by CTAB method(Saghai-Maroof et al. 1984) and quantified in UVspectrophotometer. In all 56 SSR markers and 14random decamer nucleotide 10 – mer primers (Williamset al. 1990) were used to test the hybridity and verify thehybrids and their parents in reference to genetic puritytest during Kharif 2008. SSR amplified products wereresolved on 3.5% (w/v) high resolution agarose (SigmaAldrich) and 4% denatured polyacrylamide gel, asdescribed by Chen et al. (1997).
Result and Discussion
Out of 56 SSR primers, 12 were found polymorphic acrossthe parents and hybrids (Table 2). All the 12 markerswere amplified as heterozygous in all the hybrids. In allnine markers amplified both the alleles of their respectiveparents in all the hybrids under study. Therefore they mayidentify hybrid seed without differentiating hybrids.
Eight polymorphic marker viz., JGT 3 - 36.1, RM15331, RM 423, RM 449, RM 510, JGT 04 -18.1, RM8126, and JGT 11 -16.3 differentiate the lines asRestorer or Female. However identification of genotypewas not possible with these markers. A total of 69 alleleswere amplified with the maximum number i.e., three bymarker JGT 4 -18.1 and RM 28157.
Primer RM 6938 and JT 02 - 9.1 located on
Table 1. Details of parental lines and hybrids of rice
Genotype Parentage ReferenceGroup I - CMS (female) line
IR 58025A IR 48483A X Pusa 167-120-3-2 Sundaram et al. (2008)IR 68886 A IR 62829A X IR 62832-58-7-8-1-8-12-4IR 68897A IR 62856-15-3-1-1-7-5-10-3Pusa 6A ?
Group II - RestorersNPT 10 Selection from indica x japonica crossesNPT 65NPT 70
Group II - HybridsJRH 4 86 A X NPT 65JRH 5 97 A X NPT 65JRH 10 97 A X NPT 10JRH 11 Pusa 6 A X NPT 70JRH 12 25 A X NPT 70JRH 13 86 A XNPT 10
A set of 56 SSR markers, well distributed all overthe genome i.e., 5 on chromosome number 1; 7 onchromosome number 2; 4 on chromosome number 3; 1on chromosome number 4; 5 on chromosome number 5;4 on chromosome number 6; 5 on chromosome number7; four on chromosome number 8; 4 on chromosomenumber 9; 4 on chromosome number 10; one onchromosome number 11 and 02 on chromosome number12 were used whereas location of 10 markers were notknown.
chromosome number 2; JGT 04 -18.1 on chromosomenumber 4 and RM 28157 on chromosome number 12were able to discriminate female parents based on thealleles produced by these markers. Primer JT 02 - 9.1amplified a specific allele of about 400 bp in parent 86Awhile primer JGT 04 -18.1 amplified specific alleles ofabout 96 bp and 250 bp in parent 97A and 25Arespectively, while two alleles of about 110 and 250 bpwere amplified in parents 86A and Pusa 6A. Primer RM6938 differentiated the parents, 97A and 86A from 25Aand Pusa 6A. Similarly Microsatellite marker RM 28157
218
differentiated the parents, 97A and 25A from 86A andPusa 6A. Maximum four and minimum two micro-satellitemarkers were able to show polymorphism in each hybrid(Table 3). The frequency of heterozygocity for a hybridranged from 33% to a maximum of 16% (Table 4). Atleastone polymorphism was detected with the set of markersfor each of the parental combination being used in hybrid
seed production. Sundaram et al. (2008) also identifiedsome SSR markers those differentiate the few of these Alines.
The restorer lines were the advance lines of theindica x japonica crosses selected in the background ofNew Plant Type. Out of 56 SSR markers only one wasfound polymorphic. Very little diversity at molecular levelshowed that restorer lines might be the advance lines ofthe same cross with variation in phenological traits. Amongthe restorer lines, marker RM 6938 amplified a specificallele of about 270 bp in NPT 70 and allele of size 265 bpin NPT 10 and NPT 65. The markers RM 6938 amplified aspecific allele in restorer NPT 70, which is different thanthe amplification in remaining two restorer lines. Themarkers RM 6938 may be used for protection of restorerand hybrids.
The six hybrids developed using three R-lines andfour A-lines amplifying both alleles of their respectiveparents. No unique or cross amplification was observedin these hybrids. Marker JGT 02 - 9.1, JGT 04 -18.1 andRM 28157 amplified differently among the hybrids. Byusing a set of three markers we can identify anddifferentiate the above studied hybrids. Identification anduse of such hybrid specific markers can effectively reducethe cost and simplify the procedure of hybrid identification.
Acknowledgement
The authors are thankful to Dr. R.M. Sundaram,Directorate of Rice Research, Hyderabad for technicalsupport and help.
Table 2. SSR markers exhibiting polymorphic expression across the parents and hybrids of rice
Name Forward sequences Reverse sequences Chromosome
/kku es ladj ,oa muds tudksa dh vuqokaf'kd 'kqYrk ,oa fQxaj fizafVaxgsrq ekbØkslsVykbV fpUgdksa dk mi;ksx fd;k x;k A ckjg ,l-Vh-,e-fpUbd lHkh ladjksa esa gsVjkstkbxl :i es iznf'kZr gq, A buls vkBdrkjksa dh fjLVksjj ;k uj uaiqld ds :i esa igpku dh tk ldrhgS A uj tudksa dks ds-vkj-,e- 6938 ds }kjk rFkk dqN ladjksa dksts-th-Vh- 02-9-1] ts-th-Vh- 04-18-1 rFkk vkj-,e- 28157 ds}kjk vyx igpkuk tk ldrk gS A
References
Virmani SS (1999) Exploitation of heterosis for shifting theyield frontier in rice. In: JG Coors & S Pandey (Eds)The Genetics and Exploitation of Heterosis in Cropspp. 423–438 CIMMYT ASA CSSA Madison WI
Yashitola J, Thirumurugan T, Sundaram RM, Naseerullah MK,Ramesha MS, Sarma NP, SontiI RV (2002)Assessment of purity of rice hybrids usingmicrosatellite and STS markers. Crop Sci 42:1369–1373
Rajendrakumar P, Biswal AK, Balachandran SM, RameshaMS, Viraktamath BC, Sundaram RM (2007) Amitochondrial repeat specific marker fordistinguishing wild abortive type cytoplasmic malesterile rice lines from their cognate isogenicmaintainer lines. Crop Sci 47:207-211
UPOV-BMT (2002) BMT/36/10 Progress Report of the 36thSession of the Technical Committee, the technicalworking parties and working group on biochemicaland molecular techniques and DNA-profiling inparticular Geneva
McCouch RS, Teytelman L, Xu Y, Lobos BK, Clare K, WaltonM, Maghirang R, Li Z, Xing Y, Zhang Q, Kono I, YanoM, Fjellstorm R, Declerk G, Schneider D, CartinhourS, Ware D, Stein L (2002) Development and mapping
of 2240 new SSR markers for rice (Oryza sativa L.)DNA Res 9:199-207
Saini N, Jain N, Jain S, Jain RK (2004) Assessment of geneticdiversity within and among Basmati and non-Basmatirice varieties using AFLP, ISSR and SSR markers.Euphytica 140: 133-146
Nandkumar N, Singh AK, Sharma RK, Mohpatra T, PrabhuKV, Zaman FU (2004) Molecular fingerprinting ofhybrids and assessment of genetic purity hybridseeds in rice using microsatellite markers. Euphytica136:257- 264
Sundaram RM, Naveenkumar B, Birader SK, BalachandranSM, Mishra B, Ilyas Ahmed M, Viraktamath BC,Ramesha MS, Sarma NP (2008) Identification ofinformative SSR markers capable of distinguishinghybrid rice parental lines and their utilization in seedpurity assessment. Euphytica (published online-10.1007/s10681-007-9630-0)
Saghai-Maroof MA, Soliman KM, Jorgensen RA, Aallard RW(1984) Ribosomal DNA spacer length polymorphismsin barley: Mendelian inheritance, chromosomallocation and population dynamics. Proc Natl AcadSci USA 81:8014-8018
Williams JGK, Kubelic AR, Livak KJ, Rafalski JA, Tingey SV(1990) DNA polymorphisms amplified by arbitraryprimers are useful as genetic marker. Nucl AcidsRes 18:6531-6535
Chen X, Temnykh S, Xu Y, Cho YG, McCouch SR (1997)Development of a microsatellite framework mapproviding genome wide coverage in rice (Oryza sativaL.). Theor Appl Genet 95: 553–567
All the fertilizer doses tested were found to reduce diseaseintensity of RAB in soybean. Three doses 150%NPK, 100%NPand 100%N had very little effect in reducing the diseaseintensity. Maximum per cent disease control of 33.0 per centwas recorded in 100%NPK+ FYM followed by 100%NPK+Znof 29.2 per cent. Maximum of 19.7 per cent loss in 1000 seedweight due to RAB was observed in 100%N whereas minimumloss of 16.3 per cent in 150%NPK. RAB cause quantitative(yield loss, 1000 seed weight) and well as qualitative loss(discoloration, shriveled) in seeds. Nitrogen alone or incombination with Phosphorus could not reduce the diseaseseverity. Full dose of NPK alone or with Zn helped in reducingthe disease.
Keywords: Soybean, RAB, fertilizer
Major soybean (Glycine max (L.) Merrill) producingstates in India are Madhya Pradesh, Maharashtra,Rajasthan, Karnataka and Andhra Pradesh. In MadhyaPradesh, it is being grown in an area of 55.193 lakhhectares during the year 2010 with the production ofabout 60.987 lakh MT. with productivity level of 1105kg/ha (SOPA 2010). Soybean suffers from manydiseases such as yellow mosaic disease (Mungbeanyellow mosaic virus), charcoal rot (Rhizoctoniabataticola), collar rot (Sclerotium rolfsii), Rhizoctonia rootrot and Rhizoctonia aerial blight (RAB) caused byRhizoctonia solani. Rhizoctonia foliar blight has beenreported to cause epiphytotics in soybean throughoutthe world (Jones and Belmar 1989, Yang et al. 1990, Liuand Sinclair 1991, Muyolo et al. 1995 and Embrapa 1999).Occurrence of RAB in the epidemic form was recorded inLa, USA during 1973 and 1975 (Neill et al. 1977). In theyear 1993 soybean yield was reduced by 18% due toRAB (Black et al. 1989) and in Brazil and northwest Brazilby 31 to 60% (Fenille et al. 2002). Annual losses due toRAB in India is 879.6mt USA 111.5mt, China 16.6mt,and in Brazil 14.4mt. It has attained serious proportion
ever since it was first reported in India. In India this diseasewas first time came in record from Sikkim in 1987-88(Srivastava and Gupta 1989) and from Rajasthan during asurvey at Banswara (Goyal and Ahmed 1988). Culturalmeasures are considered as important choices for thecontrol before the establishment of the disease. Basedon evidences that potassium (K) amendments cansubstantially reduce the severity of several soybeandiseases such as Cercospora leaf blight (Cercosporakikuchii), pod and stem blight (Phomopsisphaseoli var. sojae) and stem canker (Diaporthephaseolorum f.sp. meridionalis). Despite all evidence,there is little information in the literature about the effectof NPK fertilizer application in controlling soybeanfoliar blight hence investigations were undertaken.
Material and Methods
The present investigation was undertaken in theDepartment of Soil Science and Agricultural ChemistryResearch Farm, JNKVV Jabalpur during 2010-11. Thematerials used and methods followed were as follows:
Effect of various doses of fertilizers
To assess the effect of various fertilizer doses on diseaseintensity of Rhizoctonia aerial blight, a field trial waslaid out in experimental farm, Department of SoilScience and Agricultural Chemistry Adhartal. Thepresent study pertains to 10 treatments of theexperimental plan, replicated four times in a randomizedblock design. The gross size of each plot was 17×10.8m2 with 1m spacing in between the plots and 2m amongthe replications including Treatments as T1 – 50% NPKT2 – 100% NPK T3 – 150% NPK T4 – 100% NPK + HWT5 – 100% NPK + Zn T6 – 100% NP T7 – 100% N T8 –100% NPK + FYM T9 – 100% NPK – S and T10 – Control.
Effect of fertilizer doses on the intensity of aerial blight(Rhizoctonia solani) of soybean
R.K. Varma, Kamlesh Patel and S.D. SawarkarDepartment of Plant PathologyJawaharlal Nehru Krishi Vishwa VidyalayaJabalpur (MP) 482 004
221
Optimal NPK doses (100per cent ) based on initial(1972) soil test values were nitrogen 120:80:40 and20:80:20 for wheat and soybean respectively. Nitrogenwas applied through urea, phosphorus through singlesuper phosphate except in treatment T9, whereapplication of sulphur was omitted therefore, di-ammonium phosphate was used as a source forphosphorus and the dose of nitrogen was adjustedthrough urea, potassium was applied through murateof potash. In T8 treatment the FYM was applied @ 15ton ha-1 to soybean crop every year. For calculation of1000 seed weight, separate plot of each treatment wassprayed with carbendazim (0.15%} first at the onset onthe disease and second after 10 days of first spray.Seeds were harvested and at 9 per cent moisture 1000seed weight were measured.
Calculation of Percent Disease Index (PDI)
Select randomly ten plants in each treatment (plot) andeach selected plants should be approximately dividedinto three positions as bottom, middle and top. Fromeach position three to five leaves should be graded asper the following diseases assessment key of Mayeeand Datar which is mainly based on the percent leafarea infected (0 to 9 scales).
These grades are then utilized for the calculation of
On the basis of PDI, the entry/variety will be classifiedas follows:
Percent disease control was calculated by followingformula.
Control - Treatment = x 100
Control
Results and Discussion
Effect of fertilizer doses
The data presented in the Table 1 indicated that rangeof PDI (Per cent disease index) ranged from 22.9 percent to 55.9 per cent. Similarly range of percent losswas from 20.44 per cent to 55.22 per cent. MaximumPDI 55.9 per cent was observed in control. Amongtreatments maximum PDI 45.2 per cent was recordedin 100%N, whereas minimum PDI 22.9 per cent wasobserved in 100%NPK.+Zn. Observation showed thatmaximum per cent loss of 55.22 per cent was recordedin control followed by 100%N of 42.16 whereas minimumper cent loss of 20.44 was recorded in 100%NPK+FYM.All the fertilizer doses tested were found significantlyeffective in reducing the disease severity of RAB insoybean. Per cent disease control over control rangedfrom 10.7 per cent to 33.0 per cent.
Maximum per cent disease control of 33.0 percent was recorded in 100%NPK.+Zn followed by100%NPK+FYM of 29.2 whereas minimum per centdisease control of 10.7 per cent was recorded in 100%N.Two treatments i.e. 100%N and 100%NP had reduced10.7 and 10.8 per cent disease control over check (no
0 No lesions/spots1 1% of the leaf area covered with lesions/
spots3 1.1 to 10% of the leaf area covered with
lesions/spots, no spots on stem.5 10.1 to 25% of the leaf area covered no
defoliation-little damage.7 25.1 to 50% of the leaf area covered,
some leaves drop, death of a few plants,damage conspicuous.
9 >50.1 % of the leaf area covered, lesions/spot vary common on all plants,defoliation common, death of plantscommon, damage more than 50%
PDI using the following formula of Wheeler.
Percent diseaseindex (PDI)
Sum of individualrating
No. of leavesexamined
Max. diseaserating
= x100
Percent DiseaseControl (PDC)
222
fertilizer) as compared to other treatments.
Effect of RAB on 1000 Seed weight
Effect of various doses of fertilizers on 1000 seeds wasstudied on the basis of yield in protected andunprotected crop and presented in the Table 2.
The data presented in the Table-2 indicated thatrange of PDI (percent disease index) of nine fertilizerdoses was between 15.3 per cent to 55.9 per cent andrange of per cent loss was between 16.3 per cent to
21.0 per cent. Maximum PDI 45 per cent was observedin T7 (100%N) as compared to 55.9 per cent in control.Minimum PDI of 15.3 per cent was recorded in 50%NPK.Maximum per cent loss of 21.0 per cent was recordedin control followed by 19.7 per cent in 100%N. Minimumof 16.3 per cent loss was observed in 150%NPKfollowed by 16.8 per cent in 100%NPK+Zn. Data alsoexhibited that none of fertilizer doses had 1000 seedweight equal to protected i.e. 100g.
All the fertilizer doses tested were found to reducedisease intensity. Maximum per cent disease control of72.6 per cent was recorded in 50%NPK followed by
Table 1. Effect of different fertilizer doses on disease intensity of RAB and yield of soybean
S.No. Treatments PDI Yield (Kg/ha) Loss (%) PDCProtected Unprotected
100% NPK-S of 66.9. Disease intensity increased withincreased doses of nitrogenous fertilizer uptorecommended doses have been reported by manyworkers (Sarkar et al. 1991, Borthakur et al. 1989, Slatonet al. 2003, Tang et al. 2007 and Cartwright et al. 2000).Similar findings have been also reported by Guzmanand Nieto (1992) and Basu (1996) in sheath blight ofpaddy and Patel and Bhargava (1998) in soybean.Kashem et al. (1994) reported significantly increase indisease intensity with increase in fertilizer doses.Reduction in disease intensity with the application of Khave been reported by Basseto et al. 2007, Adebitan 1998and Wan et al. 2005. Sati and Sinha (2005) found thatamong the treatments, K alone or in combination with Nor P reduced the survival of the mycelium of the pathogenin plant debris. Thus effect of recommended/combinationof fertilizer on disease intensity of RAB is lacking. Thepresent investigation indicated variable reduction indisease intensity due to application of fertilizers. Thisdifference in opinion might be due to difference in crop,causal agent and/or ecological variations.
iz;ksx esa yk, x, lHkh jklk;fud [kkn dh ek=k ls lks;kchuesa jkbtksdVksfu;k vaxekjh dh rzhork esa deh ikbZ xbZ A rhu ek=k150 izfr’kr ,u-ih-ds-] 100 izfr’kr ,u-ih- vkSj 100 izfr’kr,u- esa vlj de Fkk A jksx dh rzhork esa lcls T;knk deh ¼33izfr’kr½ 100 izfr’kr ,u-ih-ds- $ xkscj dh [kkn rFkk 100izfr’kr ,u-ih-ds- $ ftad ¼29-2 izfr’kr ½ ij ukih xbZ A 1000cht ds otu esa lcls T;knk uqdlku ¼19-7 izfr’kr ½ 100 izfr’kru=tu rFkk lcls de uqdlku ¼16-3 izfr’kr½ 150 izfr’kr ,u-ih-ds- ij vakdh xbZ A dsoy u=tu ;k u=tu ds lkFk QklQksjlmi;ksx djus ls jksx dh rzhork ij T;knk vlj ugha vkadk x;kAvuq’kaflr ek=k ;k fQj vuq’kaflr ek=k ds lkFk ftad ds mi;ksx lsjksx dh rzhork esa deh ykbZ tk ldrh gS A
References
Basu A, Gupta PKS (1996) Effect of forms of nitrogen fertilizeron sheath blight of rice. Indian Phytopath 49(1):87-88
Borthakur BK, Addy SK (1988) Anastomosis groupings isolatesof Rhizoctonia solani causing rice sheath blightdisease. Indian Phytopath 41(3):351-354
Fenille RC, Spisa NL, Kuramae EE, Sousa NL (2002).Characterization of Rhizoctonia solani associatedwith soybean in Brazil. European J Pl Pathol108(8):783-792
Guzman Garcia P, Nieto Illidge L (1992) New densities andfertilizers for reducing Rhizoctonia solani in rice. Arroz41:379
Herrera I, Galantai LE, Camara M (1988) The effects of somenitrogen sources used as fertilizers on Sclerotiumrolfsii and Rhizoctonia solani Kuhn. Centro Agrico15(4):69-83
Jones RK, Belmar SB (1989) Characterization andpathogenicity of Rhizoctonia spp. Isolated from rice,soybean and other crops grown in rotation with ricein Texas. Plant Dis 73(12):1004-1010
Kashem MA, Howlider MAR, Begum HA, Rahman GKMM(1994) Effect of fertilizers on the disease severitiesof bacterial leaf blight and sheath blight of rice.Bangladesh J Sci Indus Res 29(3):89-95
Liu Z, Sinclair JB (1991) Isolates of Rhizoctonia solanianastomosis group 2-2 Pathogenic to soybean. PlantDis 76:682-687
Muyolo NG, Lips PE, Schmitthenner AF (1993) Anastomosisgrouping and Rhizoctonia solani associated with drybean and soybean in Ohio and Zaire. Phytopathology83:438-444
Neil O, Rush NR, Horn, MC, Carver RB (1977) Aerial blight ofsoybean caused by Rhizoctonia solani. Pl Dis Reptr61(9):713-717
Patel BL, Bhargava PK (1998) Aerial blight of soybean (Glycinemax) caused by Rhizoctonia solani. Indian J AgricSci 68(5):277-278
Sarkar MK, Sharma BD, Gupta PKS (1991) The effect of plantspacing and fertilizer application on sheath blight ofrice caused by Rhizoctonia solani. Beitrage zurTropischen Landwirtschaft, Veterinarmedizin29(3):331-335
Wan Gyu Kim, Sung Kee Hong, Seong Sook Han (2005)Occurrence of web blight in soybean caused byRhizoctonia solani AG-1(IA) in Korea. Plant Pathol J21(4):406-408
Yang XB, Snow JP, Berggren GT (1990) Analysis of epidemicsof Rhizoctonia aerial blight of soybean in Louisiana.Phytopathology 80:386-392
Investigation were made at farmers field in village Amkheraof Jabalpur District, with seven phyto extracts againstcoriander aphid (Hyadaphis coriandri) and grain yield duringthe cropping year of 2009- 2010 . The phyto extracts appliedin two different schedules significantly reduced the H. coriandripopulation as compared to control. The order of effectivenessof treatments applied against H. coriandri was in order ofNeem (12.75), > Lantana (17.90), > Ipomea (21.85), > Akua(24.72), > Dhatura (30.65), > Parthenium (31.15), > Custardapple (40.03), > Control(62.57). Treatments were found tohave effect on the yield of coriander. The maximum yield (741kg/ha) recorded from the plot treated with the extract of Neem(5%) was found significantly superior over other treatments.The lowest yield (510 kg/ha) was observed from the untreatedcontrol plots. The coriander crop affected with aphid attractedCoccinellid predators. All the treatments significantly affectedthe population of C. sexmaculatus in comparison to theuntreated control.
Coriander (Coriandrum sativum Linn.) is one of themost important spices used in daily food by majority ofIndians. It occupies an important place in the spiceindustry and play a major role in Indian cuisine. It isextensively grown in India, Russia, Central Europe, Asiaminor and Morocco (Kumaresan et al. 1988). India is thelargest producer of coriander with a world production shareof about 70 per cent. In India, coriander is cultivated in anarea covering 320.80 thousand ha. with a production of233.20 thousand MT and productivity of 0.72 MT/ha. during2006-2007 (Anon 2007). Coriander crop is affected bylarge numbers of insect pests and coriander aphid H.coriandri is most damaging pest of this crop. Aphidincidence on coriander occurs from flowering stage tillmaturity, resulting considerable damage in yield. Farmers
are generally using synthetic insecticides for themanagement of the pest. The ill effects of inorganicinsecticides and synthetic pyrethroids are well known andcan be avoided by replacing them with bio - pesticides.The bio - pesticides have received greater importance inrecent years due to their eco - friendly nature and thegrowing awareness about harmful effects of indiscriminateuse of synthetic pesticides. To reduce the pesticideshazards, the option is the application of insecticides ofplant origin which are easily available and safer tomankind. Neem plant has proved itself as wonderfulinsecticides of plant origin, which is harmless to higheranimals including man (Walunj et al. 1996). Keeping thesefacts in view, the present studies were under taken toevaluate the different phyto extracts for the managementof coriander aphids.
Material and Methods
The investigation was conducted on farmers field duringrabi season of the year 2009-2010 in a RandomizedBlock Design (RBD) with three replications at villageAmkhera of Jabalpur District. The coriander varietySymco 31 was grown. The phyto extracts (Custard apple5%, Ipomea 5%, Lantana 5%, Dhatura 5%, Neem 5%,Parthenum 5%, Akua 5%) were applied twice as foliarapplication using Foot Sprayer. Total quantity of spraysolution required for uniform coverage of the crop onper plot basis was worked out as for each treatmentsseparately. The crop was sprayed twice with each ofthe phyto extracts at an interval of 7 days on theappearance of the pest. Observation was recorded onthe number of H. coriandri a day before the spray andon 1st, 3rd and 7th days after spraying, from 10 randomlyselected apical twigs (10 cm length/ 10 randomlyselected plants/plot). At harvest of the crop, grain yieldper plot and efficacy of the treatment was also recorded.
JNKVV Res J 46(2): 224-227 (2012)
Efficacy and economics of phyto extracts against Hyadaphiscoriandri Das and Coccinella sexmaculatus on coriander
R. Pachori, A. Tandekar, A.S. Thakur and A.K. PandayDepartment of EntomologyJawaharlal Nehru Krishi Vishwa VidyalayaJabalpur 482004 (MP)
225
Results and Discussion
Effect of phyto extracts on the population of H. coriandriThe pre-treatment observations indicated non-significant differences in H. coriandri population (rangedbetween 61.70 to 63.40 aphid/plant/10 cm twig) amongdifferent experimental plots. All the phyto extracts werefound to be significantly superior over untreated controlin reducing H. coriandri population (Table-1).
The mean H. coriandri population in thetreatments revealed that neem 5% (21.78 aphids/twigs)had significantly superior over all other treatmentsfollowed by Lantana 5% (25.77 aphids/twigs), Ipomea5% ( 28.56 aphids/twigs) and Akua 5% (34.11 aphids/twigs). Dhatura 5% (39.44 aphids/twigs) and Parthenium5% (40.77 aphids/twigs) were the next better treatmentwhile custard apple 5% (46.20 aphids/twigs) were foundto be least effective as compared to all other treatments.During first spraying lowest population of aphid wasrecorded on 7th days after application of phyto extractsfollowed by 3rd and 1st days after spraying similar resultwas also recorded after second spraying the lowestpopulation was recorded 7th days after spraying followedby 2nd and 1st days after application.
Among the various treatments Neem 5% wasfound most superior treatment they reduced the H.coriandri population up to 64.98% over control it was
followed by Lantana 5% (58.58%) and Ipomoea 5%(54.11%). Custard apple reduced the aphid populationup to 25.74% it was the lowest among the treatments itwas followed by Parthenium 5% (22.61%) and Akua5% (23.54%).
Effect of different phyto extracts on the population ofCoccinella sexmaculatus predator
The coriander crop affected by H. coriandri wasattracted by large number of C. sexmaculatus predators.All the phyto extracts were significantly affected thepopulation of C. sexmaculatus in comparison to theuntreated control, where the population of C.sexmaculatus is highest. The pre-treatmentobservations indicated non-significant differences inpopulation C. sexmaculatus (ranged between 3.93 to4.60 per plant/10 cm twig) among different experimentalplots. All the phyto extracts significantly reduced thepopulation of C. sexmaculatus over untreated control.Among the first spray treatments highest number of C.sexmaculatus was recorded from the untreated controlplot followed by Custard apple 5%, Dhatura 5%, Akua5%, Lantana 5%, Parthenium 5%, Ipomea 5%, Neem5%. During the second spraying the highest number ofpredator population was again recorded from theuntreated control plot followed by Custard apple 5%>Akua 5% , Parthenium 5%, Lantana 5%, Dhatura
Table 1. Effect of different phyto extracts on the population of H. coriandri infesting coriander plant
Treatments Pre Post treatmenttreatments First spray Second spray
1st day 3rd day 7th day Mean 1st day 3rd day 7th day Mean
5%, Ipomea 5%, Neem 5%. The mean population invarious treatments were in order of Custard apple 5%(3.20), Akua 5% (3.01), Dhatura 5% (2.99), Lantana5% (2.98), Parthenium 5% (2.94), Ipomea 5% (2.81),Neem 5% (2.18). The population of C. sexmaculatuswas minimum in plots treated with Neem 5% (2.18) whileit was highest in the untreated control plot (3.92). Duringboth the spraying the C. sexmaculatus populationgradually decreased after 1st, 2nd and 7th day afterspraying. Highest population was recorded from the pretreatment observations followed by 1st spraying and 2nd
spraying.
The grain yield, recorded in all the treatmentswas significantly higher (652 to 741 kg/ha) than thecontrol (510 kg/ha). Among the phyto extracts, Neem5%, recorded significantly more grain yield (741 kg/ha)i.e., increase of 21.78 % over control while with Lantana5 % it was (688 kg/ha) i.e., increase 24.78% over control.Jain and Yadav (1989) earlier reported 50% reductionin seed yield due to the infestation of 55 to 70 aphids/plant at flowering stage. Ipomea 5% was the next bettertreatment i. e., increase the yield up to 24.78% (678.00kg/ha) followed by Akua 5% (667.00 kg/ha) and Dhatura5% (663.00 kg/ha). The next effective treatment in order
227
in comparative effectiveness were Parthenium 5% (659.00kg/ha.) and Custard apple 5% (652.00 kg/ha.) that wasat par with each other. The lowest yield (510.00 kg/ha.)was recorded from the untreated control plot.
Economics
Gross return from coriander due to different phytoextracts applications varied from Rs 29,340/ha. To Rs33, 341/ha as against only Rs 22, 950/ha in theuntreated control. However the value of increased yieldover control was maximum Rs 10, 395/ha with Neem5% application. Cost benefit ration (1:14.51) was withNeem 5% application. Our result is conformity with theresult of Gupta and Pathak (2009). They reported thatthe incidence of H. coriandri was reduced to the lowerextent with a maximum yield and net profit in the croptreated with Neem oil 1% (983 kg/ha and Rs 12165/ha).
o"kZ 2009&2010 ds jch ekSle esa /kfu;k ds ekgksa dhV ij lkr tSodhVuk'kdks dk iz;ksx tcyiqj ftys ds xzke& ve[ksjk esa Ñ"kd iz{ks=ij fd;k x;kA
tSo dhVuk'kdksa dk iz;ksx nks ckj nks vyx&vyx pj.kksa esafd;k x;k tks lkFkZd :Ik ls /kfu;k esa ekgks ds izdksi dks de djrkgSaA
Anon (2007) Compendium of Agriculture Statistics (2006-07)Madhya Pradesh pp 221
Gupta MP, Pathak RK (2009) Comparative efficacy of Neemproducts and insecticides against the incidence ofcoriander aphid, Hyadaphis coriandri Das. AgriclSci Digest 29 (1): 69-71
Jain PC, Yadav CPS (1989) Incidence of pests and theircontrol on coriander. Indian Cocoa Arecanut andSpices 13 (2): 61-62
Kumaresan D, Ragupathy A, Baskaran P (1988) Corianderand Cumin. 164-168, In Pest of Spices RajlakshmiPublications Nagercoil
Singh MK, Nath P (2005) Effect of organic manuring andsowing date of late sown mustard on the incidenceof mustard aphid infesting mustard crop in easternUttar Pradesh (India) Indian J Ent 67 (3): 218-221
Walunj AR, Mote UN, Desai AC, Parikh KM (1996) Efficacyof neem based insecticides against brinjal shoot andfruit borer. Pestology 20 (1): 7-9
Table 4. Economics of different phyto extracts against H. coriandri
Treatments Dose/ha Grain Value of yield Increase in Value of Cost of Net profit CostYield (Rs/ha) yield over increase yield treatment benefit
(kg/ha) control (Rs/ha) including labours ratio(kg/ha) charge (Rs/ha)
To evaluate the newer insecticide molecules against storageinsect pests and to assess the storability of the treated pearlmillet seed, a laboratory experiment was conducted incompletely randomized design with seven treatments(thiamethoxam @ 2 ppm, methyl primiphos @ 4 ppm,emamectin benzoate @ 2 ppm, spinosad @ 2 ppm,lufenuron @ 5 ppm, deltamethrin @ 1 ppm and control) andfour repetitions. All the insecticidal seed treatments recordedsignificantly lower per cent seed damage than control. Theseed treatment of emamectin benzoate as well as spinosadwere found completely free from seed damage after 9 monthsof storage. The effect of insecticidal treatments on moisturecontent of hybrid pearl millet seed was found non-significant.Seed germination was significantly higher in treatment ofemamectin benzoate after 9 months of storage. All theinsecticidal treatments were found effective in protecting thepearl millet seed from insect damage up to 9 months withoutany adverse effect on moisture content and germination.
Key words: Pearl millet seed, chemical control, storedgrain insect pests
Pearl millet (Pennisetum glaucum (L.) R. Br.) is a crop ofsemi arid tropical regions and forms life line of peopleand cattle population inhabiting dry land regions especiallyrural areas. Gujarat, Rajasthan, Maharashtra, U.P. andHaryana account for about 90 % of the total area of about10 million hectare covered under pearl millet in India.Development of hybrids in pearl millet increased demandfor high quality seeds by the farmers for obtaining highercrop productivity. The improved quality seed shouldpossess good germination, optimum moisture contentand free from diseases and insect pests as per seedcertification standards. Sometimes hybrid seeds are tobe stored for more than one season. In such casesdeterioration of valuable seeds due to insect pests is major
constraints. The primary damage in stored pearl milletseed is mainly by lesser grain borer (Rhyzopertha
dominica, Fab.), followed by secondary attack of rust redflour beetle (Tribolium castaneum, Herbst) and rice moth(Corcyra cephalonica, Stainton). Hence, to evaluate thenewer insecticidal molecules against storage insect pestsand to assess the storability of treated pearl millet seed,the present study was initiated.
Material and methods
A laboratory experiment was conducted at Pearl MilletResearch Station, Junagadh Agricultural University,Jamnagar during August, 2007 to 2008. Five newinsecticides viz; thiamethoxam (Cruiser 70 WS) @ 2 ppm[T1], methyl pirimiphos (Actellic 50 EC) @ 4 ppm [T2],emamectin benzoate (Proclaim 5 SG) @ 2 ppm [T3],spinosad (Tracer 45 SC) @ 2 ppm [T4] and lufenuron (Cigna5 EC) @ 5 ppm [T5] alongwith standard check ofdeltamethrin (Decis 2.8 EC) @ 1 ppm [T6] were evaluatedagainst major storage insect pests infesting pearl milletseed during storage. Freshly harvested 1.0 kg certifiedpearl millet hybrid seed (GHB -558) with high germination(> 95 %) and low moisture content (< 10 %) was takenfor each treatment. Required quantity of insecticides wasdiluted in 5 ml of water to treat one kg of seed for propercoating. After drying in shade, seeds were packed in 2kg capacity of gunny baglets. Similarly, control wasmaintained without any treatment for comparison [T7]. Theexperiment was conducted in completely randomizeddesign with seven treatments and four repetitions. Thetemperature and relative humidity of the room was recordedon standard week basis. Observations on seed moisture,seed germination, seed damage and insect population(larvae and adult) were recorded at 3 months interval upto 12 months of experimental period.
JNKVV Res J 46(2): 228-230 (2012)
Effect of insecticidal seed treatment on pearl millet seed viabilityduring storage
Y.H. Ghelani, K.K. Dhedhi, H.J. Joshi, K.L. Raghvani and C.J. DangariaSeed Technology Research Unit, Pearl Millet Research StationJunagadh Agricultural UniversityJamnagar 361 006 (Guj.)
229
Table 1: Effect of insecticidal seed treatments on moisture, germination and seed damage in pearl millet seed duringstorage
Moisture (%) Germination (%) Seed damage (%)Treatment Months after storage Months after storage Months after storage
* Square root transformed value √x+0.5 # Figures in parentheses are retransformed value
230
Results and Discussion
Effect on seed moisture
The effect of insecticidal seed treatments on moisturecontent of hybrid pearl millet seed was found nonsignificant and which was observed below Indian MinimumSeed Certification Standards (10 %) in all the treatments.It clearly showed that none of the insecticides whenapplied as seed treatment in pearl millet has not anyeffect on seed moisture content (Table 1).
Effect on seed germination
Germination of pearl millet seed was recordedsignificantly higher in all insecticidal seed treatmentsas compared to control after 9 months of storage.Treatment of emamectin benzoate recorded the highestgermination (87.50 %) which was found statistically atpar with rest of treatments except control (77.75 %).None of the treatments recorded germinationpercentage above IMSCS (75 %) after 12 months ofstorage. However, thiamethoxam recorded highestgermination (64.75 %). While in control, it was foundonly 46.00 per cent (Table 1).
Effect on seed damage
The per cent damage in pearl millet seed was noticedsignificantly lower in all the insecticidal seed treatmentsthan control during storage. The treatment of emamectinbenzoate as well as spinosad were found free from theseed damage and were statistically at par with the restof insecticidal treatments after nine months of storage.After 12 months of storage, emamectin benzoaterecorded the lowest seed damage (3.23 %) and wasstatistically at par with rest of the insecticidal treatments.While in untreated seed, it was observed 18.18 per cent(Table 1).
Effect on insect population
All the insecticidal seed treatments recordedsignificantly lowest larval and adult population of R.dominica, T. castaneum and C. cephalonica after 12months of storage. The lowest population of R. dominica
(0.90) and T. castaneum (2.24) was observed in treatmentof spinosad while the lowest population of C. cephalonica(0.90) was found in treatment of thiamethoxam (Table 2).
The result of the experiment clearly showed thatall the insecticides under study were found effective inprotecting the pearl millet seed from insect damage upto 9 months without any adverse effect on moisturecontent and germination. The effectiveness ofdeltamethrin has been reported in literature (Bareh et al.1989) and cleared by WHO and FAO as a safe seed andgrain protectant (Anonymous 1982). Study conducted atvarious centers of National Seed Project showed thatspinosad, emamectin benzoate and thiamethoxam (all@ 2 ppm) were found equally effective as deltamethrin @1 ppm and provided appreciable control of storage insectsinfesting cereal seeds viz; wheat, pearl millet, maize andpaddy under different agro climatic conditions for sixmonths (Anonymous 2008)
Acknowledgement
The authors are thankful to the Principal Investigator(Seed Entomology), Project Director (NSP) and Directorof Research, Junagadh Agricultural University forproviding necessary facilities to conduct thisinvestigation.
besafDju cstksusV ¼nks ihih,e nj ls½ rFkk LihukslsM ¼nks ihih,e njls½ cktjs ds chtksa dk mipkj djus ls ukS efgus rd HkMkjx““g esadhV izdksi esa deh ik;h x;h A mijksDr dhVkuk’kdksa ds mipkj lscktjs ds chtksa dks ukS efgus rd dhV izdksi ls lqjf{kr ik;k x;k A
References
Bareh SS , Gupta H C (1989) Efficacy of six insecticides forthe protection of stored seeds against Rhyzoperthadominica Fab. Seed Res 17: 47-54
Anonymous (1982) Guide line to the use of WHOrecommended classification on pesticides byhazards. WHO VBC 78 Third revision July 1982
Anonymous (2008) All India Co-ordinated National SeedProject (Crops) Annual Report Project Co-coordinator National Seed Project (Crops)Directorate of Seed Research (ICAR) Mau :238-274
Majority of tribal farm women (57.14%)had moderateparticipation in decision making process towards agriculturaloperations in Kurai block of Seoni district (MP).
India has one of the largest concentrations of tribalpopulation in the world. According to 2001 census. Tribalare the traditional bound people with apathetic attitudetowards the change and development. Women are saidto be originator of agriculture. They not only give stabilityto the life of nomadic habitat, but simultaneously madeagriculture a way of life. The rural households are slowlydepending on agriculture and farming has become a familyenterprise where each member could participate inproduction process. Men’s role is dominant andauthoritative while that women’s subtle and persuasive.Anita kumari (2002). However, the decision making roleof farm women seems to have changed considerably overthe years mainly two reasons, firstly the joint familysystem is breaking and secondly the introduction ofmodern agricultural technology has resulted in higherincome and better standard of living which has broughtabout a change in outlook and attitude of rural people,especially the women. There is an increasing evidenceof women’s participation in decision making activities vis-a-vis farm are related enterprises.
Material and Method
The study was conducted in tribaldominated(48%) block of Seoni district of MadhyaPradesh. The block comprised of 183 villages, out ofwhich 5 villages were selected randomly for the study.To select the respondents, a list of tribal farm womenfrom each village was prepared. From the list, 15 percent tribal farm women were chosen randomly. Thus,
total sample comprised of 105 tribal farm womendistributed in 5 villages. The eight steps of decisionmaking process are:
Desire for change :
Measured in 3 point scale 1. strong desire 2. Moderatedesire 3. least desire.
Getting initial information :
Divided in 3 levels 1. very much. 2. much 3. little
Recognition of the problems:
Measured in 3 point scale 1. Most important 2. important3. Not important
Getting additional information:
Divided 3 point scale 1. needed 2. Some what needed3. Not at all needed
Consideration of alternative means:
Divided 3. point scale 1. always 2. Some times 3. Never
Consideration of resources :
Measured in 3 levels 1. Satisfied 2. partially Satisfied3. not at all satisfied.
Extent of participation of tribal farm women in decision makingprocess related to agriculture operations in Seoni district MadhyaPradesh
Trupti Gokhe and N.K. KhareDepartment of Extension EducationJawaharlal Nehru Krishi Vishwa VidyalayaJabalpur 482004 (MP)
JNKVV Res J 46(2): 231-234 (2012)
232
Tab
le 1
. E
xten
t of p
artic
ipat
ion
of tr
ibal
farm
wom
en in
dec
isio
n m
akin
g pr
oces
s re
late
d to
agr
icul
tura
l ope
ratio
ns(N
=105
)
Ste
ps o
f Dec
isio
nPr
actic
eC
rop
sele
ctio
nSe
ed s
elec
tion
See
d tre
atm
ent
Use
of
Use
of
Plan
t pro
tect
ion
Impr
oved
Tim
e of
mak
ing
proc
ess
(%)
(%)
(%)
wee
dici
des
ferti
lizer
sm
easu
res
met
hod
ofse
lling
farm
(%)
(%)
(%)
stor
age
(%)
prod
uce
(%)
Des
ire fo
r cha
nge
Stro
ng d
esire
d52
.38
57.1
428
.57
10.4
738
.09
20.0
034
.28
51.4
2
Mod
erat
e de
sire
38.0
938
.09
55.2
345
.71
46.6
639
.04
57.1
436
.19
Leas
t des
ire9.
524.
7616
.19
43.8
015
.23
40.9
58.
5712
.39
Get
ting
initi
al in
form
atio
nVe
ry m
uch
exci
tem
ent
57.1
446
.66
38.0
924
.76
27.6
120
.95
50.4
740
.95
Muc
h ex
cite
men
t37
.14
47.6
145
.71
39.0
457
.14
32.3
843
.80
44.7
6
Littl
e ex
cite
men
t5.
715.
7116
.19
36.1
915
.23
46.6
65.
7114
.28
Rec
ogni
tion
of p
robl
emM
ost i
mpo
rtant
48.5
741
.90
36.1
920
.95
35.2
310
.47
35.2
339
.04
Impo
rtant
35.2
347
.61
40.0
042
.85
52.3
842
.85
50.4
751
.42
Not
impo
rtant
16.1
910
.47
23.8
036
.19
12.3
846
.66
14.2
89.
52
Get
ting
addi
tiona
l info
rmat
ion
Nee
ded
48.5
743
.80
36.1
919
.04
25.7
19.
5235
.23
49.5
2
Som
e w
hat n
eede
d35
.23
39.0
438
.09
43.8
049
.52
41.9
054
.28
40.9
5
Not
at a
ll ne
eded
16.1
917
.14
25.7
137
.14
24.7
648
.57
10.4
79.
52
Con
side
ratio
n of
alte
rnat
ive
mea
nsAl
way
s34
.28
41.9
029
.52
16.1
947
.61
16.1
945
.71
35.2
3
Som
etim
es40
.95
49.9
548
.57
35.2
340
.95
33.3
343
.80
50.4
7
Nev
er24
.76
24.7
621
.90
48.5
711
.42
50.4
710
.47
14.2
8
Con
side
ratio
n of
reso
urce
sSa
tisfie
d44
.76
34.2
829
.52
9.52
29.5
216
.19
31.4
241
.90
Parti
ally
sat
isfie
d40
.95
46.6
646
.636
.19
50.4
737
.14
53.3
343
.80
Not
at a
ll sat
isfie
d14
.28
19.0
423
.80
54.2
820
.00
46.6
615
.23
14.2
8
Con
side
ratio
n al
tern
ativ
e of
use
s-
--
--
--
-
of m
eans
Dec
isio
nYe
s78
.09
68.5
746
.66
27.6
153
.33
21.9
065
.71
71.4
2
No
21.9
034
.42
53.3
372
.38
46.6
678
.09
34.2
828
.57
233
Consideration of alternative uses of means:
1 score was given to each level for each Agriculturaloperation
Decision:
The data were collected according to theirresponse 1. Yes 2. No.
Result and Discussion
Extent of participation at different steps of decisionmaking process related to agricultural operations.
Out of the total respondents 57.14, 52.38, and 51.42per cent were having strong desire for change in seedselection, crop selection and time of selling farmproduce respectively. 57.14, 50.47 and 46.66 per centof respondents had very much excitement for gettinginitial information about crop selection, improved methodof storage and seed selection. Majority of tribal farmwomen realized that the problem pertaining to the cropselection, seed selection and time of selling farmproduce were the major problem (Table 1).
It is about 49.52 and 48.57 per cent ofrespondents that needed addition information relatedwith time of selling of farm produce and crop selection.Out of total respondents 47.61 and 45.71 per centconsidered alternative means for the practice use offertilizers and improved method of storage respectively.Majority(44.76%) of tribal farm women were satisfiedwith the income resources for crop selection, in technical
advice for time of selling farm produce, in knowledgeresources for time of selling farm produce and their skillinvolved resource in time of selling farm produce. Allthe respondents considered all alternative uses ofmeans.
It was realized that 78.09, 71.42 and 68.57 percent tribal farm women took part in decision for cropselection, time of selling farm produce and seedselection respectively. However, 78.09, 72.38 and 53.33per cent of tribal farm women did not take decision foruse of plant protection measures, use of weedicidesand seed treatment methods (Table 1).
Rank order of tribal farm women in decision makingprocess related to Agricultural operations
Majority of 78.09% of tribal farm women took decisionfor crop selection were placed rank I, where as 72.38%and 71.47% took decision for use of weedicides andtime of selling farm produce and were placed in rank II& III respectively. Other practices perceived by tribalfarm women according to percentage are seedselection, improved method of storage, use of fertilizerseed treatment and plant protection measures wereplaced in rank IV. V.VI, VII respectively. (Table 2).
Extent of participation of tribal farm women in decisionmaking process
Out of the total respondent 21.91% had low, 57.14% hadmoderate and 20.95% had high role in decision makingprocess. Therefore, it can be inferred that majority(57.14%) tribal farm women had moderate participationin decision making process. (Table 3)
Table 2. Rank order of tribal farm women in decisionmaking process related to agricultural operationsPractices Decision Rank
makingprocess
Crop selection 78.09 ISeed selection 68.57 IVSeed treatment 55.33 VIIUse of Weedicides 72.28 IIUse of fertilizers 57.14 VIPlant protection measures 50.47 VIIIImproved method of storage 60.71 VTime of selling farm produce 71.42 III
Table 3. Extent of participation of tribal farm women indecision making processCategories Frequency PercentageLow 23 21.91Moderate 60 57.14High 22 20.95Total 105 100.00
21.91
57.14
20.95
0
10
20
30
40
50
60
Percentag e
Low M oderate High
Fig . 1 : Distribution o f t ribal farm w omen accord ing to their e xten t of participat ion in decision m aking process
Percen tage
234
Majority 78.09% of tribal farm women took final decisionregarding crop selection. Maximum 57.14 of tribal farmwomen had moderate participation in decision makingprocess.
References
Jaiswal Manisha (1998) To study the role of farm women indecision making process of agricultural operationsin Patan block of Jabalpur district. M Sc (Ag) ThesisJNKVV Jabalpur
Anita Kumari (2002) Role of rural women in monetarydecision making. Indian J Extn Edu 13 (4) : 4318-3421
Mandloi Kavita (2006) Role of farm women in decisionmaking process in Nimar Region M Sc (Ag.) ThesisJNKVV Jabalpur.
Rao V M (2003) Pattern of workload and participation indecision making among tribal women of ArunachalPradesh Women’s Link Jan-March 9(1) : 2-9
A field experiment on effect of dates of sowing on growth andheat use pattern of wheat cultivars was carried out during2008-09 and 2009-10. The study reveals that early plantedwheat varieties produced more number of productive tillers/plant (9.90), maximum panicle length (10.22 cm), morenumber of grains /panicle (55.03), high test weight (43.78 g)and highest grain yield (66.48 q/ha) as compared to latesowing. The reduction in grain yield was 16.17% when thecrop was sown on 1st December. The wheat variety GW 366gave maximum yield 68.26 q/ha followed by GW 322 andGW 273. While the wheat variety DL788-2 gave poor yield.The heat use efficiency was more under timely sown conditionas compared to late sown condition. The heat use efficiencyfor grain yield was highest (40.12 q/ha/GDDx10-3) for wheatvariety GW 366 and lowest (31.40 q/ha/GDDx10-3) for wheatvariety DL 788-2.
Keywords: Wheat, dates of sowing, heat use efficiency(Pattern)
Wheat is a staple food crop of Madhya Pradesh whichoccupies an area of 40.45 lakh hectares with the totalproduction of 73.3 lakh tones and productivity1812 kg/ha. The major wheat growing area is under rice-wheatcropping system. Late harvesting of rice causes delayin sowing of wheat. In case of late sowing, hightemperature during ripening phase shortens the growingperiod and reduces grain yield. Wheat crop is sensitiveto photoperiod, temperature and date of sowing. Hence,the phenology of growth pattern differs greatly with thechange in latitude. In past, degree day techniques havebeen variously applied to correlate the phenologicaldevelopment of crops to predict maturity dates(Nuttonson 1955). However the phenology, ambienttemperature interaction of wheat varieties under
different sowing dates has not been studied in Rewa regionof Madhya Pradesh. Hence, present investigation wasunder taken.
Material and methods
The experiment was conducted on sandy loam soil ofCollege of Agriculture Research Farm, Rewa duringRabi season of 2008-09 and 2009-10. The soil wasneutral in reaction (pH 7.1), low in available nitrogen(235 kg/ha) and phosphorus (9.6 kg/ha) and high inavailable potash (461 kg/ha). The maximumtemperature was recorded 40.00c and minimumtemperature was 3.10c during crop period. Thetreatment consisted of two dates of sowing viz. 15th Nov.and 1st December and six varieties of wheat (GW 366,GW 322, GW 273, MP 3269, JW 3020 and DL 788-2)with three replications. The experimental design wasRBD. The fertilizer dose was kept 100 kg N, 60 kg P2O5,40 kg K2O/ha. All the recommended package ofpractices were adopted. The maximum and minimumtemperature and sunshine hours were recorded at theCollege Farm observatory located inside the field.
The growing degree days were calculated using50c as base temperature and accumulated for differentgrowth stages i.e. from sowing to crown root initiation(CRI), sowing to tillering and sowing to maturity stages(Nuttonson 1955) and Sastry and Chakravorty (1982).Photo thermal unit were calculated by multiplyinggrowing degree days to day length. Heat use efficiency(HUE) for different varieties were evaluated at maturityfor both the dates of sowing, by using above groundbiomass and yield. The phenothermal index was alsocalculated by following Nuttonson (1955) and Sastryand Chakravorty (1982). Yield and yield componentssuch as plant height, number of tillers /plant, panicle
Effect of dates of sowing on growth and heat use pattern ofwheat cultivars
length, number of grains/pencil and test weight wererecorded at the time of harvesting.
Results and Discussion
Effect on yield and yield components
Data presented in Table 1 reveal that the earlier thesowing date the higher the number of productive tillers/plant, panicle length, number of grains/panicle, testweight and final grain yield. Grain yield of 15th Nov.sowing was significantly higher by 19.28% as comparedto late sown condition (i.e. 1st December). Averagereduction of grain yield was 16.17% when the crop wassown on 1st December. Low yield under late sowncondition was due to stress caused by highertemperature during grain filling period in the moth ofMarch, Ishag and Ageeb (1990) also reported similarresults.
Yield components likes number of productivetillers/plant (12.15) panicle length (11.65 cm), testweight (48.14 g), biomass yield (168.39 q/ha) and grainyield (68.26 q/ha) were maximum in wheat variety GW366 followed by GW 322. Number of grains/panicle weremaximum in wheat variety GW 322 (75.85) followed byJW 3020 (72.20) but these varieties recorded lowesttest weight 40.43 and 39.41 g, respectively. Theminimum grain yield (54.12 q/ha) was recorded in wheatvariety DL 788-2.
Phenology
Data pertaining to accurance of phenological events ofwheat crop varieties under different sowing dates ispresented in Table 1. The higher number of days forcrown root initiation was recorded for wheat variety JW3020 (20.25 days) followed by GW 322 (19.90 days)and GW 273 (19.30 days). The minimum number ofdays for crown root initiation was recorded for varietyGW 366 (18 days). The maturity days was maximum(130 days) for variety DL 788-2 followed by GW 366(128 days). The early maturity by(130 days) for varietyDL 788-2 followed by GW 366 (128 days). The earlymaturity by (4.6 days) was observed under late sownwheat planted on 1st December. The results are inagreement with the findings of Maurya and Kushwah(1993).
Energy Summation indices during crop growth period(GDD)
Data presented in Table 2 regarding the GDD revealsthat both calendar days and GDD were higher atmaturity for variety DL 788-2 (130 days maturity) and1739.20 (GDD) followed by GW 366 (128 days, 1720GDD). The requirements of GDD under different datesof planting were not much different among the varietiestested.
Photo thermal unit (PTU)
The photo thermal unit for different growth stages ispresented in Table 2. The requirement of PTU rangedfrom 12313.07 to 13082.68 for maturity stages. It wasmaximum for variety DL788-2 and minimum for MP3269.
Heat use efficiency (HUE)
The heat use efficiency for grain yield and biomass atmaturity stage are presented in Table 2. The significantdifference for HUE was observed among the varietiesat both the dates of sowing. Maximum HUE value forgrain and biomass yield (40.12 and 98.98 q/ha/GDD x10-3) was noted for wheat variety GW 366 and minimum(31.40 and 79.50 q/ha/GDDx 10-3) for DL 788-2. Thisreflects that variety GW 366 is more suitable for lateplanting than variety DL 788-2. Similar results werereported by Khare et al. (1989).
—f"k foKku dsUnz jhok }kjk jch ekSle 2008&09 ,oa 2009&10 es/kku ds ckn xsagw dh Qly cksus ls c<+rs rkieku dk mit ij izHkkons[kus ds fy, 15 uoacj vkSj 1 fnlacj dks xsagw dh N% fdLeksa dkscks;k x;k A v/;;u esa ik;k x;k fd 15 uoacj dks cksuh djus ijxsagw ds ikS/kksa esa mRiknu nsus okys dYyksa dh la[;k] izfr ikS/kk ckfy;ksadh la[;k rFkk ckfy;ksa esa nkuksa dh la[;k ,oa 1000 nkuska dk otuvf/kd ik;k x;k ftlds dkj.k xsagw dh mit esa 19-28 izfr’kr dho``f) gqbZ A 1 fnlacj dks cksuh djus ij fofHkUu fdLeksa dh ghV ;wtbZfQfl;alh ¼m"ek mi;ksx {kerk½ esa deh ik;h x;h rFkk xsagw dh mit16-17 izfr’kr ?kV xbZ A v/;;u esa ;g Hkh ik;k x;k fd xsagw dhfdLe th-MCY;w 366 dks nsjh ls cksus ij lcls vf/kd m"ek mi;ksx{kerk ik;h xbZ ftlds dkj.k bl fdLe dh mit lcls vf/kd mit68-26 fDoaVy@gsDVs;j izkIr gqbZ A lcls de mit xsagw dh nsj lsidus okyh fdLe Mh-,y- 788&2 ls izkIr gqbZ A
238
References
Ishag HM, Ageeb OAA (1990) Nile valley regional programmeon cool season food legumes and wheat. Annualreport 1989/90. Agricultural Research Corporation,Wad Medai, Sudan
Khare JP, Usrathe KP, Pandey RP, Rohan Singh, NamdeoKN (1989). Response of wheat varieties under latesown rainfed conditions. Indian J Agron 34:75-79
Maurya BM, Kushwah SS (1993) Thermal response of wheatcultivars to ground water table and dates of planting.Mysore J agric Sci 27: 50-55
Nuttonson MY (1955) Wheat climate relationship and use ofphenology in ascertaining the thermal andphenothermal requirement of wheat. Am Inst CropEcol Washington D C pp 388
Sustry PSN, Chakravorty NVK (1982) Energy summationindices for wheat crop in India. Agril Meteorol 27:45-48
Impact of Information Technology to enhance the agricultureproductivity in India
A.K. Rai, Bharati Dass, A. Khare, A. Bisen and C.P. KushwahaInstrument Development and Service CentreJawaharlal Nehru Krishi Vishwa VidyalayaJabalpur 482 004 (MP)
JNKVV Res J 46(2): 239-244 (2012)
Abstract
India is an agricultural country. Most of the populations areliving in rural areas (Villages) and agriculture is their mainsource of earning. The agricultural sector in India is currentlypassing through a difficult phase. Unfortunately almost all ofthem are not familiar with the terms "Information Technology"or "e-Agriculture" and other related issues that can make adramatic change to their day to day life. India is moving towardsan agricultural emergency due to lack of attention, insufficientland reforms, defective land management, non-providing offair prices to farmers for their crops, value addition,inadequate investment in irrigational and agriculturalinfrastructure etc. India's food production and productivity isdeclining while its food consumption is increasing. Theproper utilization of modern Information technologies,especially e-Agriculture can provide them a global identitythat can drastically change the usual life of rural agriculturalcommunity. "e-Agriculture" is an emerging field in theintersection of agricultural informatics, agriculturaldevelopment and entrepreneurship, referring to agriculturalservices, technology dissemination, and informationdelivered or enhanced through the internet and relatedtechnologies. In our country food production and productivitymay be increased by an effective use of IT for agriculturalpurposes.
Keywords: Information Technology, e-Agriculture,Productivity, Farmer, Entrepreneurship
With the grand success of green revolution in India,agriculture has evolved from sustainable farming into acomplex and profit oriented business, which requiresaccumulation and integration of knowledge and informationfrom diverse sources. An increasing population coupledwith mining of natural resources requires application ofnew technologies to maintain sustainable food and watersupply without environmental degradation. Presently thecosts of the planting material/seeds, nutrients, pesticides,water, power and labour are increasing enormously; whereas increase in crop productivity is at low pace. Farmers
are more concerned about the choice of crops that areappropriate for the changing environmental conditions andmore conscious location-specific crop management sothat the input costs are minimal and less risk prone(Swaminathan 2001).
Information technologies particularly the Internet,are transforming all human activities dependent oninformation, including rural development and food security,it plays a crucial role in improving the efficiency of inputsas water, nutrient and pesticide use (Ananda andVijayanand 2003). Modern tools such as Remote Sensingand Geographic Information System (GIS) are helpful toestimate area and production under agricultural crops.Other models such as decision support system, Bio-Informatics, Precision Agriculture, Rural Networking etccan be achieved by aligning Information Technology withagriculture (Kumar and Sailaja 2006). Combining thesatellite technology with tools of IT, farmers in a remotevillage can demand and get the following information's:
• Land use planning for crops for farmers field basedon integrated information on soil water, weather,fertilizer and pest management models.
• How and where to get seeds or good quality nurs-ery plants of crops?
• Interactive exchange of information for planning andday-to day operations by farmers.
• e-Procurement
Role of IT in Agriculture
In the context of agriculture, the potential of informationtechnology can be assessed broadly under two heads :(a) as a tool for direct contribution to agriculturalproductivity and (b) as an indirect tool for empoweringfarmers to take quality decisions which will have positiveimpact on the way agricultural and allied activities
240
conducted. Precision farming, popular in developedcountries, extensively uses IT to make direct contributionto agricultural productivity. The indirect benefits of IT inempowering Indian farmer are significant and remain tobe exploited. The Indian farmer urgently requires timelyand reliable sources of information inputs for takingdecisions. At present, the farmer depends on tricklingdown of decision inputs from conventional sources whichare slow and unreliable. The changing environment facedby Indian farmers makes information not merely useful,but necessary to remain competitive (Mittal 2004)
Application of IT in Agricultural
IT should be used on demand and monitoring the supplyof agricultural impacts in the fields. Based on the annualcrop plan, the demand for the agro inputs can be estimatedand accordingly supply can be monitored. The informationon availability of seeds, fertilizers and pesticides indifferent region can be made available to the farmers. Thiswill help them in fast procurement of inputs at a cheaperrate. Information on availability of quality planting materialof horticultural species at various government nurseriesand Agriculture Universities should also be regularly postedon the website. Agriculture Universities and other NationalInstitutions are regularly releasing improved varieties ofvarious crops. The important features of these varietiessuch as its performance, disease resistance andadaptability should be made known to farmers throughthe website. The prompt identification and control of pestand diseases of the cash crops is essential in reducingfurther damage to the crop. Audio-visual clips of thecausative organism and affected/diseased plant part withits control measure should be displayed on the website.This would assist the farmers in remote areas to identifythe pest/disease and take corrective action. Weatherplays a major role in incidences of certain pest anddiseases. A disease-forecasting module for advanceintimation on likely occurrences of pest and diseasesand preventive measures to be taken needs to bedeveloped to reduce the economic losses. The micro leveldata can be of use in preparing an interactive module forthe farmers which will take into consideration the localagro climatic conditions and suggest them an alternativecrop plan. Suitable software can be developed for effectivemonitoring of the crop plan by various officials at differentlevels and update them with the latest situation. GIStechnology will enable the policy makers to assess thearea and production of crops. This will help to frame theshort term and long term market/credit policy. Use ofsatellite imaging data analysis for forecasting agriculture
related information should be adopted for forecastingrainfall, area under different crops, yield estimations andsoil properties. Interactive module needs to be preparedto assist the farmer in preparing crop budget, which willhelp him in documenting data on cultivation cost and makethem aware of the profitability.
To enhance the productivity it is essential that thelatest information on production and post harvestproduction aspects of various economic crops be madeavailable to the farmers. There is an urgent need to preparea crop guide containing reliable and authentic informationon important varieties, cultivation practices, recommendedfertilizer doses, types of pest and diseases and its control,harvesting methods and post harvest practices includingprimary processing at the farmer's field. This informationbeing dynamic should be kept updated. InformationTechnology for agricultural extension is going to receivehigh priority in future. While developing any system of ITfor Agriculture technology, the farmer should be kept infocus as a player, generator and user of the knowledge.Extensive use of modern information technology shouldbe promoted for two way communication betweenscientists, extension workers and farmers to transfertechnologies and information more cost effectively. Takinginto consideration the individual agriculture managementby the farmers, some useful software packages shouldbe developed and made available on the website. Someof the software which need urgent consideration are Microirrigation (Drip designs), Green House design, CroppingPattern, Farm Accounting and Management. TheAgriculture Department and private sector should beencouraged to develop multimedia based extensionmaterial in local language. Multimedia CDs on varioustopics would be of great utility to the farmers (Chaudhuriet al. 2001).
Constraints and Remedies for Effective Dissemination
Some of the major constraints delaying the spread of e-Agriculture revolution to rural India are listed below
Haphazard development
It is observed that some initiatives have already been madeto provide IT based services to agricultural community.However, duplication of efforts is witnessed as most ofthe services revolve around limited subjects. Keeping inview the giant task involved, it is necessary to form acoordinated mechanism to strive for a concerted effort tosupport farming community in the country.
241
User friendliness
The success of this strategy depends on the ease withwhich rural population can use the content. This will requireintuitive graphics based presentation. Touch screen kiosksare required to be set up to encourage greater participation
Local languages
Regional language fonts and mechanisms forsynchronization of the content provide a challenge thatneeds to be met with careful planning.
Restrictions
Information content based on remote sensing andgeographical information systems can provide timelyalerts to the farmers and also improve the efficiency ofadministration. These applications can have a majorimpact on the farmers and help them to appreciate thepotential of information technology. However, government'smap restriction policies often threaten to stifle the optimalutilization of these tools.
Power Supply
In most of the rural India, power supply is not available forlong hours. This will reduce the usefulness of the intendedservices. Since almost entire country receives sunshinefor most part of the year, it is useful to explore solar powerpacks for UPS as well as for supply of power. The Ministryof Non-conventional Energy Sources may pay specialattention in this area which can be a major contributor tothe growth of IT in villages.
Connectivity
Despite the phenomenal progress made in the recentyears, the connectivity to rural areas still requires to beimproved. Reliable connectivity is a prerequisite for asuccessful penetration of IT into rural areas. Many privateISPs are setting up large networks connecting many majortowns and cities. Since some of these networks passthrough rural areas, it is possible to provide connectivityto a large number of villages. Several technologies existthat can be utilized for connecting rural areas. Cablenetwork is a possible medium for providing the last mileconnectivity to villages.
Bandwidth
Even in areas where telephone and other communicationservices exist, the available bandwidth is a majorconstraint. Since internet based rural services requiresubstantial use of graphics, low bandwidth is one of themajor limitations in providing effective e-services tofarmers. As already stated, networks with high bandwidthare being set up by several companies passing throughrural segments which can be utilized. Until thismaterializes, a two pronged strategy of storing staticinformation at the kiosks and providing dynamicinformation from remote locations can be examined. Thegraphic oriented content which does not changefrequently, such as, demonstration clips for farmers, canbe stored on the local drives at the kiosks and arrange forperiodic updating of this information over the networkduring non-peak hours may be adopted. The dynamicinformation which changes more frequently can beaccessed from remote locations to obtain the latest status.
Dissemination Points
Mass deployment of information kiosks is critical foreffective use of the Internet based content and services.In order to ensure that the information kiosks areeconomically feasible, it is necessary to make theproposition sustainable and viable. This requires a majorfocus on a viable revenue model for such kiosks. In thenew information era, the kiosks should be designed tobecome electronic super markets that can, in addition tobeing information sources, handle other services of useto the people living in rural areas.
Recommendations for successful implementation of eAgriculture
The following recommendations should be considered forsuccessful implementation of e Agriculture
Networks Online
The agricultural communities should take the initiative totake on IT rather than waiting for the government to providethe technologies to them. This could be achieved byfostering extension of new agricultural practices throughfarmer-to-farmer networks and links with research andextension services, and bringing local experience andknowledge to the attention of these services. They shouldalso aim to start developing content to improve their
242
Information will be collected from the different resources (Farmers fields, Public & Private agricultural research agencies, scientific agricultural Journals, Articles, Bulletins, Magazines, Proceedings, News letters, News papers and Books.
Convert selected text data into Electronic-Data
Create Software modules and Database
Crop Cultivation
Access data from the database through WEB
Implement, Testing and Uploading of WEB Application
Analysis and interpretation of collected data
Water Management Fertilizer Application
Pest Management Harvesting Post harvest handling
Transporting of crops/ food products Packaging
Crops/food Preservation Food Processing / value addition.
Food quality management Food Safety Food Storage
Marketing Information
Adoption of new technology by the farmers
Enhance Productivity / Production / Income
Figure 1: Conceptual Architecture of an Agricultural Information Dissemination System for Users
243
livelihoods, and in language understand by the ruralpeople.
The government, non-governmental organizations,private sector and rural communities must collaborate todevelop rural telecenters or information kiosks intointegrated service outlets for agricultural informationdissemination, covering such issues as land titlecertification, credit, marketing, skill development,education and other topics, depending on the needs ofthe agricultural communities.
Indian governments may take advantage of this byintroducing and strengthening initiatives that support thewidening of space for exchange of information and a com-petitive culture of debate of ideas that could concretizethe current information-based development wave.
Indian Governments and other agriculturalstakeholders should be creative in adapting to thesewaves, as this could be the road to sustainable progress.With imagination and creativity regional informationsystems will deliver where other approaches have failed.
Website content developers should facilitateaccess and enhance the relevance of IT use in Agriculturalcommunities by developing content that can beunderstood and implemented, that is in local languagesand that deals with local issues. Using internationallyadopted standards such as UNICODE should bepromoted.
Technologies used to develop the online database
Agricultural Development Networks Online can bedeveloped using three free software tools or standardsavailable on the Worldwide Web, namely PHP, MySQLand HTML.
PHP (Hypertext Preprocessor) is a server-sidescripting language designed specifically for webapplications. The PHP code can be embedded in HTMLpages and is executed every time the page is visited.PHP is an open source product downloadable from theInternet at www.php.net. MySQL is a relational databasemanagement system (RDBMS) that enables users toefficiently store, search, sort and retrieve data. The MySQLserver controls access to the data and ensures that manyusers can work concurrently on the database, andprovides fast access to the database. It is available underan open source license but commercial licenses areavailable if required. HTML (Hypertext Markup Language)is a document-layout and hyperlink-specificationlanguage. It defines the syntax and placement of special
embedded directions, which are not displayed by thebrowser but tell it how to display the contents of thedocument including text, images and other support media.The language also makes a document interactive throughspecial hypertext links that connect one document toanother and with other Internet resources such as filetransfer protocols.
The information on database can be indexed bydifferent main phases of the agricultural fields such asCrop cultivation, Water management, FertilizerApplication, Fustigation, Pest management, Harvesting,Post harvest handling, Transporting of food/food products,Packaging, Food preservation, Food processing/valueaddition, Food quality management, Food safety, Foodstorage, Food marketing (Fig.1). All farmers of agriculturalfield need information and knowledge about these phasesto manage them efficiently. Any system applied for gettinginformation and knowledge for making decisions in anyagricultural sector should deliver accurate, complete,concise information on time. The information provided bythe system must be in user-friendly form, easy to access,cost-effective and well protected from unauthorizedaccesses (Reddy 2002).
The Indian farmer and those who are working for theirwelfare need to be e-powered to face the emergingscenario of complete or partial deregulation & reductionin government protection, opening up of agriculturalmarkets, fluctuations in agricultural environment and toexploit possible opportunities for exports. The quality ofrural life can also be improved by quality information inputswhich provide better decision making abilities. IT can playa major role in facilitating the process of transformationof rural India to meet these challenges and to remove thefast growing digital divide. It can be rightly stated thatthough Information Technology in the agriculture is ingrowing stage in the Indian context, it has just started tospread its shoots, but with its immense potential tostandardize and regulate the agricultural processes andsolve the problems, it is sure that IT will be one of themost important areas in the near future for agriculturaldevelopment. It is hoped that Information Technology willbring a highly developed agriculture by its worthwhilecontributions to the society by narrowing down theenormous gap between the researchers and farmers. Itis suggested that the farmers are to be made aware ofthe utility of the Internet and other related informationregarding Information Technology (Phougat 2006).
esa jgrh gS ,oa —f"k mudh vk; dk eq[; L=ksr gS A —f"k O;olk; blle; dfBu ifjfLFkfr ls xqtj jgk gS A nqHkkZX;o'k Hkkjr ds fdlkulwpuk rduhd@bZ & —f"k ls vufHkK gS A ftldk eq[; dkj.ktkx:drk dk vkHkko] —f"k Hkwfe esa deh gksuk] ewY;lao/kZu dk fodklu gksuk] =qfViw.kZ Hkwfe izca/ku] fdlkuks dks muds mRikn ds fy, mfprewY; u feyuk] flapkbZ ,oa —f"k vk/kkjHkwr lajpuk ds fy, mfpr fuos'kdk u gksuk vkfn gS A Hkkjr dh [kknz; mRiknu ,oa mRindrk esa dehgks jgh gS tcfd budh vko';drk c<+ jgh gS A lwpuk izkS/kfxdh dk—f"k esa mi;ksx djus ij Hkkjr dks fo'o Lrj ij igpku izkIr gksxh]—f"k mRiknu dks c<+kus esa lgk;rk feysxh ,oa fdlkuksa dks mPp ewY;izkIr gks ldsaxk A
References
World Summit on the Information Society, Geneva 2003-Tunis 2005, Plan of Action. Paragraph 21. http://www.itu.int/dms_pub/itu-s/md/03/wsis/doc/so3-WSIS-DOC-0005!!PDF-E.pdf
Swaminathan M.S. (2001) Food Security and sustainabledevelopment, Current Science, 81:8 October 25
Sagar Ananda K Vijayanand K(2003) Good Governance: Roleof Information Technology, http://www.gisindia.com/article_read.asp?id=7
Kumar RN, Sailaja B (2006) Role of information andcommunication technologies for improving inputefficiency of horticultural crop production. IndianJournal of Arid Horticulture, Vol(I):63:68
Mittal SC (2004) Enhancing Productivity and Quality of workthrough IT, http://www.networkcomputing.in/EnhancingProductivityandQualityofWorkthroughIT.aspx
Chaudhuri S, Dayal Umeshwar, Ganti V (2001), DatabaseTechnology for decision support systems, IEEEcomputer, pp 48-55
Reddy P Krishan (2002) A novel frame work for informationdissemination system to improve crop productivity,in proceedings of 27th Convention of IndianAgricultural Universities Association, December 9-11, Hyderabad India pp.437-459, AcharyaN.G.Ranga Agricultural University Press
Phougat S (2006). Role of Information Technology inAgriculture. Science Tech Entrepreneur
Technological gap in chickpea production technology among tribalfarmers of Mandla district Madhya Pradesh
Ragini Varme and A.K. PandeDepartment of Extension EducationJawaharlal Nehru Krishi Vishwa VidyalayaJabalpur 482004 (MP)
JNKVV Res J 46(2): 245-247 (2012)
Abstract
The study indicate that out of 120 respondents majority ofchickpea tribal growers (88.33%) had medium to hightechnological gap in practices of chickpea in Mandla block ofMandla district of Madhya Pradesh.
Keywords : Chickpea, tribal farmer
Chickpea (Cicer arietinum L.) is the major pulse crop usedin diet of vegetarians in India and is a good source ofprotein. In India chickpea occupies an area of 7.49 millionha with production of 6.33 million tones with productivityof 845 kg/ha. Chickpea occupies about 38 per cent ofarea under pulse and contributes about 50 per cent of thetotal pulse production in India (Anonymous 2007). Thearea of chickpea crop is 2.84 million ha. with productionof 2.79 million tones with productivity of 981 kg/ha. inMadhya Pradesh (Anonymous 2009). The average grainyield of chickpea as per the recommendations ofscientist’s of Jawaharlal Nehru Krishi Vishwa Vidyalayais 14 q/ha. Thus it warrants the decrease in throughincreasing the yield potential at farmer’s field by adoptingscientist’s recommended production technologies.Therefore, a study was conducted to ascertain the existingtechnological gap in tribal growers of Mandla district whoare altogether different in characteristics as compared tothe general farmers and the factor associated with.
Material and methods
The present study was conducted in Mandla district ofMadhya Pradesh.
The district is situated in between 22°.22” to 23°.22” Northlatitude and 80°.18” to 81°.50” East longitude. Thegeographical area of the district is 8771 sq/km with a
population of 7,86,648 out of which 5,11,798 are tribalpopulation. Among the nine blocks one block wasselected purposively on account of large tribal population(57.23%) and chickpea growers as well as large area761 ha. and less production 578 tones under chickpeacrop as compared to other blocks. Out of total 174 villagesof block 10 villages were taken on random basis afterpreparation of list of chickpea growing villages and 12farmers from each village were selected on random basis.Thus, a total of 120 tribal respondents were consideredfor the study as per the procedure adopted by Mishra(2009).
Technological gap in adoption of scientific chickpeaproduction technologies was considered as dependentvariable for the study and to measuring this, an adoptionindex was prepared. The technological gap in differentpackage of practices was worked out by using followingmentioned formula as advocated by Bhoite (1983).
Formula R – ATechnological gap index (TGI) = ----------------- x 100
R
Where,
R = Maximum possible adoption score that a respondentcould get
A= Scores obtained by a respondent by virtue of hisadoption of given technology
The production practices, viz., field preparation andmanagement, seed management, fertilizer management,irrigation management, weed management, plantprotection management, harvesting management andstorage management were considered for determining thetechnological gap. The data were collected with the helpof pre-tested structured interview schedule. Percentageand Chi-square test were used for statistical analysis and
246
interpretation of results as recommended by Snedecor(1959).
Result
Distribution of respondents on the basis of technologicalgap
All the respondents were grouped into low, medium andhigh categories of technological gap. It was observed that61.67 per cent respondents belong to medium level oftechnological gap followed by low technological gap 11.67per cent (Table 1). More than one-fourth of total samplepopulation (26.66%) did not adopt any recommendationwhich was considered as high level of technological gapin adoption of chickpea production technology. It wasrecorded that 11.67 per cent respondents adopted therecommendations of chickpea production technology. Thework of Badodia et al. (2002) and Mishra (2009) alsoreported that maximum numbers of respondents werehaving medium level of technological gap about chickpeacultivation. The wide gap (88.33%) can be minimizedthrough education and other education programmes.
Table 1. Distribution of tribal growers on extent oftechnological gap in chickpea productiontechnology N=120
Technological Gap Frequency Percentage
Low (1- 33 score) 14 11.67
Medium (34- 66 score) 74 61.67
High (67 – 100 score) 32 26.66
Extent of technological gap in different package ofpractices of chickpea
The technological gap of package of practices of chickpeawas worked the data are presented in (Table 2). Themaximum percentage of technological gap was recordedin seed management (60.48%) followed by plantprotection management (57.60%), fertilizer management(57%) and weed management (51.80%). The leasttechnological gap was recorded in field preparation(35.83%) and irrigation management (34.12%).
This wide gap in field preparation may be attributedto the common practice and lesser requirement of irrigationin chickpea crop. The maximum technological gap in caseof seed management, plant protection management,fertilizer management and weed management must be
minimized through educating the farmers by impartingtraining, conducting result demonstrations and field visits.
Table 2. Mean technological gap in package of practices N=120
Package of practices Mean RankSeed management 60.48 IPlant protection management 57.60 IIFertilizer management 57.00 IIIWeed management 51.80 IVStorage management 40.41 VHarvesting management 36.94 VIField preparation 35.83 VIIIrrigation management 34.12 VIII
Association between socio-economic, psychological andcommunicational attributes of chickpea tribal growers withtechnological gap
Out of 15 independent variables, 11 variables, namely,education level, size of land holding, farm power, materialpossession, scientific orientation, marketing orientation,knowledge level and adoption level had significant andpositive association with the technological gap (Table 3).Other 4 variables namely, age, social participation, massmedia exposure and contact with extension agencies hadnon-significant and did not show any relationship withthe technological gap.
Table 3. Chi-square between the attributes of tribal growerswith technological gap N=120
Age 1.34Education level 14.89**Size of land holding 6.79*Farm power 7.963*Material possession 9.18*Social participation 0.198Annual income 5.591*Socio-economic status 6.475*Mass media exposure 3.009Contact with extension agencies 2.979Extension participation 6.008*Scientific orientation 14.771**Marketing orientation 6.070*Knowledge level 23.48**Adoption level 10.95*** Significant at 5 per cent level of significance** Significant at 1 per cent level of significance
247
It indicates that these variables did not play any significantrole in explaining the technological gap. The variableswith Chi-square value high reveal that the variables areassociated with the technological gap.
References
Anonymous (2007) All India General Statistical Informationof Agriculture Department 103-104
Anonymous (2009) District wise General StatisticalInformation of Agriculture Department 105
Badodia SK, Shrivastava KK, Lakehra ML (2002)Technological gap in chickpea cultivationtechnology. Agric Ext Rev: 25-28
Bhoite HS (1983) A multidimentional study of adoption ofIOWA with reference to the technological gap. PhDThesis MPKV Rahuri
Mishra Rahul (2009) Technological gap in chickpeaproduction practices in Jabalpur district of MadhyaPradesh. JNKVV Res J 43 (2):225-227
Snedecor George W (1959) Statistical methods. The IOWAstate college press Ames IOWA USA 18
Analysis of Covariance (ANCOVA) technique has been usedto sort out the covariance effect assignable to different causesunder investigation about paddy crop. Analysis reveals thatthe yield attributing characteristics of paddy, viz. number oftillers/hill, number panicles/hill, length of the panicle andnumber of grains/panicle have been found significantcofactors (covariates) in increasing the yield of the crop.
Keywords: Analysis of covariance, Analysis of variance,Regression analysis, Adjusted and unadjusted yield,Randomized complete block designs
Rice (Oriza sativa) is the most important staple food cropin India. It is cultivated in 44.6 million ha and covers thelargest acreage under the crop in the world. Riceproduction accounts for about 43% of the total food grainproduction and 55% of the total cereal production in thecountry. Major advances have occurred in rice productionduring last four decades due to adoption of green revolutiontechnology.
The average yield of rice in Madhya Pradesh is1.06 tones ha-1. The national average is 2.20 ton ha-1
(Statistics 2003) with currant growth in rice production.The productivity of rice in the State is about 1.0 toneha-1 which is lesser than that of national productivity level.
In Madhya Pradesh, rice in grown in the area ofabout 1.64 million hectares with production of 1.34 milliontones and productivity 12.05 q ha-1, which is below thanthat of national average. 20.05 q ha-1. The productivity ofhigh yielding inbred varieties of rice has almost reachedto a plateau with the present level of management in ricegrowing areas of Madhya Pradesh Introduction of hybridin rice crop has opened the door of productivity to breakthe barriers of low productivity in rice growing areas.
JNKVV Res J 46(2): 248-252 (2012)
Evaluation of major characteristics towards yield of rice crop usingANCOVA technique
K.S. Kushwaha and Sharad K. JainDepartment of Mathematics and StatisticsJawharlal Nehru Krishi Vishwa VidyalayaJabalpur 482004 (MP)
In agriculture, the necessary conditions for the fieldtrials is the uniformity of soil condition and culture so thatsome valid conclusions may be drawn about varioustreatments applied in study. It is not possible to get anideal piece of land as is expected for conducting a fieldexperiment and, therefore, the complete randomized blockdesign has been used to meet the need of treatmentcomparisons with a desired precision up to some extent.It can be possible only with the adoption of properexperimental trial to get reliable data along with the useof suitable statistical methodology and interpretation ofsuch data.
In an ANOVA technique, we sort out the variancecomponents attributable to different sources of variationlike blocks, treatments, error etc. But ANCOVA is astatistical technique which controls the variability whenexperimental control (blockings) fails to meet out therequired needs. It is a methods (i) to reduce experimentalerror through application of a covariate, and also (ii) tominimization of effect an extraneous source of variationin the observations taken. The concept of statisticalcontrol is attainable through the use of a co-variate alongwith the response variable. The ANCOVA makes use ofjoint applicability of (i) ANVOA and (ii) Regressionanalysis simultaneously.
An investigation was carried out to achieve thefollowing objectives:
(i) to investigate the presence of of correlation betweenyield and some important covariates
(ii) to see the effect of some selected covariates whichactually regulate the yield of crop
(iii) to see the significance of rice yield of differentvarieties under unadjusted and adjusted effects ofcovariates on yield through the use of regressionmodel.
249
(iv) to search out the better variety amongst varietiesconsidered in the study to give maximum yield inoptimized way for recommendation to the farmers.
Methodology for statistical Analysis
The present study is confined to the State of MadhyaPradesh, which is ranked 13th position in the totalproduction of rice in the Indian Union. To fulfill the specificobjectives, the study requires the data, viz. number oftillers/hill, number of panicle/hill, length of panicle, numberof grains/panicle and grain yield/plot in kg. The data werecollected from the Department of Physics andAgrometerology, College of Agricultural Engineering,JNKVV, Jabalpur. Data pertains to rice crop during Kharifseason, 2008.
Following Steel and Torrie (1980), the linearstatistical model in "Randomized Complete Block Design(RCBD) for ANCOVA", has been utilized for analysis workwhich is written as
yij = μ + ti + αj + β (xij- x ..) ... (1)
where (i=1,2,3,4...t, j=1,2,3,...,r)
(yij, xij): are the values (yield) on ith treatment of rice andjth character of covariate, respectively.
( x .., μ) : Grand mean of covariate x and general mean ofresponse variate y
(ti, aj ) : Effect of ith treatment and jth block, respectively
b, eij) : Regression coefficient of y on x and error termsdistributed as
eij~ N (o, αi2)
Ti = y i - y ... - b ( x i. - x ..)
αj = y .j - y .. - b ( x .i - x ..)
β = b = Exy/Exx
α2x = α2
y.x = Eyy - Eyy/Exx ...(iv)
Here, Exx, Exy and Eyg and adjusted SS, and SP forerror respectively and fe is the error d.f. We have to adoptthe strategy that the deviation of any treatment mean onresponse variate y (yield) from grand mean y.. must beadjusted by the quantity b ( xi - x ..). This adjustmentremoves any attributable effect of covariate x on responsevariate y. It is adjusted variety means that are comparablein a valid and efficient way.
We have to test the following statisticalhypotheses:
H01: There is no significant correlation between yieldand its attributing characters at α% level of significance.
H02: Experimental error is non-significant at α% levelof significance.
H03: Different varieties have significant effect on cropyield at a% level of significance.
The structure of ANCOVA table for R.C.B.D. andat the same time, illustrates the general procedure (Table1).
The logic of procedure depends on fitting model bymultiple regressions where total SS (adjusted) ispartitioned into components attributable to regression andresidual. This must be done for the full model i.e. under
Table 1. Structure of Analysis of Covariable in R.C.B.D
Testing adjusted treatment means, ANOVA for the RCBD Adjusted Sum of products
(t-1) (t-1)-1Treatment + error r(t-1) Sxx Sxy Syy r(t-1)-1 Syy-(S
2xy/Sxx)
Total r(t-1) Σ(X- X )2 ?(X- X )2 (Y - Y ) Σ( Y- Y )2
250
H1 and again for the reduced model, i.e. under H0. Finally,we have M.S.E.= $2y.x for full model and partial regressioncoefficient of Y on X is given as b = Exy/Exx. which estimatesβ.
Table 2. The correlation matrix of various covariates withresponse variate Y (yield)
Y X1 X2 X3 X4
Y 1.000
X1 0.085 1.000
X2 0.203 -0.390 1.000
X3 0.204 -0.435 0.937** 1.000
X4 0.092 0.937** -0.124 -0.136 1.000
** Correlation is significant at 1% level of significance (twotailed).
Pair wise correlation coefficient is worked out forcombination of all characters under study using theexpression
rx y x
x x y yxg
i i i
y
ni
n
i
n
n2
n
2 n
i2
n i
2
ii
n
n n
=−
∑
− FH IKFHG
IKJ − FH IKFHG
IKJ
∑∑
Σ ΣΣ Σ
Results and discussion
Silva et al. (1988) explained regression analysis toestimate the relation between rice yields in Sao Pauloand monthly water deficits, Wu (1989) suggested theANOVA and ANCOVA for agronomic traits with
Table 3. Analysis of variance for unadjusted yield of rice with different covariates separately
Covariance Source of variance d.f. Mean sum of square Fcal Ftab 5%
Table 5. ANCOVA for unadjusted and adjusted yield of rice with different covariates
Covariates average Treatments (varieties) Average yield Average yieldNo. of tillers/hill Unadjusted Adjusted
13.13 A 18.83 18.78**13.73 B 19.80 20.06**20.06 C 22.00 18.24*19.04 D 16.00 11.936.46 E 17.33 7.17 6.86 F 20.00 10.0512.8 G 21.00 14.3412.86 H 16.16 9,03
C.D. at 5%.=17.549.60 A 18.83 9.167.73 B 19.80 9.9518.00 C 22.00 13.34**11.20 D 16.00 6.555.80 E 17.33 7.266.10 F 20.00 9.9711.20 G 21.55 12.06**10.13 H 16.16 6.59
C.D. at 5%.=8.56426.50 A 18.83 27.47**27.60 B 19.80 29.91**24.06 C 22.00 27.53**25.66 D 16.00 23.8525.40 E 17.33 24.5925.40 F 20.00 27.2623.93 G 21.55 26.8724.46 H 16.18 22.21
C.D. at 5%=4.769235.53 A 19.83 226.12**315.40 B 22.00 1824.50**204.50 C 16.00 -414.10196.50 D 17.33 -403.30211.22 E 17.00 -209.50206.40 F 20.00 -338.30195.40 G 21.55 -601.00196.60 H 16.16 -432.80
C.D. at 5%=11.599
252
unbalanced data in hybrids of Indian rice. Lin (1992)explained the cultivation methods for producing the highestyield for rice c.v. Shamyou 63 were modeled. Wu LiangHuan et al. (1995) provided explanation based on datafrom 84 fertilizer application experiments with rice andobtained equations for regression analysis of factorialexperiments with limited replications. Rao, et.al. (1998)conducted a field experiment at the ICRISAT, Hyderabad,India, over 6 years period to study the run off from Alfisolaunder numbers of tillage without amendments. Becker,and Johnson (2001) found that much of the rapidly growingdemand for rice in West Africa will be met from productionin island valley swamps which are abundant and relativelyrobust with regard to cropping intensification. Mahto, R.N.and Mohan (2003) proposed the regression analysis of26 early maturing upload rice genotypes conducted in afield experiment in Ranchi, Jharkhand, India, during theKharif season of 1995.
There was no significant correlation between yieldand its attributing character at 1% level of significance.But there is significant positive correlation between No.of tillers/hill and number of grains/panicles and same isbetween length panicle and No. of panicle/hill (Table 2).
The experimental error is non-significant and hencesampling error is pooled with experimental error to seethe significance of variety means (Table 3).
The treatment T2 and T3 are significant and are alsomore superior, but T3 is formed most superior and henceit is the best variety (Table 4).
On comparison of adjusted variety difference valueswith C.D., value, the variety B is the highest tiller/yieldamong varieties followed by variety A and is significantlydifferent from others (Table 5).
In case of comparison of adjusted means differencevalues with C D values, the variety C has highest No. ofpanicle / hill among the varieties followed by variety G.and significantly different from other varieties.
In case considering length of panicle, the variety"B" has the highest length of panicle yield among varietiesfollowed by variety C and is significantly different fromother varieties.
In case of considering yield for number of grain /panicle, the variety B has the highest grain yield amongverities followed by A and is significantly different fromother varieties.
Finally, we come to a conclusion that variety B isthe best variety for Kharif season.
Abamu FJ, Allure (1988) CAMMI analysis at rainfed rice(Oryza sativa) trials in Nigeria, Plant Breeding 117(4),395-397
Lin F, Hong ZF, Zhuang BH, Hun x H, Yong SH, Yan Q (1992)Polynomial regression analysis on cultivation factorof ratooning hybrid rice Shanyou 63, Fugiam-AgricCollege 21(4) 374-379
Maths RN, Mohan KS (2003) Regression study in rainfedupland rice (Oryza sativa L.), Rese, Birsa Agric Univ15(2) 261-263
Roa K P C, Steenhuis TS, Cogle AL, Scinivagan ST, Yule DF,Smith GD (1998) Rainfall inflitration and sunoff froman alfital in almi-aid tropical India I. No. till systems,soil and Tillage Research 48 (1-2):51-59
Steel RGD, Torce JH (1980) Principles and procedures ofplattistics, (A Bio-metrical Approach) Mc Graw- HillKagnanusha Toky.
Selea GLS P da, Vicentre JR, Casper D V (1988) Effect ofweather conditions on rice yields in Sao Pauto state,Pesquisa- Agropecuaria Brasileira 23 (10) 1063-1071
Wa Jixiang (1995) Analysis of variance and co-variances foragronomic trials with unbalanced data in hybrids ofIndia Chinese Rice Rese letter. 3-4, 10-11
Wu Liang Huan, Ta qin Nam, Fong ping, Wu LH, Tao QN,Fang P(1995) Approach for improving precision ofregression analysis of single replication fertilizationexperiments in rice CRRN, Chinese Rice ResNewsletter 3-2: 11-12
The study is concerned with diagnostics analysis of the non-linear models for the forecasting of area under wheat crop inMadhya Pradesh. The four non-linear models were employed.Two models Gompertz followed by Logistic were found bestsuitable because they fore cost the area very well.
Wheat (Triticum aestivum) is the important staple foodcrop. It is cultivated over an area of about 215 m ha.with the production of 584mt grain. Wheat productionof India jumped from 6.40 million tones in 1950-1951 toa record figure of 80.80 million tones in 2010-11(Agriculture Statistics at a glance).
A number of studies have been undertaken tounderstand the growth pattern of area under wheat cropin Madhya Pradesh. Statistical tool and techniquesranging from graphs, charts and diagrams to regressionanalysis were employed. But the potential of the areawas unanswered. Hence, the study of the growthprocess of area employing sound statistical techniqueswas undertaken.
Various important nonlinear deterministic growthmodels viz. Logistic, Gompertz, Monomolecular andRichards are fitted.
Logistic Model
Let x (t) denote the variable under study like productionor productivity or area of wheat at time t. also, let A (>0)denote the intrinsic growth rate and C the carryingcapacity of the environment. Thus the model is
represented by
X (t) = C / [1+B exp (-At)]
WhereB=[C-X (0)] / X (0) and X (0) is the value of X (t) at t=0.
Gompertz Model
Gompertz model is another sigmoid growth model. It isrepresented by
X (t) = C exp [-B exp (-At)].
Monomolecular model
The model describes the progress of a growth situationin which it is believed that the rate of growth at aparticular time t is directly proportional to the amount ofgrowth yet to be achieved. The model is representedby the equation
X (t) = C- (C-B) exp (-At)
Richard’s model
Like mixed influence model, Richard’s model has a four-parameter growth model. It is proposed by Richards(1959) and is represented by
X (t) = C / [{1±B exp (-At)}1/D]
Where,
B = [{CD-XD (0)}/XD (0)] is the constant of integration.
JNKVV Res J 46(2): 253-257 (2012)
Non-linear model for prediction of area under wheat crop in MadhyaPradesh
R.B. Singh, Ramkesh Meena, K.B. Tiwari and Mahesh PatidarDepartment of Mathematics and StatisticsJawaharlal Nehru Krishi Vishwa VidyalayaJabalpur 482004 (MP)
254
The upper sign within the brackets is applicable when Dis positive and the lower sign when D lies in the Range -1≤D<0. Richards model is a generalization of logistic(when D=1), Gompertz (when D=0), and monomolecular(when D= -1) models.
Material and methods
Test for randomness of residuals
To test whether the successive observations are randomare not, we examine residuals. Replace a residual by“+” or “-“sign according as it was positive or negative.Let n1 be the number of pluses and n2 was the numberof minuses in the series of residuals. The test was basedon the number of runs (r); where a run was define as asequence of symbols of one kind separated by symbolsof another kind. We test the null hypothesis
H0: the test of residuals is random,
Against
H1: the test of residuals is not random.
The required statistical test is the one samplerun test. The mean and variance of the samplingdistribution of r, the number of runs, was given by
Therefore, for large samples, the required test statisticwas
Where,h = 0.5 if r < 2n1n2 / n+1
andh = -0.5 if r > 2n1n2 / n+1
Since H1 does not predict the direction of the deviationfrom randomness, a two-tailed rejection region wasused. Thus H0 is rejected at level of significance α if
⏐ Z⏐ >Zα/2Where Z ?= P (Z>Z α) = α
The most widely used method of computing nonlinearleast square estimates is Levenberg-Marquadt algorithm(Levenberg 1944 Marquadt 1963) has been used. Themethod represents a compromise between thelinearization (i.e. Taylor series) method and the gradient(i.e. steepest descent) method and combinessuccessfully the best features of both and avoids theseries
Goodness of fit of nonlinear statistical models
An important question that arises when a modeler wantsto develop model empirically is that of how a specifiedmodel fits the given data set. A lot of studies have beenconducted for investigating whether a proposed modelprovides a good description of the data. The widely usedmethod is based on examination of residuals. The usualmodeling situation was that a model is adopted becausesome theory and / or empirical evidence from the useof that model over many data sets indicate that modelis appropriate (Ratkowsky 1983).
Coefficient of determination (R2)
The goodness of fit was examined by using thecoefficient of determination (R2). Kvalseth (1985)examined the different forms of R2 available in theliterature. Eight different forms of R2 have beenmentioned in his paper. One of the main conclusions ofthe paper was that
R2 = 1- Residual SS / Corrected SS (1)
values of this R2 was well defined with end pointscorresponding to perfect fit and complete lack of fit, suchas 0 ≤ R2 ≤ 1, where R2 = 1 corresponds to perfect fitand R2 ≥ 1 for any reasonable model specification. Fornonlinear statistical models its value can be negative,if the selected model fits worse than the mean (Kvalseth1985).
Zr h 12n n
n
{2n n (2n n n n )}{(n n ) (n n 1)}
1 2
1 2 1 2 1 2
1 22
1 2
=+ − −
− −+ + −
d i
255
Root means squared errors (RMSE)
The RMSE is defined as
(2)
The smaller the value of RMSE the better is the model.
(iii) Mean absolute error (MAE) the MAE is defined as
RMSE = S |X – X| / n (3)
the smaller the value of MAE the better is the model.
Mean squared error (MSE)
The MSE is defined as
MSE (X X)(n p)
2
= −−
Σ
(4)
In equation (2) to (4) the summation is over all theobserved values, n denote the total number of observedvalues and p denotes the number of model parameters.Ratkowsky (1990) mentioned that MSE is the bestgoodness of fit statistic as it explicitly considers numberof parameters in the definition.
Correlation coefficient between observed and predictedvalues [r(X, x )]
It is the simple product moment correlation coefficientbetween observed and predicted values. The greaterthe value the better is the model.
Results and discussion
Various nonlinear statistical models Logistic, Gompertz,Monomolecular and Richards are considered formodeling total area under wheat in state of MadhyaPradesh (Table 1). In all the four models Logistic andGompertz fit very well to the data set than the othermodels, The best fit model is Gompertz, followed byLogistic model for the data set because the other twomodels showed the higher values of RMSE, MSE, MAEparameter values, hence discard Monomolecular andRichards in comparison of three parameter models thatis Logistic and Gompertz. The coefficient of
determination was maximum with comparison variousgoodness of fit of statistic R2, RMSE, MSE, MAE, andr(X X) . Therefore Gompertz model followed by logisticswas considered as the best suited models. Thedifference between the statistics of goodness of fit ofthese models was negligible. Therefore no differenceamong these models was noticed. Gompertz andLogistic model well considered for the fore casting ofarea of wheat in Madhya Pradesh. The illustration ofgraphs of fitted logistic, Gompertz, monomolecular, andRichards. Models as represented in (Fig 1 a, b, c, d)showed the clear-cut picture that Gompertz and Logisticfit the data best. The result of the observed and fittedvalue is given in the Table 2.
RMSE 1/ 2(X X)n
2
= −Σ
Table 1. Results of fitting various models to the datasets regarding total area under wheat (in millionhectares) crop during 1984-85 to 2008-2009
Bass F M (1969) A new product growth for model consumerdurables. Management Sci 15 (5): 215-27
Jain B L Atri P M and Sharma HO (1988) Analysis of growthtrends in area, production and productivity ofchickpea in Madhya Pradesh. Indian J Pulses Res1(1): 36-42
Kvalseth T O (1985) Cautionary note about R2. The AmericanStatistician 39(4): 279-85
Levenberg K (1944) A method for the solution of certain non-linear problems in least squares. Quart Appl Math 2:164-8
Lal Jagdish and Bajpai P K (1984) Regional disparities andtrends in area, production and productivity ofsugarcane in India. Agricultural Situation in India39(2): 91-94
Marquardt DW (1963) An algorithm for least squaresestimation of nonlinear parameters. J Soc Ind ApplMath 11: 431-41
Mander GS and Sharma J L (1995) Production performanceof cereal crops in India state wise analysis.Agricultural Situation in India XLXII (2): 57-61
Prajneshu and Sharma V K (1992) A nonlinear statistical modelfor adoption of high yielding varieties. Ind J Appl Stat1:12-18
Ratkowsky DA (1983) Nonlinear Regression Modeling. Aunified Practical Approach. Marcel Dekker New York
Richards FJ (1959) A flexible growth functions for empiricaluse. J Exp Botany 10: 290-300
Studies on land use pattern changes in Betul tehsil during pastdecade using remote sensing technique
V.K. Verma*, N.K. Khare, D.P. Rai and K.K. Saxena*Programme CoordinatorKrishi Vigyan Kendra, BetulJawaharlal Nehru Krishi Vishwa VidyalayaJabalpur 482 004 (MP)
Abstract
During the systematic survey of Betul district, it was observedthat a great variety of soils (soil family association) occurs inthe region. These soils are found to occur either as a singleentity or an association of two to three soil families in amapping unit of a particular landform and soil portionrepresents a large fraction of the biological and physicalactivities necessary for turfgrass growth. It serves as a growthmedium, and a source of nutrients and water. It was observedthat more than 60 per cent of the districts have no stoniness,while the rest of the area falls under moderate to slightstoniness. The nitrogen content in 54 per cent of soil ismedium; in 21 per cent of soil is high and that of 25 per centof soil is low. This shows that the most of the soils need (lowand medium category) the application of nitrogen. As a wholein the district, 105451 ha has low K, 456957 ha has mediumK and 441892 ha has high K status indicating the necessityof K fertilization in about 56 per cent (low to medium) area ofthe district. These lands are grouped under marginal tomoderate suitability class for cultivation. About 28 per centland of the districts falls under class VI-VIII which are notsuitable for cultivation. the introduction of canal irrigation hasresulted in the development of soil salinity and shallow watertable in the arid and semi-arid regions, which have depictedserious negative impact on the agricultural environment inthese areas. The Total Forest Area is 4085.043 sq. km (40.67% of total geographical area of the district) with protectedForest (1245.634 sq. km) and reserved Forest (2839.409sq. km)
A country is considered to be the social and politicalstable nation, if it possesses a very sound agriculturebase. In India, it is the largest enterprise up holding bymore than 10 crore farm holdings. It contributes nearly14.6 per cent of national GDP and sustains livelihood ofmore than 65 per cent population, helps in alleviatingpoverty and provides food to more than 1 billion people. Itforms the base for agro processing industries by supplying
raw material and contributes to 1/6th of the export earnings.
There is a continuous pressure of growingpopulation and dynamism in human activities resulting inchange in agricultural resource pattern and use. Asystematic planning is urgently needed to combine theconventional practices with modern to reap the fruits ofadvancement in science and technology. There is a greatconcern about decline soil fertility and water level,increasing soil salinity, resistance too many insecticides,pesticides and degradation of irrigation water quality. Inmany areas of the country due to misuse and impropermanagement of natural resources especially land andwater have initiated a process of degradation through lossof soil productivity and environmental quality. This hasresulted in soil erosion, silting up to storage reservoirs,rising steam beds, frequent floods, water logging etc.Apart from this, there is a continuous competing demandon land resources which are gradually leading to landscarcity. In many parts, large areas of prime agriculturalland lost due to urbanization and developmental activities.Forests are being intruded for agriculture and subjectedto heavy pressure of grazing.
In view of the above situation, importance of land,resource for the survival and welfare of the people,economic independence of the country it is imperative togive high priority to promoting optimum land use tomaintain and improving soil productivity and to conservesoil resources. The available land of the country is alreadybeing put to use due to an increasing demand for variousagricultural, forestry and livestock products forconsumption and export, it evidently need the planningfor its best use. The conventional methods of datacollection by simple survey method to systemic land usesurveys are generally costly and time consuming. Thenew scientific ways such as Remote Sensing andGeographical Information System (GIS) proved great
259
significance to record information on cropping patternchanged and agriculture land which is a prerequisite foroptimal land use planning.
The advent of remote sensing technology and itspotential in the field of agriculture has given newopportunities for improving agricultural statistics. Singhet al. (2003) proposed suitable methodology for estimatingcrop area by integrated remote sensing and GIS basedon spatial sampling approach. Remote sensing is powerfultechnique for surveying, mapping and monitoring earthresources. Development of remote sensing andGeographical Information System(GIS) technologies haveresulted in the betterment of mapping and interpretationtechniques as a means of understanding and effectivemanaging the present sources for sustainable. A uniquefeature of systems is that it allows human logic andintuition through a specifically developed programme forcorrecting and modifying the discrepant classificationarising out of spectral similarity of two or more classes innon forest stratum. The technology combined with GISwhich excels in storage, manipulation and analysis ofgeographic information and socio economic data providewider application and remotely recorded have beensuccessfully used for a variety of applications in arid andsemi-arid regions along the world. Land use and landcovering mapping using remotely sense image datainvolves delineation of the constituent units .Suchdelineation however, is dependent on wavelength region,in which they are imaged and also the spatial resolutionof the image sensor. The visible and infrared bands provideinformation on common land cover features water, soiland vegetables Goward et al. (1994).
Material and methods
The study was conducted in Betul tehsil of Betul District.Betul tehsil is situated in Satpura Mountain running eastto West Satpura hills, Sapura Plateau, Satpura plains.The tehsil is categories under agro climatic zone SatpuraPlateau Zone and has basically agriculture orientedeconomy. It receives monsoon rains during June toOctober The average rainfall of the district 1083.9 mm in57 rainy days. Betul tehsil is situated in the south centralpart of the Madhya Pradesh with head quarter at Betulunder Bhopal division. It is bounded northwest byHoshangabad district in southwest by Khandwa Districtin the east by Chhindwara district of Madhya Pradeshand in south by Amravati District of Vidarbha region ofMaharastra state. The tehsil is located between 210-220to 220-240 North latitude and 740-04 to 780-330 Eastlatitude the general elevation is 700-800 meters abovemean see level (MSL).
An extensive survey of the Tehsil was carried outto collect relevant information for present study. Noquestionnaire based study was carried out but informationwas collected through formal interviews of the farmers,local governing bodies and personnel. It included RAEO,Patwaries, Sarpanch and Agriculture Extension Officersetc. Fifty different villages of the Tehsil lying in differentdirection were randomly surveyed. These villages surveyedwere later used for remote sensing studies as well. Theinformation regarding the change in agriculturalmechanization, fertilizer and plant protection methodswere collected through these villages. Also the causesand concern for these changes was discussed with thefarmers and related authorities. Data regarding agricultureLand Use Land Cover (LULC) pattern, crop cultivation,water resources etc. were produced through variousgovernment and semi government organization includingDistrict planning and Statistic Department, Betul; StateLand Record Department, Betul; National InformaticsCenter, Betul, Agriculture Department, Soil testingLaboratory, Betul.
Result and discussion
In a developing country like India, it is necessary to knowand evaluate the changes/transformations of land coverthat are going on. Out of several land use practicesagriculture is one of them, where man uses the land forgrowing crops to fulfil his basic food demands. Duringthis practice he transformed the land cover other thanagricultural land into croplands. Conventional groundmethods of land use mapping are labour intensive, timeconsuming and are done relatively infrequently. Thesemaps soon become outdated with passage of time,particularly in a rapidly changing environment. Hence, tohave knowledge based concrete record of transformationof land cover and the rate of land use practices man haddeveloped modem tools like remote sensing satellite tohave a vigilant watch on the changes. Remote sensingsatellite is one of the best tools designed by the humanbeing for continuous monitoring of such changes evertaking place on the land cover due to its revisit capacity.The remote sensing sensors data provides betterinformation about the changes. In agricultural applications,remote sensing imagery has been used to identify differentcrop types, estimate crop area and, predict yield at small(Kanemasu 1974).
The remote sensing and GIS approach not only emphasizeon the agricultural practices in the country, it also help tomanage the sustainability of agriculture even in the regionalarea like small or large tehsil of a state district. The tehsillevel agricultural crop analysis is possible only through
260
the IRS series satellite data due to its resolution. However,in addition to this, it seems that the analyses based onsynoptic data make extrapolations to lower administrativelevels difficult (Ocatre 1997). Monitoring of potential yieldbased administrative aggregates is disadvantageousbecause of the wide conditions and land use types thatmay occur within their area.
Remote sensing satellite data helps in sustainableagricultural practices. In order to achieve sustainableagriculture, national planners and decision makers requiretimely, accurate and detailed information on landresources. Available crop area statistics are disseminatedas administrative aggregates in tabular format. Theaggregate form of such data is incompatible with dataformats that attempt to interpret spatial relationships offactors related to crop distribution and production potential.The traditional notion of thematic mapping presumes thatevery spot on the ground surface can be labelled asbelonging to only one category (Schowengerdt 1997). Thelandscape is a heterogeneous area consisting of a mosaicof local and interacting ecosystems, which may includeforests, cropland, shrub land, open grassland and builtup areas (DeFries et al. 1996). However, the identificationof object depends on the spatial resolution of the remotesensing imagery (Tomar and Maslekar 1974).
The present study primarily aims at generatingdetailed agricultural cropping pattern and relevant landcover land use classes of the tehsil maps by using remotesensing and GIS techniques incorporated with expertknowledge to spatially distribute crop areas and otherpossible land cover /land use classes. For this IRS lALISS IT and IRS ID LISS III data were chosen as the mostefficient satellite data for 1:50000 scale for agriculturaland land use land cover pattern changes studyapplications. Spatial information on the expansion andidentification of agricultural production is an importantaspect in the generation of spatial agricultural statistics.This present study is based on the observation that thereis an increasing need for accurate and timely informationon crop area information at national level.
Soil
Soil systems like most natural systems, are in dynamicequilibrium. Most changes are slow and imperceptibleparticularly when viewed in the time frame of humanlifespan. However, catastrophic events such as highintensity storms can accelerate erosion processesresulting in measurable changes. These 'performance-related changes are more important as they can bequantified, particularly in economic value terms (Szabolcs1994). Soil survey provides an accurate and scientific
inventory of different soils, their kind and nature, andextent of distribution so that one can make predictionabout their characters and potentialities. It also providesadequate information in terms of land form, terraces,vegetation as well as characteristics of soils (viz., texture,depth, structure, stoniness, drainage, acidity, salinity andso on) which can be utilized for the planning anddevelopment. More than ninety percent of world's foodproduction is dependent on soil (Venkataratnam &Manchanda 1997). The scientific documentation of theproperties of Indian soils dates back to 1898 when J.WLeather distinguished four major groups of soils namelyIndo-gangetic alluvial soils, black cotton or regular soils,red soils lying on metamorphic rocks and lateritic soils(Velayutham 2000). The use of digital image processingfor soil survey and mapping was initiated with theestablishment of National Remote Sensing Agency andRegional Remote Sensing Service Centres. The initialworks carried out by Venkatratnam (1980) and Kudrat etal. (1990) demonstrated the potential of digital imageprocessing techniques for soil survey.
Soils are varied in nature. Their extent anddevelopment depends upon the environmental setting inwhich they have been evolved. The knowledge on the kindsof soils and their extent is very essential for sustainableland use planning. Soil resources inventory provides thiskind of information, obtained through a systematicinterpretation of remote sensing imageries, photograph,field survey, laboratory characterization and cartography.During the systematic survey of Betul district, it wasobserved that a great variety of soils (soil familyassociation) occurs in the region. These soils are foundto occur either as a single entity or an association of twoto three soil families in a mapping unit of a particularlandform.
Organic Matter
Soil organic matter is any material produced originally byliving organisms (plant or animal) that is returned to thesoil and goes through the decomposition process. At anygiven time, it consists of a range of materials from theintact original tissues of plants and animals to thesubstantially decomposed mixture of materials known ashumus. Most soil organic matter originates from planttissue. Plant residues contain 60-90 percent moisture.The remaining dry matter consists of carbon (C), oxygen,hydrogen (H) and small amounts of sulphur (S), nitrogen(N), phosphorus (P), potassium (K), calcium (Ca) andmagnesium (Mg). Although present in small amounts,these nutrients are very important from the viewpoint ofsoil fertility management. Soil organic matter consists of
261
a variety of components. These include, in varyingproportions and many intermediate stages, an activeorganic fraction including microorganisms (10-40 percent),and resistant or stable organic matter (40-60 percent),also referred to as humus. Radar waves may not be ableto penetrate soil if it is moist. On the soil reflectancespectra, this soil moisture will develop parallel curves.Moisture of soil has an equal effect over the spectrumand the ration between the spectral bands. Spectral bandsof red and near-infrared bands are independent from thesoil moisture. The soil line of the soil reflectance spectra,characterizes the soil type, defines vegetation indices,and corrects the plant canopy reflectance from the opticalsoil property effects. This soil line also represents therelationship between the red and the near-infrared soilreflectance. Ground radar can also be used incombination with remote sensing, to detect changes ofdiagnostic soil horizons such as albic, spodic and argillichorizons or soil/rock boundaries. Limitations with groundradar include soils with high salt content/clay/silt/moistureamounts.
Soil particles
The soil particle such as proportion of the sand, silt andclay play an important role for water holding and retentivecapacity, response to water management, response toapplication of fertilizers etc. the soil having almost equalamount of sand, silt and clay are considered as ideal.However, the existences of such soils are seldom. Soilswith extreme high content of clay, high content of sandor high content of silt are said to be bad soils in term ofparticle size classes. Usually the soils are met withdifferent proportion of particles. In view of this the soils ofthe soils of the district have been categorized as below.The fine soils are accounted to 35 per cent, followed byloamy soil 29 per cent, clayey soils to 16 per cent andloamy skeletal soils to 10 per cent TGA.
In Betul district the soil portion represents a largefraction of the biological and physical activities necessaryfor turfgrass growth. It serves as a growth medium, and asource of nutrients and water. The interaction nature ofsoils and water together is the focus of this presentation.Basically the soil particle size, the soil particle sizedistribution, and the structure of the soil determine themoisture characteristics (soil water relationships) aparticular turfgrass soil will have. Soil particles arebasically composed of sands, silt, clays and organicmatter. Sands include particle sizes which range from0.05 mm to 2.0 mm in size. This is a very large range ofparticle sizes Silt particles range in size from 0.05 mm to
0.002 mm, and clay particles are those particles lessthan 0.002 mm in size.
Clay Mineralogy
Clay minerals (and clay-sized particles) represent theultimate fate of the crystalline rocks as they interact withsurficial environmental conditions, provide the substratethat sustains life (and may even have played an essentialrole in the creation of life!), are important constituents ofthe "critical zone", play a key role in global biogeochemicalcycling, and are important to humanity with respect totheir role in natural hazards (swelling clays, slip surfacesof landslides and faults), as a natural resource, as theyimpact human health, their importance to civil engineeringprojects, and topical issues such as nuclear wasterepositories. The clay mineralogy of the districts havebeen studied and concluded that they are closely relatedto the nature and kinds of parent material/rock. The soilsof mixed mineralogy occupy an area of 32 per cent;Smectitic (developed from fine gravels, basaltic rocks -basalt) 38 per cent and that of kaolinitic mineralogy around29 per cent (coarse nature of parent rock/materials).
Calcareousness of Soil
In general there are two kinds of soils i.e. calcareous andnoncalcareous. The calcareous soils having calciumcarbonate within 50 cm from the surface. The content ofCaC03 help for crop growth and to some extent improvesthe quality of fruit crops/grains etc. but it has somereservation. The CaCO3 more than 20% is harmful to theroot crops and also uptake of nutrients. Based on contentof CaC03, the soils have been categorized as slight,moderate and strongly calcareous soils. Slightlycalcareous soils do not have much problem whereasstrongly calcareous soils pose problem for crop productionetc.
The land use of calcareous soils is highly variable:it ranges from non-used wastelands (deserts) tointensively cultivated irrigation areas. Calcareous soilsdevelop in regions of low rainfall and must be irrigated tobe productive. Therefore one of the main productionconstraints is the availability of water for irrigation. Thequality of the irrigation water is of crucial importance forsustainable agricultural production on calcareous soils.Frequently, the irrigation water is the cause of manymanagement problems. Almost all waters used forirrigation contain inorganic salts in solution. These saltsmay accumulate within the soil profile to suchconcentrations that they modify the soil structure,decrease the soil permeability to water, and seriously
262
injure plant growth. Crusting of the surface may affect notonly infiltration and soil aeration but also the emergenceof seedlings. Cemented conditions of the subsoil layersmay hamper root development and water movementcharacteristics. Calcareous soils tend to be low in organicmatter and available nitrogen. The high pH level results inunavailability of phosphate (formation of unavailablecalcium phosphates as apatite) and sometimes reducedmicronutrient availability e.g. zinc and iron (lime inducedchlorosis). There may be also problems of potassium andmagnesium nutrition as a result of the nutritionalimbalance between these elements and calcium.
Stoniness
The stoniness of surface is the area covered by stonesplaying an important role for soil crop and watermanagement practices. More the area, the more is therisk of conservation measure and vice versa. The stoninessdepends on slope gradients, terrain, managementpractices, land use, land cover etc. As such in the districtthree stoniness classes .are noticed. A land having lessthan 3% stones cover is classified as 'nil'; 3-15% stonescover as 'Slightly stony and 15-40% stones cover asmoderately stony. This stoniness provides the hurdle inall sort of (soil, crop and water) management practicesleading to low productive area. It was observed that morethan 60% of the districts have no stoniness, while therest of the area falls under moderate to slight stoniness.
Availability of Nitrogen
Nitrogen is an essential plant nutrient and is of a singularimportance in influencing crop production. Its uniqueposition in agriculture is due to the fact that its, occurrencein soil in general is low, and in atmosphere enormous. Itsrequirement by plant is considerable very high. Normallyfood grain crops need 4-5 kg of N for production of onequintal of grain yield. The entry of atmospheric nitrogenin soil had taken place through series of steps, the frontone being the symbiosis fixation of atmosphere elementarynitrogen (78.09%) and through liberation of nitrogen fromfundamental rocks as well as reduced forms of nitrogento elementary form. The nitrogen content in 54% of soil ismedium; in 21 % of soil is high and that of 25% of soil islow. This shows that the most of the soils need (low andmedium category) the application of nitrogen.
Available Potassium
Available potassium (K) refers to that forms of soil K whichremains on exchange complex (exchangeable) and inwater soluble form, together these can be extracted easily
by plant to meet its requirement. On an average theexchange phase K dominated by 90 per cent and that ofsolution phase K by 10 per cent to the total pool ofavailable K. The variation in available K status is governedby top sequential occurrence of soil, texture, CEC, K-activity, depth and slope gradient. The value increaseswith fineness of texture and also with increasing CEC(r=0.561; Y = 5.6 CEC-7.3); K-activity (r = 0.96; Y = 2788ak-19) and soil depth. The shallow soils usuallyaccompanied by coarser texture occurred at or near theescarpment and are usually associated with relatively lowvalue of available K. Considering the K fertility indices as:less than <150 ppm K as low; 150-300 ppm K as medium,and more than >300 ppm K as high; about 44% of thesoils of the districts showed high level of available K status,45.5% soils showed medium K status and 10.5% soilsshowed low K status.
As a whole in the district, 105451 ha has low K, 456957ha has medium K and 441892 ha has high K statusindicating the necessity of K fertilization in about 56 percent (low to medium) area of the district.
Land Capability Classification
Land capability classification is an interpretative groupingof soil mapping units mainly based on inherent soilcharacteristics, external land features and environmentalfactors that limit the use of land for agriculture, pasture,or other uses on a sustained basis. Land capability isthe potential of the land for its utilisation in specified use.The limitations are the land characteristics which adverselyaffect its use potential for agricultural production. Thereare three category of land capability classification namelycapability class, subclass, and unit. A capability classis a grouping of land unit that have the same relative degreeof limitation or hazard. The classes are indicated by romannumerals. The restriction, kind of land use andmanagement increases from class I to class VIII. ClassesI to IV considered for arable uses, while class V to VIII fornon-arable uses. The soils, having greatest response tomanagement and least limitation are grouped in class I,and those with little response to management and greatestlimitations are grouped in class VIII. In the district, themajor area falls under Class 11 contributing about 39%of the district TGA followed by Class III accounting forabout 14% and Class IV 19% of TGA. These lands aregrouped under marginal to moderate suitability class forcultivation. About 28% land of the districts falls underclass VI-VIII which are not suitable for cultivation.
Soil Erodibility
Erosion is the process of detachment of finer soil particles
263
from aggregates and their transportation from one placeto the other place through the action of eroding agentslike water, wind and human activities etc. It further leadsto soil degradation with varying extent and intensity oferoding agents. There are four type of soil erosion namelysheet, rill, gully and stream bank erosion.
Remote Sensing and GIS integrated erosionprediction models do not only estimate soil loss but alsoprovide the spatial distributions of the erosion. Especially,generating accurate erosion risk maps in GIS environmentis very important to locate the areas with high erosionrisks and to develop adequate erosion preventiontechniques. In this study RS and GIS technologies weresuccessfully used for land degradation and erosionmapping. Another study by also indicated that GISanalysis provide satisfactory results in developing erosionsurveys and risk maps by using GIS data layers such asDEM, slope, aspect, and land use. The amount of soilerosion is mainly affected by vegetation cover, topographicfeatures, climatic variables, and soil characteristics. Thehuman activities and large-scale envelopments alter thevegetation cover, impacting upon the soil erosion rate.Topographic features such as ground slope, slope length,and shape most affect rill and interrill erosion. The mostimportant climatic variables are rainfall amount andprecipitation intensity, which are called rainfall erosivity.Besides, temperature is another important climatic variablesince it affects the vegetative materials which are used inmulching to control erosion. Soil erodibility is mainlyaffected by aggregate stability, texture, depth, organicmatter, and stoniness.
Soil Degradation
The soil degradation is defined as the condition of thesoil by which soil progressively losses its productivecapacity. The assessment of soil degradation plays animportant role for taking care of conservation of the naturalresources to avoid further deterioration of soil and landquality. For assessing the degradation of the landform,land use, yield potential, the erosion, slope and physio-chemical properties of soils have been considered. Thekind, degree, extent and severity of soil degradation wereassessed on the district. Assessing the soil erosion rateis essential for the development of adequate erosionprevention measures for sustainable management of landand water resources. Geographic Information System(GIS) technologies are valuable tools in developingenvironmental models through their advance features ofdata storage, management, analysis, and display. TheRemote Sensing (RS) technology has been used toprovide the land use/cover information by using digital
image processing techniques. There have been manystudies on modeling soil erosion by utilizing RS and GIStechnologies.
Land Irrigability
Land irrigability classification is an interpretative groupingof soils based on physical and socio-economic factors inaddition to the soil irrigability and is primarily concernedwith predicting the behavior of soils when they are broughtunder irrigation. Development of irrigation network to feedthe increasing human population is a worldwide concern.A substantial investment has been made in the countryfor creating assured irrigation-facilities through major andmedium irrigation projects to increase agriculturalproduction. The irrigated area of the country has increasedfrom 21 Mha in 1950-51 to 57 Mha during 1999-2000(www.agricoop.nic.in). Unfortunately, the introduction ofcanal irrigation has resulted in the development of soilsalinity and shallow water table in the arid and semi-aridregions, which have depicted serious negative impact on
Table1. Forest Resources of Betul District
Total Forest Area 4085.043 sq. km (40.67 % oftotal geographical area of thedistrict)
Protected Forest 1245.634 sq. kmReserved Forest 2839.409 sq. kmPer capita ForestArea of the district 0.267Annual Rate ofafforestation 0.19 per centForest Villages 111Main Species Teak usually (grade III)Other species Haldu, Saja, DahoaMinor Forest Produce Tendu leaves, Chironji, Harra,
Aonla etc.
the agricultural environment in these areas.
Forest
Forests cover about a third of the Earth's land surface,and they affect the exchange of gases and energy betweenthe atmosphere and the surface. About 80% of the globalbiomass is contained in forests, and this forms the centralcomponent of the stocks and acquisition of carbon in thebiosphere. The growth and distribution of forests has acritical impact on atmospheric carbon dioxideconcentrations, a central issue in global change research.
264
Measuring the size and complexity of forest canopiesover large areas would enable scientists to betterunderstand these environmental processes. This can bemade easier only through the high spectral, spatial andtemporal resolution qualities of remote sensingtechniques. Indeed, the precise database pertaining toforest cover information is an imperative input offormulating various management plans and also remotesensing technology can be effectively utilized for changedetection and monitoring activities (Jessica et al. 2001).Forest boundaries of Betul Forest circle and Betul Districtare the same. Information regarding forest resources ofthe region is illustrated in the following table:
DeFries R, Hansen M, Townshend J (1996) Proportionalestimation of land covers characteristics fromsatellite data. Paper presented at the IGARSS'96
(1996 International Geosciences and RemoteSensing Symposium: Remote Sensing for thefuture) Burnharn Yates Centre, Lincoln Nebraska,USA
Goward N, Huemmrich F, Waring H (1994) Visible nearinfrared spectral reflectance of landscapecomponents in Westem Oregon. Remote sensingof Environment 47: 190-203
Jessica PK, MC Porwal, PS Roy and G Sandhya (2001) Forestchange detection in Kalarani Round, Vadodara,Gujarat - A Remote Sensing and GIS approach. JourInd Soc Rem Sensing 29 : 129-135
Kanemasu ET (1974) Seasonal canopy reflectance patternsof wheat sorghum and soybean. Remote Sensingof Environment 3(1-4)
Kudrat M, Saha SK, Tiwari AK (1990) Potential use of IRSLISS II digital data in soil landuse mapping andproductivity assessment. Asian Pacific RemoteSensing Journal 2: 73-78.
Ocatre R (1997) Agro ecological stratification and monitoringof the growing season with NOAA. UnpublishedMSc. Thesis, International Institute of Gee-information Science and Earth Observation,Enschede
Szabolcs J (1994) The concept of soil resilience. pp. 33-40.In: D.J. Greenland & I. Szabolcs (eds.) SoilResilience and Sustainable Use. CAB International,Wallingford
Schowengerdt RA (Ed) (1997) Remote sensing models andmethods for Image processing (Second Edition ed.).San Diego: Academic Press Limited
The present investigation was undertaken to elucidate thehypocholestremic effect of the garlic oil on egg yolk and serumcholesterol levels in Jabalpur color birds. Twenty four 40-weeks-old Jabalpur color birds were allocated to four dietarytreatments. Birds were caged individually and diets weresupplemented with 0 (control), 250, 500 and 750 mg garlicoil/kg of feed in group T1, T2, T3 and T4 respectively for 56days. There were highly significant (P<0.01) differences inserum cholesterol and egg yolk cholesterol values betweenintervals within treatments, whereas those between treatmentswithin group were significant (P<0.05). Serum and egg yolkcholesterol concentration decreased with increased level ofgarlic oil from 0 to 750 mg/kg of feed. It was concluded thatgarlic oil in the diet of laying hens reduced the serum and eggyolk cholesterol concentration. The better values-for theseparameters were obtained in the T4 group.
Keywords: Garlic oil, Jabalpur color birds, serumcholesterol, egg yolk cholesterol
Cholesterol is present in all animal tissues. When itslevel rises to more than normal limits it may beassociated with atherosclerosis, hypertension andcoronary heart disease (Satyanarayana 2005). Themedicinal values of several plants is well studied fortherapeutic properties. Garlic (Allium sativum) is usedto treat cardiac diseases (Adler and Holub 1997) thatcontains a variety of organosulphur compounds suchas allicin, ajoene, S-allylcysteine, diallyl disulphide, S-methylcysteine sulphoxide and S-allylcysteinesulphoxide (Chi et al. 1982). According to Adler and Holub(1997), allicin is responsible for reducing the level of serumcholesterol that ultimately may be beneficial tocardiovascular diseases.
Egg is a rich source of all the essential aminoacids, minerals and vitamins however, in addition tothese essential dietary components, it contains about
200-250mg of cholesterol (Griffin 1992) which isconsidered as a major source of dietary cholesterol.The liver of the layer hen produces most of the lipidsfound in egg yolk since the lipids are transported to theovary by serum lipoproteins (Elkin 1997). Hence, adecrease in serum lipid concentration might lead to adecrease in egg-yolk lipids. The current study wasplanned to study the effect of garlic oil on the serumand egg yolk cholesterol of poultry birds.
Material and Methods
Birds 40-week age were maintained at All IndiaCoordinated Research Project on Poultry Breeding,Adhartal, Jabalpur in individual cages under standardmanagemental conditions for 56 days. Birds 40-weekage were randomly divided into 4 groups having 6 birdseach. Group T1 served as control, whereas treatmentgroups T2, T3 and T4 were considered as experimental-ones. Diet of the birds of trial groups were supplementedwith garlic oil @ 250, 500 and 750 mg/kg of feedrespectively. The basal diet consisted of 2700 Kcal ME/kg and 17% protein. Blood samples were collected fromall control and experimental birds on days 0, 14, 28, 42and 56 of the experiment. Serum was separated andused for the estimation of cholesterol by standarddiagnostic kit (Erba). Six eggs were collected from eachgroup on days 0, 14, 28, 42 and 56 day of theexperiment. Egg yolk total lipids were extracted (Folchet al. 1957) and used for the estimation of egg yolkcholesterol by the standard diagnostic kits (Erba).
Results and Discussion
Data were analyzed using hierarchial analysis ofvariance (Steel and Torrie 1992). Mean values of serumcholesterol are presented in Table1. The variations in
Hypocholestremic effects of garlic oil on serum and egg yolk ofJabalpur color birds
Shraddha Shrivastava, V.N. Gautam, B.S. Gehlaut and M.A. QuadriDepartment of Veterinary BiochemistryCollege of Veterinary Science and Animal HusbandryNanaji Deshmukh Veterinary Science UniversityJabalpur 482001 (MP) India
266
Table 1. Serum cholesterol (mg/dl) in Jabalpur colour birds under various treatments and durations (mean ± SE;n=6)Treatments Days
Day 0 Day 14 Day 28 Day 42 Day 56T1 176.62b ± 0.37 176.17b ± 0.63 177.54ab ± 0.59 178.88a ± 0.49 176.56b ± 0.37
Mean values with different superscripts in a row vary significantly (P< 0.01)
serum cholesterol and egg yolk cholesterol betweenintervals within treatments were highly significant(P<0.01) whereas those between treatments withingroup were significant (P<0.05). The reduction in serumcholesterol values was 25.79% for group T2 whereas itwas 33.31% for group T3 and 43.75% for group T4 onday 56 of the experiment (Fig. 1). Mottaghitalab andTaraz (2004) showed that the mean serum cholesterollevels were dropped by 14.2%, 21.9% and 12% in the0.5, 1, 1.5% garlic treated groups in laying hens.Significant reduction in serum cholesterol levels in birdswere also reported (Canogullari et al. 2009, Khan et al.2008, Chowdhury et al. 2002).
Mean values of egg yolk cholesterol are presentedin Table 2. Birds fed with garlic oil the percent reductionin egg yolk cholesterol was calculated to be 22.75 ingroup T2, 29.60 in group T3 and 35.61 in group T4 on day56 of the experiment (Fig. 2). Similarly Chowdhury et al.(2002) reported 5, 9, 14, 20 and 24% reduction in yolkcholesterol of laying hens on supplementation of 2, 4, 6,8 or 10% garlic paste in diet. Elangovan et al. (2004)found lower cholesterol levels in egg yolk levels ofJapanese quails fed 1% garlic powder in diet. Khan et al.(2008) observed a significant reduction (P<0.05) in eggyolk cholesterol concentration with increasing level of ovendried garlic powder from 0 to 8% in native desi layers for
267
6 weeks.
Most of cholesterol found in the egg isconcentrated in the yolk and is synthesized in the liverof the hen, transported by blood in the form of thelipoproteins (HDL, LDL and VLDL) and deposited in thedeveloping follicles. In the present studies, serum HDL-cholesterol values 42.81±0.12 mg/dl on day 0 weresignificantly increased to 52.06±0.11mg/dl. On the otherhand serum LDL cholesterol values 80.92±0.24 mg/dlon day 0 were significanly reduced to 44.44±0.47 mg/dl on day 56 of garlic oil supplementation of diet.Similarly serum VLDL values also decreasedsignificanly from 52.59a±0.04 to 30.99e±0.05 mg/dl.
The reduction in lipid profile may be due to thefact that garlic reduces the hepatic activities of lipogenicand cholesterogenic enzymes such as malic enzyme,fatty acid synthase, glucose-6 phosphatedehydrogenase (Qureshi et al. 1983) and 3-hydroxy-3-methyl-glutaryl-CoA (HMG-CoA) reductase (Youn et al.1996).
Hence, it was concluded that use of 750mg garlicoil/kg of feed showed a highly significanthypocholestremic effect (P<0.01) on day 56 and canbe effectively used for reducing cholesterol contents inegg yolk and serum of poultry birds. So, therefore, thategg can be consumed safely without the risk ofcardiovascular diseases.
de dksyLVªky okys v.Mksa dk mRiknu dsoy iksYVªh m|ksx dhvFkZO;oLFkk esa o`f) gh ugha djrk vfirq LokLF; ds izfr tkx:dmiHkksDrkvksa }kjk ,sls v.Mksa dh [kir esa o`f) Hkh djrk gS A bufcUnqvksa dks /;ku esa j[krs gq;s orZeku tkap djus ds fy, v.Ms dhtnhZ vkSj tcyiqj jaxhu eqfxZ;ksa esa lhje dskyLVªky ds Lrj ijyglqu ds rsy ds izHkko dks LiLV fd;k x;k gS A 24 eqfxZ;ksa ¼40 lIrkgmez½ dks 6&6 eqfxZ;ksa ds pkj lewg esa foHkkftr fd;k x;kA izR;sd eqfxZ;ksdks vyx fitMsa esa j[kk x;k Fkk A T1 T2 T3 ,oa T4 lewgksa esa Øe’k%0] 250] 500] 750] fe-xzk- yglqu dk rsy izfrfdyks vkgkj 56 fnuksard fn;k x;k A lhje dksyLVªky vkSj v.Mks esa mipkj ds Hkhrj varjkyesa P<0.01 erHksn Fks tcfd lewg ds Hkhrj mipkj esa P<0.05erHksn Fks A lhje o v.Ms dk dksyLVªky yglqu ds rsy dk izfr’krc<+kus ds lkFk de ik;k x;k A bl iz;ksx ls ;g fu"d'kZ fudyrk gS dseqxhZ ds vkgkj esa yglqu dk rsy feykus ij lhje o v.Ms+ nksuksa dkdksyLVªky de gksrk gS A
References
Adler AJ, Holub BJ (1997) Effect of garlic and fish-oilsupplementation on serum lipid and lipoproteinconcentrations in hypercholesterolemic men. Am JClin Nutr 65: 445–450
Canogullari S, Baylan M, Erdogan Z, Duzguner V, KucukgulA (2009) The effects of dietary garlic powder onperformance, egg yolk and serum cholesterolconcentration in laying quails. Czech J Anim Sci 55(7): 286–293
Chi MS, Koh ET, Steward TJ (1982) Effects of garlic on lipidmetabolism in rats fed cholesterol or lard. J Nutr112: 241–248
Chowdhury SR, Chowdhury SD, Smith TK (2002) Effect ofdietary garlic on cholesterol metabolism in layinghens. Poult Sci 81: 1856- 1862
Elangovan AV, Mandal AB, Tyagi PK (2004) Effect of dietarysupplementation of certain herbal agents andcholesterol lowering drug on egg productionperformance and egg quality of Japanese quaillayers. Annual Report CARI-Izatnagar
Elkin RG (1997) An overview of recent developments in avianlipoprotein metabolism. J Nutr S 127: 793-794
Folch J, Lees M, Sloane-Stanley GH (1957) A simple methodfor isolation and purification of total lipids fromanimal tissues. J Biol Chem 226: 497-509
Griffin HD (1992) Manipulation of egg yolk cholesterol: aphysiologist’s view. World Poult Sci 48: 101-112
Khan SH, Hassan S, Sardar R, Anjum MA (2008) Effects ofdietary garlic powder on cholesterol concentrartionin native desi laying hens. Am J Food Tech 3(3): 207-213
Mottaghitalab M, Taraz Z (2004) Effects of garlic (Alliumsativum) on egg yolk and blood serum cholesterol inAryan breed laying hens. British Poult Sci 43: S42–S43
Qureshi AA, Abuirmeileh N, Din ZZ, Elson CE, Burger WC(1983) Inhibition of cholesterol and fatty acidbiosynthesis in liver enzymes and chickenhepatocytes by polar fractions of garlic. Lipids 18:343–348
Steel RGD, Torrie JH (1992) Principles and Procedures ofStatistics: A Biometrical Approach. McGraw Hill NewYork
Youn BS, Nam KT, Kim CW, Kang CW, Ohtani S, Tanaka K(1996) Effects of dietary garlic supplementation onperformance and HMG-CoA reductase in broilerchicks. Korean J Poultry Sci 23: 129–134
Counteracting adverse effect of ochratoxin on relative organ weightsof broilers by Mentha piperita dry leaf powder
Anju Nayak, Sunil Nayak, Varsha Sharma and R.P.S. BaghelDepartment of Veterinary MicrobiologyCollege of Veterinary Science and Animal husbandryNanaji Deshmukh Veterinary Science UniversityJabalpur 482 001(MP)
Abstract
Hot and humid climate proliferate the growth of Aspergillus
ochraceus and ochratoxin production. It is considered to bethe most toxic mycotoxin and reported to be nephrotoxic,hepatotoxic, teratogenic and immunosuppresive causing adrastic reduction in the lymphoid cell population. The presentexperiment was designed to study the adverse effect of 2ppmochratoxin in broilers and anti ochratoxigenic effect of Mentha
pirerita dry leaf powder. Six groups were maintained withand without ochratoxin and Mentha pirerita leaf powder induplicate having 6 broilers in each replicate. The broilerswere sacrificed on day 15th, 25th and 35th. Increase in theweights of liver, kidneys were noted while reduction in thesize of lymphoid organs particularly bursa and thymus wereobserved. Mentha pirerita leaf powder partially counteractedthe adverse effect of ochratoxin on organ weights in broilers.
Poultry is kept primarily to convert feed into meat andeggs. At present, India stands at the third and fifth positionsin egg and chicken meat production, respectively with anannual contribution of about rupees 352 billion to the grossdomestic product (GDP).The Council of AgriculturalScience and Technology (1989) reported that at least 25%of the total world feed supply is contaminated withmycotoxins. During 2004-05 more than 85 percent of feedsamples were found positive for mycotoxins (Devegowdaet al. 2005). Besides aflatoxin, ochratoxin and T-2 toxinsare also found in feed stuffs. Although aflatoxin is themost prevalent, ochratoxin is considered to be the mosttoxic mycotoxin, being three times more dangerous thanaflatoxin. It is reported to be nephrotoxic, hepatotoxic,teratogenic and immunosuppresive, causing a drasticreduction in the lymphoid cell population (Hohler 1998).The toxin is an ever increasing threat to the poultry
industry, young birds being more susceptible to it thanolder birds (Huff et al. 1974). As a natural contaminant ofpoultry feedstuff it produces detrimental effects on theimmune and other systems of broiler chicks. Species ofAspergillus and Penicillium are mainly controlled bysynthetic preservatives, most of which are reported to becarcinogenic, teratogenic and leave residual effects in bothhumans and animals (Foegeding and Busta 1991). Theuse of herbal agents in controlling the production andspread of mycotoxins in broilers is a recent concept.Mentha pirerita has wide geographic distribution, is easilyprocured and economical. Besides, they are reported topossess antioxidant, antimicrobial, immunomodulatoryand antitoxigenic properties (Hitokota et al. 1980, Basilicoand Basilico 1999, Renzulli et al. 2004). Effect ofochratoxin on relative organ weights in broilers andcounteracting its adverse effect by Mentha pirerita leafpowder was studied.
Material and methods
Day old 72 broiler chicks of either sex were procuredfrom M/S Phoenix Hatcheries. Ochratoxin was producedin cereals according to the method described by Trenk etal. (1971). The representative samples of feed weresubmitted for quantification of ochratoxin by thin layerchromatography (AOAC 1995) at the Animal FeedAnalytical and Quality Control Laboratory (A.F.A.Q.C.L.)Veterinary College, Namakkal (Tamil Nadu) and added inbroiler diet to give a final concentration of 2 ppm. Nineexperimental diets were formulated as per Bureau of IndianStandard (BIS 1992) specification. Six groups weremaintained in duplicate with six broilers in each replicate(Table 1). The broilers were sacrificed on 15th, 25th and35th day of experiment. The organ (liver, spleen, kidney,bursa and thymus) collected at the time of slaughter wereweighed and expressed as relative organ weight andexamined for any gross abnormal changes.
269
Results and discussion
The broilers of groups I, III and IV showed normal relativeorgan weights and were statistically similar.
Liver: In group II broilers receiving 2 ppm ochratoxin, relativeliver weight was higher in comparison to control whileliver in broilers of group VII was more severely affected incomparison to group II. Marginal improvement in relativeliver weight in broilers of group V, VI supplemented withMentha pirerita along with ochratoxin was observed on15th day. Increase in relative weight of liver due toochratoxicosis were observed by Huff and Doerr (1981),who reported a significant increase in relative weights ofliver at 2 ppm ochratoxin in feed. The enlargement anddegenerative change in the epithelium of liver may be due
Table 1. Design of experiment for in vivo studies withochratoxin and Mentha pirerita dry leaf powders
Groups TreatmentsGroup I control Only broilers rationGroup II 2 ppm OchratoxinGroup III 2g Mentha pirerita / Kg feedGroup IV 4g Mentha pirerita / Kg feedGroup V 2 ppm Ochratoxin + 2g Mentha pirerita /
Kg feedGroup VI 2 ppm Ochratoxin + 4g Mentha pirerita /
Kg feed
Table 2. Organ weights (%) of broiler chickens fed 2 ppm ochratoxin with and without Mentha piperita on 15th day
Groups Treatments Liver Spleen Kidney Bursa ThymusI control 2.56b 0.08a 0.68b 0.29a 0.63a
Values bearing similar superscripts in the same column do not differ significantly (P>0.05)Values in ( ) brackets are angular transformed values
to the enterohepatic recirculation and hepatobiliary wayof excretion of ochratoxin causing the direct toxic effect(Fuchs et al. 1988).
Spleen: Relative spleen weight was significantly higheronly on 35th day in group II broilers. While relative spleenweight of group II was at par with control up to 25th day ofexperiment. Supplementation of Mentha pirerita along withochratoxin was not effective at any interval. The findingsare in agreement with Bhanuprakash et al. (2006),enlargement in spleen may be due to inflammation.
Kidney: Significantly higher kidney weight was noted ingroup II in comparison to control during the entire periodof experiment. Supplementation of Mentha pirerita withochratoxin (group V and VI) was partially effective incounter acting adverse effect of ochratoxin only up to 15th
day of study. Increase in relative weight may be due toenlargement of epithelium in kidney as a result of theirregenerative activity. The enlargement and degenerativechanges of the epithelium cells may be due to the factthat the route of elimination of ochratoxin is kidney (Fuchset al. 1988). It was due to direct effect on the kidney ordue to renal damage involving proximal convoluted tubules.
Bursa: In broilers of group II, reduced weight of bursa ofFabricius was observed in comparison to control duringall the intervals of experiment. Broiler of groups V and VIcounteracted adverse effects of ochratoxin only on the35th day of experiment. Reduction in the size of bursa islikely to be a consequence of degenerative changes anddecreased lymphoid tissue in these organs in ochratoxin
270
treated chicks (Stoev et al. 2000). Huff et al. (1974)observed significant decrease in size of bursa at 8 ppmochratoxin in diet.
Thymus: Significantly reduced relative thymus weight wasobserved in group II in comparison to control during allthe three intervals of experiment. Marginal improvementin thymus weight was observed in groups V and VI during
Table 3. Organ weights (%) of broiler chickens fed 2 ppm ochratoxin with and without Mentha piperita on 25th day
Groups Treatments Liver Spleen Kidney Bursa ThymusI control 2.38b 0.10a 0.71b 0.26a 0.56a
Values bearing similar superscripts in the same column do not differ significantly (P>0.05)Values in ( ) brackets are angular transformed values
all the three intervals of experiment except group VI whichwas not effective in diluting the adverse effect of toxin on15th day. Bhunuprakash et al. (2006) observed decreasein size of thymus using 1 ppm ochratoxin. The decreasein size of thymus may be due to degenerative changesand decreased lymphoid tissue in thymus in ochratoxintreated chicks (Stoev et al. 2000).While supplementationof Mentha pirerita along with ochratoxin, counteracts the
271
adverse effect of ochratoxin. It may be due to modulatingpotentials of these herbal powders.
'kks/k esa 72 ,d fnolh; pwtksa dks 6 lewgksa esa ckaVk x;k] izR;sd lewgds nks& nks jsIYhdsV cuk, x, o izR;sd esa 6&6 pwts j[ks x;sA eqfxZ;ksa dsvkgkj esa mifLFkr vksdjkVkfDlu dk pwtks ds fofHkUu vaxksa ds otu omu ij izHkko dk v/;;u fd;k x;kA iqfznuk dh fofHkUu ek=kvksa ds lkFkHkh vksdjkVkfDlu dk pwtks ds fofHkUu vaxksa ds otu o muij izHkkons[ks x;sA 2 o 4xke iqfznuk izfr fdyks vkgkj dk mi;ksx vkgkj esamifLFkr vksdjkVkfDlu ds izHkko dks de djrk gSA
References
AOAC (1995) Official methods of analysis. 16th edn.,Association of Official Analytical Chemist'sWashington D C
Basilico M Z, Basilico JC (1999) Inhibitory effect of somespices essential oils on A. ochraceus. NRRL3174growth and ochratoxin A production. Let ApplMicrobiol 29 (10): 238-242
Bhanuprakash M L, Sathyanarayana, Vijayasarthi S K,Upendra H A (2006) Serum biochemistry, organweights and performance of broilers chickens fedaflatoxin, ochratoxin and Toxin binder. Indian Vet J83 (2):159-161
BIS (1992) Indian standard nutrient requirements for poultry.I.S. : (9863) First revision, Bureau of Indian Standard,Manak Bhawan, 9 Bhadur Shah Zafar Marg NewDelhi India
Council of Agricultural Science and Technology (1989) InMycotoxins; economics and health risks - Task forceReport no. 115 Ames, IA, USA
Devegowda G, Murthy T K N, Girish C K, Gowda M R M C(2005) Mycotoxins in feed and feed ingredients. Asurvey in India, In Nutritional Biotechnology in theFeed and Food Industries 21st Annual Symposiumpp22-25
Foegeding P M, Busta F F (1991) Chemical foodpreservatives. In Disinfection,sterilisation andpreservation (ed. S.S. Block) Lea and Febiger,malvern, Pennsylvania 802
Fuchs R, Radic B, Peraica M, Hult K, Plestina R (1988).Enterohepatic circulation of ochratoxin A in rats.Period Biol 90: 39-42
Hitokota H, Morozumi S, Wanke T, Sakai S, Kurata H (1980)Inhibitory effects of spices on growth and toxinproduction fungi. Environ. Microbiol 39 (4): 818-822
Huff W E, Doerr J A (1981) Synergism between aflatoxin andochratoxin in broiler chickens. Poult. Sci 60: 550-555
Huff W E, Wyatt R D, Tucker T L, Hamitlon P B (1974)Ochratoxicosis in the broiler chicken. Poult Sci 53:1585-1591
Renzulli C, Galvano F, Pierdomenico L, Speroni E, Guerra MC (2004) Effects of rosamaric acid against aflatoxinB-1 and ochratoxin A induced cell damage in humanhepatoma cell line (Hep G2). J Appl Toxicol 24 (4):289-296
Stoev S D, Anguelov G, Ivanov I, Pavlov D (2000) Influence ofochratoxin A and an extract of arti choke on thevaccinal immunity and health in broiler chicks. ExpToxicol Pathol 52 (1) : 43-55
Trenk H L, Butz M E, Chu F N (1971) Production of ochratoxinsin different cereal products by A. ochraceus. ApplMicrobiol 21 (6 ) :1032-1035
Effect of rock phosphate without and with aluminium on carcassyields of egg type starters
Sunil Nayak, R.P.S. Baghel and Anju NayakDepartment of Animal NutritionCollege of Veterinary Science and Animal HusbandryNanaji Deshmukh Veterinary Science UniversityJabalpur 482 001 (MP)
Abstract
In order to reduce the cost of mineral mixture in egg typestarters, present study was planned to see the utilization ofrock phosphate (RP) without and with aluminium sulphateas an alternate to dicalcium phosphate in their mineralmixture In the experiment, four hundred and five day old eggtype chicks (WLH) were randomly distributed to 27 replicatesof 15 chicks each and were allotted to 9 dietary treatments.Diet one (T1) was control diet in which DCP was used as asole source of P. Diets 2, 4, 6 and 8 (T2, T4, T6 and T8) weresame as T1 except that in these diets DCP was replaced @40%, 60%, 80% and 100% with rock phosphate on P basis.While, diets 3, 5, 7 and 9 (T3, T5, and T7 and T9) were same asT2, T4, T6 and T8 accept the addition of aluminium at a ratio of0.8 Al: 1 F, in those diets. Experiment was conducted for 0-8weeks (Starter phase). Use of RP with and without aluminiumsulphate on carcass yields (dressed, eviscerated and drawnweights) of egg type starters (0-8 weeks) had significant(P<0.05) influence on the dressed, eviscerated and drawnweights of starters. Use of 40% RP instead of DCP did notinfluence their carcass yield but when it was used at higherlevel (60%, 80% and 100%) they were reduced significantly.However supplementation of aluminium sulphate with 80%RP instead of DCP did not influence their carcass yield.Hence it was concluded that 40% RP and 80% RP alongwith aluminium sulphate was beneficial to replace DCP inthe mineral mixture of egg type starters. However,supplementation of aluminium sulphate to RP was noteconomical.
Keywords: Mineral mixture, Alternate phosphorussources, Dicalcium phosphate, Rock phosphate,Aluminium sulphate, carcass yields, Egg type starters.
The cost of traditional phosphorus (P) supplement i.e.dicalcium phosphate (DCP) in poultry diet is steeplyincreasing hence use of alternate economical phosphorussupplement without lowering the production performance
of birds has become essential. In India, rock phosphate(RP) is available as an alternate economical phosphorussupplement but its use in the poultry diet is limited. Rockphosphate contains lower amount of P and large amountof fluorine (F) in comparison to DCP. Aluminium over ashort time period has proved to be an effective alleviatorof F toxicity. An Al : F ratio of 0.8 : 1.0 was found effectivein eliminating the toxic effect of F in poultry rations.Therefore, the present work was conducted to study theeffect of rock phosphate without and with aluminium oncarcass yields of egg type starters.
Material and methods
Stock, diet and husbandry
In the experiment, four hundred and five day old egg typechicks (WLH) were randomly distributed to 27 replicatesof 15 chicks each and were allotted to 9 dietarytreatments. Diet one (T1) was control diet in which DCPwas used as a sole source of P. Diets 2, 4, 6 and 8 (T2,T4, T6 and T8) were same as T1 except that in these dietsDCP was replaced @ 40%, 60%, 80% and 100% withrock phosphate on P basis. While, diets 3, 5, 7 and 9 (T3,T5 and T7 and T9) were same as T2, T4, T6 and T8 acceptthe addition of aluminium at a ratio of 0.8 Al: 1 F, in thosediets. Fluorine content in the diets containing 40%, 60%,80% and 100% RP instead of DCP were 486,729,972and 1214ppm, respectively. The chicks were vaccinatedagainst MD, ND, IBD, IB and fowl pox as per vaccinationschedule. The brooder temperature was maintained at34±1°C up to 7 days of age and gradually reduced to26±1°C by 21 days of age after which chicks weremaintained at room temperature. The experimental dietswere formulated as per ICAR (1998) specification and arepresented in Table 1. Each experimental diets were fedad libitum to 27 replicates of 15 chicks each duringexperimental period of 0-8 weeks.
273
Table 1. Composition of diets (%), using RP without and with aluminium sulphate, instead of DCP in MM, fed to eggtype starter chickens (0-8 weeks)
*Vitamin premix provided (each 250 g contains): Vit A - 10000000 IU; Vit.D3- 2000000 IU; Vit. B1 -800mg; Vit.B2- 5g; Vit.B6-1.6g;Vit. B12-20.5g; Niacin -12.0g; Calcium D Panthothenate-8.0g; Vit. K3-1.0g; Vit. E - 8.0g; folic acid-800mg.**Trace minerals premix provided (mg/kg diet) - Manganese- 80; Iron- 80; Copper-11.24; Zinc- 50; Iodine-8
Parameters studied
Samples of feed were analyzed for proximate compositionusing standard procedures of the AOAC (1995) and forestimation of Calcium and phosphorous content methodgiven by Talapatra et al. (1940).
Carcass yield were measured using 2 birds in eachreplicates at 8th weeks of age. Birds used for carcassyield study were fasted for 12 hours and then wereslaughtered using standard procedure.
Statistical analysis
The data obtained during experiment were analyzedstatically by using the methods described by Snedecorand Cochran (1989). Differences among the treatmentswere tested for significance by Duncan's New MultipleRange Test (1955).
274
Results and discussion
Effect of use of RP without and with aluminium sulphateon carcass yields (dressed, eviscerated and drawnweights) of egg type starters (0- 8 weeks) is presented inTable 2. Dietary treatments had significant (P<0.05)influence on the dressed, eviscerated and drawn weightsof starters.
The treatment means of dressed, eviscerated anddrawn weights indicated that increase in the level of RPinstead of DCP in the MM reduced the dressed,eviscerated and drawn weights of starters. Among RPdiets, maximum and significantly (P<0.05) higher dressed,eviscerated and drawn weights was observed in startersassigned T2 (40% RP) diet. Afterwards, addition of 60%,80% levels of RP instead of DCP decreased their dressed,eviscerated and drawn weights significantly (P<0.05).However, statistically (P<0.05) they were comparable.Further, complete replacement of RP instead of DCPreduced their dressed, eviscerated and drawn weightssignificantly (P<0.05). Minimum and significantly (P<0.05)lower dressed, eviscerated and drawn weights wasobserved in starters assigned T8 diet (Table 2).
Table 2.Carcass yields (% of live weight) in starters fed mineral mixture containing RP without and with aluminiumsulphate (0-8 weeks)
The carcass yield and processing losses in 8weeks birds were not influenced significantly (P> 0.05)when RP was used at 40% level instead of DCP but useof higher levels of RP (80% and 100%) tend to reduce thecarcass yields. These finding were in accordance withthat of Abdelhamid (1999) who reported that increase levelsof fluorine (0 to 3125 ppm) resulted in decrease relativeweights of pituitary, adrenal, heart, spleen, lungs, kidney,gizzard, and changes in intestinal dimensions.
Use of RP up to 80% level (972 ppm F) along withaluminium sulphate produced carcass yields comparableto control (DCP) but when it was added completely instead
of DCP led to reduction the carcass yield (Table 2). Itwas attributed to more processing losses.
Supplementation of aluminium sulphate with 60%,80% and 100% levels of RP instead of DCP (Table 2)increased dressed, eviscerated and drawn weights ofstarters significantly (P<0.05). Probably reduction influorine content due to supplementation of aluminiumsulphate diverted more amounts of nutrients for proteinsynthesis resulting in to better carcass yield and lessprocessing losses (Hahn and Guenter 1986).
Hence it was concluded that use of 40% RPinstead of DCP and use of 80% RP along with aluminiumsulphate instead of DCP in mineral mixture of starting (0-8 weeks) egg type chickens was responsible for bettercarcass yield.
AOAC (1995) Official Methods of Analysis, 16th ed.Association of Official Analytical Chemist'sWashington DC
Abdelhamid J, Sohail S S, Ronald D A (1999) Influence ofsupplemental phytase on performance of broilers.Poult Sci 78:550-555
Duncan D B (1955) Multiple range and multiple F tests.Biometrics 11: 1-42
Hahn P H B, Guenter W (1986) Effect of dietary fluoride andaluminium on laying hen performance and fluorideconcentration in blood soft tissue, bone and egg.Poult Sci 65: 1343-1349
ICAR (1998) Nutrient Requirements of Livestock and Poultry,ICAR Publication New Delhi India
Snedecor G W, Cochran W G (1989) Statistical methods. 7thed. Oxford and IBH Publishing Company New DelhiIndia
Talapatra S K, Roy S C, Sen K C (1940) The analysis ofmineral constituents in biological materials. IndianJ Vet Sci 10: 243-258