Research and Operational Application of TRMM-Based, Fine Time Scale Precipitation Analyses R.F. Adler 1 , G.J. Huffman 1,2 , D.T. Bolvin 1,2 , S. Curtis 3 , G. Gu 1,4 , E.J. Nelkin 1,2 1: NASA/GSFC Laboratory for Atmospheres 2: Science Systems and Applications, Inc. 3: East Carolina University 4: UMBC Goddard Earth Sciences and Technology Center Outline 1. TRMM Status 2. The MPA 3. Examples 4. Planned Enhancements
Transcript
Research and Operational Application of TRMM-Based, Fine Time Scale Precipitation Analyses
R.F. Adler1, G.J. Huffman1,2, D.T. Bolvin1,2, S. Curtis3, G. Gu1,4, E.J. Nelkin1,2
1: NASA/GSFC Laboratory for Atmospheres2: Science Systems and Applications, Inc.3: East Carolina University4: UMBC Goddard Earth Sciences and Technology Center
Outline
1. TRMM Status
2. The MPA
3. Examples
4. Planned Enhancements
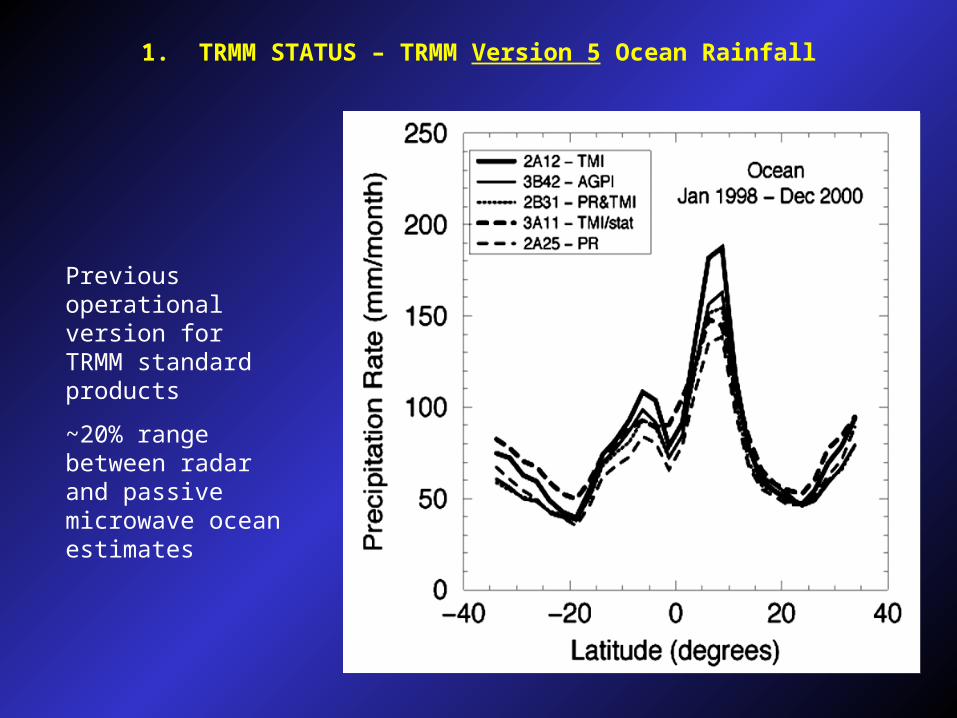
1. TRMM STATUS – TRMM Version 5 Ocean Rainfall
Previous operational version for TRMM standard products
~20% range between radar and passive microwave ocean estimates
1. TRMM STATUS – TRMM Version 6 Ocean Rainfall Test Results (Not Final Versions)
~5% range between radar and passive microwave ocean estimates
Processing/reprocessing for Version 6 began in May 2004
May 1998
August 1998
1. TRMM STATUS – Future Operations
TRMM has evolved from an experimental mission into the core satellite for a constellation preceding and evolving into GPM.
PR, TMI, VIRS, LIS all working nominally; spacecraft systems in excellent shape.
In Spring 2004 NASA decided to end TRMM; however, outcry from science community resulted in continuation until end of 2004 and review by National Academy of Science (8-10 Nov.).
National Academy will recommend TRMM future based on value of data for science and operational forecasting for
1) TRMM ops. through 2005, with a controlled re-entry using134 kg of fuel; or
2) use of all 134 kg of fuel for science operation, which would extend potential mission life to ~2011; overlap with GPM possible (GPM launch in 2010).
Flight operations cost for TRMM: $4M/yr (full cost).
NASA safety organization does not require TRMM controlled re-entry.
2. THE MULTI-SATELLITE PRECIPITATION ANALYSIS (MPA)
TRMM by itself yields sparse coverage:TRMM PR (red)
+ TRMM TMI (cyan)
Long-term microwave record covers
~40% of 20°N-S in 3 hr: + SSM/I (3 sat.; yellow)
New microwave satellites raise + AMSR-E (blue)coverage to ~80% of 20°N-S in 3 hr: + AMSU-B (3 sat.; green)
IR 50°N-S, missing at higher latitudes (black)
Instant-aneousSSM/ITRMMAMSRAMSU
30-day HQ coefficients
3-hourly merged HQ
Hourly IR Tb
Hourly HQ-calib IR precip
3-hourly multi-satellite (MS)
Monthly gauges
Monthly SG
Rescale 3-hourly MS to monthly SG
Rescaled 3-hourly MS
Calibrate High-Quality (HQ) Estimates to
“Best”
Merge HQ Estimates
Match IR and HQ, generate coeffs
Apply IR coefficients
Merge IR, merged HQ estimates
Compute monthly satellite-gauge
combination (SG)
30-day IR coefficients
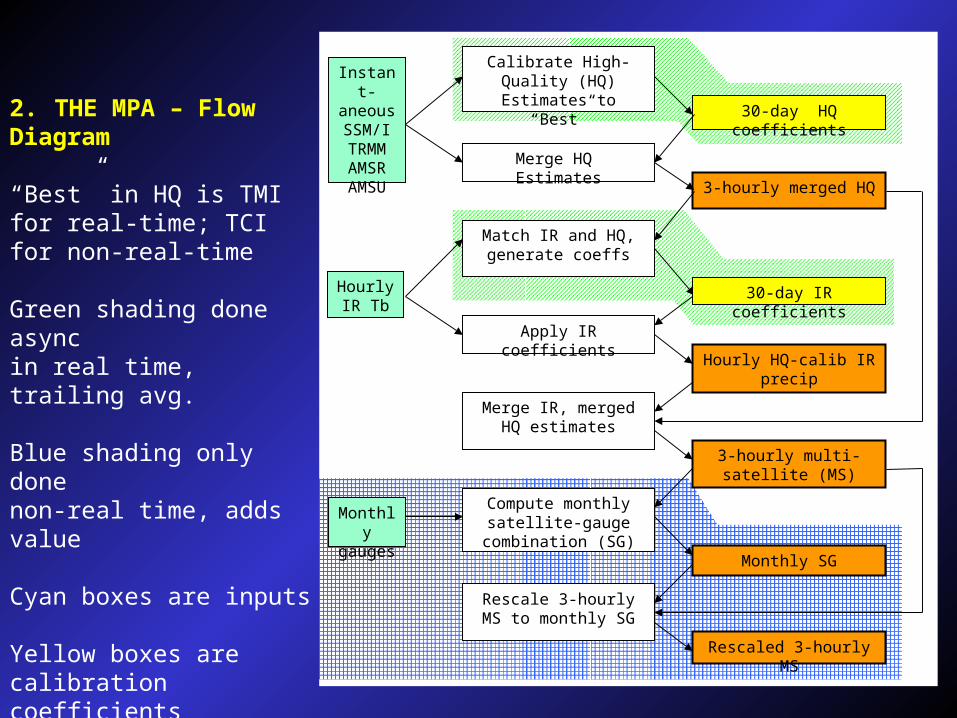
2. THE MPA – Flow Diagram
“Best” in HQ is TMI for real-time; TCI for non-real-time
Green shading done asyncin real time, trailing avg.
Blue shading only donenon-real time, adds value
Cyan boxes are inputs
Yellow boxes are calibration coefficients
Orange boxes are products
2. THE MPA – Detailed ExampleHurricane Isabel; microwave swaths in light grey
QuickTime™ and aAnimation decompressor
are needed to see this picture.
3. EXAMPLES – Accumulation from Tropical Storms Affecting the U.S. Mainland in 2004
Order of appearance: Alex, Bonnie, Charlie, Gaston, Frances, Ivan, Jeanne, Matthew
QuickTime™ and aAnimation decompressor
are needed to see this picture.
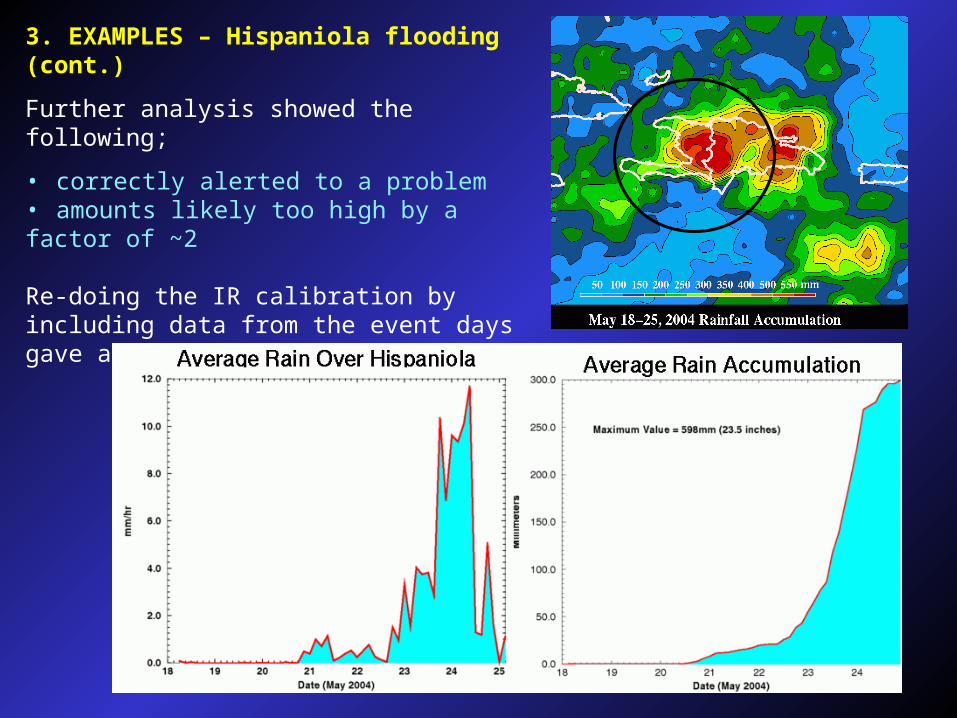
3. EXAMPLES – Near-real-time analysis of flooding event in Hispaniola, 22-25 May 2004
A minor low pressure tracked north, unleashing >450 mm of rain in south-central Hispaniola.
Kevin Laws (NOAA FEWS-Net) had reviewed the MPA-RT and CMORPH analyses by 12Z 26 May.
Hourly IR product
QuickTime™ and aVideo decompressor
are needed to see this picture.
3. EXAMPLES – Hispaniola flooding (cont.)
Further analysis showed the following;
• correctly alerted to a problem• amounts likely too high by a factor of ~2
Re-doing the IR calibration by including data from the event days gave a more reasonable answer.
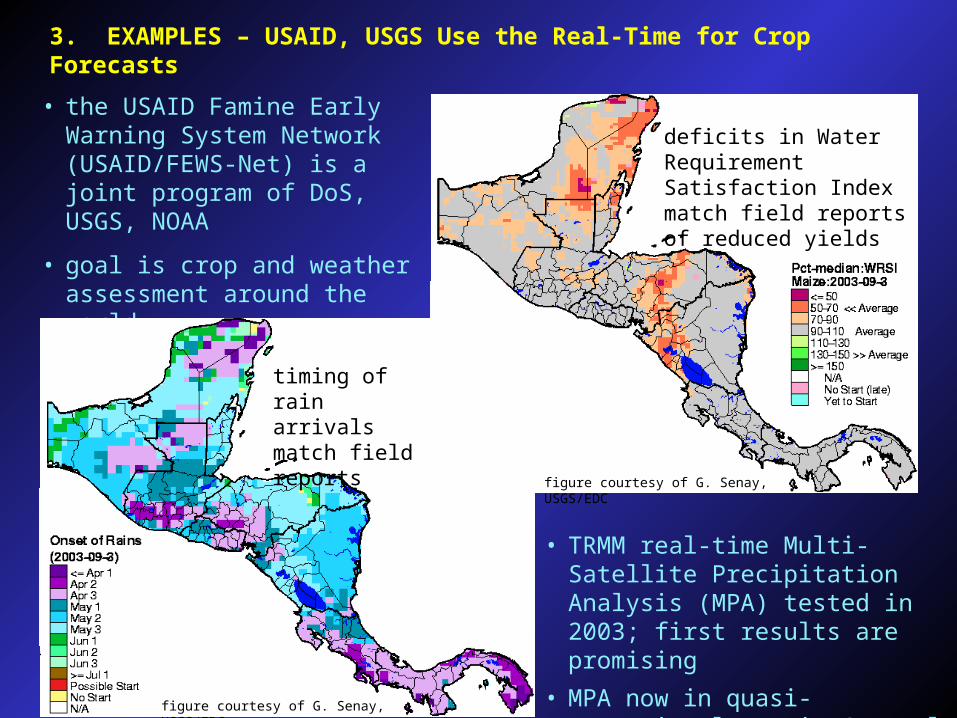
3. EXAMPLES – Potential-Flood Monitoring Product
• simple thresholds for 1-, 3-, 7-day accumulations
• oceans are masked out• focuses attention on potential
problems• updated on the Web daily
7-day
3-day
1-day
Typhoon Tokage
• snapshots from 22 October 2004
• flooding and mudslides in western Japan
• 67 deaths, 21 missing• >23,000 dwellings
destroyed
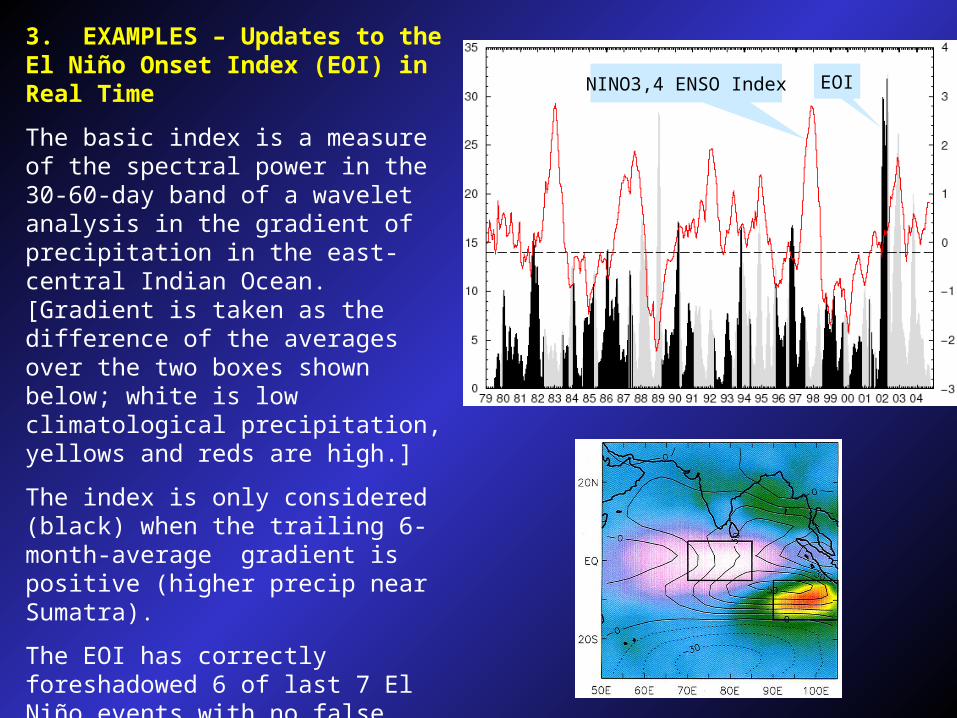
3. EXAMPLES – Updates to the El Niño Onset Index (EOI) in Real Time
The basic index is a measure of the spectral power in the 30-60-day band of a wavelet analysis in the gradient of precipitation in the east-central Indian Ocean. [Gradient is taken as the difference of the averages over the two boxes shown below; white is low climatological precipitation, yellows and reds are high.]
The index is only considered (black) when the trailing 6-month-average gradient is positive (higher precip near Sumatra).
The EOI has correctly foreshadowed 6 of last 7 El Niño events with no false alarms.
The EOI is computed with the MPA, then with the GPCP Satellite-Gauge combination when available.
NINO3,4 ENSO Index EOI
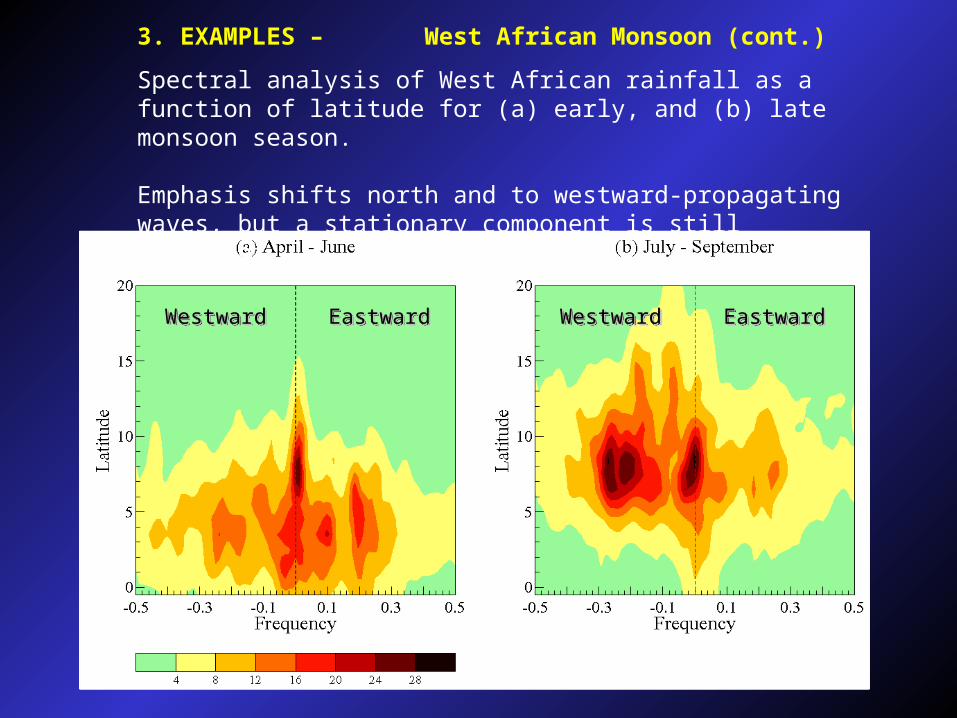
3. EXAMPLES – West African Monsoon
The seasonal cycle of precipitation is shown, with zonal winds at three levels for comparison.
Latitudinal values are averaged over 10°W-10°E for the years 1998-2003.


![[D.T] Digimon Adventure V-Tamer 01](https://static.documents.pub/doc/80x56/568befb01a28ab89338d0d26/dt-digimon-adventure-v-tamer-01.jpg)


![The Canton advocate (Canton, D.T. [S.D.]). (Canton, D.T. …chroniclingamerica.loc.gov/lccn/sn83025440/1878-01-16/… · · 2013-10-18AVhat calm Moods down the storm-swept way ...](https://static.documents.pub/doc/80x56/5aa075a27f8b9a7f178e1ab6/the-canton-advocate-canton-dt-sd-canton-dt-2013-10-18avhat-calm.jpg)


![The Canton advocate (Canton, D.T. [S.D.]). (Canton, D.T ...chroniclingamerica.loc.gov/lccn/sn83025440/1884-02-07/ed-1/seq-4.… · MM :^a XSG&g • TFGJNR -r DISTURBANCES AMONG THE](https://static.documents.pub/doc/80x56/5f55309c84dd444d522656d6/the-canton-advocate-canton-dt-sd-canton-dt-mm-a-xsgg-a.jpg)