over a group of bonded PHYs. One reason this is significant in the higher bitrate discussion is that it
was originally envisioned that the first client needing to be carried over OTN larger than 100G would
be 400 GbE, which is currently scheduled for completion at the end of 2017. Flex Ethernet may
provide >100G clients through the bonding of multiple 100G earlier than this [20]. Another relevant
OIF project is the Flex Coherent DWDM framework, which would ensure that the right components
are being specified to allow building of the kinds of interfaces that are emerging in OTN networks
(DSP-driven interfaces that can support different modulation formats with different effective
bitrates depending on reach) [21].
2.1.4 NREN Partner Experiments
PSNC
In June 2015 PSNC conducted 400G transmission tests in the PIONIER network. The tests were
prepared and run together with ADVA Optical Networking. The trial was conducted over the PIONIER
network, 385 km of fibre, reaching between two research and education centres in Poznań and
Increasing Utilisation of the Photonic Layer
Deliverable D13.1 Research and Study Network Technologies – White Paper Document Code: GN4-1-16-7D602 15
Warsaw. The system transported the data continuously for 14 hours without any block errors. The
test system used software-defined optics to deliver flexible data rates and modulation. This means
the network can intelligently scale from 200 Gb/s to 300 Gb/s to 400 Gb/s and from QPSK to 8QAM
to 16QAM as required. All configuration and modulation options were tested and evaluated by the
PSNC team.
The 400 Gb/s trial was conducted using the operational PIONIER network resources. PIONIER is a
consortium of Polish research and education organisations and its network is operated domestically
by PSNC. For the purpose of the trial, the system was configured with two 200 Gb/s wavelengths
operating at 16QAM within an optical super-channel with spectral width of 100 GHz. The system also
featured reconfigurable optical add/drop multiplexers (ROADMs) and hybrid amplifiers. During the
14 hours of testing, the trial showed an error-free transmission with optical-signal-to-noise ratios of
approximately 20 dB.
During the 400G tests, results were presented live at the TERENA 2015 conference. Following the
tests, PSNC has established and configured an operational 400G link between the Poznań and
Warsaw nodes. PSNC has also established a second 400G link that is used for its own work and
projects.
CESNET
CESNET tested and worked with the ECI Apollo platform and Czech Light® Open DWDM together [22].
The ECI Apollo system has excellent features and is very compact, which makes testing easier. During
the trial, CESNET pushed both Apollo and Czech Light® Open DWDM to their limits by proving that
200 Gb/s DP-16QAM signals can reach further than 2,000 km over the standard single-mode fibre
G.652. CESNET and ECI experts also successfully demonstrated alien wavelengths capabilities, which
are gaining momentum, not only for NRENs but also in the global telco world.
It should be mentioned that 400G systems are almost exclusively 2x200G, with 200G transmitted
over one DWDM channel with DP-16QAM. True 400G signals using DP-64QAM were not available in
2015 (when the CESNET testing took place) and it looks as though almost all vendors went from
100G with DP-QPSK (also known as DP4QAM) to 200G with DP-16QAM, with 400G being considered
as the next step for really huge data-demanding applications.
CESNET and ECI also tested transmission over a cascade of narrow DWDM filters, with 200G DP-
16QAM signals able to be transported over 8 narrow DWDM multiplexers.
The last important point to note is the mixed scenario whereby “slow” and amplitude-modulated
signals such as 10G and 10G Ethernet were tested together with phase-modulated coherent 100G
and 200G signals. Again, results were very satisfactory and both encouraging and promising for
mutual transmission of high-speed coherent phase-modulated signals and really slow amplitude-
modulated signals (i.e. less than 1 Gb/s), which are used by new applications such as accurate time
transfer or remote sensing. As far as CESNET is aware, such experiments with real equipment are
rather rare.
The main results of the testing trial were:
Increasing Utilisation of the Photonic Layer
Deliverable D13.1 Research and Study Network Technologies – White Paper Document Code: GN4-1-16-7D602 16
The successful extension of all-optical reach to 2,000 km with single-channel 200G DP-
16QAM.
High bitrate traffic can be easily transported as alien wavelengths over CESNET’s production
network.
200 Gb/s signals can be transmitted over 240 km in a single hop, without the challenging,
and potentially hazardous, Raman amplification.
New ways of compensation for chromatic dispersion in dark fibre lines with mixed coherent
and legacy amplitude-modulated signals.
2.1.5 Conclusions
A number of new formats and modulations currently offer the ability to increase the capacity of the
fibre. This has now evolved to the client side, and the simplest, and thus most cost-effective, form of
it at this stage is PAM-4. It uses four-level amplitude detection to double the transmission capacity,
but at the expense of lower signal-to-noise (SNR) performance when compared to NRZ, currently the
main client-side high-order modulation format.
With regard to increasing capacity by delivering more modes per core and more cores per fibre, the
SDM technologies of FMF and MCF are promising, but not without problems. FMF usually support up
to 15 modes, but this is limited to 6 because of constraints imposed by the available few-mode
amplifiers. MCF with up to 30 cores are available, but again, matching amplification techniques are
difficult to find, and splicing and connecting such fibres are much more challenging. Few-mode
techniques can be combined with multi-core fibres to achieve even higher spatial channel counts.
However, it is debateable whether SDM is currently relevant to NRENs, whose needs today can be
met by traditional 100 Gb/s and 200 Gb/s systems.
In respect of broader spectrum utilisation, existing technologies can lower the manufacturing costs
for the new type of equipment and can significantly improve the available bandwidth for the optical
transmission system. The most promising aspect is to use technologies and manufacturing
techniques for photonic systems that heavily use experience from the silicon industry.
Important progress in high-bitrate standardisation is being delivered by three standardisation bodies.
Within the IEEE-SA, which focuses on LAN and Ethernet protocols development, the IEEE 802.3
Working Group has several efforts underway concerning specification of Ethernet operating at rates
of 25 Gb/s, 50 Gb/s, (next gen) 100 Gb/s, 200 Gb/s, and 400 Gb/s. ITU-T is more involved in OTN
network protocols, and work is underway on B100G, where, in general, the modulation format used
and the effective bitrate per wavelength vary according to reach. Another principle of the B100G
work is that new transport containers are defined that are distributed to multiple wavelengths or
sub-carriers. A modular frame format is being worked on that can be used to describe containers
such as the current ODUk in increments of 100G.
GÉANT partners PSNC and CESNET have conducted successful 400G transmission experiments. The
PSNC test system used software-defined optics to deliver flexible data rates and modulation. This
means the network can intelligently scale from 200 Gb/s to 300 Gb/s to 400 Gb/s and from QPSK to
8QAM to 16QAM as required. All configuration and modulation options were tested. Following the
tests, PSNC has established and configured two operational 400G links. The CESNET test
demonstrated the successful extension of all-optical reach to 2,000 km; that high-bitrate traffic can
Increasing Utilisation of the Photonic Layer
Deliverable D13.1 Research and Study Network Technologies – White Paper Document Code: GN4-1-16-7D602 17
be easily transported as alien wavelengths over CESNET’s production network; that 200 Gb/s signals
can be transmitted over 240 km in a single hop, without Raman amplification; and new ways of
compensation for chromatic dispersion in dark fibre lines with mixed coherent and legacy
amplitude-modulated signals.
2.2 Flexible Optical Networks
While Section 2.1 addressed technologies and concepts for increasing the available bandwidth, in
this section the focus is on the flexible use of the available capacity using flexible optical networks
(FON). First, Section 2.2.1 presents a review of the results obtained by the GN3plus Open Call project
REACTION, which evaluated FON. This is continued by a survey of the latest FON developments in
Section 2.2.2 and experimental research in Section 2.2.3. Finally, Section 2.2.4 reports on some
available implementations at commercial vendors.
2.2.1 Results of GN3plus REACTION
The GN3plus Open Call project Research and Experimental Assessment of Control plane
archiTectures for In-Operation flexgrid Network re-optimisation (REACTION) [23] designed a flexible
optical network scenario enabling software-controlled super-channel transmission. Innovations were
introduced in the context of data plane, control plane, and routing and spectrum allocation
strategies.
Bandwidth Variable Transponders
Before reviewing the results of the REACTION project, it is useful to discuss one of the key building
blocks in flexible optical networks, namely, bandwidth variable transponders (BVT). BVT have been
recently deployed in vendor multi-rate transponders. BVT make it possible to tune a certain set of
transponder functions in a point-to-point connection (one flow and one destination). A further
development of BVT has led to sliceable bandwidth variable transponders (S-BVT), which are not
commercially available yet. S-BVT provide the ability to allocate a certain amount of capacity on one
or several independent flows and transfer the flows to multiple destinations. The S-BVT also make it
possible to select from among different modulation formats, forward error correction (FEC) types,
baud rates and optical spectrum occupancy (12.5 GHz granularity, flexi-grid). Enabling flexi-grid and
super-channel features in S-BVT requires that all nodes along the link path support flexi-grid
functionalities, but the other variables in S-BVT could be implemented in a fixed-grid network
environment.
Increasing Utilisation of the Photonic Layer
Deliverable D13.1 Research and Study Network Technologies – White Paper Document Code: GN4-1-16-7D602 18
Figure 2.4: Transponder evolution path
Results
Data Plane
From a data plane architectural perspective, the REACTION project enhanced a bandwidth variable
transponder supporting 1 Tb/s multi-carrier transmission to support, in addition to dynamic
adaptation of transmission parameters, the sliceable functionality. Specifically, such sliceable BVT
are capable of creating multiple optical flow units (i.e. sub-carriers) that can be aggregated or
independently routed according to the traffic requirements.
The use of sliceability during provisioning and restoration in flexible grid optical networks was
addressed. Specifically, a scheme was proposed to exploit the possibility of establishing/recovering
an optical connection as a single super-channel or as a number of independent sub-carriers. Both
centralised and distributed implementations of the proposed schemes were evaluated through
simulations in a GMPLS-based scenario.
Results showed that, despite the introduced spectrum overbuild, the utilisation of sliceability
permits the amount of established/recovered traffic to increase.
Control Plane
From the control plane perspective, the REACTION project developed a solution relying on a GMPLS-
based distributed control plane with a path computation element (PCE) architecture. Specifically, a
novel PCE architecture was investigated. The architecture relies on an active stateful front-end PCE,
in charge of routing and spectrum allocation (RSA) computations and a back-end PCE in charge of
performing complex network re-optimisation solutions. The PCE architecture also relies on the
northbound distribution of link-state (LS) and traffic-engineering (TE) information through border
gateway protocol (BGP) (i.e. BGP-LS), utilised to provide the PCE architecture (also in the context of a
hierarchical implementation for multi-domain scenarios) with adequate networking information.
Routing and Spectrum Allocation
Novel routing and spectrum allocation (RSA) algorithms were designed and evaluated in the context
of flexible optical networks and, specifically, to be encompassed within the proposed PCE
architecture.
S-BVT capabilities were evaluated in the context of restoration and for in-operation network
planning operations:
Fixed rate &
Fixed parameters
Fixed rates but tunable
parameters (FEC, Modulation ...)
BVT S-BVT
Increasing Utilisation of the Photonic Layer
Deliverable D13.1 Research and Study Network Technologies – White Paper Document Code: GN4-1-16-7D602 19
Restoration: multi-path recovery and bitrate squeezing were applied to maximise the
amount of restored bitrate, also exploiting limited portions of spectrum resources along
multiple routes. A software-defined network (SDN) architecture was introduced to
adequately support the S-BVT configuration. The SDN architecture was applied to
experimentally assess that the overall re-configuration time upon failure detection was
concluded within two seconds, largely dominated by the proprietary control of optical nodes.
In-operation network planning operations were considered. To increase traffic restorability
in flexi-grid networks, a multi-path after-failure repair optimisation (MP-AFRO) algorithm was
applied to reduce the sub-connections count by aggregating those belonging to the same
original connection and rerouting the resulting connection to release spectral resources. A
heuristic algorithm was deployed inside an in-operation planning tool in the form of back-
end PCE (bPCE) inside the application-based network operations (ABNO) architecture
controlling a network. The bPCE was connected to the centralised active stateful PCE.
Additionally, the benefits of flexi-grid were evaluated in the context of the UNINETT NREN network.
The expected evolution of the NREN traffic matrix was assumed to evaluate the benefits provided by
the adoption of high-rate transmission systems with and without the flexi-grid technology. Results
showed that fibre exhaustion will occur after around seven years from now, further postponed in
the case of flexi-grid networks [1].
2.2.2 Recent Developments on FON
Flexible optical networks maximise spectral efficiency through use of super-channels on a flexible
channel grid. Super-channels receive a negative penalty through non-linear interactions of closely
spaced sub-carriers and pass-band narrowing in network ROADMs. Numerical analyses have been
carried out to evaluate super-channel optimisation to maximise product of spectral efficiency and
optical reach [24]. Non-linear interactions are minimised by sub-carrier power optimisation where
edge sub-carriers have smaller launch power (see Figure 2.4). The pass-band narrowing penalty is
optimised by introducing a guard band around every super-channel. The best performance in terms
of product of spectral efficiency and optical reach is achieved for a super-channel guard band of
6 GHz (although 12.5 GHz tends to be the minimal granularity). Sub-channels within a super-channel
may be Nyquist-shaped by an optical inverse-Gaussian filter of order 2 to improve the sub-channels’
bandwidth utilisation. Such optimised super-channels will benefit from the minimal frequency
granularity of filtering elements of 3.125 GHz that are already available on the market [25].
Figure 2.5: Optimum sub-carriers launch power for 1 Tb/s 5-SC-DP-16-QAM and 400 Gb/s 4SC-DP-QPSK super-
channels for sub-carrier power pre-emphasis (SCPP) method
Although many vendors offer turn-key network solutions for backbone networks, there is increasing
need for vendor interoperability for network subsystems, or even elements, in order to reduce
Increasing Utilisation of the Photonic Layer
Deliverable D13.1 Research and Study Network Technologies – White Paper Document Code: GN4-1-16-7D602 20
overall cost. For the future flexible optical network, an important requirement is a common network
management platform with an identical access to all network elements, independently of their origin.
On top of it, flexible planning tools are proposed to fully optimise resource use in the network [26].
New network management systems are therefore needed sooner than new optical fibres. Available
capacity of the current fibre footprint is expected to last till the end of the next decade [27].
2.2.3 Transponder Interoperability
Currently, most system integrators are about to develop transceivers beyond 100 Gb/s. Although
“black link” (BL) standardisation at 100 Gb/s is not yet fully accomplished, now is the right time to
begin thinking about and investigating how to realise BL interoperability at even higher channel
speeds.
NREN networks often consist of equipment purchased from different system vendors.
Interconnection of terminals (e.g. routers and switches) with a dense-wavelength-division-
multiplexing (DWDM)-based optical network has traditionally been realised through the deployment
of transponders with an intrinsic demarcation between the transport network and the client layer.
This interconnection can also be achieved by removing one grey short-reach transmitter (TX) and
receiver (RX) pair per channel (eliminating the transponders and substituting them with so-called
coloured interfaces in the packet machines) with associated cost savings. This configuration is known
as the BL approach, and related multi-vendor interoperable specifications are already part of the
ITU-T’s Recommendations G.698.1 and G.698.2 for DWDM links with and without optical line
amplifiers, respectively. This configuration is often referred to as an “alien wavelength” concept
when the DWDM TX and the DWDM RX are provided by the same vendor A. The alien wave concept
is discussed in more detail in Section 3.
The DWDM link consists of fibres and optical network elements – e.g. optical (de)multiplexers,
amplifiers, and (reconfigurable) optical add/drop multiplexers [(R)OADMs] – and is considered as
“black” if the design details are proprietary to the BL designer. However, the overall worst-case BL
transfer characteristics must be specified, e.g. minimum/maximum accumulated dispersion,
maximum differential group delay, and maximum optical signal-to-noise ratio (OSNR) path penalty.
In the in-force version of G.698.2 [28], application codes for non-return-to-zero modulated signals
with channel data rates up to a nominal 10.71 Gb/s have been standardised. Currently, ITU-T’s
G.698.2 BL work focuses on 100 Gb/s polarisation-multiplexed quadrature phase shift keying (PM-
QPSK) modulated signals. This modulation format requires clear definitions and specification
methodologies for parameters not present in existing optical interface standards, such as error
vector magnitude (EVM) or spectral excursion.
In the case of a single carrier communication, the following main transmission parameters have to
be considered (see [29]):
Modulation format. Multiple types of modulation formats may be supported, enabled by the
use of a digital to analog converter at the transmitter. Possible formats include binary PSK
(BPSK), QPSK, m-quadrature amplitude modulation (QAM), etc.
Sampling rate and analog bandwidth. To achieve interoperability, minimum hardware
requirements in terms of sampling rate, ADC resolution, and analog bandwidth have to be
guaranteed.
Increasing Utilisation of the Photonic Layer
Deliverable D13.1 Research and Study Network Technologies – White Paper Document Code: GN4-1-16-7D602 21
DSP algorithms. DSP may require standardisation in the case of data-aided algorithms
because the training sequences need to be agreed upon between the TX and RX. On the
other hand, if blind DSP algorithms are employed, less standardisation effort is expected.
Optical layer parameters. To achieve interoperability, optical parameters have to be defined
within a strict range of working conditions. The range of output power values at the
transmitter (i.e. launch power) and receiver (i.e. maximum values of the overall and per-
channel received optical power and input power sensitivity) require dedicated
standardisation.
Frequency slot. The supported wavelength tunability range, slot-width granularity, and the
actual nominal central frequency have to be specified, together with the possible required
optical cross connections and their filter characteristics. In addition to TX and RX, this
information has to be provided to intermediate switching nodes.
In addition to these per-carrier parameters, the following information has to be considered in super-
channel connections consisting of multiple sub-carriers:
Number of sub-carriers. The number of supported sub-carriers has to be specified (e.g. eight
or four sub-carriers in the case of a 1 Tb/s channel).
Sub-carrier spacing. Sub-carrier spacing should be compliant with flexible grid specifications
(e.g. the granularity of 6.25 GHz).
The interoperability of two S-BVT implementations has been recently demonstrated on a pan-
European multi-domain multi-vendor elastic optical network (EON) testbed [30] within the IDEALIST
project [31]. Two S-BVT implementations from the Inter-University National Consortium for
Telecommunications (CNIT)/Ericsson and Coriant, with hard-decision (HD) and soft-decision (SD)
FECs, were evaluated. The control architecture was able to configure the S-BVTs so the multi-vendor
transmission reach is failure-free up to 300 km with current FEC standards. The testbed, illustrated in
Figure 2.6, consisted of data and control planes.
64 GSa/s(13 GHz)
DAC Board
LASER (even)
LASER (odd)
DSPTX
[dB
]
Wavelength [nm]
Optical Front-
end
50GSa/sSampling
scope(20GHz)
DSPRX
DSPRX
DWDM link
Controller Controller
Flex-grid WSS
Munich (Germany)Pisa (Italy)
Figure 2.6: Multi-partner pan-European testbed
The data plane setup consists of flexi-grid nodes, based on configurable spectrum selective switches
(SSS), a CNIT/Ericsson DSP unit at the Tx and two different ones (CNIT/Ericsson and Coriant) at the Rx
as part of an optical coherent testbed. The Tx is able to provide a super-channel with different
configurable numbers of carriers and capacity (i.e. 1 carrier for 100 Gb/s, 3 carriers for 400 Gb/s, and
Increasing Utilisation of the Photonic Layer
Deliverable D13.1 Research and Study Network Technologies – White Paper Document Code: GN4-1-16-7D602 22
7 carriers for 1 Tb/s). At 1 Tb/s, PM-16QAM Nyquist-shaped signals shaped by a roll-off = 0.05 and
symbol rate = 23 GBd were adopted.
The control plane is performed via controllers located at each physical node of the network.
Controllers are connected with the data plane testbed (i.e., SSS, Tx and Rx) by means of USB, serial
and GPIB interfaces. Controllers are able to automatically configure SSS (i.e. filter shape as the
reserved frequency slot), transponders parameters (i.e. symbol rate, number of carriers, sub-carrier
central frequencies) and DSP parameters (i.e. modulation format, FEC). Multi-vendor interoperability
between CNIT/Ericsson and Coriant DSPs was achieved by the exchange of novel application code
(AC) and transponder class (TC) attributes, in line with ITU recommendations [28].
Figure 2.7 reports the transmission performance of the single-vendor (CNITTX CNITRX - SV) and
cross-vendor (CNITTX CORRX - CV), where COR stands for Coriant. In both cases, blind-DSP
algorithms [32] were used because an interoperability scenario would not allow the usage of
algorithms that require knowledge of the link [33] or of training sequences [34].
Figure 2.7: BER performance
If the cross-vendor (CV) solution is selected, only already standardised FEC can be used. For example,
the ITU standard G975.1 hard-decision super-FECstd (HD-FECstd) with 20% overhead could use a pre-
FEC BER threshold = 1×10⁻². This value could increase, if new SD-FEC become standard, up to a
reasonable pre-FEC BER threshold = 2×10⁻². Based on the pre-FEC thresholds, the following
conclusions can be drawn concerning the experiment carried out by employing the testbed depicted
in Figure 2.6. If the usage of already standardised HD-FECstd is assumed, transmission up to ~750 km
in the case of SV transmission is guaranteed. This halves in cross-vendor mode. Although the system
performance has been significantly reduced, such a scenario would still guarantee error-free
transmission, with CV transmission, over the majority of European links. Moreover, if a standardised
FEC (SD-FECstd) could be adopted, the reach would approach 1,100 km for SV transmission, and ~600
km for CV transmission. Finally, in the case of proprietary FEC, the transmission distances would be
~1,800 km [35], and once again about half for CV transmission. These values are summarised in
Table 2.2.
Increasing Utilisation of the Photonic Layer
Deliverable D13.1 Research and Study Network Technologies – White Paper Document Code: GN4-1-16-7D602 23
Reach [km]
Case HD-FECstd SD-FECstd SD-FECth
SV 750 1100 1800
CV 300 600 900
Table 2.2: Performance results
In addition to the results of the conducted experiment, Figure 2.7 also displays the results obtained
within a second experiment that has been reported in [29; 32]. In this previous analysis, the vendor
configuration was mirrored by having (CORTX CORRX - SV) and cross-vendor (CORTX CNITRX - CV).
In [29; 35] the channel configuration was slightly different (32 GBd and 38 GHz channel spacing). The
performance of this experiment is reported by the curves with filled markers in Figure 2.7 and in this
comparison, it is clearly visible that the two single-vendor scenarios and two cross-vendor-ones,
between them, achieve similar performance. From a DSP perspective, the degraded performance of
CV could be associated to the lack of knowledge of the system, such as for example Tx / Rx I/Q skew
compensation. The CV transmission, with standard HD-FEC, can reach ~300 km, and therefore if
longer distances are needed, a solution concerning standardisation on SD-FEC must be agreed within
the ITU panels.
2.2.4 FON Vendor Available Implementations
In order to meet the future capacity demand on optical networks and to gain more capacity and
network efficiency, introducing flexibility into the network is the most cost-efficient strategy to
choose [1; 31]. Taking a longer perspective, to enable 1 Tb/s client signals in transport networks the
only cost-efficient option is to migrate the fixed network to a flexible optical network.
In today’s commercially available flexi-rate transponders (BVT), a subset of the functionalities
mentioned in Section 2.2.1 are available. JRA1 T1 conducted a vendor survey during the GN4-1
project to identify the functionalities currently available and those coming in a two-year term. There
are a variety of solutions and implementations, but a subset of common functionalities could be
found in more or less all vendor implementations. Table 2.3 shows these subsets.
Table 2.3: Tunable parameters in today’s vendors’ multi-rate transponder implementations
FEC type Modulation format
Spectral occupancy Line rate Number of carriers
Baud rate
G-FEC
HG-FEC
SD-FEC
E-FEC
U-FEC
BP-BPSK
BP-QPSK
BP-8QAM
BP-16QAM
37.5 GHz up to 200 GHz with 12.5G Hz granularity
50G
100G
200G
400G
1–2 25 Gbaud – 32 Gbaud
Increasing Utilisation of the Photonic Layer
Deliverable D13.1 Research and Study Network Technologies – White Paper Document Code: GN4-1-16-7D602 24
Not all of these parameters are supported by all vendors. There are some minor differences
between them. Modulation format and FEC are the most basic common building blocks in already-
existing multi-rate transponders. Spectral occupancy and Baud rate, on the other hand, have been
implemented slightly differently from vendor to vendor. Regarding spectral occupancy, both
transponders with limited spectral tuning flexibility and transponders that give the ability to tune the
granularity by 0.5 GHz can be seen.
The advantage of flexi-rate transponders is that they give the network operators the ability to tune
the transponder parameters in order to support a certain service with the highest network
utilisation rate. For example, if operators want to deliver a 400G service over a short distance, the
most optimised way to deliver the service is to choose the highest possible modulation format, with
SD-FEC in order to minimise spectral occupancy usage.
Forward Error Correction
Different FEC types add some overhead to the transmission channel. The amount of overhead can
vary from 7% to more than 20%. More overhead means more coding gain. The FEC types used in
transponders are usually vendor proprietary and this means that it is not possible to run
transponders from different vendors with each other. The exceptions are G-FEC and high-gain (HG)
multi-vendor FEC.
2.2.5 Conclusions
With regard to enabling effective, optimal use of the availability capacity through flexible optical
networks (FON), the GN3plus Open Call project REACTION introduced significant innovations in the
context of data plane (support for sliceability), control plane (novel PCE architecture), and routing
and spectrum allocation strategies (novel RSA algorithms). In each case, results confirmed the
capacity-utilisation benefits of a flexible network over a fixed network, including postponing fibre
exhaustion. Developments since REACTION have further enhanced FON’s ability to maximise
spectral efficiency and reach by minimising the negative penalties to which super-channels are
susceptible, namely interactions of closely spaced sub-carriers and pass-band narrowing in network
ROADMs. For the future, there is increasing need for vendor interoperability for network subsystems,
or even elements, and hence for a common network management platform that permits identical
type of access to all network elements, independently of their origin, together with flexible planning
tools to fully optimise resource use in the network.
The interoperability of two S-BVT implementations has been recently demonstrated on a pan-
European multi-domain multi-vendor elastic optical network (EON) testbed within the IDEALIST
project. Experiments proved the need for a new soft-decision FEC standard which would significantly
increase reach in single- and cross-vendor transmission.
A survey of BVT vendors showed a subset of common functionalities, though with implementations
– particularly of spectral occupancy and Baud rate – varying from vendor to vendor.
Deliverable D13.1 Research and Study Network Technologies – White Paper Document Code: GN4-1-16-7D602
25
3 Spectral Sharing and Alien Waves
In Section 2 the physical media and the enabling technologies for increasing the capacity were
addressed. A special type of spectrum utilisation is the alien wave (or alien wavelength) and alien
spectrum, where the spectrum is opened and waves from other equipment and/or entities are
injected into a system. This section deals with these types of networks and the focus is on the
further development of a modelling tool for estimating the viability of alien waves as well as
reporting on experiments with alien waves for, among other purposes, validating the modelling tool.
Hence, Section 3.1 provides an overview of the advantages of alien waves and shared spectrum, and
it forms the basis for the rest of the section. In Section 3.2 the multi-domain optical modelling tool
(MOMoT) is described, with the latest extensions, followed in Section 3.3 by a report on best
practices with alien waves and, in particular, the deployment of an alien wave-based optical
transport layer. Section 3.4 describes experimental scenarios and results to validate the estimations
provided by the MOMoT modelling tool.
3.1 Advantages of Alien Waves and Shared Spectrum
Alien waves (AW) are wavelengths that are unknown to the network domain and that share the
spectrum with native wavelengths. Spectral sharing is another term used for alien wavelengths. The
topic has been discussed within the NREN community for a number of years and is now finally
gaining momentum as AWs are deployed more and more throughout the NREN networks.
As research is increasingly becoming a global effort, research networks equally need to become
more dynamic and flexible by extending their resources and capabilities beyond single countries,
regions or domains. To accommodate future research projects and global partnerships, research
networks can be developed in a more open and federated way. Instead of creating new multi-
domain services in the traditional “cross border” type of manner, where information is typically
exchanged at the bare minimum information level (e.g. back-to-back information exchange on a
black-and-white interface), research networks can tear down the boundaries by looking at what the
available resources are, and by opening up access to these resources (e.g. by the exchange of
information on OTN level or access to spectrum in another network).
One way of doing this for the individual research networks could be by opening up access to the
DWDM spectrum and thereby offering a means of utilising foreign infrastructure. An example is alien
wavelengths, in which resources from a carrier network are being utilised to transport optical
channels, not controllable by the carrier.
Spectral Sharing and Alien Waves
Deliverable D13.1 Research and Study Network Technologies – White Paper Document Code: GN4-1-16-7D602 26
In the past there have been some studies and experiments on alien wavelength communication in
the research communities. In particular, JRA1 T1 participants SURFnet and NORDUnet have
partnered up to turn these experiments into real-life production services that are now being used
for stabilising and expanding their networks.
As SURFnet and NORDUnet’s partnership on developing alien wavelength services was established
some time ago, a lot of testing has been carried out in order to establish the reliability and integrity
of the optical signal interaction. Furthermore, planning and development effort was put into
defining the correct responsibilities, suitable procedures, and proper monitoring tools for putting the
services into production.
Although vendors traditionally take a more conservative view on sharing their network capabilities
(as it typically diminishes their revenues), there has been a tendency for the industry to open up to
the concept after all. Ciena’s DWDM platform (6500) has a setting for adding “Foreign” wavelength
channels and can even control its power along the system. Other vendors, such as Alcatel Lucent
(with their 1626LM platform) and ADVA (with their FSP 2000 / FSP 3000 systems) can also take in
alien wavelengths. Infinera also supports AW networking, but in a less scalable configuration.
The latest trend is that some of the vendors seem to be taking the concept even further, as will be
discussed in Sections 3.3.2 and 3.3.3.
3.2 Modelling Tool Development
In GN3plus, the Open Call project MOMoT [36] developed a multi-domain optical modelling tool
(MOMoT) to estimate and predict AW performance and assess the implications for existing traffic in
the network path. During GN4-1, the modelling tool has been further developed by JRA1 T1 and new
functions have been added. The following sub-sections introduce the modelling tool and the
extensions developed, provide guidelines on how to use the tool, and outline the basic principles,
capabilities and assumptions of its adopted models. The main advances compared with the version
of the MOMoT tool delivered by the GN3plus MOMoT Open Call project are also summarised.
3.2.1 Introduction to the Tool
The MOMoT tool enables users to input certain characteristic parameters, such as length from A to B,
wavelength, input power, bitrate, etc., and based on these the tool will estimate whether or not the
connection is likely to be successful and what the impact on existing services may be. The tool will
serve as a “back-of-the-envelope” calculation and evaluation of the feasibility to deploy an AW in a
given network scenario. Development of the tool has been done with speed and effectiveness in
mind, so instead of doing fully detailed and time-consuming multi-channel simulations, a safe-zone
approach has been applied. The tool makes a quick assessment of multi-channel effects, without a
deep simulation, and warns the user of any likely implications.
The modelling tool estimates the bit error rate (BER) of alien wavelengths in circuit-switched optical
networks with reference to the following modulation formats:
Spectral Sharing and Alien Waves
Deliverable D13.1 Research and Study Network Technologies – White Paper Document Code: GN4-1-16-7D602 27
On-off keying (OOK) with direct detection.
Polarisation multiplexing quadrature phase shift keying (PM-QPSK) with coherent detection.
Thus, typical bitrates to be considered can be 10 Gb/s and 100 Gb/s.
3.2.2 Guidelines on How to Use the Tool
The modelling tool is software (.exe) providing a user-friendly interface where link, native and alien
wavelength parameters can be set. Based on the provided input parameters, the software outputs
bit error rate estimation.
Operation of the Tool
The user can input various parameters, among others the bitrate of the alien wavelength, the
channel spacing, the modulation format and power levels. In combination with information on the
location of dispersion compensating fibre (DCF), the tool provides the following output:
Evaluated BER pre-FEC: in this field the estimated BER of the (alien) wavelength is reported.
Warning if the power of the alien wavelength exceeds the threshold of 2 dBm. This has been
introduced since the level of power may be too high and it may induce excessive cross-phase
modulation (XPM) on active wavelengths.
In the case of injecting a PM-QPSK alien wave into an OOK native network, output messages
will report the BER of the alien wave at varying guard band between the alien wave and a
native OOK.
Indeed, the BER of a PM-QPSK is strongly affected by the presence of OOK neighbours because of XPM. Thus, by spacing out PM-QPSK and OOK, the performance of the PM-QPSK improves. Guard band is defined as the number of free channels between a PM-QPSK and an OOK. Another kind of output message is reported if the performance is strongly affected by the PMD.
Spectral Sharing and Alien Waves
Deliverable D13.1 Research and Study Network Technologies – White Paper Document Code: GN4-1-16-7D602 28
Figure 3.1: Modelling tool interface and output messages including guard band information
3.2.3 Basic Principles, Capabilities and Assumptions of the Tool
The modelling tool is based on an analytical model for BER estimation detailed in Modeling and
Distributed Provisioning in 10–40–100-Gb/s Multirate Wavelength Switched Optical Networks [37].
Two models are adopted for the two different transmission techniques considered:
1. OOK with direct detection: e.g. suitable for 10 Gb/s.
2. PM-QPSK with coherent detection: e.g. suitable for 100 Gb/s.
The model aims at providing the estimated value of BER before forward error correction (pre-FEC
BER) for both the alien wavelength and the native lightpaths active in the network. The model and
the modelling tool are built based on assumptions described in [37], and summarised here:
Amplifier noise figure is assumed to be the same for all spans.
The following fibre parameters are the same for all spans and are not visible to the user:
effective area of 80 μm2, PMD parameter 0.1 ps/sqrt(km).
The digital signal processing (DSP) at the receiver, for PM-QPSK signals, can completely
compensate for linear impairments (i.e., both polarisation mode dispersion (PMD) and
chromatic dispersion (CD)).
Spectral Sharing and Alien Waves
Deliverable D13.1 Research and Study Network Technologies – White Paper Document Code: GN4-1-16-7D602 29
Four-wave mixing (FWM), stimulated Raman scattering (SRS) and stimulated Brillouin
scattering (SBS) are not explicitly included in the model. These can be considered as worst-
case margins (e.g. lower than 1 dB as optical signal-to-noise ratio (OSNR) penalty [37]). In any
case, the power levels typically used in telecom networks are low enough to consider these
effects as negligible.
Other effects such as ageing, filtering effects, etc. are considered as margins to the OSNR in
the computations that can be configured through the interface. A typical value for the
margins can be 3 dB
In general, the adopted models account for the following physical impairments:
Amplified spontaneous emission (ASE).
PMD.
CD.
Self-phase modulation (SPM).
Cross-phase modulation (XPM). XPM is particularly relevant when a PM-QPSK alien
wavelength is surrounded by OOK wavelengths.
As stated earlier, other physical impairments are considered through the configurable worst-
case margins.
For more details on the adopted models, please refer to [37]. Also, a more detailed description of
the inputs, outputs and the operation can be found in Appendix A.
3.2.4 Extensions to the Tool
In this sub-section, the main advances with respect to the version of the tool delivered by the
GN3plus Open Call MOMoT project are summarised:
Enabled the 10G OOK BER computation.
Included margins as an input parameter of the system.
Unlocked the bitrate in case of 10G OOK.
Modified the horizontal header of the table.
Solved a bug when loading some configuration files: introduced a check validating the
structure of the configuration file (avoiding the tool crash at start-up).
Solved a problem related to both “warning: VOA attenuation” and “Error 2” error messages
(avoiding problem with specific configuration files with high power): such warning and error
messages are avoided.
The modelling tool developed in the GN3plus Open Call MOMoT project estimates, for a subset of
available modulations, the impact and viability of injecting alien waves into host optical transport
networks. The tool has been further developed in the context of GN4-1 and, among others, 10G OOK
BER computation has been added, which was specifically requested in GN3plus by NRENs. The tool
provides a simple graphical user interface and accounts for a wide range of physical impairments,
which are relevant when transporting alien waves.
Spectral Sharing and Alien Waves
Deliverable D13.1 Research and Study Network Technologies – White Paper Document Code: GN4-1-16-7D602 30
3.3 Best Practices from Other Projects
In order to gain practical experience and develop guidelines on how to design, commission and
maintain alien wave services, different trials and studies have been performed in the NREN
communities. This section outlines general best practice, and the lessons learned from AW trials by
JRA1 T1 NREN third-party participants SUNET and UNINETT, and from NREN operators’ experiences.
3.3.1 General Best Practice
Setting up alien waves between two research networks essentially comes down to the technicalities
of how well the actual platforms support adopting and managing alien wavelengths. Despite this,
there is an equal challenge in simply partnering up with other research networks. It is crucial that
service deployment aspects, such as agreeing responsibilities or defining the operational procedures,
are handled collaboratively, and at an early stage of the partnering. Further essential factors include:
definition of standards and agreements on the technical details for the service deployment;
documenting all the design parameters and build values (e.g. launch powers, receive inputs, etc.);
sufficient monitoring of the alien wave services; and reporting of alarms and problems in a clear
fashion to each partner.
The concept of sharing network resources and opening up for non-native signals does not have to be
restricted to single-signal adoption. Instead of merely assigning a designated input point on a
dedicated channel, a slice of the native spectrum (or even the full spectrum) can be shared with the
partner, thus giving them better possibilities for expansion. This concept is typically referred to as
spectrum sharing.
3.3.2 SUNET Alien Wave-Based Network
During the design phase of SUNET’s (the Swedish research network) new network, it was decided to
take a new approach in terms of establishing router connectivity between the universities.
Instead of relying on the traditional way of building networks, in which expensive transponders are
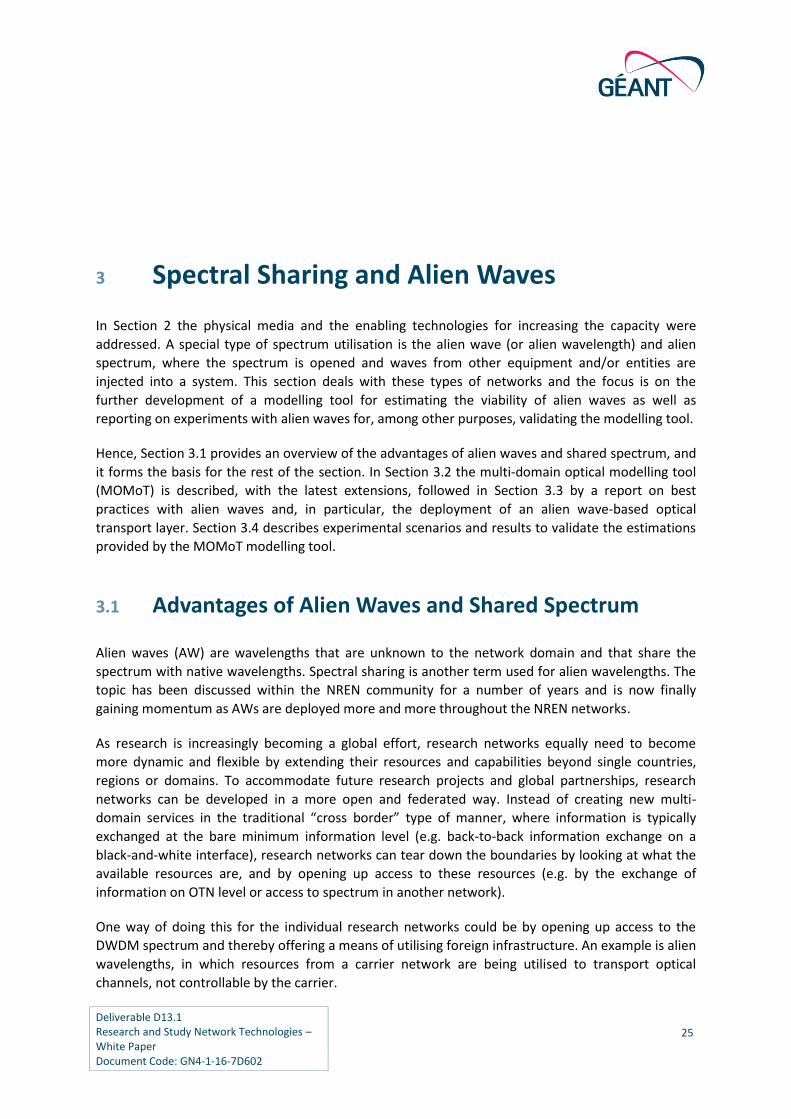
utilised for the connectivity, SUNET are planning to use coherent coloured interfaces in the routers.
Specifically, these coherent interfaces are 100G Juniper line cards with CFP2 client interfaces, which
will be connected directly towards the next university site (the red line in Figure 3.2 below) as alien
waves via optical amplifiers from ADVA. Furthermore, backbone routers are likewise connected via
alien waves (the blue lines in Figure 3.2).
Spectral Sharing and Alien Waves
Deliverable D13.1 Research and Study Network Technologies – White Paper Document Code: GN4-1-16-7D602 31
Figure 3.2: Optical network setup
The effective channels (originating in the Juniper line cards) will therefore be “alien” to the ADVA
platform. The plan is to control and manage the spectrum in a collaborative manner, by utilising a
GMPLS control plane interworking on the ADVA and Juniper systems.
The 100G coherent line cards from Juniper are beta version and SUNET is one of the first customers
in the world to try them out. The process of building this network has started and the first link has
been established; finalisation of the complete network is expected to continue until October 2016.
3.3.3 UNINETT 100G Alien Wavelength Cisco–Juniper Interoperability Test
The purpose of the test was to verify support of 100G alien wavelengths in UNINETT’s (Norway’s
NREN) optical network. In addition, UNINETT wanted to gain some experience with new 100G
OTN/DWDM cards from Juniper and Cisco, and prove the interoperability between them. The
following tests have been performed:
100G single-vendor alien wavelength (AW) test over Coriant hiT 7300 platform.
100G multi-vendor AW test over Coriant hiT 7300 platform.
Test Layout and Equipment
The DWDM path of the link was established over two point-to-point DWDM systems based on a
Coriant hiT 7300 platform between Trondheim and Oslo. As shown in Figure 3.3 below, the DWDM
systems on the Oslo side are connected to each other by using dedicated dark fibre between mux
and demux.
Spectral Sharing and Alien Waves
Deliverable D13.1 Research and Study Network Technologies – White Paper Document Code: GN4-1-16-7D602 32
Both routers are located in Trondheim but in different locations. A Spirent test generator with 10G
interface and logical loop was used on the routers in order to create 40 Gb/s of traffic over the 100G
AW link.
Figure 3.3: UNINETT Cisco–Juniper interoperability test scenario
The total length of the test DWDM path is 1,235 km, and it consists of nine “optical line repeater”
NEs, six OADMs and two terminals. One of the DWDM systems is based on 100 GHz spacing and the
other on 50 GHz spacing. The system utilisation on both systems is over 50%, running a mix of 10G
and 100G operational wavelengths. 100G and 10G wavelengths are grouped in separate optical
bands with 200 GHz of guard band between them. The total OSNR is about 16.2 dB.
The 100G DWDM MX MIC is based on the 100G CFP2-ACO coherent pluggable optics technology.
Both routers were configured with HG-FEC (multi-vendor) on 193 THz frequency channel. 40 Gb/s of
load was generated on the 100G AW link and the test ran over several days. Figure 3.4 and Figure
3.5 shows the results on the Juniper interfaces.
As shown in the figures, neither packet loss nor post-FEC errors were registered. The minimum and
maximum pre-FEC BER measured during a 1-second interval over a 15-minute period are shown in
Figure 3.4.
Spectral Sharing and Alien Waves
Deliverable D13.1 Research and Study Network Technologies – White Paper Document Code: GN4-1-16-7D602 33
Figure 3.4: Pre-FEC bit error rate on Juniper router
Figure 3.5: Post-FEC bit errors on Juniper router
Interoperability Test Conclusion
The test result was better than expected. Configuration of the routers and DWDM was done in
accordance with the procedure and without any obstacles. Even if the DWDM system had an OSNR
value close to the limit of HG-FEC operation, there was no pre-FEC bit error and packet loss.
Spectral Sharing and Alien Waves
Deliverable D13.1 Research and Study Network Technologies – White Paper Document Code: GN4-1-16-7D602 34
3.3.4 Operator Experiences with Alien Waves
There are definitely many possibilities in alien waves and spectrum sharing and it has a lot of
potential in the research communities. As mentioned in Section 3.1, SURFnet and NORDUnet have
already implemented some of their services as alien waves and the stability of these services has
been proven in their production environment for a couple of years now.
The willingness to implement wavelengths from other vendors (operated by other systems and
other operating centres) is founded on past simulations, experiments and trials by NRENs and within
the GÉANT context that have given the confidence to commence real implementation.
During the experiments and simulations mentioned above, it was investigated whether or not it was
possible to find an optimum power area for the native and alien signals’ interaction. Clearly, the
non-linear effects become evident when the signal intensities are relatively increased, and the
results of the experiments showed both cross-phase and self-phase modulation problems when
using too high signal powers or having too little guard band.
Apart from these findings, it was concluded that the operational challenges in partnering up for
sharing waves or spectrum are just as important as solving technical problems at the commissioning
stage.
3.4 Experimental Scenarios and Key Results
Several experimental deployments have been conducted with and without the JRA1 T1 partners’
participation. The results of these are useful for gaining confidence and for providing some
engineering rules of thumb for optimal implementation.
Another matter is how to determine the actual design parameters and the specific physical values
that are needed when the alien waves are adopted.
It is here that the MOMoT tool can be very useful and, conveniently, can calculate the effect of the
alien/native signal interaction. It is easy to model the production environment, and then calculate
concrete values to be used on commissioning of the alien waves.
However, in order to have confidence in these values, verification testing has been performed to
check the integrity of the tool and, if necessary, make corrections and improvements. The initial
verification testing was performed in GN3plus through a trial with SURFnet and Dante, which was
compared with the estimations from the MOMoT tool.
In order to gain more verification assurance, it is desirable to have multiple trials to confirm the
integrity of the tool and thus more trials was performed in NORDUnet’s live production network
with BER vs. launch power as a performance criterion.
Spectral Sharing and Alien Waves
Deliverable D13.1 Research and Study Network Technologies – White Paper Document Code: GN4-1-16-7D602 35
3.4.1 Experiments in NORDUnet
1st Trial Copenhagen–Hamburg and Back
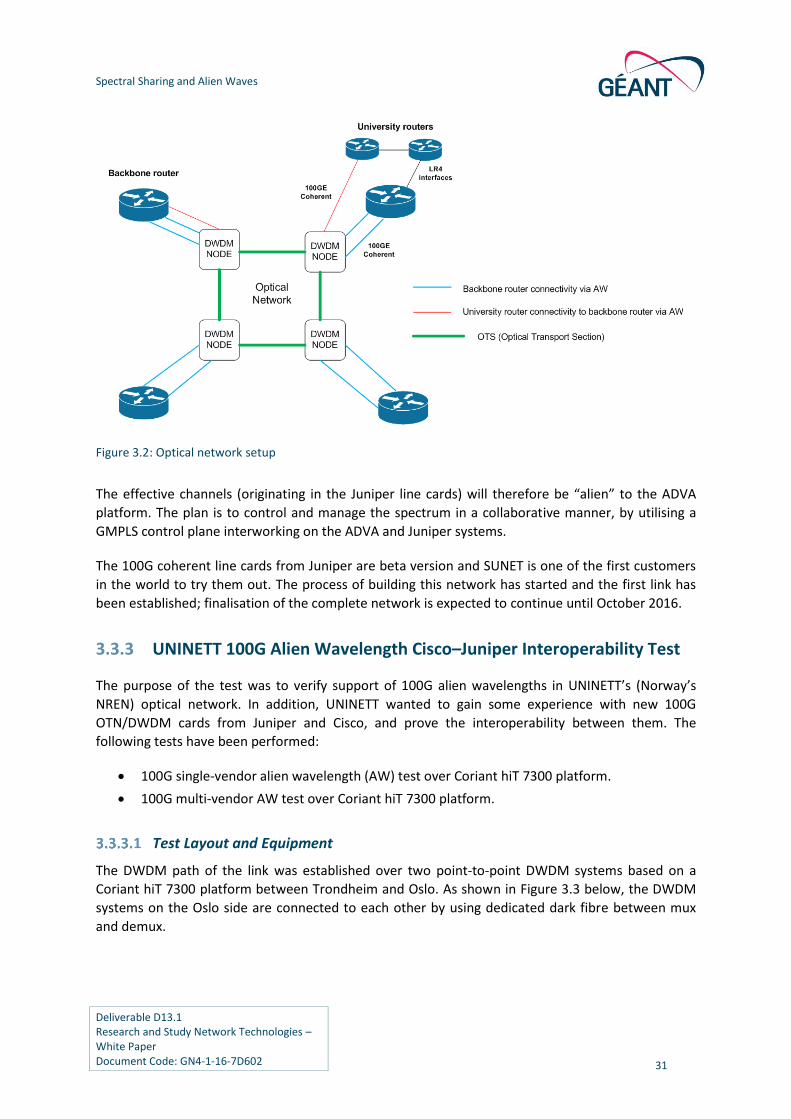
In the first trial NORDUnet connected two transponders (at the same site in Copenhagen 1), and
then set up up a channel going uni-directionally from Copenhagen to Hamburg and back to
Copenhagen again. The link from Copenhagen 2 to Hamburg 1 goes via Fyen and down towards
Germany. The other link, from Hamburg 2 back to Copenhagen 1, goes via Sealand and thus the total
coverage is approximately 1,000 km.
Figure 3.6: Test scenario between Copenhagen and Hamburg
Unfortunately the reach of the transponders that were available for the trial was not long enough,
and it was not possible to successfully compare the results with the MOMoT tool. Due to this reach
limitation, it was soon decided to create another trial in the same network but covering a shorter
distance.
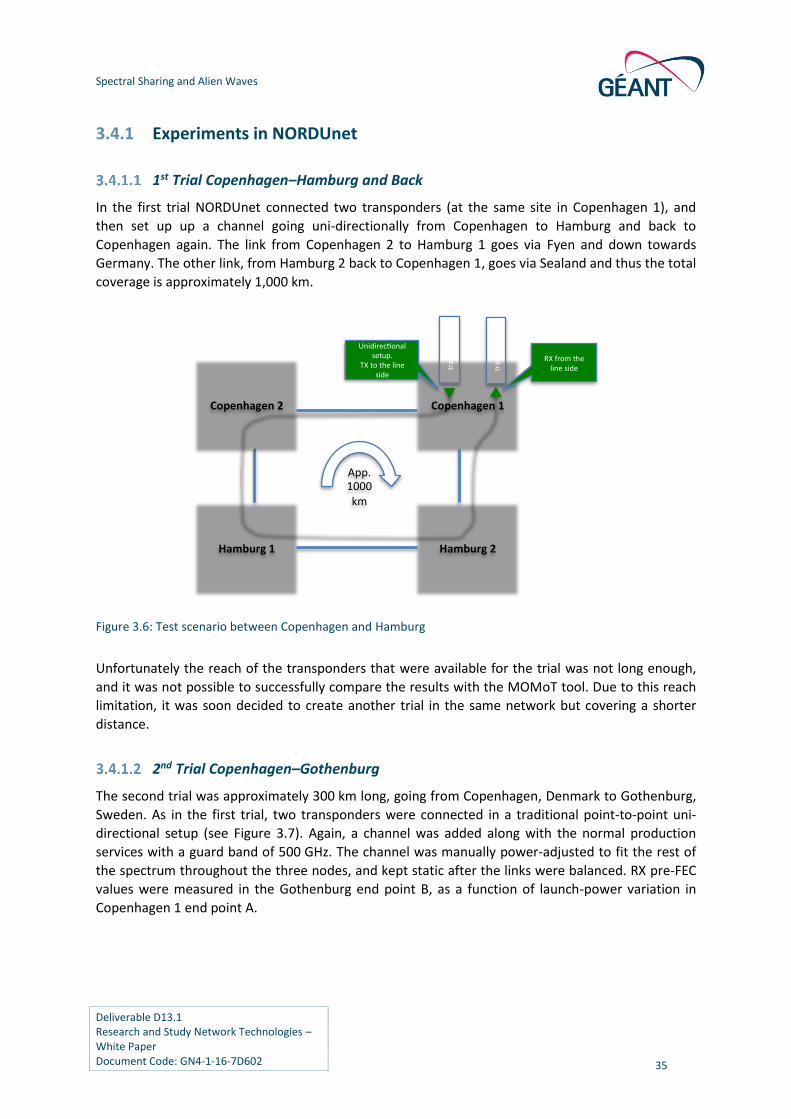
2nd Trial Copenhagen–Gothenburg
The second trial was approximately 300 km long, going from Copenhagen, Denmark to Gothenburg,
Sweden. As in the first trial, two transponders were connected in a traditional point-to-point uni-
directional setup (see Figure 3.7). Again, a channel was added along with the normal production
services with a guard band of 500 GHz. The channel was manually power-adjusted to fit the rest of
the spectrum throughout the three nodes, and kept static after the links were balanced. RX pre-FEC
values were measured in the Gothenburg end point B, as a function of launch-power variation in
Copenhagen 1 end point A.
Copenhagen1Copenhagen2
Hamburg2Hamburg1
transponder
transponder
App.1000km
Unidirec onalsetup.
TXtothelineside
RXfromthelineside
Spectral Sharing and Alien Waves
Deliverable D13.1 Research and Study Network Technologies – White Paper Document Code: GN4-1-16-7D602 36
Figure 3.7: 300 km test scenario between Copenhagen and Gothenburg
In order to verify the predictions of the MOMoT tool, the Gothenburg link values, such as span
lengths, launch power, bitrate and modulation format, were used as input.
Figure 3.8 shows the comparison of the actual link measurements and three graphs that represent 3
different scenarios calculated by the tool. The margin M and the noise figure NF were varied in pairs:
(M = 3, NF = 3), (M = 3, NF = 7) and (M = 7, NF = 7). The margin is a parameter that takes fibre ageing
and other non-modelled factors into account. Typically, a value of around 3 is a good representation
for an average optical link. The noise figure of the amplifiers is often known for optical networks.
However, in this case, its value was not verified so two variations were chosen.
In Figure 3.8 the tool resemblance with the actual measurements looks fairly reasonable when
compared with the (M = 3, NF = 7) tool curve. At input powers above 1 dB, however, the lab curve is
bending off. This can be explained by the power limitation that takes place in the link. Due to
amplifier gain management in the link, the effect of further increases in the power is reduced. Also,
it should be mentioned that the lab results curve was parallel-shifted 5 dB to the left in this graph,
which accounts for losses occurring in the initial phase of the transmission and underway in a
wavelength selective switch. In terms of an AW link evaluation where these losses are unknown, the
link quality estimation would not overestimate the quality, but rather be pessimistic about the
success of the link. Minimising the insertion losses or being aware of these so they can be taken into
account is therefore always preferred.
Gothenburg
Copenhagen1Copenhagen2
transponder
transponder
PointATXtotheline
side
PointBRXfromthelineside
App.300km
Spectral Sharing and Alien Waves
Deliverable D13.1 Research and Study Network Technologies – White Paper Document Code: GN4-1-16-7D602 37
Figure 3.8: The figure compares the pre-FEC BER curves of the field trial (lab) measurements and three curves
produced by the MOMoT tool
3.5 Conclusions
Alien waves and spectral sharing are gaining momentum among NRENs as one way of becoming
more dynamic, flexible and open in order to meet R&E needs and potentially provide savings on
fibre deployment. Studies and experiments – including by JRA1 T1 participants SURFnet and
NORDUnet – have helped identify prerequisites and best practice not simply in terms of technology
but also in terms of definition of responsibilities, standards, procedures, documenting design
parameters and build values, monitoring and reporting. The reliability and integrity of alien waves
have been sufficiently proven for SURFnet and NORDUnet to have transitioned AW services into
production for both client and own use.
Valuable results have been obtained on defining an optimum power area for the native and alien
signals’ interaction: the non-linear effects become evident when the signal intensities are relatively
increased, and both cross-phase and self-phase modulation problems are encountered when using
too high signal powers or having too little guard band.
The multi-domain optical modelling tool (MOMoT), originally developed during a GN3plus Open Call
project and further developed during GN4-1, helps determine these and other design parameters
and specific physical values needed for AW adoption. Verification tests in NORDUnet’s live
production network, with BER vs. launch power as a criterion, showed a reasonable correlation
between MOMoT’s predictions and actual measurements, and indicated that the tool would
underestimate link quality rather than overestimate; minimising the insertion losses or being aware
of these so they can be taken into account is always preferred.
Deliverable D13.1 Research and Study Network Technologies – White Paper Document Code: GN4-1-16-7D602
38
4 Frequency and Time Distribution
In order to provide zero-touch connectivity and to facilitate a number of high-demanding
applications, it is necessary to provide mechanisms to synchronise and distribute time and frequency
information among laboratories and users. Solutions to the challenge can be sought in different
layers, and in this section the issue is addressed in both the physical layer and in layer 2/3.
In Section 4.1, the concepts are described for distribution of accurate time and stable frequency in
the physical layer. Different conceptual architectures are explained and several joint inter-NREN
experiments described, which were carried out over links ranging up to 1,500 km. The results
indicate the viability of the concepts, and an overview of the future challenges is also provided.
While the physical time transfers are the costly and accurate highways, the precise transfer of time
information can also be supported in the higher layers. This is investigated in Section 4.2 with audio
and video as the candidate applications. In particular, precision time protocol (PTP) is investigated,
and how it can work for connections running on top of MPLS tunnels. Also, a joint experiment
evaluating PTP over a standard Internet connection on a 500 km link between Erlangen and Prague is
discussed.
4.1 Distribution on the Lowest Layer
Accurate time or stable frequency is required by many applications in navigation, metrology,
telecommunications, geodesy, astronomy and other scientific and industrial areas. One source of
accurate time is often a Global Navigation Satellite System (GNSS) receiver providing the one pulse
per second (1PPS) signal. However, such a solution is scalable only with difficulty and is sometimes
not possible due to problems with antenna installation (e.g. large buildings, tunnels). Furthermore,
time and frequency distribution over optical links allows significant improvements of uncertainty and
stability compared with GNSS methods [38; 39].
Precise time and ultra-stable frequency transfer opens the possibility to set up experiments with a
high level of precision that has not been attainable to date. Without being exhaustive, examples
include:
Antenna networking in astrophysics.
Fundamental constants measurements (e.g. Boltzmann constant).
Frequency and Time Distribution
Deliverable D13.1 Research and Study Network Technologies – White Paper Document Code: GN4-1-16-7D602 39
Satellite link tests (e.g. Metrological Fibre Network with European Vocation + (REFIMEVE+)
signal could be used by the European Space Agency’s (ESA) spatial atomic clock program
PHARAO/ACES within the next few years).
Fundamental physics tests [40; 41] (e.g. spectroscopy of hydrogen and its derivatives, high-
resolution spectroscopy in the physics of atoms, ions and molecules, the search for parity
This architecture is mainly used within the REFIMEVE+ project in France, aiming to deploy a national
infrastructure on RENATER DWDM backbone to disseminate an ultra-stable frequency towards
scientific laboratories. The metrological signal is transmitted bi-directionally through each dark fibre
to compensate it precisely, so this solution is not compliant with usual DWDM technology, which
requires isolators.
Figure 4.3 depicts the Nancy–Reims link on RENATER, equipped for REFIMEVE+ transmission.
Figure 4.3: Detailed scheme of a span between Reims and Nancy
Dedicated OADMs are installed on each PoP and in-line amplifier (ILA) to make the metrological
signal (in red) bypass DWDM equipment. Once extracted in ILAs, the signal is reamplified separately
from the NREN signal. This insertion of OADM causes an extra attenuation of 1.6 dB on each span.
CESNET reported in 2014 on precise time transmission over the 306 km line Praha–Brno [42]. This
line features both C- and L-band transmission systems. The excessive attenuation of 27 dB in the
span Praha–Potehy was solved by creation of a bi-directional ILA site only.
Figure 4.4: Praha–Brno line, C- and L-band systems deployed, 306 km
Revigny TrousseyLa Veuve
Node
Nancy
Station
2
Node
Reims
Switches
&
Routers
Switches
&
Routers
Mono-directionalOptical Amplifiers
Bi-directionalOptical Amplifiers
Multiplexer(OADM)
Ultrastable signalregeneration
54km
-16dB
69km
-16dB
72km
-16dB
Station
1
82km
-18dB
Frequency and Time Distribution
Deliverable D13.1 Research and Study Network Technologies – White Paper Document Code: GN4-1-16-7D602 42
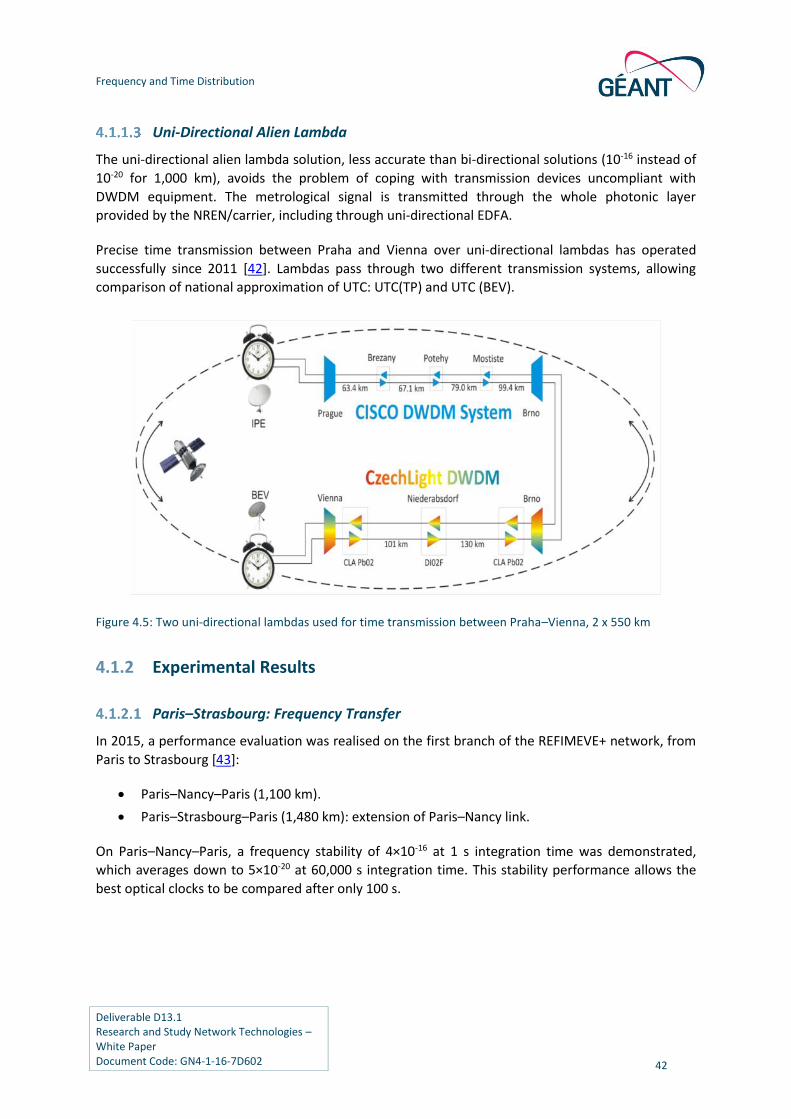
Uni-Directional Alien Lambda
The uni-directional alien lambda solution, less accurate than bi-directional solutions (10-16 instead of
10-20 for 1,000 km), avoids the problem of coping with transmission devices uncompliant with
DWDM equipment. The metrological signal is transmitted through the whole photonic layer
provided by the NREN/carrier, including through uni-directional EDFA.
Precise time transmission between Praha and Vienna over uni-directional lambdas has operated
successfully since 2011 [42]. Lambdas pass through two different transmission systems, allowing
comparison of national approximation of UTC: UTC(TP) and UTC (BEV).
Figure 4.5: Two uni-directional lambdas used for time transmission between Praha–Vienna, 2 x 550 km
4.1.2 Experimental Results
Paris–Strasbourg: Frequency Transfer
In 2015, a performance evaluation was realised on the first branch of the REFIMEVE+ network, from
Paris to Strasbourg [43]:
Paris–Nancy–Paris (1,100 km).
Paris–Strasbourg–Paris (1,480 km): extension of Paris–Nancy link.
On Paris–Nancy–Paris, a frequency stability of 4×10-16 at 1 s integration time was demonstrated,
which averages down to 5×10-20 at 60,000 s integration time. This stability performance allows the
best optical clocks to be compared after only 100 s.
Frequency and Time Distribution
Deliverable D13.1 Research and Study Network Technologies – White Paper Document Code: GN4-1-16-7D602 43
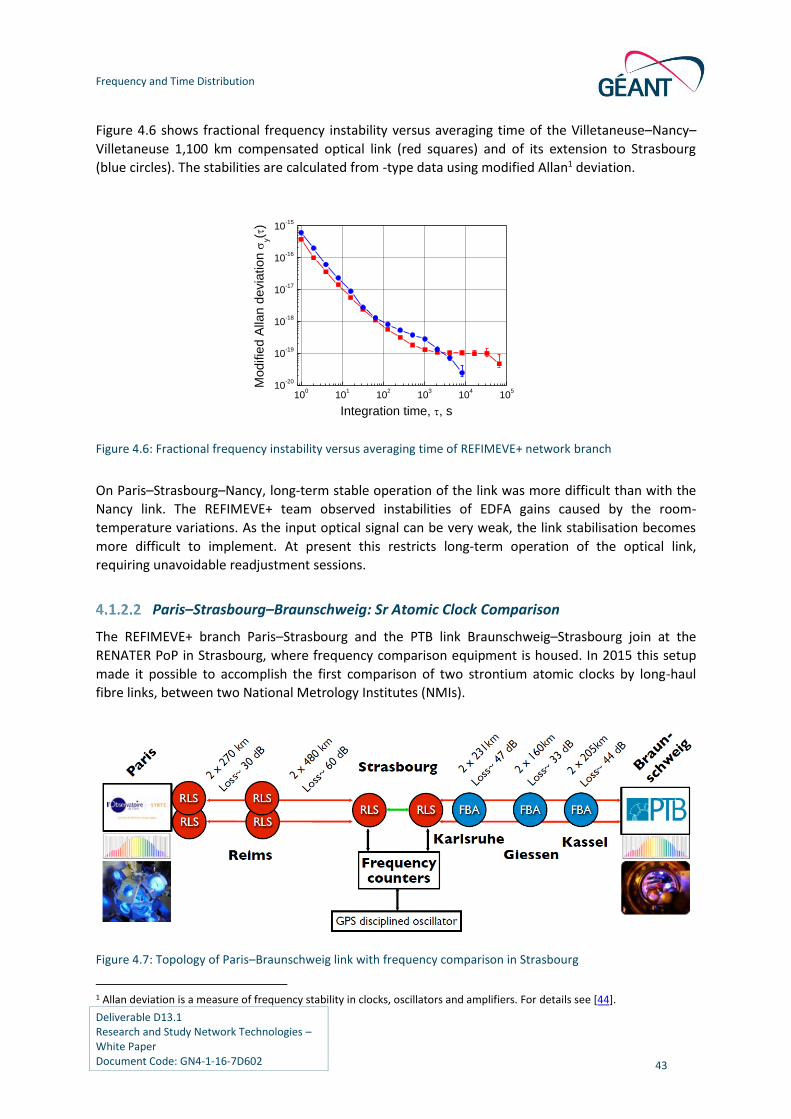
Figure 4.6 shows fractional frequency instability versus averaging time of the Villetaneuse–Nancy–
Villetaneuse 1,100 km compensated optical link (red squares) and of its extension to Strasbourg
(blue circles). The stabilities are calculated from -type data using modified Allan1 deviation.
Figure 4.6: Fractional frequency instability versus averaging time of REFIMEVE+ network branch
On Paris–Strasbourg–Nancy, long-term stable operation of the link was more difficult than with the
Nancy link. The REFIMEVE+ team observed instabilities of EDFA gains caused by the room-
temperature variations. As the input optical signal can be very weak, the link stabilisation becomes
more difficult to implement. At present this restricts long-term operation of the optical link,
requiring unavoidable readjustment sessions.
Paris–Strasbourg–Braunschweig: Sr Atomic Clock Comparison
The REFIMEVE+ branch Paris–Strasbourg and the PTB link Braunschweig–Strasbourg join at the
RENATER PoP in Strasbourg, where frequency comparison equipment is housed. In 2015 this setup
made it possible to accomplish the first comparison of two strontium atomic clocks by long-haul
fibre links, between two National Metrology Institutes (NMIs).
Figure 4.7: Topology of Paris–Braunschweig link with frequency comparison in Strasbourg
1 Allan deviation is a measure of frequency stability in clocks, oscillators and amplifiers. For details see [44].
100
101
102
103
104
105
10-20
10-19
10-18
10-17
10-16
10-15
Mod
ifie
d A
llan
devia
tio
n
y(
)
Integration time, , s
Frequency and Time Distribution
Deliverable D13.1 Research and Study Network Technologies – White Paper Document Code: GN4-1-16-7D602 44
The French and German links, described in Figure 4.7, are built upon different transmission
technologies. On the French side, the signal is periodically reamplified by repeater laser stations
(RLS) and EDFA amplifiers, whereas the PTB use fibre Brillouin amplification (FBA).
Two independent frequencies are emitted from the French and German atomic clocks and those are
compared in Strasbourg, where a GPS makes it possible to evaluate the frequency instability SrPTB-
SrSYRTE as represented in Figure 4.8 below [45]:
Figure 4.8: 25-day comparison of Paris and Braunschweig atomic clocks in Strasbourg
The frequency instability can also be expressed with the total Allan deviation, as in Figure 4.9, where
one can see a statistical uncertainty lower than 3x10-17 during measurement over one day, and of
2x10-17 from 5,000 to 50,000 seconds.
Frequency and Time Distribution
Deliverable D13.1 Research and Study Network Technologies – White Paper Document Code: GN4-1-16-7D602 45
Figure 4.9: Frequency instability during two phases of experimentation
The stability of time transfer is usually expressed in terms of Time Deviation (TDEV), introduced for
the first time in All optical two-way time transfer in strongly heterogeneous networks [42]. A
comparison of uncertainty between optical time transfer and GPS-based methods at the link Praha–
Vienna (as in Figure 4.5) is shown in Figure 4.10. The link connects Czech and Austrian laboratories of
the National Time and Frequency Standard. In both of them GPS calibration receivers are installed,
allowing comparison of national representation of timescales: UTC(TP) in Praha and UTC(BEV) in
Vienna. This way optical time transfer (red line) can be directly compared with GPS-based time
transfer. The green line is TDEV of the Common View (CV GPS) method, when the signal of the same
GPS satellite, visible from both sites, is compared. The blue line shows the results of the precise
point positioning (PPP) technique, which uses GPS phase and code observations for data post-
processing.
Frequency and Time Distribution
Deliverable D13.1 Research and Study Network Technologies – White Paper Document Code: GN4-1-16-7D602 46
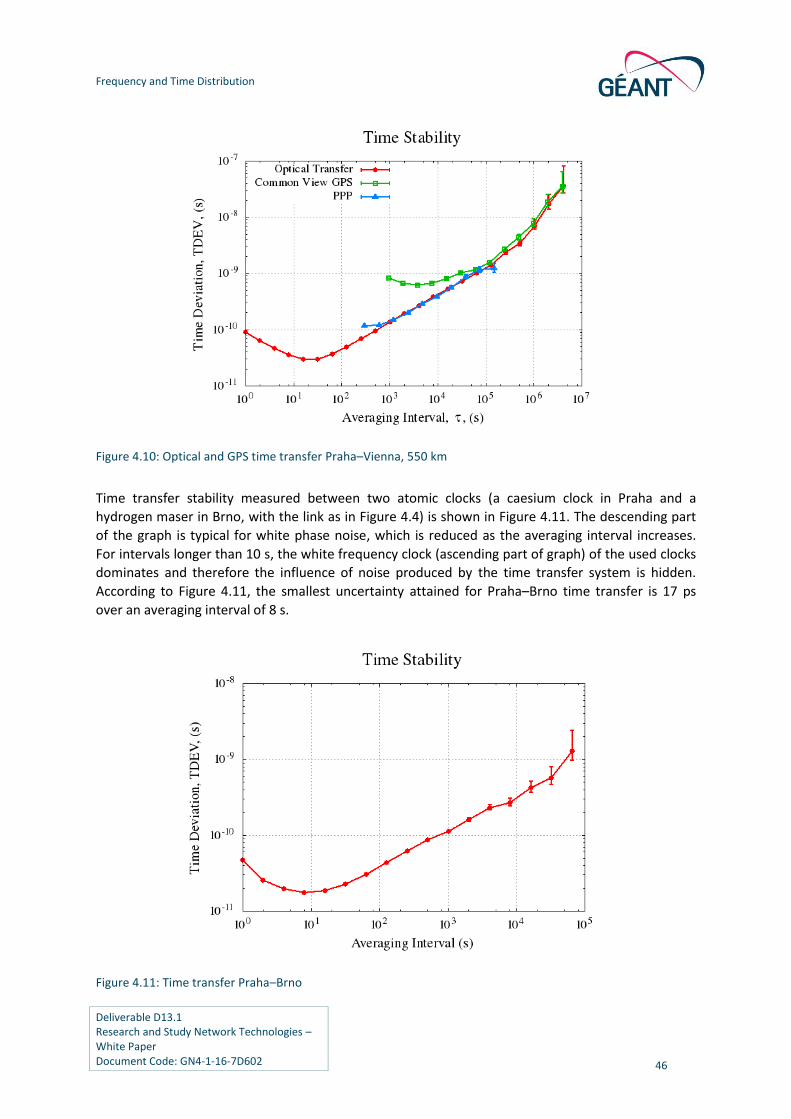
Figure 4.10: Optical and GPS time transfer Praha–Vienna, 550 km
Time transfer stability measured between two atomic clocks (a caesium clock in Praha and a
hydrogen maser in Brno, with the link as in Figure 4.4) is shown in Figure 4.11. The descending part
of the graph is typical for white phase noise, which is reduced as the averaging interval increases.
For intervals longer than 10 s, the white frequency clock (ascending part of graph) of the used clocks
dominates and therefore the influence of noise produced by the time transfer system is hidden.
According to Figure 4.11, the smallest uncertainty attained for Praha–Brno time transfer is 17 ps
over an averaging interval of 8 s.
Figure 4.11: Time transfer Praha–Brno
Frequency and Time Distribution
Deliverable D13.1 Research and Study Network Technologies – White Paper Document Code: GN4-1-16-7D602 47
4.1.3 Conclusions: Management of Waves for Frequency Distribution
Transmission using uni-directional waves can be handled with mature technology, using common
alien waves at high performance, which still out-performs GNSS methods.
The precise time and ultra-stable frequency transmission as a bi-directional alien wavelength is in its
infancy. Most deployed links are point-to-point on a fixed wavelength. It is difficult to regenerate a
signal to a different wavelength because of the price of the precise lasers and transceiver stations,
and because most amplifiers and transmission equipment are prototypes and need to be
industrialised.
Consequently, several challenges need to be solved to pave the way to a remotely controlled,
automated and flexible metrological network:
To be able to “multicast” the ultra-stable frequency to different PoPs (a first experimentation
was performed in 2015 within the REFIMEVE+ project [46]).
To be able to monitor these signals at the optical layer, given that they are narrow and bi-
directional.
To create and to test SNMP MIBs and/or an alternative solution to remotely monitor
metrological equipment.
To find a reliable and cost-effective way to monitor third-party equipment (i.e. metrological
in-line amplifiers) in NREN ILAs.
To define best practices for metrological network configuration (amplifier gains, optical
powers to be chosen to achieve the best performance without disturbing NREN traffic) in
order to model metrological alien wavelengths on NREN DWDM infrastructures.
To understand the kinds of incidents that can occur on a metrological network, to train
efficiently the NREN and GÉANT NOCs.
4.2 Time Distribution in Layer 3
For the synchronisation of clocks throughout a network, the precision time protocol (PTP) (IEEE 1588
protocol) was proposed to obtain clock accuracy in LANs in the sub-microsecond range. With such
accuracy, PTP is suitable for measurement and control systems [47] and provides precision beyond
network time protocol (NTP). PTP also has the advantage that costs for GPS receivers can be reduced,
as not all nodes in the network need to have access to GPS signals: PTP slaves (for example, at
locations where GPS signals are inaccessible) can be used, which obtain their clock synchronisation
by using the reference of a GPS-based PTP grandmaster clock at another location within the network.
Since PTP was initially designed for LANs, several experiments were conducted during GN4-1 to
determine the level of clock synchronisation with PTP over wide area networks where longer
distances with higher delays are involved, which will affect PTP’s delay-based algorithm. The
following sections describe experiments over MPLS tunnels, as well as long-term tests of PTP
synchronisation over the Internet.
Frequency and Time Distribution
Deliverable D13.1 Research and Study Network Technologies – White Paper Document Code: GN4-1-16-7D602 48
4.2.1 PTP Validation over MPLS Tunnels
IEEE 1588 / PTP was developed to distribute high-precision time and frequency over packet-switched
networks. Such high precision can only be achieved if all network elements (in particular, all switches
and routers) support PTP on the hardware layer. Currently, most of the installed switches and
routers in a network do not support PTP.
MPLS is a common technology for network providers (e.g. NRENs or commercial providers) to offer
IP or Ethernet services to different customers or separate networks logically, in particular for wide
area networks (WANs). The following measurements investigate the potential and properties of a
typical MPLS service to transport time-sensitive data and the corresponding time synchronisation via
PTP.
Network Environment of the Test and Results
The WAN consists of Cisco routers connected via 10 GE links. An MPLS tunnel was established
between Munich and Frankfurt and between Frankfurt and Berlin. The bandwidth of these tunnels
was not limited. L2 measurements were taken to evaluate the characteristics of these tunnels;
results showed the packet jitter was within a range of 50 – 60 us.
Figure 4.12: Test setup 1 in AES over WAN tests
A linear audio stream (based on AES67-Standard) was used as a time-sensitive data application.
In test setup 1 (shown in Figure 4.12), the PTP grandmaster (GPS synchronised) was located in
Munich. PTP traffic was transmitted in-band, and transmitted at the same tunnel as the audio traffic.
Frequency and Time Distribution
Deliverable D13.1 Research and Study Network Technologies – White Paper Document Code: GN4-1-16-7D602 49
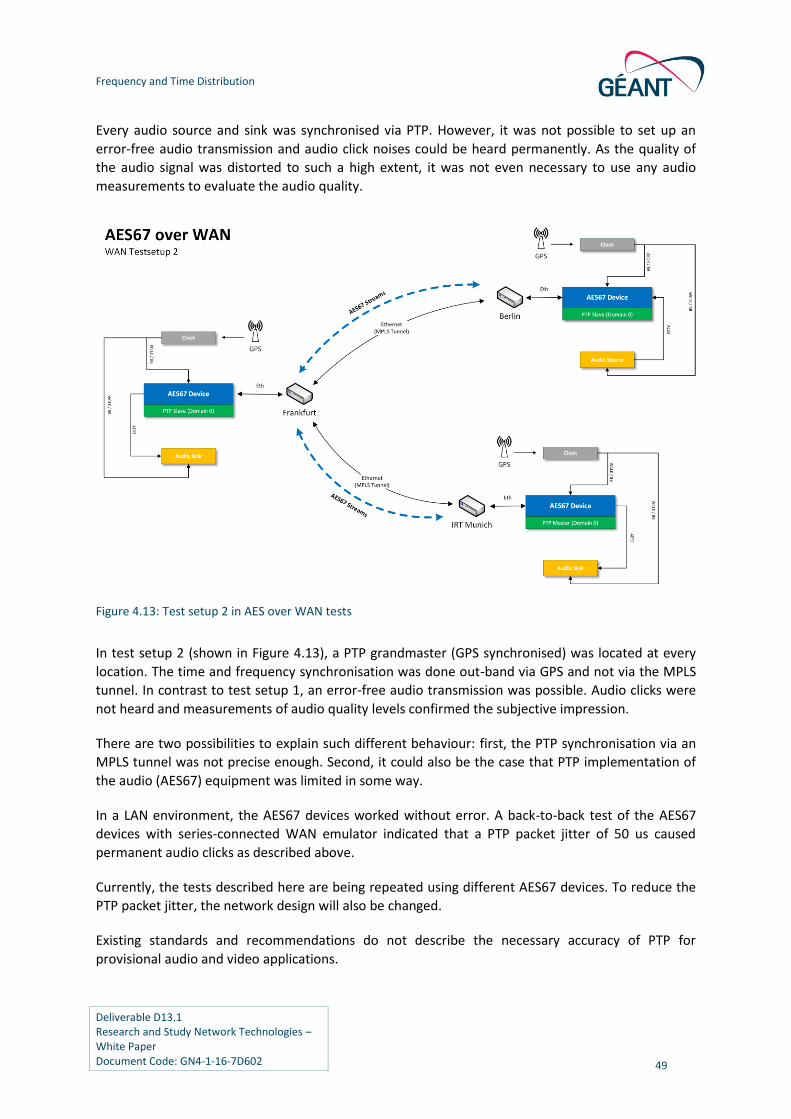
Every audio source and sink was synchronised via PTP. However, it was not possible to set up an
error-free audio transmission and audio click noises could be heard permanently. As the quality of
the audio signal was distorted to such a high extent, it was not even necessary to use any audio
measurements to evaluate the audio quality.
Figure 4.13: Test setup 2 in AES over WAN tests
In test setup 2 (shown in Figure 4.13), a PTP grandmaster (GPS synchronised) was located at every
location. The time and frequency synchronisation was done out-band via GPS and not via the MPLS
tunnel. In contrast to test setup 1, an error-free audio transmission was possible. Audio clicks were
not heard and measurements of audio quality levels confirmed the subjective impression.
There are two possibilities to explain such different behaviour: first, the PTP synchronisation via an
MPLS tunnel was not precise enough. Second, it could also be the case that PTP implementation of
the audio (AES67) equipment was limited in some way.
In a LAN environment, the AES67 devices worked without error. A back-to-back test of the AES67
devices with series-connected WAN emulator indicated that a PTP packet jitter of 50 us caused
permanent audio clicks as described above.
Currently, the tests described here are being repeated using different AES67 devices. To reduce the
PTP packet jitter, the network design will also be changed.
Existing standards and recommendations do not describe the necessary accuracy of PTP for
provisional audio and video applications.
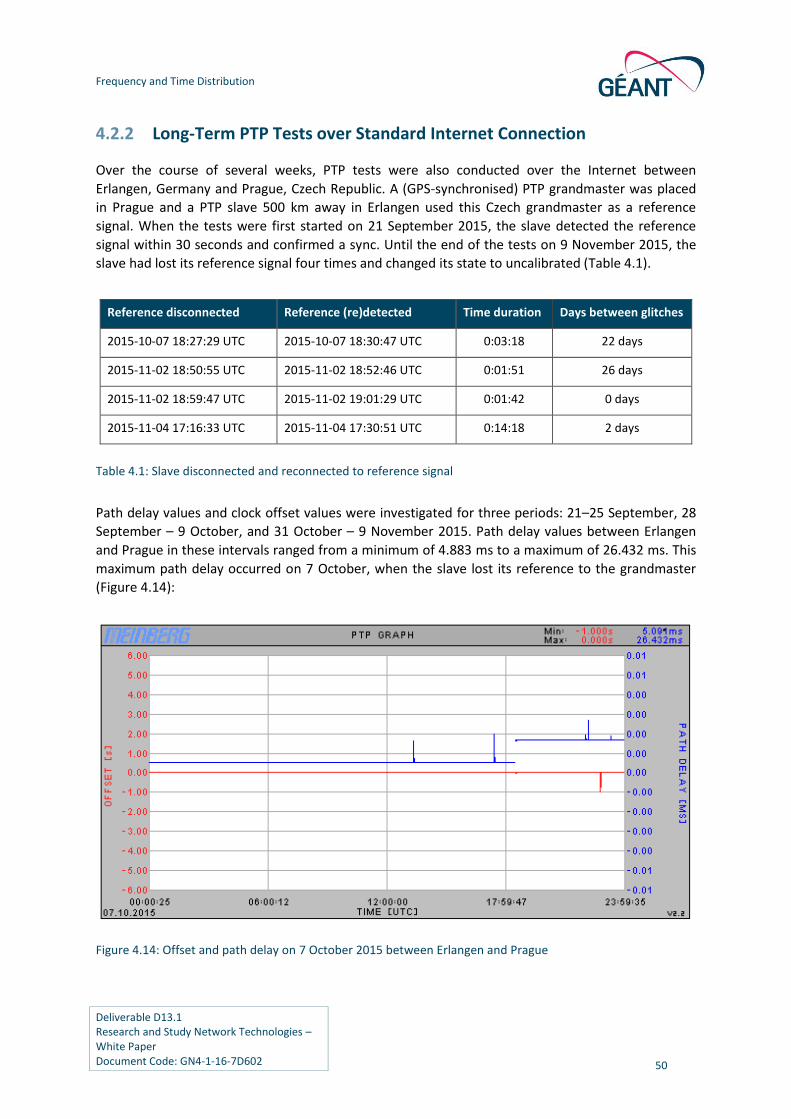
Frequency and Time Distribution
Deliverable D13.1 Research and Study Network Technologies – White Paper Document Code: GN4-1-16-7D602 50
4.2.2 Long-Term PTP Tests over Standard Internet Connection
Over the course of several weeks, PTP tests were also conducted over the Internet between
Erlangen, Germany and Prague, Czech Republic. A (GPS-synchronised) PTP grandmaster was placed
in Prague and a PTP slave 500 km away in Erlangen used this Czech grandmaster as a reference
signal. When the tests were first started on 21 September 2015, the slave detected the reference
signal within 30 seconds and confirmed a sync. Until the end of the tests on 9 November 2015, the
slave had lost its reference signal four times and changed its state to uncalibrated (Table 4.1).
Table 4.1: Slave disconnected and reconnected to reference signal
Path delay values and clock offset values were investigated for three periods: 21–25 September, 28
September – 9 October, and 31 October – 9 November 2015. Path delay values between Erlangen
and Prague in these intervals ranged from a minimum of 4.883 ms to a maximum of 26.432 ms. This
maximum path delay occurred on 7 October, when the slave lost its reference to the grandmaster
(Figure 4.14):
Figure 4.14: Offset and path delay on 7 October 2015 between Erlangen and Prague
Reference disconnected Reference (re)detected Time duration Days between glitches
2015-10-07 18:27:29 UTC 2015-10-07 18:30:47 UTC 0:03:18 22 days
2015-11-02 18:50:55 UTC 2015-11-02 18:52:46 UTC 0:01:51 26 days
2015-11-02 18:59:47 UTC 2015-11-02 19:01:29 UTC 0:01:42 0 days
2015-11-04 17:16:33 UTC 2015-11-04 17:30:51 UTC 0:14:18 2 days
Frequency and Time Distribution
Deliverable D13.1 Research and Study Network Technologies – White Paper Document Code: GN4-1-16-7D602 51
Such a jump in delay is indicative of packets suddenly being rerouted over a different path. The
reference disconnect happened as a consequence at the same time (18:50:55).
On 2 November 2015 the slave got disconnected from its reference in Prague twice between
18:50:55 and 19:01:29 UTC. The path delay measurements during that time span show an increased
elevation with higher variation compared to the hours before and after the reference signal was lost
(Figure 4.15):
Figure 4.15: Offset and path delay on 2 November 2015 between Erlangen and Prague
On 4 November 2015 the measurements show that at the time of the sync disconnect of the slave
from the grandmaster no values were registered, neither for clock offset nor for path delay (Figure
4.16):
Figure 4.16: Offset and path delay on 4 November 2015 between Erlangen and Prague
Frequency and Time Distribution
Deliverable D13.1 Research and Study Network Technologies – White Paper Document Code: GN4-1-16-7D602 52
At this time it is unclear what caused the interruption of measurements and the loss of the reference
signal.
4.2.3 Conclusions and Recommendations
These long-term measurements show that adverse network conditions can lead to a loss of the
reference signal that the PTP slave obtains from the grandmaster clock. Clock offsets in a range of
milliseconds and even seconds are also quite large. The tests should be repeated, placing
grandmaster and slave in closer proximity to each other to see how favourable shorter path delays
may be. More investigations need to be done over varying distances, and also longer distances and
longer timeframes, in order to be able to determine how far away slaves can be placed from PTP
grandmasters and how exactly network conditions such as jitter affect slave calibration to the
grandmaster.
In the audio tests AES67 over WAN described above, there was jitter in the MPLS tunnel as low as 50
– 60 us; nevertheless, it was not possible in the tests to have a clear audio without distorting noise.
More experiments have to follow to determine if such network jitter values are to be blamed for
audio distortions or if different equipment could lead to better results. As existing standards and
recommendations do not describe the level of accuracy of PTP needed for provisional audio and
video applications, many additional tests are needed in various scenarios to be able to narrow down
network jitter or loss requirements.
Deliverable D13.1 Research and Study Network Technologies – White Paper Document Code: GN4-1-16-7D602
53
5 Network Dynamicity
Network dynamicity is the ability of a network to respond and adapt rapidly and optimally to
changing demands and/or conditions in terms of resources, traffic, service usage and failures among
other aspects. It is key to enabling national resource and education networks to meet new and
changing service requirements.
To fully utilise the increased capacity as described in Sections 2 and 3, it should be possible to
orchestrate the network resources, optionally combined with orchestration of compute and storage
resources. Software-defined networks (SDN) have gained momentum, mainly in the packet layer, as
the new paradigm for controlling network resources and to provide programmability of network
functions. The concept of SDN is also moving into the transport layer, which enables integrated,
layerless approaches for restoration, taking both the transport and the packet layer into
consideration.
This section addresses the control and orchestration of transport network resources. First, in
Section 5.1, the basics of traditional SDN and how it applies to transport SDN are reviewed and the
main trends are reported. The focus is then placed on the extensions to the OpenFlow protocol to
support transport networks (Section 5.1.2), before moving up to the orchestration layer where
application-based network operations (ABNO) as an orchestration tool is described (Section 5.1.3)
and a deployed partner-developed demonstrator is discussed (Section 5.1.4). Second, a special use
case to optimise a failure scenario in the NORDUnet network is used to conceptually evaluate the
potential benefits of using transport SDN in combination with an open network operating system
(ONOS) to provide layerless restoration.
5.1 SDN and Transport SDN Review
The availability of the flexible grid technology facilitates finer spectrum utilisation and the evolution
towards elastic optical networks (EON). Deploying elastic optical networks based on the flexible grid
technology, different services can be provided by adapting optical connection frequency slot width
to the requested bitrate. A provisioning algorithm has to compute a route and find a frequency slot
that must be contiguous in the spectrum and the same along the links in its route [48], in the
absence of expensive spectrum converters. In addition, the algorithm has to decide from among
different modulation formats so as to efficiently use optical resources as a function of the length of
the computed route.
Network Dynamicity
Deliverable D13.1 Research and Study Network Technologies – White Paper Document Code: GN4-1-16-7D602 54
Notwithstanding those advances, dynamicity at the optical layer has been kept rather limited so far
as a result of the large traffic aggregation performed in the upper network layers. Hence, optical
transport networks are currently statically configured and managed. In fact, long planning cycles
upgrade and prepare optical transport networks for the next planning period, where spare capacity
is usually installed to ensure that traffic forecast and failure scenarios can be supported.
Nevertheless, due to the introduction of new services, such as datacentre interconnection, that
NRENs must provide, huge changes in the traffic, not only in volume but also in its distribution and
dynamicity, can be anticipated.
Forecast
Periodical Network Design
Monitor and Measure
Operation(Provisioning and Recovery)
Network Operation
Periodical
Forecast
Periodical Network Design
Monitor and Measure
Operation(Provisioning and Recovery)
Reconfigure / Re-optimise
Periodical
In-operation planning
Network Operation
Figure 5.1: Transport networks lifecycle with (a) dynamicity and (b) in-operation planning
The network lifecycle therefore consists of several steps that are performed sequentially. The initial
step receives inputs from the service layer and from the state of the resources in the already
deployed network and configures the network to be capable of dealing with the forecast traffic, for a
period of time. Once the planning phase produces recommendations, the next step is to design,
verify and manually implement the network changes. While in operation, the network capacity is
continuously monitored and that data is used as input for the next planning cycle (Figure 5.1(a)).
Dealing with traffic dynamicity requires connection provisioning to be automated, which explains
the development of centralised architectures based on the software-defined networking (SDN)
concept.
SDN decouples the network control and forwarding functions, enabling the network control to
become directly programmable and the underlying infrastructure to be abstracted for applications
and network services. SDN is dynamic, manageable, cost-effective and adaptable, making it ideal for
the high-bandwidth, dynamic nature of today’s applications.
Operating the network dynamically might bring cost savings, but it also might cause non-optimal
network resource utilisation. To solve that, network resources can be made available by applying in-
operation network planning [49], i.e. by reconfiguring and/or re-optimising the network on-demand,
which leads to an extended network lifecycle (Figure 5.1(b)).
Network Dynamicity
Deliverable D13.1 Research and Study Network Technologies – White Paper Document Code: GN4-1-16-7D602 55
5.1.1 Developments in Transport SDN
The evolution of SDN and its further advancement have played a most significant role in the
development of next-generation packet networks to meet the upcoming social needs of the growing
population. SDN as a programmable network having “service provisioning on the fly” has induced a
keen interest both in the academic world and in industry.
The concept of SDN derives its basis from the computer engineering area, where an abstraction-
based architecture has simplified the programming problems of writing and maintaining software.
Abstraction is the process by which data and programs are defined with a representation similar in
form to its meaning, while hiding away the implementation details. Different levels of abstraction
can be defined, providing different amounts of detail (high and low levels) and, in turn, creating
different interfaces (instances of abstraction). The objective of the SDN paradigm is realised by
redesigning the architecture of networks in order that they operate in a similar way to that of
computing architectures.
Figure 5.2 shows a logical view of the SDN architecture. Three layers can be identified in this
architecture: an application layer, a control layer, and a data layer. Hence, the SDN paradigm
envisions a network architecture where the network devices (routers, switches, optical nodes, etc.)
become programmable. This objective is realised by introducing appropriate levels of abstraction
that are accessible by applications through the use of control interfaces, specifically, application
programming interfaces (APIs). The interface between the application layer and control layer goes
under the name of northbound interface (NBI) and is specified by the API, while the interface
between control layer and data layer is the southbound interface (SBI) defined by various protocol
specifications, OpenFlow being the most popular.
ApplicationApplication
Application
Application Layer
SDN ControllerControl Layer
Network device
Data LayerNetwork device
Network device
SBI (OpenFlow)
NBI
Figure 5.2: SDN architecture
Network intelligence is (logically) centralised in SDN controllers, which maintain a global view of the
network. As a result, the network appears to the applications and policy engines as a single, logical
switch. With SDN, enterprises and carriers gain vendor-independent control over the entire network
from a single logical point, which greatly simplifies the network design and operation. SDN also
greatly simplifies the network devices themselves, since they no longer need to understand and
Network Dynamicity
Deliverable D13.1 Research and Study Network Technologies – White Paper Document Code: GN4-1-16-7D602 56
process thousands of protocol standards but merely accept instructions from the SDN controllers. A
comparison between conventional networking and SDN is shown in Table 5.1.
Characteristics Conventional Networking Software Defined Networking
Features Data and control planes are customised in each node. For each problem a new protocol is proposed with complex network control.
Segregates the data plane from the control plane with a centralised programmable controller that makes the network control simple.
Configuration When new equipment is added into the existing network, the heterogeneity of the network devices’ manufacturers and configuration interfaces requires a certain level of manual configuration procedures, which is tedious and error prone.
Unification of the control plane over all kinds of network devices, including routers, switches and load balancers, permits automated configuration with centralised validation via software controlling. As such, an entire network can be programmatically configured and dynamically optimised based on network status.
Performance Due to heterogeneity among networking devices and coexistence of various technologies, optimising the performance of the network as a whole is difficult.
Provides an opportunity to improve network performance globally with centralised control and by having a feedback mechanism to exchange information among different tiers of the networking architecture.
Innovation Difficulties are encountered while implementing new ideas and design due to widely used proprietary hardware, which prevents modification for experimentation and adoption.
Comparatively, SDN encourages implementation of new ideas, applications and new revenue-earning services conveniently and flexibly through the programmable network platform.
Cost Both data and control planes are embedded on the switches, thereby making the switch more complex and costly.
Data plane and control planes are decoupled from each other which makes the structure of the switches simpler and easier to manufacture, which in turn leads to a lower-cost solution.
Table 5.1: Conventional networking and SDN comparison
The SDN approach has become very natural for store and forward packet networks, especially in the
core-metro segments and, more recently, also in the access segment. The extension of the SDN
architecture for optical networks poses several challenges. One of the key challenges in designing
and operating optical networks is the interaction, control and management between the optical and
packet layers.
Multiple standards bodies are currently working on developing SDN standards for the optical
network. The two main standards/protocol efforts related to SDN in the optical network are
generalised multi-protocol label switching (GMPLS) and OpenFlow:
Network Dynamicity
Deliverable D13.1 Research and Study Network Technologies – White Paper Document Code: GN4-1-16-7D602 57
GMPLS is often used as the control plane for optical switching; it is a proposed IETF standard
to simplify the creation and management of IP services over optical networks, and it is often
used as the control plane for optical switching.
SDN/OpenFlow was designed specifically for packet transport and needs modification to
provide SDN-like control to the optical layer.
The Optical Transport working group within the Open Networking Foundation (ONF) is addressing
SDN/OpenFlow control capabilities for optical transport networks [50]. The work includes identifying
use cases, defining a target reference architecture for controlling optical transport networks
incorporating OpenFlow, and creating OpenFlow protocol extensions. The identified use cases are:
Direct control of optical components in enterprise networks.
Carrier Ethernet network virtualisation.
Service provider datacentre interconnection.
Packet-optical integration.
Nevertheless, services such as content distribution, distributed databases, or inter-datacentre
connectivity place a set of new requirements on the operation of networks. They need on-demand
and application-specific reservation of network connectivity, reliability and resources (such as
bandwidth) in a variety of network applications (such as point-to-point connectivity, network
virtualisation or mobile back-haul) and in a range of network technologies from packet down to
optical. An environment that operates to meet these types of requirements is said to have
application-based network operations (ABNO) [51]. ABNO brings together many existing
technologies and may be seen as the use of a toolbox of existing components enhanced with a few
new elements. Some identified use cases are:
Inter-AS connectivity.
Pseudo-wire operations and management.
Multi-layer networking.
Network re-optimisation and adaptive network management.
Cross-stratum optimisation.
Virtual network topologies operations and management.
ABNO includes a provisioning manager responsible for the establishment of connections either by
giving instructions to a GMPLS control plane running in the networks or by programming individual
network devices. In the latter case, the provisioning manager would act as an OpenFlow Controller.
In addition, the current network architecture will need to evolve to include a functional block
between the service layer and the network elements to support multi-service provisioning in multi-
vendor and multi-technology scenarios. Two standard interfaces are required. First, the northbound
interface (NBI), which, among other tasks, gives an abstracted view of the network, enabling a
common entry point to provision multiple services and to provision the planned configuration for
the network. Moreover, this interface allows coordination of the network and service layer
according to service requirements. Second, the southbound interface (SBI), covering provisioning,
monitoring and information retrieval.
Network Dynamicity
Deliverable D13.1 Research and Study Network Technologies – White Paper Document Code: GN4-1-16-7D602 58
5.1.2 ONF View on Transport Extensions
The potential of SDN, owing to its separation of control and data layer, is already visible in the
packet world, with major vendor and service providers stepping forward to support products and
services based on SDN technologies. The advantages of SDN for optical transport over existing
control plane solutions, namely GMPLS, have been shown to be substantial with regard to several
specific aspects. An SDN-based architecture can simplify the complexities of handling traffic among
various networking technologies. It allows the underlying infrastructure to be abstracted and used
by applications and network services as a virtual entity. This allows network operators to define and
manipulate logical maps of the network, creating multiple co-existing network slices (virtual
networks) independent of underlying transport technology and network protocols. Furthermore, the
separation of the control plane and data plane makes SDN a suitable candidate for an integrated
control plane supporting multiple network domains and multiple transport technologies. The
architecture is not only well suited to address the present optical networking problems related to
supporting different administrative and technology segments, bridging the gap between packet and
optical layers, but it also supports new operations such as virtualisation, cross-layer orchestration,
bandwidth on demand (BoD), load balancing and many more.
Due to the unique analogue features of the optical layer, various static and dynamic attributes and
properties (e.g. modulation format, capacity, power, impairments) need to be considered in the
process of optical resource abstraction. Depending on the type of the optical transmission and
networking elements involved and the requirements of the upper layer operations, different levels
of abstraction (i.e. the amount of information to be exposed to the upper layer) need to be defined.
One of the key challenges of optimally using the optical infrastructure is to create an abstracted
optical resource model and describe it in a way that is simple enough for the higher control layer to
utilise it while capturing the true properties of the distributed non-linear, noisy and dispersive
analogue optical channel. Existing models are often conservative or over-simplified, and targeted to
direct-detection systems, now superseded by digital coherent transmission systems. A key challenge
here is to develop simplified models for the optical physical layer, starting from an understanding of
the underlying physics of the optical channel and the optical layer analogue characteristics.
Within this technological context, the target of a unified, centralised control plane involves, on the
one hand, extending the OpenFlow protocol to support circuit switching (that is, where a dedicated
communications channel or circuit is established between end points) and, on the other hand,
ensuring that operator use cases and workflows are fully covered. This is of importance since the
operation of an optical transport network is significantly different to the operation of a packet
switched network. For example, the former usually involves operator intervention before
provisioning a new optical connection, and the lifetimes of services are on different timescales.
From a standardisation perspective, extending OpenFlow for optical networks is perceived to be a
difficult task, given the intrinsic complexity of the optical technology. One of the reasons is that
there is no common, comprehensive, abstract model of optical devices, such as reconfigurable
optical cross-connects, nor the associated information and data models. That said, initial efforts are
being made by the ONF Optical Transport working group and other standards-developing
organisations, as well as in related research initiatives. In fact, the ONF Optical Transport working
group has been working internally on preliminary OpenFlow extensions for multi-technology
switches with GMPLS label encodings, complementing and adapted to OpenFlow 1.1. It is expected
Network Dynamicity
Deliverable D13.1 Research and Study Network Technologies – White Paper Document Code: GN4-1-16-7D602 59
that newer versions will improve the support of optical networks, in order to address, in a more
comprehensive way, identified requirements both for fixed- and flexi-grid, notably filter
configuration and configuration of cross-connections of media channels in media matrices.
The northbound abstraction is crucial not only for defining application-based services and policies
but also for integrating different technology and administrative domains, which are typical of
optical-based core networks. The two main aspects to consider for the NBI are the set of
functionalities that are exposed to external applications, together with the different interfaces that
determine the different mechanisms used to interact with them.
The application abstraction is a common-map abstraction, based on a data abstraction of a network-
wide common map manipulated by a network API. The common map has full visibility into both
packet and circuit switched networks, allowing creation of network applications that work across
multiple layers and multiple optical technologies. Full visibility allows applications to jointly and
globally optimise network functions and services across multiple layers and technologies.
Implementing network functions as centralised applications is simple and extensible, as the
common-map abstraction hides the details of state distribution (including east-west API for multiple
controllers) from the applications, allowing unified operation over multiple layers.
One way to represent information to applications is as graphs. A few implementations of transport
network controllers, such as the open network operating system (ONOS) [52] and packet and circuit
network convergence (PAC.C), use network graphs as the method to define northbound abstraction.
These graph abstractions help optical network control and management functions to utilise the
wealth of graph computation algorithms that are widely used in the optical world. Another added
benefit is to use existing and emerging PCE orchestration architectures to allow applications to
seamlessly define network requirements over multiple administrative and technology domains.
See also Appendix B for the latest document about OpenFlow transport extensions from ONF.
5.1.3 ABNO and Its Role as Orchestrator
Standardisation bodies, especially the IETF, have been working to address operators’ and NRENs’
requirements and, as a result, the application-based network operations (ABNO) architecture is now
being proposed as a candidate solution. The ABNO architecture consists of a number of standard
components and interfaces which, when combined together, provide a method for controlling and
operating the network. A simplified view of the ABNO architecture is represented in Figure 5.3. It
includes:
The ABNO controller as the entrance point to the network for NMS/OSS and the service
layer for provisioning and advanced network coordination. It acts as a system orchestrator,
invoking its inner components according to a specific workflow.
The path computation element (PCE) defined as an entity to serve path computation
requests. The PCE protocol (PCEP) might be used to carry path computation requests and
To control the network elements from the SDN controller, the OpenFlow protocol (OFP) has been
used. Since OFP v1.4, new properties in support of optical ports have been added, allowing
configuration and monitoring of the laser in the transmitter, and of frequency and power in the
receiver. These properties support optical ports in optical cross-connects (OXC). However, they do
not include modulation format support for the transmitters. In view of that, the Task has
implemented extensions to OFP v1.4 to support modulation formats in the form of EXPERIMENTER
properties. The following sub-sections define the extensions implemented in OFP v1.4.
Port Description
Regarding the port description, the standard ofp_port_desc_prop_optical currently retrieves
the port features (RX tunable, TX tunable, TX power adjustable, values specified in frequency or
wavelength units), minimum and maximum TX and RX frequency/wavelength, TX and RX grid spacing
in frequency or wavelength units, and minimum and maximum TX power. To extend those, Task 1
has implemented a new experimental property to obtain the modulation formats supported by the
port. The property is named ofp_port_desc_prop_experimenter_modulation_formats and
its structure is as follows:
struct ofp_port_desc_prop_experimenter_modulation_formats { uint16_t type; /* OFPPDPT_EXPERIMENTER. */ uint16_t length; /* Length in bytes of this property. */ uint32_t experimenter; /* Experimenter ID. */ uint32_t exp_type; /* Type=1 Modulation Formats Description. */ uint8_t num_mod_formats; /* Number of modulation formats supported. */ uint32_t mod_formats[0]; /* List of modulation formats supported. Each following
structure ofp_port_desc_prop_experimenter_modulation_format. */ uint32_t pad[0]; /* 64-bit alignment */ }; struct ofp_port_desc_prop_experimenter_modulation_format { uint16_t id; /* Identifier of the modulation format. */ uint16_t bits_per_symbol; /* Spectral efficiency in bits per baud. */ };
Network Dynamicity
Deliverable D13.1 Research and Study Network Technologies – White Paper Document Code: GN4-1-16-7D602 63
Port Configuration
Port configuration messages currently support the definition of configuration flags, central
frequency, offset, slot width and transmission power of the port, but not the desired modulation
format configuration. The Task has implemented a new experimental property to set the desired
modulation format of the port. The property is named
ofp_port_mod_prop_experimenter_modulation_format and its structure is as follows:
struct ofp_port_mod_prop_experimenter_modulation_format { uint16_t type; /* OFPPMPT_EXPERIMENTER. */ uint16_t length; /* Length in bytes of this property. */ uint32_t experimenter; /* Experimenter ID. */ uint32_t exp_type; /* Type=1 ModulationFormatConfiguration. */ uint16_t mod_format_id; /* Modulation format id. One from Modulation Formats Description. */ float_t symbol_rate; /* Symbol rate in bauds/s formatted as an IEEE 32 bit float */ uint16_t num_subcarriers; /* Number of subcarriers used. */ uint16_t bits_per_symbol; /* Bits per symbol as reported in Modulation Formats Description. */ uint32_t pad[0]; /* 64-bit alignment */ };
Optical Frequency Slot Matching
The optical label for WDM specifies the grid identifier, the channel spacing and the nominal central
frequency index, as defined in IETF RFC6205 [53]. In the case of the flexible grid technology, an extra
field defining the slot width has to be included, as defined in [54].
In the demonstrator, the Task has used a 20-bit MPLS-like label, the structure of which actually
depends on the technology used.
0 1
0 1 2 3 4 5 6 7 8 9 0 1 2 3 4 5 6 7 8 9
+-+-+-+-+-+-+-+-+-+-+-+-+-+-+-+-+-+-+-+-+
|GR | CS | n | t | RES |
+-+-+-+-+-+-+-+-+-+-+-+-+-+-+-+-+-+-+-+-+
0 1
0 1 2 3 4 5 6 7 8 9 0 1 2 3 4 5 6 7 8 9
+-+-+-+-+-+-+-+-+-+-+-+-+-+-+-+-+-+-+-+-+
|GR | n | m | t |
+-+-+-+-+-+-+-+-+-+-+-+-+-+-+-+-+-+-+-+-+
WDM label format Flexible grid label format
The fields in the label are as follows:
Grid (GR, 2 bit): Supported values are 01 for ITU-T DWDM, 10 for ITU-T CWDM, 11 for flexible
grid and 00 is a reserved value.
Channel Spacing (CS, 3 bits): Supported values are 001 for 100 GHz, 010 for 50 GHz, 011 for
25 GHz, 100 for 12.5 GHz, 101 for 6.25 GHz, and 000 is a reserved value. For flexible grid
technology, this field is assumed to be 6.25 GHz.
Network Dynamicity
Deliverable D13.1 Research and Study Network Technologies – White Paper Document Code: GN4-1-16-7D602 64
Nominal Central Frequency index (n, 9 bits): The maximum spectrum width is 4 THz; when
using 6.25 GHz slices, 640 possible indexes need to be representable. The reference central
frequency, e.g. 193.1 THz, corresponds to n=0; n is a signed integer in two-complement
notation, thus requiring 9 bits for its representation. The nominal central frequency is
computed as 193.1 THz + n x CS / 1000.
Slot Width (m, 6 bits): This field is used only in flexible grid technology. The field size for m
has been computed to allow encoding a 1 Tb/s connection that, using the worst modulation
format, e.g. QPSK, requires 20 frequency slices of 12.5 GHz.
Ethernet Type (t, 3 bits): This field is not required by the IETF label format, but it is required
in Task 1’s integrated demonstrator since, when enveloping an Ethernet frame in an MPLS
frame, its Ethernet type, e.g. ARP, IP, IPv6, IGMP, MPLS, etc. field is substituted by MPLS,
thus preventing the reconstruction of the original frame at the receptor. For this reason, a
field used to encode the original frame protocol was added. Supported values are: 0000 for
ARP, 0001 for IP, 0010 for IPv6, 0011 for IGMP and 0100 for MPLS. Remaining values are
reserved for future use.
End-to-End Management
In the case of a multi-domain/-layer network, a network orchestrator needs to be configured on top
of the set of single-layer/-domain SDN controllers. To that end, the SDN controllers must export the
underlying network topology and resources to the controller, so that an end-to-end view of the
network can be created. The IETF is currently working on defining data models to specify optical
networks based on YANG. Since YANG model definitions are still not defined, the Task decided to
implement a REST/API in the demonstrator, so that the SDN controllers can export their topology
and resources.
A different REST/API needs to be developed to set up, update or tear down an LSP. For the set-up
operation an LSP identifier (symbolic path name) the end-points of the LSP and the explicit route
object (ERO) needs to be provided. For the update operation, the LSP’s symbolic path name and the
new ERO are enough. For the tear-down operation, the LSP’s symbolic path name is enough.
Demonstrator Deployment
The demonstrator to test the single-layer/-domain functionality described above has been
experimentally implemented using Ryu SDN controller v3.25, since it supports all available OFP
versions as well as the standardised optical port extensions. Controller applications developed for
the Ryu controller use the cookie field in each flow configured in the network elements to identify
the LSP for which that rule is being configured. The controller application has been implemented in
Python and was configured with a northbound interface in the form of a REST API used to receive
requests from an orchestrator. In addition, a southbound interface to control the underlying
network elements has been configured to use OFP v1.4 with extensions to support WDM and
flexible grid technologies.
Mininet v2.1.0 has been used to orchestrate the deployment and configuration of each network
element in the topology. Each network element has been deployed using an OpenVSwitch v2.4.0
bridge with the optical extensions for WDM and flexible grid technology emulation. The Task
emulated the transmission of an optical signal by encapsulating each Ethernet frame being
Network Dynamicity
Deliverable D13.1 Research and Study Network Technologies – White Paper Document Code: GN4-1-16-7D602 65
converted from electrical to optical into an MPLS-like frame where the MPLS label encoded the
optical spectrum label. Intermediate OXCs switched the frame according to that MPLS label and, at
the receiver, the MPLS label is removed to restore the original Ethernet frame.
Network Orchestrator
L0 Ryu SDN Ctrl
OpenFlow
NBI API
REST/API
Optical Network
OFP
X1
X2
X3
TP1
P2P1 P2
P1
TP2
LSP:id = “X1-X3-1”src = X1/TP1dst = X3/TP2ero = X1/P1 – X2/P2 – X3label = n, m
Figure 5.6: Example of LSP setup
When the network orchestrator needs to set up an LSP, it computes the LSP’s explicit route object
(ERO), containing the resource assignment for that LSP along a route. For instance, in Figure 5.6, the
LSP to be set up is between X1/TP1 and X3/TP2. Upon the reception of an ERO in the SDN controller,
the ERO is used to configure the transmitter and receiver transponders and contains the source and
destination end points specifying the node and its port. In the example in Figure 5.6, the source port
is transponder TP1 in X1 and the destination port is transponder TP2 in X3. The ERO defines the set
of individual connections to be set up in every OXC along the route and includes a label defining the
frequency slot that must be used for the LSP along the route.
5.2 The NORDUnet UNINETT Use Case
This use case was selected for investigation because it represents a typical situation in a packet-
optical network, where routing might not be optimal because of lack of coordination between the
path calculation elements of different network layers.
5.2.1 The Problem
NORDUnet use three routers (R-USI, R-OSC, and R-TUG) for providing IP connectivity to UNINETT
(Figure 5.7)2.
2 The case description was provided by Alberto Colmenero and Rasmus Lund from NORDUnet.
Network Dynamicity
Deliverable D13.1 Research and Study Network Technologies – White Paper Document Code: GN4-1-16-7D602 66
Figure 5.7: Packet and optical layers of NORDUnet
IP-traffic from NORDUnet to UNINETT is aggregated by R-TUG and sent to a UNINETT destination
either through the R-TUG–R-USI primary connection (cost 10) or the R-TUG–R-OSC primary
connection (cost 100). Both connections use the OTN/DWDM infrastructure circuits and have 10G
capacity. The R-TUG–R-USI connection uses the direct TUG–USI circuit while the R-TUG–R-OSC
connection uses the compound circuit TUG–FRE–ORE–UNI–OSC. The cost of the connections reflects
the characteristics of the circuits they use, such as distance, number of spans, delays; that is why the
cost of the R-TUG–R-OSC connection is 10 while the cost of the R-TUG–R-OSC connection is 100.
Optical boxes (TUG, USI, OSC and others) have 10GE tributary ports to provide connections with IP
routers and 100G line ports with ODU4 framing for inter-connections. Within optical boxes, IP traffic
maps onto ODU2e frames that are then multiplexed into the respective time slots of the ODU4
signal.
Under normal conditions, router R-TUG sends IP packets to UNINETT through router R-USI, as the
cost of this route (10) is less than the cost of the alternative route through router R-OSC (100).
The problem with a non-optimal routing arises when an outage in the fibre between USI and TUG
takes place. The OTN layer of the NORDUnet optical network has a GMPLS control plane, which is
used for rerouting OTN circuits in the event of fibre and wavelength faults. So, when the OSPF
protocol detects a loss of connectivity along the TUG–OSC OTN circuit, it recalculates a route and
sets up a backup one. In this example case, the backup circuit goes around the fibre ring along the
TUG–FRE–ORE–UNI–OSC–USI route.
For the IP routers, the rerouting happening at the OTN layer remains invisible and router R-TUG
keeps sending IP packets towards UNINETT through router R-USI, as this route still has a cost of 10.
In fact, after the rererouting, router R-TUG should have sent traffic to UNINETT through router R-
OSC, as this route at the OTN layer has better characteristics (hop number, distance, delay) than the
route through R-USI. However, to do so, the routers would have to have known the corrected costs
of the OTN circuits, but such an information exchange in automatic mode between the IP and OTN
layers is not supported by NORDUnet network equipment (Juniper routers and Ciena OTN/DWDM
Network Dynamicity
Deliverable D13.1 Research and Study Network Technologies – White Paper Document Code: GN4-1-16-7D602 67
boxes at the moment. As a result the route from R-TUG towards UNINETT destinations remains
non-optimal, one optical hop longer than an alternative route through R-OSC and hence resulting
in longer delays of signal propagation along a route. Such a situation takes place until the manual
intervention of an IP administrator who corrects the route costs according to the information passed
to him or her by an ONP/DWDM network administrator – an informal procedure, which might take
too much time and involve mistakes.
5.2.2 The SDN Solution
The problem described above is not specific to NORDUnet, as historically the IP control plane
worked on its own, without any interaction with the optical layers. The following sub-sections
summarise the current situation and developments with regard to layer interaction to establish the
context for then considering SDN as a natural way to effective routing in multi-layer packet-optical
networks.
Manual Interaction of Layers
Usually, the packet and optical networks of a network provider (if it owns both) are managed by two
different teams of network administrators (sometimes by two different Network Operations Centres
(NOCs)). The optical network administrators establish circuit-based connections for IP routers
according to requests from the packet network administrators, who specify the end points and
bandwidth of a connection. If the packet network administrator who makes such a request takes
into account the topology of the optical network, the resulting route might be optimal or close to
optimal. However, if such a request is made in “blind” mode, i.e. without knowledge of the optical
network topology, the result could be quite far from optimal.
GMPLS-Based Layer Interaction
The introduction of GMPLS brought an automatic interaction between the control planes of packet
and optical networks. However, the main model of the IP-GMPLS interaction functionality, called the
overlay model, is very close to the manual blind mode described above. In the overlay model, the IP
control plane has a limited view of the optical network topology, seeing only the entry points of the
optical network, to which routers are connected, and makes a request to the optical GMPLS control
plane to set up a circuit between two of those entry points. The effectiveness of the resulting
combined route going through IP-OTN-DWDM layers as in the manual blind mode depends to some
extent on luck.
Another GMPLS model – the peer model – assumes that all the nodes of both networks have full
knowledge about the layerless topology of the combined packet-optical network. In such a case the
routing might be optimal; it depends on the routing protocol used but, in principle, having the full
topology information available at each network node potentially allows effective routing to be
achieved. The implementation of the peer GMPLS model faces several challenges:
The IP and underlying optical network can be under different administrative control – such a
situation was very typical in the past; now more and more providers own and control both
types of networks.
Network Dynamicity
Deliverable D13.1 Research and Study Network Technologies – White Paper Document Code: GN4-1-16-7D602 68
All network nodes – IP routers and OTN/DWDM switches – have to support GMPLS protocols;
for routers this is not common, as GMPLS protocols differ from the standard IP control plane
protocols.
The complexity of the path calculation task grows significantly with the addition of extra
nodes and links to the combined network topology graph; this could be too heavy a task for
network nodes.
Because of these challenges, development of the GMPLS technology and its applications mostly
stuck to the overlay model and hence cannot make use of the potential benefits of routing based on
a global view of the packet-optical network topology.
SDN-Based Layer Interaction
The SDN paradigm assumes the logically centralised control of a network. One of the consequences
of this paradigm is that it provides a natural way to control all network layers from a single point (the
SDN controller) that has a global view of the network as a whole and optimises its behaviour
accordingly.
The global view of a packet-optical network can be achieved through two kinds of generalisation [55]:
A common-flow abstraction that generalises packet flows and circuit flows.
A common-map abstraction that allows a packet-optical topology to be presented as a flat
layerless map.
The benefits of a global view of a packet-optical network are multi-faceted as such a view allows
different aspects of network behaviour to be optimised, including establishing optimal routes for
compound (packet-circuit-packet) flows on an end-to-end basis.
SDN control of a packet-optical network based on a generalised layerless topology is similar to the
GMPLS peer model approach but it copes better with the challenges described above:
Network nodes do not need to run complex GMPLS protocols. Instead, they need only
comply with an SDN switch specification (e.g. from ONF) and support an SDN controller-
switch protocol (e.g. OF).
The increased complexity of the path calculation due to the increased dimension of the
combined network graph is not a big problem for the centralised computational power of an
SDN controller: to deploy one or several very powerful computers running a path
computation element (PCE) application is much simpler than increasing the computational
power of each network node.
Of course, as with a GMPLS peer model, an SDN layerless global approach cannot help if the packet
and optical networks are under different administrative control.
SDN-based control of a packet-optical network can use an overlay approach too. In such a case there
are two separate topology databases, one for the packet network and one for the optical network
[51]. Two different SDN controllers control their respective networks separately but coordinate their
work if necessary. For example, when an IP SDN controller needs to set up a new link between
Network Dynamicity
Deliverable D13.1 Research and Study Network Technologies – White Paper Document Code: GN4-1-16-7D602 69
routers, it makes a request to an optical SDN controller specifying the end points and bandwidth of a
connection.
Taking an SDN Layerless Approach to the NORDUnet Use Case
Taking an SDN layerless approach to the NORDUnet use case results in the topology shown in Figure
5.8. The topology includes both physical and virtual elements of the combined network. The physical
elements are represented by physical ports and links – fibres between routers and tributary 10GE
ports of the optical nodes. Virtual elements are wavelengths of the DWDM and time-slots of the
OTN layers and virtual ports.
A virtual port maps data between layers. For example, virtual port 1 of the TUG optical node maps
incoming packets of a packet flow onto ODU2e frames. Virtual port 2 of TUG maps ODU2e data onto
time-slots of an ODU4 frame of one of the wavelengths outgoing from one of the TUG 100G ports.
Figure 5.8: A global view of the NORDUnet layerless topology
An example of several first hops of a path of flow 3 going through R-TUG packet port 2 and then
through TUG and FRE towards R-USI might look like this: