Amy Clewell,1 Gábor Hirka,2 Róbert Glávits,2 Philip A. Palmer,1 John R. Endres,1
Timothy S. Murbach,1 Tennille Marx,1 and Ilona Pasics Szakonyiné2
1AIBMR Life Sciences, Inc., 2800 East Madison Street, Suite 202, Seattle, WA 98112, USA2Toxi-Coop Zrt., Magyar Jakobinusok tere 4/B, Budapest 1122, Hungary
Correspondence should be addressed to Amy Clewell; [email protected]
Received 19 May 2016; Revised 11 July 2016; Accepted 21 July 2016
A 90-day repeated-dose oral toxicological evaluation was conducted according to GLP and OECD guidelines on the methyluratepurine alkaloid theacrine, which is found naturally in certain plants. Four groups of Hsd.Brl.Han Wistar rats (ten/sex/group)were administered theacrine by gavage doses of 0 (vehicle only), 180, 300, and 375mg/kg bw/day. Two females and one malein the 300 and 375mg/kg bw/day groups, respectively, died during the study. Histological examination revealed centrilobularhepatocellular necrosis as the probable cause of death. In 375mg/kg bw/day males, slight reductions in body weight development,food consumption, and feed efficiency, decreased weight of the testes and epididymides and decreased intensity of spermatogenesisin the testes, lack or decreased amount of mature spermatozoa in the epididymides, and decreased amount of prostatic secretionswere detected at the end of the three months. At 300mg/kg bw/day, slight decreases in the weights of the testes and epididymides,along with decreased intensity of spermatogenesis in the testes, and lack or decreased amount of mature spermatozoa in theepididymides were detected in male animals. The NOAEL was considered to be 180mg/kg bw/day, as at this dose there were notoxicologically relevant treatment-related findings in male or female animals.
1. Introduction
Theacrine (1,3,7,9-tetramethyluric acid) is a methylurate,which is a class of purine alkaloids similar in structure tomethylxanthines such as caffeine. Theacrine is often foundas a methylated and oxidized metabolite of caffeine inmethylxanthine-producing plants [1]. The two prominenttheacrine-containing foods in the human diet are the fruitsand seeds of Theobroma grandiflorum (cupuacu) and kuchagreen tea from the leaves of Camellia kucha (Camelliaassamica var. kucha) [2–8]. Kucha tea leaves have historicallybeen consumed in certain regions of China as a tea and“healthy beverage” [9–11].The theacrine content of expandingbuds and young leaves of kucha has been reported as ∼2.8%of dry weight and the content of mature leaves as ∼1.3%[2, 3, 11]. As an estimate of possible exposure to theacrinefrom kucha tea, if one were to assume 2-3 grams of tea isused per cup at a theacrine content of 2.8%, a cup of tea
would contain approximately 56–84mg of theacrine (equiv-alent to 0.8–1.2mg/kg bw for a 70 kg person). Radiolabelledexperiments show that theacrine is synthesized from caffeinein some plants including kucha [2, 4]. Levels of theacrinein cupuacu plant parts are not well-characterized in theliterature.
Only limited research, primarily in cell and animal lines,is available to highlight any potential impact theacrine mayhave when ingested by humans. Preliminary data from aseven-day oral repeated-dose study by Feduccia et al. [12]demonstrated that theacrine increased locomotor activityin rats while an older study showed a potential biphasicdose-response curve with regard to its effects on activityin mice [13]. Mechanistically, theacrine appears to haveadenosine receptor antagonist activity [12]. Other reportshave highlighted theacrine’s potential to exert dopaminergicand other neurochemical activity suggesting dose-dependent
Hindawi Publishing CorporationJournal of ToxicologyVolume 2016, Article ID 6206859, 17 pageshttp://dx.doi.org/10.1155/2016/6206859
2 Journal of Toxicology
anti-inflammatory, antifatigue, analgesic, and mood enhanc-ing bioactivity, although studies in humans are lacking [14–16].
Theacrine exhibited hepatoprotective effects in a stress-induced liver damage mouse model as well as strong antiox-idant capacity in vitro and in vivo [3, 17]. In oppositionto effects typically seen with caffeine [18, 19], Feduccia etal. showed that intraperitoneal injections of up to 48mg/kgtheacrine did not induce sensitization or tolerance of itsphysiologic effect over the seven-day period of the study [12].
Few studies on the safety of theacrine were foundin a comprehensive literature search. Brief results of anacute toxicity study in mice were published in whichthe authors calculated the LD
50of orally administered
theacrine as 810.6mg/kg bw (95% confidence interval 769.5–858.0mg/kg bw) [14]. Similar to other purine alkaloids,theacrine was reported to induce chromosomal aberrationsin onion root tips, in Vicia faba cells treated during theG2 stage of interphase and in Chinese hamster cells [20,21]. However, no genotoxicity was found in an in vivomouse micronucleus study at theacrine concentrations up to325mg/kg bw [22].
In contrast to results observed using C. sinensis (31 g/kgcaffeine and 0 g/kg theacrine), intragastric administrationof water extracts of theacrine-containing teas including C.assamica var. kucha (3 g/kg caffeine and 22 g/kg theacrine)did not lead to increases in blood pressure and heart ratein spontaneously hypertensive rats [10]. When rats weregiven 30mg/kg caffeine, theobromine, or theacrine, only thecaffeine treatment had a significant effect on cardiovascularparameters [10].
In a human study of 60 healthy men and women,theacrine was given daily (200 or 300mg) for eight weeks [23,24].The two doses are equivalent to 2.6 and 3.8mg/kg bw/day,respectively, for a 78 kg human (the average weight for maleand female subjects in the study). Primary outcomes includedfasting clinical safety markers (heart rate, blood pressure,lipid profiles, and hematologic and liver/kidney/immunefunction biomarkers), all of which fell within normal limitswith no group × time interactions and no differences in sideeffect profiles as compared to controls. Theacrine was alsogiven to 15 healthy subjects in a randomized double-blindedcrossover study [25, 26]. A single 200mg dose (or placebo)was administered, and side effect reports, hemodynamics,and biochemical markers of safety were collected over a 3-hour postdosing period, with no significant findings noted.Six subjects additionally participated in a separate 7-dayopen-label repeated-dose study comparing 100, 200, and400mg of theacrine, in which no side effects were noted[25, 26].
To investigate further the safety of oral consumption oftheacrine, in the current work we report the results of a90-day repeated-dose oral subchronic toxicity study in theWistar rat.
2. Material and Methods
The 90-day study was conducted according to OECDGLP (ENV/MC/CHEM (98)17; OECD, Paris, 1998) and in
compliance with OECD 408 (adopted 21st September 1998;90-day study) [27] andUSFDARedbook 2000, IV.C.4.a (2003;90-day study) guidelines [28]. Care and use of study animalswere in compliancewith the laboratory’s Institutional AnimalCare and Use Committee, the National Research CouncilGuide for Care and Use of Laboratory Animals [29], and theprinciples of the Hungarian Act 2011 CLVIII (modification ofHungarian Act 1998 XXVIII) regulating animal protection.
Synthetic 1,3,7,9-tetramethyluric acid (CAS number2309-49-1; ≥98% pure as measured by high performanceliquid chromatography (HPLC), proton nuclear magneticresonance, and liquid chromatography-mass spectrometrymethodologies) was supplied as the branded productTeaCrine� for use as the test article by its manufacturer(Compound Solutions, Inc., Carlsbad, CA). TeaCrine isa commercially available white crystalline powder. A 24-month stability study on this product was conducted at25 ± 2
∘C with 60 ± 10% relative humidity under conditionsof commercial packaging and the compound remainedstable throughout the testing period (data not shown).Batch number 48-KY20141102, which met all commercialspecifications for the product (including ≥98% purity, ≤1%loss on drying, ≤0.5% residue on ignition, and commerciallimits for heavy metals and microbial counts) was utilizedfor the study within the two-year shelf-life date. The specificpurity level of this batch (per HPLC analysis) was 99.5%.
The dose levels of theacrine utilized in the study were375, 300, and 180mg/kg bw/day. These doses were chosenbased on an unpublished 14-day repeated-dose oral toxicitystudy in Wistar rats that utilized ten animals per group (fiverats/sex/group).The highest dose group of 500mg/kg bw/dayresulted in mortality of 5 of 5 males and 3 of 5 females andtremors in all animals; additionally one male animal diedin the 400mg/kg bw/day group. Remaining animals in the400, 350, and 200mg/kg bw/day groups survived withouttoxicological signs, and the NOAEL of the 14-day study wasdetermined to be 350mg/kg bw/day. Based on the results ofthis study and OECD 408 guidelines stating that the highestdose level should be chosen with the aim to induce toxicitybut not death or severe suffering, the high dose for the 90-day study was selected as 375mg/kg bw/day. The guidelinessuggest a descending dose sequence aiming to demonstrateany dose-related responses and a NOAEL at the lowest doselevel. While the guidelines state that twofold to fourfoldintervals are frequently optimal for setting descending doselevels, in this case smaller intervals were utilized due tothe narrow dose range in which adverse events appearedin the 14-day study and with an aim to detect the highestNOAEL possible (which a broader interval may have missed)to allow assessment of the margin of safety of doses used inhuman studies, such as the 200–300mg per day dose (2.6–3.8mg/kg bw/day for a 78 kg human) used in the study byTaylor et al. [24], which did not result in adverse events orfindings in clinical safety markers.
The test article doses were prepared by suspendingtheacrine in 1% aqueous methylcellulose to achieve con-centrations of 18, 30, and 37.5mg/mL in order to providea constant dosing volume of 10mL/kg bw. Doses were pre-pared daily by careful weight measurement and administered
Journal of Toxicology 3
within four hours. The control group received the samevolume of 1% methylcellulose vehicle only.
Male and female SPF Hsd.Brl.Han Wistar rats (Toxi-Coop, Budapest, Hungary) were housed individually, witha 12-hour light-dark cycle at 19–25∘C and 30–70% relativehumidity, in type II polypropylene/polycarbonate cages withLignocel� certified laboratory wood bedding. Cages were22 cm (width) by 32 cm (length) by 19 cm (height), and cagesand bedding were changed weekly. Animals received ssniff�SMR/M-Z+H complete diet for rats andmice and potable tapwater ad libitum.The animals were acclimated for seven daysprior to the start of dosing.
At the start of the experimental period, animals wereapproximately seven weeks old and weighed 206–233 g(males) and 131–151 g (females). Eighty male and female ratswere stratified by body weight and randomly assigned tofour dose groups containing 10 rats/sex/group.Theacrine wasadministered by gavage daily each morning at doses of 0(vehicle-control), 180, 300, or 375mg/kg bw/day.
Animals were observed twice daily for morbidity andmortality. General cage-side observations for clinical signswere made on two occasions during the acclimation periodand once daily during the dosing period, at approximately thesame time each day, after administration of the test article.Detailed clinical observations were conducted once weekly,and a functional observational battery (FOB) was performedduring the final week to assess parameters such as generalphysical condition and behavior, response to handling, sen-sory reactions to various stimuli, grip strength, and motoractivity [30]. Measurements of body weight were conductedtwice during the acclimation period, on the first experimentalday prior to treatment, twice weekly during weeks 1–4, oncea week during weeks 5–13, and immediately prior to sacrifice.Food intake was determined and food efficiency calculatedonce weekly. Ophthalmological examination was carriedout on all animals prior to the experimental period andprior to study termination in control and high-dose groupanimals.
After an overnight fast (approximately 16 hours) follow-ing final administration of the test article, three blood sampleswere collected from the retroorbital venous plexus underIsofluran CP� (CP-Pharma Handelsgesellschaft GmbH, Ger-many) anesthesia (0.25mL in tripotassium ethylenedi-aminetetraacetic acid tubes for hematology measurements,1.0mL in sodium citrate tubes for blood coagulation mea-surements, and 2.5mL in serum separator tubes for clin-ical chemistry measurements) after which the animalswere euthanized by exsanguination from the abdomi-nal aorta. Blood samples were analyzed for hematologic[hematocrit (HCT), hemoglobin (HGB), red blood cell(RBC), white blood cell (WBC), white blood cell differ-ential (neutrophils (NEU), lymphocytes (LYM), monocytes(MONO), eosinophils (EOS) and basophils (BASO)), platelet(PLT), mean corpuscular volume (MCV), mean corpuscularhemoglobin (MCH), mean corpuscular hemoglobin concen-tration (MCHC), and reticulocyte (RET)], blood coagulation(activated partial thromboplastin time and prothrombintime) and clinical chemistry [sodium (Na+), potassium (K+),glucose (GLUC), cholesterol, urea concentration, creatinine
(CREA), total protein (TPROT), albumin (ALB), alanineaminotransferase (ALT), aspartate aminotransferase (AST),alkaline phosphatase (ALP), gamma glutamyl transferase(GGT), total bilirubin (TBIL), albumin/globulin ratio, bileacids, calcium (Ca++), chloride (Cl−), and inorganic phos-phate (Pi)] parameters. Gross pathological examinations anddeterminations of selected absolute organ weights (liver,kidneys, adrenals, testes, epididymides, thymus, spleen,brain, heart, uterus with fallopian tubes, ovaries, and thy-roid/parathyroid) were completed and relative organ weights(compared to body and brain weights) were calculated.Full histopathological examinations were conducted on thepreserved organs and tissues (adrenals, aorta, bone marrowof the femur, brain (cerebrum, cerebellum, pons, andmedullaoblongata), eyes, femalemammary gland, gonads (testes withepididymides and ovaries), heart, kidney, large intestines,liver, lungs, submandibular and mesenteric lymph nodes,quadriceps muscle, esophagus, nasal turbinates, pancreas,pituitary, prostate, submandibular salivary glands, sciaticnerve, seminal vesicle, skin, small intestines, spinal cordat three levels, spleen, sternum, stomach, thymus, thyroidand parathyroid, trachea and urinary bladder, and uteruswith vagina) of all animals of the control and high-dosegroups. The adrenal glands, testes, and epididymides werealso processed and examined histologically in all animals ofthe low- andmid-dose groups on the basis of themacroscopicobservations at the necropsy (pale adrenal glands and smallerthan normal testes and epididymides).
Statistical analyses were conducted using SPSS PC+software (SPSS, Inc., Chicago, IL). Bartlett’s homogeneity ofvariance test was used to assess heterogeneity of variancebetween groups and was followed by a one-way analysisof variance (ANOVA) if no significant heterogeneity wasdetected. Duncan’s Multiple Range test was used to assess thesignificance of intergroup differences if a positive ANOVAresult was obtained. Where significant heterogeneity wasdetected by Bartlett’s test, the Kolmogorov-Smirnov testwas performed to examine normally distributed data, andKruskal-Wallis nonparametric one-way ANOVA, followedby the Mann-Whitney U test for intergroup comparisonsof positive results, was used in the case of a nonnormaldistribution. A 𝑝 value of <0.05 was considered statisticallysignificant, and statistically significant results were reportedat 𝑝 < 0.05 and 𝑝 < 0.01 levels.
3. Results and Discussion
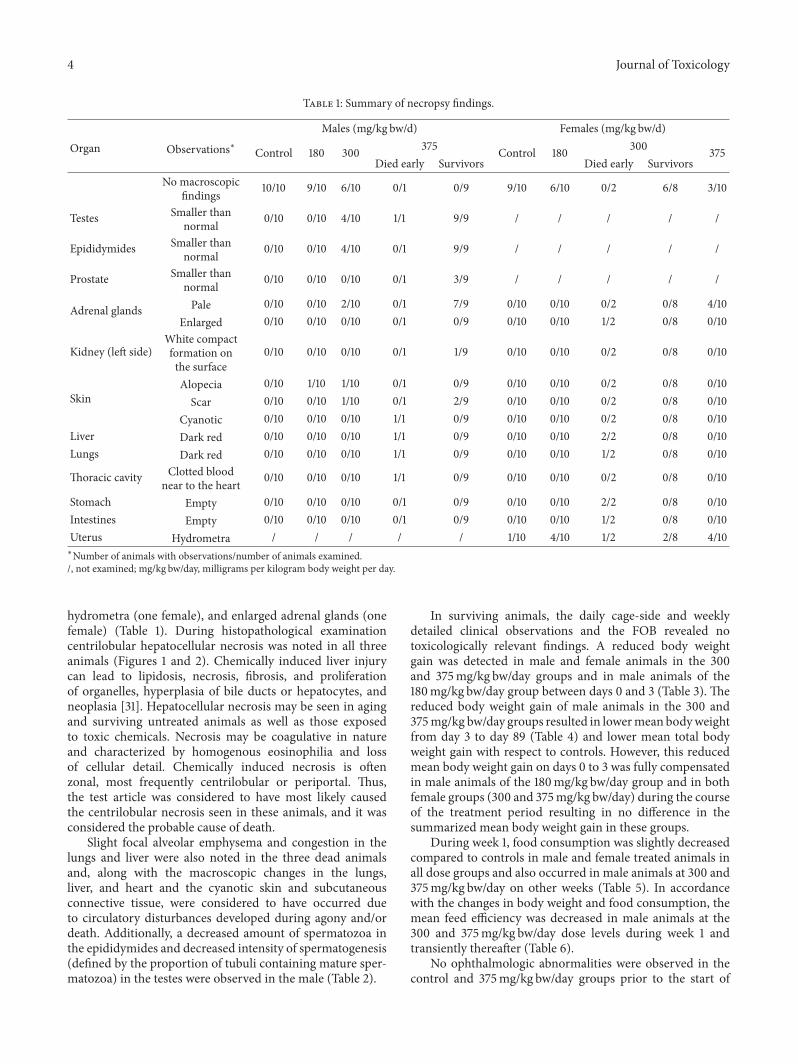
One male at 375mg/kg bw/day and two females at300mg/kg bw/day were found dead on days 42, 33, and67, respectively. There were no preceding clinical signs in thedead male and in one of the dead females. The other femaleexhibited a decrease in activity on the day before death.Necropsy observations of the dead animals revealed darkred liver (all) and lungs (male and one female), smaller thannormal testes (male), clotted blood in the thoracic cavitynear to the heart (male), cyanotic skin and subcutaneousconnective tissue on the lower part of the abdomen (male),empty stomach (both females) and intestines (one female),
4 Journal of Toxicology
Table 1: Summary of necropsy findings.
Organ Observations∗Males (mg/kg bw/d) Females (mg/kg bw/d)
Control 180 300 375 Control 180 300 375Died early Survivors Died early Survivors
Cyanotic 0/10 0/10 0/10 1/1 0/9 0/10 0/10 0/2 0/8 0/10Liver Dark red 0/10 0/10 0/10 1/1 0/9 0/10 0/10 2/2 0/8 0/10Lungs Dark red 0/10 0/10 0/10 1/1 0/9 0/10 0/10 1/2 0/8 0/10
Thoracic cavity Clotted bloodnear to the heart 0/10 0/10 0/10 1/1 0/9 0/10 0/10 0/2 0/8 0/10
Stomach Empty 0/10 0/10 0/10 0/1 0/9 0/10 0/10 2/2 0/8 0/10Intestines Empty 0/10 0/10 0/10 0/1 0/9 0/10 0/10 1/2 0/8 0/10Uterus Hydrometra / / / / / 1/10 4/10 1/2 2/8 4/10∗Number of animals with observations/number of animals examined./, not examined; mg/kg bw/day, milligrams per kilogram body weight per day.
hydrometra (one female), and enlarged adrenal glands (onefemale) (Table 1). During histopathological examinationcentrilobular hepatocellular necrosis was noted in all threeanimals (Figures 1 and 2). Chemically induced liver injurycan lead to lipidosis, necrosis, fibrosis, and proliferationof organelles, hyperplasia of bile ducts or hepatocytes, andneoplasia [31]. Hepatocellular necrosis may be seen in agingand surviving untreated animals as well as those exposedto toxic chemicals. Necrosis may be coagulative in natureand characterized by homogenous eosinophilia and lossof cellular detail. Chemically induced necrosis is oftenzonal, most frequently centrilobular or periportal. Thus,the test article was considered to have most likely causedthe centrilobular necrosis seen in these animals, and it wasconsidered the probable cause of death.
Slight focal alveolar emphysema and congestion in thelungs and liver were also noted in the three dead animalsand, along with the macroscopic changes in the lungs,liver, and heart and the cyanotic skin and subcutaneousconnective tissue, were considered to have occurred dueto circulatory disturbances developed during agony and/ordeath. Additionally, a decreased amount of spermatozoa inthe epididymides and decreased intensity of spermatogenesis(defined by the proportion of tubuli containing mature sper-matozoa) in the testes were observed in the male (Table 2).
In surviving animals, the daily cage-side and weeklydetailed clinical observations and the FOB revealed notoxicologically relevant findings. A reduced body weightgain was detected in male and female animals in the 300and 375mg/kg bw/day groups and in male animals of the180mg/kg bw/day group between days 0 and 3 (Table 3). Thereduced body weight gain of male animals in the 300 and375mg/kg bw/day groups resulted in lowermean bodyweightfrom day 3 to day 89 (Table 4) and lower mean total bodyweight gain with respect to controls. However, this reducedmean body weight gain on days 0 to 3 was fully compensatedin male animals of the 180mg/kg bw/day group and in bothfemale groups (300 and 375mg/kg bw/day) during the courseof the treatment period resulting in no difference in thesummarized mean body weight gain in these groups.
During week 1, food consumption was slightly decreasedcompared to controls in male and female treated animals inall dose groups and also occurred in male animals at 300 and375mg/kg bw/day on other weeks (Table 5). In accordancewith the changes in body weight and food consumption, themean feed efficiency was decreased in male animals at the300 and 375mg/kg bw/day dose levels during week 1 andtransiently thereafter (Table 6).
No ophthalmologic abnormalities were observed in thecontrol and 375mg/kg bw/day groups prior to the start of
Journal of Toxicology 5
(a) (b)
Figure 1: Intact (normal) hepatocytes around the central vein of a female rat at 375mg/kg bw/day at terminal sacrifice. Haematoxylin andeosin staining; magnification 200x (a) and 400x (b).
(a) (b)
Figure 2: Centrilobular necrosis (arrows) in the liver of a female rat at 300mg/kg bw/day found dead on day 33. Haematoxylin and eosinstaining; magnification 200x (a) and 400x (b).
dosing or at the end of the treatment period (data not shown).Statistically significant differences between treatment andcontrols were noted in some hematological and clinicalchemistry parameters in male and female animals and areshown in Tables 7 and 8, respectively. Statistically significantdifferences inMCHCandRETvalues as compared to controlsin males and RBC values in both males and females were notclearly dose-dependent and fell well within historical controlranges and were thus not considered toxicologically relevant.EOS values appeared to decrease dose-dependently withinhistorical ranges in both genders; however, decreases inthis value are not generally considered biologically relevant.Significant differences in MCV and MCH levels were slightand values remained within historical control ranges in the180mg/kg bw/day group (and were within or marginal tohistorical control ranges in the mid- and high-dose groups).Related hematological parameters such as HGB and HCTwere not different than controls, and no hematologically
related organ pathologies were noted. Thus the findings werenot considered toxicologically adverse.
Slight but statistically significant increases were observedin liver ALT and AST enzyme activities in the 300 (ALT)and 375 (ALT and AST) mg/kg bw/day groups. Similarly, themean CREA concentrations were slightly elevated in maletreated animals. These slight, apparently dose-dependentchangesmay be indicative of a test article effect onhepatic andrenal function; however, there were no related histopatho-logical changes in the kidneys or livers of these animals tosubstantiate their relevance, and the values all remained wellwithin historically normal ranges.
Interestingly, at lower doses in mice, theacrine (up to30mg/kg bw/day for seven days) was reported to protectagainst increases in ALT and AST levels induced by restraintstress [17]. Yet, in another recently published 90-day study,Crl: Sprague Dawley CD IGS rats given 150mg/kg bw/dayof the structurally similar compound, caffeine, also showed
6 Journal of Toxicology
Table 2: Summary of notable histopathology findings.
Organs Observations∗
Incidence of observations per groupDose groups (mg/kd bw/d)
Incidence of observations per groupDose groups (mg/kd bw/d)
Control 180 300 375 Control 180 300 375Survivors Died early Survivors Died early
Uterus Dilatation / / / / / 1/10 / / 0/2 4/9∗Number of animals with observations/number of animals examined./, not examined; BALT, bronchus associated lymphoid tissue; mg/kg bw/d, milligrams per kilogram body weight per day.
increases in AST, ALT, and CREA that fell within historicalcontrol ranges [32]. Significant differences in AST and ALTwere reported in a National Toxicology Program study inFischer 244 rats on caffeine at doses up to 287mg/kg bw/day;however, no dose-related patterns were established [33].Slight but significant increases in AST and ALT have alsobeen reported in humans with consumption of coffee [34],although coffee/caffeine consumption has also been associ-ated with protective effects against increases in liver enzymes(e.g., ALT) and liver protection in general [35–37]. Caffeine(and likely theacrine) is metabolized in the liver [33, 38] andthus high doses could theoretically have an effect on thisorgan due to high exposure chronically.
Other statistically significant differences in clinical chem-istry values in various dose groups were slight and consideredto be of little or no biological or toxicological relevance. Forexample, slight statistically significant differences inTBIL andK+, as compared to controls, occurred only in one gender,were not dose-dependent, and remained well within thehistorical control ranges. GLUC and Na+ values appeared todecrease statistically significantly and dose-dependently inboth genders suggesting a possible test article effect, althoughall values remained well within historical control ranges.Differences in Cl− and Pi did not show clear dose-responserelationships.
Of note with regard to macroscopic findings (Table 1),smaller than normal testes (4/10 and 9/9) and epididymides(4/10 and 9/9) were observed in males of the 300 and375mg/kg bw/day groups, respectively. Three animals inthe 375mg/kg bw/day group also had smaller than normalprostates. Pale adrenal glands were observed in male animalsat 300mg/kg bw/day (2/10) and in male and female animalsat 375mg/kg bw/day (7/9 and 4/10, resp.). Other minornecropsy findings shown in Table 1 (e.g., white compact for-mation on the surface of the kidney, scarring, and alopecia inseveral groups) were considered to be individual findings inmale animals as they are common observations in untreatedexperimental rats of this strain and age.
Decreased organ weights compared to controls wereobserved in male animals in the testes of the 300 (absoluteand relative to brain weight) and 375 (absolute and relativeto body and brain weights) mg/kg bw/day groups and epi-didymides of the 300 and 375 (absolute and relative to bodyand brain weights) mg/kg bw/day groups. Increased weightscompared to controls were noted for adrenal glands in malesat 375 (absolute and relative to body and brain weight) and300mg/kg bw/day (relative to body weight only). Decreasesin thymus weight (absolute and relative to body and brainweight) were noted at 300 and 375mg/kg bw/day in bothmale and female animals (Tables 9–11). Statistically significant
Journal of Toxicology 7
Table3:Summaryof
meanbo
dyweightg
ain.
Group
(mg/kg
bw/d)
Body
weightg
ain(g)b
etweendays
Sum
0–3
3–7
7–10
10–14
14–17
17–21
21–24
24–28
28–35
35–4
242–4
949–56
56–6
363–70
70–77
77–8
484–89
0–89
Males Con
trol
Mean
21.2
23.8
6.7
19.8
10.4
17.4
8.3
13.4
14.4
18.1
16.0
12.8
7.810.1
8.7
5.1
1.0215.0
SD1.8
3.3
2.9
3.4
2.4
3.8
4.2
3.9
2.9
3.5
4.0
2.1
2.3
3.0
3.9
3.5
2.4
15.1
180
Mean
16.5
23.1
10.5
18.0
9.516.2
9.912.2
19.3
16.3
14.6
15.2
10.9
8.5
9.47.1
3.6
220.8
SD5.2
3.9
2.5
3.8
3.8
3.4
4.7
3.6
6.2
3.9
4.7
4.1
3.3
4.1
3.1
3.6
3.7
22.9
SS∗∗
300
Mean
10.3
21.6
7.716.9
8.4
13.2
10.6
9.816.1
13.3
14.3
12.1
9.710.6
11.1
0.9
4.9
191.5
SD7.1
4.6
4.5
6.6
3.4
2.6
4.2
3.2
4.5
9.83.6
2.6
3.1
3.6
2.5
8.3
6.2
30.5
SS∗∗
∗∗
∗
375
Mean−1.7
22.7
10.0
15.9
10.5
15.3
9.39.4
11.9
12.1
12.3
10.9
7.09.8
10.8
5.2
7.9181.9
SD12.5
3.6
5.2
6.0
3.8
3.1
4.2
8.0
6.2
5.7
6.9
6.2
5.5
4.2
5.3
6.1
2.0
27.7
SS∗∗
∗∗∗∗∗
𝑛10
1010
1010
1010
1010
109
99
99
99
9Females
Con
trol
Mean
10.9
13.0
6.9
9.45.2
7.04.4
6.2
11.6
6.1
5.9
6.5
0.7
5.6
5.7
3.8
2.2
111.1
SD3.7
1.63.4
2.3
2.8
1.63.4
2.7
4.2
3.6
3.8
2.1
3.6
2.8
4.2
4.1
3.3
13.7
180
Mean
9.113.1
9.08.3
5.7
8.8
3.6
8.2
9.75.3
7.57.3
1.14.2
4.5
4.6
4.0
114.0
SD3.1
3.7
4.6
2.0
5.1
4.2
2.0
3.8
4.4
3.8
4.6
2.7
2.8
3.4
4.6
5.1
3.8
14.5
300
Mean
6.7
14.3
7.88.8
6.7
9.14.5
8.7
9.68.3
8.0
4.3
7.22.1
8.1
2.4
2.4
118.5
SD5.1
2.8
3.6
4.7
3.4
2.2
3.4
2.1
2.5
2.5
4.5
4.2
2.5
3.6
2.4
3.2
1.816.5
𝑛10
1010
1010
1010
109
99
99
88
88
8SS
∗∗∗
375
Mean
5.0
12.8
10.0
12.3
6.1
6.4
6.5
7.99.5
7.19.2
4.7
4.5
3.5
6.6
3.2
5.2
120.5
SD2.5
2.7
3.5
3.3
4.4
4.4
4.3
3.3
5.2
7.65.2
2.4
2.5
3.9
5.0
4.5
3.8
21.4
SS∗∗
∗∗
mg/kg
bw/d,m
illigramsp
erkilogram
body
weightp
erday;SD
,stand
arddeviation;
g,gram
s;SS,statistic
alsig
nificance;𝑛,num
bero
fanimals.
∗𝑝<0.05;∗∗𝑝<0.01.𝑛=10un
lesso
therwise
stated.
8 Journal of Toxicology
Table4:Summaryof
meanbo
dyweight.
Group
(mg/kg
bw/d)
Body
weight(g)
ondays
03
710
1417
2124
2835
4249
5663
7077
8489
Males Con
trol
Mean
218.6
239.8
263.6
270.3
290.1
300.5
317.9
326.2
339.6
354.0
372.1
388.1
400.9
408.7
418.8
427.5
432.6
433.6
SD7.2
7.910.0
11.2
12.9
13.9
16.8
15.6
16.8
17.0
18.2
19.5
18.8
18.4
18.8
18.1
19.7
18.9
𝑛10
1010
1010
1010
1010
1010
1010
1010
1010
10
180
Mean
218.3
234.8
257.9
268.4
286.4
295.9
312.1
322.0
334.2
353.5
369.8
384.4
399.6
410.5
419.0
428.4
435.5
439.1
SD7.2
10.9
12.0
12.2
15.5
17.5
15.7
16.0
15.9
18.4
19.4
21.7
21.5
22.1
23.8
24.0
26.1
26.2
±%
0−2−2−1−1−2−2−1−2
0−1−1
00
00
11
𝑛10
1010
1010
1010
1010
1010
1010
1010
1010
10
300
Mean
217.2
227.5
249.1
256.8
273.7
282.1
295.3
305.9
315.7
331.8
345.1
359.4
371.5
381.2
391.8
402.9
403.8
408.7
SD6.2
9.312.0
12.5
14.8
14.8
14.8
16.9
16.9
18.0
23.9
25.2
25.5
26.0
27.0
27.3
28.6
31.7
±%−1−5−6−5−6−6−7−6−7−6−7−7−7−7−6−6−7−6
SS∗
∗∗
∗∗
∗∗
∗∗∗∗∗∗∗∗∗∗∗∗∗
∗∗
∗∗
𝑛10
1010
1010
1010
1010
1010
1010
1010
1010
10
375
Mean
217.1
215.4
238.1
248.1
264.0
274.5
289.8
299.1
308.5
320.4
332.5
348.2
359.1
366.1
375.9
386.7
391.9
399.8
SD5.5
13.4
12.0
11.0
13.3
14.3
14.8
15.9
17.1
16.4
18.3
16.7
20.0
22.9
23.7
25.1
28.2
28.4
±%−1−10−10−8−9−9−9−8−9−9−11−10−10−10−10−10−9−8
SS∗∗∗∗∗∗∗∗∗∗∗∗∗∗∗∗∗∗∗∗∗∗∗∗∗∗∗∗∗∗∗∗
∗
𝑛10
1010
1010
1010
1010
1010
99
99
99
9Females
Con
trol
Mean
139.8
150.7
163.7
170.6
180.0
185.2
192.2
196.6
202.8
214.4
220.5
226.4
232.9
233.6
239.2
244.9
248.7
250.9
SD5.5
6.7
7.48.8
10.2
11.1
12.0
11.5
13.0
12.0
13.4
13.8
14.3
14.2
14.2
16.2
15.5
17.2
𝑛10
1010
1010
1010
1010
1010
1010
1010
1010
10
180
Mean
140.1
149.2
162.3
171.3
179.6
185.3
194.1
197.7
205.9
215.6
220.9
228.4
235.7
236.8
241.0
245.5
250.1
254.1
SD5.9
6.1
4.5
5.0
4.8
6.3
8.2
8.4
9.711.4
11.9
13.3
14.0
13.9
14.0
14.0
15.6
15.8
±%
0−1−1
00
01
12
10
11
11
01
1𝑛
1010
1010
1010
1010
1010
1010
1010
1010
1010
300
Mean
139.4
146.1
160.4
168.2
177.0
183.7
192.8
197.3
206.0
216.4
224.8
232.8
237.1
244.3
245.4
253.5
255.9
258.3
SD2.0
4.4
4.6
5.8
7.37.2
8.4
9.99.8
10.8
11.4
13.3
14.5
13.4
15.5
15.7
16.1
17.1
±%
0−3−2−1−2−1
00
21
23
25
34
33
𝑛10
1010
1010
1010
1010
99
99
98
88
8
375
Mean
141.0
146.0
158.8
168.8
181.1
187.2
193.6
200.1
208.0
217.5
224.6
233.8
238.5
243.0
246.5
253.1
256.3
261.5
SD5.2
6.1
6.9
7.68.8
7.910.5
11.7
11.2
15.9
16.8
16.2
16.5
16.0
19.1
21.1
21.5
23.4
±%
1−3−3−1
11
12
31
23
24
33
34
𝑛10
1010
1010
1010
1010
1010
1010
1010
1010
10±%,percent
deviationversus
control;mg/kg
bw/d,m
illigramsp
erkilogram
body
weightp
erday;SD
,stand
arddeviation;
g,gram
s;SS,statisticalsig
nificance;𝑛,num
bero
fanimals.
∗𝑝<0.05;∗∗𝑝<0.01.
Journal of Toxicology 9
Table 5: Summary of food consumption.
Group(mg/kg bw/d)
Daily mean food consumption (g/animal/day) on weeks1 2 3 4 5 6 7 8 9 10 11 12 13
±%, percent deviation versus control; mg/kg bw/d, milligrams per kilogram body weight per day; SD, standard deviation; g, grams; SS, statistical significance;𝑛, number of animals.∗𝑝 < 0.05; ∗∗𝑝 < 0.01. 𝑛 = 10 unless otherwise stated.
differences in the weights of some organs in male animals(heart and kidneys) relative to body weight arose partiallyor fully from the body weight changes of these groups andwere not seen in organ to brain weight ratios. Differencesin some organ weights (absolute or relative) were observedonly in the lower dose groups but not in the higher dosegroups (liver, thyroid, and uterus) and, therefore, were notconsidered treatment-related.
In surviving animals, histological examination (Table 2)revealed decreased intensity of spermatogenesis in the
seminiferous tubuli in all male animals at 375mg/kg bw/dayand in half of male animals at 300mg/kg bw/day as com-pared to controls. In all animals with testicular findings,giant cells in the seminiferous tubuli were noted. Lack ofmature spermatozoa in the ductuli of epididymides (2/10 at300mg/kg bw/day and 8/9 at 375mg/kg bw/day to amoderateor severe degree) and decreased number ofmature spermato-zoa (1/10 at 300mg/kg bw/day and 1/9 at 375mg/kg bw/day inminimal ormild degree)were seen inmale animals.The alter-ations in the testes and epididymides were not accompanied
±%, percent deviation versus control; mg/kg bw/d, milligrams per kilogram body weight per day; g bw/g food, grams body weight per grams of food; SD,standard deviation; g, grams; SS, statistical significance; 𝑛, number of animals.∗𝑝 < 0.05; ∗∗𝑝 < 0.01.
by inflammation, degeneration, or necrosis. The number andcytomorphology of interstitial testicular cells were the sameas in control male animals. A decreased amount of secretionin the tubuli of the prostate was observed in three maleanimals at 375mg/kg bw/day. In the remaining male animalsof the 300mg/kg bw/day group (5/10) and in all animalsof the 180mg/kg bw/day and control groups, the variousspermatogenic cells (spermatogonia, spermatocytes, sper-matids, and spermatozoa)—representing different phases inthe development and differentiation of the spermatozoons—and the interstitial cells appeared normal. Similar effectshave been reported in rats after consumption of high levelsof the purine alkaloids theobromine and caffeine, namely,atrophy of the testes and epididymides and spermatogeniccell degeneration, although the mechanism by which thisoccurs is unknown [39, 40]. However in human studies,caffeine intake has not been associated with adverse effectsrelated to semen quality, and fertility levels have, overall, notconsistently been linked to caffeine intake [41].
There were no other treatment-related findings uponmicroscopic examination of the selected tissues. Findings that
were not considered toxicologically relevant occurred in afew animals; for example, slight, focal alveolar emphysemawas observed in the lungs of some male and female animalsin control and high-dose groups with similar incidence.This finding is connected to hypoxia, dyspnea, and circu-latory disturbance that occurs during exsanguination andwas considered unrelated to test article administration [42].Hyperplasia of bronchus-associated lymphoid tissue (BALT)was also observed in both the control and high-dose groups(with greater incidence in the control group). This is aphysiological, immunomorphological phenomenon [43, 44]and is not considered toxicologically relevant. Dilatation ofthe uterine horns occurred in female animals of control andhigh-dose groups; this is considered a slight neurohormonalphenomenon connected to the estrus phase of the innergenital organs and not toxicologically relevant [45].
No histopathological findings were noted in the adrenalor thymus glands. Thus the pale adrenals and differences inorgan weights of the adrenals and thymus were consideredlikely to be an indication of the adaptive process (the responseof the organ to environmental variation in order to maintain
Journal of Toxicology 11
Table7:Summaryof
statistic
allysig
nificanth
ematologicalfin
ding
s.
Doseg
roup
(mg/kg
bw/d)
Males
Females
Con
trol
𝑛=10
180𝑛=10
300𝑛=10
375𝑛=9
Historical
range
Con
trol
𝑛=10
180𝑛=10
300𝑛=8
375𝑛=10
Historicalrange
WBC
(×109/L)
7.91±
0.97
7.69±1.4
96.69±1.7
98.13±1.6
54.60–13.86
6.20±1.8
15.63±1.0
2∗4.74±0.98
6.57±1.6
62.96–12.94
MONO(%
)2.82±0.48
∗3.70±0.85
2.62±1.17
2.67±0.68
0.6–
4.1
2.09±0.64
2.26±0.31
2.51±0.45
1.81±
0.48
0.4–
3.1
EOS(%
)1.4
1±0.40
∗1.0
4±0.34
∗∗0.78±0.20
∗∗0.69±0.31
0.4–
3.3
1.06±0.43
0.78±0.34
0.76±0.32
∗∗0.52±0.20
0.5–2.0
RBC(×1012/L)
9.51±
0.40
∗∗8.43±0.48
∗∗8.31±0.64
∗∗8.34±0.33
6.20–10.26
8.67±0.28
∗∗7.9
2±0.40
∗∗8.01±0.52∗8.19±0.67
7.61–9.3
1HGB(g/L)
168.70±5.93
162.00±7.4
7161.9
0±10.84
163.67±3.5
0109–
184
161.2
0±3.77
∗154.60±6.82
158.88±9.4
9165.20±6.99
145–169
MCV
(fL)
48.04±1.4
0∗∗52.96±2.96
∗∗53.94±2.15
∗∗54.17±2.68
45.0–53.7
51.13±2.09
∗∗54.18±2.71∗∗54.78±2.15∗∗55.14±1.6
547.0–55.0
MCH
(pg)
17.75±0.41
∗∗19.24±0.81
∗∗19.51±
0.57
∗∗19.66±0.86
16.7–
19.4
18.61±
0.62
∗19.54±0.89
∗∗19.85±0.56∗∗20.25±1.2
917.3–19.7
MCH
C(g/L)
369.7
0±4.40
∗363.70±9.0
7∗361.8
0±5.92
∗362.89±4.26
339–
376
363.90±5.90
360.60±3.53
362.75±5.50
367.2
0±17.07
351–368
RET(%
)3.15±0.30
∗∗3.67±0.32
∗∗4.18±1.7
2∗∗3.94±0.56
2.51–4
.65
3.93±0.49
4.14±0.79
3.91±0.63
4.36±1.2
23.17–6
.16Va
lues
aree
xpressed
asmean±sta
ndarddeviation.
HistoricalRa
ngeb
ased
ondatafro
m40
malea
nd38
femaleH
sd.Brl.Han
Wistar
controlratsa
ged19-20weeks.
mg/kg
bw/d,m
illigramsp
erkilogram
body
weightp
erday;L,liter;fL,femtoliters;pg
,picograms;𝑛,num
bero
fanimals;∗𝑝<0.05
and∗∗𝑝<0.01.
12 Journal of Toxicology
Table8:Summaryof
statistic
allysig
nificantclin
icalchem
istry
finding
s.
Doseg
roup
(mg/kg
bw/d)
Males
Females
Con
trol
𝑛=10
180𝑛=10
300𝑛=10
375𝑛=9
Historical
range
Con
trol
𝑛=10
180𝑛=10
300𝑛=8
375𝑛=10
Historical
range
ALT
(U/L)
54.97±10.62
66.51±
7.29
∗∗73.55±13.81∗∗75.58±18.09
38.5–9
8.0
58.26±11.88
68.12±12.14
∗73.925±17.23
∗∗78.25±14.91
31.4–8
4.1
AST
(U/L)
94.64±20.70
101.8
1±12.75
98.25±8.76
∗112.53±17.90
72.6–123.5
95.25±16.82
89.75±16.20
99.39±17.46
∗112.36±20.00
75.0–116.6
ALP
(U/L)
102.80±20.47∗∗78.8±10.89∗79.70±12.28
89.44±25.67
67–215
55.9±17.25
72.90±25.88
60.88±35.45
73.40±32.00
20–185
TBIL
(𝜇mol/L)
1.71±
0.23
1.69±0.28
∗2.07±0.37
∗2.09±0.35
0.62–4
.72
1.839±0.45
1.44±0.34
1.86±0.38
1.85±0.62
0.91–4
.69
CREA
(𝜇mol/L)
28.70±2.73
∗32.76±3.97
∗∗34.35±4.58
∗∗35.97±2.89
23.1–
37.0
29.3±2.32
29.51±
3.28
30.30±3.55
31.15±3.06
25.9–38.2
Urea(𝜇mol/L)
7.48±0.91
7.20±0.88
7.64±0.86
7.64±0.82
4.14–9.62
6.947±0.71
7.19±1.0
46.83±0.85
7.08±0.82
4.79–9.71
GLU
C(𝜇mol/L)
6.04±0.52
5.99±0.53
5.62±0.43
∗∗5.35±0.33
4.98–7.97
5.73±0.49
5.71±0.49
∗5.10±0.80
∗∗4.53±0.41
4.18–8.49
Pi(𝜇mol/L)
1.90±0.28
2.09±0.25
2.09±0.20
∗∗2.39±0.24
1.40–
2.06
1.275±0.16
∗1.5
3±0.16
∗∗2.12±0.20
∗∗2.11±0.39
1.3–2.1
Ca++(𝜇mol/L)
2.67±0.08
∗2.58±0.11
∗2.56±0.09
2.63±0.07
2.39–2.75
2.617±0.06
2.55±0.10
2.57±0.07
2.54±0.10
2.4–
2.8
Na+
(𝜇mol/L)
142.00±1.0
5∗∗140.00±1.4
9∗∗138.80±1.14∗∗138.67±0.87
137–147
140.6±0.97
139.9
0±1.7
9139.2
5±1.5
8∗138.50±2.51
137–147
K+(𝜇mol/L)
4.41±0.25
4.61±0.39
4.23±0.15
4.45±0.26
3.62–5.31
3.921±
0.24
4.15±0.21
∗4.28±0.32
∗4.24±0.45
3.6–
4.4
Cl−(𝜇mol/L)
105.65±0.98
∗∗103.4±1.7
0∗∗102.24±0.98
∗∗102.46±1.3
4101.0
–106.6
104.66±0.74∗103.5
6±1.3
7∗∗102.79±1.15
∗102.79±2.22
101.2
–109.6
ALB
(g/L)
34.21±
0.72
∗33.08±0.88
∗∗32.03±1.6
133.63±1.19
31.5–36.7
35.77±1.2
934.73±1.10
34.76±1.4
535.03±2.04
32.9–4
1.1TP
ROT(g/L)
62.59±3.30
∗59.7±2.44
∗∗57.37±2.30
61.22±2.70
55.5–70.6
64.76±3.53
62.09±2.60
62.65±2.66
64.29±5.17
57.6–79.3
Values
aree
xpressed
asmean±standard
deviation.
HistoricalRa
ngeb
ased
ondatafro
m40
malea
nd38
female(19
females
forB
UNandPi)H
sd.Brl.Han
Wistar
controlratsa
ged19-20weeks.
mg/kg
bw/d,m
illigramsp
erkilogram
body
weightp
erday;U/L,unitsperliter;𝜇mol,m
icromol;g,gram;𝑛,num
bero
fanimals.
∗𝑝<0.05;∗∗𝑝<0.01.
Journal of Toxicology 13
Table9:Summaryof
organweights.
Group
(mg/kg
bw/d)
Organ
weight(g)
Body
weight
Brain
Liver
Kidn
eys
Heart
Thym
usSpleen
Teste
sor
uterus
Epididym
ides
orovaries
Adrenals
Thyroids
Males Con
trol(𝑛=10)
Mean
422.0
2.16
10.00
2.28
1.14
0.44
0.71
3.49
1.62
0.077
0.028
SD17.52
0.16
0.96
0.20
0.09
0.12
0.10
0.34
0.09
0.01
0.01
180(𝑛=10)
Mean
421.8
2.19
10.77
2.38
1.14
0.40
0.77
3.51
1.65
0.074
0.023
SD25.26
0.12
0.99
0.26
0.19
0.08
0.08
0.34
0.20
0.02
0.01
±%
0.0
18
50
−8
91
2−4
−19
SS∗
300(𝑛=10)
Mean
393.1
2.11
9.83
2.33
1.20
0.32
0.80
2.70
1.36
0.085
0.021
SD28.39
0.10
0.77
0.26
0.14
0.06
0.11
0.74
0.15
0.01
0.01
±%
−7
−2
−2
35
−26
13−23
−16
10−26
SS∗
∗∗
∗∗
∗∗
∗∗
375(𝑛=9)
Mean
377.0
2.06
9.51
2.22
1.24
0.30
0.71
1.42
1.14
0.093
0.023
SD26.43
0.14
0.99
0.25
0.22
0.05
0.10
0.68
0.12
0.01
0.00
±%
−11
−4
−5
−3
9−31
1−59
−30
20−16
SS∗∗
∗∗
∗∗
∗∗
∗
Females
Con
trol(𝑛=10)
Mean
241.9
1.94
6.63
1.61
0.83
0.41
0.55
0.66
0.165
0.088
0.021
SD15.55
0.07
0.70
0.21
0.07
0.06
0.11
0.09
0.036
0.012
0.003
180(𝑛=10)
Mean
242.5
2.01
7.41
1.59
0.77
0.38
0.63
0.88
0.154
0.085
0.022
SD14.74
0.11
0.62
0.14
0.05
0.05
0.10
0.28
0.027
0.018
0.00
6±%
04
12−1
−7
−8
1532
−7
−4
9SS
∗∗
300(𝑛=8)
Mean
250.4
1.98
7.07
1.56
0.92
0.33
0.61
0.58
0.148
0.092
0.022
SD15.97
0.08
0.56
0.09
0.09
0.05
0.06
0.18
0.034
0.016
0.00
4±%
42
7−3
11−20
11−12
−10
46
SS∗
∗∗
375(𝑛=10)
Mean
247.3
1.96
7.16
1.55
0.95
0.31
0.61
0.57
0.151
0.095
0.022
SD21.06
0.06
0.84
0.14
0.14
0.07
0.11
0.19
0.031
0.016
0.005
±%
2.2
0.7
8.0
−3.5
14.7
−25.0
11.1
−13.2
−8.3
6.9
8.3
SS±%,percent
deviationversus
control,mg/kg
bw/d,m
illigramsp
erkilogram
body
weightp
erday;SD
,stand
arddeviation;
g,gram
s;SS,statisticalsig
nificance;𝑛,num
bero
fanimals.
∗𝑝<0.05;∗∗𝑝<0.01.
14 Journal of Toxicology
Table10:Sum
maryof
organweightsrelativetobo
dyweight(%).
Group
(mg/kg
bw/d)
Organ
weightrelativetobo
dyweight(%)
Brain
Liver
Kidn
eys
Heart
Thym
usSpleen
Teste
sor
uterus
Epididym
ides
orovaries
Adrenals
Thyroids
Males Con
trol(𝑛=10)
Mean
0.512
2.371
0.538
0.271
0.104
0.167
0.825
0.384
0.018
0.007
SD0.031
0.206
0.032
0.017
0.027
0.019
0.051
0.024
0.003
0.001
180(𝑛=10)
Mean
0.519
2.551
0.564
0.269
0.096
0.183
0.831
0.391
0.018
0.005
SD0.021
0.137
0.034
0.037
0.018
0.011
0.06
00.031
0.003
0.001
±%
18
5−1
−8
101
2−5
−19
SS∗
∗∗
300(𝑛=10)
Mean
0.540
2.502
0.593
0.305
0.082
0.203
0.692
0.347
0.022
0.005
SD0.054
0.099
0.045
0.031
0.011
0.021
0.201
0.04
60.003
0.001
±%
56
1013
−21
22−16
−10
18−20
SS∗∗
∗∗
∗∗
∗∗
∗
375(𝑛=9)
Mean
0.549
2.519
0.588
0.329
0.079
0.189
0.379
0.304
0.025
0.00
6SD
0.04
00.148
0.043
0.047
0.00
90.019
0.187
0.04
00.003
0.001
±%
76
922
−23
13−54
−21
35−5
SS∗
∗∗
∗∗
∗∗
∗∗
∗∗
Females
Con
trol(𝑛=10)
Mean
0.807
2.739
0.663
0.343
0.170
0.226
0.274
0.06
80.037
0.00
9SD
0.06
40.215
0.058
0.032
0.023
0.041
0.036
0.014
0.005
0.002
180(𝑛=10)
Mean
0.831
3.051
0.656
0.316
0.155
0.260
0.359
0.06
40.035
0.00
9SD
0.04
00.110
0.049
0.023
0.017
0.034
0.107
0.013
0.007
0.002
±%
311
−1
−8
−9
1531
−6
−4
7SS
∗∗
∗
300(𝑛=8)
Mean
0.794
2.828
0.625
0.367
0.132
0.244
0.233
0.059
0.037
0.00
9SD
0.054
0.204
0.025
0.031
0.019
0.029
0.078
0.012
0.005
0.001
±%
−2
3−6
7−23
8−15
−13
02
SS∗∗
375(𝑛=10)
Mean
0.796
2.892
0.628
0.384
0.125
0.245
0.231
0.061
0.038
0.00
9SD
0.071
0.200
0.039
0.04
80.023
0.026
0.06
80.013
0.00
60.002
±%
−1
6−5
12−27
8−15
−10
55
SS∗
∗∗
±%,percent
deviationversus
control,mg/kg
bw/d,m
illigramsp
erkilogram
body
weightp
erday;SD
,stand
arddeviation;
SS,statisticalsig
nificance;𝑛,num
bero
fanimals.
∗𝑝<0.05;∗∗𝑝<0.01.
Journal of Toxicology 15
Table11:Sum
maryof
organweightand
body
weightrelativetobrainweight(%).
Group
(mg/kg
bw/d)
Organ
weightand
body
weightrelativetobrainweight(%)
Body
weight
Liver
Kidn
eys
Heart
Thym
usSpleen
Teste
sor
uterus
Epididym
ides
orovaries
Adrenals
Thyroids
Males Con
trol(𝑛=10)
Mean
19608.6
465.49
105.54
52.99
19.90
32.71
161.6
475.55
3.58
1.29
SD1278.39
59.62
8.82
3.84
4.61
4.51
12.20
9.17
0.51
0.23
180(𝑛=10)
Mean
19285.0
492.44
108.86
52.07
18.44
35.34
160.22
75.51
3.39
1.03
SD759.6
340
.09
8.86
8.62
3.60
3.05
11.73
7.23
0.64
0.22
±%
−1.7
63
−2
−7
8−1
0−5
−20
SS∗
300(𝑛=10)
Mean
18700.4
467.55
110.87
56.86
15.45
37.96
127.31
64.29
4.04
0.97
SD1910.29
48.08
13.13
7.56
3.34
6.61
32.03
6.09
0.64
0.23
±%
−5
05
7−22
16−21
−15
13−25
SS∗
∗∗∗
∗∗
375(𝑛=9)
Mean
18314.2
460.80
107.3
460.39
14.59
34.75
68.41
55.41
4.52
1.14
SD1352.12
35.16
7.32
10.94
2.47
5.35
31.26
5.53
0.45
0.18
±%
−7
−1
214
−27
6−58
−27
26−12
SS∗∗
∗∗
∗∗
∗∗
Females
Con
trol(𝑛=10)
Mean
1246
6.2
341.4
5582.693
42.583
21.19
728.267
34.10
98.473
4.554
1.056
SD957.2
837.492
10.797
3.797
2.917
5.757
5.119
1.847
0.652
0.183
180(𝑛=10)
Mean
12062.5
368.27
78.98
38.14
18.71
31.46
43.10
7.66
4.20
1.10
SD591.8
425.74
4.94
3.23
2.17
4.83
12.09
1.39
0.78
0.23
±%
−3
8−4
−10
−12
1126
−10
−8
4SS
∗∗
300(𝑛=8)
Mean
1264
2.0
356.58
78.94
46.31
16.71
30.83
29.21
7.48
4.63
1.10
SD863.82
20.88
4.51
4.30
2.80
3.60
8.44
1.66
0.77
0.23
±%
14
−5
9−21
9−14
−12
24
SS∗∗
375(𝑛=10)
Mean
12643.1
365.80
79.19
48.41
15.81
31.17
29.31
7.69
4.84
1.13
SD1076.51
40.84
6.37
6.57
3.62
5.39
9.33
1.45
0.85
0.25
±%
17
−4
14−25
10−14
−9
67
SS∗
∗∗
±%,percent
deviationversus
control,mg/kg
bw/d,m
illigramsp
erkilogram
body
weightp
erday;SD
,stand
arddeviation;
SS,statisticalsig
nificance;𝑛,num
bero
fanimals.
∗𝑝<0.05;∗∗𝑝<0.01.
16 Journal of Toxicology
function/survival) or stress response, and the toxicologicalsignificance was considered equivocal as has also been seenwith theobromine and caffeine consumption in rats [32, 39,46, 47].
4. Conclusion
In summary, doses of up to 300mg (3.8mg/kg bw/day fora 78 kg human) given to healthy males and females in aprevious clinical study did not result in any adverse effectsor potential toxicological findings in numerous clinical safetymarkers [24]. In the present GLP and OECD 408 complianttoxicological study in Wistar rats, theacrine consumptionwas associated with mortality at 300mg/kg bw/day in two often females and, at 375mg/kg bw/day in one of ten males,with centrilobular hepatocellular necrosis considered thelikely cause of death. Males in the 375mg/kg bw/day groupalso had reductions in body weight gain, food consumptionand feed efficiency, and decreased weight of the testes andepididymides, along with decreased intensity of spermato-genesis, amount of mature spermatozoa, and prostate secre-tions. Males of the 300mg/kg bw/day similarly had decreasedweight of testes and epididymides and decreased intensity ofspermatogenesis and amount of mature spermatozoa. Basedon observations made in this 90-day repeated-dose gavagetoxicity study and the lack of toxicologically relevant findingsin the low dose group, theNOAEL for theacrine is consideredto be 180mg/kg bw/day in male and female Wistar rats.
Competing Interests
The authors declare that they have no competing interests.
Acknowledgments
The authors would like to thank the following partici-pating investigators for their contributions to the work:Viktoria Balogh, Erzsebet Biczo, Ibolya Bogdan, MonikaCsatari, Tımea Csorge, Ildiko Hermann, Isvanne Horvath,Zoltan Jakab, Klara Fritz Kovacsne, Viktoria Matina, AgotaJo Schullerne, Janos Stahl, Beatrix Szilagyi Sumegine, EvaSzabo, Ferenc Szabo, Zsuzsanna Szabo, Edit Szam, JuditSzilak, Marta Tenk, Zsuzsanna Vuleta, and Levente Zoltanfor the performance of experimental tasks and/or collectionof data and Jared Brodin for copyediting and administrativesupport in preparation of the paper. The authors disclosethat financial support for the research described herein wasprovided by Compound Solutions Inc. (Carlsbad, CA).
References
[1] J. B. Petermann and T. W. Baumann, “Metabolic relationsbetween methylxanthines and methyluric acids in Coffea L.,”Plant Physiology, vol. 73, no. 4, pp. 961–964, 1983.
[2] H. Ashihara, M. Kato, and A. Crozier, “Distribution, biosynthe-sis and catabolism of methylxanthines in plants,” inMethylxan-thines, B. B. Fredholm, Ed., vol. 200 ofHandbook of Experimen-tal Pharmacology, pp. 11–31, 2011.
[3] K. Li, X. Shi, X. Yang, Y.Wang,C. Ye, andZ.Yang, “Antioxidativeactivities and the chemical constituents of two Chinese teas,Camellia kucha andC. ptilophylla,” International Journal of FoodScience and Technology, vol. 47, no. 5, pp. 1063–1071, 2012.
[4] A. L. Anaya, R. Cruz-Ortega, andG. R.Waller, “Metabolism andecology of purine alkaloids,” Frontiers in Bioscience, vol. 11, no.1, pp. 2354–2370, 2006.
[5] T. Lim, “Theobroma grandiflorum,” in Edible Medicinal andNon-Medicinal Plants: Volume 3, Fruits, pp. 252–258, Springer,New York, NY, USA, 2012.
[6] M. Vasconcelos, M. da Silva, J. Maia, and O. Gottlieb, “Estudoquımico de sementes do cupuacu,” Acta Amazonica, vol. 5, no.3, pp. 293–295, 1975.
[7] T. Baumann and H. Wanner, “The 1,3,7,9-tetramethyluric acidcontent of cupu (Theobroma grandiflorum Schum.),” ActaAmazonica, vol. 10, no. 2, p. 425, 1980.
[8] F. Marx and J. G. S. Maia, “Purine alkaloids in seeds of Theo-broma species from the Amazon,” Zeitschrift fur Lebensmittel-Untersuchung und Forschung, vol. 193, no. 5, pp. 460–461, 1991.
[9] G. Xie, R.-R. He, X. Feng et al., “The hypoglycemic effects ofCamellia assamica var. kucha extract,” Bioscience, Biotechnologyand Biochemistry, vol. 74, no. 2, pp. 405–407, 2010.
[10] S.-B. Li, Y.-F. Li, Z.-F. Mao et al., “Differing chemical composi-tions of three teas may explain their different effects on acuteblood pressure in spontaneously hypertensive rats,” Journal ofthe Science of Food and Agriculture, vol. 95, no. 6, pp. 1236–1242,2015.
[11] X.-Q. Zheng, C.-X. Ye, M. Kato, A. Crozier, and H. Ashihara,“Theacrine (1,3,7,9-tetramethyluric acid) synthesis in leaves of aChinese tea, kucha (Camellia assamica var. kucha),” Phytochem-istry, vol. 60, no. 2, pp. 129–134, 2002.
[12] A. A. Feduccia, Y. Wang, J. A. Simms et al., “Locomotoractivation by theacrine, a purine alkaloid structurally similarto caffeine: involvement of adenosine and dopamine receptors,”Pharmacology Biochemistry and Behavior, vol. 102, no. 2, pp.241–248, 2012.
[13] J.-K. Xu, H. Kurihara, L. Zhao, and X.-S. Yao, “Theacrine, aspecial purine alkaloid with sedative and hypnotic propertiesfrom Cammelia assamica var. kucha in mice,” Journal of AsianNatural Products Research, vol. 9, no. 7, pp. 665–672, 2007.
[14] Y.Wang, X. Yang, X. Zheng, J. Li, C. Ye, andX. Song, “Theacrine,a purine alkaloid with anti-inflammatory and analgesic activi-ties,” Fitoterapia, vol. 81, no. 6, pp. 627–631, 2010.
[15] G. Xie,M.Wu,Y.Huang et al., “Experimental study of the acrineon antidepressant effects,” Chinese Pharmacological Bulletin,vol. 9, 2009.
[16] Y.-F. Li, M. Chen, C. Wang et al., “Theacrine, a purine alkaloidderived from Camellia assamica var. kucha, ameliorates impair-ments in learning and memory caused by restraint-inducedcentral fatigue,” Journal of Functional Foods, vol. 16, pp. 472–483, 2015.
[17] W.-X. Li, Y.-F. Li, Y.-J. Zhai, W.-M. Chen, H. Kurihara, and R.-R. He, “Theacrine, a purine alkaloid obtained from Camelliaassamica var. kucha, attenuates restraint stress-provoked liverdamage in mice,” Journal of Agricultural and Food Chemistry,vol. 61, no. 26, pp. 6328–6335, 2013.
[18] O. Cauli, A. Pinna, V. Valentini, and M. Morelli, “Subchroniccaffeine exposure induces sensitization to caffeine and cross-sensitization to amphetamine ipsilateral turning behavior inde-pendent from dopamine release,” Neuropsychopharmacology,vol. 28, no. 10, pp. 1752–1759, 2003.
Journal of Toxicology 17
[19] P. Svenningsson, G. G. Nomikos, and B. B. Fredholm, “Thestimulatory action and the development of tolerance to caffeineis associated with alterations in gene expression in specific brainregions,” The Journal of Neuroscience, vol. 19, no. 10, pp. 4011–4022, 1999.
[20] B. A. Kihlman, “1,3,7,9-Tetramethyluric acid—a chromosome-damaging agent occurring as a natural metabolite in cer-tain caffeine-producing plants,” Mutation Research/Reviews inGenetic Toxicology, vol. 39, no. 3-4, pp. 297–315, 1977.
[21] B. A. Kihlman and G. Odmark, “Deoxyribonucleic acid synthe-sis and the production of chromosomal aberrations by strep-tonigrin, 8-ethoxycaffeine and 1,3,7,9-tetramethyluric acid,”Mutation Research—Fundamental and Molecular Mechanismsof Mutagenesis, vol. 2, no. 6, pp. 494–505, 1965.
[22] J. Endres, N. Deshmukh, R. Glavitis et al., “A comprehensivetoxicological assessment of the purine alkaloid theacrine,” TheToxicologist, Supplement to Toxicological Sciences, vol. 150, no. 1,2016, Abstract #1459.
[23] “Safety of Teacrine�, a non-habituating, naturally-occuringpurine alkaloid over eight weeks of continuous use,” in Proceed-ings of the Annual Meeting of the International Society of SportNutrition, S. Hayward, J. Mullins, S. Urbina et al., Eds., Austin,Tex, USA, 2015.
[24] L. Taylor, P. Mumford, M. Roberts et al., “Safety of TeaCrine�, anon-habituating, naturally-occurring purine alkaloid over eightweeks of continuous use,” Journal of the International Society ofSports Nutrition, vol. 13, article 2, 2016.
[25] S. M. Habowski, J. E. Sandrock, A. W. Kedia, and T. N.Ziegenfuss, “The effects of Teacrine�, a nature-identical purinealkaloid, on subjective measures of cognitive function, psy-chometric and hemodynamic indices in healthy humans: arandomized, double-blinded crossover pilot trial,” Journal of theInternational Society of Sports Nutrition, vol. 11, no. 1, article P49,2014.
[26] T. N. Ziegenfuss, S. M. Habowski, J. E. Sandrock, A. W. Kedia,C.M. Kerksick, andH. L. Lopez, “A two-part approach to exam-ine the effects of theacrine (TeaCrine�) supplementation onoxygen consumption, hemodynamic responses, and subjectivemeasures of cognitive and psychometric parameters,” Journal ofDietary Supplements, 2016.
[27] OECD, OECD 408. Guideline for the testing of chemicals:repeated dose 90-day oral toxicity study in rodents, Section 4,No. 408, adopted 21, pp. 1–10, September 1998.
[28] FDA and Redbook 2000, Toxicological Principles for the SafetyAssessment of Food Ingredients. IV.C.4.a. Subchronic ToxicityStudies with Rodents, 2003.
[29] National Research Council,Guide for the Care and Use of Labo-ratory Animals, Committee for the Update of the Guide for theCare and Use of Laboratory Animals, Institute for LaboratoryAnimal Research, Division on Earth and Life Studies, NationalResearch Council, Washington, DC, USA, 2011.
[30] S. Irwin, “Comprehensive observational assessment: Ia. A sys-tematic, quantitative procedure for assessing the behavioral andphysiologic state of the mouse,” Psychopharmacologia, vol. 13,no. 3, pp. 222–257, 1968.
[31] S. Eustis, G. Boorman, T. Harada, and J. Popp, “Liver,” inPathology of the Fischer Rat Reference and Atlas, pp. 71–94,Academic Press, San Diego, Calif, USA, 1990.
[32] R.W. Kapp Jr., O.Mendes, S. Roy, R. S.McQuate, and R. Kraska,“General and genetic toxicology of guayusa concentrate (Ilexguayusa),” International Journal of Toxicology, vol. 35, no. 2, pp.222–242, 2016.
[34] A. J. Onuegbu, J. M. Olisekodiaka, O. E. Adebolu, A. Adesiyan,andO. E. Ayodele, “Coffee consumption could affect the activityof some liver enzymes and other biochemical parameters inhealthy drinkers,” Medical Principles and Practice, vol. 20, no.6, pp. 514–518, 2011.
[35] A. A.Modi, J. J. Feld, Y. Park et al., “Increased caffeine consump-tion is associatedwith reduced hepatic fibrosis,”Hepatology, vol.51, no. 1, pp. 201–209, 2010.
[36] C. E. Ruhl and J. E. Everhart, “Coffee and caffeine consumptionreduce the risk of elevated serum alanine aminotransferaseactivity in the United States,” Gastroenterology, vol. 128, no. 1,pp. 24–32, 2005.
[37] C. E. Ruhl and J. E. Everhart, “Coffee and tea consumption areassociated with a lower incidence of chronic liver disease in theUnited States,” Gastroenterology, vol. 129, no. 6, pp. 1928–1936,2005.
[38] EFSA, “Scientific opinion. Opinion on the safety of caffeine,”The EFSA Journal, vol. 13, no. 5, 2015.
[39] J. H. Gans, “Comparative toxicities of dietary caffeine andtheobromine in the rat,” Food and Chemical Toxicology, vol. 22,no. 5, pp. 365–369, 1984.
[40] H. Funabashi, M. Fujioka, M. Kohchi, Y. Tateishi, and N.Matsuoka, “Collaborative work to evaluate toxicity on malereproductive organs by repeated dose studies in rats. 22) effectsof 2- and 4-week administration of theobromine on the testis,”Journal of Toxicological Sciences, vol. 25, pp. 211–221, 2000.
[41] J. D. Peck, A. Leviton, and L. D. Cowan, “A review of theepidemiologic evidence concerning the reproductive healtheffects of caffeine consumption: a 2000–2009 update,” Food andChemical Toxicology, vol. 48, no. 10, pp. 2549–2576, 2010.
[42] J. Vandenberghe, Life-Span Data and Historical Data in Car-cinogenicity Testing in Wistar Rats Crl:(WI) BR. Addendum5.8, Janssen Research Foundation, Department of Toxicology,Charles River Deutschland, Beerse, Belgium, 1990.
[43] G. Boorman and S. Eustis, “Lung,” in Pathology of the FischerRat: Reference and Atlas, G. Boorman, S. Eustis, M. Elwell, andW. MacKenzie, Eds., pp. 339–367, Academic Press, San Diego,Calif, USA, 1990.
[44] W. Haschek, C. Rousseaux, and M. Wallig, “Respiratory sys-tem. Structure and cell biology. Physiology and functionalconsiderations—lymphoid tissue,” in Fundamentals of Toxico-logic Pathology, p. 98, Elsevier, New York, NY, USA, 2009.
[45] J. Vidal, M. Mirsky, K. Colman, K. Whitney, and D. Creasy,“Reproductive system and mammary gland,” in ToxicologicPathologyNonclinical Safety Assessment, chapter 18, pp. 717–830,CRC Press, Boca Raton, Fla, USA, 2013.
[46] M. Hamlin and D. Banas, “Adrenal gland,” in Pathology of theFischer rat Reference andAtlas, pp. 501–518, Academic Press, SanDiego, Calif, USA, 1990.
[47] N. E. Everds, P. W. Snyder, K. L. Bailey et al., “Interpretingstress responses during routine toxicity studies: a review of thebiology, impact, and assessment,” Toxicologic Pathology, vol. 41,no. 4, pp. 560–614, 2013.
Submit your manuscripts athttp://www.hindawi.com
PainResearch and TreatmentHindawi Publishing Corporationhttp://www.hindawi.com Volume 2014
The Scientific World JournalHindawi Publishing Corporation http://www.hindawi.com Volume 2014