For SLA-aware service composition problem (SSC), an optimization model for this algorithm is built, and a hybrid multiobjectivediscrete particle swarm optimization algorithm (HMDPSO) is also proposed in this paper. According to the characteristic of thisproblem, a particle updating strategy is designed by introducing crossover operator. In order to restrain particle swarm’s prematureconvergence and increase its global search capacity, the swarm diversity indicator is introduced and a particle mutation strategyis proposed to increase the swarm diversity. To accelerate the process of obtaining the feasible particle position, a local searchstrategy based on constraint domination is proposed and incorporated into the proposed algorithm. At last, some parameters inthe algorithm HMDPSO are analyzed and set with relative proper values, and then the algorithm HMDPSO and the algorithmHMDPSO+ incorporated by local search strategy are compared with the recently proposed related algorithms on different scalecases. The results show that algorithm HMDPSO+ can solve the SSC problem more effectively.
1. Introduction
Service-oriented architecture (SOA) is an emerging styleof software architecture that reuses and combines looselycoupled services for building, maintaining, and integratingapplications in order to improve productivity and cost effec-tiveness throughout the application life cycle [1]. In SOA,each application is often designed with a set of services anda workflow (or business process). Each service encapsulatesthe function of an application component. Each workflowdefines how services interactwith each other.When a service-oriented application operates, it is instantiated as a workflowinstance that deploys each service in the application as oneor more service instances. Each service instance followsa particular deployment plan; different service instancesoperate at different quality of service (QoS) levels. When anapplication is intended to serve different categories of users,it is instantiated with multiple workflow instances, each ofwhich is responsible for offering a specific QoS level to aparticular user category.
In SOA, a service-level agreement (SLA) is defined upona workflow instance as its end-to-end QoS requirements
such as throughput, latency, and cost (e.g., resource utiliza-tion fees). In order to satisfy the given SLAs, application,developers are required to optimize a composition of serviceinstances, service composition, for each user category byconsidering which service instances to use for each serviceand how many service instances to use for each service.This decision-making problem, called the SLA-aware servicecomposition (SSC) problem, is a combinatorial optimizationproblem that searches the optimal bindings between eachservice and its service instances.
Although a large number of research work have leveragedlinear programming [2, 3] to solve the SSC problem, theysuffer from high computational costs. To address the issue ofhigh computational costs, several heuristicsz [4, 5] have beenstudied, but they just convert a multiobjective optimizationproblem into a single-objective optimization problem anddo not take SLAs into account. Until 2012 Wada et al. [6]began to convert SSCproblem into amultiobjective optimiza-tion problem with multiple SLAs and proposed algorithmsMOGA and NSGA-II. But there are several problems inthese two algorithms. Firstly, the service model for SSCproblem associated with those two algorithms contains too
Hindawi Publishing CorporationMathematical Problems in EngineeringVolume 2014, Article ID 252934, 14 pageshttp://dx.doi.org/10.1155/2014/252934
2 Mathematical Problems in Engineering
many objectives, which include all QoS attributes of servicecomposition in all SLAs. In this way, the number of objectiveswill remarkably rise with the increase of the number ofservice composition’s QoS attributes and the number of SLAs.Secondly, in the existing algorithms, when generating newpopulations, the chromosomes are used to make crossoverand mutation by selection of the uniformly random manner,which cannotmake some promising candidates to be selectedmore frequently. Furthermore, for the evaluation of thecandidates in the environmental selection process, only thestrength of a candidate being dominated is considered, buthow many candidates it dominates is not considered. Thesemake the existing algorithms for this problem convergeslowly, easily fall into local optimum, and are hard to getsatisfying solution sets when problem scale is relatively large.To tackle these problems, we redefine the service model forthis SSC problem and propose algorithm HMDPSO to solveit. Our algorithm combined genetic operators and particleswarm optimization algorithm (PSO), which is a widely usedswarm intelligence algorithm [7–9] and has the merits likeeasy realization, high precision, and fast convergence, and soon.
In this algorithm, a particle updating strategy is designedby introducing the crossover operator in genetic algorithmbased on the exchange of candidate services; a particlemutation strategy is proposed to increase particle swarm’sdiversity by introducing new information and then increasethe particle swarm’s global searching capacity; in order todistinguish small differences among particle positions, a fine-grained domination value assignment method is used tocalculate the fitness value of particles which will guide theparticles’ optimization process more accurately; in order toaccelerate the process of obtaining feasible service compo-sition and optimize it, an improved version of algorithmHMDPSO+ incorporatedwith a local search strategy improv-ing the particle position from its candidates is designed. Inthe end, the evaluation of these two algorithms includingtheir parameters turning and comparative studies based on4 different cases is given.
2. Multiobjective Optimization Model forService Composition
The SLA-aware service composition problem is a combi-national optimization problem for searching the optimabindings between each service and its service instance, whichis a NP-hard problem [6]. A workflow is modeled in Figure 1.It consists of a series of abstract services and each abstractservice has several concrete services to realize its function.Concrete services can be bound to an abstract service inparallel and it need to make sure that at least one concreteservice is bound to an abstract service.
When every abstract service has deployed with concreteservices, it forms a service composition. Multiple serviceinstances can be bound to an abstract service in parallel forimproving the service’s throughput and fault tolerance, whichare called redundant parallel. In order to satisfy multilevel
Table 1: QoS aggregation function in abstract service.
QoS Aggregation function
Throughput𝑀
∑𝑘=1
𝑥𝑖𝑗𝑘× 𝑄1(𝑠𝑗𝑘)
Latency 1∑𝑀𝑘=1
𝑥𝑖𝑗𝑘
𝑀
∑𝑘=1
𝑥𝑖𝑗𝑘× 𝑄2(𝑠𝑗𝑘)
Cost𝑀
∑𝑘=1
𝑥𝑖𝑗𝑘× 𝑄3(𝑠𝑗𝑘)
requirements from SSC problem, a solution representingmultilevel service composition has to be designed.
In order to judge whether a service composition satisfiesa given SLA, it is required to examine its end-to-end QoSby aggregating QoS measures of individual service instances.Suppose a two-dimensional vector 𝑆 = (𝑠
11, . . . , 𝑠
𝑁𝑀)
representing all concrete services, where 𝑁 denotes thequantity of abstract services included in an abstract workflowand 𝑀 denotes the quantity of concrete services relatedto each abstract service, and a three-dimensional vector𝑋 = (cs1, . . . , cs𝐿) = (𝑥
111, . . . , 𝑥
1𝑁𝑀, . . . , 𝑥
𝐿11, . . . , 𝑥
𝐿𝑁𝑀)
representing a solution of SSC problem, where 𝐿 denotes thequantity of levels included in the problem. The componentcs𝑖in solution𝑋means a service composition which satisfies
the 𝑖th level of SLA constraint, and component 𝑥𝑖𝑗𝑘
meansthe number of instances for concrete service 𝑠
𝑍; 𝑘 ∈ [1,𝑀], 𝑘 ∈ 𝑍. In order to be consistent with the for-mer settings, we denote a vector cs
𝑖= (cands
𝑖1, . . . , cands
𝑖𝑁)
to represent service composition cs𝑖, and its component is
defined as follows.
Definition 1 (candidate service). A part vector of solu-tion 𝑋 associated with one abstract service, cands
𝑖𝑗=
(𝑥𝑖𝑗1, . . . , 𝑥
𝑖𝑗𝑀), is defined as a candidate service if and only if
this part vector represents a deployment of concrete servicesassociated with the same abstract service 𝑗 in level 𝑖 and it isnot equal to zero.
QoS attributes of service composition such as throughput,latency, and cost are represented by𝑄
1, 𝑄2, and 𝑄
3, respec-
tively.The end-to-endQoS attributes of a service compositionare calculated by aggregating QoS measures of every serviceinstances based on their structure. Each abstract service isinterpreted as a collection of concrete services in redundantparallel and the aggregate functions are shown in Table 1. QoSattributes of a candidate service are calculated by aggregatingQoS measures of corresponding redundant parallel concreteinstance.
Table 2 shows aggregation functions among abstract ser-vices for different structure, and the notations ∏
𝑇, ∏𝐿,
and ∏𝐶
represent aggregation functions of throughput,latency, and cost, respectively.
Suppose there are three level user categories: platinum,gold, and silver users, so the quantity of levels is three, whichis 𝐿 = 3; and denote cs
1, cs2, and cs
3to represent three service
compositions for platinum, gold, and silver user, respectively.
Mathematical Problems in Engineering 3
Concrete service1-1
Concrete service1-1
Concrete service1-2
Concrete service1-3
Concrete service3-3
Concrete service2-3
Concrete service2-2
Concrete service2-1 Concrete service4-1
Concrete service4-2
Concrete service4-2
Concrete service4-3
Instantiate InstantiateInstantiate
Workflow instance (service composition)
Concrete
Concrete
Concrete
Concrete
Concrete
Concrete
Abstractservice 4
Abstract service 2Abstractservice 1
Abstract service 3
CRedundant parallel instance for abstract service 1
service1-1 service4-1
service4-2
service4-3
service1-2
service1-3
Concrete service2-1
Concrete service3-1
Concrete service3-2
Concrete service3-3
Concrete service2-2
Concrete service2-3
Figure 1: Service composition model for SSC.
Table 2: QoS aggregation function among abstract services.
Suppose each abstract service is associated with three con-crete services that operate at different QoS measures whichare high-end (high throughput/latency and high cost), low-end (low throughput/latency and low cost), and intermediate(intermediate throughput, latency, and cost), so quantity ofconcrete services related to each abstract service is three,which is𝑀 = 3. According to the supposition, QoS attributesof three level service compositions are calculated as follows:
𝑄1(cs1) =𝑁
∏𝑗=1
𝑇(𝑀
∑𝑘=1
𝑥1𝑗𝑘𝑄1(𝑠𝑗𝑘)) ,
𝑄2(cs1) =𝑁
∏𝑗=1
𝐿(𝑀
∑𝑘=1
𝑥1𝑗𝑘𝑄2(𝑠𝑗𝑘)) ,
𝑄3(cs1) =𝑁
∏𝑗=1
𝐶(𝑀
∑𝑘=1
𝑥1𝑗𝑘𝑄3(𝑠𝑗𝑘)) ,
𝑄1(cs2) =𝑁
∏𝑗=1
𝑇(𝑀
∑𝑘=1
𝑥2𝑗𝑘𝑄1(𝑠𝑗𝑘)) ,
𝑄2(cs2) =𝑁
∏𝑗=1
𝐿(𝑀
∑𝑘=1
𝑥2𝑗𝑘𝑄2(𝑠𝑗𝑘)) ,
𝑄3(cs2) =𝑁
∏𝑗=1
𝐶(𝑀
∑𝑘=1
𝑥2𝑗𝑘𝑄3(𝑠𝑗𝑘)) ,
𝑄1(cs3) =𝑁
∏𝑗=1
𝑇(𝑀
∑𝑘=1
𝑥3𝑗𝑘𝑄1(𝑠𝑗𝑘)) ,
𝑄2(cs3) =𝑁
∏𝑗=1
𝐿(𝑀
∑𝑘=1
𝑥3𝑗𝑘𝑄2(𝑠𝑗𝑘)) ,
𝑄3(cs3) =𝑁
∏𝑗=1
𝐶(𝑀
∑𝑘=1
𝑥3𝑗𝑘𝑄3(𝑠𝑗𝑘)) .
(1)
A vector of the SLA QoS constraints is 𝐶 = (𝐶1, . . . , 𝐶
7),
which represents themultilevel constraint and is expressed interms of a vector of upper or lower bounds for different QoScriteria. In SSC problem, there are a worst case throughputand latency for platinum and gold users, and there are a worstcase and a cost limit on silver users; in addition there is a limiton the total costs incurred by all three user categories. Andthe SLA constraints are expressed in detail as follows:
𝑄1(cs1) ≥ 𝐶1; 𝑄
2(cs1) ≤ 𝐶2,
𝑄1(cs2) ≥ 𝐶3; 𝑄
2(cs2) ≤ 𝐶4,
𝑄3(cs3) ≥ 𝐶5; 𝑄
3(cs3) ≤ 𝐶6,
𝑄3 (𝑋) ≤ 𝐶7.
(2)
SSC problem optimized in terms of three objectives; there aretotal throughput, latency, and cost incurred by all three usercategories, which are expressed in detail as follows:
𝑄1 (𝑋) = 𝑄1 (cs1) + 𝑄1 (cs2) + 𝑄1 (cs3) ,
𝑄2 (𝑋) = 𝑄2 (cs1) + 𝑄2 (cs2) + 𝑄2 (cs3) ,
𝑄3 (𝑋) = 𝑄3 (cs1) + 𝑄3 (cs2) + 𝑄3 (cs3) .
(3)
Definition 2 (SLA-aware service composition). For a givenabstract workflow 𝜁 and the SLAQoS constraints, SLA-awareservice composition is to find solutions related to three leveluser categories, which satisfy the global QoS constraints andoptimize total three objectives.
In order to use particle optimization algorithm to solveSSC problem, algorithm HMDPSO defined particle updatestrategy by introducing crossover operator to make globalsearch of the solution space; it designed mutation strategyto prevent particles swarm from premature convergence; andthe complete algorithm will be given in detail. In addition, inorder to accelerate the process of obtaining feasible solution,algorithm HMDPSO+ was also be designed which wascombined local-search strategy and algorithm HMDPSO.
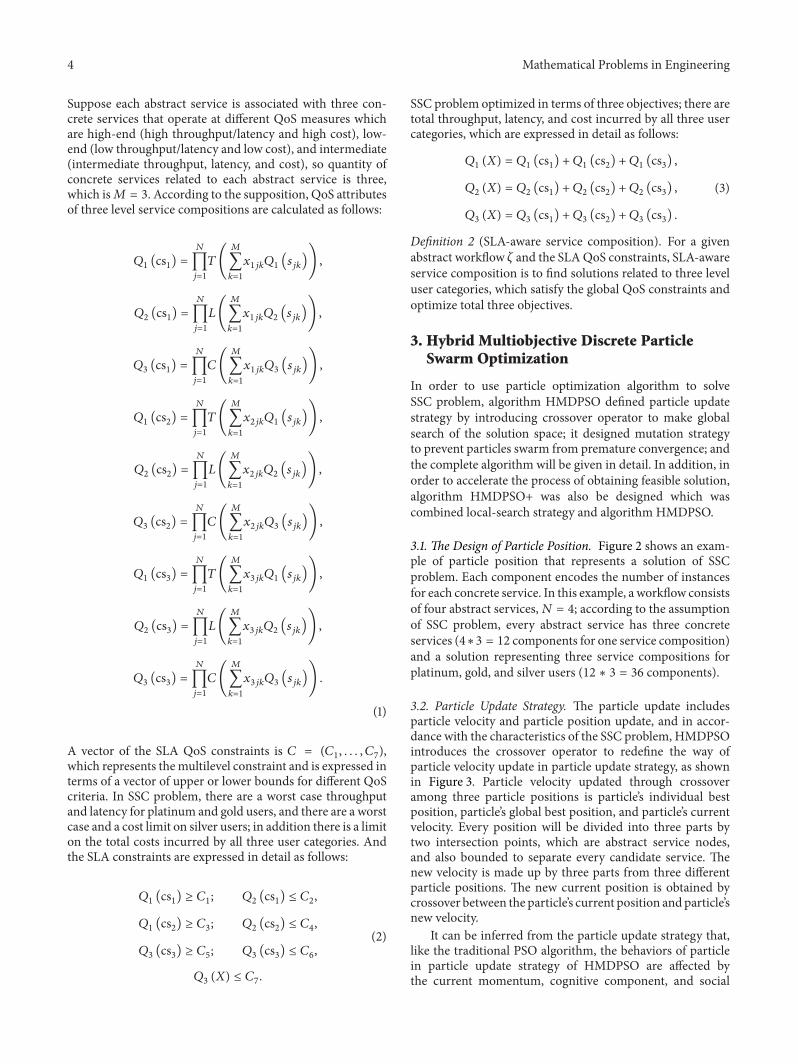
3.1. The Design of Particle Position. Figure 2 shows an exam-ple of particle position that represents a solution of SSCproblem. Each component encodes the number of instancesfor each concrete service. In this example, a workflow consistsof four abstract services,𝑁 = 4; according to the assumptionof SSC problem, every abstract service has three concreteservices (4∗3 = 12 components for one service composition)and a solution representing three service compositions forplatinum, gold, and silver users (12 ∗ 3 = 36 components).
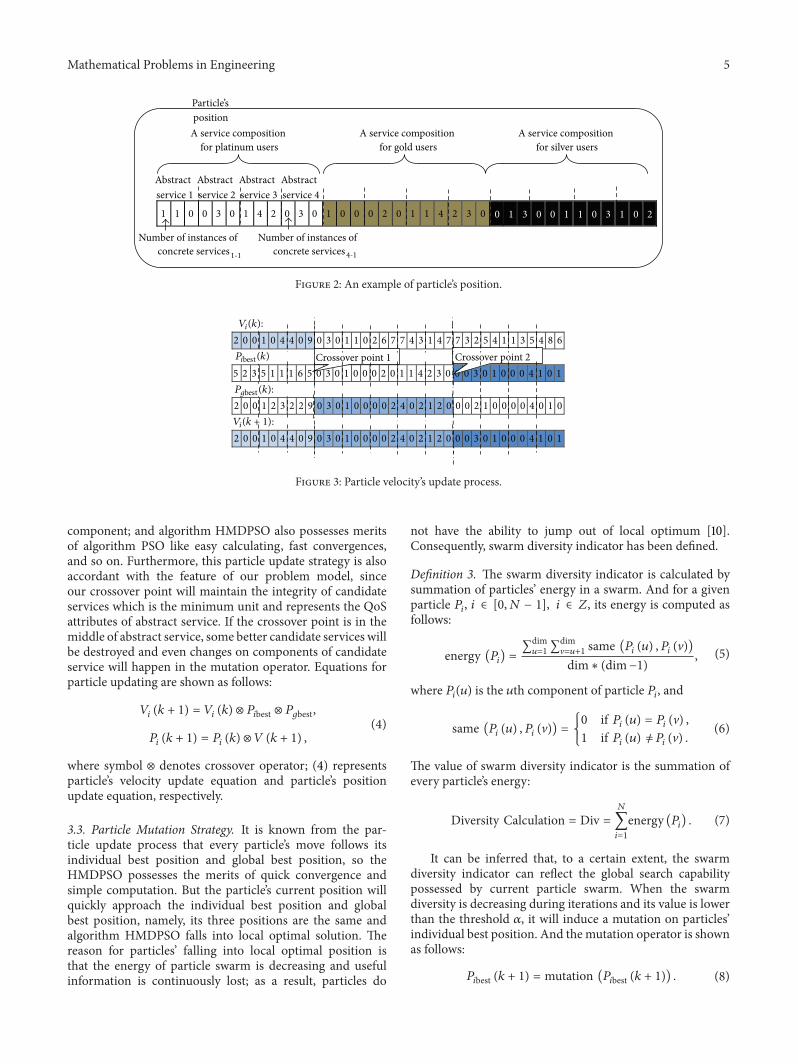
3.2. Particle Update Strategy. The particle update includesparticle velocity and particle position update, and in accor-dance with the characteristics of the SSC problem, HMDPSOintroduces the crossover operator to redefine the way ofparticle velocity update in particle update strategy, as shownin Figure 3. Particle velocity updated through crossoveramong three particle positions is particle’s individual bestposition, particle’s global best position, and particle’s currentvelocity. Every position will be divided into three parts bytwo intersection points, which are abstract service nodes,and also bounded to separate every candidate service. Thenew velocity is made up by three parts from three differentparticle positions. The new current position is obtained bycrossover between the particle’s current position andparticle’snew velocity.
It can be inferred from the particle update strategy that,like the traditional PSO algorithm, the behaviors of particlein particle update strategy of HMDPSO are affected bythe current momentum, cognitive component, and social
component; and algorithm HMDPSO also possesses meritsof algorithm PSO like easy calculating, fast convergences,and so on. Furthermore, this particle update strategy is alsoaccordant with the feature of our problem model, sinceour crossover point will maintain the integrity of candidateservices which is the minimum unit and represents the QoSattributes of abstract service. If the crossover point is in themiddle of abstract service, some better candidate services willbe destroyed and even changes on components of candidateservice will happen in the mutation operator. Equations forparticle updating are shown as follows:
𝑉𝑖 (𝑘 + 1) = 𝑉𝑖 (𝑘) ⊗ 𝑃𝑖best ⊗ 𝑃𝑔best,
𝑃𝑖 (𝑘 + 1) = 𝑃𝑖 (𝑘) ⊗ 𝑉 (𝑘 + 1) ,
(4)
where symbol ⊗ denotes crossover operator; (4) representsparticle’s velocity update equation and particle’s positionupdate equation, respectively.
3.3. Particle Mutation Strategy. It is known from the par-ticle update process that every particle’s move follows itsindividual best position and global best position, so theHMDPSO possesses the merits of quick convergence andsimple computation. But the particle’s current position willquickly approach the individual best position and globalbest position, namely, its three positions are the same andalgorithm HMDPSO falls into local optimal solution. Thereason for particles’ falling into local optimal position isthat the energy of particle swarm is decreasing and usefulinformation is continuously lost; as a result, particles do
not have the ability to jump out of local optimum [10].Consequently, swarm diversity indicator has been defined.
Definition 3. The swarm diversity indicator is calculated bysummation of particles’ energy in a swarm. And for a givenparticle 𝑃
𝑖, 𝑖 ∈ [0,𝑁 − 1], 𝑖 ∈ 𝑍, its energy is computed as
follows:
energy (𝑃𝑖) =
∑dim𝑢=1
∑dimV=𝑢+1 same (𝑃
𝑖 (𝑢) , 𝑃𝑖 (V))dim∗ (dim−1)
, (5)
where 𝑃𝑖(𝑢) is the 𝑢th component of particle 𝑃
𝑖, and
same (𝑃𝑖 (𝑢) , 𝑃𝑖 (V)) = {
0 if 𝑃𝑖 (𝑢) = 𝑃𝑖 (V) ,
1 if 𝑃𝑖 (𝑢) ̸= 𝑃
𝑖 (V) .(6)
The value of swarm diversity indicator is the summation ofevery particle’s energy:
Diversity Calculation = Div =𝑁
∑𝑖=1
energy (𝑃𝑖) . (7)
It can be inferred that, to a certain extent, the swarmdiversity indicator can reflect the global search capabilitypossessed by current particle swarm. When the swarmdiversity is decreasing during iterations and its value is lowerthan the threshold 𝛼, it will induce a mutation on particles’individual best position. And themutation operator is shownas follows:
}AssignFitnessValues(𝐺best𝑘 ∪ 𝑄𝑘)𝐺best𝑘+1 ← Top 𝜆 of 𝐺best𝑘 ∪ 𝑄𝑘𝑘 ← 𝑘 + 1}
Procedure 1: HMDPSO.
New information is introduced into particle swarmthrough particle position mutation: it will increase particleswarm diversity, guide particles search the area that theynever been, and prevent premature and earlier convergence.
3.4. HMDPSO. Procedure 1 shows the optimization processin HMDPSO. Particle swarm 𝑃0 and global particle swarm𝐺0best are randomly initialized in the beginning; namely,particles in 𝑃0 randomly initialize their current position𝑃𝑖(0), velocity𝑉
𝑖(0), and individual best position𝑃
𝑖best(0); andparticles in 𝐺0best randomly initialize their current position.
In each iteration, swarm diversity indicator of 𝑃𝑘 iscalculated firstly, and then swarm particle updates and everynew particle’s individual best position will be added toparticle swarm 𝑄𝑘; after that fitness of particles in 𝑄𝑘 ∪ 𝐺𝑘bestis computed by function Assign Fitness Value( ) and top 𝜆particles with respect to their fitness value used to update𝐺𝑘best. When𝐺𝑘best is replaced by𝐺
(𝑘+1)
best , one iteration is ended,and HMDPSO repeats the above iteration for 𝑘max times.
For particle 𝑖, swarm particle update can be divided intothree parts; the first, when swarm particle diversity is lowerthan 𝛼, components of particle 𝑖’s individual best position
Domination rank = 1Domination value = 8
Domination rank = 2Domination value = 3
Domination rank = 2Domination value = 4
= Individual
Cost (objective to be minimized)
Thro
ughp
ut (o
bjec
tive t
o be
max
imiz
ed)
Figure 4: An example domination ranking.
are randomly altered by mutation( ); the second, 𝐺V(𝑘) isselected with binary tournaments from 𝐺best, as combinedwith particle 𝑖’s velocity and individual best position 𝑃
𝑖best(𝑘),particle 𝑖’s new current position 𝑃
𝑖(𝑘 + 1) is produced
according to the particle update strategy; the third, it needsto make a comparison between 𝑃
𝑖(𝑘 + 1) and 𝑃
𝑖best(𝑘)about constraint domination [4], when 𝑃
𝑖best(𝑘) is said to beconstraint domination of 𝑃
𝑖(𝑘 + 1), 𝑃
𝑖best(𝑘) stays the same;when 𝑃
𝑖best(𝑘) is said to dominate 𝑃𝑖(𝑘 + 1) or they are
nondominated, 𝑃𝑖best(𝑘 + 1) is replaced by 𝑃
𝑖(𝑘 + 1) and
𝑃𝑖best(𝑘 + 1) is added to particle swarm 𝑄𝑘.In fitness function, every particle can get its domination
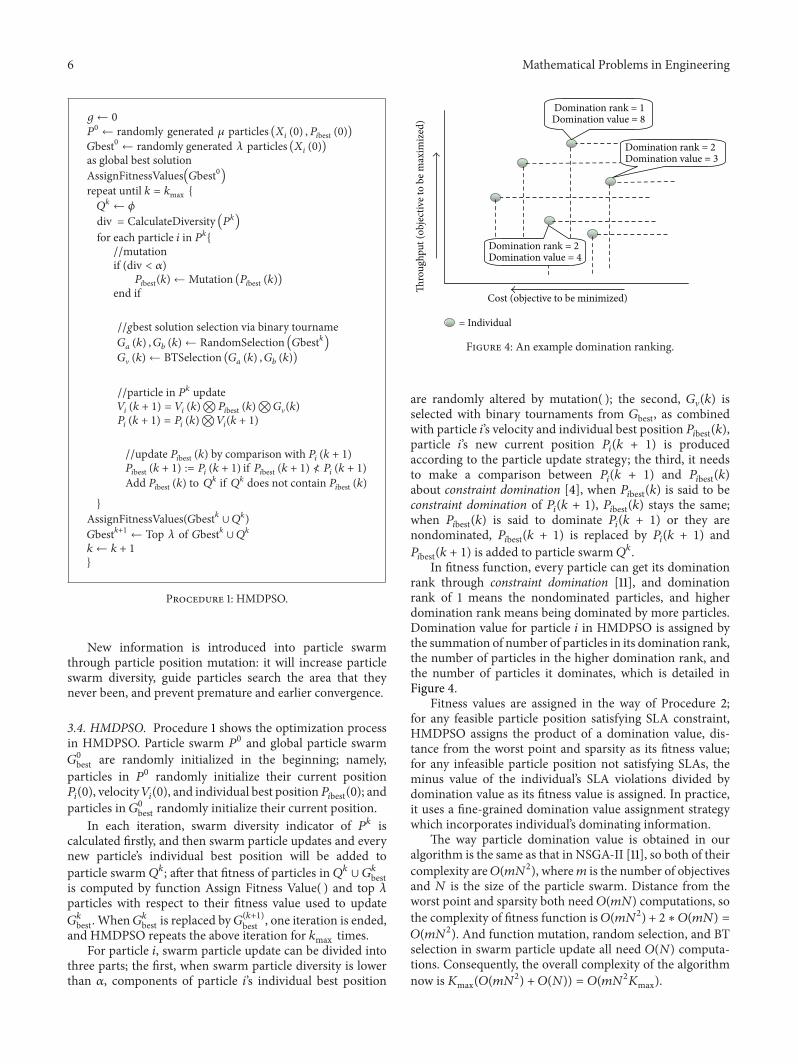
rank through constraint domination [11], and dominationrank of 1 means the nondominated particles, and higherdomination rank means being dominated by more particles.Domination value for particle 𝑖 in HMDPSO is assigned bythe summation of number of particles in its domination rank,the number of particles in the higher domination rank, andthe number of particles it dominates, which is detailed inFigure 4.
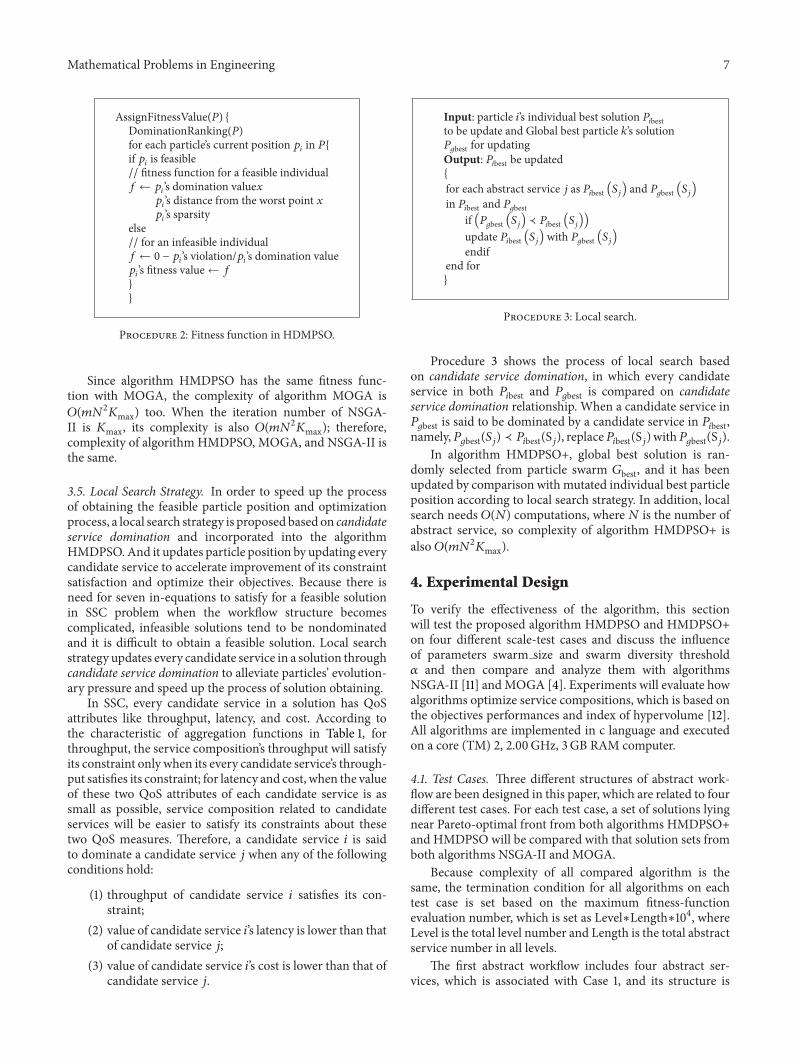
Fitness values are assigned in the way of Procedure 2;for any feasible particle position satisfying SLA constraint,HMDPSO assigns the product of a domination value, dis-tance from the worst point and sparsity as its fitness value;for any infeasible particle position not satisfying SLAs, theminus value of the individual’s SLA violations divided bydomination value as its fitness value is assigned. In practice,it uses a fine-grained domination value assignment strategywhich incorporates individual’s dominating information.
The way particle domination value is obtained in ouralgorithm is the same as that in NSGA-II [11], so both of theircomplexity are𝑂(𝑚𝑁2), where𝑚 is the number of objectivesand 𝑁 is the size of the particle swarm. Distance from theworst point and sparsity both need 𝑂(𝑚𝑁) computations, sothe complexity of fitness function is𝑂(𝑚𝑁2) + 2 ∗ 𝑂(𝑚𝑁) =𝑂(𝑚𝑁2). And function mutation, random selection, and BTselection in swarm particle update all need 𝑂(𝑁) computa-tions. Consequently, the overall complexity of the algorithmnow is𝐾max(𝑂(𝑚𝑁
2) + 𝑂(𝑁)) = 𝑂(𝑚𝑁2𝐾max).
Mathematical Problems in Engineering 7
AssignFitnessValue(𝑃) {DominationRanking(𝑃)for each particle’s current position 𝑝
𝑖in 𝑃{
if 𝑝𝑖is feasible
// fitness function for a feasible individual𝑓 ← 𝑝
𝑖’s domination value𝑥
𝑝𝑖’s distance from the worst point 𝑥
𝑝𝑖’s sparsity
else// for an infeasible individual𝑓 ← 0 − 𝑝
𝑖’s violation/𝑝
𝑖’s domination value
𝑝𝑖’s fitness value ← 𝑓
}}
Procedure 2: Fitness function in HDMPSO.
Since algorithm HMDPSO has the same fitness func-tion with MOGA, the complexity of algorithm MOGA is𝑂(𝑚𝑁2𝐾max) too. When the iteration number of NSGA-II is 𝐾max, its complexity is also 𝑂(𝑚𝑁2𝐾max); therefore,complexity of algorithm HMDPSO, MOGA, and NSGA-II isthe same.
3.5. Local Search Strategy. In order to speed up the processof obtaining the feasible particle position and optimizationprocess, a local search strategy is proposed based on candidateservice domination and incorporated into the algorithmHMDPSO.And it updates particle position by updating everycandidate service to accelerate improvement of its constraintsatisfaction and optimize their objectives. Because there isneed for seven in-equations to satisfy for a feasible solutionin SSC problem when the workflow structure becomescomplicated, infeasible solutions tend to be nondominatedand it is difficult to obtain a feasible solution. Local searchstrategy updates every candidate service in a solution throughcandidate service domination to alleviate particles’ evolution-ary pressure and speed up the process of solution obtaining.
In SSC, every candidate service in a solution has QoSattributes like throughput, latency, and cost. According tothe characteristic of aggregation functions in Table 1, forthroughput, the service composition’s throughput will satisfyits constraint only when its every candidate service’s through-put satisfies its constraint; for latency and cost, when the valueof these two QoS attributes of each candidate service is assmall as possible, service composition related to candidateservices will be easier to satisfy its constraints about thesetwo QoS measures. Therefore, a candidate service 𝑖 is saidto dominate a candidate service 𝑗 when any of the followingconditions hold:
(1) throughput of candidate service 𝑖 satisfies its con-straint;
(2) value of candidate service 𝑖’s latency is lower than thatof candidate service 𝑗;
(3) value of candidate service 𝑖’s cost is lower than that ofcandidate service 𝑗.
Input: particle 𝑖’s individual best solution 𝑃𝑖best
to be update and Global best particle 𝑘’s solution𝑃𝑔best for updating
Output: 𝑃𝑖best be updated
{for each abstract service 𝑗 as 𝑃
𝑖best (𝑆𝑗) and 𝑃𝑔best (𝑆𝑗)in 𝑃𝑖best and 𝑃𝑔bestif (𝑃𝑔best (𝑆𝑗) ≺ 𝑃𝑖best (𝑆𝑗))
update 𝑃𝑖best (𝑆𝑗) with 𝑃𝑔best (𝑆𝑗)
endifend for}
Procedure 3: Local search.
Procedure 3 shows the process of local search basedon candidate service domination, in which every candidateservice in both 𝑃
𝑖best and 𝑃𝑔best is compared on candidate
service domination relationship. When a candidate service in𝑃𝑔best is said to be dominated by a candidate service in 𝑃
𝑖best,namely,𝑃
𝑔best(𝑆𝑗) ≺ 𝑃𝑖best(S𝑗), replace𝑃𝑖best(S𝑗)with𝑃𝑔best(S𝑗).In algorithm HMDPSO+, global best solution is ran-
domly selected from particle swarm 𝐺best, and it has beenupdated by comparison with mutated individual best particleposition according to local search strategy. In addition, localsearch needs 𝑂(𝑁) computations, where𝑁 is the number ofabstract service, so complexity of algorithm HMDPSO+ isalso 𝑂(𝑚𝑁2𝐾max).
4. Experimental Design
To verify the effectiveness of the algorithm, this sectionwill test the proposed algorithm HMDPSO and HMDPSO+on four different scale-test cases and discuss the influenceof parameters swarm size and swarm diversity threshold𝛼 and then compare and analyze them with algorithmsNSGA-II [11] andMOGA [4]. Experiments will evaluate howalgorithms optimize service compositions, which is based onthe objectives performances and index of hypervolume [12].All algorithms are implemented in c language and executedon a core (TM) 2, 2.00GHz, 3GB RAM computer.
4.1. Test Cases. Three different structures of abstract work-flow are been designed in this paper, which are related to fourdifferent test cases. For each test case, a set of solutions lyingnear Pareto-optimal front from both algorithms HMDPSO+and HMDPSO will be compared with that solution sets fromboth algorithms NSGA-II and MOGA.
Because complexity of all compared algorithm is thesame, the termination condition for all algorithms on eachtest case is set based on the maximum fitness-functionevaluation number, which is set as Level∗Length∗104, whereLevel is the total level number and Length is the total abstractservice number in all levels.
The first abstract workflow includes four abstract ser-vices, which is associated with Case 1, and its structure is
8 Mathematical Problems in Engineering
Table 3: QoS attributes of concrete services.
Abstractservice
Concreteservice
Prob distribution and QoS measures CostProb (%) Throughput Latency
1
1
0.85 9000 60
900.05 10000 50
0.05 6000 80
0.05 0 0
20.80 5500 60
500.15 4000 100
0.05 0 0
3
0.30 2000 200
100.30 3000 180
0.20 1500 250
0.20 0 0
2
1 0.70 2000 20 500.30 2300 18
20.90 4000 15
1000.05 6000 13
0.05 3000 20
3
0.70 4000 25
700.20 3000 23
0.05 2500 30
0.05 0 0
3
1 0.70 1500 30 300.30 2000 20
20.80 3000 12
800.10 5000 200.10 500 80
30.50 1000 60
100.30 500 500.20 0 0
4
1 0.75 2500 50 200.25 3000 55
20.90 6000 15
700.05 4000 200.05 3000 20
3
0.85 1000 90
50.05 500 1200.05 100 1500.05 0 0
5
10.80 5500 18
760.10 2500 230.10 1400 27
2 0.75 3800 25 440.25 1500 35
30.85 3100 30
300.10 1000 450.05 900 60
Table 3: Continued.
Abstractservice
Concreteservice
Prob distribution and QoS measures CostProb (%) Throughput Latency
6
10.80 2000 15
670.15 1600 220.05 100 25
20.65 4600 35
450.25 3800 450.10 2500 50
3 0.85 3100 40 300.15 2900 55
7
10.60 7800 35
800.25 6500 650.15 600 70
20.70 5600 55
510.20 3900 650.10 300 70
3 0.80 1900 140 100.20 900 175
Abstract service 1
Abstract service 4
Abstract service 3
Abstract service 2
Abstract service 6
Abstract service 5
Abstract service 7
Figure 5: Case 2 abstract workflow.
shown as in Figure 1. And each abstract service is associatedwith three concrete services that operate at different QoSmeasures in Table 3: high-end (high throughput/latency andhigh cost), low-end (low throughput/latency and low cost),and intermediate (intermediate throughput/latency and lowcost). Date set for Case 1 includes the concrete services andtheir distribution associated with the former four abstractservices.
The SLA for Case 1 is illustrated in Table 4, and platinumand gold users have SLA on their throughput and latency;silver users have SLA on their throughput and cost; and thereis a SLA on their total cost. Objective functions of Case 1 areobtained according to its workflow structure as in Figure 1,and objective formula (3); in the same way, SLA constraintfunctions are obtained according to SLA constraint for Case 1in Table 4 and constraint formula (2). Termination conditionof Case 1, the maximum fitness function evaluation number,is set as 1.2∗105. All results are the average of 10 independentruns.
The second abstract workflow includes seven abstractservices, which is related to Case 2 and its structure, includingbranch structure, as shown in Figure 5.This branch structuremeans that when one abstract service execution is completed,only one of several abstract services connected with itwill be executed. Each abstract service in Case 2 is alsoassociated with three concrete services operating at different
Mathematical Problems in Engineering 9
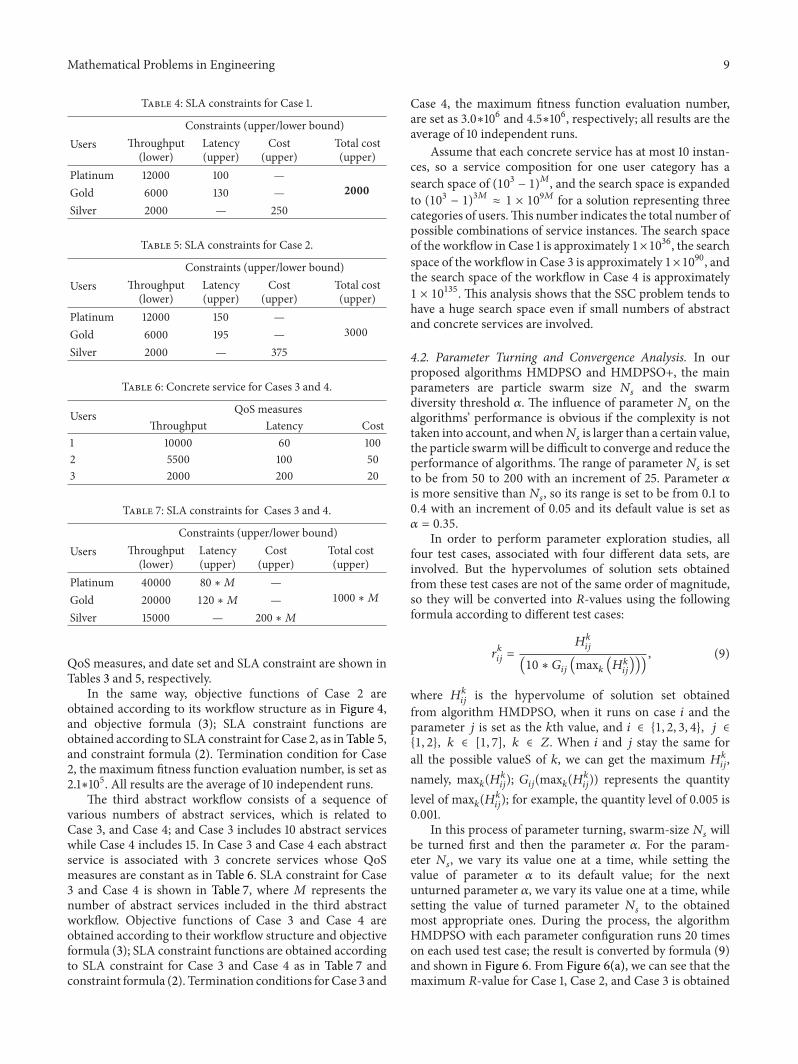
Table 4: SLA constraints for Case 1.
UsersConstraints (upper/lower bound)
Throughput(lower)
Latency(upper)
Cost(upper)
Total cost(upper)
Platinum 12000 100 —2000Gold 6000 130 —
Silver 2000 — 250
Table 5: SLA constraints for Case 2.
UsersConstraints (upper/lower bound)
Throughput(lower)
Latency(upper)
Cost(upper)
Total cost(upper)
Platinum 12000 150 —3000Gold 6000 195 —
Silver 2000 — 375
Table 6: Concrete service for Cases 3 and 4.
Users QoS measuresThroughput Latency Cost
1 10000 60 1002 5500 100 503 2000 200 20
Table 7: SLA constraints for Cases 3 and 4.
UsersConstraints (upper/lower bound)
Throughput(lower)
Latency(upper)
Cost(upper)
Total cost(upper)
Platinum 40000 80 ∗𝑀 —1000 ∗𝑀Gold 20000 120 ∗𝑀 —
Silver 15000 — 200 ∗𝑀
QoS measures, and date set and SLA constraint are shown inTables 3 and 5, respectively.
In the same way, objective functions of Case 2 areobtained according to its workflow structure as in Figure 4,and objective formula (3); SLA constraint functions areobtained according to SLA constraint for Case 2, as in Table 5,and constraint formula (2). Termination condition for Case2, the maximum fitness function evaluation number, is set as2.1∗105. All results are the average of 10 independent runs.
The third abstract workflow consists of a sequence ofvarious numbers of abstract services, which is related toCase 3, and Case 4; and Case 3 includes 10 abstract serviceswhile Case 4 includes 15. In Case 3 and Case 4 each abstractservice is associated with 3 concrete services whose QoSmeasures are constant as in Table 6. SLA constraint for Case3 and Case 4 is shown in Table 7, where 𝑀 represents thenumber of abstract services included in the third abstractworkflow. Objective functions of Case 3 and Case 4 areobtained according to their workflow structure and objectiveformula (3); SLA constraint functions are obtained accordingto SLA constraint for Case 3 and Case 4 as in Table 7 andconstraint formula (2). Termination conditions forCase 3 and
Case 4, the maximum fitness function evaluation number,are set as 3.0∗106 and 4.5∗106, respectively; all results are theaverage of 10 independent runs.
Assume that each concrete service has at most 10 instan-ces, so a service composition for one user category has asearch space of (103 − 1)𝑀, and the search space is expandedto (103 − 1)3𝑀 ≈ 1 × 10⁹𝑀 for a solution representing threecategories of users.This number indicates the total number ofpossible combinations of service instances. The search spaceof the workflow in Case 1 is approximately 1×1036, the searchspace of the workflow in Case 3 is approximately 1×1090, andthe search space of the workflow in Case 4 is approximately1 × 10135. This analysis shows that the SSC problem tends tohave a huge search space even if small numbers of abstractand concrete services are involved.
4.2. Parameter Turning and Convergence Analysis. In ourproposed algorithms HMDPSO and HMDPSO+, the mainparameters are particle swarm size 𝑁
𝑠and the swarm
diversity threshold 𝛼. The influence of parameter 𝑁𝑠on the
algorithms’ performance is obvious if the complexity is nottaken into account, andwhen𝑁
𝑠is larger than a certain value,
the particle swarmwill be difficult to converge and reduce theperformance of algorithms. The range of parameter𝑁
𝑠is set
to be from 50 to 200 with an increment of 25. Parameter 𝛼is more sensitive than𝑁
𝑠, so its range is set to be from 0.1 to
0.4 with an increment of 0.05 and its default value is set as𝛼 = 0.35.
In order to perform parameter exploration studies, allfour test cases, associated with four different data sets, areinvolved. But the hypervolumes of solution sets obtainedfrom these test cases are not of the same order of magnitude,so they will be converted into 𝑅-values using the followingformula according to different test cases:
𝑟𝑘𝑖𝑗=
𝐻𝑘𝑖𝑗
(10 ∗ 𝐺𝑖𝑗(max𝑘(𝐻𝑘𝑖𝑗)))
, (9)
where 𝐻𝑘𝑖𝑗
is the hypervolume of solution set obtainedfrom algorithm HMDPSO, when it runs on case 𝑖 and theparameter 𝑗 is set as the 𝑘th value, and 𝑖 ∈ {1, 2, 3, 4}, 𝑗 ∈{1, 2}, 𝑘 ∈ [1, 7], 𝑘 ∈ 𝑍. When 𝑖 and 𝑗 stay the same forall the possible valueS of 𝑘, we can get the maximum 𝐻𝑘
𝑖𝑗,
namely, max𝑘(𝐻𝑘𝑖𝑗); 𝐺𝑖𝑗(max𝑘(𝐻𝑘𝑖𝑗)) represents the quantity
level of max𝑘(𝐻𝑘𝑖𝑗); for example, the quantity level of 0.005 is
0.001.In this process of parameter turning, swarm-size 𝑁
𝑠will
be turned first and then the parameter 𝛼. For the param-eter 𝑁
𝑠, we vary its value one at a time, while setting the
value of parameter 𝛼 to its default value; for the nextunturned parameter 𝛼, we vary its value one at a time, whilesetting the value of turned parameter 𝑁
𝑠to the obtained
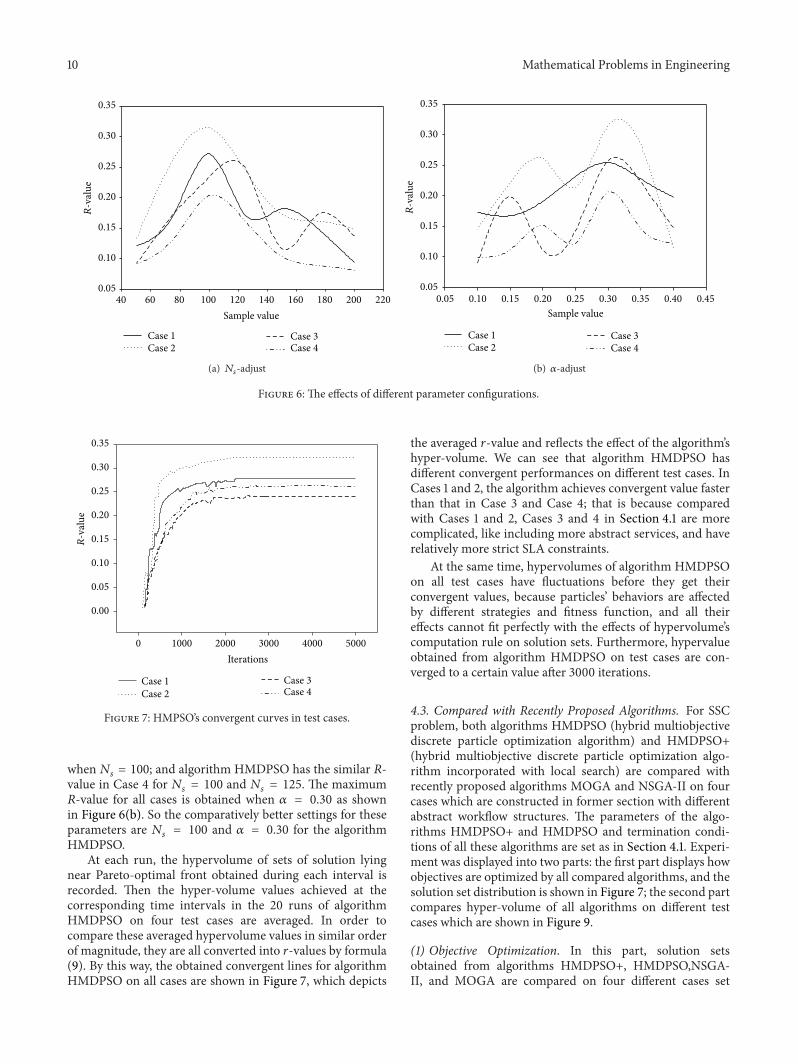
most appropriate ones. During the process, the algorithmHMDPSO with each parameter configuration runs 20 timeson each used test case; the result is converted by formula (9)and shown in Figure 6. From Figure 6(a), we can see that themaximum 𝑅-value for Case 1, Case 2, and Case 3 is obtained
Figure 6: The effects of different parameter configurations.
Iterations0 1000 2000 3000 4000 5000
R-v
alue
0.00
0.05
0.10
0.15
0.20
0.25
0.30
0.35
Case 1Case 2
Case 3Case 4
Figure 7: HMPSO’s convergent curves in test cases.
when𝑁𝑠= 100; and algorithm HMDPSO has the similar 𝑅-
value in Case 4 for 𝑁𝑠= 100 and 𝑁
𝑠= 125. The maximum
𝑅-value for all cases is obtained when 𝛼 = 0.30 as shownin Figure 6(b). So the comparatively better settings for theseparameters are 𝑁
𝑠= 100 and 𝛼 = 0.30 for the algorithm
HMDPSO.At each run, the hypervolume of sets of solution lying
near Pareto-optimal front obtained during each interval isrecorded. Then the hyper-volume values achieved at thecorresponding time intervals in the 20 runs of algorithmHMDPSO on four test cases are averaged. In order tocompare these averaged hypervolume values in similar orderof magnitude, they are all converted into 𝑟-values by formula(9). By this way, the obtained convergent lines for algorithmHMDPSO on all cases are shown in Figure 7, which depicts
the averaged 𝑟-value and reflects the effect of the algorithm’shyper-volume. We can see that algorithm HMDPSO hasdifferent convergent performances on different test cases. InCases 1 and 2, the algorithm achieves convergent value fasterthan that in Case 3 and Case 4; that is because comparedwith Cases 1 and 2, Cases 3 and 4 in Section 4.1 are morecomplicated, like including more abstract services, and haverelatively more strict SLA constraints.
At the same time, hypervolumes of algorithm HMDPSOon all test cases have fluctuations before they get theirconvergent values, because particles’ behaviors are affectedby different strategies and fitness function, and all theireffects cannot fit perfectly with the effects of hypervolume’scomputation rule on solution sets. Furthermore, hypervalueobtained from algorithm HMDPSO on test cases are con-verged to a certain value after 3000 iterations.
4.3. Compared with Recently Proposed Algorithms. For SSCproblem, both algorithms HMDPSO (hybrid multiobjectivediscrete particle optimization algorithm) and HMDPSO+(hybrid multiobjective discrete particle optimization algo-rithm incorporated with local search) are compared withrecently proposed algorithms MOGA and NSGA-II on fourcases which are constructed in former section with differentabstract workflow structures. The parameters of the algo-rithms HMDPSO+ and HMDPSO and termination condi-tions of all these algorithms are set as in Section 4.1. Experi-ment was displayed into two parts: the first part displays howobjectives are optimized by all compared algorithms, and thesolution set distribution is shown in Figure 7; the second partcompares hyper-volume of all algorithms on different testcases which are shown in Figure 9.
(1) Objective Optimization. In this part, solution setsobtained from algorithms HMDPSO+, HMDPSO,NSGA-II, and MOGA are compared on four different cases set
Mathematical Problems in Engineering 11
0.0
0.2
0.4
0.6
0.8
1.0
0.00.2
0.40.6
0.81.0
0.00.20.4
0.60.81.0
Obj
ectiv
e—th
roug
hput
Objecti
ve—
cost
Objective—latency
0
(a) Solution sets distribution of Case 1
0.0
0.2
0.4
0.6
0.8
1.0
0.0
0.20.4
0.60.8
1.0
0.00.20.4
0.60.8
0.0
.2
4
6
0 0
0.20.4
0.60.8
1
0 20.40.6
0.8
Obj
ectiv
e—th
roug
hput
Objecti
ve—
cost
Objective—latency
(b) Solution sets distribution of Case 2
0.0
0.2
0.4
0.6
0.8
1.0
0.00.2
0.40.6
0.81.0
0.00.20.40.60.8
HMDPSO+HMDPSO NSGA-II
MOGA
Obj
ectiv
e—th
roug
hput
Objecti
ve—
cost
Objective—latency
(c) Solution sets distribution of Case 3
0.0
0.2
0.4
0.6
0.8
1.0
0.00.20.40.6
0.81.0
Obj
ectiv
e—th
roug
hput
HMDPSO+HMDPSO NSGA-II
MOGA
0.00.2
0.40.6
0.81.0
Objecti
ve—
cost
Objective—latency
(d) Soution sets distribution of Case 4
Figure 8: The solution sets distribution on different cases.
as before. The 100-solution sets are selected with largesthyper-volume among the results in 20 independent runs onfour different cases, and every solution is associated withthree objectives which are normalized and the larger, thebetter. All the statistical experiment results of the mean(mean) and standard deviation (STD) of all three objectivesassociated with solution sets are summarized in Table 8among HMDPSO+, HMDPSO, MOGA, and NSGA-II. Thetwo-tailed 𝑡-test is used to verify whether every objectiveof HMDPSO+, HMDPSO, MOGA, and NSGA-II hasdistinctive difference with 99 degrees of freedom andsignificance level 𝛼 = 0.05.
As observed from Table 8, we can see that the itemsof “all three objectives” of algorithm HMDPSO+ are much
better than those of algorithms HMDPSO, MOGA, andNSGA-II. The values of the test statistics between algorithmsHMDPSO+ and HMDPSO and MOGA and NSGA-II aregiven as the 𝑡-test column in the Table 8, which showsthat the mean results between algorithm HMDPSO+ andalgorithm HMDPSO, MOGA/NSGA-II have significant dif-ference at the 5% level. So solutions produced by algorithmHMDPSO+ are obviously better than that produced byalgorithmHMDPSO,MOGA, andNSGA-II, on all objectivesand all cases, and this is further proved by Figure 7.
Solution sets with largest hypervolume are also plotted ina three-dimensional coordinate system according to differentcases in Figure 8. And we can see that the effect of solutionsets plotted in Figure 8 is accordant with the analysis in
12 Mathematical Problems in Engineering
Table 8: Performance comparisons among algorithms HMDPSO+, HMDPSO, MOGA, and NSGA-II with all objectives of composite webservice in different sets. The value of 𝑡 with 99 degrees of freedom is significant at 𝛼 = 0.05 by a two-tailed test.
Table 8. For example in Case 1, mean of “all three objectives”of algorithm HMDPSO+ is better than those of algorithmsHMDPSO, MOGA, and NSGA-II as in Table 8, and thecoordinate value of solutions from algorithm HMDPSO+is relatively larger than those of the compared algorithm.The STD value of “all three objectives” is related to thedegree of distribution concentration, since solution set fromalgorithm HMDSPO+ with relatively smaller STD value,solutions in that set distributes more concentrate as inFigure 8 accordingly.
The 𝑡-test value of “all three objectives” represents thelevel of significance of differences and the larger the 𝑡-testvalue is, the bigger the difference is. The difference of“all three objectives” between algorithm HMDPSO+ andalgorithm NSGA-II is the largest among all the differencesof “all three objectives” between algorithm HMDPSO+ andother compared algorithms as in Table 8; accordingly, wecan see that distribution of solution sets obtained fromalgorithm HMDPSO+ is roughly farthest from the distri-bution of solution sets obtained from algorithm NSGA-II.The 𝑡-test values of “all three objectives” between algorithmHMDPSO/MOGA and algorithm HMDPSO+ are near asin Table 8, and distribution of solution sets obtained fromalgorithms HMDPSO and MOGA overlaps each other withsome area, and they are relatively the same far away fromthe distribution of solution sets obtained from algorithmHMDPSO+. As far as other cases are considered, similarsituations appear again that algorithm HMDPSO+ greatlyoutperforms algorithms HMDPSO, MOGA, and NSGA-IIand the superiority ofMDOSP+overHMDPSO,MOGA, andNSGA-II is more and more clear.
These results indicate that algorithm HMDPSO+ withlocal search strategies proposed in this paper has powerful
search ability and excellent convergence property whencompared with algorithms HMDPSO, MOGA, and NSGA-II for SLA-aware service composition problem with differentscales and different workflow structures.
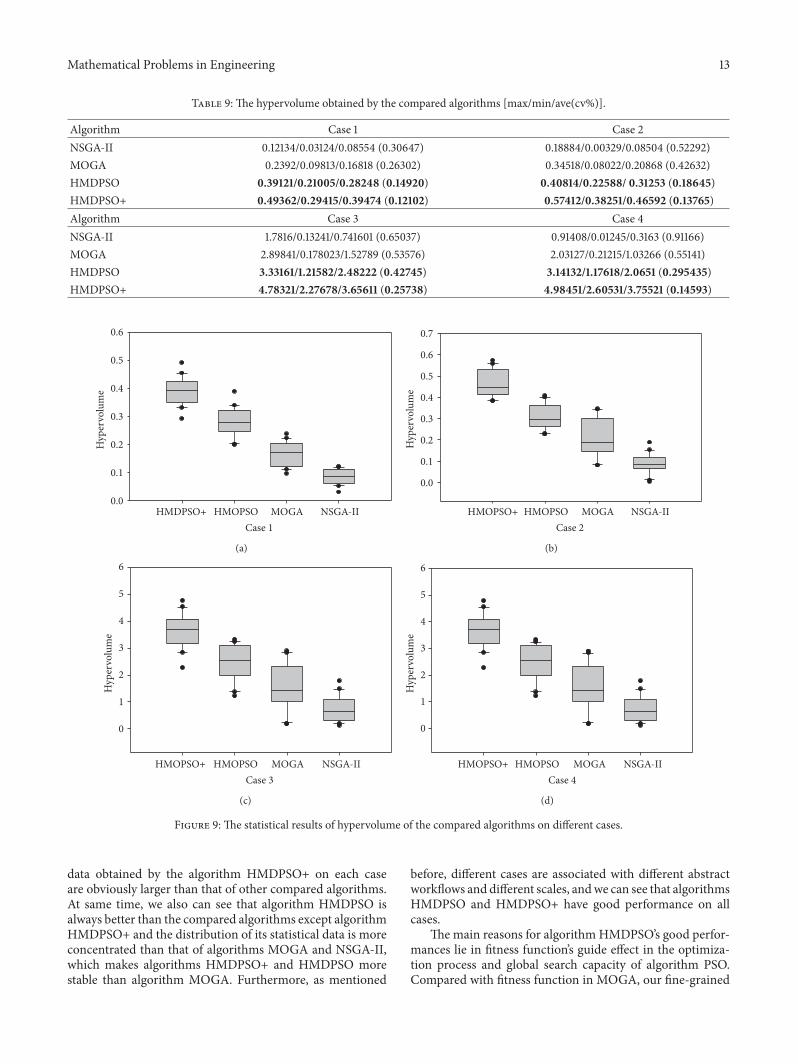
(2) Hypervolume Comparison. In this part, we compare thehyper-volumes of solution sets from algorithms HMDPSO+,HMDPSO, MOGA, and NSGA-II on 4 different scale-testcases set as in Section 4.1. We run each algorithm twentytimes on each test case. The maximum hypervolume, min-imum hyper-volume, mean, and the coefficient of variationobtained by each compared algorithm in the twenty runson each instance are given in Table 9. Coefficient of varia-tion, which is dimensionless and scale invariant variance, isdefined as the ratio of the standard deviation: CV = 𝜎/𝜇,where𝜎 and𝜇 are the standard deviation and themeanofQoSvalues, respectively. Lower CVmeans that solutions are moreequally distributed over the objective space. We can see thatthe maximum hyper-volume, minimum hyper-volume, andmean value obtained by the algorithm HMDPSO+ for eachtest case are larger than those obtained by the other comparedalgorithms. It also has achieved relatively the smallest CVvalues for all cases. Therefore, we can clearly get that thealgorithm HMDPSO+ is more stable than the other com-pared algorithms and can perform better than all the othercompared algorithms.This can be further proved by Figure 9,which explicitly shows the statistical results using the box plotbased on the hyper-volume obtained by the compared algo-rithms on each test case. It gives the distribution of the hyper-volume obtained by each algorithm, including the smallestobservation, lower quartile, median, mean, upper quartile,and the largest observation.We can see that all these statistical
Mathematical Problems in Engineering 13
Table 9: The hypervolume obtained by the compared algorithms [max/min/ave(cv%)].
Figure 9: The statistical results of hypervolume of the compared algorithms on different cases.
data obtained by the algorithm HMDPSO+ on each caseare obviously larger than that of other compared algorithms.At same time, we also can see that algorithm HMDPSO isalways better than the compared algorithms except algorithmHMDPSO+ and the distribution of its statistical data is moreconcentrated than that of algorithms MOGA and NSGA-II,which makes algorithms HMDPSO+ and HMDPSO morestable than algorithm MOGA. Furthermore, as mentioned
before, different cases are associated with different abstractworkflows and different scales, andwe can see that algorithmsHMDPSO and HMDPSO+ have good performance on allcases.
The main reasons for algorithmHMDPSO’s good perfor-mances lie in fitness function’s guide effect in the optimiza-tion process and global search capacity of algorithm PSO.Compared with fitness function in MOGA, our fine-grained
14 Mathematical Problems in Engineering
fitness function will assign different fitness value to particlesin the same domination rank to prevent particles with betterQoS attributes from being discarded and improve the accu-racy of particles distinguishing. When particles representinfeasible solution, this fitness function will accelerate thefeasible solution searching process; when particles representfeasible solution, it will improve the optimization effectsof our algorithm. Optimization process in NSGA-II onlyfocuses on the nondominated individuals, and its accuracyof solution distinguishing is even lower than that of MOGA,so algorithm HMDPSO performances better than these twoalgorithms on SSC problem.
And the reason for algorithm HMDPSO+’s better per-formances lies in merits inherited from algorithm HMDPSOand its incorporation with local search strategy. Local searchstrategy can update poorQoS attribute candidate service withbetter candidate service and keep the good QoS attributecandidate service for a particle; then, it will decrease thepossibility of a particle with good QoS attribute candidateservice to be discarded and increase the possibility of aparticle with poor QoS attribute service entering next iter-ation to promote the optimization performance; more thanthat, efficiency of algorithm will not be reduced after theincorporation with local search strategy, since its complexityis 𝑂(𝑛). So, we can conclude that the algorithm HMDPSO+(algorithm HMDPSO incorporated with local search strat-egy) outperforms the compared methods in terms of thehypervolume and possesses competitive performance forthe large scale service selection problem with all kinds ofconnection structures.
5. Conclusions
For the SLA-aware service composition problem, multiob-jective discrete particle optimization algorithm (HMDPSO)is proposed and its improved algorithm HMDPSO+ whichincorporates local search strategy into algorithm HMDPSOis also designed. In algorithm HMDPSO, particle updatestrategy is defined to search the solution space in globalrange. Particle mutation strategy is proposed, and togetherwith it, indicator of swarm diversity is defined. When swarmdiversity is lower than the threshold of swarm diversity 𝛼,the individual best position will be mutated to introduce newinformation, increase the swarm diversity, and restrain parti-cle swarm’s premature convergence. And its fitness functionalso has positive effect on algorithmHMDPSO’s optimizationprocess. In algorithm HMDPSO+, the incorporated localsearch strategy improves the degree of particle position’sconstraint satisfaction in every abstract service, and thenit accelerates the process of obtaining the feasible particleposition and optimizes all the three objectives of particlepositions. In the end, these two algorithms HMDPSO+ andHMDPSO are compared with recently proposed algorithmsMOGA and NSGA-II on four cases with different scalesand workflow structures, and the experiments illustrate thatalgorithmHMDPSO+ has an excellent performance in termsof powerful searching ability, excellent convergence ability,and stable performance.
Conflict of Interests
The authors declare that there is no conflict of interestsregarding the publication of this paper.
Acknowledgments
This work is sponsored by NSFC Major Research Program(nos. 61073062, 61100090, and 61100027) and the SpecialFund for Fundamental Research of Central Universities ofNortheastern University (no. 110204006).
References
[1] Y. Yin, B. Zhang, and X.-Z. Zhang, “An active and opportunisticservice replacement algorithm orienting transactional compos-ite service dynamic adaptation,” Chinese Journal of Computers,vol. 33, no. 11, pp. 2147–2162, 2010.
[2] V. Cardellini, E. Casalicchio, V. Grassi et al., “Moses: a frame-work for qos driven runtime adaptation of service-orientedsystems,” IEEETransactions on Software Engineering, vol. 38, no.5, pp. 1138–1159, 2012.
[3] T. Yu, Y. Zhang, and K.-J. Lin, “Efficient algorithms for Webservices selection with end-to-end QoS constraints,” ACMTransactions on the Web, vol. 1, no. 1, article 6, 2007.
[4] R. Calinescu, L. Grunske, M. Kwiatkowska, R. Mirandola, andG. Tamburrelli, “Dynamic QoS management and optimizationin service-based systems,” IEEE Transactions on Software Engi-neering, vol. 37, no. 3, pp. 387–409, 2011.
[5] Y.-M. Xia, B. Cheng, J.-L. Chen, X.-W. Meng, and D. Liu,“Optimizing services composition based on improved antcolony algorithm,” Chinese Journal of Computers, vol. 35, no. 2,pp. 270–281, 2012.
[6] H. Wada, J. Suzuki, Y. Yamano et al., “E3: a multiobjectiveoptimization framework for SLA-aware service composition,”IEEE Transactions on Services Computing, vol. 5, no. 3, pp. 358–372, 2012.
[7] S.-G. Wang, Q.-B. Sun, and F.-C. Yang, “Web service dynamicselection by the decomposition of global QoS constraints,”Journal of Software, vol. 22, no. 7, pp. 1426–1439, 2011.
[8] F. L. Huang, S. C. Zhang, and X. F. Zhu, “Discovering networkcommunity based on multi-objective optimization,” Journal ofSoftware, vol. 24, no. 9, pp. 2062–2077, 2013.
[9] W. Tao, S. Guo-Jun, and G. Quan, “Web service compositionbased on modified particle swarm optimization,” Chinese Jour-nal of Computers, vol. 36, no. 5, pp. 1031–1046, 2013.
[10] Z. Chang, “A hybrid algorithm for flow-shop scheduling prob-lem,” Acta Automatica Sinica, vol. 35, no. 3, pp. 332–336, 2009.
[11] K. Deb, A. Pratap, S. Agarwal, and T. Meyarivan, “A fastand elitist multiobjective genetic algorithm: NSGA-II,” IEEETransactions on Evolutionary Computation, vol. 6, no. 2, pp. 182–197, 2002.
[12] L.While, L. Bradstreet, and L. Barone, “A fast way of calculatingexact hypervolumes,” IEEE Transactions on Evolutionary Com-putation, vol. 16, no. 1, pp. 86–95, 2012.