INTRODUCTIONSeveral species of Holarctic amphibians and reptiles survive winter’scold by tolerating the freezing of their body tissues. Although someof the mechanisms underpinning freezing adaptation in vertebrateectotherms are understood, relatively little is known about the factorsdriving evolution of this trait. Efforts directed thereto mightprofitably focus on anuran amphibians, which generally exhibitstrong clinal variation in cold tolerance (Brattstrom, 1968; Snyderand Weathers, 1975). The wood frog, Rana sylvatica (LeConte1825), is a singularly useful species in such studies owing to itsbroad geographic range, which extends to 69°N, within the ArcticCircle (Martof and Humphries, 1959).
Throughout its range, R. sylvatica overwinters in relativelyexposed sites on the forest floor, where it potentially encounterssubzero temperatures but nevertheless survives the freezing of upto two-thirds of its body water (Costanzo and Lee, 2013; Storeyand Storey, 2004). Freezing adaptation in northern populations ofthis species has not been thoroughly examined, although preliminaryfindings indicate that frogs collected near Fairbanks, Alaska, USA,tolerate profound freezing, with many surviving exposure totemperatures below –18°C (Middle and Barnes, 2001). Within theirhibernacula, indigenous frogs are commonly exposed to –10°C orbelow (Middle and Barnes, 2000), consistent with conditions withinsubnivean habitats of Interior Alaska (Barnes et al., 1996). Incontrast, R. sylvatica endemic to the Great Lakes Region in NorthAmerica encounter more modest hibernal temperatures and toleratefreezing only to –3 to –6°C (Costanzo and Lee, 2013). Discovering
the physiological basis of this variation could provide importantclues to the evolution of the freeze-tolerance adaptation.
One reasonable expectation is that frogs from colder environmentspossess enhanced mechanisms of cryoprotection, including a greateraccumulation of colligatively active solutes. Two osmolytesparamount in freezing survival of R. sylvatica are urea, whichaccumulates during fall and early winter, and glucose, which is quicklyand copiously mobilized from hepatic glycogen reserves in directresponse to freezing. Both agents limit freezing injury by colligativelylowering the equilibrium freezing/melting point (FPeq) of body fluids(and, hence, limiting ice formation), and by preserving the integrityof membranes and macromolecules (Costanzo and Lee, 2013; Storeyand Storey, 2004). Cryoprotection is also conferred by a redistributionof water and its sequestration as ice within coelomic and lymphaticcompartments, a process that limits intra-organ ice formation thatcould physically damage cells and tissues (Lee and Costanzo, 1998).
In this project, we investigated physiological preparations forhibernation, capacity for freeze tolerance, and freezing adaptationin a northern population of R. sylvatica that must endure extremecold during an extended period of overwintering. For perspective,we also examined responses of conspecifics from a more temperatepart of the species’ geographic range.
MATERIALS AND METHODSExperimental animals and acclimatization
We collected R. sylvatica from Fairbanks North Star Borough, nearFairbanks, Alaska, USA (64.8°N, 147.7°W; Fig.1), during early
SUMMARYWe investigated hibernation physiology and freeze tolerance in a population of the wood frog, Rana sylvatica, indigenous toInterior Alaska, USA, near the northernmost limit of the species’ range. Winter acclimatization responses included a 233%increase in the hepatic glycogen depot that was subsidized by fat body and skeletal muscle catabolism, and a rise in plasmaosmolality that reflected accrual of urea (to 106±10μmolml−1) and an unidentified solute (to ~73μmolml−1). In contrast, frogs froma cool-temperate population (southern Ohio, USA) amassed much less glycogen, had a lower uremia (28±5μmolml−1) andapparently lacked the unidentified solute. Alaskan frogs survived freezing at temperatures as low as –16°C, some 10–13°C belowthose tolerated by southern conspecifics, and endured a 2-month bout of freezing at –4°C. The profound freeze tolerance ispresumably due to their high levels of organic osmolytes and bound water, which limits ice formation. Adaptive responses tofreezing (–2.5°C for 48h) and subsequent thawing (4°C) included synthesis of the cryoprotectants urea and glucose, anddehydration of certain tissues. Alaskan frogs differed from Ohioan frogs in retaining a substantial reserve capacity for glucosesynthesis, accumulating high levels of cryoprotectants in brain tissue, and remaining hyperglycemic long after thawing. Thenorthern phenotype also incurred less stress during freezing/thawing, as indicated by limited cryohemolysis and lactateaccumulation. Post-glacial colonization of high latitudes by R. sylvatica required a substantial increase in freeze tolerance thatwas at least partly achieved by enhancing their cryoprotectant system.
August 2011. Frogs were topically treated with tetracycline HCl,placed in plastic cups containing a moist paper towel, and shippedunder refrigeration to Miami University, where they were transferredindividually to a clean plastic cup and held on damp paper. Severalof these frogs were sampled promptly (hereafter ‘late-summerfrogs’), but most were inducted into a dormant state (winteracclimatized) by housing them in a programmable environmentalchamber (model I-35X, Percival, Boone, IA, USA) and exposingthem to dynamic, diel cycles of temperature and full-spectrumlighting, which, based on institutional records of weather, wereseasonally appropriate to their origin. At the start of this 5-weekregimen, temperature varied daily from 17.0 to 8.0°C and thephotophase was 16.5h; at its end, in mid-September, temperaturevaried daily from 13.0 to 2.5°C and the photophase was 13.3h. Frogswere fed ad libitum with crickets dusted with a vitamin supplement(ReptoCal, Tetrafauna, Blacksburg, VA, USA), although mostrefused food after the first week in September. Followingacclimatization, several frogs were sampled immediately (hereafter‘fall frogs’), whereas most were kept at 4°C, in darkness, for~8weeks in simulated hibernation until used in experiments in mid-November (hereafter ‘winter frogs’).
Wood frogs from a cool-temperate population were collectedin late winter (21 February 2011) from vernal breeding pools inAdams County, south-central Ohio, USA (38.8°N, 83.3°W;Fig.1). They were brought to laboratory facilities and kept, unfed,on damp moss within darkened plastic boxes (4°C) for the next3weeks. Thereafter they were kept in a 48m2 pen at the EcologyResearch Center (39.5°N, 84.7°W), Miami University, untilautumn. The pen was situated in a mature, deciduous woodlotand provided herbaceous cover and cool, moist conditions. Frogshad access to a pool of water and were fed vitamin-fortifiedcrickets two to three times weekly, although this diet wassupplemented by a host of arthropods that was attracted to a UV-A-emitting light. Feeding was suspended in late October. InNovember, frogs, on the verge of dormancy, were recaptured andplaced inside covered, opaque boxes that were kept in a cold room(4°C). They remained quiescent and buried under sheets of dampmoss until used in experiments 8weeks later.
Frogs were collected using approved methods under appropriatepermits issued by cognizant governmental agencies. Rearing and
experimental protocols were approved by the Institutional AnimalCare and Use Committee (IACUC) of Miami University.
Acclimatization experimentWe investigated the physiological changes in Alaskan frogs duringpreparation for hibernation by comparing morphometrics and selectblood and tissue metabolite concentrations among late-summer, falland winter frogs. Winter-acclimatized Ohioan frogs were alsosampled for comparative purposes. Winter samples also served asreference (unfrozen) groups in the freeze/thaw time-courseexperiment.
Freeze/thaw time-course experimentWinter frogs from both populations were experimentally frozen andthawed following a protocol (Costanzo et al., 1992) that facilitatescryoprotective responses, promotes survival and presumably mimicsnatural freezing and thawing episodes (i.e. slow freezing followed bygradual warming). They were purged of any bladder fluid via cloacalcanulation, weighed (to 0.1g) and individually placed inside a 50mlpolypropylene tube. A thermocouple placed against the abdomenallowed us to chart body temperature (Tb) at 30s intervals on amultichannel data logger (model RD3752, Omega, Stamford, CT,USA). Tubes containing these frogs were plugged with flexible plasticfoam and suspended in a refrigerated bath (model RTE 140, Neslab,Portsmouth, NH, USA) containing chilled ethanol. After each frogbecame supercooled (Tb approximately –1°C), we seeded the freezingof its tissues by applying aerosol coolant to the tube’s exterior.Freezing continued for as long as 48h as the frogs gradually cooled(0.05°Ch−1) to the ultimate Tb, –2.5°C, which was reached ~30h afterfreezing commenced. Groups of frogs (N=4–6) were removed fromthe bath at intervals (2, 6, 30 or 48h) and immediately euthanized toprovide tissues for analysis. Additional frogs were frozen for 48h,gently removed from their tubes and held on damp paper at 4°C, indarkness, for either 6h or 5days before being euthanized and sampled.A reference (unfrozen) group comprised frogs sampled directly fromtheir containers in the cold room.
Morphometrics and physiological assaysWorking inside a refrigerated (4°C) room, each frog was purged ofany urine via cloacal cannulation, weighed (to 0.1g), euthanized by
The Journal of Experimental Biology 216 (18)
Alaskan population64.8°N
Average January low, –28°CAverage January high, –19°CAnnual snowfall, 174 cm
Ohioan population38.8°N
Average January low, –5°CAverage January high, 4°CAnnual snowfall, 35 cm
Fig.1. Geographic range of Rana sylvatica(shading) and sources of animals used inthe study, with key climatic variables of thecollecting locales. Average daily airtemperature and snowfall data wereobtained from local meteorological stations.
THE JOURNAL OF EXPERIMENTAL BIOLOGY
3463Freeze tolerance in northern wood frogs
double-pithing, measured to determine snout–ischium length (to0.1mm) and dissected. Blood was immediately drawn intoheparinized microcapillary tubes from an incision in the aortic trunk(or ventricle of still-frozen frogs) and centrifuged (2000g, ~5min)in order to determine hematocrit and isolate the plasma, which wasimmediately frozen in liquid N2.
We quickly excised the liver, heart, brain and two muscles, thegastrocnemius and the gracilis, from the right hindlimb. Mass ofthe intact liver was determined (to 0.01g) after lightly blotting theorgan on laboratory tissue. Destined for metabolite assays, portionsof the liver and gracilis, and also the entire heart and brain, wereimmediately frozen in liquid N2. Other portions of the liver andgracilis, plus the intact gastrocnemius, were blotted to remove excesssurface moisture, weighed (to 0.01mg), placed in a 65°C oven andreweighed after thoroughly dried. Initial water concentration in thesesamples was estimated by dividing the mass lost upon drying bythe mass of the dried residue; an insufficient amount of tissueprohibited us from determining the hydration state of the heart andbrain. Water concentration of the liver sample was used to estimatemass of the entire, dry liver; in turn, this value was used to computethe hepatosomatic index (HSI; gdryliverg−1dry body×100) andhepatic glycogen content (μmolg−1dryliver×gdryliver). Weremoved and weighed (to 0.01mg) any coelomic fat body. Thecarcass was then weighed (to 0.01 g) and thoroughly dried in thesame oven so that its water concentration could be determined.Extrapolating this result permitted us to estimate the mass of thedry, intact body, which was then used to compute glycogen richnessby dividing the hepatic glycogen content (μmol) by the mass of thedry body (g). Using dial calipers we measured the length of thetibiofibula (to 0.1mm) of the right hindlimb; this value was usedto normalize mass of the dried gastrocnemius to body size.
Plasma and organ samples were stored at –80°C before metaboliteanalyses were carried out. Deproteinized organ extracts wereprepared by homogenizing samples in cold 7% (w/v) perchloric acidand then neutralizing the aqueous portion of the homogenate withKOH. These extracts, plus an aliquot of plasma, were assayed forurea, glucose and lactate using urease, glucose oxidase and lactateoxidase procedures (Pointe Scientific, Canton, MI, USA),respectively; concentrations of these metabolites were expressed asμmolml−1plasma or μmolg−1freshtissue. Extracts of liver andmuscle (gracilis) were also assayed for glycogen using an enzymaticprocedure. A portion of whole-tissue homogenate (100μl) wasneutralized with KOH and incubated at 40°C for 2h in a 0.2moll–1
sodium acetate buffer, pH4.8, with amyloglucosidase (1mgml−1).Following incubation, the reaction was stopped by adding cold 7%(w/v) perchloric acid and the free glucose was determined asdescribed above; glycogen concentration was expressed as glucosylunits (μmolg−1 dry tissue or μmolmg−1 protein) after subtraction ofthe initial free glucose. Plasma osmolality was measured by vapor-pressure osmometry (model 5520, Wescor, Logan, UT, USA) orfreezing point-depression osmometry (model 3320, AdvancedInstruments, Norwood, MA, USA) using appropriate NaClstandards.
In the acclimatization experiment, we used a colorimetric assayto measure glutamate dehydrogenase (GDH) activity in the gracilis.Frozen muscle samples (~25mg) were weighed (to 0.01mg) andhomogenized in 0.5ml imidazole buffer (50mmoll−1 imidazole atpH7.5, 100mmoll−1 NaF, 5mmoll−1 EDTA, 5mmoll−1 EGTA,0.1mmoll−1 PMSF, 15mmoll−1 β-mercaptoethanol) with a mincing-blade homogenizer. Homogenates were centrifuged at 13,000g for10min. GDH activity was determined using an assay kit (BioVision,Mountain View, CA, USA) that can detect activity as low as
0.01mU. The assay was run per kit instructions using 50μl ofsample; optical density was read at 450nm with a SPECTRAmaxPLUS384 microplate reader (Molecular Devices, Sunnyvale, CA,USA) before and after incubation at 37°C for 60s. GDH activitywas expressed as mUmg−1 protein, with 1U representing theamount of enzyme generating 1.0μmolNADHmin−1 at 37°C,pH7.6. Total protein in muscle homogenates was determined usingthe Bradford method (BioRad, Hercules, CA, USA) with bovineserum albumin as the standard.
For frogs used in the freeze/thaw time-course experiment, wemeasured free hemoglobin (Hb) in plasma using a modification ofthe Drabkin’s reagent protocol (Sigma-Aldrich, St Louis, MO,USA). The assay was performed in a 96-well plate containing 10μlplasma and 190μl Drabkin’s solution, with human Hb (H7379,Sigma-Aldrich) as the standard. The reaction was incubated at roomtemperature for 20min before the absorbance at 540nm was readwith the aforementioned microplate reader. Hb concentration(mgml−1) was determined from a standard curve and then adjustedto match the sample volume/dilutant volume ratio from the originalprotocol.
Freeze tolerance trialsWe examined freeze tolerance in a single group (N=10) of winterAlaskan frogs. These subjects were removed from their holding cupsand placed, in separate groups of five frogs, amongst several layersof floral sheet moss inside each of two opaque plastic boxes(0.0162m3). The moss had been previously chilled (4°C) andhydrated with dechlorinated water that prevented the frogs fromdehydrating and, once frozen, provided ice crystals to reliably initiatetissue freezing through contact inoculation. We placed crushed iceon the moss, closed the boxes with a lid and transferred them to aprogrammable incubator (Percival, model I-35X) set at 0°C.Temperature was recorded using several microprocessor-basedloggers (Tidbit, Onset Computer Corporation, Pocasset, MA, USA)placed inside the incubator and within each box, both on top of andwithin the sheets of moss.
In the first trial, all 10 frogs were cooled (0.05°Ch−1) to –8°C,a process requiring 160h, and held at that temperature an additional6h before being warmed to 4°C over the ensuing 24h and, finally,examined for viability. In a second trial, which began following an~30h hiatus, nine of the original frogs were randomly assigned toeither of two groups and cooled (0.05°Ch−1) to minima of –12°C(N=5) or –16°C (N=4). As before, frogs were held at either targettemperature for 6h; thus, the total time they spent frozen beforerewarming to 4°C was 246 and 326h, respectively.
We next used these frogs to test survival of prolonged freezingat a relatively mild temperature. This experiment was carried outas described above, except that the eight available frogs, which wereevenly distributed between two boxes, were cooled (0.05°Ch−1) to–4°C over 80h and then held at that temperature for either 8 or12weeks. Both boxes contained a central partition that separatedtwo frogs previously exposed to –12°C from two frogs previouslyexposed to –16°C, thus enabling us to associate each individual’ssurvival status with its thermal history. In all trials, we allowed frogsup to 7days to demonstrate the righting reflex, our ultimate survivalcriterion, before determining survival status.
Statistical inferencesFor the acclimatization experiment, seasonal variation in somaticand physiological variables in Alaskan frogs was tested usingANOVA, followed by the Student–Newman–Keuls multiplecomparisons test. Means for winter Alaskan and Ohioan frogs were
THE JOURNAL OF EXPERIMENTAL BIOLOGY
3464
compared using Student’s t-tests. For the freeze/thaw time-courseexperiment, group means were compared within each populationusing ANOVA; samples of frozen or thawed frogs weredistinguished from unfrozen frogs using Dunnett’s post hoc test.Two-factor ANOVA was used to compare populations, with pairsof means distinguished using Bonferroni tests. Data sets were testedto ensure they met parametric assumptions of normality andhomoscedasticity; those that did not were transformed or, ifnecessary, analyzed using nonparametric Kruskal–Wallis/Dunn’stests. Significance was judged at P<0.05.
RESULTSWe aimed to collect only adult males in an effort to eliminate anypotential gender- and age-based differences in physiology. Thisobjective was largely achieved for the sample Ohioan frogs, which,collected during the breeding season, contained only one female.However, because secondary sex characteristics are not evident insummer, and because northern R. sylvatica lack sexual dimorphismin body size (Martof and Humphries, 1959), we inadvertentlycollected both sexes of Alaskan frogs. This sample comprisedapproximately 32% females, which occurred randomly and wererepresented by at least one individual within the various treatmentgroups. Qualitative inspection of our data suggested that there wasno gender-based variation that would materially influence thestatistical results or overall conclusions of the study.
Winter acclimatizationFrogs collected in Interior Alaska during August were near the endof their activity season, as they typically enter hibernacula by mid-September (Kirton, 1974). Many had recently fed, as their gutsusually contained invertebrate prey in various stages of digestion.In contrast, little or no alimentary matter was found in fall or winterfrogs. Externally, frogs of all three groups appeared morphologicallysimilar. They did not vary in body mass, snout–ischium length or
body mass index, nor in body water content(range=3.81–3.91gwaterg−1drytissue; Table1). However, winteracclimatization induced marked changes in certain bodycomponents. The coelomic fat body present in late-summer frogswas virtually depleted during acclimatization. Concomitantly,relative mass of the liver, as represented by the HSI, increased ~1.5-fold. This change coincided with a 1.4-fold increase in the tissue’sglycogen concentration, which rose by more than 1000μmolg−1;consequently, the liver glycogen depot in fall and winter frogs wasnearly twice that in late-summer frogs. Muscle tissue also exhibitedprofound changes during winter acclimatization. Size of thegastrocnemius, as represented by its normalized dry mass, wasreduced by 27%. The gracilis exhibited a marked decrease in proteinconcentration (reduced by 40% in winter frogs) and concomitantincrease in GDH activity, which was 1.7-fold higher in winter frogsthan in late-summer frogs. Glycogen concentration in this tissuerose during this period, reaching a maximal value in winter frogs.
Plasma levels of the two major cryoprotectants increased inAlaskan frogs during winter acclimatization (Table1). However,whereas glucose increased by only several μmolml−1, ureaconcentration rose 10-fold, exceeding 100μmolml−1 in fall andwinter frogs. Plasma osmolality in winter frogs, 419±9mOsmolkg−1,increased by 173 units over that in late-summer frogs. This riseexceeded the combined increment in glucose and urea (100 units),suggesting that an unidentified solute(s) was also accumulated duringwinter acclimatization.
Winter-acclimatized frogs representing the two populationsdiffered in most of the measured variables (Table1). Variation inmorphological traits reflected the larger body size of frogs from themore temperate locale, as Ohioan frogs were 2.3-fold heavier and1.2-fold longer than Alaskan frogs. The body mass index (length-adjusted body mass) of Ohioan frogs was nearly twice that ofAlaskan frogs, despite the fact that their tissues contained relativelyless water. Such differences probably reflect allometric scaling
The Journal of Experimental Biology 216 (18)
Table1. Somatic and physiological variables of Alaskan and Ohioan wood frogs before and after acclimatization to winter conditions
Alaskan Ohioan
Late summer Fall Winter P Winter P
N 6 5 8 7Body mass (g) 6.0±0.8 5.9±0.5 7.2±0.5 0.245 16.7±1.1 <0.0001Snout–ischium length (cm) 3.9±1.2 4.0±0.1 4.3±0.1 0.142 5.2±0.1 <0.0001Body mass index (gcm–1) 1.53±0.13 1.45±0.09 1.68±0.10 0.335 3.25±0.23 <0.0001Body water content (gg–1) 3.81±0.09 3.85±0.08 3.91±0.05 0.608 3.28±0.05 <0.0001Coelomic fat body (mg) 23.6±7.5a 0.4±0.4b 1.5±0.8b 0.004 16.9±4.9 0.006Liver
Values are means ± s.e.m. Muscle mass values pertain to the gastrocnemius; other muscle variables pertain to the gracilis. Comparisons among three groupsof Alaskan frogs were made using ANOVA/Student–Newman–Keuls or Kruskal–Wallis/Dunn’s tests. Where statistical significance was achieved (P<0.05),groups are distinguished by dissimilar letters. Comparison of Alaskan winter frogs with Ohioan winter frogs was made using Student’s t-test or theMann–Whitney U-test.
THE JOURNAL OF EXPERIMENTAL BIOLOGY
3465Freeze tolerance in northern wood frogs
relationships, although genetic variation may also be involved, asR. sylvatica from northern locales have considerably smaller andstockier bodies, with proportionately shorter hind limbs (Loomisand Jones, 1953). Tibiofibula–body length ratios of our Alaskan(0.41) and Ohioan (0.55) frogs were comparable to those previouslyreported for northern and southern frogs (Martof and Humphries,1959).
Whereas fat body was virtually absent from winter Alaskan frogs,winter Ohioan frogs had a modest quantity of this tissue (Table1).The HSI in Alaskan frogs was a remarkable 22.4%. Thecorresponding value for Ohioan frogs was only one-third as much,the difference chiefly reflecting the liver’s 20% inferior glycogenconcentration. Although the hepatic glycogen content was similarbetween populations, when considered relative to body mass(glycogen richness) this depot was actually 3.5-fold greater inAlaskan frogs. The gastrocnemius was comparatively lighter inAlaskan frogs. The gracilis from these frogs had a higher GDHactivity and lower protein concentration, as well as more glycogen,relative to Ohioan frogs (Table1).
Populations varied markedly in hematological variables (Table1).Whereas the difference in glycemia was relatively minor, the plasmaurea concentration in Ohioan frogs, 28.8±4.8μmolml−1, was only27% of that in Alaskan frogs and, consequently, their osmolalitywas comparatively low (245±7 versus 419±9mOsmolkg−1).However, some of the disparity in osmotic activity was due to the73μmolml−1 of additional, unidentified solute in Alaskan frogs, aspreviously mentioned; Ohioan frogs contained no significantquantity of any unexpected solute.
Metabolite responses to freezing and thawing of winter frogsFreezing commenced at a Tb near –1°C and was marked by anexotherm in the Tb record for each individual. Dissections revealedthat ice progressively accumulated in frogs as time elapsed. Ohioanfrogs sampled at 30 or 48h contained substantial amounts of ice inthe coelom, beneath the skin and within the muscles. Comparedwith Ohioan frogs, Alaskan frogs contained much less ice, whichwas primarily confined to subcutaneous spaces, and were relativelysupple even after 48h of freezing. Frogs sampled 6h after thawingbegan contained no visible ice but were still inanimate. Exceptingone Alaskan frog, which was omitted from analyses, all frogssampled 5days after thawing began exhibited normalneurobehavioral functions, including the righting reflex.
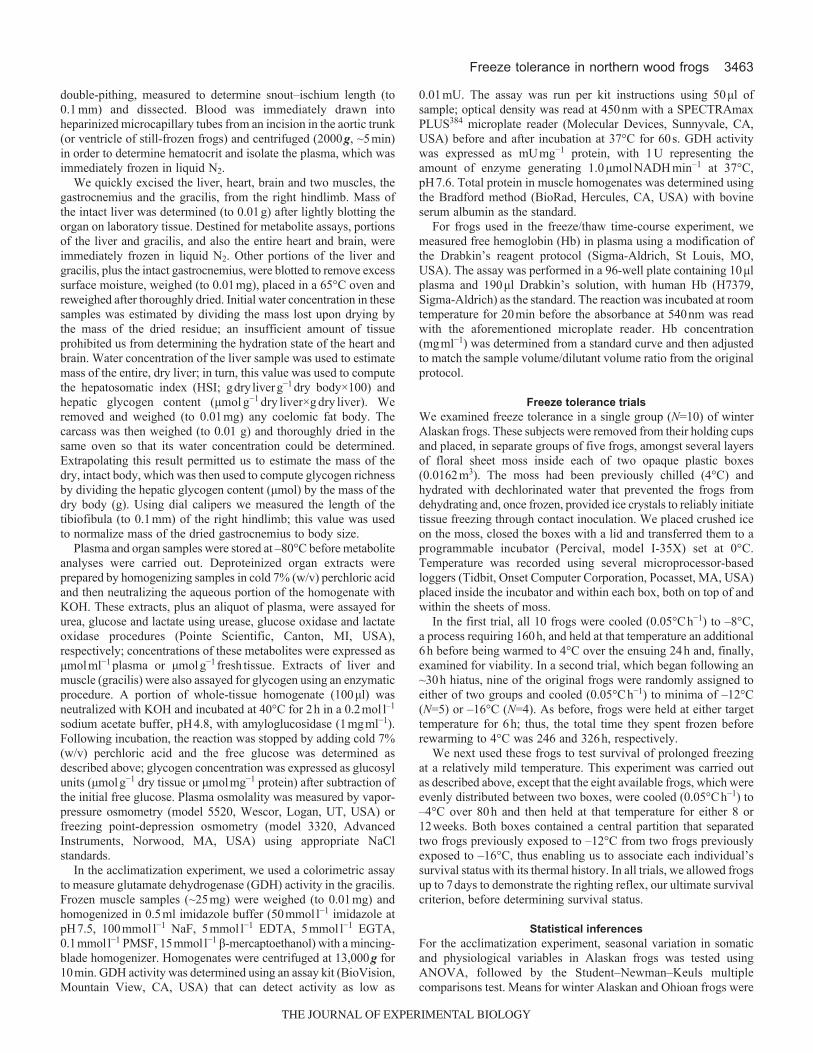
In Alaskan frogs, experimental freezing was accompanied by aprogressive decrease (F6,35=14.4, P<0.0001) in liver glycogenconcentration, which fell from 3549±88μmolg−1 in unfrozen frogsto 2164±245μmolg−1 after 48h of freezing (Fig.2). This valueremained low shortly after thawing but within 5days rebounded to2991±127μmolg−1, a level indistinguishable from that of unfrozenfrogs. Ohioan frogs also lost liver glycogen during freezing andreplenished it upon thawing (F6,29=25.7, P<0.0001). However, thisdynamic differed from that seen in Alaskan frogs (F13,64=3.1,P=0.0095) primarily in that, after 48h of freezing, glycogenconcentration had fallen 83% in Ohioan frogs, but only 39% inAlaskan frogs. Moreover, liver glycogen concentration in unfrozenOhioan frogs, 2883±79μmolg−1, was 19% less than that found inunfrozen Alaskan frogs (t=2.9, P<0.01).
Plasma glucose concentration in Alaskan frogs exhibited changes(F6,35=128.2, P<0.0001) that mirrored the freezing/thawing dynamicin liver glycogen (Fig.2). This also occurred with Ohioan frogs(F6,29=155.8, P<0.0001); however, although glycemic levelsachieved after 48h of freezing were indistinguishable betweenAlaskan (217±9μmolml−1) and Ohioan (231±24.4μmolml−1) frogs,
the nature of the mobilization response differed between populations(F13,64=30.7, P<0.0001). Notably, the glycemic increase in thenorthern phenotype appeared essentially linear, whereas the responsein Ohioan frogs was asymptotic, with little additional increaseoccurring after 30h. Populational differences in post-thaw glucoseclearance were also evident. Glycemic levels in frogs sampled 5daysafter thawing began were higher than those in unfrozen frogs,although the disparity was relatively small in Ohioan frogs; at thistime Alaskan frogs remained strongly hyperglycemic(85.0±13.4μmolml−1).
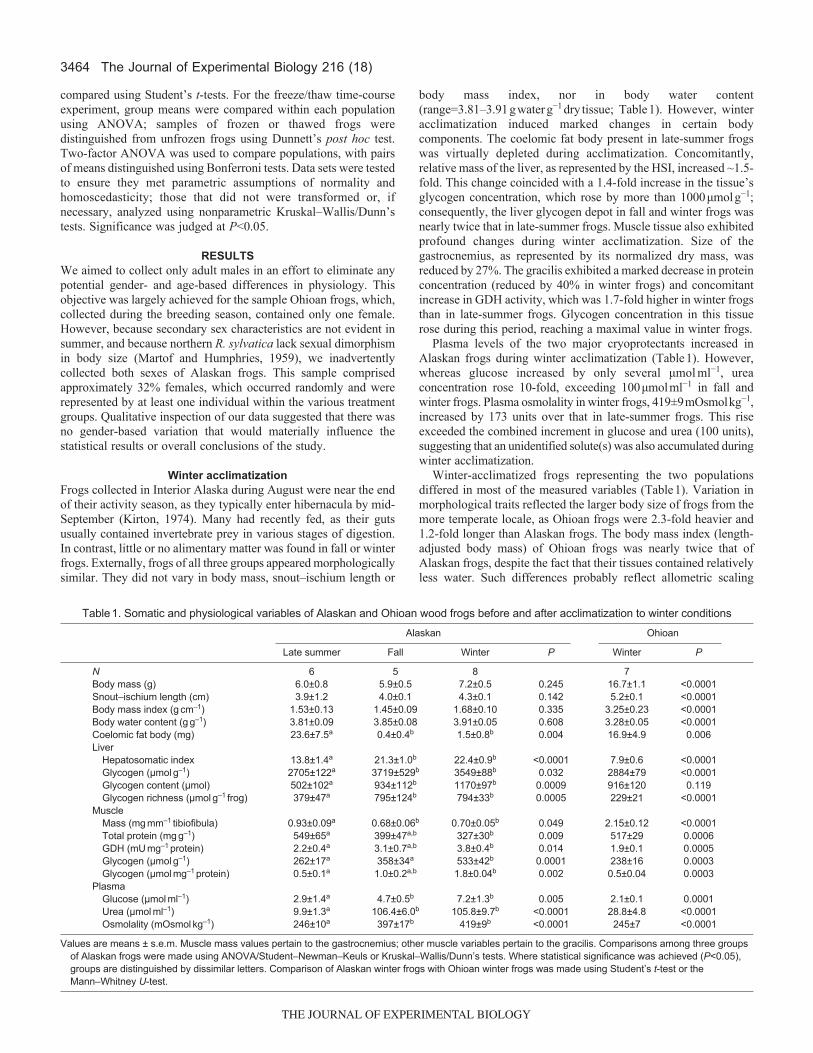
Alaskan frogs exhibited a strong increase with freezing, andsubsequent reduction upon thawing, in glucose levels of liver(F2,16=433.2, P<0.0001), heart (F2,16=430.7, P<0.0001), brain(F2,16=251.5, P<0.0001) and skeletal muscle (F2,16=677.3,P<0.0001; Fig.3). Concentrations in frogs frozen for 48h were 54-to 80-fold higher than those in unfrozen frogs, the actual levelsvarying by organ, being highest in liver (194±16μmolg−1 freshtissue) and lowest in skeletal muscle (62±3μmolg−1 fresh tissue).Although Ohioan frogs incurred grossly comparable changes (liver:F2,13=81.6, P<0.0001; heart: F2,13=291.5, P<0.0001; brain:F2,13=235.3, P<0.0001; skeletal muscle: F2,13=414.6, P<0.0001),populations differed in freeze/thaw dynamics with respect to liver(F5,29=4.8, P=0.015), heart (F5,29=49.9, P<0.0001) and brain(F5,29=29.3, P<0.0001). Glucose levels in these organs were similarbetween Alaskan and Ohioan frogs frozen for 48h, but werecomparably higher in Alaskan frogs sampled 5days after thawingbegan. Skeletal muscle differed from other organs in that the overallpattern of glucose accumulation with freezing and depletion uponthawing was similar between populations (F5,29=2.3, P=0.124) and,
1000
2000
3000
4000
Live
r gly
coge
n (µ
mol
g–1
) AlaskanOhioan
* **
0 6 12 18 24 30 36 42 48 6 120
100
200
300
Time (h)P
lasm
a gl
ucos
e (µ
mol
ml–1
)
Freeze Thaw
***
* *
**
*
* *
*,†
†
†
*,† *,†
†*,†
*,,†
Fig.2. Time course for changes in liver glycogen (μmolglucosylunitsg–1drytissue) and plasma glucose associated with experimental freezing for upto 48h and thawing for up to 5days of Alaskan and Ohioan wood frogs.Means (±s.e.m.; N=4–8) identified by asterisks differed (P<0.05) from thecorresponding mean for unfrozen frogs, which is given at the zero on theabscissa. Dagger indicates that the mean for Ohioan frogs differed(P<0.05) from the corresponding mean for Alaskan frogs.
THE JOURNAL OF EXPERIMENTAL BIOLOGY
3466
in the case of 48-h frozen frogs, glucose levels were markedly higher(t=3.2, P<0.05) in the northern phenotype (Alaskan: 62±3μmolg−1
fresh tissue; Ohioan 38±3μmolg−1 fresh tissue).Urea accumulated in the liver during freezing, the concentration
in Alaskan frogs frozen for 48h reaching 157.2±9.9μmolg−1 freshtissue, a value substantially higher (F2,16=9.8, P=0.002) than that(114.1±5.8μmolg−1 fresh tissue) found in unfrozen frogs (Fig.4).Following a similar pattern of response (F5,29=1.5, P=0.24), hepaticurea levels in Ohioan frogs also varied (F2,13=7.0, P=0.009) withfreezing/thawing, yet were 62–72% lower than those in Alaskanfrogs. Generally, urea concentrations in other organs and blood of48-h frozen frogs were nominally higher than corresponding levelsin unfrozen frogs, but the difference was significant (F2,13=4.1,P=0.042) only for the plasma of Ohioan frogs. There was goodconcordance between urea concentrations in blood and non-hepatictissues, except that the level in brain of Alaskan frogs exceeded thatin plasma. Tissue urea levels returned to respective basal levelswithin 5days after thawing began.
Hydric responses to freezing and thawing of winter frogsExperimental freezing and thawing of Alaskan frogs wasaccompanied by a measured rise (F6,35=17.4, P<0.0001) in the water concentration of liver tissue, which, after 48h of freezing,had increased 36% over that in unfrozen frogs(2.0±0.04gwaterg−1drytissue; Fig.5). This state persisted throughoutthawing, but was rectified within 5days after thawing began. In Ohioanfrogs, hydration of liver also changed with freezing/thawing(F6,29=25.7, P<0.0001), although the variation principally reflected a1.7-fold spike in recently thawed frogs; consequently, populationsdiffered in their pattern of response (F13,64=6.2, P<0.0001).
The Journal of Experimental Biology 216 (18)
80
160
240
320G
luco
se (µ
mol
g–1
)*
*
*
Liver
Unfrozen Frozen Thawed
20
40
60
80 Muscle
80
160
240 Heart
40
80
120
160 Brain
**
**
*
*
Ohioan
Alaskan
*
*
*
*
*,†
†
†
*,††
*,†
†*
Fig.3. Variation in glucose concentration (μmolg–1freshtissue) in severalorgans associated with experimental freezing (48h) and thawing (5days) ofAlaskan and Ohioan wood frogs. Sample sizes and symbology as in Fig.2.
Ure
a (µ
mol
g–1
or µ
mol
ml–1
)
Unfrozen Frozen Thawed
40
80
120
160 Muscle
40
80
120
160 Heart
40
80
120
160 Brain
**
*
*
*
40
80
120
160 Plasma
80
160
240
*
*Liver
OhioanAlaskan
*†
*,†
*,†
†
††
†††
† † †
† † †
Fig.4. Variation in concentration of urea in several organs(μmolg–1freshtissue) and plasma associated with experimental freezing(48h) and thawing (5days) of Alaskan and Ohioan wood frogs. Samplesizes and symbology as in Fig.2.
THE JOURNAL OF EXPERIMENTAL BIOLOGY
3467Freeze tolerance in northern wood frogs
Contrary to the case with liver, skeletal muscles dehydrated duringfreezing and rehydrated upon thawing (Fig.5). In Alaskan frogs,changes in water concentration of both the gastrocnemius(F6,35=32.3, P<0.0001) and the gracilis (F6,35=14.4, P<0.0001)reflected a reduction from basal values by 30h of freezing, followedby repletion within 5days after thawing began. Similar changesoccurred in Ohioan frogs (gastrocnemius: F6,29=8.9, P<0.0001;gracilis: F6,29=15.6, P<0.0001), although their tissues lost watermore rapidly during freezing. The water concentration in musclesof 48-h frozen frogs was 23–29% less than that in unfrozen frogs,the differential being greater in Alaskan frogs. Hydric responses ofmuscles apparently differed between Alaskan and Ohioan frogs(Fig.5), although the difference was significant for gastrocnemius(F13,64=6.2, P<0.0001), but not quite so for gracilis (F13,64=2.0,P=0.080).
Hematocrit, the percentage by volume of the blood occupied byformed elements, is a useful index of the hydration status of theblood. Hematocrit of Alaskan frogs changed slightly, albeitsignificantly (F6,34=2.8, P=0.027), with freezing and thawing,although only the value for 48-h frozen frogs, 28.1±2.1%, differedfrom that of unfrozen frogs, 18.2±1.4% (Fig.6). By contrast, Ohioanfrogs exhibited a rapid and robust rise (F6,27=13.7, P<0.0001) inhematocrit with freezing, the value in 48-h frozen frogs, 49.6±1.2%,being 2.4-fold higher than that of unfrozen frogs, 21.0±3.2%.
Hematocrit returned to basal levels within 5days after thawingbegan.
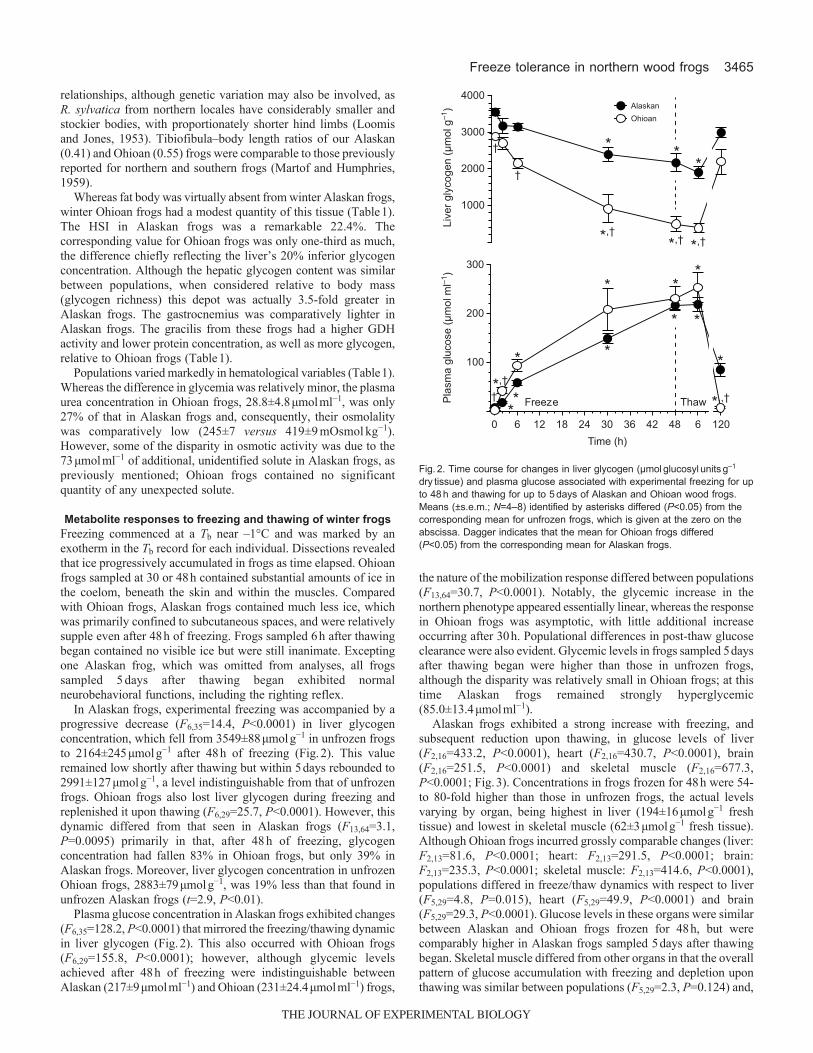
Freezing/thawing stress in winter frogsExperimental freezing coincided with a rise in the lactateconcentration of all tissues examined. By 48h of freezing, lactatein plasma of Alaskan frogs had increased (F2,16=82.7, P<0.0001)5.4-fold over that measured in unfrozen frogs (Fig.7). Ohioan frogsalso accumulated lactate in plasma (F2,13=97.9, P<0.0001), althoughthe increment was nearly 15-fold; consequently, lactemia in thesefrogs was greater (t=3.7, P<0.01) than that in Alaskan frogs. Forboth populations, lactate values returned to basal levels within 5daysafter thawing began. This pattern of accumulation during freezingfollowed by clearance after thawing was observed for all othertissues (data not shown), although the levels achieved with freezingwere consistently higher (P<0.01, all cases) in Ohioan frogs. Forexample, after 48h of freezing, lactate concentrations in Ohioanfrogs ranged from 10.8±0.8μmolg−1 fresh tissue in muscle to27.2±2.3μmolg−1 fresh tissue in brain, whereas correspondingvalues for Alaskan frogs were only 3.2±0.3 and 12.8±1.4μmolg−1
fresh tissue, respectively.Plasma Hb concentration served to index the magnitude of cellular
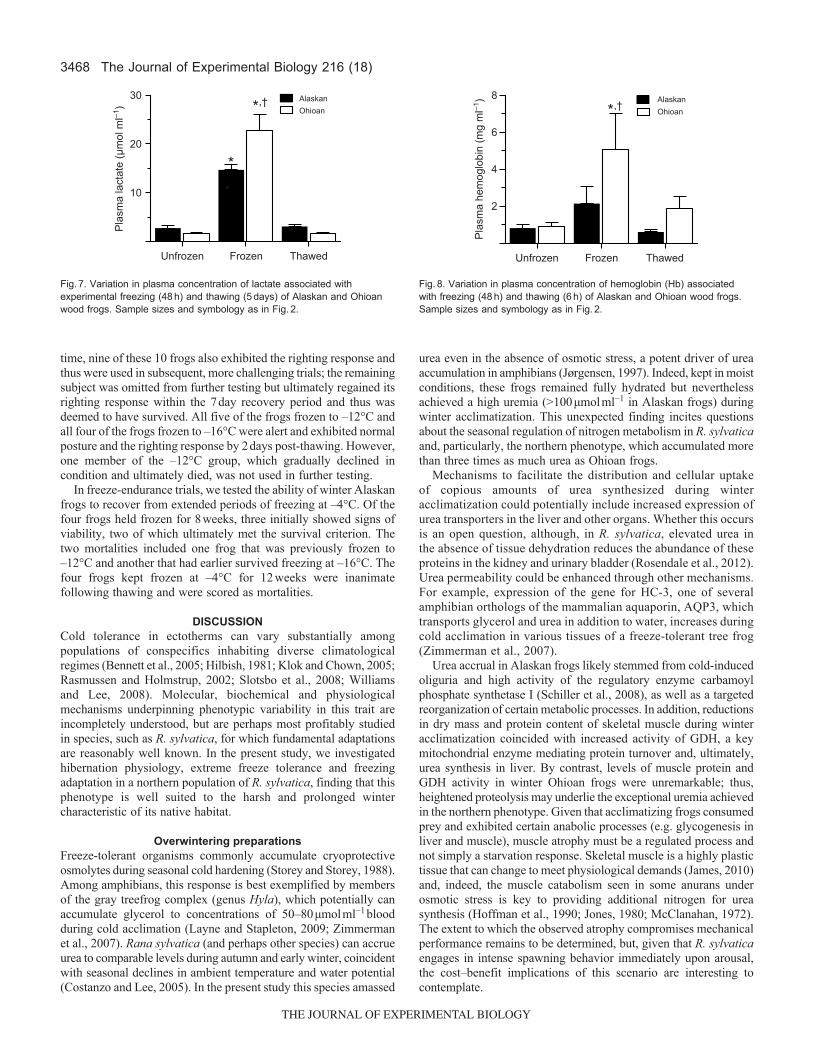
freezing stress (Fig.8). Hb concentration in Alaskan frogs frozenfor 48h was slightly higher than that in their unfrozen counterparts,but the difference was not quite significant (F2,17=3.1, P=0.072).By contrast, the concentration in frozen Ohioan frogs was 5.5-foldgreater (F2,13=5.8, P=0.016) than the basal level, indicating thatsubstantial cryohemolysis had occurred in these frogs. For bothpopulations, Hb levels in thawed frogs were comparable to thosemeasured in unfrozen frogs.
Freeze tolerance trials with winter frogsOur method of experimentally freezing winter Alaskan frogsexploited the tenet that frogs physically contacting ambient icecannot resist freezing (i.e. remain supercooled) and that inoculativefreezing will occur at a Tb close to the equilibrium freezing pointof body fluids, approximately –0.7°C (Lee and Costanzo, 1998).Although we could not monitor the freezing status of frogs duringcooling, we quickly examined the contents of one box after it hadreached –8°C, confirming that the moss within was solidly frozenand the frogs themselves were icy and rigid.
Frogs frozen to –8°C were alert and responded to tactilestimulation when first examined, 2days after thawing began. At this
2
3
4
5 Liver AlaskanOhioan
*
*
0 6 12 18 24 30 36 42 48 6 120
2
3
4
5
Time (h)
Gracilis
Freeze Thaw
**
**
*
2
3
4
5
Wat
er c
once
ntra
tion
(g g
–1 d
ry ti
ssue
)
Gastrocnemius
*
*
*
**
*,†
† †
*,††
†† †
*,†*,†
Fig.5. Time course for changes in water concentration in several organsassociated with experimental freezing (48h) and thawing (5days) ofAlaskan and Ohioan wood frogs. Sample sizes and symbology as in Fig.2.
0 6 12 18 24 30 36 42 48 6 120
10
20
30
40
50
60
Time (h)
Hem
atoc
rit (%
)
Alaskan
Ohioan
Freeze Thaw
*
*,†*,†
*,† *,†*,†
Fig.6. Variation in hematocrit associated with experimental freezing (48h)and thawing (5days) of Alaskan and Ohioan wood frogs. Sample sizes andsymbology as in Fig.2.
THE JOURNAL OF EXPERIMENTAL BIOLOGY
3468
time, nine of these 10 frogs also exhibited the righting response andthus were used in subsequent, more challenging trials; the remainingsubject was omitted from further testing but ultimately regained itsrighting response within the 7day recovery period and thus wasdeemed to have survived. All five of the frogs frozen to –12°C andall four of the frogs frozen to –16°C were alert and exhibited normalposture and the righting response by 2days post-thawing. However,one member of the –12°C group, which gradually declined incondition and ultimately died, was not used in further testing.
In freeze-endurance trials, we tested the ability of winter Alaskanfrogs to recover from extended periods of freezing at –4°C. Of thefour frogs held frozen for 8weeks, three initially showed signs ofviability, two of which ultimately met the survival criterion. Thetwo mortalities included one frog that was previously frozen to–12°C and another that had earlier survived freezing at –16°C. Thefour frogs kept frozen at –4°C for 12weeks were inanimatefollowing thawing and were scored as mortalities.
DISCUSSIONCold tolerance in ectotherms can vary substantially amongpopulations of conspecifics inhabiting diverse climatologicalregimes (Bennett et al., 2005; Hilbish, 1981; Klok and Chown, 2005;Rasmussen and Holmstrup, 2002; Slotsbo et al., 2008; Williamsand Lee, 2008). Molecular, biochemical and physiologicalmechanisms underpinning phenotypic variability in this trait areincompletely understood, but are perhaps most profitably studiedin species, such as R. sylvatica, for which fundamental adaptationsare reasonably well known. In the present study, we investigatedhibernation physiology, extreme freeze tolerance and freezingadaptation in a northern population of R. sylvatica, finding that thisphenotype is well suited to the harsh and prolonged wintercharacteristic of its native habitat.
Overwintering preparationsFreeze-tolerant organisms commonly accumulate cryoprotectiveosmolytes during seasonal cold hardening (Storey and Storey, 1988).Among amphibians, this response is best exemplified by membersof the gray treefrog complex (genus Hyla), which potentially canaccumulate glycerol to concentrations of 50–80μmolml−1bloodduring cold acclimation (Layne and Stapleton, 2009; Zimmermanet al., 2007). Rana sylvatica (and perhaps other species) can accrueurea to comparable levels during autumn and early winter, coincidentwith seasonal declines in ambient temperature and water potential(Costanzo and Lee, 2005). In the present study this species amassed
urea even in the absence of osmotic stress, a potent driver of ureaaccumulation in amphibians (Jørgensen, 1997). Indeed, kept in moistconditions, these frogs remained fully hydrated but neverthelessachieved a high uremia (>100μmolml−1 in Alaskan frogs) duringwinter acclimatization. This unexpected finding incites questionsabout the seasonal regulation of nitrogen metabolism in R. sylvaticaand, particularly, the northern phenotype, which accumulated morethan three times as much urea as Ohioan frogs.
Mechanisms to facilitate the distribution and cellular uptakeof copious amounts of urea synthesized during winteracclimatization could potentially include increased expression ofurea transporters in the liver and other organs. Whether this occursis an open question, although, in R. sylvatica, elevated urea inthe absence of tissue dehydration reduces the abundance of theseproteins in the kidney and urinary bladder (Rosendale et al., 2012).Urea permeability could be enhanced through other mechanisms.For example, expression of the gene for HC-3, one of severalamphibian orthologs of the mammalian aquaporin, AQP3, whichtransports glycerol and urea in addition to water, increases duringcold acclimation in various tissues of a freeze-tolerant tree frog(Zimmerman et al., 2007).
Urea accrual in Alaskan frogs likely stemmed from cold-inducedoliguria and high activity of the regulatory enzyme carbamoylphosphate synthetase I (Schiller et al., 2008), as well as a targetedreorganization of certain metabolic processes. In addition, reductionsin dry mass and protein content of skeletal muscle during winteracclimatization coincided with increased activity of GDH, a keymitochondrial enzyme mediating protein turnover and, ultimately,urea synthesis in liver. By contrast, levels of muscle protein andGDH activity in winter Ohioan frogs were unremarkable; thus,heightened proteolysis may underlie the exceptional uremia achievedin the northern phenotype. Given that acclimatizing frogs consumedprey and exhibited certain anabolic processes (e.g. glycogenesis inliver and muscle), muscle atrophy must be a regulated process andnot simply a starvation response. Skeletal muscle is a highly plastictissue that can change to meet physiological demands (James, 2010)and, indeed, the muscle catabolism seen in some anurans underosmotic stress is key to providing additional nitrogen for ureasynthesis (Hoffman et al., 1990; Jones, 1980; McClanahan, 1972).The extent to which the observed atrophy compromises mechanicalperformance remains to be determined, but, given that R. sylvaticaengages in intense spawning behavior immediately upon arousal,the cost–benefit implications of this scenario are interesting tocontemplate.
The Journal of Experimental Biology 216 (18)
Unfrozen Frozen Thawed
10
20
30
Pla
sma
lact
ate
(µm
ol m
l–1)
*
OhioanAlaskan
*
*,†
Fig.7. Variation in plasma concentration of lactate associated withexperimental freezing (48h) and thawing (5days) of Alaskan and Ohioanwood frogs. Sample sizes and symbology as in Fig.2.
Unfrozen Frozen Thawed
2
4
6
8
Pla
sma
hem
oglo
bin
(mg
ml–1
)
OhioanAlaskan
*,†
Fig.8. Variation in plasma concentration of hemoglobin (Hb) associatedwith freezing (48h) and thawing (6h) of Alaskan and Ohioan wood frogs.Sample sizes and symbology as in Fig.2.
THE JOURNAL OF EXPERIMENTAL BIOLOGY
3469Freeze tolerance in northern wood frogs
Our Alaskan frogs attained levels of urea that, albeit impressive,were perhaps more modest than could be achieved under osmoticchallenge, such as occurs in nature when the surrounding soil freezes(Costanzo and Lee, 2005). Nevertheless, their capacity to accumulatethis osmolyte to high levels enhances winter survival because, inaddition to its cryoprotective properties, urea can promotehypometabolism in dormant ectotherms (Muir et al., 2010). In thisrole, transfer between arousal and dormancy is achieved throughshifts between the active/inactive states of key regulatory enzymesin response to changing urea concentration, pH and temperature.Elevated urea is associated with reduced metabolism in both intactfrogs and isolated tissues, and this response would particularlybenefit frogs in Interior Alaska, which remain dormant for nearly8months of the year (Kirton, 1974).
Temperate amphibians undergo distinct, seasonal patterns ofnutrient cycling exemplified by the hepatic glycogen depot peakingin autumn or early winter and regressing following vernal spawning(Pinder et al., 1992). In some species, pre-hibernal glycogenesis issubsidized by increased lipolysis in fat bodies and other tissues(Farrar and Dupre, 1983; Koskela and Pasanen, 1975; Krawczyk,1971; Pasanen and Koskela, 1974), and this seems to be the casewith our Alaskan R. sylvatica, which substantially reduced their fatbodies during the period of glycogen deposition. Whereas winterOhioan frogs retained a modicum of this adipose, Alaskan frogsexpended their fat bodies whilst preparing for hibernation. Enhancedlipolysis in high-latitude populations of R. sylvatica, and also freeze-tolerant tree frogs (Irwin and Lee, 2003), likely improves survivalby magnifying the glycogen reserve. Additionally, more of theenergy in lipid, which cannot be oxidized in frozen (hypoxic) tissues,is converted to a more useful substrate; indeed, R. sylvatica undergoa seasonal downregulation of certain enzymes that would curtaillipid use in hibernation (Kiss et al., 2011).
Glycogen deposition in liver (and perhaps muscle) during thepre-hibernal period seemingly was supported by proteolysis inskeletal muscle. Albeit energetically expensive, this process wouldnot only help synthesize glycogen via gluconeogenesis, but, asmentioned earlier, would also promote urea accumulation. Proclivityfor muscle degeneration in Alaskan frogs, but apparently not inOhioan frogs, may underlie the substantially larger glycogenreserves amassed by the former.
Anuran species, and populations within species, inhabitingespecially cold climates tend to stockpile more glycogen, and thushave heavier livers, than counterparts from milder locales (Chen etal., 2011; Jönsson et al., 2009; Pasanen and Koskela, 1974).Accordingly, our Alaskan frogs had extremely rich glycogen depositsand an extraordinary HSI; indeed, the percentage of body massrepresented by the liver was 22%, as compared with 8% in our Ohioanfrogs. Fall-collected R. sylvatica native to Ontario, near the 45th northparallel, have an intermediate value, 12% (Sinclair et al., 2013). Thisclinal pattern might suggest that frogs need greater energy reservesin colder climates to survive aphagia during prolonged dormancy.However, R. sylvatica (and likely other freeze-tolerant species)preferentially conserves this substrate – an important source ofcryoprotectant – throughout hibernation, ultimately expending it tohelp fuel post-emergent reproductive activities (Costanzo et al., 2012).Maximizing the size of the glycogen depot, and thus capacity forcryoprotectant generation, is likely a key trait contributing to wintersurvival at high latitudes. Disparity in glycogen provisioning betweennorthern and southern phenotypes is particularly evident whenconsidering the size of the glycogen reserve relative to the mass oftissue requiring cryoprotection: the supply was more than 3.5 timesas great in Alaskan frogs (Table1).
Between late summer and winter, Alaskan frogs accumulatedmuch glycogen in skeletal muscle, a response also seen in otherfreeze-tolerant anurans (Higgins and Swanson, 2013). Abundantglycogen may be advantageous in cold climates, as levels inAlaskan frogs were 2.2-fold greater than those in Ohioan frogs.Furthermore, the pre-hibernal supply of muscle glycogen in aMinnesotan population (~47.6°N) of the gray tree frog was nearlytwice that of conspecifics from Missouri (~37.9°N) (Irwin and Lee,2003). Muscle stores of this substrate probably contribute little towhole-animal metabolism in winter (Pasanen and Koskela, 1974;Tattersall and Ultsch, 2008), but may help fuel occasionalmovements to new hibernacula, which have been observed for R.sylvatica wintering in an outdoor enclosure (J.P.C. and J. T. Irwin,unpublished). Such relocations, which are made by other ranids thathibernate beneath forest duff, even in mid-winter and at near-freezingtemperatures (Holenweg and Reyer, 2000), may help diminish thestimulus for disuse atrophy of skeletal muscle (James, 2010).However, the most crucial role of the muscle glycogen depot islikely to support the reproductive activities that commence uponspring arousal (Wells and Bevier, 1997).
During winter acclimatization of Alaskan frogs, the observedincrement in plasma osmolality, 173mOsmolkg−1, was only partlyexplained by a rise in glucose and urea, which jointly contributed~100mOsmolkg−1 to this increase. We thus deduced that the bloodof winter frogs contained ~73μmolml−1 of some other osmolyte(s),which, like glucose and urea, serves a cryoprotective role bycolligatively reducing FPeq. We further deduced that this agent wasabsent from Ohioan frogs because, omitting glucose and urea, theirplasma osmotic pressure would be ~214mOsmolkg−1, which canbe wholly attributed to the principal ionic electrolytes (Shoemakerand Nagy, 1977). Additional study is needed to identify this soluteand determine the extent to which it contributes to exceptional freezetolerance in the northern phenotype. Our preliminary results indicatethat it is not glycerol, as this compound was absent (or at least presentat concentrations below 0.25μmolml−1) from the plasma of late-summer, fall and winter frogs.
Extreme freeze toleranceFreeze-tolerant frogs of cool-temperate regions commonlyexperience thermal minima of –5 or –7°C within their shallow,terrestrial hibernacula (MacArthur and Dandy, 1982; Schmid,1982), although lower temperatures and longer chilling excursionsprobably affect populations at higher latitudes. Temperatures in thewinter microenvironment occupied by R. sylvatica in InteriorAlaska are indeed more severe (Middle and Barnes, 2000; Barneset al., 1996) and presumably demand a commensurately greatertolerance to freezing. Whereas frogs indigenous to the Great LakesRegion tolerate freezing only to –4 to –6°C, our results confirm andextend a preliminary report (Middle and Barnes, 2001) that thisnorthern phenotype can survive at temperatures below –16°C. Freezetolerance is also considered in terms of survivable duration, whichreflects the ability to cope with additional stresses, such as prolongedhypoxia and energy depletion. Whereas R. sylvatica from a cool-temperate population survive continuous freezing for perhapsseveral weeks (Layne, 1995; Layne et al., 1998), some Alaskan frogsrevived after being frozen at –4°C for 2months. None tolerated a3-month exposure, although the subjects used in these trials, whichhad recently been frozen at –12 or –16°C, may have been undulystressed. Additional study is needed to delineate freeze endurancein this population.
Freeze-tolerant animals can survive the freezing of as much astwo-thirds of their body water, but may reach this limit at markedly
THE JOURNAL OF EXPERIMENTAL BIOLOGY
3470
different Tb values (Storey and Storey, 1988). Such variation partlyreflects differences in osmotic potential, which can be increased byaccruing organic osmolytes before and/or during freezing. Iceformation in our Alaskan frogs would be curbed by their high plasmaosmolality, which, at 419mOsmolkg−1 before freezing commenced,is exceptional for a fully hydrated amphibian (Shoemaker and Nagy,1977). Tissue FPeq would be further reduced by the glucose andurea synthesized during freezing, although such agents may alsolimit ice formation by increasing the proportion of body water thatis bound or ‘unfreezable’ by virtue of its close association withmacromolecules and cellular structures (Storey and Storey, 1988).Indeed, disparate capacities for freeze tolerance in Alaskan andOhioan frogs may owe considerably more to variation in boundwater than to the difference in osmotic potential, which in frozenfrogs was only ~150mOsmolkg−1. Using a mathematical model ofthe colligative properties of solutions, FPeq and Tb (Claussen andCostanzo, 1990), we estimate that the bound water component inour Alaskan frogs, having an approximate FPeq of –1.22°C(equivalent to 657mOsmolkg−1 in frozen animals), must exceed26% in order that total body ice content remains below the lethalthreshold, 67%, when frozen at –16°C (Table2). It would beinstructive to empirically determine ice contents of frogs frozen tosuch temperatures; however, it is telling that bound water proportionsin R. sylvatica from lower latitudes are only 12–20% (Costanzo etal., 1993; Layne, 1995). Accordingly, the model’s estimate for ourOhioan frogs, which presumably attain the lethal threshold icecontent at –5°C, is 15%.
Osmolyte responses to freezing and thawingThe well-described glycemic response to freezing in R. sylvaticaderives from a sympathetic stimulation of hepatocytes that initiatesglycogenolysis and copiously produces glucose, which is circulatedto tissues throughout the body (Storey and Storey, 2004). Theprocess commences immediately and continues until the glycogenreserve is exhausted or freezing reaches an advanced stage. Glucoselevels in blood and most tissues quickly rise but usually reach anasymptote within a day or two. In the present study, frogs expresseda strong glycogenolytic response to freezing, the glycemic levelincreasing rapidly, reaching ~220μmolml−1 in both phenotypes. Thisvalue is within the range reported for winter R. sylvatica from variouslocales [albeit ~2.9 times higher than that earlier reported for thisOhioan population; see discussion and table4 in Costanzo and Lee(Costanzo and Lee, 2005)]. Although the glycemic level achievedby Alaskan frogs was not extraordinary, some evidence suggeststhat their cryoprotectant system actually is superior. Because Ohioanfrogs lost considerably more vascular water during freezing (asevidenced by higher hematocrits; Fig.6), much of the glycemic
increase seen in these frogs reflects the freeze concentration ofglucose, rather than its de novo synthesis, which was comparativelygreater in Alaskan frogs. Furthermore, whereas Ohioan frogs nearlydepleted their hepatic glycogen reserve by 48h of freezing, Alaskanfrogs retained a substantial reserve capacity (Fig.2). Indeed,extrapolating from the glycemic yield suggests that, if all remainingglycogen were mobilized (e.g. during an extended freezing bout),blood glucose concentration would approach 0.55moll–1. WhetherAlaskan frogs actually attain such glycemic levels with extendedor more extreme freezing, such as occurs in other freeze-tolerantspecies (Slotsbo et al., 2008), remains to be determined.
Tissues of frogs frozen for 48h showed the familiar variation inglucose concentration, with the highest level occurring in liver, coreorgans (heart and brain) having intermediate levels, and skeletalmuscle having the lowest (Storey and Storey, 2004). The meageramount in the latter likely reflects the rapidity with which peripheralstructures freeze and become isolated from circulating glucose(Costanzo et al., 1997b; Rubinsky et al., 1994; Storey, 1984). Ourfinding that more glucose accumulated in muscle of the northernphenotype than in Ohioan frogs suggests that perfusion persistedlonger in the former, perhaps because their tissues formed less ice.
Glucose mobilized with freezing is cleared from most tissues,returned to the liver and reconverted to glycogen usually within24–48h of thawing (Costanzo and Lee, 2013; Storey and Storey,2004). Expectedly, glucose levels in blood and organs of Ohioanfrogs returned to near-basal values within 5days after thawing began.However, Alaskan frogs remained strongly hyperglycemic, theirmean glucose level, 85μmolml−1, being some 12-fold higher thanthat of unfrozen frogs. Uncharacteristically high levels of glucosealso remained in the liver, the heart and especially the brain of thesefrogs. We speculate that clearance could be delayed by high urealevels, as this phenomenon is also seen in frogs experimentallyrendered hyperuremic before freezing (Costanzo and Lee, 2008).Tests using a Xenopus oocyte expression system (A.J.R., R.E.L.and J.P.C., unpublished) showed that high urea (150μmolml−1
medium) strongly inhibits glucose flux through GLUT2, thefacilitated transporter that mediates glucose transfer between theliver and the blood, and reabsorption in the kidney and, possibly,the bladder (Costanzo et al., 1997a). Implications of delayed glucoseclearance are not entirely clear, although sustained hyperglycemiacould potentially facilitate recovery (e.g. fueling tissue repair) orenhance cryoprotectant levels achieved during subsequent freezingexcursions (Costanzo et al., 1992).
Alaskan frogs accumulated substantial amounts of urea evenbefore freezing began. In contrast to the case with Ohioan frogs,whose heart, brain and skeletal muscle had uniform levels of thiscryoprotectant (20–23μmolg−1), urea concentrations in Alaskan
The Journal of Experimental Biology 216 (18)
Table2. Parameters associated with ice content in Alaskan and Ohioan wood frogs frozen to various temperatures
Body ice content (% of total water)
Osmolality (mOsmolkg–1) FPeq (°C) Bound water (%) –2.5°C –5°C –16°C
Osmolality was estimated by adding the osmotic activity of urea and glucose (1µmolml–1=1mOsmolkg–1) in plasma of frogs frozen for 48h to the plasmaosmolality (less contributions from urea and glucose) of unfrozen frogs.
The equilibrium freezing/melting point (FPeq) was determined from the relationship between a solution’s osmolality and FPeq (–1.86°C/Osmolkg–1).Bound water was determined using a mathematical model of the colligative properties of solutions, FPeq and body temperature (Claussen and Costanzo, 1990)
and stipulating that the threshold lethal ice content, 67%, is attained at –16°C in Alaskan frogs and –5°C in Ohioan frogs (boldface values). The stipulationfor Ohioan frogs has some empirical support (Costanzo et al., 1993; Layne, 1995), but for Alaskan frogs is false because they survived freezing to –16°C;therefore, the bound water and ice content values predicted for these frogs are necessarily underestimates and overestimates, respectively, of the truevalues.
THE JOURNAL OF EXPERIMENTAL BIOLOGY
3471Freeze tolerance in northern wood frogs
frogs varied markedly among organs, ranging from 92±7μmolg−1
in the heart to 134±9μmolg−1 in the brain. The exceptional levelin the brain, which even exceeded that in the liver, the organ of itsgenesis, is noteworthy in light of its extreme sensitivity to osmoticand freezing/thawing stress. Assuming that urea was uniformlydistributed across the plasma membrane, and that each gram of braintissue contained 830mg water (Costanzo et al., 1992), we estimatethat urea concentration in cytosol was 163μmolml−1, considerablyhigher than that in blood plasma, 106±10μmolml−1. Sequestrationof urea in the brain, via its uptake against the blood–tissueconcentration gradient, implies the work of an active ureatransporter. Confirmation of this notion awaits further study,although experimental evidence suggests that amphibian tissues canexpress such transporters (Ehrenfeld, 1998; Garcia-Romeu et al.,1981). In this organ, elevated urea likely contributes to antioxidation(Wang et al., 1999) and limits damage, such as myelinolysis,resulting from osmotic upheaval during freezing and thawing(Soupart et al., 2007).
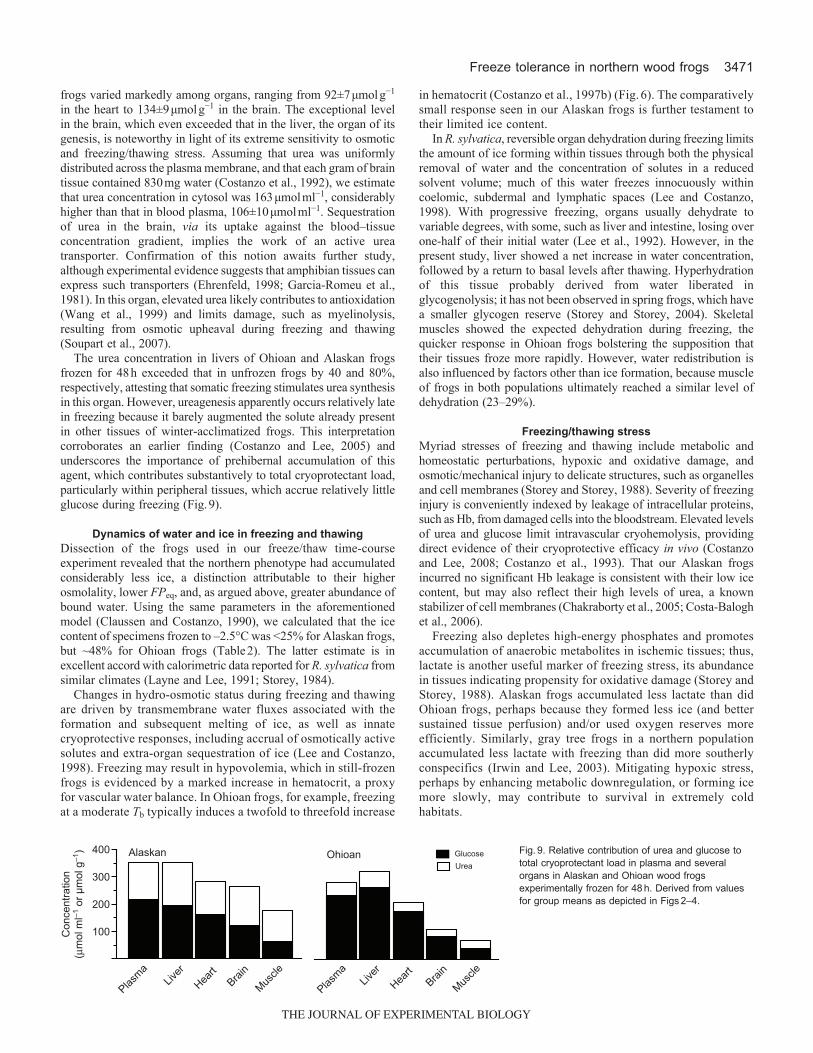
The urea concentration in livers of Ohioan and Alaskan frogsfrozen for 48h exceeded that in unfrozen frogs by 40 and 80%,respectively, attesting that somatic freezing stimulates urea synthesisin this organ. However, ureagenesis apparently occurs relatively latein freezing because it barely augmented the solute already presentin other tissues of winter-acclimatized frogs. This interpretationcorroborates an earlier finding (Costanzo and Lee, 2005) andunderscores the importance of prehibernal accumulation of thisagent, which contributes substantively to total cryoprotectant load,particularly within peripheral tissues, which accrue relatively littleglucose during freezing (Fig.9).
Dynamics of water and ice in freezing and thawingDissection of the frogs used in our freeze/thaw time-courseexperiment revealed that the northern phenotype had accumulatedconsiderably less ice, a distinction attributable to their higherosmolality, lower FPeq, and, as argued above, greater abundance ofbound water. Using the same parameters in the aforementionedmodel (Claussen and Costanzo, 1990), we calculated that the icecontent of specimens frozen to –2.5°C was <25% for Alaskan frogs,but ~48% for Ohioan frogs (Table2). The latter estimate is inexcellent accord with calorimetric data reported for R. sylvatica fromsimilar climates (Layne and Lee, 1991; Storey, 1984).
Changes in hydro-osmotic status during freezing and thawingare driven by transmembrane water fluxes associated with theformation and subsequent melting of ice, as well as innatecryoprotective responses, including accrual of osmotically activesolutes and extra-organ sequestration of ice (Lee and Costanzo,1998). Freezing may result in hypovolemia, which in still-frozenfrogs is evidenced by a marked increase in hematocrit, a proxyfor vascular water balance. In Ohioan frogs, for example, freezingat a moderate Tb typically induces a twofold to threefold increase
in hematocrit (Costanzo et al., 1997b) (Fig.6). The comparativelysmall response seen in our Alaskan frogs is further testament totheir limited ice content.
In R. sylvatica, reversible organ dehydration during freezing limitsthe amount of ice forming within tissues through both the physicalremoval of water and the concentration of solutes in a reducedsolvent volume; much of this water freezes innocuously withincoelomic, subdermal and lymphatic spaces (Lee and Costanzo,1998). With progressive freezing, organs usually dehydrate tovariable degrees, with some, such as liver and intestine, losing overone-half of their initial water (Lee et al., 1992). However, in thepresent study, liver showed a net increase in water concentration,followed by a return to basal levels after thawing. Hyperhydrationof this tissue probably derived from water liberated inglycogenolysis; it has not been observed in spring frogs, which havea smaller glycogen reserve (Storey and Storey, 2004). Skeletalmuscles showed the expected dehydration during freezing, thequicker response in Ohioan frogs bolstering the supposition thattheir tissues froze more rapidly. However, water redistribution isalso influenced by factors other than ice formation, because muscleof frogs in both populations ultimately reached a similar level ofdehydration (23–29%).
Freezing/thawing stressMyriad stresses of freezing and thawing include metabolic andhomeostatic perturbations, hypoxic and oxidative damage, andosmotic/mechanical injury to delicate structures, such as organellesand cell membranes (Storey and Storey, 1988). Severity of freezinginjury is conveniently indexed by leakage of intracellular proteins,such as Hb, from damaged cells into the bloodstream. Elevated levelsof urea and glucose limit intravascular cryohemolysis, providingdirect evidence of their cryoprotective efficacy in vivo (Costanzoand Lee, 2008; Costanzo et al., 1993). That our Alaskan frogsincurred no significant Hb leakage is consistent with their low icecontent, but may also reflect their high levels of urea, a knownstabilizer of cell membranes (Chakraborty et al., 2005; Costa-Baloghet al., 2006).
Freezing also depletes high-energy phosphates and promotesaccumulation of anaerobic metabolites in ischemic tissues; thus,lactate is another useful marker of freezing stress, its abundancein tissues indicating propensity for oxidative damage (Storey andStorey, 1988). Alaskan frogs accumulated less lactate than didOhioan frogs, perhaps because they formed less ice (and bettersustained tissue perfusion) and/or used oxygen reserves moreefficiently. Similarly, gray tree frogs in a northern populationaccumulated less lactate with freezing than did more southerlyconspecifics (Irwin and Lee, 2003). Mitigating hypoxic stress,perhaps by enhancing metabolic downregulation, or forming icemore slowly, may contribute to survival in extremely coldhabitats.
100
200
300
400
Con
cent
ratio
n(µ
mol
ml–1
or µ
mol
g–1
)
Plasma
Liver
Heart
Brain
Muscle
Alaskan OhioanUreaGlucose
Plasma
Liver
Heart
Brain
Muscle
Fig.9. Relative contribution of urea and glucose tototal cryoprotectant load in plasma and severalorgans in Alaskan and Ohioan wood frogsexperimentally frozen for 48h. Derived from valuesfor group means as depicted in Figs2–4.
THE JOURNAL OF EXPERIMENTAL BIOLOGY
3472
ImplicationsWood frogs indigenous to Interior Alaska, near the northern limitof their geographical range, exhibit distinct, prehibernal changes inphysiology and a substantially greater capacity for freeze tolerancecompared with conspecifics from more temperate regions. Suchvariation may have genetic underpinnings, as a phylogeographicanalysis (Lee-Yaw et al., 2008) suggested that frogs from ourAlaskan and Ohioan populations belong to separate mtDNA clades.The northwestern portion of their extant range was populatedfollowing glacial retreat by colonizers emanating from a high-latitude, ice-free refugium located in present-day Wisconsin.Because populations in the Great Lakes Region have a similar originbut clearly lack such extreme cold hardiness, the unique traits ofAlaskan frogs may reflect local adaptation driven by demandsimposed by an extremely harsh winter environment. It would beinstructive to determine winter preparatory and freezing responsesexpressed by other populations along the same northwest expansionroute (Lee-Yaw et al., 2008).
LIST OF SYMBOLS AND ABBREVIATIONSFPeq equilibrium freezing/melting point (°C)GDH glutamate dehydrogenaseHb hemoglobinHSI hepatosomatic index (gdryliverg−1drybody × 100)Tb body temperature (°C)
ACKNOWLEDGEMENTSWe are indebted to Brian Barnes for sharing his insights into the biology ofnorthern wood frogs. We thank Don Larson and David Russell for assisting withthe logistical challenges of collecting frogs in Alaska. Alice Reynolds and YutaKawarasaki provided technical assistance, Michael Wright drew the range map,and Timothy Muir contributed the photo of the Ohioan frog. We thank MichaelHughes for providing statistical advice, and Andor Kiss and Yuta Kawarasaki foroffering constructive comments on the manuscript.
AUTHOR CONTRIBUTIONSJ.P.C. and M.C.F.A conceived the study; J.P.C., M.C.F.A and A.J.R. designed theexperiments and collected the data; J.P.C. analyzed the data and wrote thepaper; J.P.C., M.C.F.A, A.J.R. and R.E.L. contributed substantially to interpretingthe data and developing the manuscript and take full responsibility for the contentof the paper.
FUNDINGThis work was supported by the National Science Foundation [IOS1022788 toJ.P.C.]; and the Portuguese Science and Technology Foundation (Fundação paraa Ciência e Tecnologia, Ministério da Educação e Ciência, Portugal)[SFRH/BD/63151/2009 to M.C.F.A.].
REFERENCESBarnes, B. M., Barger, J. L., Seares, J., Tacquard, P. C. and Zuercher, G. L.
(1996). Overwintering in yellowjacket queens (Vespula vulgaris) and green stinkbugs(Elasmostethus interstinctus) in subarctic Alaska. Physiol. Zool. 69, 1469-1480.
Bennett, V. A., Sformo, T., Walters, K., Toien, O., Jeannet, K., Hochstrasser, R.,Pan, Q., Serianni, A. S., Barnes, B. M. and Duman, J. G. (2005). Comparativeoverwintering physiology of Alaska and Indiana populations of the beetle Cucujusclavipes (Fabricius): roles of antifreeze proteins, polyols, dehydration and diapause.J. Exp. Biol. 208, 4467-4477.
Brattstrom, B. H. (1968). Thermal acclimation in anuran amphibians as a function oflatitude and altitude. Comp. Biochem. Physiol. 24, 93-111.
Chakraborty, A., Sarkar, M. and Basak, S. (2005). Stabilizing effect of lowconcentrations of urea on reverse micelles. J. Colloid Interface Sci. 287, 312-317.
Chen, W., Zhang, L.-X. and Lu, X. (2011). Higher pre-hibernation energy storage inanurans from cold environments: A case study on a temperate frog Ranachensinensis along a broad latitudinal and altitudinal gradients. Ann. Zool. Fenn. 48,214-220.
Claussen, D. L. and Costanzo, J. P. (1990). A simple model for estimating the icecontent of freezing ectotherms. J. Therm. Biol. 15, 223-231.
Costa-Balogh, F. O., Wennerström, H., Wadsö, L. and Sparr, E. (2006). How smallpolar molecules protect membrane systems against osmotic stress: the urea-water-phospholipid system. J. Phys. Chem. B 110, 23845-23852.
Costanzo, J. P. and Lee, R. E., Jr (2005). Cryoprotection by urea in a terrestriallyhibernating frog. J. Exp. Biol. 208, 4079-4089.
Costanzo, J. P. and Lee, R. E., Jr (2008). Urea loading enhances freezing survivaland postfreeze recovery in a terrestrially hibernating frog. J. Exp. Biol. 211, 2969-2975.
Costanzo, J. P. and Lee, R. E., Jr (2013). Avoidance and tolerance of freezing inectothermic vertebrates. J. Exp. Biol. 216, 1961-1967.
Costanzo, J. P., Lee, R. E., Jr and Wright, M. F. (1992). Cooling rate influencescryoprotectant distribution and organ dehydration in freezing wood frogs. J. Exp.Zool. 261, 373-378.
Costanzo, J. P., Lee, R. E., Jr and Lortz, P. H. (1993). Glucose concentrationregulates freeze tolerance in the wood frog Rana sylvatica. J. Exp. Biol. 181, 245-255.
Costanzo, J. P., Callahan, P. A., Lee, R. E., Jr and Wright, M. F. (1997a). Frogsreabsorb glucose from urinary bladder. Nature 389, 343-344.
Costanzo, J. P., Irwin, J. T. and Lee, R. E., Jr (1997b). Freezing impairment of malereproductive behaviors of the freeze-tolerant wood frog, Rana sylvatica. Physiol.Zool. 70, 158-166.
Costanzo, J. P., Do Amaral, M. C., Rosendale, A. R. and Lee, R. E. (2012).Seasonal dynamics and influence of hibernaculum temperature on energy reservesin the wood frog, Rana sylvatica. Integr. Comp. Biol. 52 Suppl. 1, e231.
Ehrenfeld, J. (1998). Active proton and urea transport by amphibian skin. Comp.Biochem. Physiol. 119A, 35-45.
Farrar, E. S. and Dupre, R. K. (1983). The role of diet in glycogen storage by juvenilebullfrogs prior to overwintering. Comp. Biochem. Physiol. 75A, 255-260.
Garcia-Romeu, F., Masoni, A. and Isaia, J. (1981). Active urea transport throughisolated skins of frog and toad. Am. J. Physiol. 241, R114-R123.
Higgins, S. A. and Swanson, D. L. (2013). Urea is not a universal cryoprotectantamong hibernating anurans: evidence from the freeze-tolerant boreal chorus frog(Pseudacris maculata). Comp. Biochem. Physiol. 164A, 344-350.
Hilbish, T. J. (1981). Latitudinal variation in freezing tolerance of Melampus bidentatus(Say) (Gastropoda: Pulmonata). J. Exp. Mar. Biol. Ecol. 52, 283-297.
Hoffman, J., Katz, U. and Eylath, U. (1990). Urea accumulation in response to waterrestriction in burrowing toads (Bufo viridis). Comp. Biochem. Physiol. 97, 423-426.
Holenweg, A.-K. and Reyer, H.-U. (2000). Hibernation behavior of Rana lessonaeand R. esculenta in their natural habitat. Oecologia 123, 41-47.
Irwin, J. T. and Lee, R. E., Jr (2003). Geographic variation in energy storage andphysiological responses to freezing in the gray treefrogs Hyla versicolor and H.chrysoscelis. J. Exp. Biol. 206, 2859-2867.
James, R. S. (2010). Effects of aestivation on skeletal muscle performance. InAestivation: Molecular and Physiological Aspects (Progress in Molecular andSubcellular Biology) (ed. C. A. Navas and J. E. Carvalho), pp. 171-181. New York,NY: Springer-Verlag.
Jones, R. M. (1980). Metabolic consequences of accelerated urea synthesis duringseasonal dormancy of spadefoot toads, Scaphiopus couchii and Scaphiopusmultiplicatus. J. Exp. Zool. 212, 255-267.
Jönsson, K. I., Herczeg, G., O’Hara, R. B., Söderman, F., Ter Schure, A. F. H.,Larsson, P. and Merilä, J. (2009). Sexual patterns of prebreeding energy reservesin the common frog Rana temporaria along a latitudinal gradient. Ecography 32,831-839.
Jørgensen, C. B. (1997). Urea and amphibian water economy. Comp. Biochem.Physiol. 117A, 161-170.
Kirton, M. P. (1974). Fall Movements and Hibernation of the Wood Frog, Ranasylvatica, in Interior Alaska. MSc thesis, University of Alaska, Fairbanks, Alaska,USA.
Kiss, A. J., Muir, T. J., Lee, R. E., Jr and Costanzo, J. P. (2011). Seasonal variationin the hepatoproteome of the dehydration and freeze-tolerant wood frog, Ranasylvatica. Int. J. Mol. Sci. 12, 8406-8414.
Klok, C. J. and Chown, S. L. (2005). Inertia in physiological traits: Embryonopsishalticella caterpillars (Yponomeutidae) across the Antarctic Polar Frontal Zone. J.Insect Physiol. 51, 87-97.
Koskela, P. and Pasanen, S. (1975). Effect of thermal acclimation on seasonal liverand muscle glycogen content in the common frog, Rana temporaria L. Comp.Biochem. Physiol. 50A, 723-727.
Krawczyk, S. (1971). Changes in the lipid and water content of some organs of thecommon frog (Rana temporaria) in the annual cycle. Acta Biol. Crac. Ser. Bot. 14,211-237.
Layne, J. R. (1995). Seasonal variation in the cryobiology of Rana sylvatica fromPennsylvania. J. Therm. Biol. 20, 349-353.
Layne, J. R. and Lee, R. E. (1991). The importance of body tissue composition tocalorimetric assessments of ice content in whole animals. J. Therm. Biol. 16, 61-64.
Layne, J. R., Jr and Stapleton, M. G. (2009). Annual variation in glycerol mobilizationand effect of freeze rigor on post-thaw locomotion in the freeze-tolerant frog Hylaversicolor. J. Comp. Physiol. B 179, 215-221.
Layne, J. R., Jr, Costanzo, J. P. and Lee, R. E., Jr (1998). Freeze durationinfluences postfreeze survival in the frog Rana sylvatica. J. Exp. Zool. 280, 197-201.
Lee, R. E., Jr and Costanzo, J. P. (1998). Biological ice nucleation and icedistribution in cold-hardy ectothermic animals. Annu. Rev. Physiol. 60, 55-72.
Lee, R. E., Costanzo, J. P., Davidson, E. C. and Layne, J. R. (1992). Dynamics ofbody water during freezing and thawing in a freeze-tolerant frog (Rana sylvatica). J.Therm. Biol. 17, 263-266.
Lee-Yaw, J. A., Irwin, J. T. and Green, D. M. (2008). Postglacial range expansionfrom northern refugia by the wood frog, Rana sylvatica. Mol. Ecol. 17, 867-884.
Loomis, R. B. and Jones, J. K. (1953). Records of the wood frog, Rana sylvatica,from Western Canada and Alaska. Herpetologica 9, 149-151.
MacArthur, D. L. and Dandy, J. W. T. (1982). Physiological aspects of overwinteringin the boreal chorus frog (Pseudacris triseriata maculata). Comp. Biochem. Physiol.72A, 137-141.
Martof, B. S. and Humphries, R. L. (1959). Geographic variation in the wood frog,Rana sylvatica. Am. Midl. Nat. 61, 350-389.
The Journal of Experimental Biology 216 (18)
THE JOURNAL OF EXPERIMENTAL BIOLOGY
3473Freeze tolerance in northern wood frogs
McClanahan, L. (1972). Changes in body fluids of burrowed spadefoot toads as afunction of soil water potential. Copeia 1972, 209-216.
Middle, L. B. and Barnes, B. M. (2000). Overwintering strategies of the wood frog,Rana sylvatica, in Interior Alaska. Am. Zool. 40, 1132-1133.
Middle, L. B. and Barnes, B. M. (2001). Overwintering physiology of the wood frog,Rana sylvatica, in Interior Alaska. Am. Zool. 41, 1526-1527.
Muir, T. J., Costanzo, J. P. and Lee, R. E., Jr (2010). Evidence for urea-inducedhypometabolism in isolated organs of dormant ectotherms. J. Exp. Zool. A 313, 28-34.
Pasanen, S. and Koskela, P. (1974). Seasonal and age variation in the metabolism ofthe common frog, Rana temporaria L. in northern Finland. Comp. Biochem. Physiol.47A, 635-654.
Pinder, A. W., Storey, K. B. and Ultsch, G. R. (1992). Estivation and hibernation. InEnvironmental Physiology of the Amphibians (ed. M. E. Feder and W. W. Burggren),pp. 250-274. Chicago, IL: The University of Chicago Press.
Rasmussen, L. M. and Holmstrup, M. (2002). Geographic variation of freeze-tolerance in the earthworm Dendrobaena octaedra. J. Comp. Physiol. B 172, 691-698.
Rosendale, A. J., Costanzo, J. P. and Lee, R. E., Jr (2012). Seasonal variation andresponse to osmotic challenge in urea transporter expression in the dehydration-and freeze-tolerant wood frog, Rana sylvatica. J. Exp. Zool. A 317, 401-409.
Rubinsky, B., Wong, S. T. S., Hong, J.-S., Gilbert, J., Roos, M. and Storey, K. B.(1994). 1H magnetic resonance imaging of freezing and thawing in freeze-tolerantfrogs. Am. J. Physiol. 266, R1771-R1777.
Schiller, T. M., Costanzo, J. P. and Lee, R. E. (2008). Urea production capacity inthe wood frog (Rana sylvatica) varies with season and experimentally inducedhyperuremia. J. Exp. Zool. A 309, 484-493.
Schmid, W. D. (1982). Survival of frogs in low temperature. Science 215, 697-698.Shoemaker, V. H. and Nagy, K. A. (1977). Osmoregulation in amphibians and
reptiles. Annu. Rev. Physiol. 39, 449-471.Sinclair, B. J., Stinziano, J. R., Williams, C. M., Macmillan, H. A., Marshall, K. E.
and Storey, K. B. (2013). Real-time measurement of metabolic rate during freezing
and thawing of the wood frog, Rana sylvatica: implications for overwinter energyuse. J. Exp. Biol. 216, 292-302.
Slotsbo, S., Maraldo, K., Malmendal, A., Nielsen, N. C. and Holmstrup, M. (2008).Freeze tolerance and accumulation of cryoprotectants in the enchytraeidEnchytraeus albidus (Oligochaeta) from Greenland and Europe. Cryobiology 57,286-291.
Snyder, G. K. and Weathers, W. W. (1975). Temperature adaptations in amphibians.Am. Nat. 109, 93-101.
Soupart, A., Schroëder, B. and Decaux, G. (2007). Treatment of hyponatraemia byurea decreases risks of brain complications in rats. Brain osmolyte contents analysis.Nephrol. Dial. Transplant. 22, 1856-1863.
Storey, K. B. (1984). Freeze tolerance in the frog, Rana sylvatica. Experientia 40,1261-1262.
Storey, K. B. and Storey, J. M. (1988). Freeze tolerance in animals. Physiol. Rev. 68,27-84.
Storey, K. B. and Storey, J. M. (2004). Physiology, biochemistry, and molecularbiology of vertebrate freeze tolerance: the wood frog. In Life in the Frozen State (ed.B. J. Fuller, N. Lane and E. E. Benson), pp. 243-274. Washington, DC: CRC Press.
Tattersall, G. J. and Ultsch, G. R. (2008). Physiological ecology of aquaticoverwintering in ranid frogs. Biol. Rev. Camb. Philos. Soc. 83, 119-140.
Wang, X., Wu, L., Aouffen, M., Mateescu, M.-A., Nadeau, R. and Wang, R. (1999).Novel cardiac protective effects of urea: from shark to rat. Br. J. Pharmacol. 128,1477-1484.
Wells, K. D. and Bevier, C. R. (1997). Contrasting patterns of energy substrate use intwo species of frogs that breed in cold weather. Herpetologica 53, 70-80.
Williams, J. B. and Lee, R. E., Jr (2008). Differences in cold tolerance, desiccationresistance, and cryoprotectant production between three populations of Eurostasolidaginis collected from different latitudes. J. Comp. Physiol. B 178, 365-375.
Zimmerman, S. L., Frisbie, J., Goldstein, D. L., West, J., Rivera, K. and Krane, C.M. (2007). Excretion and conservation of glycerol, and expression of aquaporins andglyceroporins, during cold acclimation in Cope’s gray tree frog Hyla chrysoscelis.Am. J. Physiol. 292, R544-R555.