SAGE-Hindawi Access to ResearchPathology Research InternationalVolume 2010, Article ID 814176, 14 pagesdoi:10.4061/2010/814176
Research Article
Analytical Validation of a Highly Quantitative,Sensitive, Accurate, and Reproducible Assay (HERmark�) forthe Measurement of HER2 Total Protein and HER2 Homodimersin FFPE Breast Cancer Tumor Specimens
Jeffrey S. Larson,1 Laurie J. Goodman,2 Yuping Tan,1 Lisa Defazio-Eli,2
Agnes C. Paquet,3 Jennifer W. Cook,2 Amber Rivera,2 Kristi Frankson,2 Jolly Bose,2
Lili Chen,2 Judy Cheung,2 Yining Shi,2 Sarah Irwin,1 Linda D. B. Kiss,1 Weidong Huang,3
Shannon Utter,1 Thomas Sherwood,3 Michael Bates,3 Jodi Weidler,3 Gordon Parry,2
John Winslow,2 Christos J. Petropoulos,2 and Jeannette M. Whitcomb1
1 Department of Clinical Laboratory Operations, Monogram Biosciences, Inc., South San Francisco, CA 94080, USA2 Department of Oncology, Research and Development, Monogram Biosciences, Inc., South San Francisco, CA 94080, USA3 Department of Clinical Research, Monogram Biosciences, Inc., South San Francisco, CA 94080, USA
We report here the results of the analytical validation of assays that measure HER2 total protein (H2T) and HER2 homodimer(H2D) expression in Formalin Fixed Paraffin Embedded (FFPE) breast cancer tumors as well as cell line controls. The assays arebased on the VeraTag technology platform and are commercially available through a central CAP-accredited clinical referencelaboratory. The accuracy of H2T measurements spans a broad dynamic range (2-3 logs) as evaluated by comparison with cross-validating technologies. The measurement of H2T expression demonstrates a sensitivity that is approximately 7–10 times greaterthan conventional immunohistochemistry (IHC) (HercepTest). The HERmark assay is a quantitative assay that sensitively andreproducibly measures continuous H2T and H2D protein expression levels and therefore may have the potential to stratify patientsmore accurately with respect to response to HER2-targeted therapies than current methods which rely on semiquantitative proteinmeasurements (IHC) or on indirect assessments of gene amplification (FISH).
1. Introduction
The human epidermal growth factor receptor 2 (HER2)is a transmembrane protein tyrosine kinase receptor thatis important in initiating signal transduction pathwaysin normal and abnormal cells [1–5]. HER2 is overex-pressed/amplified in approximately 15%–30% of humanbreast tumors and is a biomarker of poor prognosis inpatients demonstrating either high protein levels and/or geneamplification on chromosome 17 [4, 6, 7]. For this reason,HER2 testing is recommended for all newly diagnosed breast
cancer patients for the selection of individuals that maybenefit from treatment with the humanized monoclonalantibody Trastuzumab [8–11]. Despite confirmed overex-pression of HER2, the current response rates to Trastuzumabare less than 50% in the metastatic setting and many ofthe patients that respond initially will eventually developresistance and subsequent recurrence of their disease [12–14]. Standardization of both IHC and ISH methodologiesacross laboratories remains a major problem [15]. becauseof this approximately 20% of HER2 testing performed in thefield may be inaccurate [16]. The ability to accurately and
2 Pathology Research International
reproducibly quantify the level of HER2 protein expressionin tumors is critical to the appropriate selection of patientsfor Trastuzumab and other HER2 targeted therapies.
Most laboratories in North America and Europe use IHCto determine HER2 protein status, with equivocal categoryresults confirmed by indirectly measuring HER2 gene ampli-fication by Fluorescence In Situ Hybridization (FISH) ormore recently by the Chromogenic In Situ Hybridization(CISH) assay [15, 17]. The College of American PathologyGuidelines for HER2 testing algorithm includes testing allnewly diagnosed breast cancer patients. Patients with tumorsthat are classified as >30% 3+ by IHC or FISH positive(>2.2 HER2/CEP17 or >6 for noncorrected) are consideredHER2 positive and eligible for treatment with Trastuzumab,while those that are IHC 2+ should be further confirmedby FISH testing [15, 18]. If the tumors that were originallycategorized as IHC 2+ are confirmed to be FISH positivethese patients become eligible for Trastuzumab treatment[10, 18, 19]. These routine tests are subject to interlaboratoryvariation in both the accuracy and reproducibility betweenthese two methods with a general concordance rate publishedfor many studies of approximately ∼80%–90% (excludingIHC 2+ cases) for IHC and FISH, well below the 95%threshold mandated by the new ASCO-CAP guidelines [20].Furthermore, a recent study was undertaken to evaluateconcordance between local and central laboratory testing forHER2 in breast cancer specimens from the North CentralCancer Treatment Group, N9831 Intergroup Adjuvant Trial.The results demonstrated that the concordance rate betweenlocal and central laboratory HER2 testing was between75%–82% depending on whether which IHC technique wasused [21]. It is therefore critical that new testing methodsthat are less subjective and more quantitative, accurate,and reproducible to improve our ability to appropriatelyselect patients for expensive HER2 targeted therapies. Thereare two FDA approved tests for IHC, HercepTest (Dako,Carpentaria, CA), and Pathway (Ventana Medical SystemsInc, Tucson, AZ), both of which utilize a single antibodyformat on standard thin section FFPE tumors and the resultsare based on a subjective, semi-quantitative scale (0, 1+,2+, 3+) requiring microscopic evaluation and scoring by aboard certified pathologist [21]. There are four tests that areFDA approved for FISH/CISH testing, including PathVysion(Vysis Inc, Downers Grove, IL), INFORM (Ventana MedicalSystems Inc.), HER2 FISH pharmDx (Dako), and theSPoT-Light CISH kit (Invitrogen, Carlsbad, CA) [21, 22].FISH/CISH testing is also semiquantitative and subject tointer-laboratory differences accounting for the relatively low(88%) concordance rates demonstrated between local andcentral FISH testing [21]. Because of these statistics, therecan be a number of false positive and negative resultsfrom the use of these methods resulting in the inappro-priate and the cost-inefficient treatment of patients withTrastuzumab.
To address the need for better methodologies of HER2testing, we have developed an assay that can quantitativelymeasure HER2 protein levels as well as the functionalHER2:HER2 homodimers in FFPE breast tumor specimens.The assay has been validated according to the standards
defined by CLIA and is routinely performed in a CAP-accredited clinical reference laboratory. The assays are basedon the VeraTag technology platform [23] which utilizesa proximity-based release of a fluorescent tag bound toa specific antibody and the subsequent quantification ofthis tag by capillary electrophoresis. In the most commonformat of the platform, the dual-antibody approach providessignificantly increased specificity and sensitivity compared tosingle antibody-based IHC methods. The method provides acontinuum of highly quantitative results that span the entiredynamic range of HER2 protein expression from 0 to 3+ ifcompared with conventional IHC scoring methods, therebyproviding a more accurate assessment of the HER2 status ofa patient tumor.
In addition to the quantitative advantage of the VeraTagassay, results obtained with HERmark assay from a clinicalcohort of 237 metastatic breast cancer patients originallyclassified by a combination of IHC and FISH, demonstrated98% concordance for IHC positive and negative assayvalues (excluding equivocals) [24] This is well within theASCO/CAP guidelines requiring laboratories to show at least95% concordance with another validated test for negativeand positive assay values [15]. The overall concordance of therecent HER2 mRNA testing included as part of the OncotypeDx report is 70%–78% when compared with central IHC[25]. The concordance of HER2 mRNA measurementswith central FISH is higher (97%) but this makes sensewhen considering that both are indirect measurements ofdrug response. Taken together, this supports the need forquantitative and reproducible measurements the actual drugtarget rather than relying on indirect measurements suchas gene amplification or mRNA levels or with subjectivequantitation by IHC. An additional advantage of the VeraTagplatform is the ability to quantitatively measure protein-protein interactions and specifically one of the primaryactivated or functional forms of the HER2 protein (homod-imer/proximer) [23] and potentially the true drug target. TheHERmark assay is a quantitative assay that accurately andreproducibly measures HER2 total and homodimer proteinexpression on a continuum as opposed to the subjectiveclassification criteria of the current FDA approved HER2IHC protein assays and therefore may have the potential tostratify patients quantitatively for response to Trastuzumabas well as other targeted therapies that are making their wayinto the clinic.
2. Material and Methods
2.1. Antibodies, Isotype Controls, Photosensitizer Molecule, andIllumination Buffer. Monoclonal antibodies Ab8 and Ab15directed against the intracellular domain of HER2 were pur-chased from Lab Vision (Fremont, CA). Mouse monoclonalantihuman IgG1 isotype control antibodies, biotinylatedand unconjugated, were purchased from BD Biosciences(Franklin Lakes, NJ). The fluorescent reporter Pro11 wassynthesized and purified according to protocol describedearlier (US Patent 7,105,308). Antibody-fluorescent tag and
Pathology Research International 3
antibody-biotin conjugates Ab8-Pro11, Ab8-biotin, Ab15-biotin, and IgG1-Pro11 were conjugated and purified asdescribed previously [23]. Ab8-Pro11 and IgG1-Pro11 werematched to have similar hapten ratios. After purification,all antibodies were stored in 1X PBS with 1 mg/mL BSAand 0.001% sodium azide (Sigma-Aldrich, St. Louis, MO).Streptavidin-conjugated methylene blue (SA-MB: “photoac-tivator molecule”) was synthesized and purified accordingto the protocol described earlier (US Patent 7,105,308).Illumination Buffer (IB) contained 3 pM fluorescein and 2additional capillary electrophoresis (CE) mobility markersin 0.01X PBS. The fluorescein was used as a quantitationstandard.
2.2. Illuminator and Chiller Blocks, CE Instruments, andSlide Scanner. Three LED array illuminators customizedwith chiller blocks (Torrey Pine Scientific, San Diego,CA) were used to release reporter tags. Three ABI 3130genetic analyzer CE instruments equipped with 22 cm arrays(Applied Biosystems, Foster City, CA) were used to detectVeraTags. An HP ScanJet 4890 flatbed scanner was usedto create a digital image of hematoxylin and eosin (H &E) stained slides. Section area (mm2) was measured usingImageJ software as described previously [23].
2.3. Cell Lines, Tissues, Cell Culture, Fixation, Processing andParaffin Embedding. The following breast cancer cell lineswere obtained from the American Type Culture Collection(ATCC, Manassas, VA): SkBR3, BT-20, MDA-MB-453, MCF-7, MDA-MB-468, BT-474, MDA-MB-361, T47D, MDA-MB-231, Zr75-1, and A431. One melanoma cell line was utilizedMDA-MB-435S [26]. A431, MDA-MB-231, MDA-MB-361,MDA-MB-453, and MDA-MB-468 were maintained inDulbecco’s Modified Eagle Medium (DMEM). BT-474 andMDA-MB-435S were maintained in Dulbecco’s ModifiedEagle Medium: Nutrient Mixture F12 (DMEM/F12). T47Dand Zr75-1 were maintained in RPMI Media 1640. MCF-7cells were maintained in Minimum Essential Medium Alpha(αMEM). BT-20 cells were maintained in Eagle’s MinimumEssential Medium with Earle’s Balanced Salt Solution(EMEM + EBSS). SkBR-3 was maintained in McCoy’s 5 Amedia. All of the media were supplemented with 10%fetal bovine serum (FBS), 10 mM penicillin-streptomycin,and 10 mM Glutamax. All media and supplements werepurchased from Invitrogen (Carlsbad, CA). All cell lineswere cultured in a 37◦C humidified atmosphere containing95% air and 5% CO2 and were split and media replenishedaccording to ATCC recommendations. Cells were screenedfor Mycoplasma contamination using standard PCRmethods. Forty-six patient derived tumors were purchasedas frozen tumor sample or tumor blocks from Asterand(Detroit, MI), William Bainbridge (Seattle, WA), orProteogenix (Costa Mesa, CA). Frozen breast tissues weremade into FFPE blocks as previously described [23]. Twotumor tissues were used to test the effect of interferingsubstances by being embedded with pathologically verifiednormal breast stroma and fat samples.
After the cell cultures reached appropriate confluence,the cells were harvested 10–18 hours after being refed withthe appropriate media. Media was removed from the 500 cm2
plates and the cells were washed with 1X PBS. The 1XPBS was aspirated and approximately 25 mL of Richard-Allan Pen-Fix Formalin Fixative (Thermo Fisher Scientific,Waltham, MA) was added to the cells. Cells were scrapedand fixed overnight at 4◦C. Cells were then processed intoFFPE blocks as previously described [23]. Cell lines andtumor tissue FFPE blocks were cut at 7 μm and 5 μmthickness, respectively, using a Leica RM 2145 and 2155Rotary Microtome (Leica Microsystems, Bannockburn, IL).Sections were placed on positively charged glass slides (VWR,West Chester, PA), air dried for 30 minutes during the time ofcutting all the sections, and then baked at 60◦C for 1.5 hours.All slides were stored at 4◦C until assayed and generally usedwithin 3-4 weeks.
3. ELISA, Flow Cytometry, and IHC
Lysates were prepared from 500 cm2 plates at 80% conflu-ency. Cells were collected by scraping and washed threetimes with cold PBS. The resulting pellets were lysedin buffer containing 1% Triton X-100, 50 mM Tris, pH7.5, 50 mM NaF, 50 mM β-glycerophophate, 100 mM NaCl,1 mM Na3VO4, 100 μg Pepstatin A, 5 μm EDTA (Sigma-Aldrich, St. Louis, MO), and 1 complete mini proteaseinhibitor tablet (Roche, Basel, Switzerland). After lysis thesamples were centrifuged for 20 minutes at 4◦C and thesupernatants were stored at −80◦C. Protein content foreach lysate was determined against a standardized controlusing the Pierce Protein Assay Kit (Thermo Fisher Scientific,Waltham, MA). Determination of HER2 protein contentwas performed with a commercially available quantitativeenzyme-linked immunosorbent assay (ELISA) kit (EMDBiosciences, San Diego, CA) according to the manufacturer’sprotocol. Cell lysates were serially diluted and measured intriplicate. Each lysate was tested on three different days.HER-2 protein levels were determined in nanogram permilligram of total protein (Table 1). For flow cytometryanalysis, cells were harvested by trypsinization and counted.5 × 105 cells were placed in a 96 well plate and labeledwith biotinylated primary monoclonal mouse antihumanErbB2 Ab4 (Lab Vision, Fremont, CA) at a concentrationof 4 μg/ml in 100 μl total volume. Isotype controls wererun using mouse IgG1 (BD Biosciences, Franklin Lakes,NJ). The cells were incubated with antibody on ice for 45minutes. Postincubation, the cells were washed twice with 1XPBS, followed by labeling with R-Phycoerythrin (PE)-Avidin(Invitrogen, Carlsbad, CA) at 2 μg/ml for 30 minutes on ice.The labeled cells were washed with 1X PBS twice and fixedwith 1% paraformaldehyde in 1X PBS. FACS analysis wasperformed on a FACSCalibur cytometer (BD Biosciences,San Jose, CA). PE fluorescence intensity of labeled cells wasdetermined on a FL2 (585/42 nm band pass filter) detector.The direct quantitation of the fluorescence intensity ofsamples in terms of number of molecules of ErbB2 receptorswas generated based on a calibrated standard curve using
4 Pathology Research International
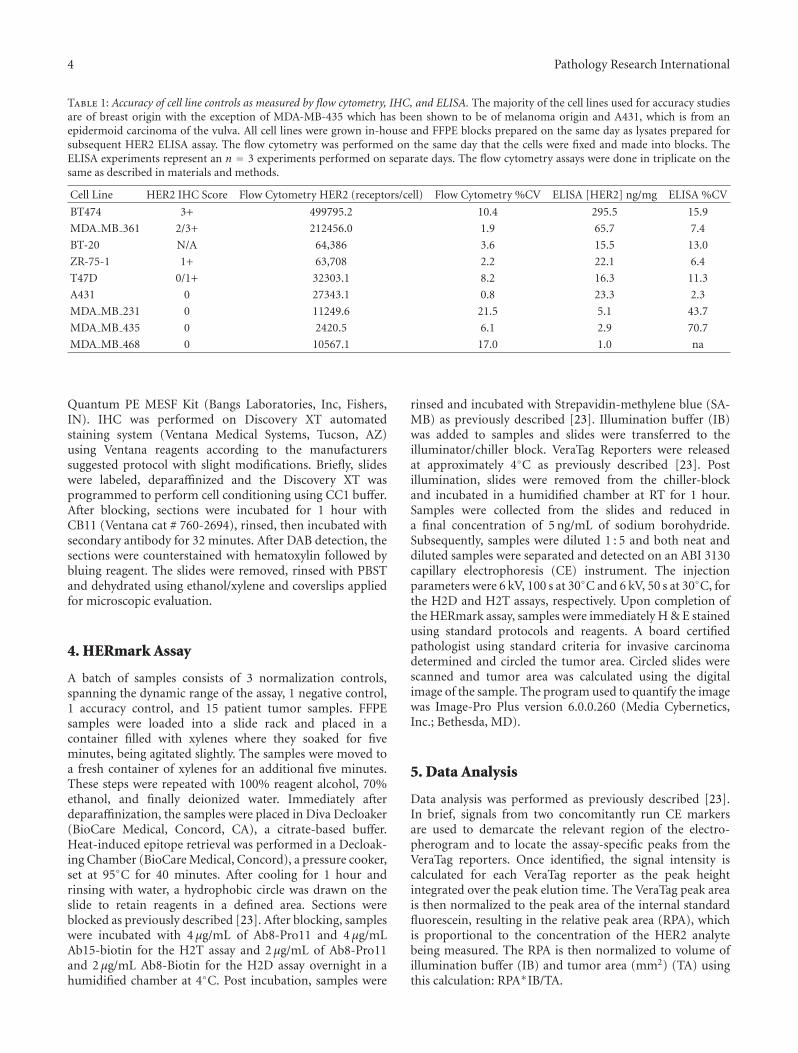
Table 1: Accuracy of cell line controls as measured by flow cytometry, IHC, and ELISA. The majority of the cell lines used for accuracy studiesare of breast origin with the exception of MDA-MB-435 which has been shown to be of melanoma origin and A431, which is from anepidermoid carcinoma of the vulva. All cell lines were grown in-house and FFPE blocks prepared on the same day as lysates prepared forsubsequent HER2 ELISA assay. The flow cytometry was performed on the same day that the cells were fixed and made into blocks. TheELISA experiments represent an n = 3 experiments performed on separate days. The flow cytometry assays were done in triplicate on thesame as described in materials and methods.
Quantum PE MESF Kit (Bangs Laboratories, Inc, Fishers,IN). IHC was performed on Discovery XT automatedstaining system (Ventana Medical Systems, Tucson, AZ)using Ventana reagents according to the manufacturerssuggested protocol with slight modifications. Briefly, slideswere labeled, deparaffinized and the Discovery XT wasprogrammed to perform cell conditioning using CC1 buffer.After blocking, sections were incubated for 1 hour withCB11 (Ventana cat # 760-2694), rinsed, then incubated withsecondary antibody for 32 minutes. After DAB detection, thesections were counterstained with hematoxylin followed bybluing reagent. The slides were removed, rinsed with PBSTand dehydrated using ethanol/xylene and coverslips appliedfor microscopic evaluation.
4. HERmark Assay
A batch of samples consists of 3 normalization controls,spanning the dynamic range of the assay, 1 negative control,1 accuracy control, and 15 patient tumor samples. FFPEsamples were loaded into a slide rack and placed in acontainer filled with xylenes where they soaked for fiveminutes, being agitated slightly. The samples were moved toa fresh container of xylenes for an additional five minutes.These steps were repeated with 100% reagent alcohol, 70%ethanol, and finally deionized water. Immediately afterdeparaffinization, the samples were placed in Diva Decloaker(BioCare Medical, Concord, CA), a citrate-based buffer.Heat-induced epitope retrieval was performed in a Decloak-ing Chamber (BioCare Medical, Concord), a pressure cooker,set at 95◦C for 40 minutes. After cooling for 1 hour andrinsing with water, a hydrophobic circle was drawn on theslide to retain reagents in a defined area. Sections wereblocked as previously described [23]. After blocking, sampleswere incubated with 4 μg/mL of Ab8-Pro11 and 4 μg/mLAb15-biotin for the H2T assay and 2 μg/mL of Ab8-Pro11and 2 μg/mL Ab8-Biotin for the H2D assay overnight in ahumidified chamber at 4◦C. Post incubation, samples were
rinsed and incubated with Strepavidin-methylene blue (SA-MB) as previously described [23]. Illumination buffer (IB)was added to samples and slides were transferred to theilluminator/chiller block. VeraTag Reporters were releasedat approximately 4◦C as previously described [23]. Postillumination, slides were removed from the chiller-blockand incubated in a humidified chamber at RT for 1 hour.Samples were collected from the slides and reduced ina final concentration of 5 ng/mL of sodium borohydride.Subsequently, samples were diluted 1 : 5 and both neat anddiluted samples were separated and detected on an ABI 3130capillary electrophoresis (CE) instrument. The injectionparameters were 6 kV, 100 s at 30◦C and 6 kV, 50 s at 30◦C, forthe H2D and H2T assays, respectively. Upon completion ofthe HERmark assay, samples were immediately H & E stainedusing standard protocols and reagents. A board certifiedpathologist using standard criteria for invasive carcinomadetermined and circled the tumor area. Circled slides werescanned and tumor area was calculated using the digitalimage of the sample. The program used to quantify the imagewas Image-Pro Plus version 6.0.0.260 (Media Cybernetics,Inc.; Bethesda, MD).
5. Data Analysis
Data analysis was performed as previously described [23].In brief, signals from two concomitantly run CE markersare used to demarcate the relevant region of the electro-pherogram and to locate the assay-specific peaks from theVeraTag reporters. Once identified, the signal intensity iscalculated for each VeraTag reporter as the peak heightintegrated over the peak elution time. The VeraTag peak areais then normalized to the peak area of the internal standardfluorescein, resulting in the relative peak area (RPA), whichis proportional to the concentration of the HER2 analytebeing measured. The RPA is then normalized to volume ofillumination buffer (IB) and tumor area (mm2) (TA) usingthis calculation: RPA∗IB/TA.
Pathology Research International 5
HER2 protein
Ab-1Ab-2
v
PM
(a)
HER2:HER2homodimer
Ab-1Ab-1
v
PM
(b)
Figure 1: Configuration of the H2T and H2D assay. (a) Configuration of the HER2 total assay consists of two antibodies specific to uniqueepitopes on the c-terminus of the HER2 protein. One antibody (Ab-1) is conjugated to a VeraTag molecule (V) and the other is conjugatedto biotin (Ab-2). The photosensitizer molecule (PM) brings the strepavidin-methylene blue in close proximity to the antibodies. (b)Configuration of the H2D assay consists of one antibody that is specific for a unique epitope on the HER2 protein. The same antibodyis conjugated either to a VeraTag (V; Ab-1) or to biotin (Ab-1). The photosensitizer molecule (PM) brings the strepavidin-methylene blue inclose proximity to the antibodies.
Finally, reported values were adjusted to reflect batch-to-batch trending in assay performance. Controls and sampleswere normalized by multiplying their adjusted RPA withthe calculated Batch Normalization Factor (BNF). AdjustedRPAs of the controls within a batch were compared toreference values. A nonlinear regression analysis on thepaired data was performed and a BNF determined foreach batch. Separate BNFs were determined for the releasedpeak and the converted peak. Each adjusted RPA value wasmultiplied by the respective BNF to obtain a normalizedRPA value. Because this normalized RPA value was unit-less by definition, its value was referred to in VeraTag units.All reportable normalized values for both peaks for a givensample were averaged to determine a final value for thatsample.
An algorithm was generated so that individual datapoints within each validation parameter could be comparedin a pairwise fashion. Because a single patient sample is runfor each of the H2T and H2D assays, performing pairwisecomparisons allows for a high degree of confidence in thatsingle measurement.
6. Results
6.1. Configuration of the H2T and H2D Assays. The prin-ciples of the VeraTag technology have been publishedelsewhere [23]. In brief, the HER2 total assay configuration(Figure 1(a)) consists of a VeraTag reporter conjugated toa specific antibody (Ab-1) that binds a distinct epitopeof HER2, while biotin is conjugated to a second antibody(Ab-2) that recognizes a second unique HER2 epitope. Ina subsequent reaction, a secondary streptavidin-methyleneblue conjugate is bound to the biotin-antibody complex toform a photosensitizer molecule (PM). Upon photoactiva-tion, the PM allows the generation of reactive oxygen thatsubsequently cleaves the most proximal VeraTag reporter,
yielding a released fluorescent molecule with a distinctcharge to mass ratio. The fluorescent molecule is accuratelyquantified using standard capillary electrophoresis (ABI3130). The H2D assay is similar in configuration with theexception that the biotin is conjugated to the same antibody(Ab1) that recognizes the same epitope as the VeraTagreporter antibody conjugate (Ab1) as shown in Figure 1(b).
6.2. HERmark Assay Workflow. The HERmark assay work-flow has been described in detail in the Material and Methodsand is depicted schematically in Figure 2. In brief, the FFPEtumor tissues are subjected to deparaffinization/rehydration,antigen retrieval, and the conjugated antibodies are thenadded and incubated overnight. The following day the tissuesare processed as described in Materials and Methods andthen illuminated on a chiller block for two hours. Followingillumination, the VeraTag reporters are collected from thetumor specimens and run on capillary electrophoresis andquantified using proprietary informer software. The sectionsare then H & E stained and the invasive tumor area identifiedby a board certified pathologist and quantified using animage analysis system as described in Materials and Methods.Tumors that are morphologically more than 50% DCIS areexcluded from the analysis. The tumor area is calculatedby the identification and circling of the invasive tumor bya board certified pathologist and subsequently quantifyingthis area using an image analysis system as described inMaterials and Methods. The final VeraTag data reported isnormalized to the actual tumor area and the entire batch isnormalized using cell line controls that have been previouslycharacterized with expected values (data not shown).
6.3. Accuracy (Comparison with Known Reference Methods).The accuracy of the H2T assay was assessed by testingmultiple independent cell lines that were previously charac-terized in the literature or in house using cross-validating
6 Pathology Research International
YY YY
Deparaffinization/rehydration Antigen retrieval
Antibodyincubation/wash
PhotoactivatedVeraTag release
VeraTag separationand detection on CE
hv
H & E tumorcircling/area analysis
Final sample and batchnormalised VeraTag data
VeraTag identificationand quantification by
VeraTag informer
vv1O2
Figure 2: HERmark Assay Workflow. Deparaffin/rehydration, antigen retrieval, and overnight antibody incubation steps are performed onDay 1. On day 2, the tumor tissue is incubated with the photosensitizer molecule and illuminated to release VeraTags. VeraTags are collectedand separated on capillary electrophoresis and the tumors are H & E stained, tumor area identified and circled and the final sample andbatch normalized data is typically available within a 7 day turnaround time.
technologies. HER2 total levels in human cancer cell lineshave been published using a variety of analytical techniques,including Western Blot data [27] and ELISA [28]. Minordiscrepancies between different published datasets are oftenattributed to minor changes in how the cells were culturedand harvested and/or the assay used to generate the data.For these reasons, Monogram generated internal datasetson HER2 total levels by both ELISA and flow cytometry(Table 1). The cell lines chosen spanned the range of knownHER2 expression from HER2 negative to HER2 3+ as definedby subjective criteria for IHC [29]. For the H2T assay,accuracy was assessed by measuring the HER2 total levels inseven cell lines (BT474, MDA-MB-361, T47D, A431, MDA-MB-231, MDA-MB-435 and MDA-MB-468) selected to spanthe approximate dynamic range of the assay. Two batcheswere required to run all 21 samples (3 samples for eachof 7 cell lines). Three samples of each of the followingfour cell lines were run in one batch: BT474, MDA-MB-361, T47D, and A431. The second batch contained thethree remaining cell lines (MDA-MB-231, MDA-MB-435,and MDA-MB-468) as well as repeated samples of A431.100% (21/21 pairwise comparisons) of overall accuracyresults matched expected results (Figure 3(a)) in that nooverlap was observed between signal levels for any of theseven cell line samples, that is, each cell line separatedcompletely from its nearest neighbor(s). For the H2D assay,no independent measurement of homodimers is currentlyavailable, so results were compared to in-house previousH2D assay measurements as well as independent HER2 totalmeasurements [23]. Samples from six different cell lineswere each tested in triplicate (BT-474, MDA-MB-361, BT-20, ZR-75-1, T47D, and MDA-MB-468) over two separatebatches and 100% (18/18 pairwise comparisons) of theresults matched predicted H2D levels (Figure 3(b)) with rank
order preservation and no overlap of values. These resultssuggest that the data from the H2T and H2D assays arecomparable to results from ELISA and flow cytometry assaysperformed concurrently as well as published results [27].
6.4. Precision (Intra-Assay Variability) Of the HERmark Assay.Assay precision was evaluated by determining the variabilitywithin a single assay or batch. Measurements were done bytesting two independent cell lines spanning the high and lowend of the assay dynamic range with 15 replicates per cellline per batch (MDA-MB-453 and MCF-7 for H2T; SKBR3and MDA-MB-453 for H2D) and analyzing the results usingpairwise comparisons. For the H2T assay, 100% (210/210)pairwise comparisons were within 1.7-fold and >95% of thepairwise comparisons were within 1.45-fold (Figure 4). Forthe H2D assay 100% (210/210) of the pairwise comparisonswere within 2.3-fold and >95% of the pairwise comparisonswere within 1.65-fold (Figure 4). The %CV for precision ofall data in the H2T assay was 14.9% (MDA-MB-453) and12.5% (MCF-7). The %CV for precision of 100% data in theH2D assay was 14% (SKBR3) and 21% (MDA-MB-453).
6.5. Reproducibility (Interassay Variability) of the H2T andH2D Assay. Assay reproducibility was evaluated by deter-mining the variability between batches. The interassay repro-ducibility was evaluated over numerous parameters typicallyencountered in the clinical reference lab, including at leasttwo operators, multiple instruments (illuminators/chillerblocks, scanners and capillary electrophoresis instruments),two lots of critical reagents, two lots of cell line controls, andmultiple days/weeks. Samples consisted of a combination of45 patient-derived FFPE samples (sample IDs not shown)and 12 cell line samples as shown in (Table 2). Samples were
Pathology Research International 7
0.1
1
10
100
1000
BT
474
MD
A-M
B-3
61
T47
D
A43
1
MD
A-M
B-2
31
MD
A-M
B-4
35
MD
A-M
B-4
68
Nor
mal
ised
H2T
(a)
0.1
1
10
100
1000
BT
474
MD
AM
B36
1
BT
20
ZR
75-1
T47
D
MD
A-M
B-4
68
Nor
mal
ised
H2D
(b)
Figure 3: Accuracy of the H2T and H2D assays. Seven ((a); H2T) and six ((b); H2D) different cell lines with varying levels of HER2 totalprotein, as measured by in house ELISA and flow cytometry, were run in the H2T assay in two separate batches. All signals showed correctrank order and accuracy based on ELISA and flow cytometry comparisons.
1
10
100
1000
MD
A-M
B-4
53(H
2T)
MC
F-7
(H2T
)
SKB
R3
(H2D
)
MD
A-M
B-4
53(H
2D)
Nor
mal
ised
H2T
orH
2D
Figure 4: Precision of the HERmark assay. Fifteen replicates of eachof 2 different cell lines spanning the dynamic range of the H2T andH2D assays were run in one batch for each assay to determine intra-assay variability. 95% of the values in the H2T and H2D assay arewithin 1.45-fold and 1.65-fold, respectively.
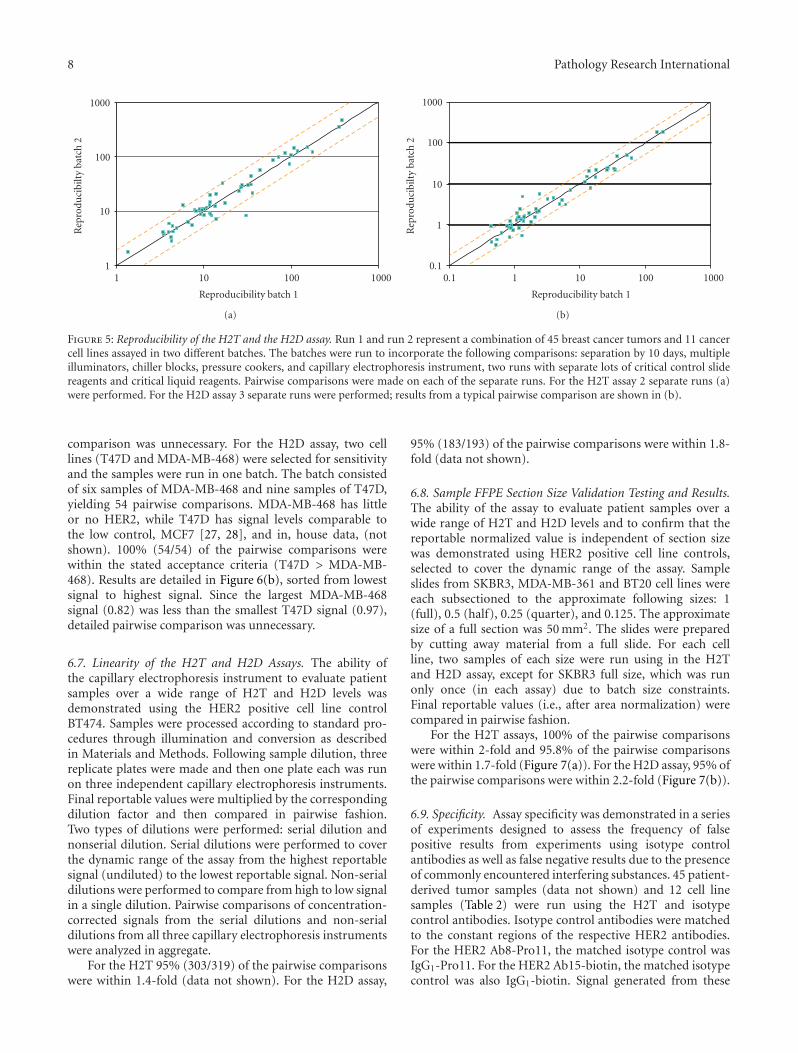
grouped into three tumor sets (TS): A, B, and C (TSA, TSB,TSC) and one cell line panel (CLP). Results were comparedpairwise after each sample was run in separate batches. Forthe H2T assay, each sample set was run in two differentbatches and, for the the H2D assay, each sample set wasrun in three different batches. Of the reportable values, 96%of the pairwise comparisons were within 2-fold in the H2Tassay (Figure 5(a)). For the H2D assay, 95% of the pairwisecomparisons were within 2.2-fold (Figure 5(b)).
Table 2: Summary of the cancer cell lines (A) used in the validationof the HERmark assay.
Cell Line Source Source ID
SKBR3 ATCC(1) HTB-30
BT20 ATCC HTB-19
MDA-MB-453 ATCC HTB-131
MCF7 ATCC HTB-22
MDA-MB-468 ATCC HTB-132
BT474 ATCC HTB-20
MDA-MB-361 ATCC HTB-27
T47D ATCC HTB-133
MDA-MB-231 ATCC HTB-26
MDA-MB-435 ATCC HTB-129
ZR-75-1 ATCC CRL-1500
A431 ATCC CRL-1555(1)ATCC= American Type Culture Collection.
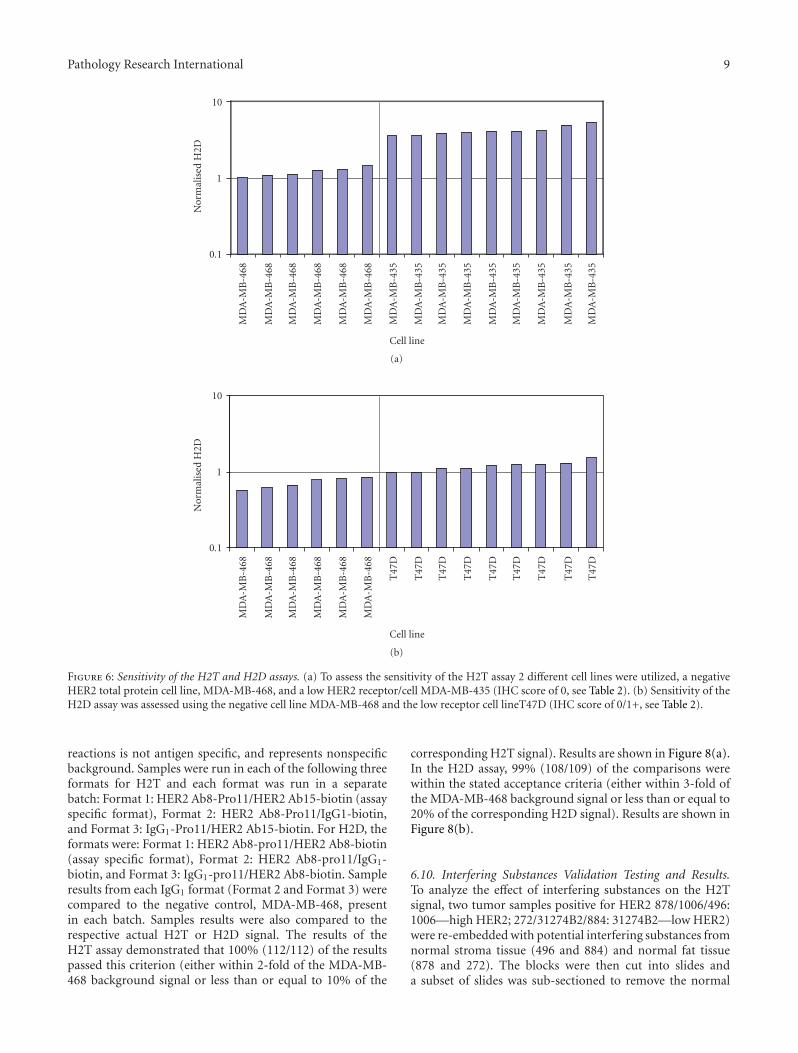
6.6. Sensitivity of the H2T and H2D Assays. For the H2Tassay, two cell lines (i.e., MDA-MB-435 and MDA-MB-468)were selected for sensitivity and the samples run in one batch.The batch consisted of six samples of MDA-MB-468 and ninesamples of MDA-MB-435, yielding 54 potential pairwisecomparisons. MDA-MB-468 has little or no HER2, whileMDA-MB-435 has low signal levels, less than the lowest assaycontrol, MCF7 [27, 28] as well as in house data (not shown).100% (54/54) of the pairwise comparisons were withinthe stated acceptance criteria that all MDA-MB-435 valuesare greater than MDA-MB-468 values. Results are detailedin Figure 6(a), sorted from lowest signal to highest signal.Because the largest MDA-MB-468 signal (1.46) was less thanthe smallest MDA-MB-435 signal (3.59), detailed pairwise
8 Pathology Research International
1
10
100
1000
1 10 100 1000
Rep
rodu
cibi
lty
batc
h2
Reproducibility batch 1
(a)
0.1
1
10
100
1000
0.1 1 10 100 1000
Rep
rodu
cibi
lty
batc
h2
Reproducibility batch 1
(b)
Figure 5: Reproducibility of the H2T and the H2D assay. Run 1 and run 2 represent a combination of 45 breast cancer tumors and 11 cancercell lines assayed in two different batches. The batches were run to incorporate the following comparisons: separation by 10 days, multipleilluminators, chiller blocks, pressure cookers, and capillary electrophoresis instrument, two runs with separate lots of critical control slidereagents and critical liquid reagents. Pairwise comparisons were made on each of the separate runs. For the H2T assay 2 separate runs (a)were performed. For the H2D assay 3 separate runs were performed; results from a typical pairwise comparison are shown in (b).
comparison was unnecessary. For the H2D assay, two celllines (T47D and MDA-MB-468) were selected for sensitivityand the samples were run in one batch. The batch consistedof six samples of MDA-MB-468 and nine samples of T47D,yielding 54 pairwise comparisons. MDA-MB-468 has littleor no HER2, while T47D has signal levels comparable tothe low control, MCF7 [27, 28], and in, house data, (notshown). 100% (54/54) of the pairwise comparisons werewithin the stated acceptance criteria (T47D > MDA-MB-468). Results are detailed in Figure 6(b), sorted from lowestsignal to highest signal. Since the largest MDA-MB-468signal (0.82) was less than the smallest T47D signal (0.97),detailed pairwise comparison was unnecessary.
6.7. Linearity of the H2T and H2D Assays. The ability ofthe capillary electrophoresis instrument to evaluate patientsamples over a wide range of H2T and H2D levels wasdemonstrated using the HER2 positive cell line controlBT474. Samples were processed according to standard pro-cedures through illumination and conversion as describedin Materials and Methods. Following sample dilution, threereplicate plates were made and then one plate each was runon three independent capillary electrophoresis instruments.Final reportable values were multiplied by the correspondingdilution factor and then compared in pairwise fashion.Two types of dilutions were performed: serial dilution andnonserial dilution. Serial dilutions were performed to coverthe dynamic range of the assay from the highest reportablesignal (undiluted) to the lowest reportable signal. Non-serialdilutions were performed to compare from high to low signalin a single dilution. Pairwise comparisons of concentration-corrected signals from the serial dilutions and non-serialdilutions from all three capillary electrophoresis instrumentswere analyzed in aggregate.
For the H2T 95% (303/319) of the pairwise comparisonswere within 1.4-fold (data not shown). For the H2D assay,
95% (183/193) of the pairwise comparisons were within 1.8-fold (data not shown).
6.8. Sample FFPE Section Size Validation Testing and Results.The ability of the assay to evaluate patient samples over awide range of H2T and H2D levels and to confirm that thereportable normalized value is independent of section sizewas demonstrated using HER2 positive cell line controls,selected to cover the dynamic range of the assay. Sampleslides from SKBR3, MDA-MB-361 and BT20 cell lines wereeach subsectioned to the approximate following sizes: 1(full), 0.5 (half), 0.25 (quarter), and 0.125. The approximatesize of a full section was 50 mm2. The slides were preparedby cutting away material from a full slide. For each cellline, two samples of each size were run using in the H2Tand H2D assay, except for SKBR3 full size, which was runonly once (in each assay) due to batch size constraints.Final reportable values (i.e., after area normalization) werecompared in pairwise fashion.
For the H2T assays, 100% of the pairwise comparisonswere within 2-fold and 95.8% of the pairwise comparisonswere within 1.7-fold (Figure 7(a)). For the H2D assay, 95% ofthe pairwise comparisons were within 2.2-fold (Figure 7(b)).
6.9. Specificity. Assay specificity was demonstrated in a seriesof experiments designed to assess the frequency of falsepositive results from experiments using isotype controlantibodies as well as false negative results due to the presenceof commonly encountered interfering substances. 45 patient-derived tumor samples (data not shown) and 12 cell linesamples (Table 2) were run using the H2T and isotypecontrol antibodies. Isotype control antibodies were matchedto the constant regions of the respective HER2 antibodies.For the HER2 Ab8-Pro11, the matched isotype control wasIgG1-Pro11. For the HER2 Ab15-biotin, the matched isotypecontrol was also IgG1-biotin. Signal generated from these
Pathology Research International 9
0.1
1
10
Nor
mal
ised
H2D
MD
A-M
B-4
68
MD
A-M
B-4
68
MD
A-M
B-4
68
MD
A-M
B-4
68
MD
A-M
B-4
68
MD
A-M
B-4
68
MD
A-M
B-4
35
MD
A-M
B-4
35
MD
A-M
B-4
35
MD
A-M
B-4
35
MD
A-M
B-4
35
MD
A-M
B-4
35
MD
A-M
B-4
35
MD
A-M
B-4
35
MD
A-M
B-4
35
Cell line
(a)
0.1
1
10
Nor
mal
ised
H2D
MD
A-M
B-4
68
MD
A-M
B-4
68
MD
A-M
B-4
68
MD
A-M
B-4
68
MD
A-M
B-4
68
MD
A-M
B-4
68
T47
D
T47
D
T47
D
T47
D
T47
D
T47
D
T47
D
T47
D
T47
D
Cell line
(b)
Figure 6: Sensitivity of the H2T and H2D assays. (a) To assess the sensitivity of the H2T assay 2 different cell lines were utilized, a negativeHER2 total protein cell line, MDA-MB-468, and a low HER2 receptor/cell MDA-MB-435 (IHC score of 0, see Table 2). (b) Sensitivity of theH2D assay was assessed using the negative cell line MDA-MB-468 and the low receptor cell lineT47D (IHC score of 0/1+, see Table 2).
reactions is not antigen specific, and represents nonspecificbackground. Samples were run in each of the following threeformats for H2T and each format was run in a separatebatch: Format 1: HER2 Ab8-Pro11/HER2 Ab15-biotin (assayspecific format), Format 2: HER2 Ab8-Pro11/IgG1-biotin,and Format 3: IgG1-Pro11/HER2 Ab15-biotin. For H2D, theformats were: Format 1: HER2 Ab8-pro11/HER2 Ab8-biotin(assay specific format), Format 2: HER2 Ab8-pro11/IgG1-biotin, and Format 3: IgG1-pro11/HER2 Ab8-biotin. Sampleresults from each IgG1 format (Format 2 and Format 3) werecompared to the negative control, MDA-MB-468, presentin each batch. Samples results were also compared to therespective actual H2T or H2D signal. The results of theH2T assay demonstrated that 100% (112/112) of the resultspassed this criterion (either within 2-fold of the MDA-MB-468 background signal or less than or equal to 10% of the
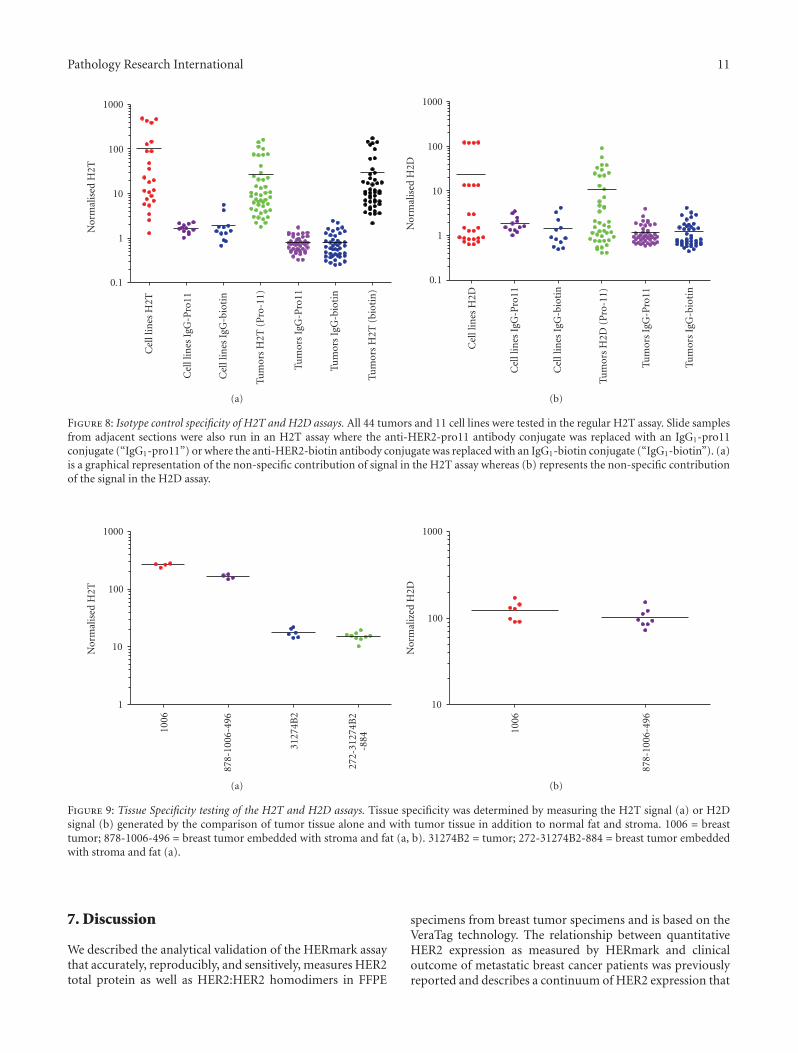
corresponding H2T signal). Results are shown in Figure 8(a).In the H2D assay, 99% (108/109) of the comparisons werewithin the stated acceptance criteria (either within 3-fold ofthe MDA-MB-468 background signal or less than or equal to20% of the corresponding H2D signal). Results are shown inFigure 8(b).
6.10. Interfering Substances Validation Testing and Results.To analyze the effect of interfering substances on the H2Tsignal, two tumor samples positive for HER2 878/1006/496:1006—high HER2; 272/31274B2/884: 31274B2—low HER2)were re-embedded with potential interfering substances fromnormal stroma tissue (496 and 884) and normal fat tissue(878 and 272). The blocks were then cut into slides anda subset of slides was sub-sectioned to remove the normal
10 Pathology Research International
10
100
1000
Nor
mal
ised
H2T
0.12
5
0.12
5
0.25
0.25 0.
5
0.5 1 1
0.12
5
0.12
5
0.25
0.25 0.
5
0.5 1 1
0.12
5
0.12
5
0.25
0.25 0.
5 1
BT20
MDA-MB-361
SKBR3
Section size
(a)
1
10
100
1000
Nor
mal
ised
H2D
0.12
5
0.12
5
0.25
0.25 0.
5
0.5 1 1
0.12
5
0.12
5
0.25
0.25 0.
5
0.5 1 1
0.12
5
0.12
5
0.25
0.25 0.
5 1
BT20
MDA-MB-361
SKBR3
Section size
(b)
Figure 7: Section size linearity of the H2T and H2D assays. (a) Cell line controls with varying levels of H2T (a) and H2D (b) were sub-sectioned and then run in the HERmark assay to determine linearity of the measurements with respect to section size. Normalized values(y-axis) show the final signals that have been corrected for size. 95.8% of the pairwise comparisons were within 1.7-fold in the H2T assayand 95% of the pairwise comparisons were with 2.2-fold for the H2D assay.
stroma and normal fat (tumor only: 1006 or 31274B2). Theseslides were then run with the corresponding whole (i.e.,not sub-sectioned) re-embedded slides in the H2T assay. Apairwise comparison of final results was then obtained. For878/1006/496, four samples of tumor only and four samplesof tumor/stroma/fat were run in one batch, resulting in 16pairwise comparisons. For 272/31274B2/884, six samples oftumor only and 9 samples of tumor/stroma/fat were run inone batch, resulting in 54 pairwise comparisons. A total of70 pairwise comparisons were obtained and 100% (70/70) ofthe pairwise comparisons were within the stated acceptancecriteria (2.5-fold). Further, 97% of the pairwise comparisonswere within 2-fold, and 95% of the pairwise comparisonswere within 1.9-fold. Results are detailed in Figure 9(a).
To analyze the affect of interfering substances on theH2D signal, the same tumor sample as above was used(878/1006/496) and the blocks cut into slides and a subset ofslides was sub-sectioned to remove the normal stroma andnormal fat. These slides were run with the correspondingwhole (i.e., not sub-sectioned) re-embedded slides in theH2D assay. A pairwise comparison of final results was thenobtained. Seven samples of tumor only and eight samples
of tumor/stroma/fat were run in one batch, resulting in56 pairwise comparisons. 100% (56/56) of the pairwisecomparisons were within the stated acceptance criteria (3-fold). 100% of the pairwise comparisons were within 2.4-foldand 95% of the pairwise comparisons were within 2-fold.Results are shown in Figure 9(b).
6.11. Validation Summary. The summary of the HERmarkCLIA validation results is shown in Table 3. For each assay,H2T and H2D, several parameters of assay performancewere tested including accuracy, precision, reproducibility,sensitivity, linearity, and specificity. The percentage of resultspassing the validation is based on a 2-fold cutoff whereapplicable. For the H2D assay, there are two parameters,reproducibility and FFPE section size linearity that did notpass the 95% 2-fold cutoffs and but were 91.8% and 92.2%,respectively. Differences in the amount of H2D in the cellrelative to H2T and/or the differences between the two assayformats may account for the decreased performance of theH2D assay relative to the H2T. In addition, the measurementon smaller section sizes may result in variability outside thelinear range of the assay.
Pathology Research International 11
0.1
1
10
100
1000
Cel
llin
esH
2T
Cel
llin
esIg
G-P
ro11
Cel
llin
esIg
G-b
ioti
n
Tum
ors
H2T
(Pro
-11)
Tum
ors
IgG
-Pro
11
Tum
ors
IgG
-bio
tin
Tum
ors
H2T
(bio
tin
)
Nor
mal
ised
H2T
(a)
0.1
1
10
100
1000
Cel
llin
esH
2D
Cel
llin
esIg
G-P
ro11
Cel
llin
esIg
G-b
ioti
n
Tum
ors
H2D
(Pro
-11)
Tum
ors
IgG
-Pro
11
Tum
ors
IgG
-bio
tin
Nor
mal
ised
H2D
(b)
Figure 8: Isotype control specificity of H2T and H2D assays. All 44 tumors and 11 cell lines were tested in the regular H2T assay. Slide samplesfrom adjacent sections were also run in an H2T assay where the anti-HER2-pro11 antibody conjugate was replaced with an IgG1-pro11conjugate (“IgG1-pro11”) or where the anti-HER2-biotin antibody conjugate was replaced with an IgG1-biotin conjugate (“IgG1-biotin”). (a)is a graphical representation of the non-specific contribution of signal in the H2T assay whereas (b) represents the non-specific contributionof the signal in the H2D assay.
1
10
100
1000
1006
878-
1006
-496
3127
4B2
272-
3127
4B2
-884
Nor
mal
ised
H2T
(a)
10
100
1000
1006
878-
1006
-496
Nor
mal
ized
H2D
(b)
Figure 9: Tissue Specificity testing of the H2T and H2D assays. Tissue specificity was determined by measuring the H2T signal (a) or H2Dsignal (b) generated by the comparison of tumor tissue alone and with tumor tissue in addition to normal fat and stroma. 1006 = breasttumor; 878-1006-496 = breast tumor embedded with stroma and fat (a, b). 31274B2 = tumor; 272-31274B2-884 = breast tumor embeddedwith stroma and fat (a).
7. Discussion
We described the analytical validation of the HERmark assaythat accurately, reproducibly, and sensitively, measures HER2total protein as well as HER2:HER2 homodimers in FFPE
specimens from breast tumor specimens and is based on theVeraTag technology. The relationship between quantitativeHER2 expression as measured by HERmark and clinicaloutcome of metastatic breast cancer patients was previouslyreported and describes a continuum of HER2 expression that
12 Pathology Research International
Table 3: H2T and H2D assay validation summary. The parameters tested in the validation of the HERmark assay are summarized and thepercentage passing is based on a 2-fold cutoff. NA indicates that a detailed pairwise comparison was not necessary and so therefore the 2-foldcutoff was not applicable. 195th percentile at 2.2 fold cutoff.
Parameter H2T Summary % Within Two-fold Cutoff H2D Summary % Within Two-fold Cutoff
Accuracy Pass NA (100) Pass NA (100)
Sensitivity Pass NA (100) Pass NA (100)
Precision Pass 100 Pass 99.5
Reproducibility Pass 96.4 Pass 91.81
Linearity: CE Pass 99.7 Pass 99%
Linearity: Section Size Pass 100 Pass 92.21
Specificity: Triple Re-embed Pass 97.1 Pass 94.6
Specificity: Isotype Pass NA (100) Pass NA (99.1)
correlates with outcome following trastuzumab treatment.[30, 31]When HERmark measurements are compared retro-spectively with IHC and ISH testing on a set of metastaticbreast cancer tumors originally classified as HER2 positiveand eligible for Trastuzumab treatment, a subset (∼13%)was subsequently reclassified [32]. These patients experi-enced times-to-progression (TTP) following trastuzumabtreatment, that were indistinguishable from those of patientsclassified as central FISH-negative, and significantly shorterTTP than similar FISH- positive patients who also showedover-expression of HER2 by HERmark. When samples werecompared retrospectively in larger adjuvant clinical trial(FinHer) originally selected for HER2 status by a combina-tion of local IHC and central CISH, ∼13%–23% of patientswere reclassified by HERmark depending on the comparison(local or central IHC, or both central IHC and CISH)[33]. Excluding the equivocal cases in this study, HERmarkdemonstrated 97% concordance with IHC for positive andnegative assay values. We have previously established aclinical cut-off whereby patients above a certain thresholdof HER2 protein, as determined by HERmark, respondbetter in time to progression to Trastuzumab treatmentthan those below this cut-off determined by positionalscanning [32]. Interestingly, this clinical cutoff falls withinthe HERmark equivocal zone which is defined by the 95%confidence of this measurement as compared to ∼1090breast cancer tissue specimens tested by reference methods(IHC/ISH). It is worthwhile to note that the HERmarkequivocal category encompasses a relative narrow range (∼0.2 log) within the wide dynamic range (∼2-3 log) of HER2distribution, while the semi-quantitative IHC 2+ category(considered equivocal) may include tumors with wider rangeof HER2 expression. The current IHC testing is based ona subjective, semi-quantitative scale (0, 1+, 2+, and 3+)requiring microscopic evaluation by a board certified pathol-ogist. Standardization of such a method across laboratoriesrequires robust methods to ensure that there is consistencyin the testing method as well as the scoring based on anonautomated system [21]. The HERmark assay providesa continuous, quantitative, and reproducible measurementfor H2T and H2D over a dynamic range of ∼3 logs and∼2 logs, respectively. This allows the accurate separation ofcell line controls that were originally classified as 2+ to 3+
into a continuum that spans a HER2 protein levels 5–10-fold as measured by HERmark. These results agree quitewell with in-house measurements using low throughputquantitative methods such as flow cytometry and ELISAand testing on the same cell line preparations as used forthe FFPE blocks. We have also demonstrated previouslythat H2T measurement in a set of 170 tumors correlateswell with in-house IHC measurements [23]. Furthermore,the corresponding histoscores (H-score), on this subset oftumors, as measured by HER2 IHC, demonstrate a plateau inthe IHC 3+ category and the inability to accurately stratify athigh levels of HER2 protein, whereas measurement by H2Tdemonstrates >10-fold difference in dynamic range [23].
There is no standard way to measure HER2 homodimerlevels but it has been demonstrated previously that over-expression of HER2 protein expression may be required totransform a cell line in vitro [2]. Biologically a differencein HER2 receptor levels in the range of 5–10-fold mayhave significant impact on patient response to Trastuzumab[34]. This is especially important when considering the low-response rates and emerging evidence that levels of p95, thetruncated form of full-length HER2, correlate with higherlevels of H2T [34]. In addition to the extension of thedynamic range at the higher end, the HERmark assay isable to accurately distinguish a set of cell line controlsclassified by IHC as 0 to 1+ but spanning a ∼20 folddynamic range from a negative control cell line, MDA-MB-468 that has no detectable HER2 protein expressionas measured by ELISA. This difference corresponds to arange of HER2 total receptors per cell from low/negativeup to ∼30,000 as determined by flow cytometry. We havedemonstrated that the sensitivity of the H2T measurement isequivalent to 2500 receptors/cell whereas conventional IHCis typically 7–10 times less sensitive. Therefore, when thecell line MDA-MB-435 is measured by IHC the result isa classification of 0 or negative (in house data). Recently,adjuvant clinical trials have indicated that even patients thatare not overexpressing HER2 as measured by IHC and FISH,may respond to Trastuzumab treatment, indicating thataccurate and sensitive measurements at the lower end of thedynamic range may also be clinically relevant [16]. Similarly,the quantitative measurement of low levels of HER2 maybe clinically relevant for other types of solid tumors as in
Pathology Research International 13
the case of Barrett’s esophagus-associated adenocarcinomacancer [35]. Other quantitative measurements of HER familyproteins (EGFR and HER2) have been developed basedon the AQUA technology, however, in the case of HER2it has been shown that two different concentrations ofHER2 antibody are required to accurately quantify the HER2levels depending on whether the measurements are madein the upper range or lower dynamic range of expression[36]. Applying this to routine practice could be quitecumbersome and may increase the subjective nature of theHER2 protein measurement. The HERmark assay consistsof cell line controls that span the entire dynamic range ofHER2 protein expression and are used to control for batchto batch variability, allowing comparisons to be made overtime between clinical samples. Since a patient sample ismeasured only once, it was important to rigorously test theintra- and interassay variability to determine the confidencelevel surrounding this measurement. Precision experimentsdemonstrated that if a patient sample is measured multipletimes within a batch, there is a 95% probability that theH2T value will be within 1.45-fold and that the H2D valuewill be within 1.65-fold. The precision was determined usingcell lines that span above and below the clinical cutoff forresponse to Trastuzumab in a test cohort as decribed above.With a dynamic range of 2-3 logs, the potential of classifyinga patient as a false positive or negative theoretically shouldbe greatly reduced; however, there will be some ambiguityin the measurement at or around the clinical cutoff basedon the analytical performance of the assay. This analyticalperformance applies to all methods of HER2 testing includ-ing IHC, ISH, and mRNA measurements and may explainwhy there is so much reclassification when standard testing iscompared to HERmark, especially in the equivocal category.Inter assay reproducibility was evaluated under differentparameters typically encountered in a clinical laboratoryincluding different operators, multiple instruments, differentdays and two lots of critical reagents. This also allows thecomparison of what might be typically associated whensamples are run in different central labs as routinely done forHER2 IHC and FISH testing for Trastuzumab inclusion. Inaddition to good reproducibility the specificity of the assay isincreased due to the fact that the VeraTag technology relieson the binding of two epitope-specific antibodies in closeproximity. Conventional IHC relies on a single antibodyand requires high degree of specificity that is difficult toachieve with varying heterogeneity in tumor samples. Batchnormalization of the data allows for Meta analysis of clinicalstudies and to validate potential clinical cutoffs as well as tomonitor assay performance over time. In general, a higherconcordance was observed between H2T by HERmark andHER2 assessed by more stringent central testing as comparedwith local HER2 testing by IHC in that the results were 97%concordant overall (excluding equivocals) [37]. Further-more, HERmark positive breast cancers were significantlyassociated with invasive ductal carcinoma, high tumor grade,estrogen/progesterone receptor negativity, and expression ofKi67 [38]. Thus the quantitative HER2 measurement byHERmark confirms the known correlations between HER2expression and clinical pathologic characteristics of breast
cancer. The use of a more accurate and quantitative HER2measurement may allow better stratification of patients forresponse to HER2 targeted therapies as well as improve theaccuracy and sensitivity of the testing methodology.
Acknowledgments
All authors included in this paper have indicated no financialor other interest that is relevant to the subject matter underconsideration in this paper other than being employeesof Monogram Biosciences. At the present time, none ofthe authors are shareholders in Monogram Biosciences. J.S.Larson and L. J. Goodman contributed equally to this work.
References
[1] A. Citri, K. B. Skaria, and Y. Yarden, “The deaf and thedumb: the biology of ErbB-2 and ErbB-3,” Experimental CellResearch, vol. 284, no. 1, pp. 54–65, 2003.
[2] P. P. Di Fiore, J. H. Pierce, M. H. Kraus, O. Segatto, R. King,and S. A. Aaronson, “erbB-2 is a potent oncogene whenoverexpressed in NIH/3T3 cells,” Science, vol. 237, no. 4811,pp. 178–182, 1987.
[3] Y. Yarden and M. X. Sliwkowski, “Untangling the ErbBsignalling network,” Nature Reviews Molecular Cell Biology,vol. 2, no. 2, pp. 127–137, 2001.
[4] C. A. Hudis, “Trastuzumab—mechanism of action and use inclinical practice,” The New England Journal of Medicine, vol.357, no. 1, pp. 39–51, 2007.
[5] J. S. Ross, E. A. Slodkowska, W. F. Symmans, L. Pusztai, P.M. Ravdin, and G. N. Hortobagyi, “The HER-2 receptor andbreast cancer: ten years of targeted anti-HER-2 therapy andpersonalized medicine,” Oncologist, vol. 14, no. 4, pp. 320–368,2009.
[6] R. W. Carlson, S. J. Moench, M. E. H. Hammond, et al.,“HER2 testing in breast cancer: NCCN task force reportand recommendations,” Journal of the National ComprehensiveCancer Network, vol. 4, no. 3, pp. S1–S22, 2006.
[7] D. J. Slamon, G. M. Clark, S. G. Wong, et al., “Human breastcancer: correlation of relapse and survival with amplificationof the HER-2/neu oncogene,” Science, vol. 235, no. 4785, pp.177–182, 1987.
[8] S. Amar, A. Moreno-Aspitia, and E. A. Perez, “Issues andcontroversies in the treatment of HER2 positive metastaticbreast cancer,” Breast Cancer Research and Treatment, vol. 109,no. 1, pp. 1–7, 2008.
[9] A. Di Leo, M. Dowsett, B. Horten, and F. Penault-Llorca,“Current status of HER2 testing,” Oncology, vol. 63, pp. 25–32,2002.
[10] D. G. Hicks and S. Kulkarni, “Trastuzumab as adjuvanttherapy for early breast cancer: the importance of accuratehuman epidermal growth factor receptor 2 testing,” Archives ofPathology and Laboratory Medicine, vol. 132, no. 6, pp. 1008–1015, 2008.
[11] A. Rhodes, B. Jasani, J. Couturier, et al., “A formalin-fixed, paraffin-processed cell line standard for quality controlof immunohistochemical assay of HER-2/neu expression inbreast cancer,” American Journal of Clinical Pathology, vol. 117,no. 1, pp. 81–89, 2002.
[12] C. L. Arteaga, A. O’Neill, S. L. Moulder, et al., “A phase I-II study of combined blockade of the ErbB receptor net-work with trastuzumab and gefitinib in patients with HER2
14 Pathology Research International
(ErbB2)-overexpressing metastatic breast cancer,” ClinicalCancer Research, vol. 14, no. 19, pp. 6277–6283, 2008.
[13] E. de Alava, A. Ocana, M. Abad, et al., “Neuregulin expressionmodulates clinical response to trastuzumab in patients withmetastatic breast cancer,” Journal of Clinical Oncology, vol. 25,no. 19, pp. 2656–2663, 2007.
[14] M. Piccart, C. Lohrisch, A. Di Leo, and D. Larsimont, “Thepredictive value of HER2 in breast cancer,” Oncology, vol. 61,supplement 2, pp. 73–82, 2001.
[15] A. C. Wolff, M. E. Hammond, J. N. Schwartz, et al., “AmericanSociety of Clinical Oncology/College of American Pathologistsguideline recommendations for human epidermal growthfactor receptor 2 testing in breast cancer,” Archives of Pathologyand Laboratory Medicine, vol. 131, p. 18, 2007.
[16] S. Paik, J. Bryant, E. Tan-Chiu, et al., “Real-world performanceof HER2 testing—National Surgical Adjuvant Breast andBowel Project experience,” Journal of the National CancerInstitute, vol. 94, no. 11, pp. 852–854, 2002.
[17] E. D. Hsi and R. R. Tubbs, “Guidelines for HER2 testing in theUK,” Journal of Clinical Pathology, vol. 57, no. 3, pp. 241–242,2004.
[18] O. Hameed, A. L. Adams, A. C. Baker, et al., “Using a highercutoff for the percentage of HER2+ cells decreases interob-server variability in the interpretation of HER2 immunohisto-chemical analysis,” American Journal of Clinical Pathology, vol.130, no. 3, pp. 425–427, 2008.
[19] D. G. Hicks and S. Kulkarni, “HER2+ breast cancer: reviewof biologic relevance and optimal use of diagnostic tools,”American Journal of Clinical Pathology, vol. 129, no. 2, pp. 263–273, 2008.
[20] A. M. Gown, “Current issues in ER and HER2 testing by IHCin breast cancer,” Modern Pathology, vol. 21, no. 2, pp. S8–S15,2008.
[21] E. A. Perez, V. J. Suman, N. E. Davidson, et al., “HER2 testingby local, central, and reference laboratories in specimens fromthe north central cancer treatment group N9831 intergroupadjuvant trial,” Journal of Clinical Oncology, vol. 24, no. 19, pp.3032–3038, 2006.
[22] W. M. Hanna and K. Kwok, “Chromogenic in-situ hybridiza-tion: a viable alternative to fluorescence in-situ hybridizationin the HER2 testing algorithm,” Modern Pathology, vol. 19, no.4, pp. 481–487, 2006.
[23] Y. Shi, W. Huang, Y. Tan, et al., “A novel proximity assay for thedetection of proteins and protein complexes: quantitation ofHER1 and HER2 total protein expression and homodimeriza-tion in formalin-fixed, paraffin-embedded cell lines and breastcancer tissue,” Diagnostic Molecular Pathology, vol. 18, no. 1,pp. 11–21, 2009.
[24] W. Huang, M. Reinholz, J. Weidler, et al., “Comparison ofCentral HER-2 tests with quantitative HER-2 expression andHER-2 homodimer measurements using a novel proximityassay,” American Journal of Pathology. In press.
[25] G. R. Baehner, T. Maddala, B. Childs, et al., “HER2 concor-dance between Central Laboratory Immunohistochemistry,FISH and Quantitative RT-PCR in Intergroup Trial E2197,”in Proceedings of the United States and Canadian Academy ofPathology Annual Meeting (USCAP ’09), Boston, Mass, USA,2009, Abstract no. 1421.
[26] J. M. Rae, C. J. Creighton, J. M. Meck, B. R. Haddad, andM. D. Johnson, “MDA-MB-435 cells are derived from M14Melanoma cells—a loss for breast cancer, but a boon formelanoma research,” Breast Cancer Research and Treatment,vol. 104, no. 1, pp. 13–19, 2007.
[27] M. M. Moasser, A. Basso, S. D. Averbuch, and N. Rosen,“The tyrosine kinase inhibitor ZD1839 (“Iressa”) inhibitsHER2-driven signaling and suppresses the growth of HER2-overexpressing tumor cells,” Cancer Research, vol. 61, no. 19,pp. 7184–7188, 2001.
[28] G. E. Konecny, M. D. Pegram, N. Venkatesan, et al., “Activity ofthe dual kinase inhibitor lapatinib (GW572016) against HER-2-overexpressing and trastuzumab-treated breast cancer cells,”Cancer Research, vol. 66, no. 3, pp. 1630–1639, 2006.
[29] M. Dowsett, W. M. Hanna, M. Kockx, et al., “Standardizationof HER2 testing: results of an international proficiency-testingring study,” Modern Pathology, vol. 20, no. 5, pp. 584–591,2007.
[30] C. Desmedt, J. Sperinde, F. Piette, et al., “Quantitation ofHER2 expression or HER2:HER2 dimers and differentialsurvival in a cohort of metastatic breast cancer patientscarefully selected for trastuzumab treatment primarily byFISH,” Diagnostic Molecular Pathology, vol. 18, no. 1, pp. 22–29, 2009.
[31] M. Toi, J. Sperinde, W. Huang, et al., “Differential survivalfollowing trastuzumab treatment based on quantitative HER2expression and HER2 homodimers in a clinic-based cohort ofpatients with metastatic breast cancer,” BMC Cancer, vol. 10,article 56, 2010.
[32] A. Lipton and S. Ali, “HER2 protein expression and homod-imer levels predict response to Trastuzumab in centrallytested FISH-positive metastatic breast cancer patients,” inProceedings of the 31st CTRC-AACR San Antonio Breast CancerSymposium, 2008, Abstract no. 550749.
[33] M. H. Joensuu, J. Weidler, Y. Lie, et al., “Quantitativemeasurements of HER2 expression and HER2 homodimerusing a novel proximity based assay: comparison with HER2status by immunohistochemistry and chromogenic in situhybridization in the FinHer study,” in Proceedings of the 31stAnnual San Antonio Breast Cancer Symposium, 2008, Posterno. 2071.
[34] J. Sperinde, S. Ali, K. Leitzel, et al., “ Identification ofa subpopulation of metastatic breast cancer patients withvery high HER2 expression levels and possible resistance totrastuzumab,” Journal of Clinical Oncology, vol. 27, supple-ment, no. 15, 2009, abstract no. 1059.
[35] S. Rauser, R. Weis, H. Braselmann, et al., “Significance ofHER2 low-level copy gain in Barrett’s cancer: implications forfluorescence in situ hybridization testing in tissues,” ClinicalCancer Research, vol. 13, no. 17, pp. 5115–5123, 2007.
[36] A. McCabe, M. Dolled-Filhart, R. L. Camp, and D. L. Rimm,“Automated quantitative analysis (AQUA) of in situ proteinexpression, antibody concentration, and prognosis,” Journal ofthe National Cancer Institute, vol. 97, no. 24, pp. 1808–1815,2005.
[37] H. Joensuu, J. Weidler, Y. Lie, et al., “Quantitative measure-ments of HER2 expression and HER2 homodimer using anovel proximity based assay: comparison with HER2 statusby immunohistochemistry and chromogenic in situ hybridiza-tion in the FinHer study,” in Proceedings of te 31st Annual SanAntonio Breast Cancer Symposium, 2008, Poster no. 2071.
[38] H. Joensuu, P.-L. K. Lehtinen, and P. Bono, “Adjuvantdocetaxel or vinorelbine with or without trastuzumab forbreast cancer,” The New England Journal of Medicine, vol. 354,pp. 809–820, 2006.