Research ArticleLaboratory Assessment of Select Methods of Corrosion Controland Repair in Reinforced Concrete Bridges
Matthew D Pritzl1 Habib Tabatabai2 and Al Ghorbanpoor2
1 Donan Engineering Co Inc 11321 Plantside Drive Louisville KY 40299 USA2University ofWisconsin-Milwaukee Department of Civil Engineering ampMechanics 3200 North Cramer Street MilwaukeeWI 53211USA
Correspondence should be addressed to Habib Tabatabai htuwmedu
Received 7 October 2013 Revised 23 January 2014 Accepted 7 February 2014 Published 10 April 2014
Academic Editor W Ke
Copyright copy 2014 Matthew D Pritzl et al This is an open access article distributed under the Creative Commons AttributionLicense which permits unrestricted use distribution and reproduction in any medium provided the original work is properlycited
Fourteen reinforced concrete laboratory test specimens were used to evaluate a number of corrosion control (CoC) procedures toprolong the life of patch repairs in corrosion-damaged reinforced concreteThese specimens included layeredmixed-in chlorides torepresent chloride contamination due to deicing salts All specimenswere exposed to accelerated corrosion testing for threemonthssubjected to patch repairs with various treatments and further subjected to additional three months of exposure to acceleratedcorrosionThe use of thermal sprayed zinc galvanic embedded anodes epoxypolyurethane coating acrylic coating and an epoxypatch repair material was evaluated individually or in combinationThe specimens were assessed with respect to corrosion currents(estimatedmass loss) chloride ingress surface rust staining and corrosion of the reinforcing steel observed after dissection Resultsindicated that when used in patch repair applications the embedded galvanic anode with top surface coating galvanic thermalsprayed zinc and galvanic thermal sprayed zinc with surface coating were more effective in controlling corrosion than the othertreatments tested
1 Introduction
Penetration of chlorides from deicing salts used on bridgescauses significant long-term deterioration which requiresperiodic maintenance and repair [1ndash3] Corrosion of thereinforcing steel in concrete can lead to cracking and spallingconcrete Patch repairs are commonly used to address thisproblem However even when proper repair procedures arefollowed failure of patches occurs in as little as 2ndash5 years [4]
The objective of this study was to assess relative per-formance of a number of corrosion control (CoC) proce-dures on patched chloride-contaminated reinforced concretespecimens tested under accelerated corrosion exposure inthe laboratory Fourteen specimens were exposed to accel-erated corrosion testing for three months subjected topatch repairs with various corrosion control treatments andfurther subjected to an additional three months of expo-sure The use of thermal sprayed zinc galvanic embedded
anodes epoxypolyurethane coating acrylic coating and anepoxy patch repair material was evaluated individually or incombination The specimens were assessed with respect tocorrosion currents (estimated mass loss) chloride ingresssurface rust staining and corrosion of the reinforcing steelobserved after dissection
The phenomenon typically associated with patch failuresknown as patch accelerated corrosion occurs when theonce ldquosoundrdquo area that surrounds the initial patch repairrequires repair itself [4] When traditional ldquochip and patchrdquorepair procedures are used a sudden change is introducedin the concrete surrounding the reinforcing steel as the barcrosses from old to new concrete (Figures 1 and 2) Thisoccurs when new concrete (patchmaterial) which is typicallychloride-free and has a high pH is placed adjacent to existingconcrete which is chloride-contaminated and has a lowerpH The interface creates zones of significantly differentcorrosion potentials along the steel bar According to Ball
Hindawi Publishing CorporationInternational Journal of CorrosionVolume 2014 Article ID 175094 11 pageshttpdxdoiorg1011552014175094
2 International Journal of Corrosion
Corrosion
Anode
Cathode
Concrete
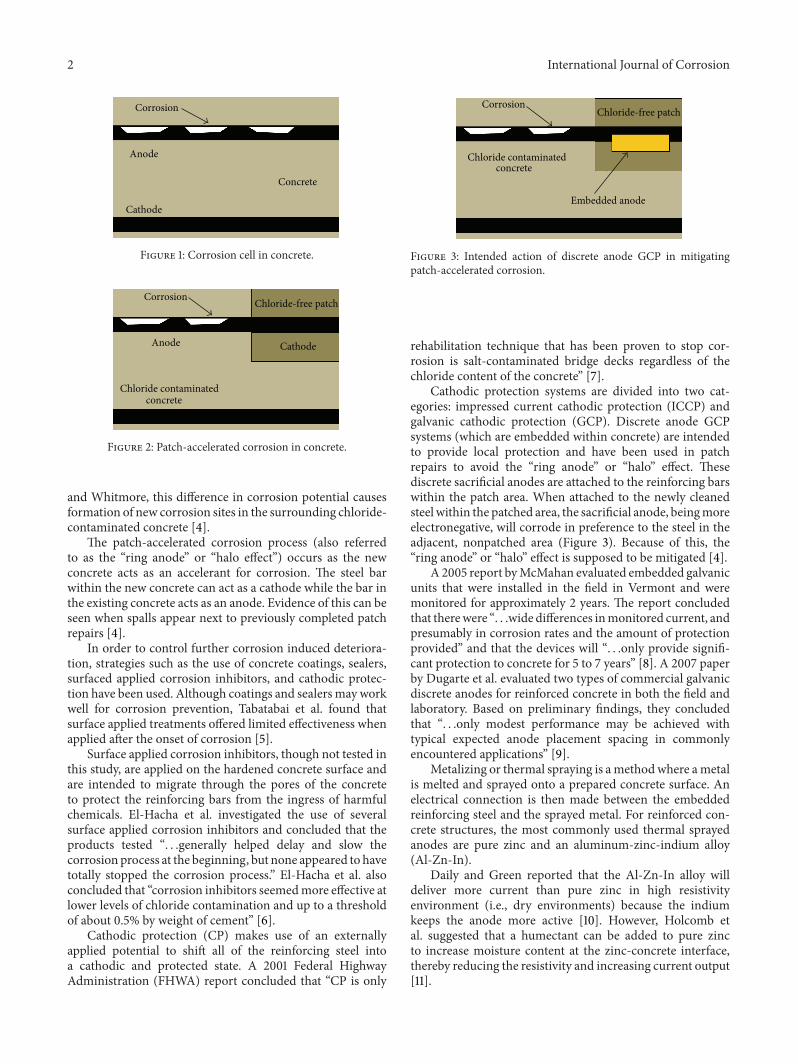
Figure 1 Corrosion cell in concrete
Corrosion Chloride-free patch
CathodeAnode
Chloride contaminated concrete
Figure 2 Patch-accelerated corrosion in concrete
and Whitmore this difference in corrosion potential causesformation of new corrosion sites in the surrounding chloride-contaminated concrete [4]
The patch-accelerated corrosion process (also referredto as the ldquoring anoderdquo or ldquohalo effectrdquo) occurs as the newconcrete acts as an accelerant for corrosion The steel barwithin the new concrete can act as a cathode while the bar inthe existing concrete acts as an anode Evidence of this can beseen when spalls appear next to previously completed patchrepairs [4]
In order to control further corrosion induced deteriora-tion strategies such as the use of concrete coatings sealerssurfaced applied corrosion inhibitors and cathodic protec-tion have been used Although coatings and sealers may workwell for corrosion prevention Tabatabai et al found thatsurface applied treatments offered limited effectiveness whenapplied after the onset of corrosion [5]
Surface applied corrosion inhibitors though not tested inthis study are applied on the hardened concrete surface andare intended to migrate through the pores of the concreteto protect the reinforcing bars from the ingress of harmfulchemicals El-Hacha et al investigated the use of severalsurface applied corrosion inhibitors and concluded that theproducts tested ldquo generally helped delay and slow thecorrosion process at the beginning but none appeared to havetotally stopped the corrosion processrdquo El-Hacha et al alsoconcluded that ldquocorrosion inhibitors seemedmore effective atlower levels of chloride contamination and up to a thresholdof about 05 by weight of cementrdquo [6]
Cathodic protection (CP) makes use of an externallyapplied potential to shift all of the reinforcing steel intoa cathodic and protected state A 2001 Federal HighwayAdministration (FHWA) report concluded that ldquoCP is only
CorrosionChloride-free patch
Embedded anode
Chloride contaminated concrete
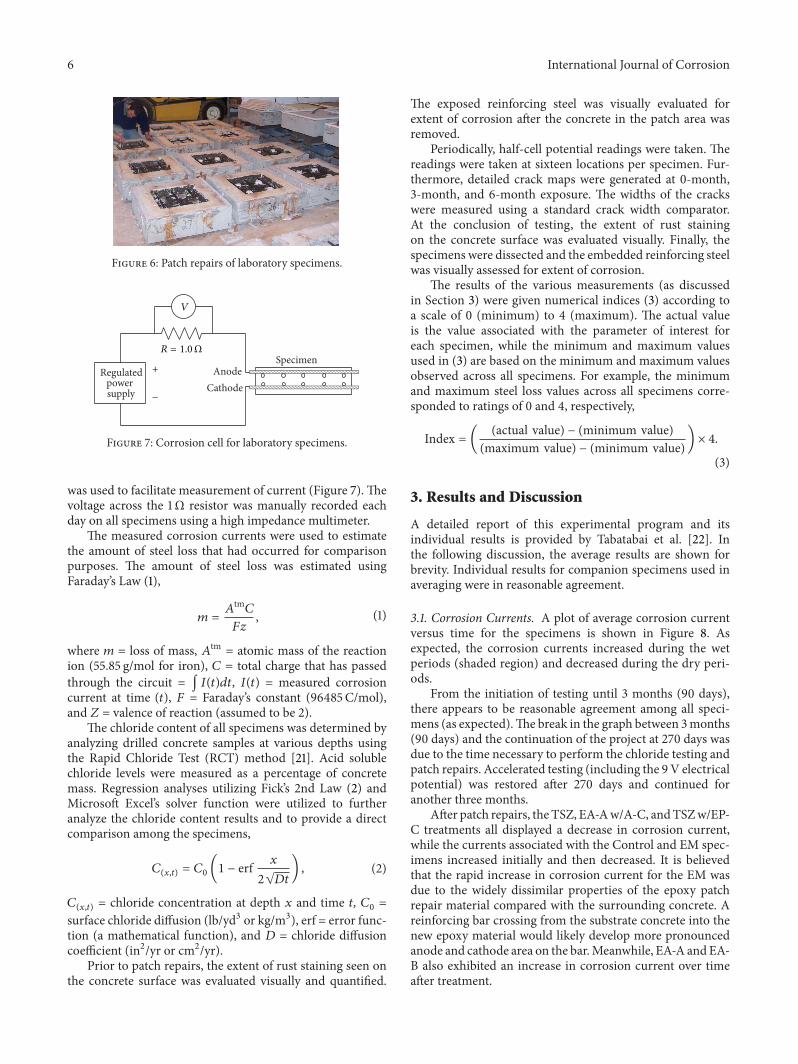
Figure 3 Intended action of discrete anode GCP in mitigatingpatch-accelerated corrosion
rehabilitation technique that has been proven to stop cor-rosion is salt-contaminated bridge decks regardless of thechloride content of the concreterdquo [7]
Cathodic protection systems are divided into two cat-egories impressed current cathodic protection (ICCP) andgalvanic cathodic protection (GCP) Discrete anode GCPsystems (which are embedded within concrete) are intendedto provide local protection and have been used in patchrepairs to avoid the ldquoring anoderdquo or ldquohalordquo effect Thesediscrete sacrificial anodes are attached to the reinforcing barswithin the patch area When attached to the newly cleanedsteel within the patched area the sacrificial anode beingmoreelectronegative will corrode in preference to the steel in theadjacent nonpatched area (Figure 3) Because of this theldquoring anoderdquo or ldquohalordquo effect is supposed to be mitigated [4]
A 2005 report byMcMahan evaluated embedded galvanicunits that were installed in the field in Vermont and weremonitored for approximately 2 years The report concludedthat therewere ldquo wide differences inmonitored current andpresumably in corrosion rates and the amount of protectionprovidedrdquo and that the devices will ldquo only provide signifi-cant protection to concrete for 5 to 7 yearsrdquo [8] A 2007 paperby Dugarte et al evaluated two types of commercial galvanicdiscrete anodes for reinforced concrete in both the field andlaboratory Based on preliminary findings they concludedthat ldquo only modest performance may be achieved withtypical expected anode placement spacing in commonlyencountered applicationsrdquo [9]
Metalizing or thermal spraying is amethodwhere ametalis melted and sprayed onto a prepared concrete surface Anelectrical connection is then made between the embeddedreinforcing steel and the sprayed metal For reinforced con-crete structures the most commonly used thermal sprayedanodes are pure zinc and an aluminum-zinc-indium alloy(Al-Zn-In)
Daily and Green reported that the Al-Zn-In alloy willdeliver more current than pure zinc in high resistivityenvironment (ie dry environments) because the indiumkeeps the anode more active [10] However Holcomb etal suggested that a humectant can be added to pure zincto increase moisture content at the zinc-concrete interfacethereby reducing the resistivity and increasing current output[11]
International Journal of Corrosion 3
North
21
22
27
30
29
26
23
2017
28
2524
1918
Figure 4 Experimental laboratory setup
In 2003 Whitney et al studied the use of cathodicprotection on substructure elements in the splash zone forthe Queen Isabella Causeway in Texas The report stated thatthe galvanic sprayed zinc and aluminum-zinc alloy systemsldquo both performed reasonably wellrdquo The report also notedthat although the zinc was less expensive the aluminum-zinc alloy appeared to perform more effectively in dryerconditions and provided more uniform protection [12]
An accelerated corrosion testing approach involving con-current use of the impressed current technique and salt waterexposure has been successfully implemented by a numberof researchers Examples include works by Ray et al [13]Mullard and Stewart [14] Michel et al [15] and Abaosara etal [16]
El Maaddawy and Soudki studied accelerated corrosiontesting of reinforcing steel in concrete by varying impressedcurrent densities The authors noted that ldquoup to 727mass loss accelerated corrosion using the impressed currenttechnique was effective in inducing corrosion of the steelreinforcement in concreterdquo [17] Austin et al also studiedthe electrochemical behavior of steel-reinforced concreteduring accelerated corrosion testing and concluded that ldquotheimpressed current technique has been confirmed to be aneffective and quick method of accelerating chloride-inducedcorrosionrdquo [18]
2 Materials and Methods
In this research two (2) types of embedded discrete galvanicanodes a humectant activated galvanic thermal sprayed zinca humectant activated galvanic thermal sprayed zinc withan epoxypolyurethane coating an embedded anode withan acrylic coating a conventional cementitious patch repairmaterial and an epoxy patch repair material were chosen forevaluationThe thermal sprayed zinc and the various coatingswere applied on the top surface of the concrete specimensThe epoxypolyurethane coating involved a first coat of epoxyfollowed by a second coat of polyurethane
21 Specimens and Materials Fourteen reinforced concretetest specimens were cast (Figure 4) Ready-mixed air-entrained concrete containing fly ash was used to fabricatethe test specimens The concrete was specified to meet thegoverning specifications for bridge deck construction inWisconsin with a specified minimum 28th day compressivestrength of 4000 psi (276MPa) The reinforced concretetest specimens had dimensions of 28 in (711 cm) times 28 in
Table 1 Level of chlorides mixed into the CoC specimens (1 inch =254mm and 10 lbyd3 = 059 kgm3)
Depth(inch)
Averagedepth(inch)
chlorides bymass of concrete
Chloride contentby volume ofconcrete
0-1 0510158401015840 0113 441 lbyd3
1-2 1510158401015840 0048 187 lbyd3
2-3 2510158401015840 0014 055 lbyd3
(711 cm) times 8 in (203 cm) Number 5 reinforcing bars (diam-eter of 58 in or 159mm)meeting the requirements of ASTMA615M were used as shown in Figure 5 Curing consisted ofcovering the specimens with plastic sheathing for seven daysThe average measured 28-day compressive strength of threeconcrete cylinders was 5839 psi (403MPa)
These 14 specimens (numbered 17 through 30) were partof a total of 30 such specimens that included 16 additionalspecimens for a companion study To reduce the lengthof time needed for chlorides to reach the top steel layerthe top layer of reinforcement utilized a 1 in (25 cm) clearcover A standard 2 in (51 cm) clear cover was used forthe bottom layer of reinforcement PVC pipe was caulkedto the perimeter of the top surface of the concrete speci-mens to create the reservoir that periodically held the saltladen water (Figures 4 and 5) To better replicate chloridecontaminated concrete these 14 specimens were cast withlayers of premixed chloridesThe bottom 5 in (127 cm) of thespecimens was cast without added chlorides while the upper3 in (76 cm) was cast with chloride profiles representativeof common bridge deck conditions in the northern deicingstates at a bridge age of 10 years
Using chloride diffusion coefficient (D) and surface chlo-ride concentration (119862
0) from a Strategic Highway Research
Program (SHRP) paper by Weyers et al [19] and Fickrsquos 2ndlaw of diffusion a chloride profile that represented 10 years ofexposure to chlorides was utilized Based on the results of theSHRP study a ldquoDrdquo of 011 in2yr (071 cm2yr) and a ldquo119862
0rdquo of
5985 lbyd3 (355 kgm3 representative of the mean of all thecollected data) were used to determine the level of chloridesto be added in each of the three top layers of concrete
Table 1 presents the chloride levels that were added tothe specimens The percentage values shown are based on aconcrete unit weight of 1450 lbft3 (2345 kgm3)
At an average depth of 15 in (38 cm) which is at the levelof reinforcing steel in this project the chloride content wasnearly two times the corrosion threshold of 10 to 15 lbyd3(059 kgm3 to 089 kgm3) indicated by ACI 222 [20]
During the concrete pour the bottom 5 inches (127 cm)of the CoC specimens was first placed The three chlorideprofile levels were then added in succession Concrete wasmixed with table salt in a concrete mixer When the pour wascompleted all of the specimens were covered with a sheet ofplastic for seven days
The specimens were subjected to three months of expo-sure to accelerated corrosion (described later) After 3monthsof exposure the specimens were examined and tested for
4 International Journal of Corrosion
Patch area PVC pipe
2998400998400
6998400998400
8998400998400
28998400998400
16998400998400
1998400998400
2998400998400
5 Rebar 6998400998400 OC
Figure 5 Cross-section of concrete specimens
Table 2 Table of treatments used for each specimenlowast
Specimennumber Type of treatments General description Referred to as
17 and 18 Control No treatment Control
19 and 20 Thermal sprayed galvanic anode with coatingapplied on top surface of specimen
Humectant activated thermal sprayedzinc with epoxypolyurethane coating TSZ wEP-C
21 and 22 Thermal sprayed galvanic anode applied on topsurface of specimen
Humectant activated thermal sprayedzinc TSZ
23 and 24 Embedded galvanic anode placed within patcharea Cylindrical-shaped zinc anode EA-A
25 and 26Embedded galvanic anode placed within patcharea with acrylic coating applied on top surface ofspecimen
27 and 28 Embedded galvanic anode placed within patcharea Box-shaped zinc anode EA-B
29 and 30 Epoxy repair mortar as a patch material Epoxy resins and polyamino amineadducts EM
lowastSpecimens 17 through 28 included a conventional cement-based patch material in addition to the treatments shown Specimens 29 and 30 included an epoxypatch material All patching and treatments were applied after 3 months of exposure to accelerated corrosion
chloride ingress Patch repairs were then performed (Fig-ure 6) and the various treatments were applied The patchrepair consisted of saw-cutting the perimeter of the squarepatch area (16 in (406 cm) times 16 in (406 cm)) chippingout the concrete cleaning the exposed reinforcing steel barwith a drill and wire wheel accessory applying an epoxycoating to the steel bar applying a bonding agent to theconcrete substrate and placing the patch repair materialThe coating of the steel bar and the application of bondingagent within the patch area were based on patch materialmanufacturerrsquos instructions and in accordance with conven-tional patch repair practices Following anode installationdirections care was taken not to coat the points of electricalcontinuity (locations where the bars intersect) the connec-tions of the anodes to the reinforcing steel or the anodesthemselves
Table 2 describes the treatment(s) used on each specimenThe numbers on the specimens in Figure 4 correspond to the
specimen numbers in Table 2 While the embedded anodeswere attached directly to the exposed bars the thermalsprayed zinc and surface coatings were applied on the topsurface of the concrete specimen and patched areas
Two types of patch materials were used a conventionalmaterial and a proprietary epoxy-based material The con-ventional patch repairmaterial used on specimens 17 through28 was a commercial cement-based rapid strength gainpatching and repair mortar which contained a migratorycorrosion inhibitor According to themanufacturer the patchmaterial is compatible with galvanic anodesThe epoxy patchrepairmaterial utilized on specimens 29 and 30 is reported bythe manufacturer to be a three component solvent-free highperformance epoxy mortar
Epoxy bonding agents for coating of substrate concrete(within the patch area) were recommended by the manufac-turer of the conventional patches Yet epoxy bonding agentsare generally not recommended for use with galvanic anodes
International Journal of Corrosion 5
Table 3 Steel loss of CoC specimens after 3-month exposure and 6-month exposure
Specimennumber Treatment
0ndash3-month steel loss
(g)
3ndash6-month steel loss
(g)
3ndash6-month index
0ndash6-month steel loss
(g)
0ndash6-month index
17 and 18 Control 3572 1487 13 5059 2819 and 20 TSZ wEP-C 3364 736 01 4100 1221 and 22 TSZ 3133 906 04 4039 1123 and 24 EA-A 3381 1758 18 5139 2925 and 26 EA-A wA-C 2782 783 02 3565 0327 and 28 EA-B 2954 1692 17 4646 2129 and 30 EM 2890 2754 34 5644 38
Table 4 Comparison of initial intended and average acid-solublechloride contents of CoC specimens ( chlorides by concreteweight) at 0 month (1 inch = 254mm)
Depth
Initialintended plus
baselinechlorides
Average of initialmeasured chlorides
Average initialmeasured chlorides
010158401015840 to 14
10158401015840
0155
0183
01561
4
10158401015840
to 12
10158401015840
01711
2
10158401015840
to 34
10158401015840
01423
4
10158401015840
to 110158401015840 0129
110158401015840 to 114
10158401015840
0090
0119
0106114
10158401015840
to 112
10158401015840
0109
112
10158401015840
to 210158401015840 0089
210158401015840 to 212
10158401015840
00560073
0065212
10158401015840
to 310158401015840 0057
However epoxy bonding agents can be used with embeddedanodes if both the metallic and ionic paths are maintainedSince the metallic path had already been confirmed (throughthe connection between the anode and the bars) the ionicpath from the anode to the cathode had to be provided aswellFor the discrete anodes this was accomplished by not coatingthe anodes or the substrate concrete immediately below theanodes When using epoxy bonding agents in specimens thatreceived thermal sprayedmetals the ionic path will still reachthe bars in the areas inside and outside of the patchwith directcontact to the top surface of each specimen
The manufacturer of the conventional patch materialrecommended the use of an epoxy bonding agent and themanufacturer of the epoxy patch repair material specifieda concrete primer on the surface of the concrete substratewithin the patch area We chose to use an epoxy bondingagent in conjunction with the conventional patch repair
Table 5 Comparison of average acid-soluble chloride contents ofCoC specimens at 0 month and after 3 months (1 inch = 254mm)
DepthAverage of0-monthchlorides
Average of0-monthchloridesper inch
Average of3-monthchlorides
Average of3-month
chlorides perinch
010158401015840 to 14
10158401015840
0183
0156
0502
03221
4
10158401015840
to 12
10158401015840
0171 03671
2
10158401015840
to 34
10158401015840
0142 02433
4
10158401015840
to 110158401015840 0129 0174
110158401015840 to 114
10158401015840
0119 0131
0108114
10158401015840
to 112
10158401015840
0109 0106 0113
112
10158401015840
to 210158401015840 0089 0099
210158401015840 to 212
10158401015840
0088
materials in accordance with manufacturerrsquos recommenda-tion following all guidelines applicable for concurrent useof embedded anodes Moreover all guidelines for the epoxypatch repair material were followed
22 Experimental Methods The treatments in question wereevaluatedwith respect to corrosion currents chloride ingressextent of cracking severity of rust staining and visualinspection of the reinforcing steel after the conclusion oftesting and dissection
To accelerate the corrosion process the specimens weresubjected to wettingdrying cycles and a reverse cathodicprotection system Cycles of one week wet (using a 6NaClsolution on the top surface) and one week dry (no saltwaterponding) were utilized A reverse cathodic protection systemwas created by continuously applying a regulated voltage of9V from the positive terminal of the regulated power supplyto the top layer of reinforcement (the anode) A 1Ω precisionresistor located between the positive terminal and the anode
6 International Journal of Corrosion
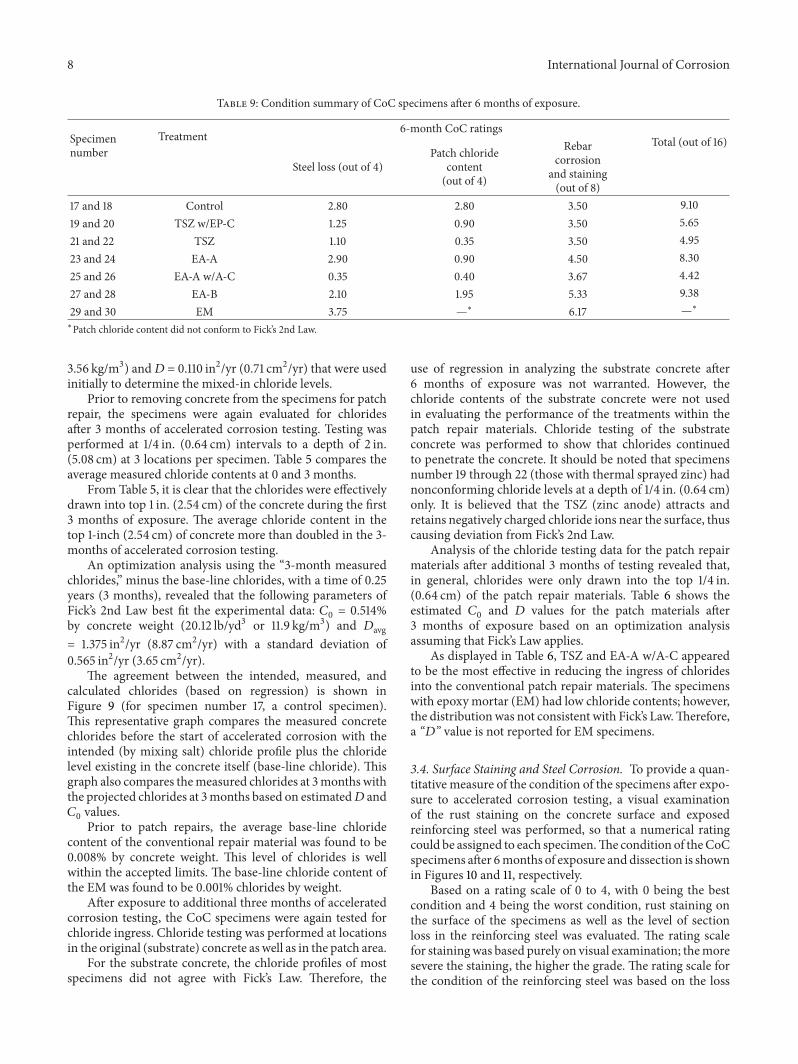
Figure 6 Patch repairs of laboratory specimens
Regulatedpowersupply
SpecimenAnode
Cathode
+
minus
V
R = 10Ω
Figure 7 Corrosion cell for laboratory specimens
was used to facilitate measurement of current (Figure 7) Thevoltage across the 1Ω resistor was manually recorded eachday on all specimens using a high impedance multimeter
The measured corrosion currents were used to estimatethe amount of steel loss that had occurred for comparisonpurposes The amount of steel loss was estimated usingFaradayrsquos Law (1)
119898 =
119860
tm119862
119865119911
(1)
where 119898 = loss of mass 119860tm = atomic mass of the reactionion (5585 gmol for iron) 119862 = total charge that has passedthrough the circuit = int 119868(119905)119889119905 119868(119905) = measured corrosioncurrent at time (119905) 119865 = Faradayrsquos constant (96485Cmol)and 119885 = valence of reaction (assumed to be 2)
The chloride content of all specimens was determined byanalyzing drilled concrete samples at various depths usingthe Rapid Chloride Test (RCT) method [21] Acid solublechloride levels were measured as a percentage of concretemass Regression analyses utilizing Fickrsquos 2nd Law (2) andMicrosoft Excelrsquos solver function were utilized to furtheranalyze the chloride content results and to provide a directcomparison among the specimens
119862
(119909119905)= 119862
0(1 minus erf 119909
2radic119863119905
) (2)
119862
(119909119905)= chloride concentration at depth 119909 and time 119905 119862
0=
surface chloride diffusion (lbyd3 or kgm3) erf = error func-tion (a mathematical function) and 119863 = chloride diffusioncoefficient (in2yr or cm2yr)
Prior to patch repairs the extent of rust staining seen onthe concrete surface was evaluated visually and quantified
The exposed reinforcing steel was visually evaluated forextent of corrosion after the concrete in the patch area wasremoved
Periodically half-cell potential readings were taken Thereadings were taken at sixteen locations per specimen Fur-thermore detailed crack maps were generated at 0-month3-month and 6-month exposure The widths of the crackswere measured using a standard crack width comparatorAt the conclusion of testing the extent of rust stainingon the concrete surface was evaluated visually Finally thespecimens were dissected and the embedded reinforcing steelwas visually assessed for extent of corrosion
The results of the various measurements (as discussedin Section 3) were given numerical indices (3) according toa scale of 0 (minimum) to 4 (maximum) The actual valueis the value associated with the parameter of interest foreach specimen while the minimum and maximum valuesused in (3) are based on the minimum and maximum valuesobserved across all specimens For example the minimumand maximum steel loss values across all specimens corre-sponded to ratings of 0 and 4 respectively
Index = ( (actual value) minus (minimum value)(maximum value) minus (minimum value)
) times 4
(3)
3 Results and Discussion
A detailed report of this experimental program and itsindividual results is provided by Tabatabai et al [22] Inthe following discussion the average results are shown forbrevity Individual results for companion specimens used inaveraging were in reasonable agreement
31 Corrosion Currents A plot of average corrosion currentversus time for the specimens is shown in Figure 8 Asexpected the corrosion currents increased during the wetperiods (shaded region) and decreased during the dry peri-ods
From the initiation of testing until 3 months (90 days)there appears to be reasonable agreement among all speci-mens (as expected)The break in the graph between 3months(90 days) and the continuation of the project at 270 days wasdue to the time necessary to perform the chloride testing andpatch repairs Accelerated testing (including the 9V electricalpotential) was restored after 270 days and continued foranother three months
After patch repairs theTSZ EA-AwA-C andTSZwEP-C treatments all displayed a decrease in corrosion currentwhile the currents associated with the Control and EM spec-imens increased initially and then decreased It is believedthat the rapid increase in corrosion current for the EM wasdue to the widely dissimilar properties of the epoxy patchrepair material compared with the surrounding concrete Areinforcing bar crossing from the substrate concrete into thenew epoxy material would likely develop more pronouncedanode and cathode area on the barMeanwhile EA-A andEA-B also exhibited an increase in corrosion current over timeafter treatment
International Journal of Corrosion 7
Table 6 Calculated chloride diffusion coefficients for patch materials of CoC specimens at the conclusion of project (1 inch = 254mm)
Specimennumber Patch treatment 119862
0( Cl by concrete mass) 119863Treatment (in
2yr) Index
17 and 18 Control
(Conventionalrepair material) 0445
0030 2819 and 20 TSZ wEP-C 0010 0921 and 22 TSZ 0004 0423 and 24 EA-A 0010 0925 and 26 EA-A wA-C 0005 0427 and 28 EA-B 0021 1929 and 30 EM mdash mdash
Table 7 Rating of concrete staining and reinforcing steel for CoC specimens after 6 months
Specimennumber
Individual Rebar ldquoinrdquo Rebar average Surface staining Total ratingA B C D Eout in out in out in out out
Table 8 Half-cell potential readings after 3 months
Specimennumber Future treatment Average Std Dev
(mV) (mV)17 and 18 Control minus5411 27919 and 20 TSZ wEP-C minus5406 27321 and 22 TSZ minus5327 28123 and 24 EA-A minus5429 22725 and 26 EA-A w A-C minus5542 24927 and 28 EA-B minus5568 32329 and 30 EM minus5543 182
32 Steel Loss By utilizing the aforementioned corrosioncurrents and (1) the amount of steel loss was estimated(Table 3) Numerical integration was used to calculate thetotal charge used in estimating steel loss
For the 0ndash3 month data the average steel loss wascalculated to be 3154 g (070 lb) with a standard deviation of354 g (008 lb) Based on the initial steel loss values it appearsthat all specimens were in a reasonably similar condition afterthe first 3 months of laboratory testing
For the 3ndash6 month steel loss data the TSZ wEP-CEA-A wA-C and TSZ produced the lowest indices Whenconsidering the 0ndash6 month index EA-A wA-C TSZ andTSZ wEP-C had the lowest Index values Therefore it canbe concluded that these three treatments performed betterwith regard to theoretical steel loss due to corrosion It isinteresting to note that all these better-performing treatments
incorporated some form of coating or physical barrier on thetop surface of the specimen
33 Chloride Ingress Thebaseline chloride content was takenfrom virgin concreteThe average measured chloride contentof the virgin concrete was found to be 0042 by concreteweight or approximately 165 lbyd3 (098 kgm3) of concreteThismeasured chloride contentwas relatively high An earlierstudy by Tabatabai et al has similar results and found that thesource of the chlorides was from coarse limestone aggregates[5]
Prior to exposure to accelerated corrosion the chloridecontents of all 14 specimens were evaluated at average depthsof 14 in (064 cm) 12 in (127 cm) 34 in (191 cm) 1 in(254 cm) 125 in (318 cm) 15 in (381 cm) 2 in (508 cm)25 in (635 cm) and 3 in (762 cm) so that confirmation ofthe actual mixed-in chloride contents could be made Threelocations for a total of 27 chloride tests per specimen wereanalyzed Chloride testing (Table 4) revealed that the actualchloride contents were in reasonable agreement with theldquoinitial intended plus baseline chloriderdquo profile
By utilizing regression analyses of measured chloridesthe agreement between the ldquoinitial intendedrdquo and ldquoinitialmeasuredrdquo chlorides could be further verified Using a timeof 10 years (assumed for calculating the amount of mixed-inchlorides) 119862
0was found to equal 0149 chlorides by con-
crete weight (583 lbyd3 or 346 kgm3) and 119863avg was foundto equal 0150 in2yr (097 cm2yr) with a standard deviationof 0026 in2yr (017 cm2yr) These values are in reasonableagreement with the values of 119862
0= 0153 (60 lbyd3 or
8 International Journal of Corrosion
Table 9 Condition summary of CoC specimens after 6 months of exposure
Specimennumber
Treatment 6-month CoC ratingsTotal (out of 16)
Steel loss (out of 4)Patch chloride
content(out of 4)
Rebarcorrosion
and staining(out of 8)
17 and 18 Control 280 280 350 91019 and 20 TSZ wEP-C 125 090 350 56521 and 22 TSZ 110 035 350 49523 and 24 EA-A 290 090 450 83025 and 26 EA-A wA-C 035 040 367 44227 and 28 EA-B 210 195 533 93829 and 30 EM 375 mdashlowast 617 mdashlowastlowastPatch chloride content did not conform to Fickrsquos 2nd Law
356 kgm3) and119863 = 0110 in2yr (071 cm2yr) that were usedinitially to determine the mixed-in chloride levels
Prior to removing concrete from the specimens for patchrepair the specimens were again evaluated for chloridesafter 3 months of accelerated corrosion testing Testing wasperformed at 14 in (064 cm) intervals to a depth of 2 in(508 cm) at 3 locations per specimen Table 5 compares theaverage measured chloride contents at 0 and 3 months
From Table 5 it is clear that the chlorides were effectivelydrawn into top 1 in (254 cm) of the concrete during the first3 months of exposure The average chloride content in thetop 1-inch (254 cm) of concrete more than doubled in the 3-months of accelerated corrosion testing
An optimization analysis using the ldquo3-month measuredchloridesrdquo minus the base-line chlorides with a time of 025years (3 months) revealed that the following parameters ofFickrsquos 2nd Law best fit the experimental data 119862
0= 0514
by concrete weight (2012 lbyd3 or 119 kgm3) and 119863avg= 1375 in2yr (887 cm2yr) with a standard deviation of0565 in2yr (365 cm2yr)
The agreement between the intended measured andcalculated chlorides (based on regression) is shown inFigure 9 (for specimen number 17 a control specimen)This representative graph compares the measured concretechlorides before the start of accelerated corrosion with theintended (by mixing salt) chloride profile plus the chloridelevel existing in the concrete itself (base-line chloride) Thisgraph also compares themeasured chlorides at 3months withthe projected chlorides at 3months based on estimated119863 and119862
0valuesPrior to patch repairs the average base-line chloride
content of the conventional repair material was found to be0008 by concrete weight This level of chlorides is wellwithin the accepted limits The base-line chloride content ofthe EM was found to be 0001 chlorides by weight
After exposure to additional three months of acceleratedcorrosion testing the CoC specimens were again tested forchloride ingress Chloride testing was performed at locationsin the original (substrate) concrete as well as in the patch area
For the substrate concrete the chloride profiles of mostspecimens did not agree with Fickrsquos Law Therefore the
use of regression in analyzing the substrate concrete after6 months of exposure was not warranted However thechloride contents of the substrate concrete were not usedin evaluating the performance of the treatments within thepatch repair materials Chloride testing of the substrateconcrete was performed to show that chlorides continuedto penetrate the concrete It should be noted that specimensnumber 19 through 22 (those with thermal sprayed zinc) hadnonconforming chloride levels at a depth of 14 in (064 cm)only It is believed that the TSZ (zinc anode) attracts andretains negatively charged chloride ions near the surface thuscausing deviation from Fickrsquos 2nd Law
Analysis of the chloride testing data for the patch repairmaterials after additional 3 months of testing revealed thatin general chlorides were only drawn into the top 14 in(064 cm) of the patch repair materials Table 6 shows theestimated 119862
0and 119863 values for the patch materials after
3 months of exposure based on an optimization analysisassuming that Fickrsquos Law applies
As displayed in Table 6 TSZ and EA-A wA-C appearedto be the most effective in reducing the ingress of chloridesinto the conventional patch repair materials The specimenswith epoxy mortar (EM) had low chloride contents howeverthe distributionwas not consistent with Fickrsquos LawThereforea ldquo119863rdquo value is not reported for EM specimens
34 Surface Staining and Steel Corrosion To provide a quan-titative measure of the condition of the specimens after expo-sure to accelerated corrosion testing a visual examinationof the rust staining on the concrete surface and exposedreinforcing steel was performed so that a numerical ratingcould be assigned to each specimenThe condition of theCoCspecimens after 6months of exposure and dissection is shownin Figures 10 and 11 respectively
Based on a rating scale of 0 to 4 with 0 being the bestcondition and 4 being the worst condition rust staining onthe surface of the specimens as well as the level of sectionloss in the reinforcing steel was evaluated The rating scalefor stainingwas based purely on visual examination themoresevere the staining the higher the grade The rating scale forthe condition of the reinforcing steel was based on the loss
International Journal of Corrosion 9
of ribs (Figures 12 and 13) If no corrosion by-products werepresent a rating of 0 was given If it appeared that all of theribs were lost a rating of 4 was given If on average 14 12or 34 of the ribs were lost ratings of 1 2 and 3 were givenrespectivelyThis ratingwas given to each of the top-layer barsin each specimen The ratings were then averaged for eachspecimen The two separate ratings (staining and loss of steelsection) were then added together for a maximum value of 8to determine a combined rating
After the initial 3 months of exposure it was found thatthe average rating for the exposed reinforcing steel (withinthe excavated patch area) was 30 and that the average ratingfor the staining was 30 The average 3-month total (steel barplus staining) rating for all CoC specimens was 60
Table 7 presents the individual and final ratings for eachof the specimens after 6 months of exposure In Table 7the five reinforcing bars (in the top layer in each specimen)are designated A through E Rebar A is located at the westend of the specimens Rebar B through Rebar D are locatedwithin the patch and Rebar E is located on the east end of thespecimens
All exposed bars were rated however only the Rebar thatwas used within the patch repairs (ldquoinrdquo bars) was countedtoward the bar rating (bars B through D) Bars outside of thepatch area (ldquooutrdquo bars) were not counted toward the rating ofthe steel rebar In doing so a comparison could be made withthe ratings that were made prior to patch repairs Concretesurface staining was also similarly rated
35 Half-Cell Potential Half-cell measurements utilizing acopper-copper sulfate electrode were obtained for each of theconcrete specimens Prior to measurement the acceleratedcorrosion system was turned off for a day and the slabs weresaturated with tap-water Readings weremade after 3monthsIt was found that the average potential was minus5461mV with astandard deviation of minus284 after three months of exposure(Table 8) Because the readings were fairly uniform contourplots were notmade Since these readings weremore negativethan minus350mV a 90 probability of corrosion was indicatedafter 3 months of exposure in the CoC specimens [2] Half-cell potential testing was not performed after 6 months ofexposure because of the high potential levels found at 3months in all specimens and because of a number of coatingsapplied on the top surface of specimens that would preventhalf-cell potential measurements
36 Discussion The following section provides a summaryand discussion of the results of this study Based on chlo-ride content reinforcing steel corrosion concrete surfacestaining and half-cell potential testing the CoC specimensappeared to be in a similar condition after the first 3months ofaccelerated corrosion testing Therefore it can be concludedthat the addition of chlorides to the concrete mix ldquopondingrdquoof salt water and application of electric current were con-trolled properly during the first 3 months of exposure andall specimens (similarly prepared and exposed for 3 months)were responding similarly
A summary of numerical ratings for the CoC specimensafter 6 months of exposure is presented in Table 9 For thisevaluation the chloride content of the substrate concrete wasnot used in evaluating the effectiveness of the treatmentswithin the patch repair and only the ldquoinrdquo patch reinforcingsteel along with surface staining (including substrate con-crete) was used for the rating
Based on the results of Table 9 EA-A wA-C TSZ andTSZ wEP-C appeared to be the most effective in controllingcorrosion It is important to note that all these treatmentsincorporated some formof coating or physical barrier appliedon the top surface of specimens however none of the CoCspecimens had a coating treatment alone to conclusivelyassess whether the coating is the sole determining factor
When evaluating the patched areas of the TSZ and TSZwEP-C specimens it is interesting to note that the steelbar near the connection point to the thermal sprayed zincexhibited more corrosion than other areas of the steel bar
The patches containing the EA-A (without coating) andEA-B were no more effective in controlling corrosion thanthe control specimens Chloridemeasurements indicated thatthe anodes attracted chlorides to their vicinityThese chlorideldquohot spotsrdquo increased corrosion of the reinforcing steel in thearea of attachment to the anodes
In regard to the EM specimens the high initial corrosioncurrents and associated steel loss appear to be the result of thehighly dissimilar material properties A ldquoring-anoderdquo effectbecame visible at the interface of the patch and substrateconcrete over the duration of testing Although the EM patchmaterial itself did not display any signs of cracking theexistence of the ldquoring-anoderdquo effect at the perimeter of thepatch was clearly evident These were the only specimens tosignificantly display this phenomenon
It appeared that the conventional patch repair materialperformed well (ie patch itself did not deteriorate) Thiswas evidenced by the fact that no significant cracking waspresent on any of the patched areas at the conclusion oftesting However as stated earlier the performance of thepatch material is not an overall indication of performance ofpatch due to the ldquohalo effectrdquo
4 Conclusions
Based on the observation of the test specimens subjected to anaccelerated corrosion regime the following conclusions aremade
(1) Embedded anode A with acrylic coating (EA-A wA-C) thermal sprayed zinc (TSZ) and thermal sprayedzinc with epoxypolyurethane coating (TSZ wEP-C) were most effective in controlling corrosion Itappears that the main factor for the better perfor-mance of these specimens was the presence of someform of coating or physical barrier
(2) The performance of the embedded anodes (EA-Awithout coating as well as EA-B without coating) wasnot better than the control specimens
(3) For the epoxy patch repair material (EM) the initialincrease in corrosion current and appearance of
10 International Journal of Corrosion
200
150
100
50
0
0 40 80 120 160 200 240 280 320 360
Time (days)
Cor
rosio
n cu
rren
t (m
A)
Average corrosion currents of CoC specimens versus time
29 amp 30
23 amp 24
25 amp 26
19 amp 20
21 amp 22
27 amp 28
Number 17 amp number 18-controlNumber 19 amp number 20-TSZ wEP-CNumber 21 amp number 22-TSZNumber 23 amp number 24-EA-ANumber 25 amp number 26-EA-A wA-CNumber 27 amp number 28-EA-BNumber 29 amp number 30-EM
17 amp 18
Figure 8 Average corrosion currents of specimens
000
050
100
150
200
250
300
350
0000 0100 0200 0300 0400 0500 0600
Dep
th (i
nche
s)
Initial intended plus baseline chloridesInitial measured chlorides3-month measured chlorides3-month regression plus baseline chlorides
Chlorides by mass of concrete ()
Chloride content for specimen no 17
Figure 9 Comparison of initial and 3-month chlorides for speci-men number 17
the ldquoring-anoderdquo effect at the perimeter of the patchis due to the significant dissimilarity between epoxymortar and concrete
Conflict of Interests
The authors declare that there is no conflict of interestsregarding the publication of this paper
North
28
29
30
25
26
27
2122
2324
1718
1920
Figure 10 Surface staining on laboratory CoC specimens after 6months
North
28
29
30
25
2627
2122
2324
17 1819 20
Figure 11 Dissected laboratory CoC specimens
Acknowledgments
The authors wish to express their gratitude and sincereappreciation to the Wisconsin Highway Research Programfor funding this effort The project team would also liketo thank Ambassador Steel of Waukesha Wisconsin for
International Journal of Corrosion 11
Figure 12 Steel rating of 2 and 3 (close-up of exposed Rebar ofcontrol after 3 months)
Figure 13 Steel rating of 4 (close-up of exposed Rebar of TSZwEP-C after 6 months)
donating materials Masonry Restoration Inc of MilwaukeeWisconsin for lending their demolition equipment AaronCoenen John Condon Chin Wei-Lee Cory Schultz andRahim Reshadi for assisting with the placement of concreteand Dr Tracy Pritzl for her assistance with chloride testing
References
[1] United States Department of Transportation Federal HighwayAdministration Turner-Fairbank Research Center 1998 Cor-rosion Protection Concrete Bridges Turner-Fairbank ResearchCenter httpwwwtfhrcgovstructurcorroscorroshtm
[2] P H Emmons Concrete Repair andMaintenance Illustrated RSMeans Kingston Mass USA 1993
[3] M El-Reedy Steel-Reinforced Concrete Structures Assessmentand Repair of Corrosion Taylor amp Francis Group Boca RatonFla USA 2008
[4] C J Ball and DWWhitmoreCorrosionMitigation Systems ForConcrete Structures Concrete Repair Bulletin 2003
[5] H Tabatabai A Ghorbanpoor and A Turnquist-NassRehabil-itation Techniques For Concrete Bridges Wisconsin Departmentof Transportation Research and Library Madison Wis USA2005
[6] R El-Hacha A Mirmiran A Cook and S Rizkalla ldquoEffec-tiveness of surface-applied corrosion inhibitors for concretebridgesrdquo Journal of Materials in Civil Engineering vol 23 no3 pp 271ndash280 2011
[7] United States Department of Transportation Federal HighwayAdministration Research and Development 2001 Long-Term
Effectiveness of Cathodic Protection Systems on HighwayStructures McLean
[8] J McMahan Preliminary Evaluation of Galvashield Installationin BR 48 I-89 Waterbury Vermont Agency of TransportationMontpelier Vermont 2005
[9] M Dugarte A A Sagues R Powers and I Lasa ldquoEvaluation ofpoint anodes for corrosion prevention in reinforced concreterdquoTech Rep 07304 NACE International Houston Tex USA2007
[10] S F Daily and W K Green ldquoGalvanic cathodic protec-tion of reinforced and prestressed concrete structures usingCORRYSPRAYmdasha thermally sprayed aluminum alloyrdquo TechRep Corrpro Companies
[11] G R Holcomb B S Covino Jr S D Cramer et alHumectantsTo Augment Current From Metallized Zinc Cathodic ProtectionSystems on Concrete Oregon Department of TransportationSalem Mass USA 2002
[12] D Whitney L Elcheverry and H Wheat Cathodic ProtectionCoordinating Corrosion To Save State Structures Center forTransporation Research The University of Texas at AustinAustin Tex USA 2003
[13] I Ray G C Parish J F Davalos and A Chen ldquoEffect of con-crete substrate repair methods for beams aged by acceleratedcorrosion and strengthened with CFRPrdquo Journal of AerospaceEngineering vol 24 no 2 pp 227ndash239 2011
[14] J A Mullard and M G Stewart ldquoCorrosion-induced covercracking new test data and predictive modelsrdquo ACI StructuralJournal vol 108 no 1 pp 71ndash79 2011
[15] A Michel B J Pease M R Geiker H Stang and J FOlesen ldquoMonitoring reinforcement corrosion and corrosion-induced cracking using non-destructive x-ray attenuationmea-surementsrdquo Cement and Concrete Research vol 41 no 11 pp1085ndash1094 2011
[16] L Abosrra A F Ashour and M Youseffi ldquoCorrosion of steelreinforcement in concrete of different compressive strengthsrdquoConstruction and Building Materials vol 25 no 10 pp 3915ndash3925 2011
[17] T A El Maaddawy and K A Soudki ldquoEffectiveness ofimpressed current technique to simulate corrosion of steel rein-forcement in concreterdquo Journal ofMaterials in Civil Engineeringvol 15 no 1 pp 41ndash47 2003
[18] S A Austin R Lyons andM J Ing ldquoElectrochemical behaviorof steel-reinforced concrete during accelerated corrosion test-ingrdquo Corrosion vol 60 no 2 pp 203ndash212 2004
[19] R E Weyers E W Weyers et al Concrete Bridge Protectionand Rehabilitation Chemical and Physical TechniquesmdashServiceLife Estimates Strategic Highway Research Program NationalResearch Council Washington DC USA 1994
[20] American Concrete Institute Committee 222 ACI 222R-01Protection of MetaLs in Concrete Against Corrosion AmericanConcrete Institute 2001
[22] H Tabatabai A Ghorbanpoor and M D Pritzl ldquoEvaluation ofselect methods of corrosion prevention corrosion control andrepair in reinforced concrete bridgesrdquo Final Report WisconsinHighway Research Program Madison Wis USA
and Whitmore this difference in corrosion potential causesformation of new corrosion sites in the surrounding chloride-contaminated concrete [4]
The patch-accelerated corrosion process (also referredto as the ldquoring anoderdquo or ldquohalo effectrdquo) occurs as the newconcrete acts as an accelerant for corrosion The steel barwithin the new concrete can act as a cathode while the bar inthe existing concrete acts as an anode Evidence of this can beseen when spalls appear next to previously completed patchrepairs [4]
In order to control further corrosion induced deteriora-tion strategies such as the use of concrete coatings sealerssurfaced applied corrosion inhibitors and cathodic protec-tion have been used Although coatings and sealers may workwell for corrosion prevention Tabatabai et al found thatsurface applied treatments offered limited effectiveness whenapplied after the onset of corrosion [5]
Surface applied corrosion inhibitors though not tested inthis study are applied on the hardened concrete surface andare intended to migrate through the pores of the concreteto protect the reinforcing bars from the ingress of harmfulchemicals El-Hacha et al investigated the use of severalsurface applied corrosion inhibitors and concluded that theproducts tested ldquo generally helped delay and slow thecorrosion process at the beginning but none appeared to havetotally stopped the corrosion processrdquo El-Hacha et al alsoconcluded that ldquocorrosion inhibitors seemedmore effective atlower levels of chloride contamination and up to a thresholdof about 05 by weight of cementrdquo [6]
Cathodic protection (CP) makes use of an externallyapplied potential to shift all of the reinforcing steel intoa cathodic and protected state A 2001 Federal HighwayAdministration (FHWA) report concluded that ldquoCP is only
CorrosionChloride-free patch
Embedded anode
Chloride contaminated concrete
Figure 3 Intended action of discrete anode GCP in mitigatingpatch-accelerated corrosion
rehabilitation technique that has been proven to stop cor-rosion is salt-contaminated bridge decks regardless of thechloride content of the concreterdquo [7]
Cathodic protection systems are divided into two cat-egories impressed current cathodic protection (ICCP) andgalvanic cathodic protection (GCP) Discrete anode GCPsystems (which are embedded within concrete) are intendedto provide local protection and have been used in patchrepairs to avoid the ldquoring anoderdquo or ldquohalordquo effect Thesediscrete sacrificial anodes are attached to the reinforcing barswithin the patch area When attached to the newly cleanedsteel within the patched area the sacrificial anode beingmoreelectronegative will corrode in preference to the steel in theadjacent nonpatched area (Figure 3) Because of this theldquoring anoderdquo or ldquohalordquo effect is supposed to be mitigated [4]
A 2005 report byMcMahan evaluated embedded galvanicunits that were installed in the field in Vermont and weremonitored for approximately 2 years The report concludedthat therewere ldquo wide differences inmonitored current andpresumably in corrosion rates and the amount of protectionprovidedrdquo and that the devices will ldquo only provide signifi-cant protection to concrete for 5 to 7 yearsrdquo [8] A 2007 paperby Dugarte et al evaluated two types of commercial galvanicdiscrete anodes for reinforced concrete in both the field andlaboratory Based on preliminary findings they concludedthat ldquo only modest performance may be achieved withtypical expected anode placement spacing in commonlyencountered applicationsrdquo [9]
Metalizing or thermal spraying is amethodwhere ametalis melted and sprayed onto a prepared concrete surface Anelectrical connection is then made between the embeddedreinforcing steel and the sprayed metal For reinforced con-crete structures the most commonly used thermal sprayedanodes are pure zinc and an aluminum-zinc-indium alloy(Al-Zn-In)
Daily and Green reported that the Al-Zn-In alloy willdeliver more current than pure zinc in high resistivityenvironment (ie dry environments) because the indiumkeeps the anode more active [10] However Holcomb etal suggested that a humectant can be added to pure zincto increase moisture content at the zinc-concrete interfacethereby reducing the resistivity and increasing current output[11]
International Journal of Corrosion 3
North
21
22
27
30
29
26
23
2017
28
2524
1918
Figure 4 Experimental laboratory setup
In 2003 Whitney et al studied the use of cathodicprotection on substructure elements in the splash zone forthe Queen Isabella Causeway in Texas The report stated thatthe galvanic sprayed zinc and aluminum-zinc alloy systemsldquo both performed reasonably wellrdquo The report also notedthat although the zinc was less expensive the aluminum-zinc alloy appeared to perform more effectively in dryerconditions and provided more uniform protection [12]
An accelerated corrosion testing approach involving con-current use of the impressed current technique and salt waterexposure has been successfully implemented by a numberof researchers Examples include works by Ray et al [13]Mullard and Stewart [14] Michel et al [15] and Abaosara etal [16]
El Maaddawy and Soudki studied accelerated corrosiontesting of reinforcing steel in concrete by varying impressedcurrent densities The authors noted that ldquoup to 727mass loss accelerated corrosion using the impressed currenttechnique was effective in inducing corrosion of the steelreinforcement in concreterdquo [17] Austin et al also studiedthe electrochemical behavior of steel-reinforced concreteduring accelerated corrosion testing and concluded that ldquotheimpressed current technique has been confirmed to be aneffective and quick method of accelerating chloride-inducedcorrosionrdquo [18]
2 Materials and Methods
In this research two (2) types of embedded discrete galvanicanodes a humectant activated galvanic thermal sprayed zinca humectant activated galvanic thermal sprayed zinc withan epoxypolyurethane coating an embedded anode withan acrylic coating a conventional cementitious patch repairmaterial and an epoxy patch repair material were chosen forevaluationThe thermal sprayed zinc and the various coatingswere applied on the top surface of the concrete specimensThe epoxypolyurethane coating involved a first coat of epoxyfollowed by a second coat of polyurethane
21 Specimens and Materials Fourteen reinforced concretetest specimens were cast (Figure 4) Ready-mixed air-entrained concrete containing fly ash was used to fabricatethe test specimens The concrete was specified to meet thegoverning specifications for bridge deck construction inWisconsin with a specified minimum 28th day compressivestrength of 4000 psi (276MPa) The reinforced concretetest specimens had dimensions of 28 in (711 cm) times 28 in
Table 1 Level of chlorides mixed into the CoC specimens (1 inch =254mm and 10 lbyd3 = 059 kgm3)
Depth(inch)
Averagedepth(inch)
chlorides bymass of concrete
Chloride contentby volume ofconcrete
0-1 0510158401015840 0113 441 lbyd3
1-2 1510158401015840 0048 187 lbyd3
2-3 2510158401015840 0014 055 lbyd3
(711 cm) times 8 in (203 cm) Number 5 reinforcing bars (diam-eter of 58 in or 159mm)meeting the requirements of ASTMA615M were used as shown in Figure 5 Curing consisted ofcovering the specimens with plastic sheathing for seven daysThe average measured 28-day compressive strength of threeconcrete cylinders was 5839 psi (403MPa)
These 14 specimens (numbered 17 through 30) were partof a total of 30 such specimens that included 16 additionalspecimens for a companion study To reduce the lengthof time needed for chlorides to reach the top steel layerthe top layer of reinforcement utilized a 1 in (25 cm) clearcover A standard 2 in (51 cm) clear cover was used forthe bottom layer of reinforcement PVC pipe was caulkedto the perimeter of the top surface of the concrete speci-mens to create the reservoir that periodically held the saltladen water (Figures 4 and 5) To better replicate chloridecontaminated concrete these 14 specimens were cast withlayers of premixed chloridesThe bottom 5 in (127 cm) of thespecimens was cast without added chlorides while the upper3 in (76 cm) was cast with chloride profiles representativeof common bridge deck conditions in the northern deicingstates at a bridge age of 10 years
Using chloride diffusion coefficient (D) and surface chlo-ride concentration (119862
0) from a Strategic Highway Research
Program (SHRP) paper by Weyers et al [19] and Fickrsquos 2ndlaw of diffusion a chloride profile that represented 10 years ofexposure to chlorides was utilized Based on the results of theSHRP study a ldquoDrdquo of 011 in2yr (071 cm2yr) and a ldquo119862
0rdquo of
5985 lbyd3 (355 kgm3 representative of the mean of all thecollected data) were used to determine the level of chloridesto be added in each of the three top layers of concrete
Table 1 presents the chloride levels that were added tothe specimens The percentage values shown are based on aconcrete unit weight of 1450 lbft3 (2345 kgm3)
At an average depth of 15 in (38 cm) which is at the levelof reinforcing steel in this project the chloride content wasnearly two times the corrosion threshold of 10 to 15 lbyd3(059 kgm3 to 089 kgm3) indicated by ACI 222 [20]
During the concrete pour the bottom 5 inches (127 cm)of the CoC specimens was first placed The three chlorideprofile levels were then added in succession Concrete wasmixed with table salt in a concrete mixer When the pour wascompleted all of the specimens were covered with a sheet ofplastic for seven days
The specimens were subjected to three months of expo-sure to accelerated corrosion (described later) After 3monthsof exposure the specimens were examined and tested for
4 International Journal of Corrosion
Patch area PVC pipe
2998400998400
6998400998400
8998400998400
28998400998400
16998400998400
1998400998400
2998400998400
5 Rebar 6998400998400 OC
Figure 5 Cross-section of concrete specimens
Table 2 Table of treatments used for each specimenlowast
Specimennumber Type of treatments General description Referred to as
17 and 18 Control No treatment Control
19 and 20 Thermal sprayed galvanic anode with coatingapplied on top surface of specimen
Humectant activated thermal sprayedzinc with epoxypolyurethane coating TSZ wEP-C
21 and 22 Thermal sprayed galvanic anode applied on topsurface of specimen
Humectant activated thermal sprayedzinc TSZ
23 and 24 Embedded galvanic anode placed within patcharea Cylindrical-shaped zinc anode EA-A
25 and 26Embedded galvanic anode placed within patcharea with acrylic coating applied on top surface ofspecimen
27 and 28 Embedded galvanic anode placed within patcharea Box-shaped zinc anode EA-B
29 and 30 Epoxy repair mortar as a patch material Epoxy resins and polyamino amineadducts EM
lowastSpecimens 17 through 28 included a conventional cement-based patch material in addition to the treatments shown Specimens 29 and 30 included an epoxypatch material All patching and treatments were applied after 3 months of exposure to accelerated corrosion
chloride ingress Patch repairs were then performed (Fig-ure 6) and the various treatments were applied The patchrepair consisted of saw-cutting the perimeter of the squarepatch area (16 in (406 cm) times 16 in (406 cm)) chippingout the concrete cleaning the exposed reinforcing steel barwith a drill and wire wheel accessory applying an epoxycoating to the steel bar applying a bonding agent to theconcrete substrate and placing the patch repair materialThe coating of the steel bar and the application of bondingagent within the patch area were based on patch materialmanufacturerrsquos instructions and in accordance with conven-tional patch repair practices Following anode installationdirections care was taken not to coat the points of electricalcontinuity (locations where the bars intersect) the connec-tions of the anodes to the reinforcing steel or the anodesthemselves
Table 2 describes the treatment(s) used on each specimenThe numbers on the specimens in Figure 4 correspond to the
specimen numbers in Table 2 While the embedded anodeswere attached directly to the exposed bars the thermalsprayed zinc and surface coatings were applied on the topsurface of the concrete specimen and patched areas
Two types of patch materials were used a conventionalmaterial and a proprietary epoxy-based material The con-ventional patch repairmaterial used on specimens 17 through28 was a commercial cement-based rapid strength gainpatching and repair mortar which contained a migratorycorrosion inhibitor According to themanufacturer the patchmaterial is compatible with galvanic anodesThe epoxy patchrepairmaterial utilized on specimens 29 and 30 is reported bythe manufacturer to be a three component solvent-free highperformance epoxy mortar
Epoxy bonding agents for coating of substrate concrete(within the patch area) were recommended by the manufac-turer of the conventional patches Yet epoxy bonding agentsare generally not recommended for use with galvanic anodes
International Journal of Corrosion 5
Table 3 Steel loss of CoC specimens after 3-month exposure and 6-month exposure
Specimennumber Treatment
0ndash3-month steel loss
(g)
3ndash6-month steel loss
(g)
3ndash6-month index
0ndash6-month steel loss
(g)
0ndash6-month index
17 and 18 Control 3572 1487 13 5059 2819 and 20 TSZ wEP-C 3364 736 01 4100 1221 and 22 TSZ 3133 906 04 4039 1123 and 24 EA-A 3381 1758 18 5139 2925 and 26 EA-A wA-C 2782 783 02 3565 0327 and 28 EA-B 2954 1692 17 4646 2129 and 30 EM 2890 2754 34 5644 38
Table 4 Comparison of initial intended and average acid-solublechloride contents of CoC specimens ( chlorides by concreteweight) at 0 month (1 inch = 254mm)
Depth
Initialintended plus
baselinechlorides
Average of initialmeasured chlorides
Average initialmeasured chlorides
010158401015840 to 14
10158401015840
0155
0183
01561
4
10158401015840
to 12
10158401015840
01711
2
10158401015840
to 34
10158401015840
01423
4
10158401015840
to 110158401015840 0129
110158401015840 to 114
10158401015840
0090
0119
0106114
10158401015840
to 112
10158401015840
0109
112
10158401015840
to 210158401015840 0089
210158401015840 to 212
10158401015840
00560073
0065212
10158401015840
to 310158401015840 0057
However epoxy bonding agents can be used with embeddedanodes if both the metallic and ionic paths are maintainedSince the metallic path had already been confirmed (throughthe connection between the anode and the bars) the ionicpath from the anode to the cathode had to be provided aswellFor the discrete anodes this was accomplished by not coatingthe anodes or the substrate concrete immediately below theanodes When using epoxy bonding agents in specimens thatreceived thermal sprayedmetals the ionic path will still reachthe bars in the areas inside and outside of the patchwith directcontact to the top surface of each specimen
The manufacturer of the conventional patch materialrecommended the use of an epoxy bonding agent and themanufacturer of the epoxy patch repair material specifieda concrete primer on the surface of the concrete substratewithin the patch area We chose to use an epoxy bondingagent in conjunction with the conventional patch repair
Table 5 Comparison of average acid-soluble chloride contents ofCoC specimens at 0 month and after 3 months (1 inch = 254mm)
DepthAverage of0-monthchlorides
Average of0-monthchloridesper inch
Average of3-monthchlorides
Average of3-month
chlorides perinch
010158401015840 to 14
10158401015840
0183
0156
0502
03221
4
10158401015840
to 12
10158401015840
0171 03671
2
10158401015840
to 34
10158401015840
0142 02433
4
10158401015840
to 110158401015840 0129 0174
110158401015840 to 114
10158401015840
0119 0131
0108114
10158401015840
to 112
10158401015840
0109 0106 0113
112
10158401015840
to 210158401015840 0089 0099
210158401015840 to 212
10158401015840
0088
materials in accordance with manufacturerrsquos recommenda-tion following all guidelines applicable for concurrent useof embedded anodes Moreover all guidelines for the epoxypatch repair material were followed
22 Experimental Methods The treatments in question wereevaluatedwith respect to corrosion currents chloride ingressextent of cracking severity of rust staining and visualinspection of the reinforcing steel after the conclusion oftesting and dissection
To accelerate the corrosion process the specimens weresubjected to wettingdrying cycles and a reverse cathodicprotection system Cycles of one week wet (using a 6NaClsolution on the top surface) and one week dry (no saltwaterponding) were utilized A reverse cathodic protection systemwas created by continuously applying a regulated voltage of9V from the positive terminal of the regulated power supplyto the top layer of reinforcement (the anode) A 1Ω precisionresistor located between the positive terminal and the anode
6 International Journal of Corrosion
Figure 6 Patch repairs of laboratory specimens
Regulatedpowersupply
SpecimenAnode
Cathode
+
minus
V
R = 10Ω
Figure 7 Corrosion cell for laboratory specimens
was used to facilitate measurement of current (Figure 7) Thevoltage across the 1Ω resistor was manually recorded eachday on all specimens using a high impedance multimeter
The measured corrosion currents were used to estimatethe amount of steel loss that had occurred for comparisonpurposes The amount of steel loss was estimated usingFaradayrsquos Law (1)
119898 =
119860
tm119862
119865119911
(1)
where 119898 = loss of mass 119860tm = atomic mass of the reactionion (5585 gmol for iron) 119862 = total charge that has passedthrough the circuit = int 119868(119905)119889119905 119868(119905) = measured corrosioncurrent at time (119905) 119865 = Faradayrsquos constant (96485Cmol)and 119885 = valence of reaction (assumed to be 2)
The chloride content of all specimens was determined byanalyzing drilled concrete samples at various depths usingthe Rapid Chloride Test (RCT) method [21] Acid solublechloride levels were measured as a percentage of concretemass Regression analyses utilizing Fickrsquos 2nd Law (2) andMicrosoft Excelrsquos solver function were utilized to furtheranalyze the chloride content results and to provide a directcomparison among the specimens
119862
(119909119905)= 119862
0(1 minus erf 119909
2radic119863119905
) (2)
119862
(119909119905)= chloride concentration at depth 119909 and time 119905 119862
0=
surface chloride diffusion (lbyd3 or kgm3) erf = error func-tion (a mathematical function) and 119863 = chloride diffusioncoefficient (in2yr or cm2yr)
Prior to patch repairs the extent of rust staining seen onthe concrete surface was evaluated visually and quantified
The exposed reinforcing steel was visually evaluated forextent of corrosion after the concrete in the patch area wasremoved
Periodically half-cell potential readings were taken Thereadings were taken at sixteen locations per specimen Fur-thermore detailed crack maps were generated at 0-month3-month and 6-month exposure The widths of the crackswere measured using a standard crack width comparatorAt the conclusion of testing the extent of rust stainingon the concrete surface was evaluated visually Finally thespecimens were dissected and the embedded reinforcing steelwas visually assessed for extent of corrosion
The results of the various measurements (as discussedin Section 3) were given numerical indices (3) according toa scale of 0 (minimum) to 4 (maximum) The actual valueis the value associated with the parameter of interest foreach specimen while the minimum and maximum valuesused in (3) are based on the minimum and maximum valuesobserved across all specimens For example the minimumand maximum steel loss values across all specimens corre-sponded to ratings of 0 and 4 respectively
Index = ( (actual value) minus (minimum value)(maximum value) minus (minimum value)
) times 4
(3)
3 Results and Discussion
A detailed report of this experimental program and itsindividual results is provided by Tabatabai et al [22] Inthe following discussion the average results are shown forbrevity Individual results for companion specimens used inaveraging were in reasonable agreement
31 Corrosion Currents A plot of average corrosion currentversus time for the specimens is shown in Figure 8 Asexpected the corrosion currents increased during the wetperiods (shaded region) and decreased during the dry peri-ods
From the initiation of testing until 3 months (90 days)there appears to be reasonable agreement among all speci-mens (as expected)The break in the graph between 3months(90 days) and the continuation of the project at 270 days wasdue to the time necessary to perform the chloride testing andpatch repairs Accelerated testing (including the 9V electricalpotential) was restored after 270 days and continued foranother three months
After patch repairs theTSZ EA-AwA-C andTSZwEP-C treatments all displayed a decrease in corrosion currentwhile the currents associated with the Control and EM spec-imens increased initially and then decreased It is believedthat the rapid increase in corrosion current for the EM wasdue to the widely dissimilar properties of the epoxy patchrepair material compared with the surrounding concrete Areinforcing bar crossing from the substrate concrete into thenew epoxy material would likely develop more pronouncedanode and cathode area on the barMeanwhile EA-A andEA-B also exhibited an increase in corrosion current over timeafter treatment
International Journal of Corrosion 7
Table 6 Calculated chloride diffusion coefficients for patch materials of CoC specimens at the conclusion of project (1 inch = 254mm)
Specimennumber Patch treatment 119862
0( Cl by concrete mass) 119863Treatment (in
2yr) Index
17 and 18 Control
(Conventionalrepair material) 0445
0030 2819 and 20 TSZ wEP-C 0010 0921 and 22 TSZ 0004 0423 and 24 EA-A 0010 0925 and 26 EA-A wA-C 0005 0427 and 28 EA-B 0021 1929 and 30 EM mdash mdash
Table 7 Rating of concrete staining and reinforcing steel for CoC specimens after 6 months
Specimennumber
Individual Rebar ldquoinrdquo Rebar average Surface staining Total ratingA B C D Eout in out in out in out out
Table 8 Half-cell potential readings after 3 months
Specimennumber Future treatment Average Std Dev
(mV) (mV)17 and 18 Control minus5411 27919 and 20 TSZ wEP-C minus5406 27321 and 22 TSZ minus5327 28123 and 24 EA-A minus5429 22725 and 26 EA-A w A-C minus5542 24927 and 28 EA-B minus5568 32329 and 30 EM minus5543 182
32 Steel Loss By utilizing the aforementioned corrosioncurrents and (1) the amount of steel loss was estimated(Table 3) Numerical integration was used to calculate thetotal charge used in estimating steel loss
For the 0ndash3 month data the average steel loss wascalculated to be 3154 g (070 lb) with a standard deviation of354 g (008 lb) Based on the initial steel loss values it appearsthat all specimens were in a reasonably similar condition afterthe first 3 months of laboratory testing
For the 3ndash6 month steel loss data the TSZ wEP-CEA-A wA-C and TSZ produced the lowest indices Whenconsidering the 0ndash6 month index EA-A wA-C TSZ andTSZ wEP-C had the lowest Index values Therefore it canbe concluded that these three treatments performed betterwith regard to theoretical steel loss due to corrosion It isinteresting to note that all these better-performing treatments
incorporated some form of coating or physical barrier on thetop surface of the specimen
33 Chloride Ingress Thebaseline chloride content was takenfrom virgin concreteThe average measured chloride contentof the virgin concrete was found to be 0042 by concreteweight or approximately 165 lbyd3 (098 kgm3) of concreteThismeasured chloride contentwas relatively high An earlierstudy by Tabatabai et al has similar results and found that thesource of the chlorides was from coarse limestone aggregates[5]
Prior to exposure to accelerated corrosion the chloridecontents of all 14 specimens were evaluated at average depthsof 14 in (064 cm) 12 in (127 cm) 34 in (191 cm) 1 in(254 cm) 125 in (318 cm) 15 in (381 cm) 2 in (508 cm)25 in (635 cm) and 3 in (762 cm) so that confirmation ofthe actual mixed-in chloride contents could be made Threelocations for a total of 27 chloride tests per specimen wereanalyzed Chloride testing (Table 4) revealed that the actualchloride contents were in reasonable agreement with theldquoinitial intended plus baseline chloriderdquo profile
By utilizing regression analyses of measured chloridesthe agreement between the ldquoinitial intendedrdquo and ldquoinitialmeasuredrdquo chlorides could be further verified Using a timeof 10 years (assumed for calculating the amount of mixed-inchlorides) 119862
0was found to equal 0149 chlorides by con-
crete weight (583 lbyd3 or 346 kgm3) and 119863avg was foundto equal 0150 in2yr (097 cm2yr) with a standard deviationof 0026 in2yr (017 cm2yr) These values are in reasonableagreement with the values of 119862
0= 0153 (60 lbyd3 or
8 International Journal of Corrosion
Table 9 Condition summary of CoC specimens after 6 months of exposure
Specimennumber
Treatment 6-month CoC ratingsTotal (out of 16)
Steel loss (out of 4)Patch chloride
content(out of 4)
Rebarcorrosion
and staining(out of 8)
17 and 18 Control 280 280 350 91019 and 20 TSZ wEP-C 125 090 350 56521 and 22 TSZ 110 035 350 49523 and 24 EA-A 290 090 450 83025 and 26 EA-A wA-C 035 040 367 44227 and 28 EA-B 210 195 533 93829 and 30 EM 375 mdashlowast 617 mdashlowastlowastPatch chloride content did not conform to Fickrsquos 2nd Law
356 kgm3) and119863 = 0110 in2yr (071 cm2yr) that were usedinitially to determine the mixed-in chloride levels
Prior to removing concrete from the specimens for patchrepair the specimens were again evaluated for chloridesafter 3 months of accelerated corrosion testing Testing wasperformed at 14 in (064 cm) intervals to a depth of 2 in(508 cm) at 3 locations per specimen Table 5 compares theaverage measured chloride contents at 0 and 3 months
From Table 5 it is clear that the chlorides were effectivelydrawn into top 1 in (254 cm) of the concrete during the first3 months of exposure The average chloride content in thetop 1-inch (254 cm) of concrete more than doubled in the 3-months of accelerated corrosion testing
An optimization analysis using the ldquo3-month measuredchloridesrdquo minus the base-line chlorides with a time of 025years (3 months) revealed that the following parameters ofFickrsquos 2nd Law best fit the experimental data 119862
0= 0514
by concrete weight (2012 lbyd3 or 119 kgm3) and 119863avg= 1375 in2yr (887 cm2yr) with a standard deviation of0565 in2yr (365 cm2yr)
The agreement between the intended measured andcalculated chlorides (based on regression) is shown inFigure 9 (for specimen number 17 a control specimen)This representative graph compares the measured concretechlorides before the start of accelerated corrosion with theintended (by mixing salt) chloride profile plus the chloridelevel existing in the concrete itself (base-line chloride) Thisgraph also compares themeasured chlorides at 3months withthe projected chlorides at 3months based on estimated119863 and119862
0valuesPrior to patch repairs the average base-line chloride
content of the conventional repair material was found to be0008 by concrete weight This level of chlorides is wellwithin the accepted limits The base-line chloride content ofthe EM was found to be 0001 chlorides by weight
After exposure to additional three months of acceleratedcorrosion testing the CoC specimens were again tested forchloride ingress Chloride testing was performed at locationsin the original (substrate) concrete as well as in the patch area
For the substrate concrete the chloride profiles of mostspecimens did not agree with Fickrsquos Law Therefore the
use of regression in analyzing the substrate concrete after6 months of exposure was not warranted However thechloride contents of the substrate concrete were not usedin evaluating the performance of the treatments within thepatch repair materials Chloride testing of the substrateconcrete was performed to show that chlorides continuedto penetrate the concrete It should be noted that specimensnumber 19 through 22 (those with thermal sprayed zinc) hadnonconforming chloride levels at a depth of 14 in (064 cm)only It is believed that the TSZ (zinc anode) attracts andretains negatively charged chloride ions near the surface thuscausing deviation from Fickrsquos 2nd Law
Analysis of the chloride testing data for the patch repairmaterials after additional 3 months of testing revealed thatin general chlorides were only drawn into the top 14 in(064 cm) of the patch repair materials Table 6 shows theestimated 119862
0and 119863 values for the patch materials after
3 months of exposure based on an optimization analysisassuming that Fickrsquos Law applies
As displayed in Table 6 TSZ and EA-A wA-C appearedto be the most effective in reducing the ingress of chloridesinto the conventional patch repair materials The specimenswith epoxy mortar (EM) had low chloride contents howeverthe distributionwas not consistent with Fickrsquos LawThereforea ldquo119863rdquo value is not reported for EM specimens
34 Surface Staining and Steel Corrosion To provide a quan-titative measure of the condition of the specimens after expo-sure to accelerated corrosion testing a visual examinationof the rust staining on the concrete surface and exposedreinforcing steel was performed so that a numerical ratingcould be assigned to each specimenThe condition of theCoCspecimens after 6months of exposure and dissection is shownin Figures 10 and 11 respectively
Based on a rating scale of 0 to 4 with 0 being the bestcondition and 4 being the worst condition rust staining onthe surface of the specimens as well as the level of sectionloss in the reinforcing steel was evaluated The rating scalefor stainingwas based purely on visual examination themoresevere the staining the higher the grade The rating scale forthe condition of the reinforcing steel was based on the loss
International Journal of Corrosion 9
of ribs (Figures 12 and 13) If no corrosion by-products werepresent a rating of 0 was given If it appeared that all of theribs were lost a rating of 4 was given If on average 14 12or 34 of the ribs were lost ratings of 1 2 and 3 were givenrespectivelyThis ratingwas given to each of the top-layer barsin each specimen The ratings were then averaged for eachspecimen The two separate ratings (staining and loss of steelsection) were then added together for a maximum value of 8to determine a combined rating
After the initial 3 months of exposure it was found thatthe average rating for the exposed reinforcing steel (withinthe excavated patch area) was 30 and that the average ratingfor the staining was 30 The average 3-month total (steel barplus staining) rating for all CoC specimens was 60
Table 7 presents the individual and final ratings for eachof the specimens after 6 months of exposure In Table 7the five reinforcing bars (in the top layer in each specimen)are designated A through E Rebar A is located at the westend of the specimens Rebar B through Rebar D are locatedwithin the patch and Rebar E is located on the east end of thespecimens
All exposed bars were rated however only the Rebar thatwas used within the patch repairs (ldquoinrdquo bars) was countedtoward the bar rating (bars B through D) Bars outside of thepatch area (ldquooutrdquo bars) were not counted toward the rating ofthe steel rebar In doing so a comparison could be made withthe ratings that were made prior to patch repairs Concretesurface staining was also similarly rated
35 Half-Cell Potential Half-cell measurements utilizing acopper-copper sulfate electrode were obtained for each of theconcrete specimens Prior to measurement the acceleratedcorrosion system was turned off for a day and the slabs weresaturated with tap-water Readings weremade after 3monthsIt was found that the average potential was minus5461mV with astandard deviation of minus284 after three months of exposure(Table 8) Because the readings were fairly uniform contourplots were notmade Since these readings weremore negativethan minus350mV a 90 probability of corrosion was indicatedafter 3 months of exposure in the CoC specimens [2] Half-cell potential testing was not performed after 6 months ofexposure because of the high potential levels found at 3months in all specimens and because of a number of coatingsapplied on the top surface of specimens that would preventhalf-cell potential measurements
36 Discussion The following section provides a summaryand discussion of the results of this study Based on chlo-ride content reinforcing steel corrosion concrete surfacestaining and half-cell potential testing the CoC specimensappeared to be in a similar condition after the first 3months ofaccelerated corrosion testing Therefore it can be concludedthat the addition of chlorides to the concrete mix ldquopondingrdquoof salt water and application of electric current were con-trolled properly during the first 3 months of exposure andall specimens (similarly prepared and exposed for 3 months)were responding similarly
A summary of numerical ratings for the CoC specimensafter 6 months of exposure is presented in Table 9 For thisevaluation the chloride content of the substrate concrete wasnot used in evaluating the effectiveness of the treatmentswithin the patch repair and only the ldquoinrdquo patch reinforcingsteel along with surface staining (including substrate con-crete) was used for the rating
Based on the results of Table 9 EA-A wA-C TSZ andTSZ wEP-C appeared to be the most effective in controllingcorrosion It is important to note that all these treatmentsincorporated some formof coating or physical barrier appliedon the top surface of specimens however none of the CoCspecimens had a coating treatment alone to conclusivelyassess whether the coating is the sole determining factor
When evaluating the patched areas of the TSZ and TSZwEP-C specimens it is interesting to note that the steelbar near the connection point to the thermal sprayed zincexhibited more corrosion than other areas of the steel bar
The patches containing the EA-A (without coating) andEA-B were no more effective in controlling corrosion thanthe control specimens Chloridemeasurements indicated thatthe anodes attracted chlorides to their vicinityThese chlorideldquohot spotsrdquo increased corrosion of the reinforcing steel in thearea of attachment to the anodes
In regard to the EM specimens the high initial corrosioncurrents and associated steel loss appear to be the result of thehighly dissimilar material properties A ldquoring-anoderdquo effectbecame visible at the interface of the patch and substrateconcrete over the duration of testing Although the EM patchmaterial itself did not display any signs of cracking theexistence of the ldquoring-anoderdquo effect at the perimeter of thepatch was clearly evident These were the only specimens tosignificantly display this phenomenon
It appeared that the conventional patch repair materialperformed well (ie patch itself did not deteriorate) Thiswas evidenced by the fact that no significant cracking waspresent on any of the patched areas at the conclusion oftesting However as stated earlier the performance of thepatch material is not an overall indication of performance ofpatch due to the ldquohalo effectrdquo
4 Conclusions
Based on the observation of the test specimens subjected to anaccelerated corrosion regime the following conclusions aremade
(1) Embedded anode A with acrylic coating (EA-A wA-C) thermal sprayed zinc (TSZ) and thermal sprayedzinc with epoxypolyurethane coating (TSZ wEP-C) were most effective in controlling corrosion Itappears that the main factor for the better perfor-mance of these specimens was the presence of someform of coating or physical barrier
(2) The performance of the embedded anodes (EA-Awithout coating as well as EA-B without coating) wasnot better than the control specimens
(3) For the epoxy patch repair material (EM) the initialincrease in corrosion current and appearance of
10 International Journal of Corrosion
200
150
100
50
0
0 40 80 120 160 200 240 280 320 360
Time (days)
Cor
rosio
n cu
rren
t (m
A)
Average corrosion currents of CoC specimens versus time
29 amp 30
23 amp 24
25 amp 26
19 amp 20
21 amp 22
27 amp 28
Number 17 amp number 18-controlNumber 19 amp number 20-TSZ wEP-CNumber 21 amp number 22-TSZNumber 23 amp number 24-EA-ANumber 25 amp number 26-EA-A wA-CNumber 27 amp number 28-EA-BNumber 29 amp number 30-EM
17 amp 18
Figure 8 Average corrosion currents of specimens
000
050
100
150
200
250
300
350
0000 0100 0200 0300 0400 0500 0600
Dep
th (i
nche
s)
Initial intended plus baseline chloridesInitial measured chlorides3-month measured chlorides3-month regression plus baseline chlorides
Chlorides by mass of concrete ()
Chloride content for specimen no 17
Figure 9 Comparison of initial and 3-month chlorides for speci-men number 17
the ldquoring-anoderdquo effect at the perimeter of the patchis due to the significant dissimilarity between epoxymortar and concrete
Conflict of Interests
The authors declare that there is no conflict of interestsregarding the publication of this paper
North
28
29
30
25
26
27
2122
2324
1718
1920
Figure 10 Surface staining on laboratory CoC specimens after 6months
North
28
29
30
25
2627
2122
2324
17 1819 20
Figure 11 Dissected laboratory CoC specimens
Acknowledgments
The authors wish to express their gratitude and sincereappreciation to the Wisconsin Highway Research Programfor funding this effort The project team would also liketo thank Ambassador Steel of Waukesha Wisconsin for
International Journal of Corrosion 11
Figure 12 Steel rating of 2 and 3 (close-up of exposed Rebar ofcontrol after 3 months)
Figure 13 Steel rating of 4 (close-up of exposed Rebar of TSZwEP-C after 6 months)
donating materials Masonry Restoration Inc of MilwaukeeWisconsin for lending their demolition equipment AaronCoenen John Condon Chin Wei-Lee Cory Schultz andRahim Reshadi for assisting with the placement of concreteand Dr Tracy Pritzl for her assistance with chloride testing
References
[1] United States Department of Transportation Federal HighwayAdministration Turner-Fairbank Research Center 1998 Cor-rosion Protection Concrete Bridges Turner-Fairbank ResearchCenter httpwwwtfhrcgovstructurcorroscorroshtm
[2] P H Emmons Concrete Repair andMaintenance Illustrated RSMeans Kingston Mass USA 1993
[3] M El-Reedy Steel-Reinforced Concrete Structures Assessmentand Repair of Corrosion Taylor amp Francis Group Boca RatonFla USA 2008
[4] C J Ball and DWWhitmoreCorrosionMitigation Systems ForConcrete Structures Concrete Repair Bulletin 2003
[5] H Tabatabai A Ghorbanpoor and A Turnquist-NassRehabil-itation Techniques For Concrete Bridges Wisconsin Departmentof Transportation Research and Library Madison Wis USA2005
[6] R El-Hacha A Mirmiran A Cook and S Rizkalla ldquoEffec-tiveness of surface-applied corrosion inhibitors for concretebridgesrdquo Journal of Materials in Civil Engineering vol 23 no3 pp 271ndash280 2011
[7] United States Department of Transportation Federal HighwayAdministration Research and Development 2001 Long-Term
Effectiveness of Cathodic Protection Systems on HighwayStructures McLean
[8] J McMahan Preliminary Evaluation of Galvashield Installationin BR 48 I-89 Waterbury Vermont Agency of TransportationMontpelier Vermont 2005
[9] M Dugarte A A Sagues R Powers and I Lasa ldquoEvaluation ofpoint anodes for corrosion prevention in reinforced concreterdquoTech Rep 07304 NACE International Houston Tex USA2007
[10] S F Daily and W K Green ldquoGalvanic cathodic protec-tion of reinforced and prestressed concrete structures usingCORRYSPRAYmdasha thermally sprayed aluminum alloyrdquo TechRep Corrpro Companies
[11] G R Holcomb B S Covino Jr S D Cramer et alHumectantsTo Augment Current From Metallized Zinc Cathodic ProtectionSystems on Concrete Oregon Department of TransportationSalem Mass USA 2002
[12] D Whitney L Elcheverry and H Wheat Cathodic ProtectionCoordinating Corrosion To Save State Structures Center forTransporation Research The University of Texas at AustinAustin Tex USA 2003
[13] I Ray G C Parish J F Davalos and A Chen ldquoEffect of con-crete substrate repair methods for beams aged by acceleratedcorrosion and strengthened with CFRPrdquo Journal of AerospaceEngineering vol 24 no 2 pp 227ndash239 2011
[14] J A Mullard and M G Stewart ldquoCorrosion-induced covercracking new test data and predictive modelsrdquo ACI StructuralJournal vol 108 no 1 pp 71ndash79 2011
[15] A Michel B J Pease M R Geiker H Stang and J FOlesen ldquoMonitoring reinforcement corrosion and corrosion-induced cracking using non-destructive x-ray attenuationmea-surementsrdquo Cement and Concrete Research vol 41 no 11 pp1085ndash1094 2011
[16] L Abosrra A F Ashour and M Youseffi ldquoCorrosion of steelreinforcement in concrete of different compressive strengthsrdquoConstruction and Building Materials vol 25 no 10 pp 3915ndash3925 2011
[17] T A El Maaddawy and K A Soudki ldquoEffectiveness ofimpressed current technique to simulate corrosion of steel rein-forcement in concreterdquo Journal ofMaterials in Civil Engineeringvol 15 no 1 pp 41ndash47 2003
[18] S A Austin R Lyons andM J Ing ldquoElectrochemical behaviorof steel-reinforced concrete during accelerated corrosion test-ingrdquo Corrosion vol 60 no 2 pp 203ndash212 2004
[19] R E Weyers E W Weyers et al Concrete Bridge Protectionand Rehabilitation Chemical and Physical TechniquesmdashServiceLife Estimates Strategic Highway Research Program NationalResearch Council Washington DC USA 1994
[20] American Concrete Institute Committee 222 ACI 222R-01Protection of MetaLs in Concrete Against Corrosion AmericanConcrete Institute 2001
[22] H Tabatabai A Ghorbanpoor and M D Pritzl ldquoEvaluation ofselect methods of corrosion prevention corrosion control andrepair in reinforced concrete bridgesrdquo Final Report WisconsinHighway Research Program Madison Wis USA