Clock-dated phylogeny for 48% ofthe 700 species of Crotalaria (Fabaceae–Papilionoideae) resolves sections worldwideand implies conserved flower and leaftraits throughout its pantropical rangeAlexander Rockinger1*, Andréia Silva Flores2 and Susanne S. Renner1
Abstract
Background: With some 700 species, the pantropical Crotalaria is among the angiosperm’s largest genera.We sampled 48% of the species from all sections (and representatives of the 15 remaining Crotalarieae genera)for nuclear and plastid DNA markers to infer changes in climate niches, flower morphology, leaf type, andchromosome numbers.
Results: Crotalaria is monophyletic and most closely related to African Bolusia (five species) from which it diverged23 to 30 Ma ago. Ancestral state reconstructions reveal that leaf and flower types are conserved in large clades andthat leaf type is uncorrelated to climate as assessed with phylogenetically-informed analyses that related compoundvs. simple leaves to the mean values of four Bioclim parameters for 183 species with good occurrence data.Most species occur in open habitats <1000 m alt., and trifoliolate leaves are the ancestral condition, from whichunifoliolate and simple leaves each evolved a few times, the former predominantly in humid, the latter mainly indry climates. Based on chromosome counts for 36% of the 338 sequenced species, most polyploids are tetraploidand belong to a neotropical clade.
Conclusions: An unexpected finding of our study is that in Crotalaria, simple leaves predominate in humidclimates and compound leaves in dry climates, which points to a different adaptive value of these morphologies,regardless of whether these two leaf types evolved rarely or frequently in our focal group.
BackgroundWith some 700 species, Crotalaria occupies place 34 ina list of the World’s largest angiosperm genera [16]. Ofthese genera, only four have been studied with a speciessampling >30%, namely Piper (Piperaceae) with 31% ofc. 1055 species sampled [27], Allium (Amaryllidaceae)with 41% of c. 815 species sampled [39], Erica (Ericaceae)with 45% of c. 860 species sampled [47], and Solanum(Solanaceae) with 34% of c. 1250 species sampled [54],
Studying mega-diverse clades (>500 species) is im-portant for understanding plant evolution, especiallythe timing of geographic expansion and rate of traitchange, which can be inferred from calibrated phyloge-nies. Here we focus on Crotalaria, a pantropical clade ofwoody or herbaceous species of low statue that mostlyoccur in open habitats at low to mid-altitudes and thathave conspicuous flowers and fruits so that they are fre-quently collected and well represented in herbaria. Under-standing of Crotalaria has benefitted from consistenttaxonomic work by Roger Polhill [48, 49] and modernphylogenetic studies focusing on its African and Indian
* Correspondence: [email protected] Botany and Mycology, University of Munich (LMU), MenzingerStr. 67, 80638 Munich, GermanyFull list of author information is available at the end of the article
species [37, 57, 58]. Of the 700 species, about 500 occurin Africa and Madagascar, 80 in India, 20 in Australia,and 80 in the Americas [14, 38, 49]. About 15 speciesare distributed pantropically due to their use as fibercrops, cattle fodder, and erosion control plants [48].The biosynthesis of pyrrolizidine alkaloids (PAs) inCrotalaria root nodules depends on infection by rhizo-bial bacteria [25]. So far, this has been studied inonly four species of Crotalaria that turn out to beclosely related (this study), and knowing the earliest-diverging species of Crotalaria, as well as the closestrelatives of the genus, is required to infer when thistrait may have evolved.Crotalaria species have typical papilionoid flowers,
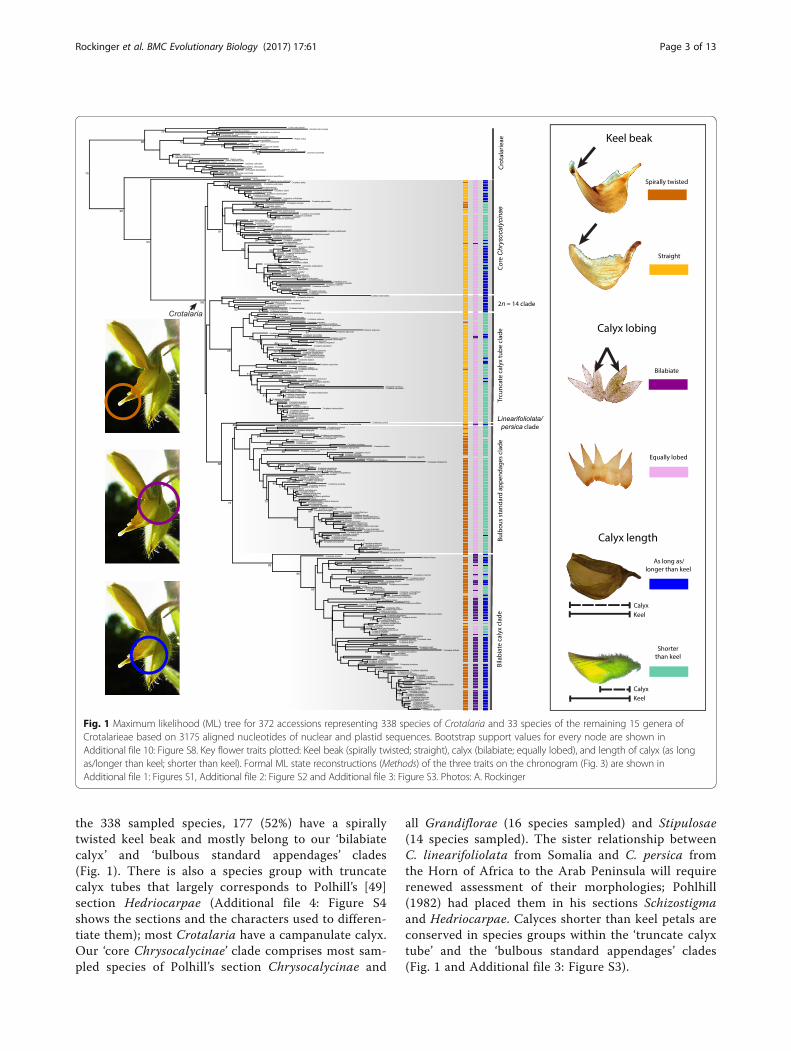
composed of standard, wing, and keel petals (Fig. 1).These flowers are adapted to bee pollination and espe-cially to Megachilidae, a worldwide clade of some 4000species [7] whose pollen-carrying structures are re-stricted to the ventral surface of the abdomen. Thismatches the ventral pollen presentation in Crotalaria.The only way for a bee to reach the nectary at the baseof a staminal tube is by inserting its proboscis through acentral channel at the base of the standard petal. Accessto the nectary from the sides is blocked by bulbous orplate-like appendages at the inner base of the standardpetal. Pollen transfer occurs while the nectar-drinkingbee grabs the lateral wing petals with its tarsi, depressingthe flower’s keel with its body weight, which causes thestyle to emerge from the staminal tube through the keelbeak [10, 11, 26, 32, 36]. Fitting with the predominant beepollination, Crotalaria flowers are yellow, sometimes withred or brownish markings. Few species have white, blue,or greenish flowers; an example of a green-flowered spe-cies is the Australian C. cunninghamii, which presumablyis pollinated by honeyeaters (Meliphagidae) [50].Leaves in Crotalaria are usually compound and trifo-
liolate, more rarely are they unifoliolate, multifoliolate,or simple. Unifoliolate leaves differ from simple leavesin having an articulation at the leaflet base; they appearto be derived from trifoliolate leaves, judging from theoccurrence on the same plant of trifoliolate and unifoli-olate leaves (seedlings of some trifoliolate species alsohave unifoliolate leaves; [49]). While the adaptive valueof simple leaves remains unknown, that of compoundleaves is thought to lie in heat dissipation because thereis greater convection than in a simple leaf of equal size[60]. Compound leaves also allow individual leaflets tochange their angle of inclination and thereby maximizediffuse light capture at microsites, with the degree offolding also varying diurnally [55, 60, 61]. Given thatabout 71% of the 700 Crotalaria species have trifolio-late, unifoliolate, or multifoliolate leaves, while some29% have simple leaves, we were interested in the re-gions and climates where simple and compound leaves
would occur. Our expectation was that compoundleaves would have evolved in dry, hot areas and be ab-sent or evolutionarily lost in humid climates.Chromosome counts have been published for about
120 species of Crotalaria (e.g., [13, 40, 41, 44, 64]).While these data are sparse, analyzing them in a phylo-genetic framework should allow an initial assessment ofthe role of chromosome number change in Crotalaria.Here we use three plastid and two nuclear gene re-
gions to reconstruct a phylogeny for representatives ofall sections of Crotalaria and of all 15 other genera ofCrotalarieae, a tribe with 517 species of mainly Africandistribution [3, 4, 38]. Our aim was to identify majorspecies groups and then to use phylograms and chrono-grams to infer the relative evolutionary lability of flowertraits, chromosome numbers, and leaf morphology andto relate leaf type to climate, using georeferenced oc-currences of as many of the sequenced species as avail-able in the Global Biodiversity Information Facility(GBIF; http://www.gbif.org).
ResultsClosest relatives and age of Crotalaria, and flower andleaf evolution in the genusBased on our sampling of 338 (48%) of the 700 species ofCrotalaria and representatives of all relevant outgroupgenera, the genus is monophyletic and most closely re-lated to the African Bolusia (5 species), followed by themonospecific likewise African Euchlora (Fig. 1). Inferredages for key divergence events under different clockmodels are summarized in Table 1; their 95% posteriorprobability intervals overlap, suggesting that the resultsare robust to choice of priors. The stem age of Crotalariafalls between the late Oligocene and the early Miocene,with the divergence from Bolusia occurring 23 (18–28,95% credibility interval) to 30 (21–51) Ma ago (Table 1).The deepest divergences between surviving Crotalaria lin-eages date to between 18 (14–22) and 29 (18–42) Ma ago.Bolusia and Euchlora, as well as most other Crotalarieaeoccur in Africa, suggesting that Crotalaria originated inAfrica. From there, Madagascar was reached at least ninetimes (Fig. 2), while Australia was reached at least fivetimes, three times from SE Asia and apparently also fromAfrica, although denser species sampling would be re-quired to confidently infer closest African/Australianrelatives.Within Crotalaria, large species groups have almost
homogeneous flower morphologies (Fig. 1; Additional file1: Figure S1, Additional file 2: Figure S2 and Additionalfile 3: Figure S3). Thus, bilabiate calyces (Fig. 1; Additionalfile 2: Figure S2) are almost restricted to Asia, Australasia,and the Neotropics and are rare in Africa (compare Figs. 1and 2, ‘bilabiate calyx clade’), with a few reversals toequally lobed calyces, such as predominate in Africa. Of
Rockinger et al. BMC Evolutionary Biology (2017) 17:61 Page 2 of 13
the 338 sampled species, 177 (52%) have a spirallytwisted keel beak and mostly belong to our ‘bilabiatecalyx’ and ‘bulbous standard appendages’ clades(Fig. 1). There is also a species group with truncatecalyx tubes that largely corresponds to Polhill’s [49]section Hedriocarpae (Additional file 4: Figure S4shows the sections and the characters used to differen-tiate them); most Crotalaria have a campanulate calyx.Our ‘core Chrysocalycinae’ clade comprises most sam-pled species of Polhill’s section Chrysocalycinae and
all Grandiflorae (16 species sampled) and Stipulosae(14 species sampled). The sister relationship betweenC. linearifoliolata from Somalia and C. persica fromthe Horn of Africa to the Arab Peninsula will requirerenewed assessment of their morphologies; Pohlhill(1982) had placed them in his sections Schizostigmaand Hedriocarpae. Calyces shorter than keel petals areconserved in species groups within the ‘truncate calyxtube’ and the ‘bulbous standard appendages’ clades(Fig. 1 and Additional file 3: Figure S3).
Fig. 1 Maximum likelihood (ML) tree for 372 accessions representing 338 species of Crotalaria and 33 species of the remaining 15 genera ofCrotalarieae based on 3175 aligned nucleotides of nuclear and plastid sequences. Bootstrap support values for every node are shown inAdditional file 10: Figure S8. Key flower traits plotted: Keel beak (spirally twisted; straight), calyx (bilabiate; equally lobed), and length of calyx (as longas/longer than keel; shorter than keel). Formal ML state reconstructions (Methods) of the three traits on the chronogram (Fig. 3) are shown inAdditional file 1: Figures S1, Additional file 2: Figure S2 and Additional file 3: Figure S3. Photos: A. Rockinger
Rockinger et al. BMC Evolutionary Biology (2017) 17:61 Page 3 of 13
Leaf architecture in Crotalaria is highly conserved, asshown by both the ancestral state reconstruction (Fig. 3and Additional file 5: Figure S5) and the permutationtest (estimated D = –1,26). All five species of the closestoutgroup Bolusia have compound (trifoliolate) leaves,while the single species of Euchlora, the next closestrelative, has simple leaves. Most simple-leaved Crota-laria species belong to the ‘bilabiate calyx’ and the ‘coreChrysocalycinae’ clades and thus are found outsideAfrica (compare Figs. 2 and 3). Trifoliolate leaves pre-dominate in African and Madagascan species (173 of205 sequenced species of Crotalaria that occur in Africaand Madagascar have this leaf type), while 56 of 69 se-quenced Asian species have simple leaves.
Occurrences, climate, and leaf morphologyThe 22,225 georeferenced specimens in GBIF representing183 of the 700 species of Crotalaria (Fig. 2 upper inset)show that the genus occurs in the tropics and subtropicsand extends into mild temperate climates. Of the speciesassignable to one of the four climate types based on theKöppen-Geiger system, 23 occur in the humid tropics,125 in the dry tropics, 62 in the arid tropics, and 66 inthe mild temperate climate (Fig. 4a, climate types aredefined in Methods). Most (108) species occur at alti-tudes <1000 m; the highest median altitude of any Cro-talaria is that of C. cylindrica, for which this value is2170 m in the highlands of the Horn of Africa [49].Our phylogeny includes an estimated 53% of all simple-leaved species and 47% of the compound-leaved species(the latter category grouping multi-, tri-, and unifolio-late leaves). The occurrence of simple- and compound-leaved species differs significantly between the humidtropics and the other three climate types (all p <0.0002,df 1) and slightly between arid and mild temperate re-gions (p <0.03, df 1; Fig. 4b).
From trifoliolate leaves, there were eight transitionsto unifoliolate, four to multifoliolate, and four to sim-ple leaves (Fig. 3). The generalized linear, logistic re-gression, and ‘random forest’ models (Methods)confirmed that mean annual precipitation (MAP) hasan effect on leaf type. According to the recursive parti-tioning analysis (Additional file 6: Figure S6), of the123 species occurring in drier regions (MAP<1250 mm), 13% have simple leaves; of the 29 speciesoccurring in more humid climates (MAP 1250-1435 mm), 41% have simple leaves; and of the 31 spe-cies occurring in very humid climates (MAP>1435 mm), 71% have simple leaves. When we incor-porated the phylogenetic structure of the data in abinaryPGLMM model, the correlation between MAPand leaf types was not significant because of the fewtransitions between compound and simple leaves;when we experimentally increased the transition fre-quency by recoding compound-leaved species thatoccur in climates with mean annual precipitation>1250 mm as simple-leaved, we found that 12 transi-tions (instead of the inferred four transitions) wereneeded for a significant correlation between simpleleaves and high precipitation.
Polyploidy in CrotalariaWe gathered chromosome numbers from the literaturefor 122 of the 338 sampled Crotalaria species and plot-ted them on the phylogeny (Additional file 7: Figure S7).The most common number in Crotalaria is 2n = 16,with 92 of the 122 species having this number. Mostpolyploids are tetraploid (assuming a base number of 8),with 2n = 32, and occur in the Neotropics, where theybelong to our ‘bilabiate calyx’ clade. Exceptions are C.tweediana, a species with 2n = 54 and endemic to Brazil,and C. ferruginea with 2n = 48 from Southeast Asia andAustralasia, and C. massaiensis with 2n = 32 from Kenya.
Table 1 Estimated mean node ages (Ma) for selected divergence events under different clock models. Ages are in million years, andthe values in brackets are the 95% posterior probability intervals
Node of interest Fossil calibration Substitution ratecalibration
Rockinger et al. BMC Evolutionary Biology (2017) 17:61 Page 4 of 13
Fig. 2 (See legend on next page.)
Rockinger et al. BMC Evolutionary Biology (2017) 17:61 Page 5 of 13
DiscussionPhylogenetic relationships and major groups in CrotalariaCrotalaria as traditionally circumscribed [48, 49] ismonophyletic. Morphologically, the five species in thetropical African genus Bolusia differ from the 700 spe-cies of Crotalaria by having a spirally coiled keel (incontrast to a spirally twisted keel beak as in c. 50% ofthe species of Crotalaria) and a single, rather thanpaired, appendages blocking the nectary access. The sin-gle species of Euchlora, endemic to the Northern andWestern Cape and the next-closest relative, lacks any ap-pendages. Bolusia has trifoliolate leaves, while Euchlorahirsuta has simple leaves. We have sampled between 25and 79% of the species in Polhill’s [49] eight sections(four of them with >50% sampled, see Methods for pre-cise sampling densities and Additional file 4: Figure S4for the floral traits characterizing the sections), andwith this sampling all sections are polyphyletic. LeRoux et al.’s [37] merging of Polhill’s sections Crota-laria and Dispermae (our ‘bulbous standard append-ages’ clade) is supported by our results (Additional file4: Figure S4 shows the sections of Polhill and Le Rouxet al. plotted on our tree). On the other hand, eight oftheir eleven sections are rendered polyphyletic by ourincreased species sampling (only their species-poor sec-tions Amphitrichae (four species), Grandiflorae (14 spe-cies), and Stipulosae (13 species) are monophyletic). Afuture sectional classification should probably not beundertaken until a higher percentage of the species issampled (currently 48%).
Evolution of flower and leaf traits and their distribution indifferent climate typesFlower traits (Fig. 1 and Additional file 1: Figure S1,Additional file 2: Figure S2 and Additional file 3: FigureS3) turned out to be highly conserved, which may reflectthat the main pollinators of crotalarias, species in thelong-tongued bee family Megachilidae with over 4,000species, are abundant in ecosystems from arid habitatsto tropical forests [7, 10, 11, 26]). All Crotalaria flowers,even the honeyeater-pollinated Australian C. cunningha-mii [50], have the same pollination mechanism in whichthe narrow keel beak serves as a cylinder and the styleacts together with the anthers as a piston. No study hascompared the effect of a spirally twisted or straight keelbeak on pollen release, and Pohlhill’s (1982) suggestion
that a twisted keel beak might better proportion pollenrelease does not match the finding that flowers with andwithout such keels have the same short life span and arevisited by some of the same bee species (C. micans andC. stipularia flowers function for c. four days, [10, 11,26]: C. retusa flowers for one day; own observationsshow that flowers last for 3-4 days in C. pallida, and for4-5 days in C. cunninghamii, C. novae-hollandiae, andC. velutina).The range map (Fig. 2, upper inset) resulting from
GBIF occurrences of 183 species illustrates the distribu-tion of the genus but also the uneven uploading of datato GBIF, with India and maritime Southeast Asia espe-cially underrepresented. Of the 183 species, only 24come from this region, and this may have affected thenumber of species assigned to the humid tropics. Cro-talaria likely originated in Africa as inferred from boththe almost exclusive African occurrence of its closestrelatives and the greatest species diversity of Crotalariaitself in savannas of the Afromontane region in Kenya,Tanzania, and Zambia, around Lake Tanganyika and LakeVictoria [49]. The ancestral leaf type in Crotalaria is thetrifoliolate compound leaf, the adaptive advantage ofwhich is thought to lie in heat dissipation [60]; the adap-tive value of simple leaves remains unclear [61]. An unex-pected finding in our study is that in Crotalaria, simpleleaves predominate in humid climates and unifoliolateleaves in dry climates, which points to a different adap-tive value of these morphologies, regardless of whetherthese two leaf types evolved rarely or frequently in ourfocal group. The few state transitions combined withthe binary coding of the four leaf types (merging multi-, tri-, and unifoliolate into compound) required for thephylogenetically-informed statistical analyses precludedmore fine-scale analysis, but with the now availablephylogeny, Crotalaria would be suitable for experimen-tal work on the adaptive benefits of leaf architecture[60, 61].
Polyploidy in CrotalariaTetraploidy in Crotalaria appears to have arisen in thecommon ancestor of a New World clade (crown nodemarked with a red arrow in Additional file 7: Figure S7).Of the 46 Neotropical species in our phylogeny, 27 forma clade that is embedded within a clade of 73 mostlyAsian species (the ‘bilabiate calyx’ clade). Of these 27, 18
(See figure on previous page.)Fig. 2 Maximum likelihood tree with the Crotalaria species’ distribution areas plotted on branches. Colored squares to the right of branchesrepresent additional regions where the respective species also occurs. Blue: Americas; orange: Africa and Middle East; red: Madagascar; green:Asia including maritime Southeast Asia; purple: Australia, Papua New Guinea, and Melanesia. Inset: Worldwide distribution of Crotalaria basedon 22,225 georeferenced occurrences from GBIF (http://www.gbif.org) representing 183 species. Due to uneven GBIF uploading, Indiais underrepresented
Rockinger et al. BMC Evolutionary Biology (2017) 17:61 Page 6 of 13
Rockinger et al. BMC Evolutionary Biology (2017) 17:61 Page 7 of 13
have had their chromosome numbers counted, and allare polyploid (17 of them have 2n = 32; one has 2n = 54).Windler [63] suggested that polyploidy might be relatedto self-compatibility, but selfing has been documented inall three species of Crotalaria studied in this regard, C.micans, C. retusa, and C. stipularia [10, 11, 26] and maycharacterize the entire genus. Crotalaria stipularia is na-tive to South America and tetraploid, but C. micans andC. retusa are both now pantropical in their distributiondue to their use as fibre crops, green manure, and cattlefodder [49] and are diploid (2n = 16). Two (counted)Asian species close to the Neotropical tetraploid clade,C. ferruginea and C. humifusa, also are polyploid as is C.massaiensis from Kenya.
ConclusionThis study resolved the main species groups of the mega-diverse pantropical genus Crotalaria, inferred the evolution-ary frequency of change in its flower traits and leaf types,and provided a first view of the possible role of polyploidyin its evolution, based on a compilation of all availablechromosome counts. The adaptive value of leaf types needsto be investigated experimentally, and such experiments willbenefit from the phylogenetic framework provided here.
MethodsTaxon sampling, DNA sequencing, and alignmentPlant material was obtained from specimens deposited inherbaria in Munich (M and MSB), the Museu Integrado
(See figure on previous page.)Fig. 3 Ancestral state reconstruction for simple and compound (unifoliolate, note the articulation at the base of the leaflet marked by a blackarrow, trifoliolate, and multifoliolate) leaves under a symmetrical rates model, carried out on a chronogram resulting from a strict clock modelimplementing a fossil-based constraint for 183 Crotalaria species, 33 species of other Crotalarieae, and 23 species of the remaining genistoids. Piecharts indicate ancestral state probabilities, and node bars 95% posterior probability intervals for nodes ≥0.96 posterior probability. The geologicaltime scale is in million years and follows Cohen et al. [5]. The fossil seedpod most closely resembles the genera Bowdichia and Diplotropis [19].Photo: P. S. Herendeen. Additional file 5: Figure S5 shows the leaf states also coded for the outgroups
Fig. 4 a Distribution of 279 Crotalaria species in four climate types (Methods and Table 2); numbers refer to sampled species; b Distribution of simple-(in pale grey) and compound-leaved species (including uni-, tri-, and multifoliolate; in dark grey) in the four climate types
Rockinger et al. BMC Evolutionary Biology (2017) 17:61 Page 8 of 13
de Roraima (MIRR), the Instituto de Botânica (SP), theUniversidade de São Paulo (SPF), the Missouri BotanicalGarden (MO), the Royal Botanic Gardens in Kew (K), andthe Botanical Garden and Botanical Museum in Berlin (B).A few samples were obtained during a field trip in May2015 to São Paulo and Bahia, Brazil, and two from plantscultivated in the greenhouses of the Munich BotanicalGarden. Additional file 8: Table S1 lists all sampled taxawith their voucher information, geographic origin andGenBank (https://blast.ncbi.nlm.nih.gov/Blast.cgi) acces-sion numbers. Total genomic DNA was extracted from 5–25 mg of leaf tissue, using plant DNA extraction kits(NucleoSpin, Macherey-Nagel, Düren, Germany) accord-ing to the manufacturer’s protocol. Polymerase chain reac-tions (PCR) followed standard protocols, using Taq DNApolymerase and 10 primers (Additional file 9: Table S2).PCR products were purified with the ExoSap clean-upkit (Fermentas, St. Leon-Rot, Germany), and sequencingrelied on Big Dye Terminator kits (Applied Biosystems,Foster City, CA, USA) and an ABI 3130 automated se-quencer. In all, 26 chloroplast sequences (rbcL gene,psbA-trnH intergenic spacer) and 245 nuclear sequences(ribosomal DNA internal transcribed spacers ITS1 andITS 2, plus the intervening 5.8 S gene, and externaltranscribed spacer ETS) were newly generated for thisstudy. New sequences were BLAST-searched in Gen-Bank and then aligned with MAFFT v7 [28] using de-fault parameters. To take into account secondarystructure, the Q-INS-i multiple alignment strategy waschosen for the ITS and ETS sequences. Minor align-ment errors were manually adjusted in Geneious v8.1.8[30]. We first generated separate alignments for the ITSregion (381 species, 855 aligned positions), the ETS re-gion (108 species, 606 aligned positions), the matKgene (135 species, 754 aligned positions), the rbcL gene(196 species, 552 aligned positions), and the psbA-trnHintergenic spacer (124 species, 408 aligned positions).In the absence of statistical conflict (>70% maximumlikelihood bootstrap support) among topologies fromthese matrices, the datasets were concatenated resultingin a matrix of 3175 aligned positions, representing 338species of Crotalaria, 33 species of the other 15 generaof Crotalarieae, and 23 further species belonging to thecore genistoid clade [4, 33]. We sampled the eight sec-tions of Polhill [49] and the 11 of Le Roux et al. [37]with their type species, except for Crotalaria clavataWight & Arn., the type of section Hedriocarpae Wight& Arn., and Crotalaria leptocarpa Balf.f., the type ofsection Schizostigma Polhill. Specifically, we sampled 15 ofthe 27 species of Polhill’s [49] section Grandiflorae, 62 ofthe 140 in Chrysocalycinae, 64 of 110 in Hedriocarpae, 15of 35 in Geniculatae, 2 of 4 in Schizostigma, 72 of 212 inCalycinae, 71 of 91 in Crotalaria, and 32 of 130 inDispermae.
Phylogenetic analyses and ancestral state reconstructionsPhylogenetic trees were estimated using Maximum Like-lihood (ML) optimization in RAxML v8.0 [56] and eitheran unpartitioned model or a partitioned model (two par-titions for the two nuclear markers and a third partitionfor the plastid data). In both cases, JModelTest foundthe GTR + Γ + I substitution model as best fitting thedata, using the Bayesian Information Criterion [8]. How-ever, since the Γ and I parameter are partly redundant, aGTR + Γ substitution model with four rate categorieswas used in both cases. Statistical support came frombootstrapping under the same model, with 1000 repli-cates. There were no topological differences between thepartitioned and unpartitioned datasets. Weshow boot-strap values for nodes with ≥70% support, andAdditional file 10: Figure S8 shows the RAxML tree withsupport values for all nodes. All sequenced species werescored for the following trait states: Beak of the flowerkeel (straight = 0, spirally twisted = 1), calyx lobing(equally lobed = 0, bilabiate = 1), length of the calyx com-pared to length of the keel (shorter than keel = 0, as longas/longer than keel = 1), leaves simple = 0, unifoliolate = 1,trifoliolate = 2, or multifoliolate = 3. The trait state codingsare shown in Additional file 11: Table S3. We carried outancestral state reconstruction for these traits on the chro-nogram (next paragraph), using a Maximum Likelihoodapproach implemented in the ace function in the R pack-age ‘ape’ [45] that compares three models: an equal rates(ER) model, which assumes that all transition rates areequal, a symmetrical rate model (SYM), which imple-ments equal rates of backward and forward state transi-tions, but with each state combination can having adistinct rate, and an all rates different (ARD) model,wherein all rates are allowed to vary. The Akaike in-formation criterion (AIC) was used to judge modelfit, and in all cases the symmetrical rate model per-formed best (see Additional file 12: Table S4).All available chromosome numbers were complied
from the literature and plotted on the phylogenetictree.
Molecular clock datingFor molecular clock dating we relied on Bayesianoptimization in BEAST v1.8.2 [9]. Very short or zero-lengthbranches are known to cause problems for time estimationalgorithms (and may introduce a bias) because in theBayesian framework, the flat topological prior prohibitszero-length branches [35] and because zero-lengthbranches reduce the chance that MCMC runs will reachstationarity. In some analyses (Fig. 3, Additional file 1:Figure S1, Additional file 2: Figure S2, Additional file 3:Figure S3, Additional file 5: Figure S5), we therefore re-duced the alignment by removing 162 Crotalaria specieswith very short (<0.0001) branches. We added 23 species of
Rockinger et al. BMC Evolutionary Biology (2017) 17:61 Page 9 of 13
other core genistoids to this dataset to allow for fossilcalibration. This resulted in a matrix of 240 species and3,175 aligned positions, of which 183 species are crota-larias (representing all major clades) and the rest arerepresentatives of the core genistoids. To convert gen-etic branch lengths into absolute times we applied threecalibration approaches: (1) A strict clock calibratedwith the oldest known legume fossil, a seedpod fromwestern Wyoming that is most similar to the Sophoreaegenera Bowdichia and Diplotropis, dated to at least theLate Paleocene (56 Mya) ([19]; P. S. Herendeen,Chicago Botanical Garden, pers. communication 17Feb. 2016). We assigned this fossil to the crown nodeof the Bowdichia-Diplotropis-Leptolobium-clade, whichwe used as the outgroup, with a gamma distribution ofshape 1.4, scale 2.0, and offset 54, reflecting the mini-mum age of 56 Mya (this allowed 95% of the root nodeages to fall between 54.17 and 62.97), and using a nor-mally distributed prior for the clock rate. (2) Next weused an uncorrelated lognormal (UCLN) relaxed clockmodel with the same fossil calibration, using a diffusegamma distribution of shape 0.001, scale 1000.0, offset0.0 for the ucld.mean rate. (3) Lastly we applied a strictclock with three unlinked partitions for the ITS, ETS,and plastid markers, using a genome substitution rateof 0.00346 subst./site/my for the ITS region followingKay et al. [29] and a plastid genome rate of 0.00056subst./site/my from Palmer [43] for the combined plas-tid loci matK, rbcL, and psbA-trnH. The substitutionrate for the ETS partition was estimated, using a diffusegamma distribution as in approach 2. In each BEASTrun, we used a pure-birth (Yule) tree prior, the GTR + Γsubstitution model, and Monte Carlo Markov chains(MCMC) of 100 million generations, with parameterssampled every 10,000th generation. Tracer v1.6 (part ofthe BEAST package; [52]) was used to assess effectivesample sizes (ESS >200) for all estimated parameters.We used TreeAnnotator v1.8.2 (part of the BEASTpackage) to discard 10% of the saved trees as burn-inand to combine trees. Maximum clade credibility treeswith mean node heights were visualized using FigTreev1.4.2 (http://tree.bio.ed.ac.uk/software/figtree/) and R(R [51]). We report highest posterior densities intervals,the interval containing 95% of the sampled values.Results obtained with the fossil-calibrated relaxed clockmodel and the substitution-rate-calibrated strict clockmodel are shown in Additional file 13: Figure S9 andAdditional file 14: Figure S10.
Leaf trait correlations with climateSpecies were area-coded according to their natural distri-bution range, based on information from regional florasand taxonomic revisions [1, 2, 14, 15, 23, 24, 34, 48, 49],and the International Legume Database and Information
System (ILDIS) [53]. Delimitations of the distributionareas shown in Fig. 2 (lower inset) are given inAdditional file 11: Table S3. To assess the distributionof leaf types in different climate zones, we used a cat-egorical approach for which we assigned species to cli-mate zones and also linear regression analyses withcontinuous Bioclim data from WorldClim – GlobalClimate Data (http://www.worldclim.org/bioclim) forgeoreferenced species records coming from the GlobalBiodiversity Information Facility (GBIF; http://www.gbif.org). For the categorical approach, each species wasassigned to one of 14 climate types in the Köppen-Geigersystem [31, 46, 62]. Species were assigned to the climatetype found in >70% of their range; 48 species without adeterminable main climate category were coded as NAand excluded from further analysis, resulting in 276 spe-cies assigned to a climate category. In a second step, wegrouped the 14 climates into just four types (Table 2):humid tropics (minimum temperature ≥18 °C and annualprecipitation ≥60 mm (Af = rain forests) or ≥25 mm (Am=monsoon climate)), dry tropics (minimum temperature≥18 °C and annual precipitation <60 mm in summer (As= equatorial savannah with dry summer) or <60 mm inwinter (Aw = equatorial savannah with dry winter)),arid (annual precipitation <50% of a threshold value setequal to potential evapotranspiration (BW= desert cli-mate) or 50-100% of the threshold (BS = steppe climate)),and mild temperate regions with an average monthlytemperature >10 °C in the warmest month and > -3 °C inthe coldest month, and a minimum annual precipitationabove the threshold of the steppe climate (BS) (Cf = fullyhumid warm temperate climate) (Cw =warm temperateclimate with dry winter) (Cs = warm temperate climatewith dry summer). To test for differences in the occur-rence of leaf types in the four main climate types, we useda Pearson’s chi-squared test for count data (R [51]) andposthoc pairwise comparisons with the chisq.post.hocfunction of the R package ‘fifer’ [12].Leaf/climate analyses used binary leaf trait coding,
namely simple = 0 or compound = 1, with the latter traitstate including uni-, tri-, and multifoliolate, becausethere are too few uni- and multifoliolate species toform categories for statistical analysis and because thereare no phylogenetically informed models for categoricalmultistate traits. To use linear regressions for the bin-ary leaf traits and the continuous climate data, we quer-ied Crotalaria species names in GBIF using the gbiffunction of the R-package ‘dismo’ [22] and then filteredthe data by removing fossil and literature records andcoordinate duplicates at a resolution of 2.5-arc minuteswithin a species. After filtering, species with fewer than10 georeferenced records were removed. This resultedin a dataset of 22,225 records for 183 species, listed inAdditional file 11: Table S3 with their trait states. The
Rockinger et al. BMC Evolutionary Biology (2017) 17:61 Page 10 of 13
georeferenced locations of the 183 species were queriedagainst grid files for mean annual temperature (MAT),temperature annual range (TAR), mean annual precipi-tation (MAP), and precipitation seasonality (PS). Theclimate variables were based on gridded information(2.5-arc minute spatial resolution data) from the World-Clim dataset (BIO1, BIO7, BIO12, BIO15; [20, 21]). Toidentify multicollinearity of predictor variables, we de-termined variance inflation factors (VIF) by applyingthe vif function of the R package ‘HH’; all VIF were<5 (Additional file 15: Table S5), indicating sufficientindependence among predictor variables [17].For each species, we determined the median of the
respective climate variable in its native distributionrange. Values for climate parameters were standardizedto allow for comparative analyses and were log trans-formed, if not normally distributed. To determinewhich climate variable might be explanatory for the dis-tribution of leaf types, we applied a generalized linearmodel with the glm function of R stats and comparedits results with a logistic regression model applyingFirth’s correction to the likelihood by using R’s logistffunction [18], a random forest model (randomForest Rlibrary; [6]) and recursive partitioning analysis utilizingthe R package ‘rpart’ [59]. For recursive partitioning weallowed the variables MAT, TAR, MAP, and PS aspotential split points and set the minimum node size
(i.e. the minimum number of species contained in eachterminal node) to 25.To account for phylogenetic structure in our data, we
used a permutation test as implemented in the phylo.dfunction of the R package ‘caper’ [42] to measure phylo-genetic signal and applied a phylogenetic generalized lin-ear model, using the binaryPGLMM function of the ‘ape’package [45], which performs a linear regression for bin-ary trait data and simultaneously estimates the strengthof phylogenetic signal.
Additional files
Additional file 1: Figure S1. Same chronogram as in Fig. 3 with a MLAncestral State Reconstruction for one of the three flower traits (compareAdditional file 2: Figures S2 and Additional file 3: Figure S3). (PDF 3482 kb)
Additional file 2: Figure S2. Same chronogram as in Fig. 3 with a MLAncestral State Reconstruction for one of the three flower traits (compareAdditional file 1: Figures S1 and Additional file 3 Figure S3). (PDF 4964 kb)
Additional file 3: Figure S3. Same chronogram as in Fig. 3 with a MLAncestral State Reconstruction for one of the three flower traits (compareAdditional file 1: Figures S1 and Additional file 2: Figure S2). (PDF 4324 kb)
Additional file 4: Figure S4. Same Maximum Likelihood tree as inFigs. 1 and 2. Bootstrap values ≥70% are shown as numbers at nodes,and branch colors and bars represent the eight sections of Polhill [45](to the left) and the 11 sections of Le Roux et al. [36] (to the right). Insetabove legend: morphological key characters of Polhill’s sections A: keelbeak straight; B: receptacle prominent; C: receptacle not prominent; D:
Table 2 The 14 Köppen-Geiger climate categories and their grouping into four major climate groups (rightmost column)
Köppen-Geiger climatecategory
Main climate Annual Precipitation Seasonal temperature Major climategroup
Af Equatorial Pmin ≥ 60 mm Tmin ≥ +18 °C Humid tropics
Csa Psmin < Pwmin, Pwmax > 3 Psmin and Psmin <40 mm
Tmax≥ +22 °C
Csb Tmax < +22 °C and at least 4 Tmon≥+10 °C
Cfa neither Cs nor Cw Tmax≥ +22 °C
Cfb Tmax < +22 °C and at least 4 Tmon≥+10 °C
Precipitation criteria reflect annual accumulated precipitation (Pann), monthly precipitation in driest (Pmin) and wettest (Pmax) month, for the summer and winter half-years on the hemisphere considered (Psmin, Psmax, Pwmin, Pwmax) and dryness threshold (Pth, only for Arid). Dryness threshold (mm) depends on annual temperature andannual cycle of precipitation. Temperature criteria depend on annual mean near-surface temperature (Tann), monthly mean temperature of warmest (Tmax) and coldest(Tmin) months, and monthly temperature (Tmon). (See [31])
Rockinger et al. BMC Evolutionary Biology (2017) 17:61 Page 11 of 13
Additional file 5: Figure S5. Ancestral state reconstruction for simpleand compound leaves as in Fig. 3, but with the outgroups also coded.(PDF 4553 kb)
Additional file 6: Figure S6. Recursive partitioning tree for therelationship between climate parameters and leaf type. Median meanannual temperature (MAT), temperature annual range (TAR), meanannual precipitation (MAP), and precipitation seasonality (PS) in aspecies’ distribution range were evaluated as potential split points.Number of species contained in each terminal node shown belowgraphs. (PDF 144 kb)
Additional file 7: Figure S7. Same maximum likelihood tree as in Fig. 1with chromosome numbers for 122 species plotted on the tips andshown as bars to the right. Red arrow marks the crown node of thepolyploid Neotropical clade; black arrows mark species in which thestages of anthesis have been studied. (PDF 524 kb)
Additional file 8: Table S1. Species used in this study with herbariumvouchers, place of deposition (in a few cases also their barcodes),geographic origin, distribution ranges, and GenBank accession numbersfor all sequences. Type species of Polhill’s [45] and Le Roux et al.’s [36]sections are listed with the respective sectional names and are markedwith an asterisk. Newly sequenced species in bold. Native distributionareas are marked by an (N), those where a species has been introducedby an (I), and those where the status is uncertain by an (U). (XLSX 69 kb)
Additional file 9: Table S2. Primer sequences used in this study (listed5’- to 3’-end) and applied protocols. (DOCX 23 kb)
Additional file 10: Figure S8. Bootstrap support values from 1000replicates for the maximum likelihood tree for 372 accessions representing338 species of Crotalaria and 33 species of the remaining 15 genera ofCrotalarieae based on 3175 aligned nucleotides of nuclear and plastidsequences. (PDF 435 kb)
Additional file 11: Table S3. Species list with coding of sections,distribution areas, leaf and flower trait states, species’ climate categories,number of GBIF records, and chromosome numbers. Polhill’s [45] sections(1 = Grandiflorae, 2 = Chrysocalycinae, 3 = Hedriocarpae, 4 = Geniculatae, 5= Schizostigma, 6 = Calycinae, 7 = Crotalaria, 8 = Dispermae); Le Roux et al.[36] sections (1 = Hedriocarpae, 2 = Incanae, 3 = Schizostigma, 4 =Calycinae, 5 = Borealigeniculatae, 6 = Crotalaria, 7 = Stipulosae, 8 = Glaucae,9 = Geniculatae, 10 = Amphitrichae, 11 = Grandiflorae); distribution areas(“Region”, “Region 2”, “Region 3”, “Region 4”) (0 = Americas (North, Central,and South America, and the Caribbean), Africa and the Middle East,Madagascar (including Mauritius, Réunion, and the Seychelles), Asia (fromthe east of Arabian Peninsula to Southeast Asia, Australasia (comprisingAustralia, Papua New Guinea, and Melanesia)); leaf type (0 = simple, 1 =unifoliolate, 2 = trifoliolate, 4 = multifoliolate); leaf type binary (0 = simple,2 = compound); beak of the keel petal (“Keel”) (straight = 0, spirallytwisted = 1); calyx lobing (equally lobed = 0, bilabiate = 1); length of thecalyx compared to length of the keel petal (“Calyx length”) (shorter thankeel = 0, as long as/longer than keel = 1); Köppen-Geiger category (0 = Af,1 = Am, 2 = As, 3 = Aw, 4 = BWk, 5 = BWh, 6 = BSk, 7 = BSh, 8 = Cfa, 9 =Cfb, 10 = Csa, 11 = Csb, 12 = Cwa, 13 = Cwb); Köppen-Geiger majorclimate group (0 = humid tropics [Af, Am], 1 = dry tropics [As, Aw], 2 =arid [BWk, BWh, BSk, BSh], 3 =mild temperate [Cfa, Cfb, Csa, Csb, Cwa,Cwb]); diploid chromosome numbers (“2n”) (0 = 14, 1 = 16, 2 = 18, 3 = 32,4 = 42/48, 5 = 54) (reference list for chromosome numbers below table).NA = not available. (XLSX 174 kb)
Additional file 12: Table S4. Akaike information criterion (AIC) valuesand log-likelihoods from ancestral state reconstructions carried out forleaf type (simple, unifoliolate, trifoliolate, multifoliolate), keel beak(straight, spirally twisted), calyx lobing (equally lobed, bilabiate), calyxlength (shorter than keel, as long as/longer than keel). (DOCX 42 kb)
Additional file 13: Figure S9. Chronogram resulting from a relaxedclock model implementing the same fossil-based constraint as in Fig. 3.Node bars indicate 95% posterior probability intervals for nodes with≥0.96 posterior probability. The geological time scale is in million yearsand follows Cohen et al. [5]. (PDF 627 kb)
Additional file 14: Figure S10. Chronogram resulting from a strictclock model calibrated with substitution rates. Node bars indicate 95%posterior probability intervals for nodes with ≥0.96 posterior probability.The geological time scale is in million years and follows Cohen et al. [5].(PDF 631 kb)
Additional file 15: Table S5. The relationships between four climatevariables and the distribution of species with simple and compoundleaves. Mean annual temperature (MAT), temperature annual range (TAR),mean annual precipitation (MAP), and precipitation seasonality (PS). Threecomparative measures were used: the coefficient of determination from ageneralized likelihood model (glm), a logistic regression model (logistf),and mean decrease in accuracy values (MDA) from random forestanalysis. Variance inflation factors (VIF) are also shown. *p <0.05, ***p<0.0001 (DOCX 31 kb)
AcknowledgementsWe thank M. Silber for assistance in the lab, C. M. Zohner for advice onclimate analysis, S. G. Aninta for help with gathering trait and distributiondata, and two anonymous reviewers for their comments. We also thank thecurators of the herbaria listed in Additional file 8: Table S1 for grantingaccess to their collections.
Availability of supporting dataAll the supporting data are included as additional files under: http://www.xxxx
Authors’ contributionsAR generated the data and carried out all analyses; AR and SSR wrote the paper;ASF contributed material, and helped gathering chromosome and morphologicaltrait data; SSR devised the project and provided financial support. All authors readand approved the final manuscript.
Competing interestsThe authors declare that they have no competing interests.
Author details1Systematic Botany and Mycology, University of Munich (LMU), MenzingerStr. 67, 80638 Munich, Germany. 2Instituto de Amparo a Ciência, Tecnologiae Inovação de Roraima, Herbário do Museu Integrado de Roraima, Av.Brigadeiro Eduardo Gomes s.n., Parque Anauá, 69305-010 Boa Vista, RR, Brazil.
Received: 3 October 2016 Accepted: 3 February 2017
References1. Ansari AA. Taxonomic studies on genus Crotalaria L. in India - II: infra-generic
classification. J Econ Tax Bot. 2006;30:570–82.2. Ansari AA. Crotalaria L. in India. Dehra Dun: Bishen Singh Mahendra Pal
Singh; 2008.3. Boatwright JS, Le Roux MM, Wink M, Morozova T, Van Wyk BE. Phylogenetic
relationships of tribe Crotalarieae (Fabaceae) inferred from DNA sequencesand morphology. Syst Bot. 2008;33:752–61.
4. Cardoso D, de Queiroz LP, Pennington RT, de Lima HC, Fonty E,Wojciechowski MF, Lavin M. Revisiting the phylogeny of papilionoidlegumes: new insights from comprehensively sampled early-branchinglineages. Am J Bot. 2012;99:1991–2013.
5. Cohen KM, Finney SC, Gibbard PL, Fan JX. The ICS internationalchronostratigraphic chart. Episodes. 2013;36:199–204.
6. Cutler DR, Edwards TC, Beard KH, Cutler A, Hess KT, Gibson J, Lawler JJ.Random forests for classification in ecology. Ecology. 2007;88:2783–92.
7. Danforth BN, Cardinal S, Praz CJ, Almeida EAB, Michez D. The impact ofmolecular data on our understanding of bee phylogeny and evolution.Annu Rev Entomol. 2013;58:57–78.
8. Darriba D, Taboada GL, Doallo R, Posada D. jModelTest 2: more models,new heuristics and parallel computing. Nat Methods. 2012;9:772.
9. Drummond AJ, Suchard MA, Xie D, Rambaut A. Bayesian phylogenetics withBEAUti and the BEAST 1.7. Mol Biol Evol. 2012;29:1969–73.
10. Etcheverry AV. Role of staminal growth in delayed self-pollination ofCrotalaria stipularia (Fabaceae: Papilionoideae). Acta Hortic. 2001;561:339–42.
Rockinger et al. BMC Evolutionary Biology (2017) 17:61 Page 12 of 13
11. Etcheverry AV, Westerkamp C, Protomastro JJ. Delayed autonomous self-pollination in the colonizer Crotalaria micans (Fabaceae: Papilionoideae):structural and functional aspects. Plant Syst Evol. 2003;239:15–28.
12. Fife, D. 2014. fifer: A collection of miscellaneous functions. R packageversion 1.0. https://CRAN.R-project.org/package=fifer
13. Flores AS, Corrêa AM, Forni-Martins ER, Tozzi AMGDA. Chromosomenumbers in Brazilian species of Crotalaria (Leguminosae, Papilionoideae)and their taxonomic significance. Bot J Linn Soc. 2006;151:271–7.
14. Flores AS, Tozzi AMGDA. Phytogeographical patterns of Crotalaria species(Leguminosae-Papilionoideae) in Brazil. Rodriguésia. 2008;59:477–86.
15. Flores AS, Rockinger A, Rodrigues RS, Tozzi AMGDA. Lectotypifications andtaxonomic changes in Brazilian Crotalaria L. (Leguminosae). Phys ChemChem Phys. 2016;267:296–300.
16. Frodin DG. History and concepts of big plant genera. Taxon. 2004;53:753–76.17. Heiberger, R.M. 2016. HH Statistical Analysis and Data Display: Heiberger and
Holland. R package version 3.1-32. URL http://CRAN.R-project.org/package=HH18. Heinze, G., Ploner, M., Dunkler, D., Southworth, H. 2013. logistf: Firth's bias
reduced logistic regression. R package version 1.21. https://CRAN.R-project.org/package=logistf
19. Herendeen, P.S., Wing, S. 2001. Papilionoid legume fruits and leaves fromthe Paleocene of northwestern Wyoming. Botany 2001, Abstracts, Society ofAmerica. http://2001.botanyconference.org/section7/abstracts/26.shtml
20. Hijmans, R.J., Cameron, S.E., Parra, J+.L., Jones, P.G., Jarvis, A. 2004. Theworldclim interpolated global terrestrial climate surfaces. Available online at:http://biogeo.berkeley.edu/
21. Hijmans RJ, Cameron SE, Parra JL, Jones PG, Jarvis A. Very high resolutioninterpolated climate surfaces for global land areas. Int J Climatol. 2005;25:1965–78.
23. Holland AE. A review of Crotalaria L. (Fabaceae: Crotalarieae) in Australia.Austrobaileya. 2002;6:293–324.
24. Hooker JD. The Flora of British India. Covent Garden: L. Reeve & Co.; 1879.25. Irmer S, Podzun N, Langel D, Heidemann F, Kaltenegger E, Schemmerling B,
Geilfus C-M, Zörb C, Ober D. New aspect of plant-rhizobia interaction:Alkaloid biosynthesis in Crotalaria depends on nodulation. Proc Natl AcadSci U S A. 2015;112:4164–9.
26. Jacobi CM, Ramalho M, Silva M. Pollination biology of the exotic rattleweedCrotalaria retusa L. (Fabaceae) in NE Brazil. Biotropica. 2005;37:357–63.
27. Jaramillo MA, Callejas R, Davidson C, Smith JF, Stevens AC, Tepe EJ. Aphylogeny of the tropical genus Piper using ITS and the chloroplast intronpsbJ–petA. Syst Bot. 2008;33:647–660.
28. Katoh K, Standley DM. MAFFT Multiple Sequence Alignment Software Version7: Improvements in performance and usability. Mol Biol Evol. 2013;30:772–80.
29. Kay KM, Whittall JB, Hodges SA. A survey of nuclear ribosomal internaltranscribed spacer substitution rates across angiosperms: an approximatemolecular clock with life history effects. BMC Evol Biol. 2006;6:36.
30. Kearse M, Moir R, Wilson A, Stones-Havas S, Cheung M, Sturrock S, Buxton S,Cooper A, Markowitz S, Duran C, Thierer T, Ashton B, Meintjes P, Drummond A.Geneious Basic: An integrated and extendable desktop software platform forthe organization and analysis of sequence data. Bioinformatics.2012;28:1647–9.
31. Kottek M, Grieser J, Beck C, Rudolf B, Rubel F. World Map of the Köppen-Geiger climate classification updated. Meteorol Z. 2006;15:259–63.
32. Lavin M, Delgado A. Pollen brush of Papilionoideae (Leguminosae):morphological variation and systematic utility. Am J Bot.1990;77:1294–312.
33. Lavin M, Herendeen PS, Wojciechowski MF. Evolutionary rates analysis ofLeguminosae implicates a rapid diversification of lineages during theTertiary. Syst Bot. 2005;54:575–94.
34. Lee AT. Some species of Crotalaria in Australia. Telopea. 1978;1:319–56.35. Lemmon AR, Brown JM, Stanger-Hall K, Lemmon EM. The effect of
ambiguous data on phylogenetic estimates obtained by maximumlikelihood and Bayesian inference. Syst Biol. 2009;58:130–45.
36. Le Roux MM, van Wyk B-E. The systematic value of flower structure inCrotalaria and related genera of the tribe Crotalarieae (Fabaceae). Flora.2012;2012(207):414–26.
37. Le Roux MM, Boatwright JS, Van Wyk B-E. A global infrageneric classificationsystem for the genus Crotalaria (Leguminosae) based on molecular andmorphological evidence. Taxon. 2013;62:957–71.
38. Lewis G, Schrire BD, Mackinder B, Lock M. Legumes of the world. Kew: RoyalBotanical Gardens; 2005.
39. Li QQ, Zhou SD, He XJ, Yu Y, Zhang YC, Wei XQ. Phylogeny and biogeographyof Allium (Amaryllidaceae: Allieae) based on nuclear ribosomal internaltranscribed spacer and chloroplast rps16 sequences, focusing on the inclusionof species endemic to China. Ann Bot-London. 2010;106:709–733.
40. Mangotra R, Koul AK. Polyploidy in genus Crotalaria. Cytologia. 1991;56:293–6.41. Oliveira ACD, Aguiar-Perecin MD. Karyotype evolution in the genus
Crotalaria (Leguminosae). Cytologia. 1999;64:165–74.42. Orme, D., Freckleton, R., Thomas, G., Petzoldt, T., Fritz, S., Isaac, N., Pearse, W.
2013. Caper: Comparative Analyses of Phylogenetics and Evolution in R. Rpackage version 0.5.2. https://CRAN.R-project.org/package=caper.
43. Palmer JD. Plastid chromosomes: structure and evolution, in: Bogorad, L.,Vasil, I.K. (Eds.), Cell culture and somatic genetics of plant. Academic Press,San Diego: Molecular Biology of plastids; 1991, pp. 5–53.
44. Palomino G, Vázquez R. Cytogenetic studies in Mexican populations of speciesof Crotalaria L. (Leguminosae-Papilionoideae). Cytologia. 1991;56:343–51.
45. Paradis E, Claude J, Strimmer K. APE: analyses of phylogenetics andevolution in R language. Bioinformatics. 2004;20:289–90.
46. Peel MC, Finlayson BL, McMahon TA. Updated world map of the Köppen-Geiger climate classification. Hydrol Earth Syst Sci Discuss. 2007;4:439–73.
47. Pirie MD, Oliver EGH, Bellstedt DU. A densely sampled ITS phylogeny ofthe Cape flagship genus Erica L. suggests numerous shifts in floralmacro-morphology. Mol Phylogenet Evol. 2011;61:593–601.
48. Polhill RM. Miscellaneous notes on African species of Crotalaria L.: II. KewBull. 1968;22:169–348.
49. Polhill RM. Crotalaria in Africa and Madagascar. Rotterdam: CRC Press; 1982.50. Popic TJ, Davila YC, Wardle GM. Cheater or mutualist? Novel florivory
interaction between nectar-rich Crotalaria cunninghamii and smallmammals. Austral Ecol. 2016;41:390–8.
51. Core Team R. R: a language and environment for statistical computing.Vienna: R Foundation for Statistical Computing; 2015.
52. Rambaut, A, Suchard, M.A., XIE, D., Drummond, A.J. 2014. Tracer v1.6,Available from http://beast.bio.ed.ac.uk/Tracer.
53. Roskov YR, Bisby FA, Zarucchi JL, Schrire BD, White RJ. ILDIS World Databaseof Legumes. 2005. http://www.ildis.org.
54. Särkinen T, Bohs L, Olmstead RG, Knapp S. A phylogenetic framework forevolutionary study of the nightshades (Solanaceae): a dated 1000-tip tree.BMC Evol Biol. 2013;13:1.
55. Shackel KA, Hall AE. Reversible leaflet movements in relation to droughtadaptation of cowpeas, Vigna unguiculata (L.) Walp. Aust J Plant Physiol.1979;6:265–76.
56. Stamatakis A. RAxML version 8: a tool for phylogenetic analysis and postanalysis of large phylogenies. Bioinformatics. 2014;30:1312–3.
57. Subramaniam S, Pandey AK, Geeta R, Mort ME. Molecular systematics ofIndian Crotalaria (Fabaceae) based on analyses of nuclear ribosomal ITSDNA sequences. Plant Syst Evol. 2013;299:1089–106.
58. Subramaniam S, Pandey AK, Rather SA. A revised circumscription of the speciesin Bracteatae complex (section Calycinae) in the genus Crotalaria L.: evidencefrom nuclear and chloroplast markers. Plant Syst Evol. 2015;301:2261–90.
59. Thernau, T., Atkinson, B., Ripley, B. 2015. rpart: Recursive Partitioning andRegression Trees. R package version 4.1-10. URL: http://CRAN.R-project.org/package=rpart
60. Vogel S. Leaves in the lowest and highest winds: temperature, force andshape. New Phytol. 2009;183:13–26.
61. Warman L, Moles AT, Edwards W. Not so simple after all: searching forecological advantages of compound leaves. Oikos. 2011;120:813–21.