Research ArticleStudy on Skin Factor and Productivity of Horizontal Well afterAcidizing with Nonuniform Damage
Lin Yuan Xiao-Ping Li Xiao-Hua Tan and Lie-Hui Zhang
State Key Laboratory of Oil and Gas Reservoir Geology and Exploitation Southwest Petroleum University Chengdu 610500 China
Correspondence should be addressed to Xiao-Hua Tan xiaohua-tan163com
Received 16 October 2014 Revised 3 December 2014 Accepted 5 December 2014
Academic Editor Agus Sasmito
Copyright copy 2015 Lin Yuan et alThis is an open access article distributed under the Creative Commons Attribution License whichpermits unrestricted use distribution and reproduction in any medium provided the original work is properly cited
Horizontal well (HW) was divided into several elements after acidizing In each element there would exist a composite zone thatwas made up of damage zone (DZ) and acidizing zone (AZ) Local skin factor after acidizing was used to describe the resistancein each composite zone The models for local skin factor and productivity of HW were created using the method of equivalentfiltration resistance and displacement between two similar flow modes According to the solution of the models type curves ofskin factor and production-increasing ratio after acidizing were illustrated and the effect of different parameters in DZ and AZ ondistribution of skin factor and production-increasing ratio after acidizing were discussedThe present model has a significant guideon the practice of acidizing technology
1 Introduction
Numerous researchers have modeled the skin factor andproductivity of horizontal well (HW) by different methodsand furthermore the flow in the wellbore has also beenconsidered
Frick and Economides [1] presented a mathematicalmodel of skin factor for a HW In their model the anisotropyof the permeability and the shape of a truncated elliptical conein damage zone (DZ) with the larger DZ near the verticalsection of HW were taken into account
For anisotropicmedium Permadi et al [2ndash5] pointed thatthe shape of damage region was circular near the well andelliptical far from the well and presented a new analyticalmodel for damage skin factor and the resulting reservoirinflow for a horizontal well which can be more accurate thanprevious model for skin factor and productivity of HW
Parn-anurak and Engler [6] put forward a new model todescribe the distribution of the skin factor along the wellboreof a HW in which the DZ had a cylindrical-conical shapemeanwhile the penetration rate the length of HW and theanisotropy ratio were taken into account
Ye et al [7] proposed a method for evaluating formationdamage from a drilled HW Their model could calculate
the invasion depth of drilling fluid and completion fluidwhich also simultaneously considered the skin factor flowefficiency of the well and production loss in order to predictthe extent of damage to the formation
Cai et al [8 9] proposed analytical fractal model toanalyze the depth of extraneous fluid invasion where thetortuosity of capillaries and wettability effect [10] are takeninto accountTheirmodels show that the impregnation depthfollows a scaling law of time where the exponent is a functionof fractal tortuosity dimension rather than the classicalconstant 05 Except for the methods that are mentionedabove the fractal theory could also be used in the study onskin factor for HW [11ndash13]
Yildiz et al [14 15] considered the problem of steadyfiltration flowof an incompressible single-phase fluid near theHWwith varying permeability inDZ In thismodel the effectof damage ratio the size and shape of DZ and the geometricparameters of the permeability profile on productivity of HWwere investigated Based on the research the effect of varyingpermeability in the DZ could also be taken into account onskin factor and productivity of HW [16]
Taking into account a negative skin Nie et al [17] consid-ered a set of complex boundary conditions and built a com-prehensive semianalytical model for a HW in homogeneous
Hindawi Publishing CorporationJournal of ChemistryVolume 2015 Article ID 706312 10 pageshttpdxdoiorg1011552015706312
2 Journal of Chemistry
z z
z z
y y y y+minus=
Composite area near the wellbore after acidizing
(I) Original damage zone (II) Damage zone with the same size as acidizing zone
(III) Acidizing zone
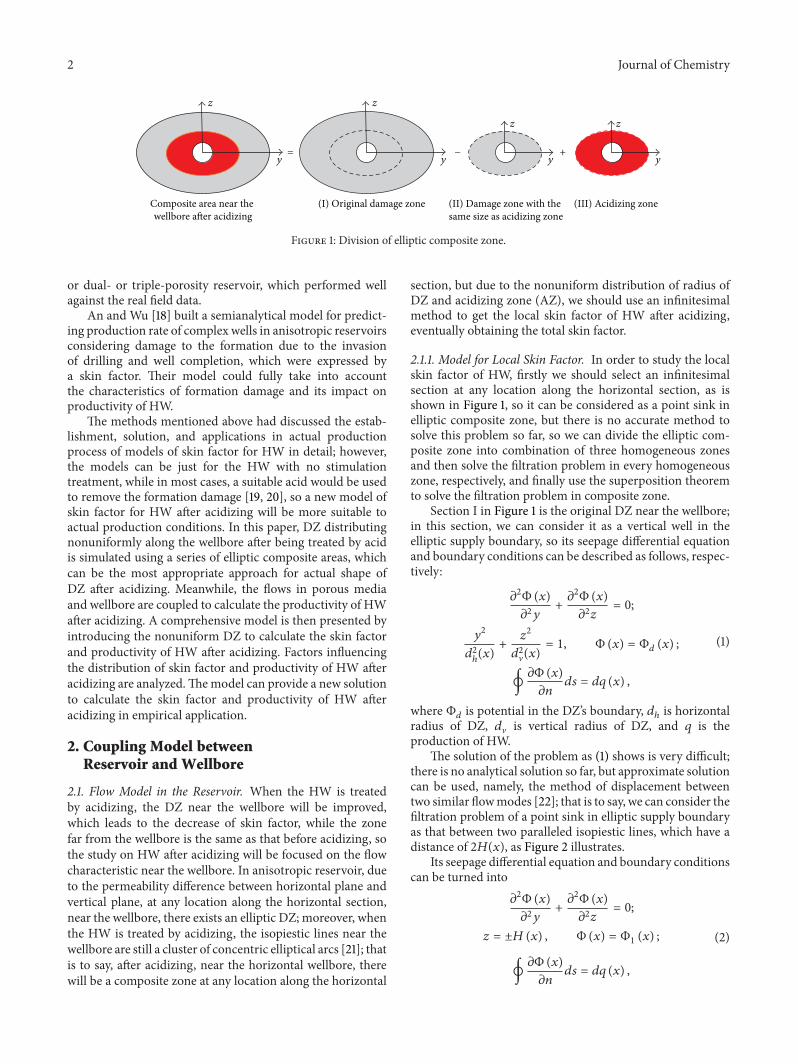
Figure 1 Division of elliptic composite zone
or dual- or triple-porosity reservoir which performed wellagainst the real field data
An and Wu [18] built a semianalytical model for predict-ing production rate of complex wells in anisotropic reservoirsconsidering damage to the formation due to the invasionof drilling and well completion which were expressed bya skin factor Their model could fully take into accountthe characteristics of formation damage and its impact onproductivity of HW
The methods mentioned above had discussed the estab-lishment solution and applications in actual productionprocess of models of skin factor for HW in detail howeverthe models can be just for the HW with no stimulationtreatment while in most cases a suitable acid would be usedto remove the formation damage [19 20] so a new model ofskin factor for HW after acidizing will be more suitable toactual production conditions In this paper DZ distributingnonuniformly along the wellbore after being treated by acidis simulated using a series of elliptic composite areas whichcan be the most appropriate approach for actual shape ofDZ after acidizing Meanwhile the flows in porous mediaand wellbore are coupled to calculate the productivity of HWafter acidizing A comprehensive model is then presented byintroducing the nonuniform DZ to calculate the skin factorand productivity of HW after acidizing Factors influencingthe distribution of skin factor and productivity of HW afteracidizing are analyzedThemodel can provide a new solutionto calculate the skin factor and productivity of HW afteracidizing in empirical application
2 Coupling Model betweenReservoir and Wellbore
21 Flow Model in the Reservoir When the HW is treatedby acidizing the DZ near the wellbore will be improvedwhich leads to the decrease of skin factor while the zonefar from the wellbore is the same as that before acidizing sothe study on HW after acidizing will be focused on the flowcharacteristic near the wellbore In anisotropic reservoir dueto the permeability difference between horizontal plane andvertical plane at any location along the horizontal sectionnear the wellbore there exists an elliptic DZ moreover whenthe HW is treated by acidizing the isopiestic lines near thewellbore are still a cluster of concentric elliptical arcs [21] thatis to say after acidizing near the horizontal wellbore therewill be a composite zone at any location along the horizontal
section but due to the nonuniform distribution of radius ofDZ and acidizing zone (AZ) we should use an infinitesimalmethod to get the local skin factor of HW after acidizingeventually obtaining the total skin factor
211 Model for Local Skin Factor In order to study the localskin factor of HW firstly we should select an infinitesimalsection at any location along the horizontal section as isshown in Figure 1 so it can be considered as a point sink inelliptic composite zone but there is no accurate method tosolve this problem so far so we can divide the elliptic com-posite zone into combination of three homogeneous zonesand then solve the filtration problem in every homogeneouszone respectively and finally use the superposition theoremto solve the filtration problem in composite zone
Section I in Figure 1 is the original DZ near the wellborein this section we can consider it as a vertical well in theelliptic supply boundary so its seepage differential equationand boundary conditions can be described as follows respec-tively
1205972Φ (119909)
1205972119910+1205972Φ (119909)
1205972119911= 0
1199102
1198892ℎ(119909)
+1199112
1198892V(119909)= 1 Φ (119909) = Φ
119889(119909)
∮120597Φ (119909)
120597119899119889119904 = 119889119902 (119909)
(1)
where Φ119889is potential in the DZrsquos boundary 119889
ℎis horizontal
radius of DZ 119889V is vertical radius of DZ and 119902 is theproduction of HW
The solution of the problem as (1) shows is very difficultthere is no analytical solution so far but approximate solutioncan be used namely the method of displacement betweentwo similar flowmodes [22] that is to say we can consider thefiltration problem of a point sink in elliptic supply boundaryas that between two paralleled isopiestic lines which have adistance of 2119867(119909) as Figure 2 illustrates
Its seepage differential equation and boundary conditionscan be turned into
Figure 2 Method of displacement between two similar flow modes
where Φ1is potential in constant pressure boundary and
2119867(119909) is the distance between two constant pressure linesUsing the potential superposition principles the analyti-
cal solution of (2) can be got as follows [23]
Φ(119909) =092119889119902 (119909)
119889119909ln
ch (1205871199102119867(119909)) minus cos (1205871199112119867(119909))ch (1205871199102119867(119909)) + cos (1205871199112119867(119909))
+ Φ1(119909)
(3)
Equation (3) is deduced based on the SI system of basicunit in oil reservoir we can improve it into SI system of mineunit in gas reservoir so (4) shows the distribution of potentialnear a point sink in the elliptic supply boundary
1199012(119909) =
1291 times 10minus3119889119902119904119888(119909) sdot 119879120583
119892119885
2119870119889V sdot 119889119909
times lnch (1205871199102119867(119909)) minus cos (1205871199112119867(119909))ch (1205871199102119867(119909)) + cos (1205871199112119867(119909))
+ 1199012
1(119909)
(4)
where 119902119904119888is the production of horizontal gas well 119879 is the
gas reservoir temperature 120583119892is the gas viscosity 119885 is the gas
deviation factor and 119870119889V is the vertical permeability of DZ
Because points [119889ℎ(119909) 0] and [0 119889V(119909)] are in the same
isopotential line substituting the plane of the two points into(4) respectively
1199012
119889(119909) =
1291 times 10minus3119889119902119904119888(119909) 119879120583
119892119885
2119870119889V sdot 119889119909
times lnch(120587119889
ℎ(119909)2119867(119909)) minus 1
ch(120587119889ℎ(119909)2119867(119909)) + 1
+ 1199012
1(119909)
(5)
1199012
119889(119909) =
1291 times 10minus3119889119902119904119888(119909) 119879120583
119892119885
2119870119889V sdot 119889119909
times ln1 minus cos (120587119889V(119909)2119867(119909))1 + cos (120587119889V(119909)2119867(119909))
+ 1199012
1(119909)
(6)
where 119901119889is the pressure of DZrsquos boundary
02468
10
0 1 2 3 4 5 6 7 8dh(x)d(x)
H(x)d(x)
Figure 3 Relationship curve between119867(119909)119889V(119909) and 119889ℎ(119909)119889V(119909)
Due to the reason that through (8) we cannot get theanalytical solution of 119867(119909) we can study its change rule bygraphing method Figure 3 is the relationship curve between119867(119909)119889V(119909) and 119889ℎ(119909)119889V(119909)
From Figure 3 it is interesting to find that when the valueof 119889ℎ(119909)119889V(119909) is more than 15 the value of119867(119909)119889V(119909) will
tend to 1 due to the effect of permeability anisotropy thevalue of 119889
ℎ(119909)119889V(119909) is always more than 15 so in this paper
we can make an assumption that119867(119909) is similar to 119889V(119909)Substituting (7) into (4)
1199012(119909) = 119901
2
119889(119909) +
1291 times 10minus3119889119902119904119888(119909) sdot 119879120583
119892119885
4119870119889V sdot 119889119909
times lnch (1205871199102119867(119909)) minus cos (1205871199112119867(119909))ch (1205871199102119867(119909)) + cos (1205871199112119867(119909))
(9)
Because the isopiestic line near thewellbore is circular wecan take any point (0 119903
119908) At this point the pressure is119901
119908119891(119909)
1199012
119908119891(119909) = 119901
2
119889(119909) +
1291 times 10minus3119889119902119904119888(119909) sdot 119879120583
119892119885
119870119889V sdot 119889119909
times ln(tan120587119903119908
4119867 (119909))
(10)
4 Journal of Chemistry
where 119901119908119891(119909) is pressure at any location along the wellbore
where 119870ℎis the permeability of formation ℎ is the gas
reservoir thickness and 119878 is the skin factor of vertical wellWe can make an assumption that the anisotropy before
and after acidizing is constant namely 120573 = (119870ℎ119870V)12
=
(119870119889ℎ119870119889V)12
= (119870119886ℎ119870119886V)12 comparing (11) with (12) the
skin factor of section I can be written as follows
1198781(119909) = (
119870ℎ
119870119889ℎ
minus 1) ln [cot120587119903119908
4119889V (119909)] (13)
Identical method can be used to get the skin factor ofsections II and III namely
1198782(119909) = (
119870ℎ
119870119889ℎ
minus 1) ln [cot120587119903119908
4119886V (119909)]
1198783(119909) = (
119870ℎ
119870119886ℎ
minus 1) ln [cot120587119903119908
4119886V (119909)]
(14)
where 119870119889ℎ
is the horizontal permeability of DZ 119870119886ℎ
is thehorizontal permeability of AZ and 119886V is the vertical radius ofAZ
So the local skin factor of HW along the wellbore afteracidizing will be written as follows
119878 (119909) = 1198781(119909) minus 119878
2(119909) + 119878
3(119909)
= (119870ℎ
119870119889ℎ
minus 1) ln[cot (120587119903
1199084119889V (119909))
cot (1205871199031199084119886V (119909))
]
+ (119870ℎ
119870119886ℎ
minus 1) ln [cot120587119903119908
4119886V (119909)]
(15)
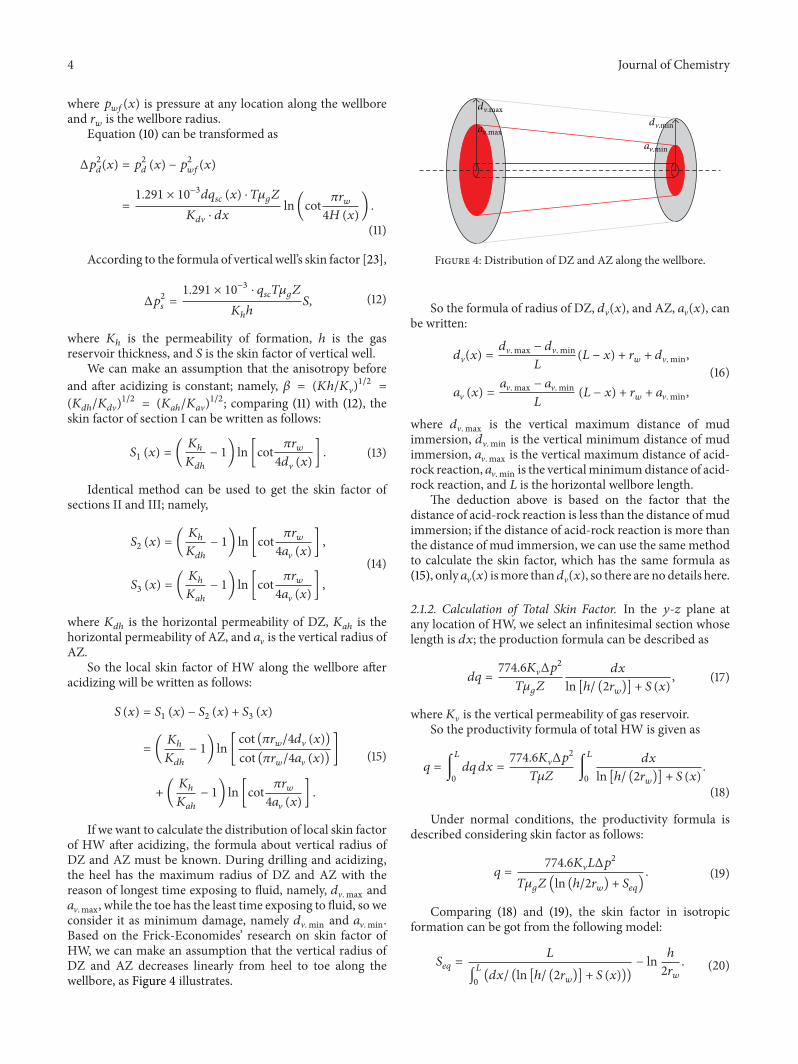
If we want to calculate the distribution of local skin factorof HW after acidizing the formula about vertical radius ofDZ and AZ must be known During drilling and acidizingthe heel has the maximum radius of DZ and AZ with thereason of longest time exposing to fluid namely 119889Vmax and119886Vmax while the toe has the least time exposing to fluid so weconsider it as minimum damage namely 119889Vmin and 119886VminBased on the Frick-Economidesrsquo research on skin factor ofHW we can make an assumption that the vertical radius ofDZ and AZ decreases linearly from heel to toe along thewellbore as Figure 4 illustrates
dvmaxdvminavmax
avmin
Figure 4 Distribution of DZ and AZ along the wellbore
So the formula of radius of DZ 119889V(119909) and AZ 119886V(119909) canbe written
119889V(119909) =119889Vmax minus 119889Vmin
119871(119871 minus 119909) + 119903
119908+ 119889Vmin
119886V (119909) =119886Vmax minus 119886Vmin
119871(119871 minus 119909) + 119903
119908+ 119886Vmin
(16)
where 119889Vmax is the vertical maximum distance of mudimmersion 119889Vmin is the vertical minimum distance of mudimmersion 119886Vmax is the vertical maximum distance of acid-rock reaction 119886Vmin is the verticalminimumdistance of acid-rock reaction and 119871 is the horizontal wellbore length
The deduction above is based on the factor that thedistance of acid-rock reaction is less than the distance of mudimmersion if the distance of acid-rock reaction is more thanthe distance of mud immersion we can use the samemethodto calculate the skin factor which has the same formula as(15) only 119886V(119909) ismore than119889V(119909) so there are no details here
212 Calculation of Total Skin Factor In the 119910-119911 plane atany location of HW we select an infinitesimal section whoselength is 119889119909 the production formula can be described as
119889119902 =7746119870VΔ119901
2
119879120583119892119885
119889119909
ln [ℎ (2119903119908)] + 119878 (119909)
(17)
where119870V is the vertical permeability of gas reservoirSo the productivity formula of total HW is given as
119902 = int
119871
0
119889119902 119889119909 =7746119870VΔ119901
2
119879120583119885int
119871
0
119889119909
ln [ℎ (2119903119908)] + 119878 (119909)
(18)
Under normal conditions the productivity formula isdescribed considering skin factor as follows
119902 =7746119870V119871Δ119901
2
119879120583119892119885(ln (ℎ2119903
119908) + 119878119890119902) (19)
Comparing (18) and (19) the skin factor in isotropicformation can be got from the following model
119878119890119902=
119871
int119871
0(119889119909 (ln [ℎ (2119903
119908)] + 119878 (119909)))
minus ln ℎ
2119903119908
(20)
Journal of Chemistry 5
x = Lx = 0
Figure 5 Coupling model between reservoir and wellbore
If the anisotropy is taken into account (20) will bechanged to
119878119890119902=
119871
int119871
0(119889119909 (ln[120573ℎ(120573 + 1)119903
119908] + 119878 (119909)))
minus ln120573ℎ
(120573 + 1) 119903119908
(21)
213 Productivity Formula of Horizontal Well after AcidizingThe formula of skin factor after acidizing namely (21) canbe added on Joshirsquos productivity formula [24] to get theproductivity index of per unit length of HW
119869ℎ= (
7746119870ℎℎ
(119879120583119892119885119871)
)(ln[[
[
119886 + radic1198862 minus (1198712)2
1198712
]]
]
+120573ℎ
119871(ln
120573ℎ
2119903119908
+ 119878119890119902))
minus1
(22)
where 119886 is a semimajor axis of elliptic drainage areaSo from formation to wellbore the flow rate of per unit
length of HW can be written as
119902ℎ(119909) = 119869
ℎ[1199012
119890minus 1199012
119908119891(119909)] (23)
where 119901119890is the driving pressure of gas reservoir
22 Flow in the Wellbore Because of the pressure drop in thewellbore [25ndash30] the flow rate is changeable at any locationalong the wellbore meanwhile the total rate in the wellboreis increasing gradually When the HW is treated by acidizingthe production is greatly increased so an assumption can bemade that the condition of fluid in the wellbore is turbulentflow for the barefoot well completion the oil flow from theformation to the wellbore uniformly as is shown in Figure 5
Based on the volume conservation between reservoir andwellbore the relationship between flow rate change in thewellbore and that from formation to wellbore can be writtenas
119889119876 (119909)
119889119909= minus119902ℎ(119909) (24)
The symbol ldquominusrdquo at the right side of (24) indicates thatfluidrsquos flow direction is opposite to the 119909 plane For the reser-voir with infinite outer boundary the boundary conditionscan be described as follows
lim119909rarrinfin
1199012
119908119891(119909) = 119901
2
119890
lim119909rarr0
1199012
119908119891(119909) = 119901
2
119908119891
(25)
Transforming the boundary condition as (25) shows intothat related to flow rate
lim119909rarrinfin
119889119876 (119909)
119889119909= 0
lim119909rarr0
119889119876 (119909)
119889119909= minus119869ℎ(1199012
119890minus 1199012
119908119891)
(26)
Typically the pressure gradient in the horizontal wellborecan be written as
1198891199012
119908119891(119909)
119889119909= 9066 times 10
minus12120582120574119892119885119879
11986351198762(119909) (27)
where 120582 is the friction coefficient119863 is the wellbore diameter120574119892is the gas relative density and 119876(119909) is the total rate at any
location of horizontal wellboreIn fully turbulent flow zone friction coefficient120582 is always
constant for a specific slotted liner or screen pipe
120582 =1
41198971198922 [120576 (37119863)] (28)
where 120576 is the wellbore coarse degree
23 Solution Method for Productivity Model Taking thederivative of (22) and (23) respectively
119889119902ℎ(119909)
119889119909+ 119869ℎ
1198891199012
119908119891(119909)
119889119909= 0 (29)
1198892119876 (119909)
1198891199092+119889119902ℎ(119909)
119889119909= 0 (30)
We can derive from (29) and (30) that
1198892119876 (119909)
1198891199092minus 119869ℎ
1198891199012
119908119891(119909)
119889119909= 0 (31)
Substituting (27) and (28) into (31) the following modelcan be obtained
1198892119876 (119909)
1198891199092minus 9066 times 10
minus20119869ℎ120582120574119892119885119879
11986351198762(119909) = 0 (32)
Combining boundary conditions (26) the analytic solu-tion when the HWrsquos length tends to reach infinity can be got
119876(119909) = 5556120583119892119863
120574119892
times [
[
radic1198621
6119909 + (radic
3
21198621
1198622)
minus13
]
]
minus2
(33)
6 Journal of Chemistry
0 100 200 300 400 500 600 700 800 900 100005
15
25
35
45
55
Any location along the horizontal section x (m)
Loca
l ski
n fa
ctor
S(x)
Kdh = 005mDKdh = 010mDKdh = 015mD
Kdh = 020mDKdh = 025mDKdh = 030mD
Figure 6 Effect of DZrsquos permeability (119870119889ℎ) on skin factor (119871 =
In (33) 119876(119909) indicates the total production that 119909 gt
1199091015840 where 1199091015840 means any location along the wellbore so the
production of HW can be described by
119876 = 119876(0) minus 119876(119871) (34)
Namely
119876 = 5556120583119892119863
120574119892
[radic3
21198621
1198622]
23
minus 5556120583119892119863
120574119892
[
[
radic1198621
6119871 + (radic
3
21198621
1198622)
minus13
]
]
minus2
(35)
3 Results and Discussion
31 Sensitivity Analysis on Skin Factor of Horizontal Well afterAcidizing Figure 6 shows the distribution of local skin factoralong the wellbore under different DZrsquos permeability FromFigure 6 we can obviously find that the local skin factordecreases from the heel to the toe meanwhile the localskin factor decreases as the permeability of DZ section isincreased but the tendency of increasing is not constant asFigure 6 shows Namely when the DZrsquos permeability is risingfrom 005mD to 010mD the local skin factorrsquos variationrange is about 16 but when theDZrsquos permeability is changingfrom 010mD to 030mD the local skin factor decreasesby only 1 which demonstrates that for the DZ with highpermeability it is difficult to obtain smaller skin factor soany other stimulation treatment must be taken to decreasethe skin factor
Figure 7 compares the distribution of local skin factorunder different mud immersionrsquos distance As is shown in
Figure 7 when themaximum andminimum distance of mudimmersion are rising from (12m 015m) to (16m 020m)respectively the local skin factor increases significantly butwhen they increase from (16m 020m) to (32m 040m)the local skin factorrsquos range of variation is less than the abovementioned case that is to say the local skin factor afteracidizing is increasing as the advancing of distance of mudimmersion but the tendency is changed gradually this showsthat if the DZ has a long distance of mud immersion nearthe wellbore the acidizing treatment has a small contributionto decrease the skin factor so an in-depth acidificationtechnology should be taken into account in order to increasethe distance of acid-rock reaction largely and improve the DZin the great degree
Figure 8 provides the comparison of distribution of localskin factor along the wellbore under different permeability ofAZAs demonstrated in Figure 8 the permeability of AZdoesnot change the distribution trend of local skin factor along thewellbore it also attains maximum at the heel while it attainsminimum at the toe When the permeability of AZ rangesfrom08mD to 10mD the local skin factor decreases sharplywhile from 10mD to 18mD the value of local skin factoronly has fewer changes namely the local skin factor decreasesby the increasing of permeability of AZ but the tendency ismore and more gentle so the conclusion can be drawn whenthe permeability of AZ reaches a certain extent if we wantto decrease the skin factor through increasing permeabilityof AZ it will have little contribution any other stimulationtreatments must be taken
Comparing the curves of distribution of local skin factorunder different distance of acid-rock reaction as illustrated inFigure 9 it is obvious to find that when the distance of acid-rock reaction ranged from (08m 010m) to (10m 0125m)
Journal of Chemistry 7
0 100 200 300 400 500 600 700 800 900 100015
2
25
3
35
4
Any location along the horizontal section x (m)
Loca
l ski
n fa
ctor
S(x)
Kah = 08mDKah = 10mDKah = 12mD
Kah = 14mDKah = 16mDKah = 18mD
Figure 8 Effect of AZrsquos permeability (119870119886ℎ) on skin factor (119871 =
respectively the local skin factor decreases sharply but whenthe distance of acid-rock reaction increases from (10m0125m) to (18m 0225m) the local skin factor only has asmall increase namely the local skin factor decreases by theincreasing of distance of acid-rock reaction but it will reacha constant when the distance has become a certain degreeso this will reveal that during HWrsquos acidizing treatmentreasonable acid type should be chosen which can not onlyincrease the distance of acid-rock reaction but also meet thedemand of economic benefit
0 100 200 300 400 500 600 700 800 900 10001
2
3
4
5
6
7
Prod
uctio
n-in
crea
sing
ratio
Horizontal well length L (m)
Kdh = 005mDKdh = 010mDKdh = 015mD
Kdh = 020mDKdh = 025mDKdh = 030mD
Figure 10 Effect of DZrsquos permeability (119870119889ℎ) on production-
119889Vmin = 02m 119886Vmax = 12m and 119886Vmin = 015m)
32 Sensitivity Analysis Study on Production-Increasing Ratioof Horizontal Well after Acidizing The relationship curvesbetween production-increasing ratio and HW length atdifferent DZrsquos permeabilities are calculated and presented inFigure 10 As is shown in Figure 10 when the DZrsquos perme-ability is constant the production-increasing ratio increasesas the HW length is increased but when the HW lengthreaches a certain extent the production-increasing ratiobecomes constant meanwhile the production-increasingratio decreases as the permeability of DZ is increased butthe tendency will become more and more gentle that isto say the lower the DZrsquos permeability is the higher theproduction-increasing ratio will be So when the distance ofmud immersion is constant if the permeability of DZ is lowthe acidizing effect will be better which is also the reasonwhyacidizing had been widely used in developing the gas and oilfield
Figure 11 shows the relationship between production-increasing ratio and HW length under different distances ofmud immersion From Figure 11 it is obvious to find that bythe increasing of distance ofmud immersion the production-increasing ratio decreases this is because when the distanceof acid-rock reaction is constant the deeper the distance ofmud immersion is the smaller the scale transformation willbe so for the HW with deep DZ acidizing treatment will beineffective and fracturing can be a good choice to stimulatewhich not only can improve the DZ to a great degree but alsocan increase the vertical permeability eventually improvingthe fluidity of oil near the wellbore
Figure 12 compares the relationship curves betweenproduction-increasing ratio and HW length under differentpermeability of AZ It illustrates that by the increasing ofpermeability of AZ the production-increasing ratio alsoincreases but the extent will be more and more gentleeventually tending to a constant value This is because whenthe permeability of DZ is constant if the permeability of AZ
119889Vmin = 02m 119886Vmax = 12m and 119886Vmin = 015m)
is higher it will indicate that acidizing fluid improves theDZ perfectly but when the permeability of AZ reaches highlevels the contribution of acidizing to production-increasingratio will become small so during application of acidizinga reasonable acid type and an acid concentration should betaken into account in order to get an optimal effect
Figure 13 compares the relationship curves betweenproduction-increasing ratio and HW length under differ-ent distances of acid-rock reaction As demonstrated inFigure 13 when the distance of mud immersion is constant
Figure 13 Effect of distance of acid-rock reaction (119886Vmax 119886Vmin)on production-increasing ratio (119871 = 1000m 119903
119908= 01m 120576 =
000016m 120574119892= 056 120583
119892= 0023mPasdots 119885 = 09 119879 = 366K
ℎ = 10m 119901119908119891
= 20MPa119870ℎ= 06mD119870V = 01mD119870
119886ℎ= 12mD
119870119889ℎ= 01mD 119889Vmax = 16m and 119889Vmin = 02m)
the production-increasing ratio increases sharply by theincreasing of distance of acid-rock reaction this is becausethe bigger the distance of acid-rock reaction is the greaterthe improvement degree (including DZ and no DZ) willbe eventually enhancing the production-increasing ratio Soduring acidizing of HW retarded acid will be a good choiceto increase the distance of acid-rock reaction and content tothe high permeability in AZ
4 Conclusions
The model for skin factor and productivity of HW afteracidizing is established and solved during which HW isdivided into many segments at any segment the methodof displacement between two similar flow modes is usedType curves of skin factor and production-increasing ratioare illustrated and the factors affecting skin factor andproduction-increasing ratio are analyzed Analysis resultsshow after acidizing as the increasing of the distance ofmud immersion local skin factor of HW increases whileas the increasing of DZrsquos permeability AZrsquos permeabilityand distance of acid-rock reaction it decreases production-increasing ratio increases as the increasing of HW lengthAZrsquos permeability and distance of acid-rock reaction while itdecreases as the increasing of DZrsquos permeability and distanceof mud immersion
Nomenclature
119886 Semimajor axis of elliptic drainage area m119886V Vertical radius of acidizing zone m
Journal of Chemistry 9
119886Vmax Vertical maximum distance of acid-rockreaction m
119886Vmin Vertical minimum distance of acid-rockreaction m
120573 Anisotropy coefficient119863 Wellbore diameter m119889ℎ Horizontal radius of damage zone m
119889V Vertical radius of damage zone m119889Vmax Vertical maximum distance of mud
immersion m119889Vmin Vertical minimum distance of mud
immersion m120582 Friction coefficient119867 Distance between two constant pressure
lines mℎ Gas reservoir thickness m119869ℎ Gas productivity index per unit
m3(dsdotMPasdotM)119870ℎ Permeability of formation mD
119870V Vertical permeability of gas reservoir mD119870119886V Vertical permeability of acidizing zone
mD119870119889V Vertical permeability of damage zone mD
119870119889ℎ Horizontal permeability of damage zone
mD119870119886ℎ Horizontal permeability of acidizing zone
mD119871 Horizontal well length m119901119890 Driving pressure of gas reservoir MPa
119901119889 Pressure of damage zonersquos boundary MPa
119901119908119891 Pressure of heel MPa
119901119908119891(119909) Pressure at any location along the
wellbore MPaΦ119889 Potential in the damage zonersquos boundary
10minus6m2s
Φ1 Potential in constant pressure boundary
10minus6m2s
Δ119901119904 Pressure drop caused by skin factor MPa
Δ119901 Production pressure drop of vertical wellMPa
119902ℎ Production of per unit length m3d
119902119904119888 Production of horizontal gas well m3d
119876 Production of horizontal well m3d119903119908 Wellbore radius m
119878 Skin factor of vertical well119878(119909) Local skin factor of horizontal well119878119890119902 Total skin factor of horizontal well
120574119892 Gas relative density
120576 Wellbore coarse degree m119879 Gas reservoir temperature K120583119892 Gas viscosity mPasdots
119885 Gas deviation factor
Conflict of Interests
The authors declare that there is no conflict of interestsregarding the publication of this paper
Acknowledgments
The authors are grateful for financial support from theNational Science Fund for Distinguished Young Scholars ofChina (Grant no 51125019) and the 2014 Australia ChinaNat-ural Gas Technology Partnership Fund TopUp Scholarships
References
[1] T P Frick and M J Economides ldquoHorizontal well damagecharacterization and removalrdquo SPE Production amp Facilities vol8 no 1 pp 15ndash22 1993
[2] P Permadi and W Wibowo ldquoEffects of non-uniform skinfactor distribution on horizontal well inflow performancerdquo inProceedings of SPE European Damage Conference pp 1ndash6 2001
[3] K Furui D Zhu and A D Hill ldquoA rigorous formation damageskin factor and reservoir inflow model for a horizontal wellrdquoSPE Production amp Facilities vol 18 no 3 pp 151ndash157 2003
[4] T Yildiz ldquoDiscussion of lsquoA rigorous formation damage skinfactor and reservoir inflow model for a horizontal wellrsquordquo SPEProduction amp Facilities vol 19 no 2 pp 105ndash106 2004
[5] K Furui D Zhu and A D Hill ldquoAuthorsrsquo reply to lsquoDiscussionof a rigorous formation damage skin factor and reservoir inflowmodel for a horizontal wellrsquordquo SPE Production amp Facilities vol 19no 2 pp 107ndash108 2004
[6] S Parn-anurak and T W Engler ldquoModeling of fluid filtrationand near-wellbore damage along a horizontal wellrdquo Journal ofPetroleum Science and Engineering vol 46 no 3 pp 149ndash1602005
[7] Y Ye J Yan S Zou S Wang and R Lu ldquoA new laboratorymethod for evaluating formation damage in fractured carbon-ate reservoirsrdquo Petroleum Science vol 5 no 1 pp 45ndash51 2008
[8] J Cai B Yu M Zou and M Mei ldquoFractal analysis ofinvasion depth of extraneous fluids in porous mediardquo ChemicalEngineering Science vol 65 no 18 pp 5178ndash5186 2010
[9] J Cai and B Yu ldquoA discussion of the effect of tortuosity onthe capillary imbibition in porous mediardquo Transport in PorousMedia vol 89 no 2 pp 251ndash263 2011
[10] J Cai E Perfect C-L Cheng and X Hu ldquoGeneralizedmodeling of spontaneous imbibition based on hagen-poiseuilleflow in tortuous capillaries with variably shaped aperturesrdquoLangmuir vol 30 no 18 pp 5142ndash5151 2014
[11] X H Tan and X P Li ldquoTransient flow model and pressuredynamic features of tree-shaped fractal reservoirsrdquo Journal ofHydrodynamics B vol 26 no 4 pp 654ndash663 2014
[12] X H Tan X P Li L H Zhang et al ldquoAnalysis of transientflow and starting pressure gradient of power-law fluid in fractalporous mediardquo International Journal of Modern Physics C vol26 no 4 Article ID 1550045 2015
[13] X-H Tan X-P Li J-Y Liu G-D Zhang and L-H ZhangldquoAnalysis of permeability for transient two-phase flow in fractalporous mediardquo Journal of Applied Physics vol 115 no 11 ArticleID 113502 2014
[14] T Yildiz ldquoEquivalent skin factor for non-uniformly damagehorizontal and multilateral wellsrdquo in Proceedings of SPE AnnualTechnical Conference and Exhibition pp 1ndash17 2008
[15] I V Voronich L A Gaidukov and N N Mikhailov ldquoFluidfiltration to a horizontal well with variation in the parametersof the damage zonerdquo Journal of AppliedMechanics and TechnicalPhysics vol 52 no 4 pp 608ndash614 2011
10 Journal of Chemistry
[16] L You K Xue Y Kang Y Liao and L Kong ldquoPore structureand limit pressure of gas slippage effect in tight sandstonerdquoTheScientific World Journal vol 2013 Article ID 572140 7 pages2013
[17] R-S Nie Y-L Jia Y-F Meng Y-HWang J-M Yuan andW-F Xu ldquoNew type curves formodeling productivity of horizontalwell with negative skin factorsrdquo SPE Reservoir Evaluation ampEngineering vol 15 no 4 pp 486ndash497 2012
[18] Y An and X Wu ldquoProductivity prediction model for complexwells with damage to producing formationrdquo Chemistry andTechnology of Fuels and Oils vol 50 no 2 pp 160ndash164 2014
[19] M Yadav S Kumar and P N Yadav ldquoDevelopment ofecofriendly corrosion inhibitors for application in acidizationof petroleum oil wellrdquo Journal of Chemistry vol 2013 ArticleID 618684 9 pages 2013
[20] Y-H Cai and W Luo ldquoPreparation of schiff base derivedfrom 34-dimethoxybenzaldehyde and p-aminobenzoic acid bysupersonic speed gas impacting methodrdquo Journal of Chemistryvol 2014 Article ID 218376 5 pages 2014
[21] E P da Motta A D Hill and K Sepehrnoori ldquoSelective matrixacidizing of horizontal wellsrdquo Journal of Canadian PetroleumTechnology vol 36 no 5 pp 43ndash52 1997
[22] M Muskat ldquoThe flow of homogeneous fluid through porousmediardquo Soil Science vol 46 no 2 p 169 1938
[23] M F Hawkins Jr ldquoA note on the skin effectrdquo Journal ofPetroleum Technology vol 8 no 12 pp 65ndash66 2013
[24] S D Joshi ldquoAugmentation of well productivity with slant andhorizontal wellsrdquo Journal of Petroleum Technology vol 40 no6 pp 729ndash739 1988
[25] B J Dikken ldquoPressure drop in horizontal wells and its effect onproduction performancerdquo Journal of Petroleum Technology vol42 no 11 pp 1426ndash1433 1990
[26] M Ihara J P Brill and O Shoham ldquoExperimental and theo-retical investigation of two-phase flow in horizontal wellsrdquoin Proceedings of the SPE Annual Technical Conference andExhibition pp 57ndash69 October 1992
[27] E Ozkan C Sarica M Haciislamoglu and R RaghavanldquoEffect of conductivity on horizontal-well pressure-behaviorrdquoSPE Advanced Technology Series vol 3 no 1 pp 85ndash94 1995
[28] V R Penmatcha S Arbabi and K Aziz ldquoEffects of pressuredrop in horizontal wells and optimumwell lengthrdquo SPE Journalvol 4 no 3 pp 215ndash221 1999
[29] E Ozkan ldquoInfluence of pressure drop along the wellbore onhorizontal-well productivityrdquo SPE Journal vol 4 no 3 pp 288ndash301 1999
[30] Q Zhang Z M Wang X Q Wang and J Yang ldquoA newcomprehensive model for predicting the pressure drop offlow in the horizontal wellborerdquo Journal of Energy ResourcesTechnology vol 136 no 4 pp 1ndash9 2014
(I) Original damage zone (II) Damage zone with the same size as acidizing zone
(III) Acidizing zone
Figure 1 Division of elliptic composite zone
or dual- or triple-porosity reservoir which performed wellagainst the real field data
An and Wu [18] built a semianalytical model for predict-ing production rate of complex wells in anisotropic reservoirsconsidering damage to the formation due to the invasionof drilling and well completion which were expressed bya skin factor Their model could fully take into accountthe characteristics of formation damage and its impact onproductivity of HW
The methods mentioned above had discussed the estab-lishment solution and applications in actual productionprocess of models of skin factor for HW in detail howeverthe models can be just for the HW with no stimulationtreatment while in most cases a suitable acid would be usedto remove the formation damage [19 20] so a new model ofskin factor for HW after acidizing will be more suitable toactual production conditions In this paper DZ distributingnonuniformly along the wellbore after being treated by acidis simulated using a series of elliptic composite areas whichcan be the most appropriate approach for actual shape ofDZ after acidizing Meanwhile the flows in porous mediaand wellbore are coupled to calculate the productivity of HWafter acidizing A comprehensive model is then presented byintroducing the nonuniform DZ to calculate the skin factorand productivity of HW after acidizing Factors influencingthe distribution of skin factor and productivity of HW afteracidizing are analyzedThemodel can provide a new solutionto calculate the skin factor and productivity of HW afteracidizing in empirical application
2 Coupling Model betweenReservoir and Wellbore
21 Flow Model in the Reservoir When the HW is treatedby acidizing the DZ near the wellbore will be improvedwhich leads to the decrease of skin factor while the zonefar from the wellbore is the same as that before acidizing sothe study on HW after acidizing will be focused on the flowcharacteristic near the wellbore In anisotropic reservoir dueto the permeability difference between horizontal plane andvertical plane at any location along the horizontal sectionnear the wellbore there exists an elliptic DZ moreover whenthe HW is treated by acidizing the isopiestic lines near thewellbore are still a cluster of concentric elliptical arcs [21] thatis to say after acidizing near the horizontal wellbore therewill be a composite zone at any location along the horizontal
section but due to the nonuniform distribution of radius ofDZ and acidizing zone (AZ) we should use an infinitesimalmethod to get the local skin factor of HW after acidizingeventually obtaining the total skin factor
211 Model for Local Skin Factor In order to study the localskin factor of HW firstly we should select an infinitesimalsection at any location along the horizontal section as isshown in Figure 1 so it can be considered as a point sink inelliptic composite zone but there is no accurate method tosolve this problem so far so we can divide the elliptic com-posite zone into combination of three homogeneous zonesand then solve the filtration problem in every homogeneouszone respectively and finally use the superposition theoremto solve the filtration problem in composite zone
Section I in Figure 1 is the original DZ near the wellborein this section we can consider it as a vertical well in theelliptic supply boundary so its seepage differential equationand boundary conditions can be described as follows respec-tively
1205972Φ (119909)
1205972119910+1205972Φ (119909)
1205972119911= 0
1199102
1198892ℎ(119909)
+1199112
1198892V(119909)= 1 Φ (119909) = Φ
119889(119909)
∮120597Φ (119909)
120597119899119889119904 = 119889119902 (119909)
(1)
where Φ119889is potential in the DZrsquos boundary 119889
ℎis horizontal
radius of DZ 119889V is vertical radius of DZ and 119902 is theproduction of HW
The solution of the problem as (1) shows is very difficultthere is no analytical solution so far but approximate solutioncan be used namely the method of displacement betweentwo similar flowmodes [22] that is to say we can consider thefiltration problem of a point sink in elliptic supply boundaryas that between two paralleled isopiestic lines which have adistance of 2119867(119909) as Figure 2 illustrates
Its seepage differential equation and boundary conditionscan be turned into
Figure 2 Method of displacement between two similar flow modes
where Φ1is potential in constant pressure boundary and
2119867(119909) is the distance between two constant pressure linesUsing the potential superposition principles the analyti-
cal solution of (2) can be got as follows [23]
Φ(119909) =092119889119902 (119909)
119889119909ln
ch (1205871199102119867(119909)) minus cos (1205871199112119867(119909))ch (1205871199102119867(119909)) + cos (1205871199112119867(119909))
+ Φ1(119909)
(3)
Equation (3) is deduced based on the SI system of basicunit in oil reservoir we can improve it into SI system of mineunit in gas reservoir so (4) shows the distribution of potentialnear a point sink in the elliptic supply boundary
1199012(119909) =
1291 times 10minus3119889119902119904119888(119909) sdot 119879120583
119892119885
2119870119889V sdot 119889119909
times lnch (1205871199102119867(119909)) minus cos (1205871199112119867(119909))ch (1205871199102119867(119909)) + cos (1205871199112119867(119909))
+ 1199012
1(119909)
(4)
where 119902119904119888is the production of horizontal gas well 119879 is the
gas reservoir temperature 120583119892is the gas viscosity 119885 is the gas
deviation factor and 119870119889V is the vertical permeability of DZ
Because points [119889ℎ(119909) 0] and [0 119889V(119909)] are in the same
isopotential line substituting the plane of the two points into(4) respectively
1199012
119889(119909) =
1291 times 10minus3119889119902119904119888(119909) 119879120583
119892119885
2119870119889V sdot 119889119909
times lnch(120587119889
ℎ(119909)2119867(119909)) minus 1
ch(120587119889ℎ(119909)2119867(119909)) + 1
+ 1199012
1(119909)
(5)
1199012
119889(119909) =
1291 times 10minus3119889119902119904119888(119909) 119879120583
119892119885
2119870119889V sdot 119889119909
times ln1 minus cos (120587119889V(119909)2119867(119909))1 + cos (120587119889V(119909)2119867(119909))
+ 1199012
1(119909)
(6)
where 119901119889is the pressure of DZrsquos boundary
02468
10
0 1 2 3 4 5 6 7 8dh(x)d(x)
H(x)d(x)
Figure 3 Relationship curve between119867(119909)119889V(119909) and 119889ℎ(119909)119889V(119909)
Due to the reason that through (8) we cannot get theanalytical solution of 119867(119909) we can study its change rule bygraphing method Figure 3 is the relationship curve between119867(119909)119889V(119909) and 119889ℎ(119909)119889V(119909)
From Figure 3 it is interesting to find that when the valueof 119889ℎ(119909)119889V(119909) is more than 15 the value of119867(119909)119889V(119909) will
tend to 1 due to the effect of permeability anisotropy thevalue of 119889
ℎ(119909)119889V(119909) is always more than 15 so in this paper
we can make an assumption that119867(119909) is similar to 119889V(119909)Substituting (7) into (4)
1199012(119909) = 119901
2
119889(119909) +
1291 times 10minus3119889119902119904119888(119909) sdot 119879120583
119892119885
4119870119889V sdot 119889119909
times lnch (1205871199102119867(119909)) minus cos (1205871199112119867(119909))ch (1205871199102119867(119909)) + cos (1205871199112119867(119909))
(9)
Because the isopiestic line near thewellbore is circular wecan take any point (0 119903
119908) At this point the pressure is119901
119908119891(119909)
1199012
119908119891(119909) = 119901
2
119889(119909) +
1291 times 10minus3119889119902119904119888(119909) sdot 119879120583
119892119885
119870119889V sdot 119889119909
times ln(tan120587119903119908
4119867 (119909))
(10)
4 Journal of Chemistry
where 119901119908119891(119909) is pressure at any location along the wellbore
where 119870ℎis the permeability of formation ℎ is the gas
reservoir thickness and 119878 is the skin factor of vertical wellWe can make an assumption that the anisotropy before
and after acidizing is constant namely 120573 = (119870ℎ119870V)12
=
(119870119889ℎ119870119889V)12
= (119870119886ℎ119870119886V)12 comparing (11) with (12) the
skin factor of section I can be written as follows
1198781(119909) = (
119870ℎ
119870119889ℎ
minus 1) ln [cot120587119903119908
4119889V (119909)] (13)
Identical method can be used to get the skin factor ofsections II and III namely
1198782(119909) = (
119870ℎ
119870119889ℎ
minus 1) ln [cot120587119903119908
4119886V (119909)]
1198783(119909) = (
119870ℎ
119870119886ℎ
minus 1) ln [cot120587119903119908
4119886V (119909)]
(14)
where 119870119889ℎ
is the horizontal permeability of DZ 119870119886ℎ
is thehorizontal permeability of AZ and 119886V is the vertical radius ofAZ
So the local skin factor of HW along the wellbore afteracidizing will be written as follows
119878 (119909) = 1198781(119909) minus 119878
2(119909) + 119878
3(119909)
= (119870ℎ
119870119889ℎ
minus 1) ln[cot (120587119903
1199084119889V (119909))
cot (1205871199031199084119886V (119909))
]
+ (119870ℎ
119870119886ℎ
minus 1) ln [cot120587119903119908
4119886V (119909)]
(15)
If we want to calculate the distribution of local skin factorof HW after acidizing the formula about vertical radius ofDZ and AZ must be known During drilling and acidizingthe heel has the maximum radius of DZ and AZ with thereason of longest time exposing to fluid namely 119889Vmax and119886Vmax while the toe has the least time exposing to fluid so weconsider it as minimum damage namely 119889Vmin and 119886VminBased on the Frick-Economidesrsquo research on skin factor ofHW we can make an assumption that the vertical radius ofDZ and AZ decreases linearly from heel to toe along thewellbore as Figure 4 illustrates
dvmaxdvminavmax
avmin
Figure 4 Distribution of DZ and AZ along the wellbore
So the formula of radius of DZ 119889V(119909) and AZ 119886V(119909) canbe written
119889V(119909) =119889Vmax minus 119889Vmin
119871(119871 minus 119909) + 119903
119908+ 119889Vmin
119886V (119909) =119886Vmax minus 119886Vmin
119871(119871 minus 119909) + 119903
119908+ 119886Vmin
(16)
where 119889Vmax is the vertical maximum distance of mudimmersion 119889Vmin is the vertical minimum distance of mudimmersion 119886Vmax is the vertical maximum distance of acid-rock reaction 119886Vmin is the verticalminimumdistance of acid-rock reaction and 119871 is the horizontal wellbore length
The deduction above is based on the factor that thedistance of acid-rock reaction is less than the distance of mudimmersion if the distance of acid-rock reaction is more thanthe distance of mud immersion we can use the samemethodto calculate the skin factor which has the same formula as(15) only 119886V(119909) ismore than119889V(119909) so there are no details here
212 Calculation of Total Skin Factor In the 119910-119911 plane atany location of HW we select an infinitesimal section whoselength is 119889119909 the production formula can be described as
119889119902 =7746119870VΔ119901
2
119879120583119892119885
119889119909
ln [ℎ (2119903119908)] + 119878 (119909)
(17)
where119870V is the vertical permeability of gas reservoirSo the productivity formula of total HW is given as
119902 = int
119871
0
119889119902 119889119909 =7746119870VΔ119901
2
119879120583119885int
119871
0
119889119909
ln [ℎ (2119903119908)] + 119878 (119909)
(18)
Under normal conditions the productivity formula isdescribed considering skin factor as follows
119902 =7746119870V119871Δ119901
2
119879120583119892119885(ln (ℎ2119903
119908) + 119878119890119902) (19)
Comparing (18) and (19) the skin factor in isotropicformation can be got from the following model
119878119890119902=
119871
int119871
0(119889119909 (ln [ℎ (2119903
119908)] + 119878 (119909)))
minus ln ℎ
2119903119908
(20)
Journal of Chemistry 5
x = Lx = 0
Figure 5 Coupling model between reservoir and wellbore
If the anisotropy is taken into account (20) will bechanged to
119878119890119902=
119871
int119871
0(119889119909 (ln[120573ℎ(120573 + 1)119903
119908] + 119878 (119909)))
minus ln120573ℎ
(120573 + 1) 119903119908
(21)
213 Productivity Formula of Horizontal Well after AcidizingThe formula of skin factor after acidizing namely (21) canbe added on Joshirsquos productivity formula [24] to get theproductivity index of per unit length of HW
119869ℎ= (
7746119870ℎℎ
(119879120583119892119885119871)
)(ln[[
[
119886 + radic1198862 minus (1198712)2
1198712
]]
]
+120573ℎ
119871(ln
120573ℎ
2119903119908
+ 119878119890119902))
minus1
(22)
where 119886 is a semimajor axis of elliptic drainage areaSo from formation to wellbore the flow rate of per unit
length of HW can be written as
119902ℎ(119909) = 119869
ℎ[1199012
119890minus 1199012
119908119891(119909)] (23)
where 119901119890is the driving pressure of gas reservoir
22 Flow in the Wellbore Because of the pressure drop in thewellbore [25ndash30] the flow rate is changeable at any locationalong the wellbore meanwhile the total rate in the wellboreis increasing gradually When the HW is treated by acidizingthe production is greatly increased so an assumption can bemade that the condition of fluid in the wellbore is turbulentflow for the barefoot well completion the oil flow from theformation to the wellbore uniformly as is shown in Figure 5
Based on the volume conservation between reservoir andwellbore the relationship between flow rate change in thewellbore and that from formation to wellbore can be writtenas
119889119876 (119909)
119889119909= minus119902ℎ(119909) (24)
The symbol ldquominusrdquo at the right side of (24) indicates thatfluidrsquos flow direction is opposite to the 119909 plane For the reser-voir with infinite outer boundary the boundary conditionscan be described as follows
lim119909rarrinfin
1199012
119908119891(119909) = 119901
2
119890
lim119909rarr0
1199012
119908119891(119909) = 119901
2
119908119891
(25)
Transforming the boundary condition as (25) shows intothat related to flow rate
lim119909rarrinfin
119889119876 (119909)
119889119909= 0
lim119909rarr0
119889119876 (119909)
119889119909= minus119869ℎ(1199012
119890minus 1199012
119908119891)
(26)
Typically the pressure gradient in the horizontal wellborecan be written as
1198891199012
119908119891(119909)
119889119909= 9066 times 10
minus12120582120574119892119885119879
11986351198762(119909) (27)
where 120582 is the friction coefficient119863 is the wellbore diameter120574119892is the gas relative density and 119876(119909) is the total rate at any
location of horizontal wellboreIn fully turbulent flow zone friction coefficient120582 is always
constant for a specific slotted liner or screen pipe
120582 =1
41198971198922 [120576 (37119863)] (28)
where 120576 is the wellbore coarse degree
23 Solution Method for Productivity Model Taking thederivative of (22) and (23) respectively
119889119902ℎ(119909)
119889119909+ 119869ℎ
1198891199012
119908119891(119909)
119889119909= 0 (29)
1198892119876 (119909)
1198891199092+119889119902ℎ(119909)
119889119909= 0 (30)
We can derive from (29) and (30) that
1198892119876 (119909)
1198891199092minus 119869ℎ
1198891199012
119908119891(119909)
119889119909= 0 (31)
Substituting (27) and (28) into (31) the following modelcan be obtained
1198892119876 (119909)
1198891199092minus 9066 times 10
minus20119869ℎ120582120574119892119885119879
11986351198762(119909) = 0 (32)
Combining boundary conditions (26) the analytic solu-tion when the HWrsquos length tends to reach infinity can be got
119876(119909) = 5556120583119892119863
120574119892
times [
[
radic1198621
6119909 + (radic
3
21198621
1198622)
minus13
]
]
minus2
(33)
6 Journal of Chemistry
0 100 200 300 400 500 600 700 800 900 100005
15
25
35
45
55
Any location along the horizontal section x (m)
Loca
l ski
n fa
ctor
S(x)
Kdh = 005mDKdh = 010mDKdh = 015mD
Kdh = 020mDKdh = 025mDKdh = 030mD
Figure 6 Effect of DZrsquos permeability (119870119889ℎ) on skin factor (119871 =
In (33) 119876(119909) indicates the total production that 119909 gt
1199091015840 where 1199091015840 means any location along the wellbore so the
production of HW can be described by
119876 = 119876(0) minus 119876(119871) (34)
Namely
119876 = 5556120583119892119863
120574119892
[radic3
21198621
1198622]
23
minus 5556120583119892119863
120574119892
[
[
radic1198621
6119871 + (radic
3
21198621
1198622)
minus13
]
]
minus2
(35)
3 Results and Discussion
31 Sensitivity Analysis on Skin Factor of Horizontal Well afterAcidizing Figure 6 shows the distribution of local skin factoralong the wellbore under different DZrsquos permeability FromFigure 6 we can obviously find that the local skin factordecreases from the heel to the toe meanwhile the localskin factor decreases as the permeability of DZ section isincreased but the tendency of increasing is not constant asFigure 6 shows Namely when the DZrsquos permeability is risingfrom 005mD to 010mD the local skin factorrsquos variationrange is about 16 but when theDZrsquos permeability is changingfrom 010mD to 030mD the local skin factor decreasesby only 1 which demonstrates that for the DZ with highpermeability it is difficult to obtain smaller skin factor soany other stimulation treatment must be taken to decreasethe skin factor
Figure 7 compares the distribution of local skin factorunder different mud immersionrsquos distance As is shown in
Figure 7 when themaximum andminimum distance of mudimmersion are rising from (12m 015m) to (16m 020m)respectively the local skin factor increases significantly butwhen they increase from (16m 020m) to (32m 040m)the local skin factorrsquos range of variation is less than the abovementioned case that is to say the local skin factor afteracidizing is increasing as the advancing of distance of mudimmersion but the tendency is changed gradually this showsthat if the DZ has a long distance of mud immersion nearthe wellbore the acidizing treatment has a small contributionto decrease the skin factor so an in-depth acidificationtechnology should be taken into account in order to increasethe distance of acid-rock reaction largely and improve the DZin the great degree
Figure 8 provides the comparison of distribution of localskin factor along the wellbore under different permeability ofAZAs demonstrated in Figure 8 the permeability of AZdoesnot change the distribution trend of local skin factor along thewellbore it also attains maximum at the heel while it attainsminimum at the toe When the permeability of AZ rangesfrom08mD to 10mD the local skin factor decreases sharplywhile from 10mD to 18mD the value of local skin factoronly has fewer changes namely the local skin factor decreasesby the increasing of permeability of AZ but the tendency ismore and more gentle so the conclusion can be drawn whenthe permeability of AZ reaches a certain extent if we wantto decrease the skin factor through increasing permeabilityof AZ it will have little contribution any other stimulationtreatments must be taken
Comparing the curves of distribution of local skin factorunder different distance of acid-rock reaction as illustrated inFigure 9 it is obvious to find that when the distance of acid-rock reaction ranged from (08m 010m) to (10m 0125m)
Journal of Chemistry 7
0 100 200 300 400 500 600 700 800 900 100015
2
25
3
35
4
Any location along the horizontal section x (m)
Loca
l ski
n fa
ctor
S(x)
Kah = 08mDKah = 10mDKah = 12mD
Kah = 14mDKah = 16mDKah = 18mD
Figure 8 Effect of AZrsquos permeability (119870119886ℎ) on skin factor (119871 =
respectively the local skin factor decreases sharply but whenthe distance of acid-rock reaction increases from (10m0125m) to (18m 0225m) the local skin factor only has asmall increase namely the local skin factor decreases by theincreasing of distance of acid-rock reaction but it will reacha constant when the distance has become a certain degreeso this will reveal that during HWrsquos acidizing treatmentreasonable acid type should be chosen which can not onlyincrease the distance of acid-rock reaction but also meet thedemand of economic benefit
0 100 200 300 400 500 600 700 800 900 10001
2
3
4
5
6
7
Prod
uctio
n-in
crea
sing
ratio
Horizontal well length L (m)
Kdh = 005mDKdh = 010mDKdh = 015mD
Kdh = 020mDKdh = 025mDKdh = 030mD
Figure 10 Effect of DZrsquos permeability (119870119889ℎ) on production-
119889Vmin = 02m 119886Vmax = 12m and 119886Vmin = 015m)
32 Sensitivity Analysis Study on Production-Increasing Ratioof Horizontal Well after Acidizing The relationship curvesbetween production-increasing ratio and HW length atdifferent DZrsquos permeabilities are calculated and presented inFigure 10 As is shown in Figure 10 when the DZrsquos perme-ability is constant the production-increasing ratio increasesas the HW length is increased but when the HW lengthreaches a certain extent the production-increasing ratiobecomes constant meanwhile the production-increasingratio decreases as the permeability of DZ is increased butthe tendency will become more and more gentle that isto say the lower the DZrsquos permeability is the higher theproduction-increasing ratio will be So when the distance ofmud immersion is constant if the permeability of DZ is lowthe acidizing effect will be better which is also the reasonwhyacidizing had been widely used in developing the gas and oilfield
Figure 11 shows the relationship between production-increasing ratio and HW length under different distances ofmud immersion From Figure 11 it is obvious to find that bythe increasing of distance ofmud immersion the production-increasing ratio decreases this is because when the distanceof acid-rock reaction is constant the deeper the distance ofmud immersion is the smaller the scale transformation willbe so for the HW with deep DZ acidizing treatment will beineffective and fracturing can be a good choice to stimulatewhich not only can improve the DZ to a great degree but alsocan increase the vertical permeability eventually improvingthe fluidity of oil near the wellbore
Figure 12 compares the relationship curves betweenproduction-increasing ratio and HW length under differentpermeability of AZ It illustrates that by the increasing ofpermeability of AZ the production-increasing ratio alsoincreases but the extent will be more and more gentleeventually tending to a constant value This is because whenthe permeability of DZ is constant if the permeability of AZ
119889Vmin = 02m 119886Vmax = 12m and 119886Vmin = 015m)
is higher it will indicate that acidizing fluid improves theDZ perfectly but when the permeability of AZ reaches highlevels the contribution of acidizing to production-increasingratio will become small so during application of acidizinga reasonable acid type and an acid concentration should betaken into account in order to get an optimal effect
Figure 13 compares the relationship curves betweenproduction-increasing ratio and HW length under differ-ent distances of acid-rock reaction As demonstrated inFigure 13 when the distance of mud immersion is constant
Figure 13 Effect of distance of acid-rock reaction (119886Vmax 119886Vmin)on production-increasing ratio (119871 = 1000m 119903
119908= 01m 120576 =
000016m 120574119892= 056 120583
119892= 0023mPasdots 119885 = 09 119879 = 366K
ℎ = 10m 119901119908119891
= 20MPa119870ℎ= 06mD119870V = 01mD119870
119886ℎ= 12mD
119870119889ℎ= 01mD 119889Vmax = 16m and 119889Vmin = 02m)
the production-increasing ratio increases sharply by theincreasing of distance of acid-rock reaction this is becausethe bigger the distance of acid-rock reaction is the greaterthe improvement degree (including DZ and no DZ) willbe eventually enhancing the production-increasing ratio Soduring acidizing of HW retarded acid will be a good choiceto increase the distance of acid-rock reaction and content tothe high permeability in AZ
4 Conclusions
The model for skin factor and productivity of HW afteracidizing is established and solved during which HW isdivided into many segments at any segment the methodof displacement between two similar flow modes is usedType curves of skin factor and production-increasing ratioare illustrated and the factors affecting skin factor andproduction-increasing ratio are analyzed Analysis resultsshow after acidizing as the increasing of the distance ofmud immersion local skin factor of HW increases whileas the increasing of DZrsquos permeability AZrsquos permeabilityand distance of acid-rock reaction it decreases production-increasing ratio increases as the increasing of HW lengthAZrsquos permeability and distance of acid-rock reaction while itdecreases as the increasing of DZrsquos permeability and distanceof mud immersion
Nomenclature
119886 Semimajor axis of elliptic drainage area m119886V Vertical radius of acidizing zone m
Journal of Chemistry 9
119886Vmax Vertical maximum distance of acid-rockreaction m
119886Vmin Vertical minimum distance of acid-rockreaction m
120573 Anisotropy coefficient119863 Wellbore diameter m119889ℎ Horizontal radius of damage zone m
119889V Vertical radius of damage zone m119889Vmax Vertical maximum distance of mud
immersion m119889Vmin Vertical minimum distance of mud
immersion m120582 Friction coefficient119867 Distance between two constant pressure
lines mℎ Gas reservoir thickness m119869ℎ Gas productivity index per unit
m3(dsdotMPasdotM)119870ℎ Permeability of formation mD
119870V Vertical permeability of gas reservoir mD119870119886V Vertical permeability of acidizing zone
mD119870119889V Vertical permeability of damage zone mD
119870119889ℎ Horizontal permeability of damage zone
mD119870119886ℎ Horizontal permeability of acidizing zone
mD119871 Horizontal well length m119901119890 Driving pressure of gas reservoir MPa
119901119889 Pressure of damage zonersquos boundary MPa
119901119908119891 Pressure of heel MPa
119901119908119891(119909) Pressure at any location along the
wellbore MPaΦ119889 Potential in the damage zonersquos boundary
10minus6m2s
Φ1 Potential in constant pressure boundary
10minus6m2s
Δ119901119904 Pressure drop caused by skin factor MPa
Δ119901 Production pressure drop of vertical wellMPa
119902ℎ Production of per unit length m3d
119902119904119888 Production of horizontal gas well m3d
119876 Production of horizontal well m3d119903119908 Wellbore radius m
119878 Skin factor of vertical well119878(119909) Local skin factor of horizontal well119878119890119902 Total skin factor of horizontal well
120574119892 Gas relative density
120576 Wellbore coarse degree m119879 Gas reservoir temperature K120583119892 Gas viscosity mPasdots
119885 Gas deviation factor
Conflict of Interests
The authors declare that there is no conflict of interestsregarding the publication of this paper
Acknowledgments
The authors are grateful for financial support from theNational Science Fund for Distinguished Young Scholars ofChina (Grant no 51125019) and the 2014 Australia ChinaNat-ural Gas Technology Partnership Fund TopUp Scholarships
References
[1] T P Frick and M J Economides ldquoHorizontal well damagecharacterization and removalrdquo SPE Production amp Facilities vol8 no 1 pp 15ndash22 1993
[2] P Permadi and W Wibowo ldquoEffects of non-uniform skinfactor distribution on horizontal well inflow performancerdquo inProceedings of SPE European Damage Conference pp 1ndash6 2001
[3] K Furui D Zhu and A D Hill ldquoA rigorous formation damageskin factor and reservoir inflow model for a horizontal wellrdquoSPE Production amp Facilities vol 18 no 3 pp 151ndash157 2003
[4] T Yildiz ldquoDiscussion of lsquoA rigorous formation damage skinfactor and reservoir inflow model for a horizontal wellrsquordquo SPEProduction amp Facilities vol 19 no 2 pp 105ndash106 2004
[5] K Furui D Zhu and A D Hill ldquoAuthorsrsquo reply to lsquoDiscussionof a rigorous formation damage skin factor and reservoir inflowmodel for a horizontal wellrsquordquo SPE Production amp Facilities vol 19no 2 pp 107ndash108 2004
[6] S Parn-anurak and T W Engler ldquoModeling of fluid filtrationand near-wellbore damage along a horizontal wellrdquo Journal ofPetroleum Science and Engineering vol 46 no 3 pp 149ndash1602005
[7] Y Ye J Yan S Zou S Wang and R Lu ldquoA new laboratorymethod for evaluating formation damage in fractured carbon-ate reservoirsrdquo Petroleum Science vol 5 no 1 pp 45ndash51 2008
[8] J Cai B Yu M Zou and M Mei ldquoFractal analysis ofinvasion depth of extraneous fluids in porous mediardquo ChemicalEngineering Science vol 65 no 18 pp 5178ndash5186 2010
[9] J Cai and B Yu ldquoA discussion of the effect of tortuosity onthe capillary imbibition in porous mediardquo Transport in PorousMedia vol 89 no 2 pp 251ndash263 2011
[10] J Cai E Perfect C-L Cheng and X Hu ldquoGeneralizedmodeling of spontaneous imbibition based on hagen-poiseuilleflow in tortuous capillaries with variably shaped aperturesrdquoLangmuir vol 30 no 18 pp 5142ndash5151 2014
[11] X H Tan and X P Li ldquoTransient flow model and pressuredynamic features of tree-shaped fractal reservoirsrdquo Journal ofHydrodynamics B vol 26 no 4 pp 654ndash663 2014
[12] X H Tan X P Li L H Zhang et al ldquoAnalysis of transientflow and starting pressure gradient of power-law fluid in fractalporous mediardquo International Journal of Modern Physics C vol26 no 4 Article ID 1550045 2015
[13] X-H Tan X-P Li J-Y Liu G-D Zhang and L-H ZhangldquoAnalysis of permeability for transient two-phase flow in fractalporous mediardquo Journal of Applied Physics vol 115 no 11 ArticleID 113502 2014
[14] T Yildiz ldquoEquivalent skin factor for non-uniformly damagehorizontal and multilateral wellsrdquo in Proceedings of SPE AnnualTechnical Conference and Exhibition pp 1ndash17 2008
[15] I V Voronich L A Gaidukov and N N Mikhailov ldquoFluidfiltration to a horizontal well with variation in the parametersof the damage zonerdquo Journal of AppliedMechanics and TechnicalPhysics vol 52 no 4 pp 608ndash614 2011
10 Journal of Chemistry
[16] L You K Xue Y Kang Y Liao and L Kong ldquoPore structureand limit pressure of gas slippage effect in tight sandstonerdquoTheScientific World Journal vol 2013 Article ID 572140 7 pages2013
[17] R-S Nie Y-L Jia Y-F Meng Y-HWang J-M Yuan andW-F Xu ldquoNew type curves formodeling productivity of horizontalwell with negative skin factorsrdquo SPE Reservoir Evaluation ampEngineering vol 15 no 4 pp 486ndash497 2012
[18] Y An and X Wu ldquoProductivity prediction model for complexwells with damage to producing formationrdquo Chemistry andTechnology of Fuels and Oils vol 50 no 2 pp 160ndash164 2014
[19] M Yadav S Kumar and P N Yadav ldquoDevelopment ofecofriendly corrosion inhibitors for application in acidizationof petroleum oil wellrdquo Journal of Chemistry vol 2013 ArticleID 618684 9 pages 2013
[20] Y-H Cai and W Luo ldquoPreparation of schiff base derivedfrom 34-dimethoxybenzaldehyde and p-aminobenzoic acid bysupersonic speed gas impacting methodrdquo Journal of Chemistryvol 2014 Article ID 218376 5 pages 2014
[21] E P da Motta A D Hill and K Sepehrnoori ldquoSelective matrixacidizing of horizontal wellsrdquo Journal of Canadian PetroleumTechnology vol 36 no 5 pp 43ndash52 1997
[22] M Muskat ldquoThe flow of homogeneous fluid through porousmediardquo Soil Science vol 46 no 2 p 169 1938
[23] M F Hawkins Jr ldquoA note on the skin effectrdquo Journal ofPetroleum Technology vol 8 no 12 pp 65ndash66 2013
[24] S D Joshi ldquoAugmentation of well productivity with slant andhorizontal wellsrdquo Journal of Petroleum Technology vol 40 no6 pp 729ndash739 1988
[25] B J Dikken ldquoPressure drop in horizontal wells and its effect onproduction performancerdquo Journal of Petroleum Technology vol42 no 11 pp 1426ndash1433 1990
[26] M Ihara J P Brill and O Shoham ldquoExperimental and theo-retical investigation of two-phase flow in horizontal wellsrdquoin Proceedings of the SPE Annual Technical Conference andExhibition pp 57ndash69 October 1992
[27] E Ozkan C Sarica M Haciislamoglu and R RaghavanldquoEffect of conductivity on horizontal-well pressure-behaviorrdquoSPE Advanced Technology Series vol 3 no 1 pp 85ndash94 1995
[28] V R Penmatcha S Arbabi and K Aziz ldquoEffects of pressuredrop in horizontal wells and optimumwell lengthrdquo SPE Journalvol 4 no 3 pp 215ndash221 1999
[29] E Ozkan ldquoInfluence of pressure drop along the wellbore onhorizontal-well productivityrdquo SPE Journal vol 4 no 3 pp 288ndash301 1999
[30] Q Zhang Z M Wang X Q Wang and J Yang ldquoA newcomprehensive model for predicting the pressure drop offlow in the horizontal wellborerdquo Journal of Energy ResourcesTechnology vol 136 no 4 pp 1ndash9 2014