Hindawi Publishing CorporationAdvances in Artificial Neural SystemsVolume 2013 Article ID 972412 11 pageshttpdxdoiorg1011552013972412
Research ArticleThe Classification of Valid and Invalid Beats ofThree-Dimensional Nystagmus Eye Movement Signals UsingMachine Learning Methods
Martti Juhola1 Heikki Aalto2 Henry Joutsijoki1 and Timo P Hirvonen2
1 Computer Science School of Information Sciences University of Tampere 33014 Tampere Finland2Department of Otorhinolaryngology amp Head and Neck Surgery University of Helsinki and Helsinki University Central HospitalHUS 00029 Helsinki Finland
Correspondence should be addressed to Martti Juhola marttijuholasisutafi
Received 30 June 2013 Revised 27 September 2013 Accepted 18 October 2013
Academic Editor Christian Mayr
Copyright copy 2013 Martti Juhola et al This is an open access article distributed under the Creative Commons Attribution Licensewhich permits unrestricted use distribution and reproduction in any medium provided the original work is properly cited
Nystagmus recordings frequently include eye blinks noise or other corrupted segments that with the exception of noise cannot bedampened by filtering Wemeasured the spontaneous nystagmus of 107 otoneurological patients to form a training set for machinelearning-based classifiers to assess and separate valid nystagmus beats from artefacts Video-oculography was used to record three-dimensional nystagmus signals Firstly a procedure was implemented to accept or reject nystagmus beats according to the limits fornystagmus variables Secondly an expert perused all nystagmus beats manually Thirdly both the machine and the manual resultswere united to form the third variation of the training set for the machine learning-based classification This improved accuracyresults in classification high accuracy values of up to 89 were obtained
1 Introduction
Nystagmus is a repetitive reflexive eyemovement thatmay becongenital induced physiologically by vestibular or optoki-netic stimuli or occur spontaneously in vestibular patientsIt is formed by to-and-fro saw tooth-like beats that can berecorded in the horizontal vertical and torsional directionsOlder recording techniques such as electrooculography(EOG) recorded only horizontal and vertical movementsVideo-oculography (VOG) using two small video camerasone for each eye also enables the recording of torsionalmove-ments A nystagmus beat contains a slow phase followed bya shorter fast phase that returns the eyes in the oppositedirection (Figure 1) Nystagmus beats are repetitive but theirconfiguration changes often in the course of even a shortmeasurement
For the analysis of nystagmus signals it is important todistinguish slow and fast phases and separate noisy orcorrupted signal locations so that they do not impair valuesof the nystagmus variables to be computed The slow phasecharacteristics are significant for the diagnostics of vestibular
neuritis positional vertigo acoustic neuroma and Menierersquosdisease and the fast phases returning the eyes to the centreare of central origin (the brain) Our present data consists of107 otoneurological patientswith spontaneous nystagmus forwhom the velocity and direction of the slow phase is themostimportant part
Several detection methods have been published for nys-tagmus signal analysis since the 1970s [1ndash12] One of theresearch details designed has been to detect nystagmus beatsas accurately as possible Most of the designs have requiredmore or less the control of a user Typically they have beenon the basis of the use of nystagmus direction and especiallyvelocity derived as an approximation of the first derivative ofa positional nystagmus signal The direction or sign of veloc-ity changes at the beginning and end of a slow or fast phaseThe direction of nystagmus beats defined as the velocity oftheir fast phases is normally constant but may infrequentlychange The directions are left and right for horizontal upand down for vertical and clockwise and anticlockwise fortorsional eye movements
2 Advances in Artificial Neural Systems
AmplitudeAmplitude
Duration Duration
Slow phaseFast
phaseA
mpl
itude
(∘)
as
Time (s)
ae
af
x(e)
x(f)x(s)
(a)
Actual slow phase
Actual fast phase
AmplitudeAmplitude
Duration Duration
Slow phaseFast
phase
as
ae
af
x(e)
x(f)x(s)
y = line between x(s) and x(f)
(b)
Figure 1 (a) A nystagmus beat from an ideal eye movement signal including no noise or corruptions contains a slow phase immediatelyfollowed by its shorter fast phaseTheir amplitudes and durations are basic nystagmus variables Durations are computed from the beginnings119909(119904) and 119909(119891) of slow and fast phases and the end 119909(119890) Amplitudes are the differences from 119886
119904 119886119891 and 119886
119890 (b) The example shows a more
realistic nystagmus beat including slightly less smooth nystagmus phases
Filtering thresholds and the estimated functional rela-tion between slow and fast phases of nystagmus beats (Figure1) were applied to recognize the difference between slow andfast phases [1]The authors in [1] also applied their functionalbroken line relation to detect rapid eye movements saccades(as extraneous voluntary movements not fast phases ofnystagmus) and eye blinks present in signals as strong peakartefacts provided that these were in the same direction asthe slow phases of a nystagmus signal The detection ofminimumandmaximum locations within a window of presetwidth was applied to find the beginnings and ends of slowand fast phases [2]The authors constructed a spike detectionalgorithm also usable for extraneous saccades but since thiscomputed the mean square error between eye movement andstimulation signals such a procedure would not be possiblefor our spontaneous nystagmus without any stimulation sig-nal Furthermore a procedure based on velocity thresholdswas presented in which noise was dampened with low-passfiltering but no specific artefact or saccade detection wasintroduced [3] In some earlier studies we applied filteringand syntactic recognition methods to both detecting nystag-mus beats and eliminating extraneous saccades and artefactsat the same time [4 5] Amethodwas introduced on the basisof filtering and wavelet processing to separate slow phasesfrom fast phases [6] but problems caused by noise artefactsand saccades were not considered
Optokinetic nystagmuswas studied by using chaos theory[7] to detect nystagmus beats The method was describedas being tolerant of noise but the noise tests were limitedto sheer simulated Gaussian noise to the nystagmus signalsA study of congenital nystagmus in infants was performedin which waveforms of different nystagmus beats were anal-ysed [8] but the procedure for the computer analysis wasnot described Congenital nystagmus containing waveformanalysis was also studied in [9] for both children and adultsby applying time-frequency analysis with the fast Fouriertransform The influence of blinking artefacts was identifiedalong with their narrow frequency band in the spectrum
Wavelet analysis was used for nystagmus signals [10] Severalfilters were used with a threshold to detect fast phases ofnystagmus in electrooculographic signals [11] The analysisof three-dimensional nystagmus signals has been describedrecently for example in [12]
Most previous studies using the EOG technique haveapplied one-dimensional (horizontal) or two-dimensional(horizontal and vertical) directions only because the tor-sional direction can be recorded only with the magneticscleral coil technique and by some VOG techniques Theearlier technique used was frequently EOG The majority ofnystagmus signal algorithms have considered the detectionof nystagmus beats as a phenomenon but not specificallythe classification of valid beats from noisy corrupted beatsor ldquodisinformationrdquo without any actual beats Recently weintroduced an algorithm for three-dimensional nystagmussignals [13] and also dealt with the preceding problem In thepresent research we concentrated on this classification topicin order to design a method based on machine learning Theidea was to utilize a dataset of accepted and rejected nystag-mus beat candidates detected from nystagmus signals eithermanually or with a selection algorithm and to enable reliableclassification of nystagmus beats by combining this selectioninformation collected in both manners
We present the average values of accepted and rejectednystagmus beat candidates of several nystagmus variablesto demonstrate how they differ in the dataset collectedIn addition we studied which variables best separate theaccepted and the rejected nystagmus beats in the datasetmeasured This is useful since some poor variables in thisrespect might be abandoned in future research if they donot provide useful information for medicine Variable orfeature evaluation and selection is an important phase in dataanalysis as in for example [14 15] because it is necessaryto find which variables most affect classification and alsothose which are less influential If there are a particularlylarge number of variables variable selection is importantSometimes leaving out poor variables may also improveclassification results somewhat
Advances in Artificial Neural Systems 3
Table 1 Nystagmus variables defined with symbols given in Figure 1 In the variable names 119904119901 and 119891119901 are slow and fast phases of nystagmus119886 refers to amplitude 119889 duration V mean velocity 119888 correlation 119898V maximum velocity 119902 quality signal and subscripts ℎ V and 119905 indicatehorizontal vertical and torsional components
Variables Name Definition119904119901119886ℎ 119904119901119886V 119904119901119886119905 Amplitudes of slow phase
Duration of slow phase (119909(119891) minus 119909(119904)) 119891119903 (119891119903 sampling frequency)119891119901119889ℎ
Duration of fast phase (119909(119890) minus 119909(119891)) 119891119903 (119891119903 sampling frequency)119904119901119907ℎ 119904119901VV 119904119901119907119905 Mean velocity of slow phase Slope computed with linear regression from samples of 119909(119904) 119909(119904 + 1) 119909(119891)
119891119901119907ℎ 119891119901119907V 119891119901119907119905 Mean velocity of fast phase
Slope computed with linear regression from samples of 119909(119891) 119909(119891 + 1) 119909(119890)and
119910(119904) 119910(119904 + 1) 119910(119891) (see Figure 1(b))
119904119901119888ℎ 119904119901119888V 119904119901119888119905 Correlations of slow phase
correlation coefficient between samples of119909(119904) 119909(119904 + 1) 119909(119891) and
Slopes 119911(119894) with linear regression from samples of119909(119894 minus 2) 119909(119891 minus 1) 119909(119894) 119909(119894 + 1) 119909(119894 + 2) and
119910(119894 minus 2) 119910(119891 minus 1) 119910(119894) 119910(119894 + 1) 119910(119894 + 2) 119894 = 119891 + 2 119890 minus 2 and then by takingmax
119894isin119891+2119890minus2
119911(119894) (Figure 1(b))
119902119905
Mean of torsional qualityvalues Mean of quality values during slow phase of interval [s f ] (Figure 1(b))
2 Eye Movement Data
We measured nystagmus signals from 107 otoneurologicalpatients (mean age approximately 50 years) suffering mainlyfrom acute unilateral peripheral loss of vestibular func-tion (vestibular neuritis or having had surgery for acousticneuroma)
An alert subject was seated in a fixed chair and instructednot to move his or her head during the measurement Atfirst a calibration measurement was performed by asking asubject to look alternately at nine dots situated symmetricallyon a wall in the visual field Actual nystagmus measurementswere run with the eyes covered in the dimmed stationarylaboratory by applying an eye movement tracking system oftwo video cameras one for each eye (SensoMotoric Instru-ments Berlin Germany) The video camera systems appliedto eye movement studies include a built-in image processingprogram to recognize the pupil in each image in order tomeasure horizontal and vertical eye movements Using theangles of the iris between successive images torsional eyemovements can be computed The appropriate measuringcircumstances enabled the lack of gaze fixation that wasimportant to obtain the best nystagmus eye movementsEach measurement took 30 seconds This short durationwas normally sufficient to include 20ndash80 nystagmus beatsand was preferred to avoid subject fatigue Nystagmus wasspontaneous for some patients while for other cases rapidhorizontal head shaking was used to generate head-shakingnystagmusThe sampling frequency was 50HzThe horizon-tal and vertical amplitude resolutions of the camera systemwere 005∘ and that of the torsional direction was 01∘
The eye movement tracking system gave several signalsas its outputs For each eye the outputs utilised were three-dimensional signals of eye movements horizontal vertical
and torsional In addition we employed the torsional qualitysignals of both eyes that included values from an interval of[0 1] the higher the value the better the quality of torsionalsignal The system estimated noise here and noisy torsionalsignal segments could be detected with these quality signalsIn the subsequent description three-dimensional signals aregiven as three one-dimensional signals in order to express andvisualize the nystagmus beats clearly
3 Computation Methods
The method used for the detection of nystagmus beatsfollowed our previous publication [13]with aminor extensionand modification The principle of the method was to applyangular velocity for the recognition of beginnings and ends ofnystagmus beats and to reject nystagmus beat candidates thatwere clearly outliers or corrupted by noise In the followingsection we describe how a method based on classificationwas formed to improve the separation of valid and poornystagmus beat candidates
For the classification of nystagmus beat candidates weused the nystagmus variables explained below (see also theprecise definitions of the variables in Table 1) Please notethat some of the variables are probably not interesting formedical diagnostic purposes Nevertheless they could beuseful simply for classification First after the detection ofa signalrsquos nystagmus beat candidates variable values werecomputed for every nystagmus beat candidateThe first threevariables were the slow phase amplitudes of the horizontalvertical and torsional components
Second the duration of a horizontal slow phase wascomputed These basic variables are illustrated in Figure 1(a)Third the mean angular velocities of the slow phases ofthe three components were estimated by means of linear
4 Advances in Artificial Neural Systems
regression between the locations of the beginning and endof a nystagmus beat candidate (Figure 1(b)) The slope givenby linear regression is directly equal to the mean velocitybetween two locations Fourth the amplitudes of horizontalvertical and torsional components of the fast phases werecalculated Fifth the duration of a horizontal fast phase wascomputed
Sixth the mean velocities of the three components ofthe fast phases were estimated using linear regression Sucha slope value given by linear regression directly estimatesthe first derivative that is angular velocity It is good toremember that not all nystagmus signal types are as close tolinear as the slow and fast phases of vestibular nystagmusThus for other nystagmus types the variables used should bemodified
Seventh mean torsional quality during a slow phase wascomputed Eighth correlation between an ldquoideal slow phaserdquoand that of an actual signal part was estimated An ideal slowphase corresponds to that illustrated in Figure 1(b) wherethere is a line between the beginning and end of the slowphase of a nystagmus beat In an actual slow phase there issome noise or other nonlinearity between those locations inthe slow phase This deviation was estimated by computing aPearson correlation coefficient between the ideal and actualslow phases The nearer the (absolute) correlation coefficientto 1 the better the slow phase and the nearer to 0 the poorerthe slow phase
Ninth the maximum velocity of a horizontal fast phasewas computed using successive segments of 5 samplesthrough a fast phase The horizontal component was empha-sized compared with the others since frequently (at least inthe present data) it is dominant compared with the othercomponents its amplitude and velocity values are greater Intotal there were 19 variables for the classification of nystag-mus candidates
To form training and test data for classification weused all nystagmus beat candidates found by the recognitionprogram We sorted nystagmus candidates to be either validor invalid at first manually and secondly with the proceduregiven in the following sectionManual selectionwas executedindependently of the automatic selection At first the bettereye signal from those of the left and right eye was chosenby computing the mean of torsional quality values throughthe whole signal and selecting the eye with a higher mean InFigures 2ndash4 there are 10-second long examples in which theeye movement signal used (left or right) is also given
31 Selection Procedure for Nystagmus Candidates The fol-lowing selection criteria were computed for every nystagmusbeat candidate to label them either accepted or rejected
(1) The mean of torsional quality values were computedfor successive signal segments of 2 seconds includingat least one [13] beat candidate If the mean torsionalquality of such a segment was low below 02ndash04depending on the mean of the whole signal that seg-ment was rejected Usually such a segment includedabundant spikes such as a few probable dropoutsfrom the video images in Figure 4 Torsional quality
0 50 100 150 200 250 300 350 400 450 500
0
1
2
3
4Left eye
(1)
(2)
minus4
minus3
minus2
minus1Am
plitu
de(∘
)
Figure 2 Abnormally slow (1) and fast (2) segments of horizontal(blue or uppermost) slow phases compared with the surroundingvalid nystagmus beats
0 50 100 150 200 250 300 350 400 450 500
0
2
4
6
8
10
12
Samples
Right eye
(1) (2)
minus2
Am
plitu
de(∘
)
Figure 3 Abrupt upward ldquostepsrdquo (1) and (2) in the horizontal (blueor uppermost) and torsional (red or lowest) signals are obviouslyrapid voluntary eye movements (saccades) which would distort theslow phase velocities of two nystagmus beats
values given by the recording system are in the range[0 1]
(2) A lower lb and upper bound ub were computed formean slow phase velocities of all nystagmus can-didates according to their means 120583
119894and standard
deviations 120590119894for the three components 119894 = ℎ V 119905
(horizontal vertical and torsional)
lb = 120583119894minus 196120590
119894
ub = max 120583119894+ 196120590
119894 119904119901Vmax
(1)
In principle this would prune 25 of nystagmus beatcandidates from each end of the distribution if the
Advances in Artificial Neural Systems 5
0 50 100 150 200 250 300 350 400 450 500
0
5
10
15
20
Samples
Right eye
(3) (4)
minus20
minus15
minus10
minus5Am
plitu
de(∘
)
(1) (2)
Figure 4Deflection (1) could be a small saccade (2) is noise and (3)and (4) could be caused by short periodswhen the image recognitionprocedure of the eye movement camera lost the image of the pupilDistortion (1) only occurred in the horizontal (blue or uppermost)signal but (2) (3) and (4) were also present in the vertical (green ormiddle) and torsional (red or lowest) signals
distribution were normal In addition an absolutemaximum of 119904119901Vmax = 75
∘
s was used to leaveout extraordinarily high mean velocities that wereprobably high peaks for example eye blinks Thismaximum was chosen on the basis of the data usedNote that a nystagmus beat is rejected if even oneof the three component values is unacceptable Thiscondition could affect the rejections of locations (2)(3) and (4) in Figure 4
(3) Any occasional beat in the opposite direction frombeats before it or after it was rejected Infrequentlythe direction of nystagmus may change during therecording period of a nystagmus signal The ldquocor-rectrdquo direction was then decided by the majority ofcandidates and those in the opposite direction wererejected
(4) Nystagmus candidates with higher torsional ampli-tudes than 119886
119905= 15∘
s were rejected since this wasseen as the physiological limit for torsional rotationsof the eye This could yield rejections because of thetorsional spikes (4) in Figure 4 These spikes werenot actual eye movements but disturbances of theeye movement tracking system Obviously the videocamera system has failed to analyse the images for ashort period resulting in video dropouts
(5) Nystagmus candidates with shorter durations of slowphases than 119904119901119889min = 0080 s (4 sampling intervals for50Hz) were rejected as improbable nystagmus beatsThis lower bound was found experimentally earlier[16]
(6) The fast phase of a nystagmus beat immediatelyfollows its slow phase to turn the eyes in the opposite
direction For values of the horizontal fast phase thevelocity maximum 119891119901Vmax = 400
∘
s estimated earlier[16] was used to reject the corresponding nystagmuscandidate Usually noise spikes are steep generatinghigh velocity values higher than 119891119901Vmax and are notrelated to actual eye movements
(7) Noisiness during a slow phase segment was assessedby applying the correlation coefficient as describedabove If a horizontal vertical or torsional com-ponent was less than the bound 119904119901V119888min = 05derived experimentally the nystagmus candidate wasomitted This cleaning often discarded candidatessuch as a ldquoplainrdquo (1) or ldquostepsrdquo (2) in Figure 2 or (1) and(2) in Figure 3 from among valid nystagmus beats Inaddition horizontal deflection (1) in Figure 4 couldbe identified on the basis of the present condition
In addition to themanual and automatic selections of nys-tagmus beat candidates we combined the above mentionedto study whether this would improve later classificationresultsThus in the thirdmode the accepted nystagmus beatswere formed taking those that were accepted by both manualand automatic selections Those that were rejected by eitheror both were considered rejected
The entire data collected seemed to be rather overlappingsubject to variable values of the accepted and rejected nystag-mus candidates In other words some values of rejected caseswere close to those accepted by the same variable (see meansand standard deviations given in Table 2) This is dealt within more detail in the following section
Properties (variable values) of valid nystagmus beatscan vary considerably between subjects Even within anindividual signal nystagmus beats may change in the courseof a short recording time The frequency of nystagmus beats(number of beats per second)may vary considerably betweensubjects Consequently relatively rapid mean velocity valuesof slow phases of one subject might be rejected for anothersubject that hadmuch smaller mean velocity valuesThus wedesigned a straightforward cleaning procedure to delete somerejected nystagmus candidates from the dataset to be usedbecause there were more rejected than accepted candidatesMoreover this action also equalized their numbers This cansometimes be useful for some classification algorithms asthe two classes of a classification task are of roughly equalsize First we computed the centres of both classes (theaccepted and rejected) in the 19-dimensional Euclideanvariable spaceThen we discarded one by one those rejectednystagmus candidates that were the closest to the centreof the accepted candidates This procedure slowly cleanedout rejected nystagmus candidates between the class centresby reducing the sphere of influence around the class centreof the rejected candidates and those not yet rejected Inprinciple this separated the two classes slightly from eachotherDeletionsweremade until the classeswere of equal sizeThe cleaning procedure was carried out for all three selectionmodesmanual automatic and both Since the three selectionmodes were also performed without a cleaning procedurethere were six different test setups altogether
6 Advances in Artificial Neural Systems
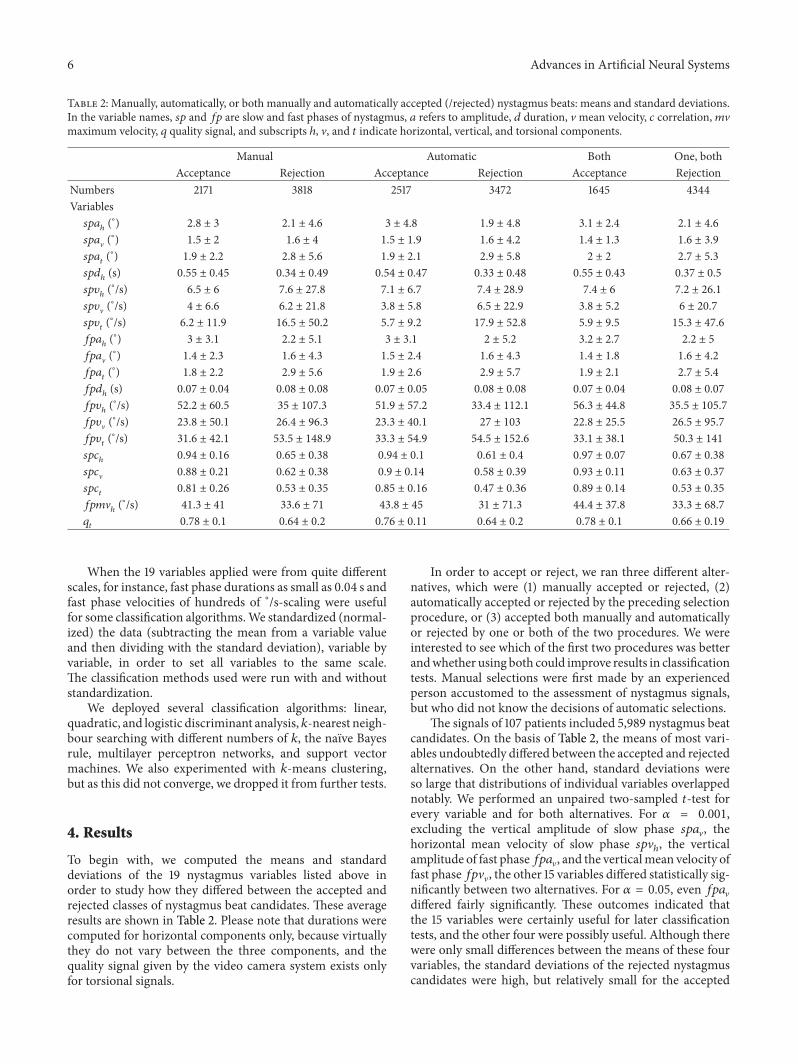
Table 2 Manually automatically or both manually and automatically accepted (rejected) nystagmus beats means and standard deviationsIn the variable names 119904119901 and 119891119901 are slow and fast phases of nystagmus 119886 refers to amplitude 119889 duration Vmean velocity 119888 correlation 119898Vmaximum velocity 119902 quality signal and subscripts ℎ V and 119905 indicate horizontal vertical and torsional components
Manual Automatic Both One bothAcceptance Rejection Acceptance Rejection Acceptance Rejection
When the 19 variables applied were from quite differentscales for instance fast phase durations as small as 004 s andfast phase velocities of hundreds of ∘s-scaling were usefulfor some classification algorithmsWe standardized (normal-ized) the data (subtracting the mean from a variable valueand then dividing with the standard deviation) variable byvariable in order to set all variables to the same scaleThe classification methods used were run with and withoutstandardization
We deployed several classification algorithms linearquadratic and logistic discriminant analysis 119896-nearest neigh-bour searching with different numbers of 119896 the naıve Bayesrule multilayer perceptron networks and support vectormachines We also experimented with 119896-means clusteringbut as this did not converge we dropped it from further tests
4 Results
To begin with we computed the means and standarddeviations of the 19 nystagmus variables listed above inorder to study how they differed between the accepted andrejected classes of nystagmus beat candidates These averageresults are shown in Table 2 Please note that durations werecomputed for horizontal components only because virtuallythey do not vary between the three components and thequality signal given by the video camera system exists onlyfor torsional signals
In order to accept or reject we ran three different alter-natives which were (1) manually accepted or rejected (2)automatically accepted or rejected by the preceding selectionprocedure or (3) accepted both manually and automaticallyor rejected by one or both of the two procedures We wereinterested to see which of the first two procedures was betterandwhether using both could improve results in classificationtests Manual selections were first made by an experiencedperson accustomed to the assessment of nystagmus signalsbut who did not know the decisions of automatic selections
The signals of 107 patients included 5989 nystagmus beatcandidates On the basis of Table 2 the means of most vari-ables undoubtedly differed between the accepted and rejectedalternatives On the other hand standard deviations wereso large that distributions of individual variables overlappednotably We performed an unpaired two-sampled 119905-test forevery variable and for both alternatives For 120572 = 0001excluding the vertical amplitude of slow phase 119904119901119886V thehorizontal mean velocity of slow phase 119904119901V
ℎ the vertical
amplitude of fast phase119891119901119886V and the verticalmean velocity offast phase119891119901VV the other 15 variables differed statistically sig-nificantly between two alternatives For 120572 = 005 even 119891119901119886Vdiffered fairly significantly These outcomes indicated thatthe 15 variables were certainly useful for later classificationtests and the other four were possibly useful Although therewere only small differences between the means of these fourvariables the standard deviations of the rejected nystagmuscandidates were high but relatively small for the accepted
Figure 5 Separation power values given by the Scatter methodThehigher the value of a variable the better the classification Variables(1)ndash(19) are in the same order as in Tables 1ndash3 119904119901119886
onesThe underlying property seemed to be that the subset ofthe accepted nystagmus candidates was faintly compact butthe subset of the rejected dispersed strongly
In order to study the importance of the 19 variables forclassification we applied our Scatter method [17 18] whichruns a nearest neighbour search in a dataset from a sample toits nearest neighbour sample according to Euclidean distancethroughout the whole set and counts how many changesbetween classes (the accepted and rejected) have occurredThe fewer class changes that are encountered the morecompact the classes that is they are probablymore separableThe more class changes that are detected the worse theseparable the classesThe Scattermethod gave us values calledseparation powers the larger the value the more separablethe classes Figure 5 includes the results for the acceptednystagmus beats only because those of the rejected were verysimilar Calculating the average of the separation powers ofthe three different selections used for each variable showsthat the most important variables with the highest separationpowers for classification were in descending order (17) 119904119901119888
119905
(15) 119904119901119888ℎ (12) 119891119901V
ℎ (16) 119904119901119888V (1) 119904119901119886ℎ (4) 119904119901119889ℎ and (8) 119891119901119886ℎ
Correspondingly the least important were in ascendingorder (10)119891119901119886
Among the poorest there were (3) (9) (2) and (13) that isthose four given by the 119905 test to have statistically insignificantdifferences ((9) with 120572 = 001 only) Since separation powersbetween the best variable (17) and the worst variable (10) didnot differ greatly and that of (10) as the worst of all was notrelatively close to 0 in comparison to the other variables wekept all variables for further analysis
As explained in the preceding section we executed alltests with three selection modes manual automatic andboth Each of these was performed either with or withoutthe cleaning of rejected nystagmus candidates as possibleoutliers Furthermore six combinations were run either with
or without standardization of the whole dataset variableby variable as the preprocessing stage before classificationIn addition to linear quadratic and logistic discriminantanalysis we exploited 119896-nearest neighbour searching with 119896equal to 1 3 5 11 15 21 25 45 and 65 and the naıve Bayesrule classification We ran the same tests with multilayerperceptron networks with 19 inputs and 6 hidden and 2output nodes and used the Levenberg-Marquardt trainingalgorithm
Finally we tested with support vector machines by apply-ing three different kernel functions as reported in Table 3 inorder to search for the best regulation parameter values Forthe linear and quadratic kernels 20 box constraint valuesfrom the set of 05 10 15 10 were employed For theradial basis kernel 20 times 20 = 400 pairs of parameter valueswere explored as Cartesian products of box constraint andstandard deviation 120590 each from 05 10 15 10 Theseresultswere computedwithout standardization of the variablevalues
Linear quadratic and logistic discriminant analysis andthe naıve Bayes rule are insensitive to data standardizationgiving identical values independent of whether standard-ization is made or not Meanwhile 119896-nearest neighboursearching was sensitive to data standardization Thus theresults of the better alternative of each classification methodare only given in Figure 6 Since the runs with 119896 equal to 511 and 15 generated results a few per cent better than thoseof smaller 119896 and around 1 better than those of greater 119896values results of 119896 equal to 15 are only depicted in Figure 6As usual accuracies in percentages were computed as theratio between the sum of true positive and true negativeclassification outcomes and the number of all 119899 tested cases
We applied the leave-one-out method for training andtesting in which 119899 minus 1 cases were used for a training set and 1as the only test case and then we repeated this for each caseTherefore there were 5889 tests for dataset variations (1) (3)and (5) and after cleaning 4342 for (2) 5034 for (4) and3290 for (6) in Figure 6 For (2) (4) and (6) the originallylarger class of the rejected nystagmus candidates was cleaned(balanced) to be of equal size according to the smaller class ofthe accepted nystagmus candidates
The results in Figure 6 show how cleaning improved theaccuracies of the linear and quadratic discriminant analysismethods by 2ndash7 but strongly decreased those of theother methods even from 80ndash90 down to 40 of correctclassifications Results of the support vector machines areshown in Figure 7 Cleaning improved the results that weregenerally among the best The quadratic kernel was the bestof the three kernels
It was a surprising result that data cleaning impairedthe results of other methods so much other than linear andquadratic discriminant analysis and support vectormachinesWe therefore studied the data in more detail We calculatedthe means and the standard deviations of the reduced setsof the rejected nystagmus candidates after cleaning the dataaccording to the threemethods described aboveThese resultsare presented in Table 4 Comparing the values of its threecolumns to those corresponding to Table 2 it can be seenthat there are differences in the means among the rejected
8 Advances in Artificial Neural Systems
Table 3 The parameter values for the kernel functions that produced the best classification results with support vector machines
Linear kernelbox constraint
Quadratic kernelbox constraint
Radial basis functionbox constraint and 120590
Manual selection 05 95 25 05Manual selection with cleaning 35 05 30 100Automatic selection 75 35 85 05Automatic selection with cleaning 25 80 65 100Both manual and automatic selections 15 10 05 05Both selections with cleaning 10 05 75 100
0102030405060708090
100
1 2 3 4 5 6Data set variations
Linear discriminantQuadratic discriminant
BayesLogistic discriminantMultilayer perceptron
Accu
racy
()
15 nn standardized
Figure 6 Classification results of the different methods used(nn is the nearest neighbour) as accuracies (as percentages) withdataset variations (1) manual selection and no cleaning of rejectednystagmus candidates (2) manual selection and with cleaning ofrejected candidates (3) automatic selection and no cleaning (4)automatic selection with cleaning (5) both manual and automaticselection and no cleaning and (6) both manual and automaticselection with cleaning
nystagmus beat candidates so that the differences betweenthe rejected nystagmus beat candidates in Table 4 and theaccepted nystagmus beat candidates in Table 2 increasedIn spite of cleaning the standard deviations of the rejectedstill remained large in Table 4 Therefore the three ways toapply the cleaned datasets did not alleviate the problem ofconsiderably overlapping classes of the accepted and rejectednystagmus beat candidates caused by their large standarddeviations At the same time differences between the meansof both classes (their centres) increased by 44 22 and56 for the three data cleaning methods Despite separatingthe set of the rejected from the accepted the large standarddeviation showed the rather similar overlap that was presentbefore cleaning
We nevertheless computed a principal component anal-ysis and present its visualization results in Figure 8 for thesituations of manual selection with no cleaning (1) and withcleaning (4) (from Figure 6) Figure 8 shows that the overlapbetween the classes of the accepted and rejected is stillrather substantial after cleaning in other words cleaning
0102030405060708090
100
1 2 3 4 5 6Data set variations
Accu
racy
LinearQuadraticRBF
Figure 7 Classification results with support vector machines afterusing the best parameter selections from Table 3 for the linearquadratic and radial basis function (RBF) kernels with datasetvariations (1) manual selection and no cleaning of rejected nystag-mus candidates (2) manual selection and with cleaning of rejectedcandidates (3) automatic selection and no cleaning (4) automaticselection with cleaning (5) both manual and automatic selectionand no cleaning and (6) both manual and automatic selection withcleaning
did not change the data distribution to more favourable inclassification between the accepted and rejected nystagmusbeat candidates
5 Discussion and Conclusions
We found useful information about nystagmus variablesanalysed here for the purpose of nystagmus recognition inrespect to the separation of valid and invalid nystagmus beatsOn the basis of Figure 5 supported by the results in Table 2we found that variables (17) 119904119901119888
119905 (15) 119904119901119888
ℎ (12) 119891119901V
ℎ (16)
119904119901119888V (1) 119904119901119886ℎ (4) 119904119901119889ℎ and (8) 119891119901119886ℎ were the best to separatevalid and poor nystagmus beats in the present dataset Infuture research it is more preferable to concentrate on thesevariables and perhaps abandon the other analysed variables ifnot important for medical diagnostics
Based on the results in Figure 6 we found out how theclassifications with nearest 119896-neighbour searching the naıveBayes rule logistic discriminant and multilayer perceptronnetworks were very sensitive to cleaning in the current data
Advances in Artificial Neural Systems 9
Table 4 After cleaning manually automatically or using both manually and automatically rejected nystagmus beats kept in the data setmeans and standard deviations In the variable names 119904119901 and 119891119901 are slow and fast phases 119886 refers to amplitude 119889 duration Vmean velocity119888 correlation119898Vmaximum velocity 119902 quality signal and subscripts ℎ V and 119905 indicate horizontal vertical and torsional components
Figure 8 The two greatest principal components were used to map how accepted and rejected nystagmus candidates by manual selectionwere distributed before (a) and after (b) cleaning (situations (1) and (2) from Figure 6) No more than one tenth of nystagmus candidates aremapped to make the figures clear since the rejected and accepted candidates overlap and the rejected candidates are strongly concentratedin the ldquoleft cornerrdquo of the distribution The two principal components corresponded to (a) 800 and (b) 821 from variance in the data
10 Advances in Artificial Neural Systems
This type of cleaning was definitely disadvantageous andalthough it balanced the two classes it did not affect theirdistribution so that the classification task was more success-ful Instead for linear and quadratic discriminant analysisand support vector machines it gave accuracies a few percentbetter than no cleaning Linear discriminant analysis was6ndash12 better for all situations than quadratic discriminantanalysis Nevertheless the support vector machines using thequadratic kernel were among the best When not cleanedthe standardized nearest neighbour searching was 6ndash16better than the nonstandardized one The nearest neighboursearching with 119896 equal to 5 11 and 15 gave virtually the sameaccuracies as those tested above 15 The naıve Bayes rule wasmostly the poorest choice except for those cleaned
The best accuracies of 88-89 were gained with stan-dardized nearest neighbour searching with 119896 equal to 5 11and 15 or above 15 and without cleaning using automatic ormanual and automatic selections Multilayer perceptron net-works and support vector machines gave accuracies virtuallyas good as those of the nearest neighbour searching How-ever the radial basis function kernel of the support vectormachines did not succeed in the class of the accepted for thethree selectionswithout cleaning but almost completely failedwith them although the class of the rejected was classifiedvery well Thus this kernel could not be recommendedfor the current data without cleaning It is natural thatsupport vectormachines benefitted from cleaning since theirprinciple is based on searching for the maximally separatingboundary between two classes Linear discriminant analysisalso gave high accuracies of 86 provided that automaticselection or manual and automatic selections with cleaningwere included Logistic discriminant analysis favoured nocleaning yielding accuracies of 87 for automatic or manualand automatic selections
Calculating pairwise betweenmanual selection and auto-matic selection through all methods and with or withoutcleaning automatic selection was approximately 3 superiorto manual selection on average Correspondingly betweenautomatic selection and jointly manual and automatic selec-tions the latter choice was approximately 4 superior to theformer on average
To build a training set automatic or preferably bothmanual and automatic selection modes are recommendedsince for most methods these gave better results than themanual selection Among the classification methods near-est neighbour searching with data standardization and nocleaning gave the best results The support vector machinesapplied with the quadratic kernel function were also amongthe best Logistic discriminant analysis without cleaningand linear discriminant analysis with cleaning were almostequally effective
To build a good training set joint manual and automaticselection seem to be useful because an experienced expertcan recognize nystagmus candidates corrupted in someexceptional way that the automatic selection might acceptFor example in Table 2 there were more manually thanautomatically rejected beats Overall the latter obviously gaveslightly better results because the fixed lower and upperbounds of the variable values created stricter boundaries
in a variable space than the subjective (somewhat varying)manual selection
A training set created as the dataset in the presentresearch can be used together with machine learning meth-ods to separate valid nystagmus beats from those corruptedin various ways This could aid the current difficulties con-sidered in various research articles since the 1970s Howeversuch a dataset is probably not generally suitable for nystagmussignals since values of nystagmus variables may vary slightlybetweenmeasurement systems and sampling frequencies Forinstance the mean velocities of slow or fast phases mightvary slightly if theywere generally steeper for one system thananother On the other hand the advantage of many machinelearning methods for example multilayer perceptron net-works and support vector machines is that they can adap-tively function with varying data Therefore this problemmay after all be minor
In the future we could test some other classificationmethods and more useful cleaning procedures However itmay be difficult to develop cleaning because of the compli-cated distribution of the dataset An advantage of the testedclassification methods was their fast running times with theexception of logistic discriminant analysis and multilayerperceptron networks The duration of building and testing30333 models (30GHz dual CPU) in the tests executedwas 21 h 40min for logistic discriminant analysis and evenlonger formultilayer perceptron networks and support vectormachines with MATLAB In comparison the other methodsrequired less than 10minutes However such execution timeswould be meaningless in routine use because one modelwould only be needed and this could be built in advance ifa rather stable training set was applied
References
[1] J H J Allum J R Tole and A DWeiss ldquoMITNYS II A digitalprogram for on line analysis of nystagmusrdquo IEEE Transactionson Biomedical Engineering vol 22 no 3 pp 196ndash202 1975
[2] C Wall III and F O Black ldquoAlgorithms for the clinical analysisof nystagmus eyemovementsrdquo IEEE Transactions on BiomedicalEngineering vol 28 no 9 pp 638ndash646 1981
[3] G R Barnes ldquoA procedure for the analysis of nystagmusand other eye movementsrdquo Aviation Space and EnvironmentalMedicine vol 53 no 7 pp 676ndash682 1982
[4] M Juhola ldquoDetection of nystagmus eye movements usinga recursive digital filterrdquo IEEE Transactions on BiomedicalEngineering vol 35 no 5 pp 389ndash395 1988
[5] M Juhola ldquoA syntactic method for analysis of nystagmusand smooth pursuit eye movementsrdquo Computer Methods andPrograms in Biomedicine vol 26 no 1 pp 53ndash62 1988
[6] P Augustyniak ldquoAdvanced method of Nystagmus-phase sep-aration using adaptive modification of time-frequency signalrepresentationrdquo in Proceedings of the 3rd International Confer-ence on Signal Processing (ICSP rsquo96) pp 351ndash354 October 1996
[7] T Aasen D Kugiumtzis and S H G Nordahl ldquoProcedure forestimating the correlation dimension of optokinetic nystagmussignalsrdquo Computers and Biomedical Research vol 30 no 2 pp95ndash116 1997
Advances in Artificial Neural Systems 11
[8] R W Hertle and L F DellrsquoOsso ldquoClinical and ocular motoranalysis of congenital nystagmus in infancyrdquo Journal of AAPOSvol 3 no 2 pp 70ndash79 1999
[9] M Hosokawa S Hasebe H Ohtsuki and Y Tsuchida ldquoTime-frequency analysis of electronystagmogram signals in patientswith congenital nystagmusrdquo Japanese Journal of Ophthalmologyvol 48 no 3 pp 262ndash267 2004
[10] L A Abel Z I Wang and L F DellrsquoOsso ldquoWavelet analysisin infantile nystagmus syndrome limitations and abilitiesrdquoInvestigative Ophthalmology and Visual Science vol 49 no 8pp 3413ndash3423 2008
[11] T Pander R Czabanski T Przybyła et al ldquoA new method ofsaccadic eye movement detection for optokinetic nystagmusanalysisrdquo inProceedings of the 34thAnnual International Confer-ence of the IEEE EMBS pp 3464ndash3467 San Diego Calif USA2012
[12] S Tominaga and T Tanaka ldquo3-Dimensional analysis of nys-tagmus using video and image processingrdquo in The Society ofInstrument and Control Engineers Annual Conference (SICE rsquo10)pp 89ndash91 Taipei Taiwan August 2010
[13] M Juhola H Aalto T Jutila and T P Hirvonen ldquoSignalanalysis of three-dimensional nystagmus for otoneurologicalinvestigationsrdquo Annals of Biomedical Engineering vol 39 no 3pp 973ndash982 2011
[14] T C Lu andC Y Tseng ldquoHemodialysis key featuresmining andpatients clustering technologiesrdquo Advances in Artificial NeuralSystems vol 2012 Article ID 835903 11 pages 2012
[15] F Steinbruecker A Meyer-Bease T Schlossbauer and DCremers ldquoEvaluation of a nonrigid motion compensationtechnique based on spatiotemporal features for small lesiondetection in breast MRIrdquo Advances in Artificial Neural Systemsvol 2012 Article ID 808602 10 pages 2012
[16] M Juhola H Aalto and T Hirvonen ldquoUsing results of eyemovement signal analysis in the neural network recognition ofotoneurological patientsrdquo Computer Methods and Programs inBiomedicine vol 86 no 3 pp 216ndash226 2007
[17] M Juhola and V Siermala ldquoA scatter method for data andvariable importance evaluationrdquo Integrated Computer-AidedEngineering vol 19 no 2 pp 137ndash139 2012
Figure 1 (a) A nystagmus beat from an ideal eye movement signal including no noise or corruptions contains a slow phase immediatelyfollowed by its shorter fast phaseTheir amplitudes and durations are basic nystagmus variables Durations are computed from the beginnings119909(119904) and 119909(119891) of slow and fast phases and the end 119909(119890) Amplitudes are the differences from 119886
119904 119886119891 and 119886
119890 (b) The example shows a more
realistic nystagmus beat including slightly less smooth nystagmus phases
Filtering thresholds and the estimated functional rela-tion between slow and fast phases of nystagmus beats (Figure1) were applied to recognize the difference between slow andfast phases [1]The authors in [1] also applied their functionalbroken line relation to detect rapid eye movements saccades(as extraneous voluntary movements not fast phases ofnystagmus) and eye blinks present in signals as strong peakartefacts provided that these were in the same direction asthe slow phases of a nystagmus signal The detection ofminimumandmaximum locations within a window of presetwidth was applied to find the beginnings and ends of slowand fast phases [2]The authors constructed a spike detectionalgorithm also usable for extraneous saccades but since thiscomputed the mean square error between eye movement andstimulation signals such a procedure would not be possiblefor our spontaneous nystagmus without any stimulation sig-nal Furthermore a procedure based on velocity thresholdswas presented in which noise was dampened with low-passfiltering but no specific artefact or saccade detection wasintroduced [3] In some earlier studies we applied filteringand syntactic recognition methods to both detecting nystag-mus beats and eliminating extraneous saccades and artefactsat the same time [4 5] Amethodwas introduced on the basisof filtering and wavelet processing to separate slow phasesfrom fast phases [6] but problems caused by noise artefactsand saccades were not considered
Optokinetic nystagmuswas studied by using chaos theory[7] to detect nystagmus beats The method was describedas being tolerant of noise but the noise tests were limitedto sheer simulated Gaussian noise to the nystagmus signalsA study of congenital nystagmus in infants was performedin which waveforms of different nystagmus beats were anal-ysed [8] but the procedure for the computer analysis wasnot described Congenital nystagmus containing waveformanalysis was also studied in [9] for both children and adultsby applying time-frequency analysis with the fast Fouriertransform The influence of blinking artefacts was identifiedalong with their narrow frequency band in the spectrum
Wavelet analysis was used for nystagmus signals [10] Severalfilters were used with a threshold to detect fast phases ofnystagmus in electrooculographic signals [11] The analysisof three-dimensional nystagmus signals has been describedrecently for example in [12]
Most previous studies using the EOG technique haveapplied one-dimensional (horizontal) or two-dimensional(horizontal and vertical) directions only because the tor-sional direction can be recorded only with the magneticscleral coil technique and by some VOG techniques Theearlier technique used was frequently EOG The majority ofnystagmus signal algorithms have considered the detectionof nystagmus beats as a phenomenon but not specificallythe classification of valid beats from noisy corrupted beatsor ldquodisinformationrdquo without any actual beats Recently weintroduced an algorithm for three-dimensional nystagmussignals [13] and also dealt with the preceding problem In thepresent research we concentrated on this classification topicin order to design a method based on machine learning Theidea was to utilize a dataset of accepted and rejected nystag-mus beat candidates detected from nystagmus signals eithermanually or with a selection algorithm and to enable reliableclassification of nystagmus beats by combining this selectioninformation collected in both manners
We present the average values of accepted and rejectednystagmus beat candidates of several nystagmus variablesto demonstrate how they differ in the dataset collectedIn addition we studied which variables best separate theaccepted and the rejected nystagmus beats in the datasetmeasured This is useful since some poor variables in thisrespect might be abandoned in future research if they donot provide useful information for medicine Variable orfeature evaluation and selection is an important phase in dataanalysis as in for example [14 15] because it is necessaryto find which variables most affect classification and alsothose which are less influential If there are a particularlylarge number of variables variable selection is importantSometimes leaving out poor variables may also improveclassification results somewhat
Advances in Artificial Neural Systems 3
Table 1 Nystagmus variables defined with symbols given in Figure 1 In the variable names 119904119901 and 119891119901 are slow and fast phases of nystagmus119886 refers to amplitude 119889 duration V mean velocity 119888 correlation 119898V maximum velocity 119902 quality signal and subscripts ℎ V and 119905 indicatehorizontal vertical and torsional components
Variables Name Definition119904119901119886ℎ 119904119901119886V 119904119901119886119905 Amplitudes of slow phase
Duration of slow phase (119909(119891) minus 119909(119904)) 119891119903 (119891119903 sampling frequency)119891119901119889ℎ
Duration of fast phase (119909(119890) minus 119909(119891)) 119891119903 (119891119903 sampling frequency)119904119901119907ℎ 119904119901VV 119904119901119907119905 Mean velocity of slow phase Slope computed with linear regression from samples of 119909(119904) 119909(119904 + 1) 119909(119891)
119891119901119907ℎ 119891119901119907V 119891119901119907119905 Mean velocity of fast phase
Slope computed with linear regression from samples of 119909(119891) 119909(119891 + 1) 119909(119890)and
119910(119904) 119910(119904 + 1) 119910(119891) (see Figure 1(b))
119904119901119888ℎ 119904119901119888V 119904119901119888119905 Correlations of slow phase
correlation coefficient between samples of119909(119904) 119909(119904 + 1) 119909(119891) and
Slopes 119911(119894) with linear regression from samples of119909(119894 minus 2) 119909(119891 minus 1) 119909(119894) 119909(119894 + 1) 119909(119894 + 2) and
119910(119894 minus 2) 119910(119891 minus 1) 119910(119894) 119910(119894 + 1) 119910(119894 + 2) 119894 = 119891 + 2 119890 minus 2 and then by takingmax
119894isin119891+2119890minus2
119911(119894) (Figure 1(b))
119902119905
Mean of torsional qualityvalues Mean of quality values during slow phase of interval [s f ] (Figure 1(b))
2 Eye Movement Data
We measured nystagmus signals from 107 otoneurologicalpatients (mean age approximately 50 years) suffering mainlyfrom acute unilateral peripheral loss of vestibular func-tion (vestibular neuritis or having had surgery for acousticneuroma)
An alert subject was seated in a fixed chair and instructednot to move his or her head during the measurement Atfirst a calibration measurement was performed by asking asubject to look alternately at nine dots situated symmetricallyon a wall in the visual field Actual nystagmus measurementswere run with the eyes covered in the dimmed stationarylaboratory by applying an eye movement tracking system oftwo video cameras one for each eye (SensoMotoric Instru-ments Berlin Germany) The video camera systems appliedto eye movement studies include a built-in image processingprogram to recognize the pupil in each image in order tomeasure horizontal and vertical eye movements Using theangles of the iris between successive images torsional eyemovements can be computed The appropriate measuringcircumstances enabled the lack of gaze fixation that wasimportant to obtain the best nystagmus eye movementsEach measurement took 30 seconds This short durationwas normally sufficient to include 20ndash80 nystagmus beatsand was preferred to avoid subject fatigue Nystagmus wasspontaneous for some patients while for other cases rapidhorizontal head shaking was used to generate head-shakingnystagmusThe sampling frequency was 50HzThe horizon-tal and vertical amplitude resolutions of the camera systemwere 005∘ and that of the torsional direction was 01∘
The eye movement tracking system gave several signalsas its outputs For each eye the outputs utilised were three-dimensional signals of eye movements horizontal vertical
and torsional In addition we employed the torsional qualitysignals of both eyes that included values from an interval of[0 1] the higher the value the better the quality of torsionalsignal The system estimated noise here and noisy torsionalsignal segments could be detected with these quality signalsIn the subsequent description three-dimensional signals aregiven as three one-dimensional signals in order to express andvisualize the nystagmus beats clearly
3 Computation Methods
The method used for the detection of nystagmus beatsfollowed our previous publication [13]with aminor extensionand modification The principle of the method was to applyangular velocity for the recognition of beginnings and ends ofnystagmus beats and to reject nystagmus beat candidates thatwere clearly outliers or corrupted by noise In the followingsection we describe how a method based on classificationwas formed to improve the separation of valid and poornystagmus beat candidates
For the classification of nystagmus beat candidates weused the nystagmus variables explained below (see also theprecise definitions of the variables in Table 1) Please notethat some of the variables are probably not interesting formedical diagnostic purposes Nevertheless they could beuseful simply for classification First after the detection ofa signalrsquos nystagmus beat candidates variable values werecomputed for every nystagmus beat candidateThe first threevariables were the slow phase amplitudes of the horizontalvertical and torsional components
Second the duration of a horizontal slow phase wascomputed These basic variables are illustrated in Figure 1(a)Third the mean angular velocities of the slow phases ofthe three components were estimated by means of linear
4 Advances in Artificial Neural Systems
regression between the locations of the beginning and endof a nystagmus beat candidate (Figure 1(b)) The slope givenby linear regression is directly equal to the mean velocitybetween two locations Fourth the amplitudes of horizontalvertical and torsional components of the fast phases werecalculated Fifth the duration of a horizontal fast phase wascomputed
Sixth the mean velocities of the three components ofthe fast phases were estimated using linear regression Sucha slope value given by linear regression directly estimatesthe first derivative that is angular velocity It is good toremember that not all nystagmus signal types are as close tolinear as the slow and fast phases of vestibular nystagmusThus for other nystagmus types the variables used should bemodified
Seventh mean torsional quality during a slow phase wascomputed Eighth correlation between an ldquoideal slow phaserdquoand that of an actual signal part was estimated An ideal slowphase corresponds to that illustrated in Figure 1(b) wherethere is a line between the beginning and end of the slowphase of a nystagmus beat In an actual slow phase there issome noise or other nonlinearity between those locations inthe slow phase This deviation was estimated by computing aPearson correlation coefficient between the ideal and actualslow phases The nearer the (absolute) correlation coefficientto 1 the better the slow phase and the nearer to 0 the poorerthe slow phase
Ninth the maximum velocity of a horizontal fast phasewas computed using successive segments of 5 samplesthrough a fast phase The horizontal component was empha-sized compared with the others since frequently (at least inthe present data) it is dominant compared with the othercomponents its amplitude and velocity values are greater Intotal there were 19 variables for the classification of nystag-mus candidates
To form training and test data for classification weused all nystagmus beat candidates found by the recognitionprogram We sorted nystagmus candidates to be either validor invalid at first manually and secondly with the proceduregiven in the following sectionManual selectionwas executedindependently of the automatic selection At first the bettereye signal from those of the left and right eye was chosenby computing the mean of torsional quality values throughthe whole signal and selecting the eye with a higher mean InFigures 2ndash4 there are 10-second long examples in which theeye movement signal used (left or right) is also given
31 Selection Procedure for Nystagmus Candidates The fol-lowing selection criteria were computed for every nystagmusbeat candidate to label them either accepted or rejected
(1) The mean of torsional quality values were computedfor successive signal segments of 2 seconds includingat least one [13] beat candidate If the mean torsionalquality of such a segment was low below 02ndash04depending on the mean of the whole signal that seg-ment was rejected Usually such a segment includedabundant spikes such as a few probable dropoutsfrom the video images in Figure 4 Torsional quality
0 50 100 150 200 250 300 350 400 450 500
0
1
2
3
4Left eye
(1)
(2)
minus4
minus3
minus2
minus1Am
plitu
de(∘
)
Figure 2 Abnormally slow (1) and fast (2) segments of horizontal(blue or uppermost) slow phases compared with the surroundingvalid nystagmus beats
0 50 100 150 200 250 300 350 400 450 500
0
2
4
6
8
10
12
Samples
Right eye
(1) (2)
minus2
Am
plitu
de(∘
)
Figure 3 Abrupt upward ldquostepsrdquo (1) and (2) in the horizontal (blueor uppermost) and torsional (red or lowest) signals are obviouslyrapid voluntary eye movements (saccades) which would distort theslow phase velocities of two nystagmus beats
values given by the recording system are in the range[0 1]
(2) A lower lb and upper bound ub were computed formean slow phase velocities of all nystagmus can-didates according to their means 120583
119894and standard
deviations 120590119894for the three components 119894 = ℎ V 119905
(horizontal vertical and torsional)
lb = 120583119894minus 196120590
119894
ub = max 120583119894+ 196120590
119894 119904119901Vmax
(1)
In principle this would prune 25 of nystagmus beatcandidates from each end of the distribution if the
Advances in Artificial Neural Systems 5
0 50 100 150 200 250 300 350 400 450 500
0
5
10
15
20
Samples
Right eye
(3) (4)
minus20
minus15
minus10
minus5Am
plitu
de(∘
)
(1) (2)
Figure 4Deflection (1) could be a small saccade (2) is noise and (3)and (4) could be caused by short periodswhen the image recognitionprocedure of the eye movement camera lost the image of the pupilDistortion (1) only occurred in the horizontal (blue or uppermost)signal but (2) (3) and (4) were also present in the vertical (green ormiddle) and torsional (red or lowest) signals
distribution were normal In addition an absolutemaximum of 119904119901Vmax = 75
∘
s was used to leaveout extraordinarily high mean velocities that wereprobably high peaks for example eye blinks Thismaximum was chosen on the basis of the data usedNote that a nystagmus beat is rejected if even oneof the three component values is unacceptable Thiscondition could affect the rejections of locations (2)(3) and (4) in Figure 4
(3) Any occasional beat in the opposite direction frombeats before it or after it was rejected Infrequentlythe direction of nystagmus may change during therecording period of a nystagmus signal The ldquocor-rectrdquo direction was then decided by the majority ofcandidates and those in the opposite direction wererejected
(4) Nystagmus candidates with higher torsional ampli-tudes than 119886
119905= 15∘
s were rejected since this wasseen as the physiological limit for torsional rotationsof the eye This could yield rejections because of thetorsional spikes (4) in Figure 4 These spikes werenot actual eye movements but disturbances of theeye movement tracking system Obviously the videocamera system has failed to analyse the images for ashort period resulting in video dropouts
(5) Nystagmus candidates with shorter durations of slowphases than 119904119901119889min = 0080 s (4 sampling intervals for50Hz) were rejected as improbable nystagmus beatsThis lower bound was found experimentally earlier[16]
(6) The fast phase of a nystagmus beat immediatelyfollows its slow phase to turn the eyes in the opposite
direction For values of the horizontal fast phase thevelocity maximum 119891119901Vmax = 400
∘
s estimated earlier[16] was used to reject the corresponding nystagmuscandidate Usually noise spikes are steep generatinghigh velocity values higher than 119891119901Vmax and are notrelated to actual eye movements
(7) Noisiness during a slow phase segment was assessedby applying the correlation coefficient as describedabove If a horizontal vertical or torsional com-ponent was less than the bound 119904119901V119888min = 05derived experimentally the nystagmus candidate wasomitted This cleaning often discarded candidatessuch as a ldquoplainrdquo (1) or ldquostepsrdquo (2) in Figure 2 or (1) and(2) in Figure 3 from among valid nystagmus beats Inaddition horizontal deflection (1) in Figure 4 couldbe identified on the basis of the present condition
In addition to themanual and automatic selections of nys-tagmus beat candidates we combined the above mentionedto study whether this would improve later classificationresultsThus in the thirdmode the accepted nystagmus beatswere formed taking those that were accepted by both manualand automatic selections Those that were rejected by eitheror both were considered rejected
The entire data collected seemed to be rather overlappingsubject to variable values of the accepted and rejected nystag-mus candidates In other words some values of rejected caseswere close to those accepted by the same variable (see meansand standard deviations given in Table 2) This is dealt within more detail in the following section
Properties (variable values) of valid nystagmus beatscan vary considerably between subjects Even within anindividual signal nystagmus beats may change in the courseof a short recording time The frequency of nystagmus beats(number of beats per second)may vary considerably betweensubjects Consequently relatively rapid mean velocity valuesof slow phases of one subject might be rejected for anothersubject that hadmuch smaller mean velocity valuesThus wedesigned a straightforward cleaning procedure to delete somerejected nystagmus candidates from the dataset to be usedbecause there were more rejected than accepted candidatesMoreover this action also equalized their numbers This cansometimes be useful for some classification algorithms asthe two classes of a classification task are of roughly equalsize First we computed the centres of both classes (theaccepted and rejected) in the 19-dimensional Euclideanvariable spaceThen we discarded one by one those rejectednystagmus candidates that were the closest to the centreof the accepted candidates This procedure slowly cleanedout rejected nystagmus candidates between the class centresby reducing the sphere of influence around the class centreof the rejected candidates and those not yet rejected Inprinciple this separated the two classes slightly from eachotherDeletionsweremade until the classeswere of equal sizeThe cleaning procedure was carried out for all three selectionmodesmanual automatic and both Since the three selectionmodes were also performed without a cleaning procedurethere were six different test setups altogether
6 Advances in Artificial Neural Systems
Table 2 Manually automatically or both manually and automatically accepted (rejected) nystagmus beats means and standard deviationsIn the variable names 119904119901 and 119891119901 are slow and fast phases of nystagmus 119886 refers to amplitude 119889 duration Vmean velocity 119888 correlation 119898Vmaximum velocity 119902 quality signal and subscripts ℎ V and 119905 indicate horizontal vertical and torsional components
Manual Automatic Both One bothAcceptance Rejection Acceptance Rejection Acceptance Rejection
When the 19 variables applied were from quite differentscales for instance fast phase durations as small as 004 s andfast phase velocities of hundreds of ∘s-scaling were usefulfor some classification algorithmsWe standardized (normal-ized) the data (subtracting the mean from a variable valueand then dividing with the standard deviation) variable byvariable in order to set all variables to the same scaleThe classification methods used were run with and withoutstandardization
We deployed several classification algorithms linearquadratic and logistic discriminant analysis 119896-nearest neigh-bour searching with different numbers of 119896 the naıve Bayesrule multilayer perceptron networks and support vectormachines We also experimented with 119896-means clusteringbut as this did not converge we dropped it from further tests
4 Results
To begin with we computed the means and standarddeviations of the 19 nystagmus variables listed above inorder to study how they differed between the accepted andrejected classes of nystagmus beat candidates These averageresults are shown in Table 2 Please note that durations werecomputed for horizontal components only because virtuallythey do not vary between the three components and thequality signal given by the video camera system exists onlyfor torsional signals
In order to accept or reject we ran three different alter-natives which were (1) manually accepted or rejected (2)automatically accepted or rejected by the preceding selectionprocedure or (3) accepted both manually and automaticallyor rejected by one or both of the two procedures We wereinterested to see which of the first two procedures was betterandwhether using both could improve results in classificationtests Manual selections were first made by an experiencedperson accustomed to the assessment of nystagmus signalsbut who did not know the decisions of automatic selections
The signals of 107 patients included 5989 nystagmus beatcandidates On the basis of Table 2 the means of most vari-ables undoubtedly differed between the accepted and rejectedalternatives On the other hand standard deviations wereso large that distributions of individual variables overlappednotably We performed an unpaired two-sampled 119905-test forevery variable and for both alternatives For 120572 = 0001excluding the vertical amplitude of slow phase 119904119901119886V thehorizontal mean velocity of slow phase 119904119901V
ℎ the vertical
amplitude of fast phase119891119901119886V and the verticalmean velocity offast phase119891119901VV the other 15 variables differed statistically sig-nificantly between two alternatives For 120572 = 005 even 119891119901119886Vdiffered fairly significantly These outcomes indicated thatthe 15 variables were certainly useful for later classificationtests and the other four were possibly useful Although therewere only small differences between the means of these fourvariables the standard deviations of the rejected nystagmuscandidates were high but relatively small for the accepted
Figure 5 Separation power values given by the Scatter methodThehigher the value of a variable the better the classification Variables(1)ndash(19) are in the same order as in Tables 1ndash3 119904119901119886
onesThe underlying property seemed to be that the subset ofthe accepted nystagmus candidates was faintly compact butthe subset of the rejected dispersed strongly
In order to study the importance of the 19 variables forclassification we applied our Scatter method [17 18] whichruns a nearest neighbour search in a dataset from a sample toits nearest neighbour sample according to Euclidean distancethroughout the whole set and counts how many changesbetween classes (the accepted and rejected) have occurredThe fewer class changes that are encountered the morecompact the classes that is they are probablymore separableThe more class changes that are detected the worse theseparable the classesThe Scattermethod gave us values calledseparation powers the larger the value the more separablethe classes Figure 5 includes the results for the acceptednystagmus beats only because those of the rejected were verysimilar Calculating the average of the separation powers ofthe three different selections used for each variable showsthat the most important variables with the highest separationpowers for classification were in descending order (17) 119904119901119888
119905
(15) 119904119901119888ℎ (12) 119891119901V
ℎ (16) 119904119901119888V (1) 119904119901119886ℎ (4) 119904119901119889ℎ and (8) 119891119901119886ℎ
Correspondingly the least important were in ascendingorder (10)119891119901119886
Among the poorest there were (3) (9) (2) and (13) that isthose four given by the 119905 test to have statistically insignificantdifferences ((9) with 120572 = 001 only) Since separation powersbetween the best variable (17) and the worst variable (10) didnot differ greatly and that of (10) as the worst of all was notrelatively close to 0 in comparison to the other variables wekept all variables for further analysis
As explained in the preceding section we executed alltests with three selection modes manual automatic andboth Each of these was performed either with or withoutthe cleaning of rejected nystagmus candidates as possibleoutliers Furthermore six combinations were run either with
or without standardization of the whole dataset variableby variable as the preprocessing stage before classificationIn addition to linear quadratic and logistic discriminantanalysis we exploited 119896-nearest neighbour searching with 119896equal to 1 3 5 11 15 21 25 45 and 65 and the naıve Bayesrule classification We ran the same tests with multilayerperceptron networks with 19 inputs and 6 hidden and 2output nodes and used the Levenberg-Marquardt trainingalgorithm
Finally we tested with support vector machines by apply-ing three different kernel functions as reported in Table 3 inorder to search for the best regulation parameter values Forthe linear and quadratic kernels 20 box constraint valuesfrom the set of 05 10 15 10 were employed For theradial basis kernel 20 times 20 = 400 pairs of parameter valueswere explored as Cartesian products of box constraint andstandard deviation 120590 each from 05 10 15 10 Theseresultswere computedwithout standardization of the variablevalues
Linear quadratic and logistic discriminant analysis andthe naıve Bayes rule are insensitive to data standardizationgiving identical values independent of whether standard-ization is made or not Meanwhile 119896-nearest neighboursearching was sensitive to data standardization Thus theresults of the better alternative of each classification methodare only given in Figure 6 Since the runs with 119896 equal to 511 and 15 generated results a few per cent better than thoseof smaller 119896 and around 1 better than those of greater 119896values results of 119896 equal to 15 are only depicted in Figure 6As usual accuracies in percentages were computed as theratio between the sum of true positive and true negativeclassification outcomes and the number of all 119899 tested cases
We applied the leave-one-out method for training andtesting in which 119899 minus 1 cases were used for a training set and 1as the only test case and then we repeated this for each caseTherefore there were 5889 tests for dataset variations (1) (3)and (5) and after cleaning 4342 for (2) 5034 for (4) and3290 for (6) in Figure 6 For (2) (4) and (6) the originallylarger class of the rejected nystagmus candidates was cleaned(balanced) to be of equal size according to the smaller class ofthe accepted nystagmus candidates
The results in Figure 6 show how cleaning improved theaccuracies of the linear and quadratic discriminant analysismethods by 2ndash7 but strongly decreased those of theother methods even from 80ndash90 down to 40 of correctclassifications Results of the support vector machines areshown in Figure 7 Cleaning improved the results that weregenerally among the best The quadratic kernel was the bestof the three kernels
It was a surprising result that data cleaning impairedthe results of other methods so much other than linear andquadratic discriminant analysis and support vectormachinesWe therefore studied the data in more detail We calculatedthe means and the standard deviations of the reduced setsof the rejected nystagmus candidates after cleaning the dataaccording to the threemethods described aboveThese resultsare presented in Table 4 Comparing the values of its threecolumns to those corresponding to Table 2 it can be seenthat there are differences in the means among the rejected
8 Advances in Artificial Neural Systems
Table 3 The parameter values for the kernel functions that produced the best classification results with support vector machines
Linear kernelbox constraint
Quadratic kernelbox constraint
Radial basis functionbox constraint and 120590
Manual selection 05 95 25 05Manual selection with cleaning 35 05 30 100Automatic selection 75 35 85 05Automatic selection with cleaning 25 80 65 100Both manual and automatic selections 15 10 05 05Both selections with cleaning 10 05 75 100
0102030405060708090
100
1 2 3 4 5 6Data set variations
Linear discriminantQuadratic discriminant
BayesLogistic discriminantMultilayer perceptron
Accu
racy
()
15 nn standardized
Figure 6 Classification results of the different methods used(nn is the nearest neighbour) as accuracies (as percentages) withdataset variations (1) manual selection and no cleaning of rejectednystagmus candidates (2) manual selection and with cleaning ofrejected candidates (3) automatic selection and no cleaning (4)automatic selection with cleaning (5) both manual and automaticselection and no cleaning and (6) both manual and automaticselection with cleaning
nystagmus beat candidates so that the differences betweenthe rejected nystagmus beat candidates in Table 4 and theaccepted nystagmus beat candidates in Table 2 increasedIn spite of cleaning the standard deviations of the rejectedstill remained large in Table 4 Therefore the three ways toapply the cleaned datasets did not alleviate the problem ofconsiderably overlapping classes of the accepted and rejectednystagmus beat candidates caused by their large standarddeviations At the same time differences between the meansof both classes (their centres) increased by 44 22 and56 for the three data cleaning methods Despite separatingthe set of the rejected from the accepted the large standarddeviation showed the rather similar overlap that was presentbefore cleaning
We nevertheless computed a principal component anal-ysis and present its visualization results in Figure 8 for thesituations of manual selection with no cleaning (1) and withcleaning (4) (from Figure 6) Figure 8 shows that the overlapbetween the classes of the accepted and rejected is stillrather substantial after cleaning in other words cleaning
0102030405060708090
100
1 2 3 4 5 6Data set variations
Accu
racy
LinearQuadraticRBF
Figure 7 Classification results with support vector machines afterusing the best parameter selections from Table 3 for the linearquadratic and radial basis function (RBF) kernels with datasetvariations (1) manual selection and no cleaning of rejected nystag-mus candidates (2) manual selection and with cleaning of rejectedcandidates (3) automatic selection and no cleaning (4) automaticselection with cleaning (5) both manual and automatic selectionand no cleaning and (6) both manual and automatic selection withcleaning
did not change the data distribution to more favourable inclassification between the accepted and rejected nystagmusbeat candidates
5 Discussion and Conclusions
We found useful information about nystagmus variablesanalysed here for the purpose of nystagmus recognition inrespect to the separation of valid and invalid nystagmus beatsOn the basis of Figure 5 supported by the results in Table 2we found that variables (17) 119904119901119888
119905 (15) 119904119901119888
ℎ (12) 119891119901V
ℎ (16)
119904119901119888V (1) 119904119901119886ℎ (4) 119904119901119889ℎ and (8) 119891119901119886ℎ were the best to separatevalid and poor nystagmus beats in the present dataset Infuture research it is more preferable to concentrate on thesevariables and perhaps abandon the other analysed variables ifnot important for medical diagnostics
Based on the results in Figure 6 we found out how theclassifications with nearest 119896-neighbour searching the naıveBayes rule logistic discriminant and multilayer perceptronnetworks were very sensitive to cleaning in the current data
Advances in Artificial Neural Systems 9
Table 4 After cleaning manually automatically or using both manually and automatically rejected nystagmus beats kept in the data setmeans and standard deviations In the variable names 119904119901 and 119891119901 are slow and fast phases 119886 refers to amplitude 119889 duration Vmean velocity119888 correlation119898Vmaximum velocity 119902 quality signal and subscripts ℎ V and 119905 indicate horizontal vertical and torsional components
Figure 8 The two greatest principal components were used to map how accepted and rejected nystagmus candidates by manual selectionwere distributed before (a) and after (b) cleaning (situations (1) and (2) from Figure 6) No more than one tenth of nystagmus candidates aremapped to make the figures clear since the rejected and accepted candidates overlap and the rejected candidates are strongly concentratedin the ldquoleft cornerrdquo of the distribution The two principal components corresponded to (a) 800 and (b) 821 from variance in the data
10 Advances in Artificial Neural Systems
This type of cleaning was definitely disadvantageous andalthough it balanced the two classes it did not affect theirdistribution so that the classification task was more success-ful Instead for linear and quadratic discriminant analysisand support vector machines it gave accuracies a few percentbetter than no cleaning Linear discriminant analysis was6ndash12 better for all situations than quadratic discriminantanalysis Nevertheless the support vector machines using thequadratic kernel were among the best When not cleanedthe standardized nearest neighbour searching was 6ndash16better than the nonstandardized one The nearest neighboursearching with 119896 equal to 5 11 and 15 gave virtually the sameaccuracies as those tested above 15 The naıve Bayes rule wasmostly the poorest choice except for those cleaned
The best accuracies of 88-89 were gained with stan-dardized nearest neighbour searching with 119896 equal to 5 11and 15 or above 15 and without cleaning using automatic ormanual and automatic selections Multilayer perceptron net-works and support vector machines gave accuracies virtuallyas good as those of the nearest neighbour searching How-ever the radial basis function kernel of the support vectormachines did not succeed in the class of the accepted for thethree selectionswithout cleaning but almost completely failedwith them although the class of the rejected was classifiedvery well Thus this kernel could not be recommendedfor the current data without cleaning It is natural thatsupport vectormachines benefitted from cleaning since theirprinciple is based on searching for the maximally separatingboundary between two classes Linear discriminant analysisalso gave high accuracies of 86 provided that automaticselection or manual and automatic selections with cleaningwere included Logistic discriminant analysis favoured nocleaning yielding accuracies of 87 for automatic or manualand automatic selections
Calculating pairwise betweenmanual selection and auto-matic selection through all methods and with or withoutcleaning automatic selection was approximately 3 superiorto manual selection on average Correspondingly betweenautomatic selection and jointly manual and automatic selec-tions the latter choice was approximately 4 superior to theformer on average
To build a training set automatic or preferably bothmanual and automatic selection modes are recommendedsince for most methods these gave better results than themanual selection Among the classification methods near-est neighbour searching with data standardization and nocleaning gave the best results The support vector machinesapplied with the quadratic kernel function were also amongthe best Logistic discriminant analysis without cleaningand linear discriminant analysis with cleaning were almostequally effective
To build a good training set joint manual and automaticselection seem to be useful because an experienced expertcan recognize nystagmus candidates corrupted in someexceptional way that the automatic selection might acceptFor example in Table 2 there were more manually thanautomatically rejected beats Overall the latter obviously gaveslightly better results because the fixed lower and upperbounds of the variable values created stricter boundaries
in a variable space than the subjective (somewhat varying)manual selection
A training set created as the dataset in the presentresearch can be used together with machine learning meth-ods to separate valid nystagmus beats from those corruptedin various ways This could aid the current difficulties con-sidered in various research articles since the 1970s Howeversuch a dataset is probably not generally suitable for nystagmussignals since values of nystagmus variables may vary slightlybetweenmeasurement systems and sampling frequencies Forinstance the mean velocities of slow or fast phases mightvary slightly if theywere generally steeper for one system thananother On the other hand the advantage of many machinelearning methods for example multilayer perceptron net-works and support vector machines is that they can adap-tively function with varying data Therefore this problemmay after all be minor
In the future we could test some other classificationmethods and more useful cleaning procedures However itmay be difficult to develop cleaning because of the compli-cated distribution of the dataset An advantage of the testedclassification methods was their fast running times with theexception of logistic discriminant analysis and multilayerperceptron networks The duration of building and testing30333 models (30GHz dual CPU) in the tests executedwas 21 h 40min for logistic discriminant analysis and evenlonger formultilayer perceptron networks and support vectormachines with MATLAB In comparison the other methodsrequired less than 10minutes However such execution timeswould be meaningless in routine use because one modelwould only be needed and this could be built in advance ifa rather stable training set was applied
References
[1] J H J Allum J R Tole and A DWeiss ldquoMITNYS II A digitalprogram for on line analysis of nystagmusrdquo IEEE Transactionson Biomedical Engineering vol 22 no 3 pp 196ndash202 1975
[2] C Wall III and F O Black ldquoAlgorithms for the clinical analysisof nystagmus eyemovementsrdquo IEEE Transactions on BiomedicalEngineering vol 28 no 9 pp 638ndash646 1981
[3] G R Barnes ldquoA procedure for the analysis of nystagmusand other eye movementsrdquo Aviation Space and EnvironmentalMedicine vol 53 no 7 pp 676ndash682 1982
[4] M Juhola ldquoDetection of nystagmus eye movements usinga recursive digital filterrdquo IEEE Transactions on BiomedicalEngineering vol 35 no 5 pp 389ndash395 1988
[5] M Juhola ldquoA syntactic method for analysis of nystagmusand smooth pursuit eye movementsrdquo Computer Methods andPrograms in Biomedicine vol 26 no 1 pp 53ndash62 1988
[6] P Augustyniak ldquoAdvanced method of Nystagmus-phase sep-aration using adaptive modification of time-frequency signalrepresentationrdquo in Proceedings of the 3rd International Confer-ence on Signal Processing (ICSP rsquo96) pp 351ndash354 October 1996
[7] T Aasen D Kugiumtzis and S H G Nordahl ldquoProcedure forestimating the correlation dimension of optokinetic nystagmussignalsrdquo Computers and Biomedical Research vol 30 no 2 pp95ndash116 1997
Advances in Artificial Neural Systems 11
[8] R W Hertle and L F DellrsquoOsso ldquoClinical and ocular motoranalysis of congenital nystagmus in infancyrdquo Journal of AAPOSvol 3 no 2 pp 70ndash79 1999
[9] M Hosokawa S Hasebe H Ohtsuki and Y Tsuchida ldquoTime-frequency analysis of electronystagmogram signals in patientswith congenital nystagmusrdquo Japanese Journal of Ophthalmologyvol 48 no 3 pp 262ndash267 2004
[10] L A Abel Z I Wang and L F DellrsquoOsso ldquoWavelet analysisin infantile nystagmus syndrome limitations and abilitiesrdquoInvestigative Ophthalmology and Visual Science vol 49 no 8pp 3413ndash3423 2008
[11] T Pander R Czabanski T Przybyła et al ldquoA new method ofsaccadic eye movement detection for optokinetic nystagmusanalysisrdquo inProceedings of the 34thAnnual International Confer-ence of the IEEE EMBS pp 3464ndash3467 San Diego Calif USA2012
[12] S Tominaga and T Tanaka ldquo3-Dimensional analysis of nys-tagmus using video and image processingrdquo in The Society ofInstrument and Control Engineers Annual Conference (SICE rsquo10)pp 89ndash91 Taipei Taiwan August 2010
[13] M Juhola H Aalto T Jutila and T P Hirvonen ldquoSignalanalysis of three-dimensional nystagmus for otoneurologicalinvestigationsrdquo Annals of Biomedical Engineering vol 39 no 3pp 973ndash982 2011
[14] T C Lu andC Y Tseng ldquoHemodialysis key featuresmining andpatients clustering technologiesrdquo Advances in Artificial NeuralSystems vol 2012 Article ID 835903 11 pages 2012
[15] F Steinbruecker A Meyer-Bease T Schlossbauer and DCremers ldquoEvaluation of a nonrigid motion compensationtechnique based on spatiotemporal features for small lesiondetection in breast MRIrdquo Advances in Artificial Neural Systemsvol 2012 Article ID 808602 10 pages 2012
[16] M Juhola H Aalto and T Hirvonen ldquoUsing results of eyemovement signal analysis in the neural network recognition ofotoneurological patientsrdquo Computer Methods and Programs inBiomedicine vol 86 no 3 pp 216ndash226 2007
[17] M Juhola and V Siermala ldquoA scatter method for data andvariable importance evaluationrdquo Integrated Computer-AidedEngineering vol 19 no 2 pp 137ndash139 2012