The present work describes a study related to the influence on the shoreline dynamics of a wave farm consisting of Wave Dragondevices operating in the western side of the Black Sea. Based on historical data analysis of the wave climate, the most relevantenvironmental conditions that could occur were defined, and for these cases, simulations with SWAN spectral phase averagedwave model were performed. Two situations were considered for the most representative patterns: model simulations without anywave energy converter and simulations considering a wave farm consisting of six Wave Dragon devices. Comparisons of the wavemodel outputs have been carried out in both geographical and spectral spaces.The results show that although a significant influenceappears near the wave farm, this gradually decreases to the coast line level. In order to evaluate the influence of the wave farm onthe longshore currents, a nearshore circulationmodeling systemwas used. In relative terms, the longshore current velocities appearto be more sensitive to the presence of the wave farm than the significant wave height. Finally, the possible impact on the marineflora and fauna specific to the target area was also considered and discussed.
1. Introduction
The higher request concerning the implementation on largescale of the renewable energy imposed by the EU directivesalso implies a substantial enhancement of the renewableenergy extraction all over Europe.
Wave energy is abundant and is more predictable thanwind or solar energy. Although the amount of energy thatcan be extracted using wave technologies varies dependingon the location and weather conditions, wave energy canbe accurately predicted using numerical models within awindow of a few days. Wave energy also offers much higherenergy densities, allowing devices to extractmore power froma smaller volume at consequently lower costs.
Shoreline energy converters have been tested for someyears, and several successful devices have been installed.Nevertheless, the most exciting developments at the presenttime are in extracting renewable energy in the nearshore andoffshore areas.
Combined wind-wave projects, also known as hybrids,hold great potential down the line when wave technologies
become more established. At that point, wave productionmight compensate for the intermittency of the offshorewind, while economies of scale developed from offshorewind could accelerate cost reduction for wave components.Although nowadays discussion of hybrid offshore wind-waveprojects is limited more to demonstrations or pilot projects,it is expected that in the near future the synergy betweenwave and wind energy would be better achieved and hybridplatforms will become fully operational and economicallysustainable. Despite a certain degree of uncertainty related tothe variability in the wave-wind climate, improvements in theaccuracy of evaluating the environmental data in the coastalareas would enhance also the accuracy of the predictions thatfuture energy convertors yield. Some economic advantagesof combining the wave and wind power productions arepresented in [1, 2].
The target of the present work is a coastal area located onthe western side of the Black Sea, which is not considered anenvironment rich in wave energy. On the other hand, due tothe technological developments regarding harvesting renew-able energy resources, which are expected to be very high in
2 The Scientific World Journal
the near future, this area can become interesting especially inrelationship with the hybrid projects combining the marineenergy fromwaves, wind,marine currents, thermal gradients,and differences in salinity.
Until now, several evaluations of the wave conditions andof thewave energy resources in the Black Sea have beenmade,and among these, the most relevant are those of presented in[3–6], where the presence of various hot spots from the pointof viewof thewave energy has been identified.These hot spotsare areas near the coast where significant differences in termsof wave conditions usually appear.
Harvesting thewave energy and transform it into electric-ity implies wave energy convertors (WECs) that transform inthe first stage the wave energy into mechanical energy, andthen this is again transformed into electricity. Several typesof devices as well as an overview on the WEC evolution aregiven in [7]. Sea waves generate high forces at low velocities,and the hydraulic systems seem to be the most appropriatedevices to absorb the energy in such conditions. The deviceis fixed at a location with a mooring system. Electricity istransmitted to the sea bottom through a flexible cable andafterwards to the coast by a cable line. The waves depend onthe characteristics of the wind that generates them, and ingeneral the energetic conditions are significantly higher in thewintertime than in summertime. Both power production andcost are dependent on the layout of the farm. To develop acommercial technology, the impact of arranging WECs in afarm has to be investigated as well. An optimization of such awave energy farm operating in the North Sea is presented in[8].
On the other hand, the implementation of the energyfarms is depends of a correct evaluation of their impact onthe coastline dynamics, because changes might appear inrelationship with the energy and the direction of the wavesas they propagate from the energy farm further towards thecoast. The environmental impacts of the wave energy farmsare yet insufficiently studied. Although this impact shouldnot be expected as necessarily negative, since reducing thewave energy might produce benefits in several coastal areas,evaluating the sensitivity of the nearshore wave climate tothe extraction of the renewable energy still represents a veryimportant issue, and a lot of studies are required in thisdirection.
In this context, the objective of the present work is toevaluate the coastal impact of a WEC array composed of sixWave Dragon devices disposed in one line that would operateon the west side of the Black Sea.
Nørgaard et al. [9, 10] showed the importance of suchdevices, which can be used also to reduce the wave heightalong the shorelines. Different stiffness of themooring systemand reflector joints have been tested for different wavesteepness and relative floating ratios assessing the influenceof each of these parameters on the wave transmission.
Some other studies are those of Millar et al. [11] for theWave Hub project or by Palha et al. [12] that studied theeffect of a Pelamis wave farm on the shoreline wave climatewhich is situated close to the Portuguese coast and also byPonce de Leon et al. [13] that studied the influence of a windfarm in the nearshore. The impact on the coastal dynamics
is dependent both on the bathymetric features and on theparticularities of the environmental matrix. For this reason,extended evaluations should be carried out in each coastalenvironment where a new structure or the energy farm willbe installed. These factors affect the medium and long-termchanges induced in the shoreline wave climate and dynamics.
From this perspective, the present study might representa step forward to the investigation of the potential impactof the implementation of large-scale wave energy arrays byproviding some insight in relationship with the influence ofa Wave Dragon-based farm that would operate in the coastalenvironment.The present target area is located in the westernside of the Black Sea close to the mouths of the Danube River,and this was found to be one of the most energetic parts ofthe western side of the sea [14]. Moreover, the results of thepresent work can be easily extrapolated tomany other coastalenvironments.
2. Theoretical Background of the NumericalModels Considered
Since a deterministic approach of the sea waves is in generalnot feasible, the most adequate representation of the waves isbased on the spectral concept.The wave spectrum representsthe Fourier transform of the autocorrelation function of thefree surface elevation. The spectral wave model consideredin the present study is Simulating Waves Nearshore (SWAN,[15]). This is considered the state-of-the-art phase averagedshallow water wave model and solves the wave action densitybalance equation which can be expressed as
𝜕
𝜕𝑡𝑁 +𝜕
𝜕𝑥𝐶𝑔𝑥𝑁 +
𝜕
𝜕𝑦𝐶𝑔𝑦𝑁
+𝜕
𝜕𝜎𝐶𝜎𝑁 +
𝜕
𝜕𝜃𝐶𝜃𝑁 =
𝑆
𝜎,
(1)
where𝑁 is the wave action density and 𝐶𝑔𝑥, 𝐶𝑔𝑦, 𝐶𝜎, and 𝐶𝜃represent the propagation speeds in the geographical space(𝑥, 𝑦), in the frequency space (𝜎), and in the directional space(𝜃), respectively. 𝑆/𝜎 represents the source and sink termsthat account in deep water for processes as wave generationby wind, whitecapping dissipation, and nonlinear wave-waveinteractions (quadruplets). In shallow water, additional pro-cesses as bottom friction, depth-induced breaking, and triadwave-wave interactions are also introduced.Themodel can benow utilized with either Cartesian or spherical coordinates;it has a parameterization to counteract the garden sprinklereffect, which is a characteristic of large areas and also includesa phase-decoupled diffraction approximation.
Many phenomena are generated from the wave energydissipation in the surf zone by breaking, but for a practicalapplication, the generation of the longshore currents is themost significant, obtaining considerable strength and beinga significant factor in controlling the morphology of thebeaches. They can also have an impact on human activitiesin the coastal zone. Calculation of the current velocity isusually based on radiation stress theory (Longuet-Higgins[16]), and various 1D, 2D, and 3Dnumericalmodels have been
The Scientific World Journal 3
Table 1: Characteristics of the computational domain defined for the SWAN simulations and the physical parameterizations activated.
Cartesian 50 × 50 5 stat/BSBT 34 35 355 × 406 = 144130Input/process wave wind tide crt gen wcap quad triad diffr bfric setup brSWAN X X 0 X X 0 X X X X X X
developed to predict these currents. A widely known generalprediction system for nearshore circulation is SHORECIRC(Svendsen [17]). This is a quasi-3D model that combines anumerical solution for the depth-integrated 2D horizontalmomentum balance equations with an analytical solution forthe 3D current profiles. The restrictions of the model arevery mild, and the basic circulation equations solved can,therefore, in general be considered very accurate. In addition,such a model catches the nonlinear feedback between wave-generated currents and the waves that generate them. Nev-ertheless, the model works in the time domain and is quiteexpensive in terms of computational resources. A simpler,but considerably faster, model is Surf, or Navy Standard SurfModel (NSSM), [18]. This is a parametric one-dimensionalmodel that estimates the wave-induced longshore currents bysolving the following equation for the longshore current:
𝜏𝑟
𝑦+ 𝜌𝜕
𝜕𝑥[𝜇ℎ𝜕𝑉
𝜕𝑥] − ⟨𝜏
𝑏
𝑦⟩ + 𝜏𝑤
𝑦= 0. (2)
The first term in this equation, 𝜏𝑟𝑦, represents the longshore
directed radiation stress due to the incident waves, the secondterm represents the horizontal mixing term due to cross-shore gradients in the longshore current velocity 𝑉, the thirdterm, 𝜏𝑏
𝑦, is the wave-averaged bottom stress, and the last
term, 𝜏𝑤𝑦, represents the longshore wind stress. The model
includes a parametric relation for cross-shore growth, anddissipation of waves due to breaking and additional relationsare included for estimating percent breaking, the number oflines of breakers, and breaker type. Because NSSM is one-dimensional several assumptions are utilized. In particular,the bottom contours are considered straight and parallel, thecurrent depth uniform, and directional wave spectra narrowbanded in frequency and direction.
Evaluations in the Italian nearshore of the waves andnearshore currents were performed by Conley and Rusu [19]with SWAN and NSSMmodels, and their results proved thatthis approach can be considered reliable for a wide range ofcoastal applications. In order to increase the properties of thetwo models and for simplicity and reliability, Rusu et al. [20]joined the two models in a user friendly computational toolnamed as the “Interface for SWAN and Surf Models” (ISSM).
The computational domain is illustrated in Figure 5.This is a rectangle with about 17.5 km in 𝑥-direction (crossshore) and 20 km in 𝑦-direction (long shore). The maincharacteristics and physical processes activated are presentedin Table 1. In this table, Δ𝑥 and Δ𝑦 represent the resolution inthe geographical space, Δ𝜃 is the resolution in the directionalspace, 𝑛𝑓 is the number of frequencies in the spectral space,𝑛𝜃 is the number of directions in the spectral space, 𝑛𝑔𝑥 is thenumber of the grid points in 𝑥-direction, 𝑛𝑔𝑦 is the number of
grid points in 𝑦-direction, and 𝑛𝑝 is the total number of gridpoints.
Some details will be given next in relationship with theimplementation of themodeling conditions in the target area.The input fields considered are also indicated in Table 1 asfollows: wave represents the wave forcing, tide is the tideforcing, wind represents the wind forcing, and crt is thecurrent field. The physical processes activated are codedas follows: gen is the generation by wind, wcap indicatesthe whitecapping process, quad represents the quadrupletnonlinear interactions, triad indicates the activation of thetriad nonlinear interactions, diff is the diffraction process(phase decoupled), bfric represents the bottom friction, setupis the wave-induced setup, and br indicates the activation ofthe depth-induced wave breaking.
3. Main Particularities of the WEC and of theWave Conditions in the Target Area
TheWEC considered in the present work is theWave Dragon(Kofoed [21]). The basic idea of this wave energy converterdevice is to use well-known and well-proven principles oftraditional hydropower plants in an offshore floating platformof the overtopping type.
The device elevates waves to a reservoir where wateris passed through a number of turbines and in this waytransformed into electricity. This is a typical terminator typeWEC, for which the conservative approach is to assume thatthe devices will absorb all suitable wave energy across the fullwidth of the reservoir.
The Wave Dragon (Figure 4) consists of two wave reflec-tors that direct the waves towards a curved ramp whichovertops in a water reservoir and, therefore, has an increasedpotential energy compared to the surrounding sea. Thus,the Wave Dragon directly utilizes the energy of the water’smotion.
To reduce rolling and keep the platform stable, the WaveDragon must be large and heavy, having only one kind ofmoving parts: the turbines. This makes it to be a durable andresistant structure. This is essential for any device bound foroperations offshore, where extreme conditions and foulingseriously affect any moving parts. If the waves do not interactwith the ramp, they are reflected under its structure ordiffracted away. Also, to improve the device performances,two reflectors are placed and hinged to the platform, whichreflect the waves towards the ramp. The experiments showedthat the ramp must be short to reduce the loss of energy,and due, the elliptical form to the overtopping increasessignificantly.
4 The Scientific World Journal
4-53-42-31-20-1
W
N
S
E10%
5%
Hs
15%
Target area
Buoy location
Figure 1: Location of the target area and the wave conditions resulting from an analysis of 5 years of data (2006–2011).
0-1 1-2 2-3 3-4 4-5 5-6 6-70
5
10
15
20
25
30
35
40
45
50Total
(%)
Hs (m)
(a)
0
5
10
15
20
25
30
35
40
45
50
0-1 1-2 2-3 3-4 4-5 5-6 6-7
Winter time
(%)
Hs (m)
(b)
Figure 2: Analysis of the wave data measured at buoy close to the target area in the period 2006–2011: (a) Classes of significant wave height(𝐻𝑠) for the total time interval; (b)𝐻
𝑠classes for wintertime.
The Scientific World Journal 5
1 2 3 4 5 6 7 8 9 10 11 123
3.5
4
4.5
5
5.5
6
6.5
7
Wave height
9.4
9.5
9.6
9.7
9.8
9.9
10
10.1
Wave period
𝐻(m
)Months
𝑇(s
)
7.5
Figure 3: Analysis of the wave data measured at a buoy close to the target area in the period 2006–2011: 𝐻 (m) monthly maximum waveheight; 𝑇 (s) monthly maximum wave period.
Ram
p
Rese
rvoi
r
300
97
170
Refle
ctor
Refle
ctor
Wavebuildupwithoutbreaking
(a)
Reservoir
Turbine outlet
Overtopping
(b)
Figure 4: (a)Main structural elements of aWave DragonWEC in plain view—dimensions inmeters; (b) cross-sectional view of the reservoirpart of the Wave Dragon.
Some remarks on the wave energy potential of the BlackSea near the Romanian coasts together with a possible powertake off system that can be placed here are given in [22]. Onea[23] made an estimation of the expected power provided bysome wave energy devices operating in the western side ofthe Black Sea. This was based on the analysis of the wavedata registered at the Gloria drilling unit for a five-yearperiod (2001–2005). Considering the above data, diagramsfor the bivariate distributions of the sea states occurrences,defined by the significant wave height and the energy period,were designed for both winter and total time. On this basis,the efficiency of different technologies for the extraction ofthe wave energy, including the Wave Dragon, was assessed.
The above results showed that a Wave Dragon device wouldproduce close to the target area about 600 kW electric powerin winter time and about 400 kW for total time, respectively.
The device has a very complex design because there mustbe a perfect relationship between ramp, wave reflectors, waveheight, the floating height of the device, and the amount ofwater overtopped and stored in the reservoir (Figure 4(b)).The components are all well-established technologies, and theWave Dragon is a particular application combining these toproduce electricity from the waves.
The target area considered in the present study is found tobe among themost energetic sites from thewestern side of theBlack Sea and is located at the south of Sulina channel, which
6 The Scientific World Journal
0
0
5
10
15
20
105 15
RL1
RL2
RL3
RL4
RL5
RL6
RL7
BP
OP1
OP2
OP3
Wave dragons
Dep
th (m
)
0
10
20
30
40
50
(km)
(km
)
Figure 5:The computational domain considered for the simulations with numericalmodels. In the background the bathymetry is representedwhile in the foreground theWave Dragon, the reference points, and the reference lines. BP indicates the boundary point, OP are the offshorepoints, and RL represent the reference lines considered in the analysis of the nearshore currents. Each offshore extremity point of the abovereference lines is denoted as NP (nearshore point).
20
15
10
5
0
CS1
0 5 10 15 20
WD0
Dir = 90∘
(km)
(km
)
Hs = 1mTm = 4 s
(a)
WD6
1
0
−0.5
0.5
1.5
0 5 10 15 20
20
15
10
5
0
CS1Dir = 90
∘Hs = 1mTm = 4 s
(km)
(km
)
Hs
(m)
(b)
Figure 6: Evaluation in the geographical space of the impact on the wave field of a wave farm based on Wave Dragon WECs that operate inthe target area. CS1—average to high energetic conditions and waves coming from east (90∘ in nautical convention). (a) SWAN simulation inthe case withoutWave Dragons (WD0). (b) SWAN simulation in the case when sixWave Dragons operate in line (WD6).The𝐻
𝑠scalar fields
are presented in the background while in the foreground the wave vectors are indicated.
is also a very important navigation sector since it representsthe main gate in the seventh Trans-European transportationcorridor (Figure 1). It has to be highlighted also that inthis region the wave fields are characterized by significantvariations during the year.
The Romanian Black Sea littoral evolution of the sea-land interface, for a period of several decades, had registeredsome significant variation. Mateescu et al. [24] presenteda study of the beach short-term response under the action of
the marine factors in the actual geomorphologic conditions.The previously stated results indicate a significant coastalresponse process to the climate changes/sea level rise trend,with an obvious influence on the future development ofthe natural environment, as well as on the socioeconomicactivities in coastal space. A study to determine variousgeomorphic types of landforms in order to create a webgeomorphic classification development for the Black Seacoast has been made by Stanica et al. [25].
The Scientific World Journal 7
Dir = 90∘
0
5
10
15
20
20151050
WD0
CS2Hs = 3m
Tm = 6 s
(km
)
(km)
(a)
20151050
WD6
2.5
0.5
−0.5
1.5
3.5
0
1
2
3
0
5
10
15
20
CS2Dir = 90
∘Hs = 3m
Tm = 6 s(k
m)
(km)
Hs
(m)
(b)
Figure 7: Evaluation in the geographical space of the impact on the wave field of a wave farm based on Wave Dragon WECs that operate inthe target area. CS2—high energetic conditions and waves coming from east (90∘ in nautical convention). (a) SWAN simulation in the caseWD0. (b) SWAN simulation for the caseWD6.The𝐻
𝑠scalar fields are presented in the background while in the foreground the wave vectors
are indicated.
Thewave data analysis presented in this section considersdata measured at a buoy which operated in the westernsector of the Black Sea close to the target area (Figure 1). Themeasurements were made daily in the five-year time interval2006 and 2011.The results were structured for total andwintertime, respectively. In this work, winter time represents thetime interval between October and March. Figure 1 showstogether with the target area the directional distributionsof the 𝐻𝑠 classes as reflected by the buoy measurements. Itcan be observed that the lowest wave heights correspond tothe western direction because of the presence of the coastin that side while the dominant wave direction is from thenortheastern side. It can be also seen that from the samedirection higher waves are usually coming in comparisonwith other directions. In Figure 2, the𝐻𝑠 classes are presentedin percents in terms of the number of occurrences, illustratingin parallel the results for total time (a) and wintertime (b),respectively. The monthly maximum values of the significantwave heights and mean wave periods are shown in Figure 3.
The results show that the highest probability of occurringwaves with significant heights, greater than 7m is in thetime interval betweenDecember and January.This possibilitybegins in September and lasts until the end of March. Thesame evolution can be seen for the significant wave heightsin the classes 4-5m, 5-6m, and 6-7m.Waves with significantwave heights in the range 1-2m are present in a considerableproportion all over the year, with a minimum in March anda maximum in July. For the waves smaller than 1m, thefrequency of occurrence in summertime is almost doublethan in wintertime. The highest value of the significantwave is 7.08m and corresponds to waves coming from the
northeastern direction. As regards the wave periods, there arenot so relevant differences between winter and total time.
4. The Expected Impact of the Wave DragonFarm on the Marine Vegetation and FaunaThat Characterize the Target Area
An important issue concerning the deployment and exploita-tion of the future energy farms relates to a correct assessmentof their environmental impact, in general, and of their impacton the aquatic flora and fauna, in special.
It is thus very important to have a comprehensive pictureof all the physical and biological characteristics of the areatargeted in order to be able to assess correctly the conse-quences of the wave energy extraction. From this perspec-tive, [26] studied the main physical-chemical characteristicscorrelated with the biological specificity of different speciesof multicellular algae along the Romanian Black Sea coastwhile [27] presented the evaluation of the conformity levelfor the marine environment of the Romanian marine areasdesignated for the main molluscs growth and exploitation.
The soils in the Black Sea basin are varied, and theirdistribution reflects the connectionwith the principal geneticfactors (lithology, relief, climate, vegetation, and fauna) andthe influence of the human activities by modifying the localconditions. From the same perspective, Stanica et al. [28]revealed the aspects that affected the natural processes of theBlack Sea coast near the Sulinamouth by the human activitiesleading to erosion of the coast.
8 The Scientific World Journal
0.2
0.4
0.6
N
S
W
Dire
ctio
n (d
eg)/
frequ
ency
(Hz)
E
(m2 s/deg)
BP
(a)
(m2 s/deg)
N
S
W E
Dire
ctio
n (d
eg)/
frequ
ency
(Hz)
0.2
0.4
0.6
OP2
WD0
(b)
0.2
0.4
0.6
N
S
W E
Dire
ctio
n (d
eg)/
frequ
ency
(Hz)
1
0.9
0.8
0.7
0.6
0.5
0.3
0.2
0.1
0.8
0.4
(m2 s/deg)
NP3
WD0
Nor
mal
ized
var
ianc
e
(c)
0.4
0.6
0.8
N
S
W E
(m2 s/deg)
Dire
ctio
n (d
eg)/
frequ
ency
(Hz)
0.2
OP2
WD6
CS1H = 1mT = 4 sDir = 90
∘
(d)
0.2
0.4
0.6
0.8
N
S
W E
(m2 s/deg)
Dire
ctio
n (d
eg)/
frequ
ency
(Hz)
1
0.9
0.8
0.7
0.6
0.5
0.3
0.2
0.1
0.4
NP3
WD6
Nor
mal
ized
var
ianc
e
CS1H = 1mT = 4 sDir = 90
∘
(e)
Figure 8: Evaluation in the spectral space of the impact on the wave field of a wave farm based on Wave Dragon WECs that operate in thetarget area for CS1. (a) BP for WD0. (b) OP2 for WD0. (c) NP3 for WD0. (d) OP2 for WD6. (e) NP3 for WD6.
Previous studies have found a higher proportion of plantspecies along the coastal area of the Black Sea. Anastasiu etal. [29] assessed the role of the harbours as gateways andreservoirs for alien plant species, the structure and invasionpattern of the alien plants, and test methods useful foreffective monitoring programs; on the other hand Sava et al.[30] showed the influence of the nutrients on themacrophyticred algae of the Romanian Black Sea coast.
An overview of the turbot Psetta maeotica species thatpopulate the Romanian Black Sea and the importance of theregional fishing potential under the aspect ofmarket demand,both on the national and international level, is made in [31],while in [32] a study of the distributional patterns of thezoobenthos from the artificial hard substratum is presented.
Thus, in the global environmental context, it is assumedthat the presence of a Wave Dragon farm would have apositive impact as an alternative to the use of polluting fossilfuels for generating electricity. These devices are a cleanpower generation technology with many environmentaladvantages: they have a very low visibility (Wave Dragon can
be compared to a moored ship and will have a maximumheight above mean sea level of 7 meters), the underwaternoise generation is very low (so it cannot produce harm to themarine fauna due to noise), they have amodest “footprint” onthe seabed from anchor block and the power cable duct, andthere is no risk of spill (they usewater hydraulics, and no toxicantifouling is used).
From this perspective, the impact of a single WEC onthe marine environment is expected to be small, but thepresence of a large number of converters in the same areaworking in an almost continuous way may cause eventuallysome environmental impact. Of course, this impact can besignificantly attenuated: subsea cables and onshore cablesimpact can be avoided by identifying the important habitatsfor fisheries, benthos, and so forth and avoiding laying cablesin these areas. Locations have to be chosen with respectto commercial and recreational fisheries, but we can noticepositive effects on fish resources (this area will create afishery exclusion zone, and the artificial reef effect will attractfish).
The Scientific World Journal 9
(m2 s/deg)
0.1
0.2
0.3
0.4
N
S
W E
Dire
ctio
n (d
eg)/
frequ
ency
(Hz)
BP
(a)
(m2 s/deg)
0.1
0.2
0.3
0.4
N
S
W E
Dire
ctio
n (d
eg)/
frequ
ency
(Hz)
OP2
WD0
(b)
(m2 s/deg)
0.1
0.2
0.3
0.4
0.5
0.6
0.7
0.8
0.9
1
0.1
0.2
0.3
0.4
N
S
W E
Dire
ctio
n (d
eg)/
frequ
ency
(Hz)
NP3
Nor
mal
ized
var
ianc
e
WD0
(c)
(m2 s/deg)
0.1
0.2
0.3
0.4
N
S
W E
Dire
ctio
n (d
eg)/
frequ
ency
(Hz)
OP2
WD6
CS2H = 3mT = 6 sDir = 90
∘
(d)
(m2 s/deg)
0.1
0.2
0.3
0.4
0.5
0.6
0.7
0.8
0.9
1
0.1
0.2
0.3
0.4
N
S
W E
Dire
ctio
n (d
eg)/
frequ
ency
(Hz)
NP3
WD6
CS2H = 3mT = 6 s
Nor
mal
ized
var
ianc
e
Dir = 90∘
(e)
Figure 9: Evaluation in the spectral space of the impact on the wave field of a wave farm based on Wave Dragon WECs that operate in thetarget area for CS2. (a) BP for WD0. (b) OP2 for WD0. (c) NP3 for WD0. (d) OP2 for WD6. (e) NP3 for WD6.
Nevertheless, limited studies have been done regardingthe wave energy farms impact and changes that these devicescanmake on the waves and current field. Wave Dragon farmswill extract energy fromwaves anddo some extended changesof the hydrodynamics behind the farm. Wave heights areexpected to decrease behind aWaveDragon farm. Changes inthe hydrophysical regimedue to the extraction of energy fromthewavesmay cause an impact on coastal processes as erosionand sediment transport and a reduced recreational value,regarding surfing due to smaller waves. Therefore, the wavesand current estimations are important aspects that must to betaken into account, and these aspects will be evaluated anddiscussed in the next section.
5. Model System Simulations andDiscussion of the Results
As in the case of the attenuator type devices, the efficiencyof the terminator devices is directionally dependent; that
is, they must follow the direction of the wave propagation.Simulations with the SWAN model have been performedin various cases that reflect better the most relevant wavepatterns in the target area.
For accounting in the wave model of the Wave Dragonarray geometry, the command obstacle that is available inSWAN was considered. The obstacle is subgrid in the sensethat it is narrow compared to the spatial meshes, but itslength should be at least one-mesh long. The location ofthe obstacle is defined by a sequence of corner points of aline. The obstacles interrupt the propagation of the wavesfrom one grid point to the next. Such an obstacle willaffect the wave field in three ways: it will reduce the waveheight of waves propagating through or over the obstacle allalong its length, it will cause waves to be reflected, and itwill cause diffraction around its end. Therefore, the modelcan reasonably account for waves around an obstacle if thedirectional spectrum of incoming waves is not too narrow.There are several mechanisms for transmission of waves.In SWAN, this can be computed as transmission of waves
10 The Scientific World Journal
Table 2: CS1 (𝐻𝑠= 1m, 𝑇
𝑚= 4 s, Dir = 90∘), evaluation of the impact of the energy farms on the waves in the reference points OP1 (northern
offshore point), OP2 (central offshore point), OP3 (southern offshore point), and in the point NP1–NP7. WD0: no energy converter, WD6:four Wave Dragon energy converters operating in line.
WD 𝐻𝑠(m) 𝐸max (m
2/Hz/deg) Dir (deg) DSPR (deg) 𝑇𝑚/𝑇𝑝(s) Wlen (m) 𝑃
Figure 10: Evaluation of the impact of the energy farms on the maximum velocities of the nearshore currents along the reference linesconsidered. (a) CS1, (b) CS2.
Table 4: Evaluation of the impact of the energy farms on the waves in the reference points OP1, OP2, and OP3 for the wave conditions (a)𝐻𝑠= 1m, 𝑇
𝑚= 4 s, and Dir = 30∘ and (b)𝐻
𝑠= 1m, 𝑇
𝑚= 4 s, and Dir = 150∘.
𝑁 𝐻𝑠(m) 𝐸max (m
2/Hz/deg) Dir (deg) DSPR (deg) 𝑇𝑚/𝑇𝑝(s) Wlen (m) 𝑃
passing over a dam with a closed surface or as a constanttransmission coefficient which was the choice in the presentwork. Together with the command obstacle, either specularreflection, when the angle of reflection equals the angle ofincidence, or diffuse reflection, where incident waves arescattered over reflected direction, may be considered. In thisway, the effect on the waves in front of the wave arraysmight be also accounted for. To accommodate diffraction inSWAN simulations, a phase-decoupled refraction-diffractionapproximation is implemented. It is expressed in terms of thedirectional turning rate of the individual wave componentsin the 2D wave spectrum.The approximation is based on the
mild-slope equation for refraction and diffraction, omittingphase information. Therefore, this does not permit coherentwave fields in the computational domain. According to thetechnical data of the Wave Dragon device the transmissioncoefficient was set to 0.68 and the diffuse reflection coefficientto 0.2 (according to Harrington [33]).
5.1. Evaluations in the Geographical and in the SpectralSpaces. An in depth analysis of the wave conditions wasperformed. These correspond to two different situations thatwere considered in the present study, WD0 (without any
12 The Scientific World Journal
Table 5: Evaluation of the impact of the energy farms on the waves in the reference points OP1, OP2, and OP3 for the wave conditions (a)𝐻𝑠= 3m, 𝑇
𝑚= 6 s, and Dir = 30∘ and (b)𝐻
𝑠= 3m, 𝑇
𝑚= 6 s, and Dir = 150∘.
𝑁 𝐻𝑠(m) 𝐸max (m
2/Hz/deg) Dir (deg) DSPR (deg) 𝑇𝑚/𝑇𝑝(s) Wlen (m) 𝑃
device operating in the target area) and WD6 (with six WaveDragon devices operating in line in the target area).
In Figure 5, some reference points are illustrated; the firstreference point is denoted as BP and indicates the boundarypoint, and three other reference points are defined at 1.8 km
down wave from the WD farm, and they have been denotedas offshore points (OP). Moreover, in order to assess thecoastal impact of the wave farm by evaluating the wave-induced nearshore currents, seven reference lines (RL) werepositioned along the entire coast and they are denoted as
The Scientific World Journal 13
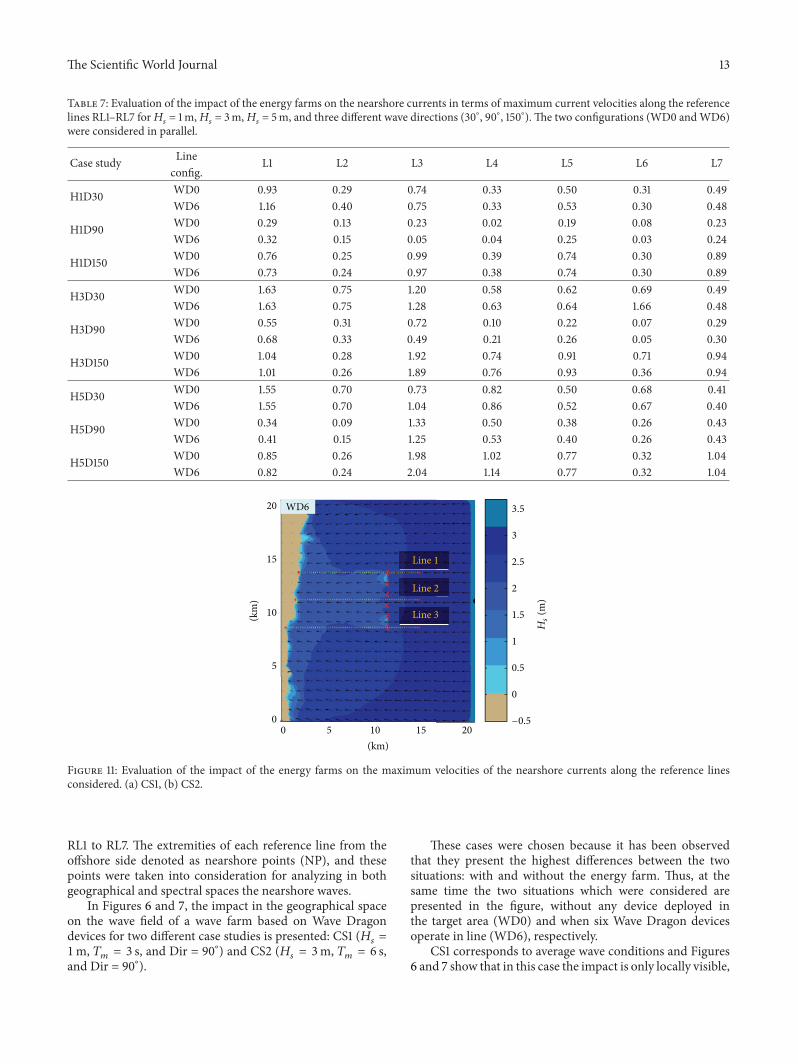
Table 7: Evaluation of the impact of the energy farms on the nearshore currents in terms of maximum current velocities along the referencelines RL1–RL7 for𝐻
𝑠= 1m,𝐻
𝑠= 3m,𝐻
𝑠= 5m, and three different wave directions (30∘, 90∘, 150∘). The two configurations (WD0 andWD6)
Figure 11: Evaluation of the impact of the energy farms on the maximum velocities of the nearshore currents along the reference linesconsidered. (a) CS1, (b) CS2.
RL1 to RL7. The extremities of each reference line from theoffshore side denoted as nearshore points (NP), and thesepoints were taken into consideration for analyzing in bothgeographical and spectral spaces the nearshore waves.
In Figures 6 and 7, the impact in the geographical spaceon the wave field of a wave farm based on Wave Dragondevices for two different case studies is presented: CS1 (𝐻𝑠 =1m, 𝑇𝑚 = 3 s, and Dir = 90∘) and CS2 (𝐻𝑠 = 3m, 𝑇𝑚 = 6 s,and Dir = 90∘).
These cases were chosen because it has been observedthat they present the highest differences between the twosituations: with and without the energy farm. Thus, at thesame time the two situations which were considered arepresented in the figure, without any device deployed inthe target area (WD0) and when six Wave Dragon devicesoperate in line (WD6), respectively.
CS1 corresponds to average wave conditions and Figures6 and 7 show that in this case the impact is only locally visible,
14 The Scientific World Journal
0
0.2
0.4
0.6
0.8
0 3 6 9 12
CS1
WD0WD6
Hs = 1m
Distance (km)
Hs
(a)
00
3 6 9 12
0.5
1
1.5
2
2.5
CS2
WD0WD6
Distance (km)
Hs = 3m
Hs
(b)
0
0
3 6 9 12
−5
−15
−20
−25
−30
−35Depth (m)
−10
Distance (km)
Hs
(c)
Figure 12:𝐻𝑠variation along the reference line 1 without and with WD farm (WD0, WD6) for the two cases considered (CS1, CS2) and the
variation of the water depth along the reference line.
the wave field being attenuated on a small area downwave thefarm. Nevertheless, as the wave height increases, the impactpropagates further towards the coast, like in CS2.
The evaluation in the spectral space of the Wave Dragonenergy farm impact is illustrated in Figures 8 and 9 for thesame two case studies (CS1 and CS2), where the 2D wavespectra were analyzed in parallel in the reference pointsOP2 and NP3 for the two different configurations considered(WD0 and WD6). In this figure a JONSWAP type spectrumwas considered.
The boundary point (BP) presents the wave conditionsunaffected in any way by the presence of the wave farm. Dueto the presence of the Wave Dragons, the single-peak JON-SWAP spectrum is transformed in a double peak spectrumimmediately after the WEC array (as, e.g., in OP2), but thisspectral shape does not propagate further in the geographicalspace, and at the level of the nearshore (the reference pointNP3) no significant difference occurs in terms of the spectralshapes between the two different configurations considered(WD0 and WD6).
In Tables 2 and 3, a detailed data representation ofthe wave variation is given for CS1 and CS2, respectively.This represents the values of the wave parameters in all thereference points defined (BP, OP1, OP2, OP3, NP1, NP2,NP3, NP4, NP5, NP6, and NP7) for the two configurationsconsidered (WD0 and WD6).
Some other relevant situations are presented in Tables4, 5, and 6; this time the analysis is being focused onlyon the offshore points (OP1, OP2, and OP3) where theinfluence of the wave energy farm is in fact really relevantfor the two situations mentioned before. The parametersconsidered in Tables 2, 3, 4, 5, and 6 are significant waveheight (𝐻𝑠), maximum variance (𝐸max), mean wave direction(Dir), directional spreading (DSPR), peak period (𝑇𝑝), meanperiod (𝑇𝑚), wavelength (Wlen), the components of theenergy transport (𝑃𝑥, 𝑃𝑦), and the components of the waveforces (𝐹𝑥, 𝐹𝑦).
The results presented in the above tables show again thatindeed relevant differences occur at the offshore referencepoints that were defined, while as regards the nearshore pointNP1–NP7, these differences are significant attenuated.
5.2. Assessment of the Impact on the Shoreline Dynamics.Various phenomena are generated by the energy dissipationin the coastal environment, and the most relevant are thenearshore currents because they contribute to the sedimenttransport affecting directly the coastal dynamics. It is thusvery important to find out how an energy farm will affect thenearshore circulation patterns by its presence in the marineenvironment and to estimate which will be the medium to
The Scientific World Journal 15
0
0.2
0.4
0.6
0.8
3 6 9 120
CS1
WD0WD6
Distance (km)
Hs
Hs = 1m
(a)
0.5
1
1.5
2
2.5
CS2
3 6 9 120
0
WD0WD6
Hs
Distance (km)
Hs = 3m
(b)
−10
−5
−15
−20
−25
−30
−35
0
3 6 9 120
Depth (m)
Distance (km)
Hs
(c)
Figure 13:𝐻𝑠variation along the reference line 2 without and with WD farm (WD0, WD6) for the two cases considered (CS1, CS2) and the
variation of the water depth along the reference line.
the long-term impact on the coastal dynamics of the energyfarm.
The nearshore currents were evaluated along the ref-erence lines RL1–RL7, for the two different configurationsconsidered (WD0 and WD6). The results concerning themaximum longshore current velocity are presented inTable 7.Table 7 presents the results corresponding to 𝐻𝑠 = 1m,𝐻𝑠 = 3m, and 𝐻𝑠 = 5m at three different wave directions(30∘, 90∘, and 150∘).
The maximum values of the velocities of the nearshorecurrents along the reference lines are illustrated in Figure 10for both case studies considered (CS1 and CS2). As the resultsshow, the influence of the wave farm over the nearshorecurrents appear in all the points but in general is not veryhigh. From the analysis of data from the simulations, it hasbeen observed that themost sensitive direction is that normalto the shoreline (90∘) and the highest decrease of the currentvelocity appears in NP3.
An additional issue is related to the assessment of theevolution of the waves after their impact with the body of theWD farm structures. For that, the 𝐻𝑠 variations have beenanalyzed along three reference lines passing through thewaveenergy farm in different locations, as illustrated in Figure 11.
The results are presented in Figure 12 (for line 1), Figure 13(for line 2), and Figure 14 (for line 3). They all presentthe evolution of the waves for the two situations WD0(blue) and WD6 (red). The bathymetric variation along thereference lines is also illustrated in each figure. As it can beseen, the most relevant impact occurs at the reference line 1in both cases (CS1, CS2), and the lowest is at the reference line2 due to the fact that the line is passing between two deviceswhile in the other two cases the lines pass directly throughthe body of one WD.
Finally, in order to complete the picture, another casestudy that was analyzed will be presented. It considers thefollowing conditions on the external boundaries: 𝐻𝑠 = 5m,𝑇𝑚 = 8 s, and Dir = 30∘. Thus, Figure 15 illustrates the impactin the geographical space on the wave field and Figure 16the evaluation in the spectral space of the impact on thewave field of the Wave Dragon farm. In this case study, themaximum values of the velocities of the nearshore currentsalong the reference lines are illustrated in Figure 17. In suchsituation, the results of themodelling system indicate that thepresence of the energy farm leads this time to an increaseof the nearshore currents in most places. Finally, Figure 18presents the 𝐻𝑠 variation along the three reference lines
16 The Scientific World Journal
0
0.2
0.4
0.6
0.8
0 3 6 9 12
CS1
WD0WD6
Distance (km)
Hs
Hs = 1m
(a)
0.5
1
1.5
2
2.5
CS2
00
3 6 9 12
WD0WD6
Distance (km)
Hs
Hs = 3m
(b)
−10
−5
−15
−20
−25
−30
−35
0
Depth (m)
0 3 6 9 12
Distance (km)
Hs
(c)
Figure 14:𝐻𝑠variation along the reference line 3 without and with WD farm (WD0, WD6) for the two cases considered (CS1, CS2) and the
variation of the water depth along the reference line.
20
15
10
5
0
WD0
0 5 10 15 20
Hs = 5m
(km)
(km
)
Tm = 8 sDir = 30
∘
(a)
1
0
2
3
4
5
0 5 10 15 20
WD620
15
10
5
0
Hs = 5mTm = 8 s
(km
)
(km)
Hs
(m)
Dir = 30∘
(b)
Figure 15:𝐻𝑠variation along the reference line 3 without and with WD farm (WD0, WD6) for the two cases considered (CS1, CS2) and the
variation of the water depth along the reference line.
The Scientific World Journal 17
0.1
(m2 s/deg)
0.2
0.3
0.4
N
S
W E
Dire
ctio
n (d
eg)/
frequ
ency
(Hz)
BP
(a)
0.1
(m2 s/deg)
0.2
0.3
0.4
N
S
W E
Dire
ctio
n (d
eg)/
frequ
ency
(Hz) WD0
OP2
(b)
0.1
0.2
0.3
0.4
N
S
W E
Dire
ctio
n (d
eg)/
frequ
ency
(Hz)
0.1
0.2
0.3
0.4
0.5
0.6
0.7
0.8
0.9
1
(m2 s/deg)
WD0
NP3
Nor
mal
ized
var
ianc
e
(c)
0.10.1
(m2 s/deg)
0.2
0.3
0.4
N
S
W E
Dire
ctio
n (d
eg)/
frequ
ency
(Hz)
OP2
WD6
H = 5mT = 8 sDir = 30
∘
(d)
0.1
0.2
0.3
0.4
N
S
W E
Dire
ctio
n (d
eg)/
frequ
ency
(Hz)
(m2 s/deg)
0.1
0.2
0.3
0.4
0.5
0.6
0.7
0.8
0.9
1
H = 5mT = 8 sDir = 30
∘
WD6
NP3
Nor
mal
ized
var
ianc
e
(e)
Figure 16: Evaluation in the spectral space of the impact on the wave field of a wave farm based on Wave Dragon WECs that operate in thetarget area for an additional case study defined by the parameters𝐻
𝑠= 5m, 𝑇
𝑚= 8 s, Dir = 30∘. (a) BP for WD0. (b) OP2 for WD0. (c) NP3
for WD0. (d) OP2 for WD6. (e) NP3 for WD6.
previously considered, for the two different situationswithoutand with the WEC array.
6. Concluding Remarks
According to the EU requirements, 20% of the electric energyproduced in Europe should be provided until 2020 by renew-able energy sources. In this connection, the marine environ-ment represents a vast space depositing a huge amount ofrenewable energy. Nevertheless, the most important problemrelated to harvesting the energy in themarine environment isrepresented by the high cost of the electric power produced.As regards the wave energy extraction, the most significantstep in the direction of reducing the energy cost is representedby the implementation of large WEC arrays. Thus, large scaleWEC deployments are expected in the near future, and avery important issue related to this perspective is to evaluatecorrectly the possible coastal impact of these new powerplants operating in the nearshore. In this context, the presentwork presents an evaluation of the changes induced in the
coastal wave climate by an array of six Wave Dragons. Thetarget area considered is located in the western side of theBlack Sea, but the methodology can be easily extended to anycoastal environment.
As regards the wave transformation, the modelling sys-tem considered in these evaluations is based on the SWANspectral model, which represents an adequate frameworkfor accounting the wave changes due to the presence ofthe energy farm. Evaluations were carried out in bothgeographical and spectral spaces for various relevant wavepatterns. The results show that while immediately after thefarm drastic changes occur in the wave fields, thus graduallyattenuate towards the coast. In order to assess better thechanges taking place in the spectral shapes due to the energyfarm, transformations of theoretical JONSWAP spectra werefollowed for each case study considered. The results usuallyshow that the single-peaked wave spectra are usually changedby the wave farm to double-peaked spectra immediatelydown wave the farm, but the spectra become again single-peaked at the level of the breaking line. This is also due to
18 The Scientific World Journal
1 2 3 4 5 6 70.2
0.4
0.6
0.8
1
1.2
1.4
1.6
Line number
WD0WD6
𝐻 = 5m𝑇 = 8 sDir = 30
∘
Vcm
ax(m
/s)
Figure 17: Evaluation of the impact of the energy farms on the maximum velocities of the nearshore currents along the reference linesconsidered for an additional case study defined by the parameters𝐻
𝑠= 5m, 𝑇
𝑚= 8 s, and Dir = 30∘.
0
1
2
3
4
WD0WD6
Line 10 3 6 9 12
Distance (km)
Hs
(a)
1
2
3
4
0Line 2
0 3 6 9 12
WD0WD6
Distance (km)
Hs
(b)
0
1
2
3
4
Line 3
0 3 6 9 12
WD0WD6
Distance (km)
Hs
(c)
Figure 18: 𝐻𝑠variation along the three reference lines without and with the WEC array (WD0 and WD6) for the wave conditions
corresponding to the parameters:𝐻𝑠= 5m, 𝑇
𝑚= 8 s, and Dir = 30∘.
The Scientific World Journal 19
the relatively large distance between the shoreline and thelocation of the wave farm.
In order to assess better the changes at the level of theshoreline dynamics, the modelling system ISSM that joinsSWANwith the 1D surf models was considered.This allowedan evaluation of the longshore currents. The results showthat although the nearshore waves are not very much affectedby the presence of the WD farm, the maximum currentvelocities may, however, have significant variations. Thesevariations are most evident at the central nearshore points.The results show also that the longshore current velocity is amore sensitive parameter to the presence of the energy farmthan the significant wave height.
Since in general the presence of the energy farm hasled to slight decreases of the wave conditions, its influenceat the level of the shoreline dynamics is expected to berather positive. Nevertheless, a very interesting result comingfrom the present work is that sometimes the presence ofthe energy farm may lead locally to enhancements of thelongshore current velocity which means that due to thespecific features of the site some coastal processes might bealso accentuated. The work is still ongoing and larger WECarrays, both of one and two lines, are being considered, whichmeans that more accentuated changes might be expected forsuch configurations.
Acknowledgment
Thework of the first author has beenmade in the scope of theproject SOP HRD—EFICIENT 61445/2009 (ManagementSystem for the Fellowships Granted to the Ph.D. Students).
References
[1] J. F. Chozas, H. C. Sørensen, and N. E. Helstrup Jensen, “Eco-nomic benefit of combining wave and wind power productionsin day-ahead electricity markets,” in Proceedings of the 4thInternational Conference on Ocean Energy, 2012.
[2] J. F. Chozas, “Predictability of wave energy and electricitymarkets,”Modern Energy Review, vol. 4, no. 1, pp. 57–59, 2012.
[3] L. Rusu, “Application of numerical models to evaluate oil spillspropagation in the coastal environment of the Black Sea,” Jour-nal of Environmental Engineering and Landscape Management,vol. 18, no. 4, pp. 288–295, 2010.
[4] L. Rusu and A. Ivan, “Modelling wind waves in the romaniancoastal environment,” Environmental Engineering and Manage-ment Journal, vol. 9, no. 4, pp. 547–552, 2010.
[5] E. Rusu and S. Macuta, “Numerical modelling of longshorecurrents in marine environment,” Environmental Engineeringand Management Journal, vol. 8, no. 1, pp. 147–151, 2009.
[6] C. V. Trusca, “Reliability of SWAN model simulations forthe Black Sea Romanian coast,” in Proceedings of the 12thInternational Congress of the International Maritime Associationof theMediterranean (IMAM ’05), Maritime Transportation andExploitation of Ocean and Coastal Resources, pp. 1159–1165,September 2005.
[7] A. Babarit, J. Hals, M. J. Muliawan, A. Kurniawan, T. Moan, andJ. Krokstad, “Numerical benchmarking study of a selection ofwave energy converters,” Renewable Energy, vol. 41, pp. 44–63,2012.
[8] C. Beels, Optimization of the Lay-out of a Farm of Wave EnergyConverters in the North Sea: Analysis of Wave Power Resources,Wake Effects, Production and Cost, Ghent University, Faculty ofEngineering, Belgium, China, 2009.
[9] J. H. Nørgaard, T. L. Andersen, and J. P. Kofoed, “Wavedragon wave energy converters used as coastal protection,”in proceedings of the 6th International Conference on CoastalStructures, Imperial College Press, 2011.
[10] J. H. Nørgaard, T. L. Andersen, and J. P. Kofoed, “Wave dragonwave energy converters used as coastal protection: a physicalmodel test study,” in Proceesings of the International Conferenceon Coastal Structures, The Coasts, Oceans, Ports, and RiversInstitute (COPRI), The American Society of Civil Engineers,Yokohama, Japan, September 2001.
[11] D. L. Millar, H. C. M. Smith, and D. E. Reeve, “Modellinganalysis of the sensitivity of shoreline change to a wave farm,”Ocean Engineering, vol. 34, no. 5-6, pp. 884–901, 2007.
[12] A. Palha, L. Mendes, C. J. Fortes, A. Brito-Melo, and A.Sarmento, “The impact of wave energy farms in the shorelinewave climate: Portuguese pilot zone case study using Pelamisenergy wave devices,” Renewable Energy, vol. 35, no. 1, pp. 62–77, 2010.
[13] S. Ponce de Leon, J. H. Bettencourt, and N. Kjerstad, “Simula-tion of irregular waves in an offshore wind farm with a spectralwavemodel,”Continental Shelf Research, vol. 31, no. 15, pp. 1541–1557, 2011.
[14] E. Rusu, “Modelling of wave-current interactions at the mouthsof the Danube,” Journal of Marine Science and Technology, vol.15, no. 2, pp. 143–159, 2010.
[15] N. Booij, R. C. Ris, and L. H. Holthuijsen, “A third-generationwave model for coastal regions 1. Model description andvalidation,” Journal of Geophysical Research C, vol. 104, no. 4,pp. 7649–7666, 1999.
[16] M. S. Longuet-Higgins, “Longshore currents generated byobliquely incident sea waves. Parts 1 and 2,” Journal of Geophys-ical Research, vol. 75, no. 33, pp. 6778–6801, 1970.
[17] I. A. Svendsen, K. Haas, and Q. Zhao, Quasi-3D NearshoreCirculationModel SHORECIRC,Version 2. 0, Center forAppliedCoastal Research, University of Delaware, Newark, NJ, USA,2002.
[18] T. R. Mettlach, M. D. Earle, and Y. L. Hsu, Software DesignDocument For the Navy Standard SurfModel, Version 3. 2, NavalResearch Laboratory, Stennis Space Center, Miss, USA, 2002.
[19] D. C. Conley and E. Rusu, “Tests of wave shoaling and surfmodels in a partially enclosed basin,” in Proceedings of the 12thInternational Congress of the International Maritime Associationof theMediterranean (IMAM ’05), Maritime Transportation andExploitation of Ocean and Coastal Resources, pp. 1015–1021,2006.
[20] E. Rusu, D. Conley, and E. Ferreira-Coelho, “A hybrid frame-work for predicting waves and longshore currents,” Journal ofMarine Systems, vol. 69, no. 1-2, pp. 59–73, 2008.
[21] J. P. Kofoed, P. Frigaard, E. Friis-Madsen, and H. C. Sørensen,“Prototype testing of the wave energy converter wave dragon,”Renewable Energy, vol. 31, no. 2, pp. 181–189, 2006.
[22] L. Szabo and C. Oprea, “Wave energy plants for the blacksea: possible energy converter structures,” in Proceedings of theInternational Conference on Clean Electrical Power (ICCEP ’07),pp. 306–311, May 2007.
[23] F. Onea, Studies Concerning the Renewable Energy Extraction inMarine Environment with Applications to the Black Sea Basin[Ph.D. thesis], Galati University Dunarea de Jos, 2013.
20 The Scientific World Journal
[24] R. Mateescu, D. Diaconeasa, S. Alina, and V. Malciu, “Hydro-geomorphological processes in the transitional romanian BlackSea Coast, their consequences on the masterplan for Coastalprotection implementation,” Journal of Environmental Protec-tion and Ecology, vol. 13, no. 3, pp. 1664–1672, 2012.
[25] A. Stanica, M. Stancheva, G. V. Ungureanu et al., “Types andimpacts of maritime hydraulic structures on the Romanian-Bulgarian Black Sea coast: Setting-up a common catalogue forGIS-based coastline classification,”Geo-Eco-Marina, vol. 18, pp.105–113, 2012.
[26] B. Negreanu-Pırjol, T. Negreanu-Pırjol, G. Paraschiv et al.,“Physical-chemical characterization of some green and redmacrophyte algae from the Romanian Black Sea littoral,” Sci-entific Study and Research, vol. 12, no. 2, pp. 173–184, 2011.
[27] D. Rosioru, V. Coatu, A. Oros, D. Vasiliu, and D. Tiganus,“Marine environment quality of the growth and exploitation ofthe main molluscs from the Romanian Black Sea,” Journal ofEnvironmental Protection and Ecology, vol. 13, no. 3, pp. 1799–1805, 2012.
[28] A. Stanica, S. Dan, and V. G. Ungureanu, “Coastal changes atthe Sulina mouth of the Danube River as a result of humanactivities,”Marine Pollution Bulletin, vol. 55, no. 10-12, pp. 555–563, 2007.
[29] P. Anastasiu, G. Negrean, C. Samoila, D.Memedemin, andD. A.Cogalniceanu, “comparative analysis of alien plant species alongthe Romanian Black Sea coastal area. The role of harbours,”Journal of Coastal Conservation, vol. 15, no. 4, pp. 595–606, 2011.
[30] D. Sava, M. Paraschiv, M. D. Samargiu, and L. Tofan, “Influenceof nutrients onmacrophytic red algae of the romanian black seacoast,” Journal of Environmental Protection and Ecology, vol. 12,no. 4, pp. 2001–2010, 2011.
[31] V. Nita, S. Diaconescu, T. Zaharia, V. Maximov, C. Nicolae,and D. Micu, “The characterization of the main habitat typespopulated by the Black Sea Turbot in its different stages ofdevelopment,” AACL Bioflux, vol. 4, no. 5, pp. 552–570, 2011.
[32] A. Novac, V. Surugiu, A. Teaca, and T. Begun, “The distri-butional patterns of the zoobenthos from the artificial hardsubstratum of the Agigea dyke (Romanian Black Sea coast):preliminary results,” Freiberg Online Geoscience, vol. 22, pp. 39–44, 2009.
[33] N. J. Harrington, “Wave Hub Technical Studies: impacts oninshore surfing beaches,” Tech. Rep., South West of EnglandRegional Development Agency, Plymouth, Mass, USA, 2007.