Page 1
http://waikato.researchgateway.ac.nz/
Research Commons at the University of Waikato Copyright Statement:
The digital copy of this thesis is protected by the Copyright Act 1994 (New Zealand).
The thesis may be consulted by you, provided you comply with the provisions of the Act
and the following conditions of use:
Any use you make of these documents or images must be for research or private
study purposes only, and you may not make them available to any other person.
Authors control the copyright of their thesis. You will recognise the author’s right to
be identified as the author of the thesis, and due acknowledgement will be made to
the author where appropriate.
You will obtain the author’s permission before publishing any material from the thesis.
Page 2
Supply Chain Integration:
A Case-based Investigation of
Status, Barriers, and Paths to
Enhancement
A thesis submitted for the degree
of
Doctor of Philosophy in Management Systems
at
The University of Waikato
by
Tillmann Böhme
Page 3
I
Abstract
In a global marketplace supply chain integration is recognised to be one of today‟s
competitive advantages; where the aim is to optimise material- and information-
flows inside the focal company and also across supply chain companies. However,
many academics report that such supply chain excellence is still rare, and that
guidance is missing on how supply chain integration is achieved in practise. This
exploratory research utilised a stepwise methodology to investigate pathways to
supply chain integration. First, a suitable investigation method was identified and
further developed, before being used to assess the current status of supply chain
integration in New Zealand. Next, because removal of barriers is recognised to be
crucial, the internal and external barriers to supply chain integration were
investigated. Finally, longitudinal case studies were used to investigate ways of
supply chain integration enhancement and to develop a deeper and more complete
understanding of current integration status, barriers, and ways of enhancement. In
total, some 240 person days were spent in eleven different companies from
multiple industry sectors to investigate supply chain integration in practise.
Current practises of a large sample of New Zealand value streams were evaluated
using the Quick Scan Audit Methodology. The Quick Scan Audit Methodology is
carried out by a team of researchers (investigator triangulation) which utilise
multiple and rigorous data collection techniques and methods (data- and method
triangulation). The research revealed that supply chain integration practise rarely
resembles the theoretical ideal and, similarly, seldom do available supply chain
integration models reflect reality. Also, New Zealand value streams are
significantly less integrated on the customer side compared to the supplier side.
Further, every case company was found to face significant barriers to supply chain
integration. Managerial, socio-cultural factors are the major obstacles to internal
supply chain integration resulting in functional silos. Similarly, power and
dependency issues limit the levels of integration achieved externally.
The research revealed that good top management support and favourable external
dependencies offer the best setting for enhancing supply chain integration in
practise. However, if a focal company lacks top management support and/or has
Page 4
II
an unfavourable dependency structure, the focal company chooses the path of
least resistance when integrating its supply chain. Also, supply chain managers
and change agents address people factors and cultural change first, before
addressing either internal process issues or external relationship issues; after
which communication technology upgrades are addressed. Finally, this
exploratory study yielded some early insights that the speed of supply chain
integration development in practise follows a learning curve trajectory.
Page 5
III
Dedicated to:
My parents, Petra and Stephan Böhme
Your love and support have encouraged me to keep pursuing challenges in my
life. I could not have done it without you.
Page 6
IV
Acknowledgements
In the effort of completing this thesis over the past four years, a great many people
have provided me with invaluable help along the way. I would like to thank my
doctoral supervisor, A. Prof. Paul Childerhouse, for his guidance and constant
encouragement throughout this research. Paul has been instrumental in developing
my critical thinking ability to analyse and synthesize the subject matter. I am also
grateful to A. Prof. Eric Deakins, for his counsel and support. Finally, Prof. Jim
Corner who provided excellent guidance writing this thesis into a cohesive whole.
Further, I would like to thank:
All the members of the various Quick Scans.
Agmardt research fund for providing financial support.
All the industrialists who provided invaluable case data.
Cardiff University‟s Logistic Systems Dynamics Group (LSDG) and here
especially Prof Denis Towill and Dr Andrew Potter who provided helpful
feedback on my research.
Henrike, Philipp, Katrin, and Laurenz Böhme, my grandmother Gisela
Glatzel, family Thomas Glatzel, family Roswitha Horner, and family
Katrin Glatzel for constant encouragement on my PhD journey.
On a more personal note, I am indebted to my partner Paula Kristina Herlin, who
encouraged me to stay focused and patient in every stage of my research. I would
like to thank Paula for her love, kindness and faith in me.
Page 7
V
Contents 1. Introduction ......................................................................................................... 1
1.1 Background ................................................................................................... 1
1.2 Investigating supply chain integration in practise ......................................... 2
1.3 Potential value of research contribution ........................................................ 3
1.4 Overview of the Thesis ................................................................................. 3
2. Literature Review ................................................................................................ 7
2.1 Introduction ................................................................................................... 7
2.2 Research Area ............................................................................................... 7
2.3 Supply chain management: A theoretical framework ................................... 9
2.4 Evolution of the supply chain management concept .................................. 11
2.5 The span of the supply chain management concept .................................... 13
2.5.1 Strategic management .......................................................................... 14
2.5.2 Logistics ............................................................................................... 15
2.5.3 Marketing ............................................................................................. 16
2.5.4 Relationships ........................................................................................ 16
2.5.5 Best practise ......................................................................................... 17
2.5.6 Organisational behaviour ..................................................................... 18
2.6 Supply chain management in New Zealand ................................................ 19
2.7 Supply chain assessment techniques ........................................................... 21
2.7.1 Supply Chain Operations Reference Model (SCOR) .......................... 21
2.7.2 Collaboration Index .............................................................................. 22
2.7.3 Logistics Scorecard .............................................................................. 22
2.7.4 Benchmarking of logistical operations................................................. 22
2.7.5 SCMAT ................................................................................................ 23
2.7.6 The diagnostic tool ............................................................................... 23
2.7.7 Quick Scan Audit Methodology .......................................................... 23
Page 8
VI
2.7.8 Cross analysis of key supply chain assessment techniques ................. 24
2.8 Supply chain integration ............................................................................. 25
2.8.1 The three layers of supply chain integration confusion ....................... 26
2.8.2 Author‟s view of supply chain integration ........................................... 31
2.9 Barriers and enablers to supply chain integration ....................................... 33
2.9.1 Internal barriers and enablers to supply chain integration ................... 33
2.9.2 External barriers and enablers to supply chain integration .................. 36
2.10 Supply chain change ................................................................................. 37
2.10.1 Continuous Improvement ................................................................... 38
2.10.1.1Kaizen ...................................................................................... 38
2.10.1.2 Quality Circle .......................................................................... 38
2.10.1.3 Six Sigma ................................................................................ 39
2.10.1.4 Total Quality Management ..................................................... 39
2.10.1.5 Hybrid Methods ...................................................................... 40
2.10.2 Business process reengineering.......................................................... 40
2.10.2.1 Process .................................................................................... 42
2.10.2.2 People ...................................................................................... 43
2.10.2.3 Technology .............................................................................. 43
2.10.2.4 Innovation ............................................................................... 43
2.11 Achieving supply chain integration .......................................................... 44
2.11.1 Supply chain integration in theory and practise ................................. 44
2.11.2 Pathways to supply chain integration ................................................. 45
2.11.3 Assessing supply chain integration in practise................................... 48
2.11.3.1 Information generation and sharing ........................................ 49
2.11.3.2 Relationship management ....................................................... 51
2.11.3.3 Technology integration ........................................................... 53
2.11.3.4 People ...................................................................................... 54
Page 9
VII
2.11.3.5 Performance Outcome ............................................................. 57
2.12 Conclusion ................................................................................................ 59
3. Research Problem Definition ............................................................................ 61
3.1 Introduction ................................................................................................. 61
3.2 Procedure for investigating supply chain integration.................................. 62
3.3 Research Questions ..................................................................................... 63
3.4 Scope and boundaries of the thesis ............................................................. 64
3.5 Conclusion .................................................................................................. 67
4. Research Methodology...................................................................................... 68
4.1 Introduction ................................................................................................. 68
4.2 Paradigms .................................................................................................... 69
4.2.1 Paradigms applied in supply chain management research ................... 71
4.3 Research Questions ..................................................................................... 72
4.4 Case study research ..................................................................................... 74
4.5 Methodological process within case study research ................................... 78
4.6 Case selection .............................................................................................. 80
4.6.1 Background of selected cases .............................................................. 81
4.7 Role of the case study researcher ................................................................ 87
4.8 Data collection and data analysis ................................................................ 88
4.8.1 Quick Scan Audit Methodology (QSAM) ........................................... 88
4.8.1.1 The development of the QSAM ................................................. 88
4.8.1.2 Scope of the QSAM ................................................................... 89
4.8.1.3 The QSAM process .................................................................... 90
4.8.1.4 Data collection techniques utilised during a Quick Scan ........... 93
4.8.1.5 QSAM‟s position within research paradigms ............................ 95
4.8.1.6 Research outputs generated by the QSAM ................................ 96
4.8.1.7 Value to practitioners ................................................................. 98
Page 10
VIII
4.8.1.8 SWOT analysis of the QSAM .................................................... 99
4.8.1.9 QSAM adaption to longitudinal case data ............................... 100
4.8.2 External relationship evaluation method ............................................ 102
4.8.3 Structured interview ........................................................................... 103
4.8.4 Timeframe .......................................................................................... 103
4.9 Theory building from case study research ................................................ 104
4.10 Limitations of case study research .......................................................... 105
4.11 Discussion ............................................................................................... 107
4.12 Conclusion .............................................................................................. 109
5. Supply Chain Integration in New Zealand ...................................................... 110
5.1 Introduction ............................................................................................... 110
5.2 Supply chain integration ........................................................................... 111
5.2.1 The supply chain uncertainty circle ................................................... 112
5.3 Supply chain integration in New Zealand ................................................. 114
5.3.1 Application of the supply chain uncertainty circle ............................ 114
5.3.1.1 Detailed uncertainty analysis ................................................... 116
5.3.1.1.1 Control and process uncertainty ................................... 116
5.3.1.1.2 Supply and demand uncertainty ................................... 119
5.3.1.2 Supply chain uncertainty benchmarking .................................. 122
5.3.2 Application of the integration evaluation tool ................................... 123
5.3.3 Comparison of the UK automotive sector with NZ data set .............. 125
5.4 Validation of existing supply chain integration models ............................ 127
5.5 Discussion ................................................................................................. 132
5.6 Conclusion ................................................................................................ 134
6. Barriers to Internal Supply Chain Integration ................................................. 136
6.1 Introduction ............................................................................................... 136
6.2 Barriers to internal supply chain integration ............................................. 136
Page 11
IX
6.2.1 Environment level .............................................................................. 138
6.2.2 Company level ................................................................................... 139
6.2.3 Value stream level .............................................................................. 141
6.3 Cause and effect analysis .......................................................................... 141
6.4 Investigation into barriers to supply chain integration .............................. 143
6.4.1 Forestry: Internal barrier assessment ................................................. 143
6.4.2 Manufacturer 2: Internal barrier assessment ...................................... 145
6.4.3 Dairy 1: Internal barrier assessment ................................................... 146
6.4.4 Steel: Internal barrier assessment ....................................................... 148
6.4.5 Service: Internal barrier assessment ................................................... 149
6.4.6 Food 1: Internal barrier assessment.................................................... 150
6.5 Cross-case Analysis .................................................................................. 151
6.6 Discussion ................................................................................................. 154
6.7 Conclusion ................................................................................................ 159
7. Barriers to External Supply Chain Integration ................................................ 160
7.1 Introduction ............................................................................................... 160
7.2 Barriers to external integration.................................................................. 161
7.3 Method used to investigate power and dependency .................................. 166
7.4 Investigation into barriers to external integration ..................................... 168
7.4.1 Findings in Steps 1 and 2: Scoping and evaluating relationships ...... 168
7.4.2 Findings in Step 3: Identification of key variables ............................ 171
7.4.3 Findings in Step 4: Idealised supplier relationship ............................ 173
7.4.5 Comparison of current relationships with the ideal ........................... 175
7.4.6 Overcoming power and dependency to external integration.............. 176
7.5 Cross-Case Analysis ................................................................................. 177
7.6 Discussion ................................................................................................. 179
7.7 Conclusion ................................................................................................ 182
Page 12
X
8. Achieving Supply Chain Integration in Practise ............................................. 184
8.1 Introduction ............................................................................................... 184
8.2 Pathways to supply chain integration ........................................................ 185
8.2.1 Key enablers for supply chain integration ......................................... 186
8.3 Method for investigating the pathways to integration............................... 187
8.4 Individual longitudinal case study findings .............................................. 190
8.4.1 Manufacturer 2: Change process ....................................................... 190
8.4.2 Forestry: Change process .................................................................. 195
8.4.3 Dairy 1: Change process .................................................................... 199
8.4.4 Food 1: Change process ..................................................................... 204
8.5 Cross-Case Analysis ................................................................................. 207
8.5.1 Cross-case analysis of supply chain change processes ...................... 208
8.5.2 Assessing the affects of change via the integration evaluation tool... 209
8.5.3 Assessing the affects of change using the uncertainty circle ............. 211
8.5.4 Future supply chain improvement outline.......................................... 214
8.6 Discussion ................................................................................................. 216
8.7 Conclusion ................................................................................................ 222
9. Discussion ....................................................................................................... 224
9.1 Supply chain integration in practise: An exploration ................................ 224
9.1.1 Current supply chain status ................................................................ 225
9.1.2 Barriers to supply chain integration ................................................... 226
9.1.3 Achieving supply chain integration in practise .................................. 227
9.2 Areas of investigation where further evidence is required........................ 230
9.2.1 Current supply chain status ................................................................ 230
9.2.2 Barriers to supply chain integration ................................................... 231
9.2.3 Achieving supply chain integration in practise .................................. 231
9.3 Research strengths ..................................................................................... 232
Page 13
XI
10. Conclusion .................................................................................................... 233
10.1 Original contribution ............................................................................... 234
10.1.1 Quick Scan Audit Methodology ...................................................... 234
10.1.2 Supply chain integration in New Zealand ........................................ 234
10.1.3 Internal and environmental barriers to supply chain integration ..... 235
10.1.4 Power and dependency barriers to external integration ................... 235
10.1.5 Achieving supply chain integration ................................................. 236
10.2 Relevance of thesis to industry and practitioners .................................... 240
10.3 Further Research ..................................................................................... 242
10.3.1 Investigation into supply chain integration ...................................... 242
10.3.2 Investigation into supply chains practise ......................................... 243
10.3.3 Barriers to supply chain integration ................................................. 243
10.3.4 Achieving supply chain integration ................................................. 244
References ........................................................................................................... 245
Appendices .......................................................................................................... 261
Appendix A: Gimenz (2004) investigation into supply chain integration ...... 261
Appendix B: Further supply chain assessment techniques ............................. 263
Appendix C: Supply chain integration maturity questionnaire ....................... 265
Appendix D: Quick Scan reports .................................................................... 271
Appendix E: Euclidean Norm ......................................................................... 290
Appendix F: Cause and effect diagrams ......................................................... 294
Appendix G: Power and dependency in external relationships ...................... 299
Appendix H: Supply chain integration evaluation scores ............................... 306
Reflection of the study of supply chain integration ............................................ 307
Reflection of the PhD journey ............................................................................ 308
Vita ...................................................................................................................... 309
Page 14
XII
List of Figures
Figure 1.1: Five step procedure to investigate supply chain integration in practise
................................................................................................................................. 2
Figure 2.1: Scope of research area ........................................................................ 8
Figure 2.2: Integrated supply chain model ........................................................... 32
Figure 2.3: Supply chain integration model by Stevens (1989) ............................ 46
Figure 3.1: Five step procedure to investigate supply chain integration in practise
............................................................................................................................... 62
Figure 3.2: Order of research questions addressed in this thesis ........................ 63
Figure 3.3: Scope and boundaries of the thesis .................................................... 65
Figure 4.1: The subjective-objective dimension ................................................... 69
Figure 4.2: Applied methodological process ........................................................ 79
Figure 4.3: The UDSO business process re-engineering procedure .................... 90
Figure 4.4: Mapping out eight research methods ................................................. 95
Figure 4.5: Scope and depth of understanding gained via QS analysis ............... 96
Figure 5.1: The supply chain uncertainty circle ................................................. 112
Figure 5.2: Steel’s supply chain map .................................................................. 118
Figure 5.3: Comparison of supply and demand uncertainty .............................. 120
Figure 5.4: Uncertainty benchmark of the New Zealand sample ....................... 123
Figure 5.5: Outcome of the application of the integration assessment tool ....... 124
Figure 5.6: Validation of integration assessment tool using value streams 1-18125
Figure 5.7: Benchmark comparison between NZ and UK automotive ............... 127
Figure 5.8: Adapted version of the supply chain uncertainty circle ................... 128
Figure 5.9: Validation of Stevens (1989) integration model (NZ data) .............. 129
Figure 5.10: Validation of Frohlich & Westbrook’s (2001) integration model . 131
Figure 5.11: Proposed supply chain integration model ..................................... 133
Figure 6.1: Three layers of internal supply chain integration barriers ............. 138
Figure 6.2: Cardiff BPR change model .............................................................. 140
Figure 6.3: Cause-effect diagram: Dairy 1 ........................................................ 142
Figure 6.4: Cross-Case comparison for barriers to supply chain integration ... 152
Figure 6.5: Interrelation of key barriers to internal supply chain integration ... 157
Figure 7.1: Power and dependency dyadic relationship model ......................... 165
Page 15
XIII
Figure 7.2: Five-step process to investigate power and dependency ................. 167
Figure 7.3: Key supplier dependency variables ................................................. 171
Figure 7.4: Key buyer dependency variables ..................................................... 172
Figure 7.5: Supplier relationship evaluation ...................................................... 174
Figure 7.6: Misalignments of current and idealised relationships ..................... 175
Figure 7.7: Preconditions to external integration .............................................. 180
Figure 8.1: Proposed supply chain integration model (see also Figure 5.11) ... 186
Figure 8.2: Preconditions to achieving a fully integrated, seamless supply chain
............................................................................................................................. 187
Figure 8.3: Preconditions for achieving a seamless supply chain: Manufacturer 2
............................................................................................................................. 190
Figure 8.4: Longitudinal internal barrier assessment: Manufacturer 2 ............ 192
Figure 8.5: Integration assessment: Manufacturer 2 ......................................... 193
Figure 8.6: Supply chain performance improvement: Manufacturer 2 .............. 194
Figure 8.7: Supply chain uncertainty improvement: Manufacturer 2 ................ 194
Figure 8.8: Preconditions for achieving a seamless supply chain: Forestry ..... 195
Figure 8.9: Longitudinal internal barrier assessment: Forestry ........................ 196
Figure 8.10: Integration assessment: Forestry ................................................... 197
Figure 8.11: Supply chain performance improvement: Forestry ....................... 198
Figure 8.12: Supply chain uncertainty improvement: Forestry ......................... 199
Figure 8.13: Preconditions for achieving a seamless supply chain: Dairy 1 ..... 199
Figure 8.14: Longitudinal internal barrier assessment: Dairy 1 ....................... 201
Figure 8.15: Integration assessment: Dairy 1 .................................................... 202
Figure 8.16: Supply chain performance improvement: Dairy 1 ......................... 202
Figure 8.17: Supply chain uncertainty improvement: Dairy 1 ........................... 203
Figure 8.18: Preconditions for achieving a seamless supply chain: Food 1 ..... 204
Figure 8.19: Longitudinal internal barrier assessment: Food 1 ........................ 205
Figure 8.20: Integration assessment: Food 1 ..................................................... 206
Figure 8.21: Supply chain performance improvement: Food 1 ......................... 206
Figure 8.22: Supply chain uncertainty improvement: Food 1 ............................ 207
Figure 8.23: Integration assessment across the four cases ................................ 209
Figure 8.24: Supply chain performance improvement across the four cases ..... 210
Figure 8.25: Uncertainty reduction .................................................................... 211
Figure 8.26: Validation of proposed integration model ..................................... 213
Page 16
XIV
Figure 8.27: Expected future pathways to supply chain integration .................. 215
Figure 8.28: Sequencing of target areas to further integrate the supply chain .. 218
Figure 8.29: Speed of supply chain integration .................................................. 220
Figure 9.1: Five step procedure to investigate supply chain integration in practise
............................................................................................................................. 225
Figure 9.2: Implications of the research for the wider integration landscape ... 228
Page 17
XV
List of Tables
Table 2.1: A selection of available supply chain definitions ................................ 10
Table 2.2: Multidisciplinary evolution of the supply chain management concept 12
Table 2.3: Important elements of supply chain management ............................... 14
Table 2.4: Major Supply Chain Management Investigations within ANZ ............ 20
Table 2.5: Examples of SCM maturity models and their classification ................ 24
Table 2.6: Supply chain integration findings ........................................................ 27
Table 2.7: The meaning of integration for different industries ............................. 28
Table 2.8: Different supply chain integration research streams .......................... 29
Table 2.9: Barriers to supply chain integration ................................................... 35
Table 2.10: Critical factors for successful BPR.................................................... 41
Table 2.11: Parallels between BPR and supply chain management .................... 42
Table 2.12: Information generation and sharing assessment ............................... 50
Table 2.13: Relationship management assessment ............................................... 51
Table 2.14: Technology integration assessment ................................................... 53
Table 2.15: People/ culture assessment ................................................................ 55
Table 2.16: Outcome assessment .......................................................................... 57
Table 4.1: Comparison of Positivism and Interpretivism ..................................... 71
Table 4.2: Relevant situations for different research strategies ........................... 73
Table 4.3: Choice of number and type of cases .................................................... 76
Table 4.4: When to use case study research ......................................................... 77
Table 4.5: Purpose of the identified research questions ....................................... 78
Table 4.6: Summary of the cases and the contribution to the thesis ..................... 86
Table 4.7: Number of QSAM applications in different countries ........................ 89
Table 4.8: The QSAM process .............................................................................. 92
Table 4.9: Original contribution enabled through the QSAM application ........... 97
Table 4.10: QSAM SWOT analysis ....................................................................... 99
Table 4.11: Longitudinal research process ........................................................ 101
Table 4.12: Methodological outline of the research ........................................... 102
Table 4.13: Research timetable........................................................................... 104
Table 4.14: Assessment of the QSAM against research quality criteria ............ 107
Table 5.1: Description of the four uncertainty areas .......................................... 113
Table 5.2: Primary archival data sources collected during a QSAM................. 115
Page 18
XVI
Table 5.3 Detailed uncertainty data for the 20 identified value streams ............ 116
Table 5.4: Inventory levels and stock turns by value stream .............................. 122
Table 5.5: Comparison of NZ value streams with UK automotive ..................... 126
Table 6.1: Similarities between Irish and NZ supply chain integration barriers 139
Table 6.2: Supply chain integration barrier assessment: Forestry .................... 144
Table 6.3: Supply chain integration barrier assessment: Manufacturer 2 ......... 145
Table 6.4: Supply chain integration barrier assessment: Dairy 1 ...................... 147
Table 6.5: Supply chain integration barrier assessment: Steel .......................... 148
Table 6.6: Supply chain integration barrier assessment: Service ...................... 149
Table 6.7: Supply chain integration barrier assessment: Food 1 ....................... 150
Table 6.8: Identified barriers within each category ........................................... 155
Table 7.1: Review of portfolio models listed by publication date ....................... 163
Table 7.2: Supplier dependency variables .......................................................... 164
Table 7.3: Buyer dependency variables .............................................................. 164
Table 7.4: Supplier relationship management practises .................................... 169
Table 7.5: Definition of anchor for identified variables ..................................... 173
Table 7.6: Idealised supplier relationship management ..................................... 177
Table 7.7: Summary table of individual case analysis ........................................ 178
Table 8.1: Time overview of case studies for longitudinal data ......................... 188
Table 8.2: Assessing the path to supply chain integration ................................. 189
Table 8.3: Overview of the change activity for Manufacturer 2 ......................... 191
Table 8.4: Similarities within the four change processes ................................... 208
Table 10.1: Research question and original contribution .................................. 238
Page 19
1
1. Introduction
1.1 Background
A supply chain can be defined as: a series of companies that eventually make
products and services available to customers, including all of the functions
enabling the production, delivery, and recycling of materials, components, end
products, and services (Wisner et al., 2005). The ultimate goal in supply chain
management is to create value for the end customers as well as the organisations
in the supply chain network (Christopher, 1998; Walters & Lancaster, 1999;
Wisner et al., 2005). To accomplish the ultimate goal, organisations in the supply
chain must integrate process activities internally and with customers and suppliers
externally (Lambert et al., 1998). Yet in most organisation the situation is chaotic.
Lack of supply chain integration is expensive for companies. For example, in the
USA the National Institute of Standards has estimated that inadequacies in
managing inventory, scheduling and accounting information costs the automotive
and electronics industries a combined total of almost $9 billion annually, or about
1.2 percent of the value of shipments in each industry (NIST, 2004). The report
also claims that almost all of these costs could be eliminated with optimally
integrated systems for exchanging information throughout supply chains. The
academic literature is also clear on the importance of integration. The academia
continuously enhances the body of knowledge, linking supply chain integration to
performance improvement (e.g. Frohlich & Westbrook, 2001; Stank et al., 1999a);
but knowledge is lacking in terms of a prescribed manner by which companies can
achieve integration across operations internally, and with suppliers and customers
externally. Further, the actual pathway chosen by a focal company is of interest.
Stevens‟ (1989) study proposed an integration model in which companies tend to
follow a pathway to supply chain integration that progresses through separate
stages; choosing to integrate internally before integrating with external supply
chain members (Stevens, 1989). However, Gimenez (2004) and Potter et al.
(2004) identified exemplar companies that did not follow the internal/external
integration route; hence this thesis aims to investigate the actual pathways taken
when companies set out to achieve supply chain integration, in order that the
Page 20
2
company might one day select the most appropriate one for its specific supply
chain situation.
1.2 Investigating supply chain integration in practise
This thesis is based around a five step approach that provides academia with a
sound methodology to investigate how companies achieve supply chain
integration in practise. This gives practitioners clear guidance when integrating
their supply chain by providing supply chain integration assessment tools and
techniques for each identified step. Figure 1.1 presents the five step procedure to
investigate how companies achieve supply chain integration in practise. A more
detailed description of Figure 1.1 can be found in Chapter 3.
Figure 1.1: Five step procedure to investigate supply chain integration in practise
Source: Author
Figure 1.1 proposes that before investigating pathways to supply chain
integration, the current status of supply chain should be evaluated. In particular, a
research methodology needs to be identified allowing the researcher to investigate
in depth the current status of supply chain integration within a focal company.
Further, Gimenez (2004) as well as Romano (2003) point out that a close
examination of the barriers to supply chain integration is critical because the
removal of barriers between and within organisations seems to be the crucial issue
in integrating the supply chain. Naylor et al. (1999) also point out that the goal of
an integrated supply chain is the removal of all barriers to ease the flow of
material and information flow. However, academia has a better understanding of
the external barriers to supply chain integration than the internal ones. Therefore,
Understand
and document
current supply
chain practises
Evaluate supply
chain integration
maturity.
Identify internal
barriers to
supply chain
integration
Evaluate
external barriers
to supply chain
integration
Current Status Barriers Pathways
Achieving
supply chain
integration in
practise
Page 21
3
the investigation into internal integration is rather broad, identifying and
categorising common internal barriers to supply chain integration. The
investigation into external integration is more specific, focusing on power and
dependency. Cox (1999), and van Donk and van der Vaart (2004) identified that
the key barrier to external supply chain integration is the power and dependency
structure present between organisations. Once the current state is identified and
the barriers to supply chain integration understood, researchers can investigate
how supply chain integration is achieved including actual pathways to supply
chain integration, using longitudinal case studies. Next, each chapter is briefly
summarised and the specific objective of each chapter is highlighted based on the
structure provided in Figure 1.1.
1.3 Potential value of research contribution
This thesis applies a qualitative (field) research methodology. The first-hand case
knowledge gained coupled with a strong research focus on supply chain
integration offers the potential for in-depth insights into the uptake of supply
chain integration in practise. Knowledge created through observing and studying
real world supply chains enables theory to be tested in the real-world setting and
further refined, providing the academia with rich practical insights. In total, 239
person days were spent on-site observing, interviewing, auditing, and analysing
archival data. Hence, a large amount of rich case study data has been collected
predominantly by using an audit methodology termed the „Quick Scan Audit
Methodology‟. This uses three forms of triangulation when investigating real
world supply chains: (1) data sources triangulation; (2) investigator triangulation;
and, (3) methods triangulation.
1.4 Overview of the Thesis
This thesis comprises ten chapters. The first chapter provides an overview of the
thesis by briefly introducing each individual chapter. Chapter 2 concentrates on
the theory that underpins the research. The objective of the literature review is not
to provide an all-inclusive review of the field of supply chain management.
Rather, its aim is to provide a foundation for the thesis. Particular attention is,
Page 22
4
therefore, paid to supply chain integration and the confusion that surrounds the
topic. Current shortfalls in the literature are identified, which lead to a clear
definition of the research questions raised in this thesis. The critique of literature
provided in Chapter 2 concludes with a conceptual model developed, which is
capable of assessing supply chain integration practises adopted by a focal
company.
Chapter 3 is pivotal in that it precisely defines the research problem under
investigation. This is followed by a detailed description of the five step
methodology proposed to investigate the pathways to supply chain integration.
The boundaries of the research are clearly defined, thereby highlighting factors
that are being considered and those outside the scope of this thesis.
Chapter 4 presents different paradigms for conducting research and argues that “a
one paradigm, one approach” should not be the obvious choice. The data
collection technique termed Quick Scan Audit Methodology uses multiple
paradigms and two ways of data triangulation: (a) investigator triangulation and
(b) methodology triangulation. The contribution to theory of this chapter is
manifold. First, a rigorous method has been developed to adapt the initial Quick
Scan to suit longitudinal case studies. Second, a method has been developed to
evaluate supplier relationships based on power and dependency. Thirdly, applying
the QSAM to New Zealand supports the increase of rigour for the methodology
developed. Fourthly, Quick Scan has been applied to new industry settings,
especially the New Zealand process industry, which further validates the QSAM.
Chapter 5 is the first of four findings chapters and provides the basis for the
remaining findings chapters. A method for evaluating a supply chain‟s level of
integration maturity is presented based on the Uncertainty Circle (Mason-Jones &
Towill, 1998). A sample of twenty value streams is assessed and further compared
to twenty value streams from the UK automotive sector. This facilitates answering
the first research question on the degree of integration of New Zealand value
streams. The second application of the twenty value streams is to highlight that
currently available supply chain integration models (here in particular Stevens
(1989) and Frohlich & Westbrook (2001)) do not always reflect reality. Resulting
Page 23
5
from this situation, a new integration model consisting of six distinct pathways to
supply chain integration is proposed.
Chapter 6 applies systems thinking to investigate why value streams are so weakly
internally integrated. A conceptual model is developed based on previous research
focusing on three distinct layers of barriers to internal integration. Those layers
are termed environmental barriers, company barriers and value stream barriers.
This model is capable of including and assessing all identified barriers to supply
chain integration. Further, the research highlighted that most of the identified
barriers on a company level are predominantly culture, people and relationships
related.
In Chapter 7, a five step method for evaluating and measuring power and
dependency in external relationships is presented. The five step method has been
successfully applied to seven case companies. Chapter 7 highlights the poor
relationship management practises currently applied by leading New Zealand
companies. The effect of power and dependency for external integration is
identified. The negative power and dependency structure (independence or
supplier dominance) often limits external integration with key external entities.
The final findings chapter (8) contains four longitudinal studies to identify the
routes that companies follow when integrating their value streams. The change
process each case company went through is mapped out and the effects of the
change process on (a) barriers to supply chain integration, (b) supply chain
uncertainty and (c) the developed „supply chain integration assessment tool‟ is
assessed. Further, the research validates the conceptual supply chain integration
model developed in Chapter 5. The findings show that companies follow different
routes when integrating their supply chain. They also reveal that companies
follow similar patterns when implementing change. All four case companies
invested in people before addressing internal processes and/ or external
relationship management issues. Changes in the current technology occurred last.
Chapter 9 is the discussion chapter. Here, the attention is focused on the meaning
of the research findings for the wider academic supply chain integration
Page 24
6
landscape. Also research areas that require further evidence are highlighted.
Chapter 10 concludes the research by providing an explicit statement of each of
the original contributions made by this thesis, and the relevance of this thesis for
practitioners is discussed. Finally, potential research areas are identified, thus
highlighting areas of potential benefit that can build on and further validate the
research of this thesis.
Page 25
7
2. Literature Review
2.1 Introduction
The purpose of this chapter is to provide a foundation for the thesis on the basis of
the literature currently available. Emphasis is placed around the concept of supply
chain integration and, in particular, on supply chain assessment as well as barriers/
enablers and achieving supply chain integration in practise. The literature review
is predominantly based on the latest publications in the key areas of supply chain
management. All of the research questions analysed in this thesis are first raised in
this chapter. These questions have been designed to provide solutions to topics not
comprehensively addressed in the current literature, and are therefore areas that
require further research and validation.
Initially, the broad field of supply chain management is discussed. The terms
“supply chain” and “supply chain management” are clarified and precisely
defined in the terms used in publications by renowned experts in the field. This is
followed by a brief historical overview of the supply chain management concept.
Further, a number of the key published methodologies for evaluating supply chain
practises is reviewed. However, the main thrust of the literature review concerns
itself with the major contributions that have been made over the years to the topic
of supply chain integration. The key contribution of this thesis is the close and in-
depth exploration of how companies actually achieve supply chain integration in
practise. Hence, change management in supply chains cannot be ignored. Finally,
a conceptual model is developed that enables the researcher to evaluate supply
chain integration practises and investigate pathways to supply chain integration.
2.2 Research Area
One of the most significant changes in the paradigm of modern business
management is that individual businesses no longer compete as solely
autonomous entities, but rather as supply chains (Christopher, 1998). Business
management has entered the era of supply chain competition and the ultimate
success of a single company will depend on management‟s ability to integrate the
company internally as well as externally (Lambert et al., 1998). Lambert et al.
Page 26
8
highlight that supply chain management is part of a wider concept termed
business management. Supply chain management offers the opportunity to capture
the synergy of intra- and inter-company integration and management by taking a
holistic/systems perspective regarding the various activities, functions, and
systems required to bring a product or service to market (Vickery et al., 2003).
Figure 2.1 illustrates the scope of the research area.
Figure 2.1: Scope of research area
Source: Author
One key theme within supply chain management is the integration of customers
and suppliers externally and functions internally to optimise material and
information flow. Recently, academia started to investigate barriers/enablers to
supply chain integration because the removal of barriers between and within
organisations seems to be a critical issue along the path to supply chain
integrating the supply chain (Gimenez, 2004; Romano, 2003). Finally, supply
chain integration in practise is reviewed. Next, the concept of supply chain
management is described, followed by the identification of a supply chain
definition used for this thesis.
Business management
Supply chain management
Supply chain integration
Barriers and enablers
Integration in practise
Page 27
9
2.3 Supply chain management: A theoretical framework
In recent years, the area of supply chain management has become very popular.
This is evidenced by marked increases in practitioner and academic publications,
conferences, professional development programs, and university courses in the
area (Burgess et al., 2006). However, the concept of supply chain management is
not particularly well-understood and many authors have highlighted the necessity
for a clear definition and conceptual frameworks of supply chain management
(Cooper et al., 1997; Croom et al., 2000; New & Payne, 1995; van der Vaart &
van Donk, 2007). One of the main problems is that supply chain management is
such a broad notion that it can be approached from many different angles:
purchasing and supply, operations management, relationship management,
logistics and transportation, industrial organisation, marketing, or strategic
management to name a few (Croom et al., 2000). The breadth of the concept is
also the main reason why it still lacks a unitary and a widely accepted definition
(Cigolini et al., 2004).
Table 2.1 provides a selection, in chronological order, of different supply chain
management definitions as introduced and used by different authors. Table 2.1 is
not intended to provide a comprehensive review of supply chain definitions (e.g.
Cooper et al., 1997) rather the purpose here is to highlight some of the contrasting
approaches to supply chain management existing in the literature. However,
consistent across these definitions is the idea of coordinating and integrating a
number of product-related activities among supply chain participants to improve
operating efficiencies, quality, and customer service in order to gain a sustainable
competitive advantage for all of the organisations involved in this collaboration.
Page 28
10
Table 2.1: A selection of available supply chain definitions
Author Definition
Bowersox et al.
(2002)
Supply chain (sometimes called the value chain or demand chain)
management consists of companies collaborating to leverage strategic
positioning and to improve operating efficiency.
Van der Vorst &
Beulens (2002)
Supply chain management is the integrated planning, co-ordination and
control of business processes and activities in the supply chain to deliver
superior consumer value at minimum cost to the end-consumer while
satisfying requirements of other stakeholders.
Hugos (2003) Supply chain management is the coordination of production, inventory,
location, and transportation among the participants in a supply chain to
achieve the best mix of responsiveness and efficiency for the market
being served.
Benton & Maloni
(2005)
Supply chain management involves the strategic process of coordination
of companies within the supply chain to competitively deliver a product
or service to the ultimate customer.
Li et al. (2005) Supply chain management has been defined to explicitly recognise the
strategic nature of coordination between trading partners and to explain
the dual purpose of supply chain management: to improve the
performance of an individual organisation, and to improve the
performance of the entire supply chain. The goal of supply chain
management is to create sourcing, making, and delivery processes and
logistics functions seamlessly across the supply chain as an effective
competitive weapon.
Source: Author
The definition by Li et al. (2005) is used throughout this thesis. This approach
views the supply chain as product and information flow encompassing all parties
involved, that is, the focal company and its suppliers and customers. Also Li et al.
take a strong process focus when defining supply chain management. Here, a
process is defined as a structured and measured set of activities designed to
produce a specific output for a particular customer or market (Davenport, 1993).
Instead of the term supply chain management, some authors use similar terms
such as network, supply pipeline management, demand chain management, value
chain management, and value stream management (Bowersox et al., 2002;
Childerhouse et al., 2002; Childerhouse et al., 2005; Childerhouse & Towill,
2006; Croom et al., 2000; Harland et al., 2001). This thesis utilises the terms
supply chain and value stream. Womack and Jones (2005) popularised the term
„value stream‟ and this thesis uses the terms supply chain and value stream
interchangeably; because in many respects „supply chain‟ and „value stream‟ are
Page 29
11
synonymous. A practical interpretation is that a supply chain consists of a bundle
of one, or more often multiple, value streams. A fuller description appears in
5.3.1. The evolution of the supply chain concept is described next, and different
supply chain management schools identified.
2.4 Evolution of the supply chain management concept
Various authors cite the work of Oliver and Webber (1982), entitled “supply chain
management: logistics catches up with strategy”, as the publication in which the
term “Supply Chain Management” was used for the first time. The term was used
with reference to management techniques which sought to reduce the stocks held
in companies of the same supply chain, linked by customer-supplier relationships
(Romano, 2003). However, the roots of the concept of supply chain management
are initially along the lines of physical distribution and transport; using the
techniques of industrial dynamics derived from the work of Forrester (1961).
Another antecedent can be found in the Total Cost approach to distribution and
logistics (Heckert & Miner, 1940). Both these approaches apply systems thinking
and show that focusing on a single element in a chain cannot assure the
effectiveness of the entire system.
Since the publication of Oliver and Webber (1982) different supply chain schools
have emerged. This chapter provides a review of supply chain management
related studies and classifies them into seven main schools/streams using Bechtel
and Jayaram‟s (1997) classification as a basis. Bechtel and Jayaram provide an
extensive retrospective review of the literature and research on supply chain
management, including major contributions and fundamental assumptions. While
other approaches to classify the supply chain management literature have been
proposed (e.g. Cooper et al., 1997; Croom et al., 2000; Halldorsson et al., 2008)
the one highlighted in Table 2.2 illustrates the long and multidisciplinary
evolution of supply chain management concept.
Page 30
12
Table 2.2: Multidisciplinary evolution of the supply chain management concept
School Key Authors Achievement
Systems
perspective
Forrester (1961);
Heckert & Miner (1940);
Jones & Riley (1985)
The basic premise of the systems perspective
is that the polices of the optimisation of sub-
systems (i.e. organisations) do not necessarily
result in an optimal solution for the system as
a whole
Supply chain
awareness
Houlihan (1987);
Jones & Riley (1985);
Novack & Simco (1991);
Oliver & Webber (1982)
These authors recognise that there is a
continuous chain of functional areas through
which materials flow and that it extends from
suppliers to final distributors
Traditional
logistics
Bowersox & Daugherty
(1995); Scott & Westbrook
(1991)
The main objective of these studies is to
improve supply chain efficiency by reducing
inventory levels, where little emphasis is given
to supply chain effectiveness. Moreover, the
analysis performed by this research stream
focuses only on logistics, paying scant
attention to other interface processes
Modern logistic Christopher (1998);
Fuller et al. (1993);
Lee & Billington (1992);
The focus of the studies shifts from mere cost
reduction to include also service and quality
improvement
Integrated
process redesign
Disney et al. (1997);
Forrester (1961);
Mason-Jones & Towill
(1997);
Towill (1997a)
Quantitative models are applied to a
systematic vision of the supply chain, how to
redesign the entire supply system in order to
obtain more efficient and effective flows of
materials and information
Industrial
organisation
Bensaou (1999);
Ellram (1991);
Frohlich & Westbrook
(2001);
van der Vaart & van Donk
(2004)
The focus is on relationships between the
various actors of the same supply chain.
Authors recognise that a wide variety of
organisational forms exist in supply chain
relationships, spanning from discrete
transactional relations, through co-operative
arrangements, to long-term partnerships
Intra- and inter-
organisational
integration
Stevens (1989);
Lambert et al. (1998);
Towill et al. (2002)
This school takes a systems/holistic
perspective regarding supply chain
management. Here, integration activity spans
from internal, cross functional integration as
well as external integration with key suppliers
and customers
Adapted from: Bechtel & Jayaram, 1997; Cigolini et al., 2004; Halldorsson et al.,
2008
The Systems Perspective, the Supply Chain Awareness, the Traditional Logistics,
and the Modern Logistics Schools can be considered as linked evolutions;
however, Integrated Process Redesign, Industrial Organisation and Intra- and
Inter-Organisational Integration actually define three different, though not
independent, lines of research. Despite these differences, the underlying theme of
Page 31
13
all identified schools consider integration as a key underlying factor. The so-
called “Supply Chain Awareness School” refers to internal and external functional
integration; the “Linkage/Logistics School” refers to the integration of logistics
activities; the “Information School” refers to integration of intra- and inter-
company information flows; and the “integrated process design school” refers to
the integration of business processes across the supply network. This thesis is
situated in the Intra- and Inter-Organisational integration school by taking a
holistic/systems perspective regarding supply chain integration, including internal
elements as well as customer and supplier integration. Next, the wide span of the
supply chain management concept is briefly introduced.
2.5 The span of the supply chain management concept
The term supply chain management has been widely used with regard to the
logistics activities and the planning and control of materials and information
flows. However, some authors have used it to describe strategic, inter-
organisational issues (Cox, 1999), others to discuss an alternative organisational
form to vertical integration (Thorelli, 1986), and others to identify and describe
the relationship a company develops with its suppliers or customers (Böhme et al.,
2008c; Ellram, 1991). Here, a number of subject areas are identified to be
considered as core elements of supply chain management. Table 2.3 provides the
principal components of the supply chain literature. The objective is to highlight
how the subject literature has contributed work in supply chain management from
different perspectives.
Page 32
14
Table 2.3: Important elements of supply chain management
Supply chain element Important issues
Strategic management Strategic networks, strategic sourcing, vertical integration, make
or buy decisions, core competency focus, supply network design,
strategic alliances, strategic supplier segmentation and selection,
global strategy, strategic purchasing, leanness, agileness
Logistics Integration of materials and information flows, JIT, MRP, VMI,
reverse logistics, physical distribution, cross docking, logistics
postponement, capacity planning, forecast information
management, distribution channel management, planning and
control of materials flow
Marketing Relationship marketing, customer service management, efficient
consumer response, efficient replenishment, after sales service,
value stream thinking
Relationships Relationship development, supplier development, strategic
supplier selection, vertical integration, partnership sourcing,
supplier involvement, supply / distribution base integration,
supplier assessment (ISO), design for manufacturer, mergers
acquisition, joint ventures, strategic alliances, contract view, trust,
power and dependency, partnership performances, relationship
marketing
Best practise JIT, MRP (II), ERP, continuous improvement, BPR, quick
response, time compression, process mapping, world class
manufacturing, CPR, VMI, EDI
Organisational behaviour Communication, human resources management, employee
relationships, organisational structure, organisational learning,
power in relationships, technology and knowledge transfer
Source: Adapted from Croom et al., 2000; Wisner et al., 2005
Table 2.3 is a brief and non-exhaustive list of subject areas associated with supply
chain management. It should be noted that there is a partial overlapping of the
subject areas. In fact, the same topic can be considered from different perspectives
in more than one subject area. Next, each of the six identified elements will be
briefly discussed.
2.5.1 Strategic management
Managing the supply chain means managing across traditional functional areas in
the company and managing interactions externally with both suppliers and
customers. This cross-boundary nature of management supports incorporating
supply chain goals and capabilities in the strategic plan of the company. Hence,
key contributions focus on strategic alignment of company strategy with supply
chain strategy (Mejias-Scaluga & Prado-Prado, 2002; Stevens, 1989). Linking
Page 33
15
supply chain strategy to the business strategy involves defining the key business
processes involved in producing a company‟s product or service. Once key
business processes are identified, a set of detailed objectives can be developed for
each process within the supply chain (Lummus & Vokurka, 1999). A second
stream focuses in detail on how to develop meaningful supply chain strategies
(Gattorna & Walters, 1996; Peck & Juttner, 2000).
2.5.2 Logistics
The concept of supply chain management is strongly anchored in the logistics
literature (Bowersox & Daugherty, 1995; Christopher, 1998; Jones & Riley, 1985)
and logistics has continued to have a significant impact on the concept (Fuller et
al., 1993). The strong influence of logistics in the process of conceptualising
supply chain management seems to be due to the weight given to inventory
reduction and stock availability as key objectives of supply chain management
(Min & Mentzer, 2000).
Early logistics literature focused on the economic theories of a company – i.e. cost
control and its contribution to the bottom line. Thus, total cost analysis was an
important performance measurement (Mentzer et al., 2004). Starting in the 1980s,
companies viewed time as a source of competitive advantage (Stalk et al., 1992).
This gave rise to techniques like Just in Time (JIT), cross-docking and vendor
managed inventory (VMI), which will be further explained in the Best Practise
category. Nowadays, logistic capabilities also play an important role in boundary-
spanning interfaces between internal functional areas and between the focal
company and supply chain partners. Coordinated with the marketing function,
logistics can differentiate product and service offerings to fulfil unique customer
requirements (Fuller et al., 1993; Gattorna & Walters, 1996; Mentzer et al., 2004).
Logistics capabilities also help the company cooperate with supply chain partners
(i.e. suppliers, distributors, and other intermediaries). Thus, logistics is an integral
part of the larger concept of supply chain management (Fuller et al., 1993).
Recent logistics research focuses on reverse logistics (e.g. Rogers & Tibben-
Lembke, 1999) and sustainability within the logistics function (e.g. Koplin et al.,
2007).
Page 34
16
2.5.3 Marketing
The objective of marketing is customer satisfaction (Walters, 1999). Supply chain
management is influenced by marketing from two different angles, namely market
orientation and marketing channels. The marketing concept is implemented in the
form of a market orientation, which promotes the emergence of relationship
marketing and the implementation of supply chain management. A market
orientation helps the implementation of supply chain management by providing
valuable market information on customers, competitors, potential supply chain
partners, and market environments (Min & Mentzer, 2000).
Marketing channels are defined as sets of interdependent organisations involved
in the process of making a product or service available (Stern & El-Ansary, 1992).
Fuller et al. (1993) applied the marketing channel approach to identify multiple
logistics channels. Fisher (1997) adapted the marketing channel approach and
identified that the supply chains need to be tailored to customer needs. Hence,
Fisher (1997) argues that a focal company consists of multiple supply chains.
Further, relationship management as well as the concept of power and dependency
in relationships became a crucial concept in marketing channels research (Cooper
et al., 1997; Lambert et al., 1998; Min & Mentzer, 2000).
2.5.4 Relationships
Traditional relationships in the 1960s and 1970s were characterised by an
adversarial, arm‟s length approach (Szwejczewski et al., 2005). This suited
traditional purchasing, which was primarily price orientated. The pressure for
change was low, but increased in the next decade so that logistics relationships
were adopted. The emphasis was to make the material transfer more efficient (Da
Villa & Panizzolo, 1996). At the beginning of the 1990s, relationships required an
even greater degree of interaction due to the need for product innovation and co-
operation in technological developments. The competitive forces in the global
marketplace compelled many companies to move significantly along the
continuum from arm‟s-length relationships with suppliers to much stronger
relationships characterised by much greater interdependence (Cox, 2001).
Page 35
17
Today, the aim of relationship management is to achieve an optimal material and
information flow (Goffin et al., 1997). As a result, relationship management
pursues partnerships, strategic alliances, and joint ventures (Min & Mentzer,
2000).
2.5.5 Best practise
Supply chain best practise is accepted as being “about doing things in the most
effective way” (Gattorna & Walters, 1996). Therefore, best practises can take
many different forms. Three main categories of best practise studies have been
identified: (1) techniques, (2) technologies and (3) concepts. Many best practises
set out to improve material and information flow and hence aim at reducing the
bullwhip effect. Forrester (1961) identified the bullwhip effect (also termed
Forrester effect), which is the amplification of demand as orders are passed on
upstream in the supply chain.
Supply chain related techniques include a large number of approaches suitable for
a better process design. Choices regarding material flow are carefully evaluated
through the transportation fleet design, facility network design, and warehouse
network design techniques using specifically developed quantitative models
(Cigolini et al., 2004). Other techniques such as just-in-time (JIT), customer
replenishment programs (CRP), and vendor management inventory (VMI) focus
on the management of the supply system. JIT is based on the idea that no activity
should take place until there is a committed customer demand. JIT principles can
be extended to distribution channels under various names, e.g. continuous
replenishment program (CRP). Moreover, vendor managed inventory (VMI) or
consignment stock agreements have been included in external relationships
(Wisner et al., 2005). Finally, the distribution requirements planning technique
(DRP) tries to combine the need for lower inventory investment with improved
customer service. DRP is similar to MRP (II) in that they both try to identify the
requirements for finished products at the point of demand and then to produce
aggregate, time-phased replenishment schedules for each echelon of the supply or
distribution system (Chopra & Meindl, 2007).
Page 36
18
Information technology (IT) is utilised to gather, transmit and share data. It
creates and directs the flow of information. Researchers have paid close attention
to the effects of electronic data interchange (EDI) on material and information
flow as well as on the relationship itself (Larson & Lusch, 1990; Myhr &
Spekman, 2005; Stefansson, 2002). EDI and internet technologies support the
inter-company transfer of data and other business documents in a standard format.
In logistics, research has recently focused on radio frequency tags (Angeles, 2005;
Gaukler, Seifert & Hausman, 2007). Automated identification systems like bar
codes and radio frequency tags are commonly used to monitor goods movement
throughout the supply chain. Integrated databases regarding sell-outs, forecasts,
inventories, and production orders are a means to provide each firm in the chain
with information originated in the other nodes of the system (Bagchi & Skjoett-
Larsen, 2002). Integrated database research has strongly focused on the
application of enterprise resource planning (ERP) systems (Cagliano et al., 2006).
Other best practise studies here focused on concepts such as Motorola‟s Six
Sigma (Wisner et al., 2005), Wal-Mart‟s Collaborative Planning, Forecasting and
Replenishment (CPFR) (Wisner et al., 2005), Dell‟s Extended Enterprise (Chopra
& Meindl, 2007), and Toyota‟s Toyota Production System (TPS) (Raisinghani et
al., 2005), to name a few.
2.5.6 Organisational behaviour
Andraski (1994) has remarked that supply chains are approximately 80% people-
centred and 20% technology centred. Hence, the concept of organisational
behaviour is very valuable. Organisational behaviour studies are well researched
within change management and here specifically within business process
reengineering (BPR). BPR is based on the idea that companies should be viewed
horizontally, not vertically, and should focus on business processes rather than on
functional areas or departments. However, successful change involves people at
every level and extensive communication throughout the organisation
(Harrington, 1995). Researchers further identified that empowerment of the work
force is critical to successful BPR (Randolph & Sashkin, 2002).
Page 37
19
Organisational behaviour studies increased when applying the concept to internal
and external supply chain integration. Cox (1999) for example, studied
extensively the effect of power and dependency in buyer supplier relationships.
Cousins and Menguc (2006) focused on socialisation tactics between buyer and
supplier. Mentzner et al. (2000) studied barriers to supply chain integration and
concluded that many such barriers are related to people and personal interaction
rather than to technology and infrastructure.
Having identified and discussed six broad elements of supply chain management
it must be reiterated that none of these elements can be viewed in isolation as they
are closely interlinked. Often the same elements can be considered from different
perspectives in more than one subject area. This section highlighted the academic
span of the supply chain management concept. The research for this thesis
investigates whether this is the same situation in New Zealand. Hence, a brief
overview of the key New Zealand publications is presented next.
2.6 Supply chain management in New Zealand
New Zealand publications in the field of supply chain management are limited in
number. To widen the scope of the literature, Australian publications have been
researched to obtain a broader perspective from the region. Table 2.4 highlights
some key publications in the field of supply chain management within the
Australia/New Zealand (ANZ) context.
Page 38
20
Table 2.4: Major Supply Chain Management Investigations within ANZ
Author Major findings
Walters & Jones (2001) A single case study within the New Zealand health sector revealed
that value chain analysis encourages an intra- and inter-
organizational review of resource application and identifies
alternative methods and structures for meeting objectives.
Wilson & Sankaran
(2001)
The need to distinguish between partnerships that are located in
discrete-part fabrication/assembly contexts and those that are
situated in a process industry context.
Basnet et al. (2003) Companies focused on on-time delivery and quality, but low level
of focus/understanding on integration or relationships.
Closs & Mollenkopf
(2004)
Internal integration is not a necessary competency in ANZ. While
internal integration is very important to US companies, it does not
seem to be as important predictor of performance for ANZ
companies.
Simatupang & Sridharan
(2004a)
Empirical evidence shows that collaboration between retailers and
suppliers has a significant influence on operational performance.
Mollenkopf & Dapiran
(2005)
The majority of organisations focused on internal logistics
integration although some organisations have world class supply
chains.
Simatupang & Sridharan
(2004b)
The authors introduced and validated an instrument to measure
collaboration between supply chain members. The quantitative
study further identified that the collaboration index was positively
associated with operational performance.
Singh et al. (2005) Presents the findings of an exploratory study that examined
contemporary issues related to supply chains in the Australian
automotive manufacturing industry. The authors identified many
unresolved issues in the Australian automotive supply chain.
Basnet et al. (2006) The results indicate that there has been a significant increase in
the general awareness of lean manufacturing, supplier integration,
and quality improvement strategies. However, good supply chain
practise is still lagging behind.
Source: Author
Overall, Table 2.4 highlights that supply chain management and operations
management research is still in its infancy in the ANZ region. Basnet et al. (2006)
also point out that, to advance supply chain management practises in New
Zealand, more research in this field needs to be undertaken.
Regarding the uptake of the supply chain management concept in practise, Wilson
and Sankaran (2001) report that New Zealand‟s local manufacturers are lagging
behind their overseas counterparts in many key areas of supply chain
management. Basnet et al. (2006) conclude that there have been constant
Page 39
21
theoretical findings and developments which have enabled organisations to
improve supply chain performance internationally. However, such developments
are poorly understood and matched by an equally disappointing uptake in New
Zealand. However, no publication has been identified reporting on supply chain
integration maturity in New Zealand. This thesis makes an early attempt to close
the gap identified. Hence, the first research question is:
Research Question 1: How integrated are New Zealand supply chains?
Next, different supply chain assessment methods are reviewed to identify the one
most suitable for answering the first research question.
2.7 Supply chain assessment techniques
General supply chain performance assessment is predominantly undertaken using
maturity models. Maturity models are rooted in the field of quality management
(Netland et al., 2007). While numerous different types of maturity models have
been developed, relatively few models for analysis of supply chains and logistics
were found in the literature. Most of the reported means of diagnosing supply
chains and logistics problems are based on analytical and numerical models
(Chopra & Meindl, 2001). Benchmarking techniques are also frequently used. In
contrast, assessment techniques encompassing the entire supply chain are scarce.
The literature divides maturity assessment techniques into commercially and
academically derived techniques.
2.7.1 Supply Chain Operations Reference Model (SCOR)
The SCOR model is probably the most well-known commercially available
supply chain assessment technique. This model was developed in the mid-1990s
by a cross-industry consortium of over 70 companies in the USA called the
Supply Chain Council. The SCOR model is based around four generic supply
chain management functions of: Planning, purchasing, manufacturing, and
distribution (Huan et al., 2004). SCOR defines common supply chain
management processes in each function and matches these with best practise,
Page 40
22
benchmarked performance measures, and use of software. The purpose is to
provide a generic framework for measuring supply chain performance and
identifying areas for improvement (Power, 2005). However, Huang and Mak
(2000) identified that a seemingly endless variety of supply chains exist in
practise and this benchmarking approach is fraught with danger and will clearly
result in errors as „oranges are compared with apples‟. Other commercially
available supply chain assessment techniques are listed and briefly explained in
Appendix B.1.
2.7.2 Collaboration Index
Simatupang and Sridharan (2004b) propose an instrument to measure the extent of
collaboration in a supply chain. The model incorporates collaborative practises in
information sharing, decision synchronisation, and incentive alignment. The
outcome of the measurement process is a collaboration index and the
identification of collaborative improvement initiatives.
2.7.3 Logistics Scorecard
Yaibuathet et al. (2006) developed a self-evaluation tool termed Logistics
Scorecard. The Logistics Scorecard encompasses twenty assessment items based
on four fundamental areas: (1) corporate strategy and inter-organisation
alignment; (2) planning and execution capability; (3) logistics performance; and
(4) IT methods and implementation. Each assessment item is allocated a five-level
Likert scale. Despite the generality of this scorecard an individual company can
perform the self-assessment and compare its score against competitors in the same
industry or across sectors.
2.7.4 Benchmarking of logistical operations
Van Landeghem and Persoons (2001) developed a causal model that relates the
use of best practise to resulting performances; grouped under four main
objectives: flexibility, reaction time, quality, and cost. It enables companies to
obtain an idea about their rate of use of best practise and their effectiveness based
Page 41
23
on the key metrics. This enables the researcher to benchmark the focal business
against previously assessed companies. Any shortcomings give important
indications of where to improve (van Landeghem & Persoons, 2001).
2.7.5 SCMAT
Netland et al. (2007) present a tool to quickly assess the maturity of a firm‟s
supply chain activities, termed Supply Chain Maturity Assessment Test
(SCMAT). SCMAT has three main objectives: It is meant as a tool to (1) map the
degree of maturity of a firm‟s supply chain activities at the strategic and
operational level; (2) communicate the degree of maturity in a logical and easy-to-
understand style; and (3) identify improvement areas in a firm‟s development
project. The aim is to take all key factors of operation management into
consideration.
2.7.6 The diagnostic tool
Foggin et al. (2004) developed a qualitative diagnostic tool with which a third
party logistics provider (3PL) can quickly determine the viability of engaging in
service with a client. The tool consists of five classifications: inventory, customer
service, organisation, systems, and product flow. These classifications follow a
specific hierarchical order, hence function as a decision tree. Each classification
has a set of questions. The results of using this tool not only indicate areas where
the 3PL can assist the client, but also how to go about addressing the client‟s
supply chain „pain points‟ (Foggin et al., 2004).
2.7.7 Quick Scan Audit Methodology
The Logistics Systems Dynamics Group at Cardiff University began development
of a supply chain audit methodology in the early 1990s (Lewis et al., 1998)
termed Quick Scan Audit Methodology (QSAM). During a typical QSAM audit,
material and information flows are process-mapped; key managers are
interviewed; company archive information is evaluated, and attitudinal
questionnaires are completed concerning supply chain interfaces. At its heart lies
Page 42
24
an assessment of supply chain integration maturity that makes use of three
(validated) measures (Böhme et al., 2008a): (1) an overarching measure of supply
chain uncertainty; (2) assessment of the mindset of practising managers, both by
direct observation and by assessing their adherence to twelve common-sense rules
of simplified material flow; (3) measurement of the presence of 24 symptoms that
are categorised into four classes: Dynamic Behaviour, Physical Situation,
Operational and Organisational Characteristics. Further academically derived
supply chain assessment techniques are briefly explained in Appendix B.2.
2.7.8 Cross analysis of key supply chain assessment techniques
Table 2.5 summarises all of the key supply chain assessment techniques detailed
previously, focusing on assessment duration, methods used, and supply chain
classification.
Table 2.5: Examples of SCM maturity models and their classification
Title Description Duration Method Classification
SCOR Self-diagnostic tool
– SCM maturity
Extensive/
unknown
Quantitative Plan, source, make,
deliver, return
Collaboration
Index
Statistical
diagnostic study –
collaboration
2-4 hours Quantitative Information sharing,
decision synchronisation
and incentive alignment
Benchmarking
of logistical
operations
Diagnostic tool -
logistics
Extensive/
unknown
Qualitative HR, planning and control,
production and assembly,
R&D, distribution, supply
and demand
Logistics
Scorecard
Self-diagnostic tool
- logistics
2-4 hours Quantitative Corporate strategy,
strategic alignment,
planning and execution,
logistics, IT
The Diagnostic
Tool
Quick time
diagnostic tool –
3PL
< 2 hours Qualitative Inventory, customer
service, organisation,
systems, product flow
SCMAT Quick time
diagnostic – SC
maturity
2-4 hours Qualitative Strategy, control,
processes, resources,
materials, information,
organisation
Quick Scan
Audit
Methodology
Supply chain
integration
diagnostic
20 person
days; 1
week
Qualitative/
Quantitative
Supply chain uncertainty;
simplified material flow;
complex material flow
Source: Adapted from Foggin et al., 2004; Netland et al., 2007
Page 43
25
This thesis will apply the Quick Scan Audit Methodology to investigate supply
chain integration in New Zealand. With the exception of SCMAT, all the other
diagnostic methods are tailored for specific problem areas. The QSAM is capable
of covering a wide range of supply chain issues in a short period of time. The
Quick Scan method also specifically addresses attitudinal issues via multiple and
rigorous data collection techniques when identifying the current state of supply
chain integration in a focal company. Importantly one key element of the Quick
Scan is a supply chain integration maturity assessment, which clearly supports
answering the first research question. A detailed description and justification of
the Quick Scan can be found in the Methodology Chapter 4.8.1.
The previous section identified that only minor research had been undertaken
regarding supply chain integration in New Zealand. This section identified that the
QSAM is an appropriate supply chain diagnostic method. Next, the supply chain
integration literature is reviewed.
2.8 Supply chain integration
The integration of supply chains has been the subject of significant debate and
discussion within the academia (Bagchi & Skjott-Larsen, 2002; Frohlich &
Westbrook, 2001; Ota, 2001; Power, 2005; Stevens, 1989; Towill et al., 2002).
Supply chain integration originates from a systems perspective, where
optimisation of the whole achieves better performance than a string of optimised
sub-systems (Christopher, 1998). The argument is that, via integration, trade-offs
and wider ranging decisions can be made based on shared information and co-
ordination. Because integration is claimed by many authors to be a supply chain
Utopia synonymous with supply chain management excellence, research into
supply chain integration is a fundamentally important area. Published studies have
focused on power position in the supply chain (Cox, 2001), purchasing integration
(Narasimham & Das, 2001), impact of simplified material flow (Childerhouse &
Towill, 2003), barriers to supply chain integration (Pagell, 2004), and shared
resources (van der Vaart & van Donk, 2004) to name a few.
Page 44
26
The following section will define supply chain integration, identify the proponents
and opponents of the supply chain integration concept, and discuss their
arguments.
2.8.1 The three layers of supply chain integration confusion
Historically, integration of logistics management was identified as the primary
challenge of the 1990s to gain and maintain customer loyalty and a competitive
advantage (Bowersox et al., 2002). More recently the scope of integration has
broadened considerably from a logistics perspective to a supply chain integration
perspective as academia recognised the potential savings to be gained from
integrating the management of the various actors in a supply chain (Vickery et al.,
2003).
Nowadays, supply chain integration is perceived as the degree to which an
organisation manages intra- and inter-organisation processes to achieve effective
and efficient flows of products, services, information, money and decisions, with
the objective of providing maximum value to its customers (Bowersox et al.,
2002, Frohlich & Westbrook, 2001; Naylor et al., 1999). Hence, most supply
chain literature considers supply chain integration as the collaborative effort in
linking internal functions, suppliers and customers (Frohlich & Westbrook, 2001;
Lambert et al., 1998; Pagell, 2004; Romano, 2003; Sabath, 1995; Spekman et al.,
1998; Wong & Boon-itt, 2008). Table 2.6 presents in chronological order key
findings in the field of supply chain integration.
Page 45
27
Table 2.6: Supply chain integration findings
Author Methodology Key Finding
Stevens (1989) Conceptual
paper
The author identified a progressive four stage supply chain
integration model starting with baseline integration,
functional integration, internal integration and external
integration.
Stank et al.
(1999a)
Quantitative The analyses identified that customer and internal
integration are the most significant differentiators of
overall firm performance.
Whipple &
Frankel (2000)
Quantitative The authors identified that the largest barrier to external
integration success is organisational (e.g. culture and the
need to reengineer the business process) rather then
technical or financial.
Frohlich &
Westbrook
(2001)
Quantitative Organisations with the greatest arch of external integration
had the largest rates of supply chain performance
improvements.
Towill et al.
(2002)
Qualitative The authors carried out detailed case studies on 20 supply
chains from the European automotive sector. They found
80% progressing towards internal integration, with the
remainder advancing further, towards external integration.
Vickery et al.
(2003)
Quantitative The study shows that the more a company has invested in
integrated information technologies infrastructure, the
more likely it is that the company will achieve internal and
external integration.
Van Donk &
van der Vaart
(2004)
Qualitative Higher complexity in business conditions requires higher
levels of integration. In cases of lower complexity the
authors identified lower levels of integration practises.
Cagliano et al.
(2006)
Quantitative Results show that the adoption of the lean production
model has a strong influence on the integration of both
information and physical flows along the supply chain,
while no significant influence emerged from the adoption
of ERP.
Pagell (2004) Qualitative The author identified that the key drivers for internal
supply chain integration are company structure and culture,
rewards system and communication.
Source: Author
Table 2.6 highlights that the relevance of supply chain integration has been widely
discussed and supported on an empirical basis. Most of the quantitative studies
presented in Table 2.6 also identified a positive relationship between the level of
integration and the performance of the focal company. However, there was little
consistency among the authors in the basic definitions of supply chain integration
and the variables applied in carrying out the research. Van der Vaart and van
Page 46
28
Donk (2007) came to a similar conclusion in their critical review of current supply
chain integration literature.
One possible explanation for the inconsistency of the supply chain integration
definition and research variables is the confusion that surrarounds the supply
chain integration topic. Some scholars understand supply chain integration as the
integration with customers and suppliers only (Frohlich & Westbrook, 2001; van
Donk & van der Vaart, 2004), while other scholars also take internal functional
integration into consideration (Childerhouse & Towill, 2004; Stevens, 1989;
Vickery et al., 2003). Hence, academia lacks a unified view of supply chain
integration. Thus, the exclusion of internal integration creates the first layer of
confusion over the concept of supply chain integration.
Supply chain practises in different industries show that integration is understood
differently, and Table 2.7 presents examples of different industries showing their
dominant supply chain integration practises.
Table 2.7: The meaning of integration for different industries
Industry Author Dominant integration practise
Food Stank et al. (1999a);
Gimenez (2006)
Transparency of information and most efforts are
focused on communication and sharing of
information (e.g. Point-Of-Sale data and
Collaborative Planning, Forecasting, and
Replenishment).
Automotive Lamming (1993); Matson
& Matson (2007)
Integration is closely linked to concepts such as
JIT and lean production, as well as co-managed
inventory and joint R&D. Here the focus is on
linking manufacturing stages through low levels of
stock and short lead times.
Retailer Cox (1999); Burt & Sparks
(2003); Towill (2005);
Supplier integration from a power and dependency
perspective. Lower inventory levels due to cross-
docking of materials.
Fashion,
Technology
Hewitt (1994); Sabath
(1995); Bruce et al. (2004)
Integration is closely linked to concepts such as
quick response (efficient consumer response) and
lean and agile supply chain management.
Source: Adapted from van Donk & van der Vaart, 2007
Thus, Table 2.7 highlights the second layer of confusion around the concept of
supply chain integration. Apparently, the different characteristics of industry
Page 47
29
sectors lead to different supply chain integrative practises. Van der Vaart and van
Donk (2007) provide a reasonable explanation for this phenomenon by pointing
out that different industry sector characteristics might deal with different barriers
in their striving for optimum material and information flows. This argument is
supported by Gimenez (2004) and Romano (2003) who point out that the removal
of barriers between and within organisations seems to be the crucial issue in
integrating the supply chain.
Finally, academia adds a third layer of confusion around the supply chain
integration concept. Different scholars focus on different aspects, when studying
supply chain integration, as highlighted in Table 2.8. Researchers often focus only
on a small area of supply chain integration so that research findings are often
constrained.
Table 2.8: Different supply chain integration research streams
Integration Stream Key Authors Focus
Organisation with
suppliers/customers
Frohlich &
Westbrook (2001)
These studies take an external view of supply
chain integration only.
R&D with
manufacturing
Stevens (1989);
Morash & Clinton
(1997); Koufteros et
al. (2005)
The focus is on the processes used to create new
products, often with an emphasis on moving
from a traditional “functional silos” approach to
a more coordinated or concurrent approach
including suppliers/customers.
Marketing with
manufacturing
Pagell (2004);
Walters (1999)
These works tend to examine ways in which
companies can increase their profitability by
coordinating marketing with manufacturing.
These studies often emphasis moving toward a
more coordinated and less functional way of
management.
Integration of IS
within a company
Narasimhan & Kim
(2001); Gunasekaran
& Ngai (2004)
These studies often examine the ways that a
common technology platform can help various
functions work more closely together.
HR with
manufacturing
Youndt et al. (1996) The authors explored the relationship between
human resource strategy and manufacturing
strategy.
Marketing with
logistics
Ellinger (2000);
Stank et al. (1999a).
These works tend to examine ways in which
companies can increase their profitability by
coordinating marketing with logistics.
Source: Author
Page 48
30
The conclusion that can be drawn from Tables 2.6, 2.7, and 2.8 is that integration
as a concept is ill defined and not well understood (Frohlich & Westbrook, 2001),
which leaves the concept of integration in serious scientific doubt. Van Donk and
van der Vaart (2005b) are among a small group of authors who doubt the concept
of supply chain integration. They argue that integrative practises should have
greater exploitation in the circumstance of high demand uncertainty. The practises
can then be limited to physical flow and stock management when customer
demand is known to be relatively uncertain. They comment that integrative
practises are hardly possible, or feasible, in circumstances of shared resources and
limited capacity (van Donk, Akkerman & van der Vaart, 2008). Finally, van der
Vaart & van Donk (2006) argue that integration also depends on business
characteristics. Arguing along the same lines, de Teville et al. (2004) conclude
from their research that demand integration is only warranted when there is
sufficient demand variability. In addition, supplier and customer integration has
been particularly scrutinised. Cox (2001) argues that not all relationships should
be fully integrated. Indeed, the relationship type adopted should be matched to
supplier and customer dependency. Swink et al. (2007) show how four different
forms of strategic integration have both benefits and dis-benefits. Mann et al
(2008) argue that the structures of monolithic organisations and global supply
chains are similar and that, consequently:
Wealth is being globally redistributed (e.g. changed labour wage structures
across the globe as jobs shift from country to country)
Political institutions are being affected (e.g. Wal-Mart, as a dominant and
most visible face of the biggest supply chain, is more powerful than the
majority of nation states)
Life chances are being influenced (e.g. supply chains that span national
borders result in lost jobs or reduced availability of jobs, loss of local
culture, death of local businesses and crafts…)
It is important to emphasise that the debate in the literature is not about full
integration versus zero integration. Rather, it is about how much integration is
justified and under what circumstances. The answer to these questions depends
very much on the nature and purpose of the supply chain. For example, it is
difficult to envisage any circumstances in which internal material and information
Page 49
31
flow optimisation will not prove essential for competitiveness. Hence, the
proponents clearly outweigh the opponents. Maloni and Benton (2000) provide a
list of potential benefits for supply chain integration:
Reduced uncertainty for customers in (a) material costs, (b) quality, (c)
timing and lead times, and (d) availability and responsiveness;
Reduced uncertainty for suppliers in (a) market, (b) understanding of
customer need, and (c) product/material specifications;
Reduced uncertainty for both in (a) convergent expectations and goals, (b)
reduced effects from externalities, (c) reduced opportunism, (d) increased
communication, and (e) shared risk and reward;
Cost savings from (a) decreased administration costs, (b) decreased
switching costs, and (c) integration of processes and technologies;
Enhanced responsiveness from (a) joint product and process development,
(b) faster time to market, and (c) improved cycle time.
This section has examined the confusion that exists around the concept of supply
chain integration. However, Ho et al (2002) point out that the development of
supply chain management theory begins with the establishment of a clear
conception of its meaning. Hence, it is important to clearly define the author‟s
view regarding supply chain integration, which is presented next.
2.8.2 Author’s view of supply chain integration
Not only has the supply chain integration construct been used to study a number
of different organisational phenomena, it has been defined in a number of
different ways. Additionally, many authors who have studied integration offer no
formal definition of the construct. The end result is that this commonly researched
construct does not have a single, accepted definition (Pagell, 2004). However,
from the literature, it emerges that integration can support business processes at
two different levels; internal and external. Internal integration aims at overcoming
the functional silo boundaries. The goal is inter-departmental collaboration that
brings departments together into a cohesive organisation (Kahn & Mentzer, 1998).
External integration, aims at overcoming the individual company boundaries and
advancing integration to an overall supply network integration. Figure 2.2 depicts
Page 50
32
the author‟s view of supply chain integration. This is the perspective adopted for
the remainder of this thesis, which is in line with that of many other authors (e.g.
Bowersox et al., 2002; Fawcett and Magnan, 2002; Lee, 2000; Stevens, 1989).
.
Figure 2.2: Integrated supply chain model
Source: Adapted from Handfield and Nichols, 2002
The supply chain shown in Figure 2.2 represents a simplified supply chain
network structure. The enterprise in the middle is referred to as the focal
company. Figure 2.2 further highlights the information and product flows, and the
key supply chain business processes penetrating functional silos within the focal
company and the various corporate silos across the supply chain (Bowersox et al.,
2002; Lambert et al., 1998). Figure 2.2 presents the need for internal integration of
key functional areas such as engineering, sourcing, logistics, and operations.
External integration with customers and suppliers (see Figure 2.2) through a
distribution network is highlighted. The end consumer purchases products based
on cost, quality, availability, maintainability, and reputation and a hope they
satisfy requirements and expectations.
Internal and external integration aims at a more effective use of the combined
resource base, together with better integrated information and material flows.
However, external integration is often viewed as partnerships and strategic
M
A
T
E
R
I
A
L
S
E
N
D
C
O
N
S
U
M
E
R
S
Internal
IntegrationExternal
Integration
M
A
T
E
R
I
A
L
S
Human/People Integration
Information flow through Technological Integration
Procurement
Manufacturing
Distribution
E
N
D
C
O
N
S
U
M
E
R
S
External
Integration
R
A
W
Page 51
33
alliances (e.g. Droge et al., 2004; Kim, 2006; Maloni & Benton, 1997; Spekman
et al., 1998), which is somehow contradictory to the initial aim of optimising
material and information flow. Therefore, Gimenez (2004) focuses solely on the
maturity of vendor managed inventory (VMI) practises in a focal company to
identify the level of supplier integration. Others have focused on advanced
information systems such as EDI to identify the degree of external integration
(Vickery et al., 2003). Frohlich and Westbrook (2001) likewise place most
emphasis on information flow and communication channels when investigating
“arcs of integration.” Therefore, it can be argued that partnerships and strategic
alliances go beyond external integration and the pure optimisation of material and
information flows.
Supply chain integration represents a promising though intricate concept that is
still maturing. To support this maturation, more research is required to identify
critical drivers of, and barriers to, the integration process (van der Vaart & van
Donk, 2007) because the removal of barriers between and within organisations
seems to be a critical issue in integrating the supply chain (Gimenez, 2004; Naylor
et al., 1999; Romano, 2003). This section has presented the authors view of
supply chain integration, although due to its intricate nature no single definition is
provided. Next, key barriers and drivers to supply chain integration are discussed.
2.9 Barriers and enablers to supply chain integration
Many scholars acknowledge the existence of barriers to, and enablers of,
achieving supply chain integration in both internal and external areas of supply
chain integration (Bagchi & Skjott-Larse, 2002; van Donk & van der Vaart,
2005b; Whipple & Frankel, 2000); however, in-depth investigations are rare.
2.9.1 Internal barriers and enablers to supply chain integration
Barriers to internal integration have origins in traditional functional practises
related to organisational structure, measurement and reward system, information
technology, and supply chain skills (Wisner et al., 2005). However, internal
barriers are not well understood. Storey et al. (2005), for example, identified that
Page 52
34
much of the supply chain literature underestimates organisational and behavioural
complexities.
The two key publications in the field of barriers to, and enablers of, internal
supply chain integration are by Gimenez (2004) and Pagell (2004). Gimenez
focuses on the barriers to implementing supply chain management programs by
interviewing managers at 14 different businesses in the Spanish grocery sector.
The key barriers identified are organisational culture and attitudes of people
working in the company, functional silos, and information systems and
technologies (a full list of the barriers Gimenez identified can be found in
Appendix A.1). Pagell also argued that the main barriers are people in the form of
the structure and culture at the plant, reward systems and the amount of formal
and informal communication. Despite their contribution to knowledge, both
studies have limitations. Pagell only focuses on the interfaces of three different
departments within a focal company: purchasing, manufacturing and marketing;
thereby ignoring interfaces with other internal departments. Gimenez only
captures the management perspective on the barriers and therefore ignores barriers
that management staff is unaware of. Lambert and Cooper (2000), Pagell, and
Gimenez all state that further research in supply chain barriers is required. This
thesis aims at contributing to knowledge in the field of internal barriers to supply
chain integration by raising the following research question:
Research Question 2: What barriers obstruct internal supply chain
integration in practise?
Many key barriers, when addressed appropriately, serve as supply chain
integration enablers; variables that managers can address to design and manage
any key business processes internally (Romano, 2003). Table 2.9 provides a list of
key internal barriers and enablers of internal supply chain integration.
Page 53
35
Table 2.9: Barriers to supply chain integration Barriers Description Enablers
Multiple independent
information systems (Lee 2000;
Wisner et al., 2005)
The structure and availability of information have traditionally been based on functional organisation
requirements. This early practise in formatting information has resulted in what is referred to as infocratic
structure. The fully integrated system instead is capable of linking and coordinating the information systems
of individual parties into a cohesive whole, thereby providing information transparency.
Fully integrated information
system (Fawcett & Magnan,
2002)
Defensive culture and attitude
of individuals (Wisner et al.,
2005)
A defensive culture is represented by people unwilling to work together or share information because of the
fear that the other party will take advantage of them or use the information unethically. However, people and
organisational culture are seen as a key enabler to supply chain integration. Hence, the development of a
positive culture regarding change is necessary.
Willingness to change.
Empowerment (Sirkin et al.,
2005)
History (Pagell, 2004)
The author identified that many cultural barriers are embedded in the company‟s history. Hence, history
influences culture and attitude in the plant.
Strategic vision that breaks
with the past
Hierarchical organisational
structure (Harrington, 1995)
The structure of a focal organisation has traditionally been based on functional organisation requirements.
Hence, the organisational structure is hierarchical and functionally orientated, supporting a functional silo
mentality. A flat organisational structure instead empowers people within the process to make decisions.
Flat organisational structure
(Cooper et al., 1997;
Hammer, 2001)
Functional driven reward
system (Bowersox et al., 2002)
Traditional measurement and reward systems typically mirror organisation structure. Hence, most reward
systems are based on functional achievement. However, cross-functional KPIs will help to overcome the silo
mentality present in many companies.
Cross-functional driven
reward system (Lee, 2000;
Wisner et al., 2005)
Lack of supply chain skills
(Walker et al., 2008)
This variable describes the lack of knowledge regarding the benefits of supply chain management among
management and other employees within a focal company. Advancing supply chain skills and systems
thinking within the workforce enables staff members to understand the wider trade-offs of their action.
Supply chain skills (Walker et
al., 2008)
Lack of staff training (Walker et
al., 2008)
Staff does not receive formal supply chain training and individual initiatives are seldom supported.
Providing staff training positively impacts on the culture as staff members feel valued, and the skill level of
the individual is raised.
Extensive staff training
(Walker et al., 2008)
Strategic misalignment (Chopra
& Meindl, 2006)
The overarching strategy sets the direction for the entire company. Misalignment of company strategy with
supply chain strategy can result in different functions following different directions and hindering
information and material flow optimisation. In an ideal world, companies within a supply chain are
committed to a single strategy.
Strategic alignment (Peck &
Juttner, 2000)
Lack of top management
support (Pagell, 2004)
Changes in the process will most likely have an impact on different functions. Top management support is
essential to achieve material and information flow optimisation that cuts across different functions.
Top management support
(Pagell, 2004; Storey et al.,
2005)
Cost of implementation (van
Donk & van der Vaart, 2005b)
Cost concerns are a serious obstacle for supply chain integration, especially if companies follow a short-term
budget view. Long-term investment focus is essential.
Long-term investment focus
Page 54
36
Next, external barriers and enablers to supply chain integration are presented.
2.9.2 External barriers and enablers to supply chain integration
External barriers to supply chain integration span the whole range; from a lack of
a culture of sharing information or trust (e.g. Giminez, 2004; Whiple & Frankel,
2000) to shared resources on the supplier side (van Donk & van der Vaart, 2004).
However, a number of academic studies have identified trust as the key external
integration characteristic fostering collaborative behaviour (Drago, 1997;
Geyskens et al., 1996; Myhr & Spekman, 2005). Trust is defined here as the
degree to which companies perceive each other as credible and benevolent and it
has a positive effect on the degree of supply chain integration (Myhr &
Spekman, 2005). However, trust is also one of the biggest uncertainties in
relationships. A high level of trust is evidenced by data sharing throughout the
supply chain and, more importantly, in trust being placed in people (Drago,
1997; Ireland & Crum, 2005).
One of the greatest deterrents to trust is one‟s relative power (Handfield &
Bechtel, 2004). Power and dependency in relationships has been studied
extensively (Bensaou, 1999; Caniels & Gelderman, 2005; Cox, 2001; Kraljic,
1983). The power phenomenon can be defined as the ability of one entity in the
chain to control the decision of another entity (Daparin & Hogarth-Scott, 2003).
Further, the balance of power can be held by the company buying or supplying
(Cox, 2001, 2004). However, power as a concept is of little analytical value since
the nature of power itself is less important than the origins of power.
Dependence, being the inverse of power, is the reliance of one party on the other
in maintaining a relationship to achieve respective goals (Emerson, 1962).
Dependence makes possible the establishment of control mechanisms over the
dependent party (Farell & Schroder, 1998; Geyskens et al., 1996).
The literature draws a distinction between buyer dependency and supplier
dependency. Supplier dependency typically exists when the buying company is
significant for the supplier; the buying company has a high percentage of the
supplier‟s total market (Motwani et al., 1998). Conversely, buyer dependency
Page 55
37
can be characterised as having a high need for, but relatively low possibility of,
integrative practises with suppliers (Cox, 2004). Currently, only limited attention
has been given to measuring power and dependency in relationship management
(Simatupang & Sridharan, 2004b). However, van der Vaart and van Donk (2007)
conclude that power and dependency in external relationships should be
measured since the concept is among the main factors shaping and influencing
integration (a more detailed literature review of the variables influencing power
and dependency is provided in Chapter 7). Due to the overall importance of
power and dependency for external supply chain integration, this thesis places
increased emphasis on this particular phenomenon by raising the following
research questions:
Research Question 3a: What is an appropriate technique to measure power
and dependency across inter-organisational boundaries?
Research Question 3b: How do power and dependency affect external
supply chain integration?
Many initiatives within the field of supply chain management and operations
management are directed toward the removal of barriers to ease the material and
information flow (Naylor et al., 1999). However, the removal of barriers implies
change from the current supply chain practise to a more integrated way to do
business. This thesis intention is not to study change in particular. Rather, the
interest is on the routes companies take to further integrate their supply chain.
How is supply chain integration actually achieved? Therefore, the concept of
supply chain change cannot be completely ignored when studying the
pathways/routes to supply chain integration.
2.10 Supply chain change
The integration of a supply chain requires change internally and also externally
with suppliers and customers. These changes target the removal of supply chain
integration barriers to ease the material and information flows. Here, two distinct
forms of change within supply chain management are discussed; a more gradual
Page 56
38
change process termed continuous improvement, and radical change in the form
of Business Process Reengineering.
2.10.1 Continuous Improvement
Japanese companies originally championed continuous improvement (CI) or
Kaizen (Balle, 1995). Continuous improvement programs evolved from a focus on
traditional manufacturing production line to reduce waste and improve product
quality, into comprehensive, systematic methodologies that focus on the entire
organization; from top management to the workers on the shop floor (Bessant et
al., 1994). Hence, CI and quality management programs go hand in hand as they
seek to achieve excellence through improvement. The best known are Kaizen, Six
Sigma, Quality Circle and Total Quality Management. More recently, large
organizations are developing their own CI methodologies to fit their specific
needs, by encompassing the various tools and techniques of individual
methodologies (Bhuiyan & Baghel, 2005). The following list is not
comprehensive and captures only the CI methods most relevant for this thesis.
2.10.1.1Kaizen
Kaizen was developed by the Japanese to overcome the inferior quality of many
manufactured goods after the World War II. Kaizen is a process-oriented
approach and focuses on small continuous improvements. Another key focus of
Kaizen is to eliminate waste. Overproduction, scrap, unnecessary motion or tasks,
excessive time setting up and breaking down processes, and moving goods too
frequently and too far are examples of waste (Berger, 1997). For example, Dr
Shigeo Shingo was instrumental in helping the car manufacturer Toyota overcome
its quality problems. The contributions from Dr Shingo included concepts called
just in time and zero quality control concepts (Raisinghani et al., 2005).
2.10.1.2 Quality Circle
In the 1950s, the Toyota Motor Company first implemented Quality Circles
within the production process. Hence, Quality Circle can be seen as part of lean
Page 57
39
manufacturing (Bhuiyan & Baghel, 2005). It is a people orientated approach to
quality improvement. The approach is to take a small group of people working on
related activities and empower them to make decisions and recommendations to
improve their activities. Management‟s role is to provide a congenial atmosphere
in which the group can make suggestions for improvement, even if it leads to
management making adjustments to their style and culture. Organisational change
due to the implementation of Quality Circles is a result of several aspects
including fostering a change in employees attitude, development of individuals
involved, and creating a team spirit and a positive working environment
(Raisinghani et al., 2005).
2.10.1.3 Six Sigma
Six Sigma has been defined as an organised and systematic method for strategic
process improvement and new product and service development (Wisner et al.,
2005). The method relies on an extensive set of rigorous tools including statistical
methods, mathematical modelling and the scientific method to make dramatic
reductions in the customer defined defect rates (Linderman et al., 2003). To
achieve this, the DMAIC model was developed; Define opportunities, Measure
performance, Analyse opportunities, Improve performance, and Control
performance. Six Sigma provides quality measurement that can be used
throughout an organisation – not only in manufacturing but also in design,
administrative, and service areas (Kwak & Anbari, 2006).
2.10.1.4 Total Quality Management
Total Quality Management (TQM) refers to a management methodology to
empower organizations for self-improvement. Unlike many quality initiatives,
implementation is top down starting with upper management (Wisner et al.,
2005). The evolution of TQM incorporated a Japanese-style technique called
Hoshin, which defines the targets and means of any project or problem. A target
statement is developed involving actions, metrics, and a time period.
Management‟s role is to provide the means to achieve the target (Chang, 2005).
Page 58
40
2.10.1.5 Hybrid Methods
While individual CI programs help to improve organisational operations in many
aspects, they are not necessarily effective at solving all issues. To overcome the
weaknesses of one program or another, a number of companies have merged
different CI initiatives together, resulting in a combined CI program that is more
far reaching. Lean Six Sigma is a well-known hybrid methodology, a combination
of Six Sigma and lean manufacturing. Another well known hybrid method is the
combination of TQM with Six Sigma to gain the benefits of both methods
(Raisinghani et al., 2005). A more aggressive alternative to CI is termed business
process reengineering.
2.10.2 Business process reengineering
Business process reengineering (BPR) is the Western answer to continuous
improvement (Balle, 1995). BPR is a radical change approach because it triggers
change of many kinds, not just of the business process itself. Job designs,
organisational structures, management systems, anything associated with the
processes are reengineered in an integrated way. Process reengineering is founded
on two key ideas:
Business should be viewed horizontally, not vertically, and should focus
on business processes rather than on functional areas, departments, etc.
The only way to change the way the company works is to apply very
aggressive change management concepts, involving people at every level,
and communicate extensively throughout the organisation (Harrington,
1995).
A BPR initiative is commonly seen as a twofold challenge (Carr & Johansson,
1995; Reijers & Mansar, 2005). Firstly a technical challenge, which is due to the
difficulty of developing a process design that is a radical improvement of the
current design. Secondly, a socio-cultural challenge, resulting from the severe
organisational effects on the people involved, which may lead them to react
against those changes. Many authors identified the socio-culture challenge as the
more critical one (Deetz, Tracy & Simpson, 2000; Harrington, 1995; Bainbride,
Page 59
41
1996). Jaffe and Scott (1998) identified a number of critical factors for successful
BPR and Table 2.10 provides an overview of those factors.
Table 2.10: Critical factors for successful BPR
Success Factor Description
Critical mass It is not easy to get people to be different. It is important to persuade people
that change is necessary and not to dictate change. Employees that are
persuaded by the required change will persuade others and together they
become a critical mass to drive the change process.
Open to
discovery and
learning
Reengineering is a major risk, moving forward into uncertainty, and is not
something that can be done cautiously. If a company tries to move into new
territory, then this company will have to learn as it goes.
Overcoming
resistance
Organisations and people are designed to resist change, not to embrace it.
Hence, change is difficult to achieve. Top managers often ignore the human
dimension of the process. To change, people need to shift their mind-sets,
their ways of seeing the organisation, and their established roles to take on
new and unfamiliar activities that may be highly threatening.
Top
management
support
No deep change is successful if the leaders are not fully engaged and deeply
involved in the effort. Top management must visibly support the
reengineering process and set the ground rules and expectations consistently
and repeatedly.
Source: Adapted from Jaffe & Scott, 1998
Several well-known management philosophies exist that can scope and guide the
overall course of a reengineering project, such as Total Cycle Time Compression
(Schonberger, 1986; Stalk & Hout, 1990), the Lean Enterprise approach (Womack
& Jones, 2005), and Constraints Management (Goldratt & Cox, 1992). However,
a discussion of these various approaches is outside the scope of this thesis. More
importantly, the similarities between BPR and supply chain integration are further
explored here.
Supply chain integration and BPR are seen as two complementary philosophies.
However, Evans et al. (1995) argue that after full and successful business process
re-engineering, internal integration will be achieved. The authors undertook an in-
depth literature review to identify the change areas when implementing an
integrated supply chain or undertaking reengineering, which is presented in Table
2.11.
Page 60
42
Table 2.11: Parallels between BPR and supply chain management
Area for
change
BPR terminology SCM terminology
Process Elimination of waste around the
core processes
Speed up core processes
Concentration on core processes
Reduce non value add activities
Lead time reduction
SCM positions each firm to do
what it does best
People Board level commitment
A management that questions
A work force that questions
Multi-skilled work force
Attitudinal changes
Board level commitment (with
SCM champion at board level)
A management that questions
A work force that questions
Multi-skilled work force
Attitudinal changes
Technology Technology change
IT – a key to BPR
Technology change
IT – a key to SCM
Relationship
Management/
Innovation
Supplier relationship management
Customer focus
Constant innovation at the
interfaces of the company
Constant product/ process
innovation
„Partnership sourcing‟
Deep penetration into customer
base
Constant innovation at the
interfaces of the company
Streamline processes
Source: Adapted from Evans et al., 1995
Table 2.11 subdivides the area for change into four distinct categories: process,
people, technology and innovation and identifies a remarkable overlap between
BPR and supply chain management in all four change areas. Hence, Evans et al.
(1995) argue that those companies which have already integrated the supply chain
will have already travelled the same path as BPR. Next, each area for change is
further explained.
2.10.2.1 Process
Business process re-engineering involves rooting out the real value-adding
activities that can be offered to the customer through core process activities. The
task is to highlight the important processes that are currently strong through the
company and integrate them effectively, implementing new designs.
Page 61
43
2.10.2.2 People
It is a widely understood requirement that the drive and vision for BPR and supply
chain integration is from the top. Constant communication and commitment are
management requirements for any major change. The foundation of reengineering
must rest on all people changing and learning, which means that everyone in the
organisation must be engaged in the process (Harrington, 1995). Reengineering is
not the application of a standard technology. It requires a discovery by the people
in the organisation of new ways and open systems – a sharing of full information
from customers, the environment, and across boundaries (Jaffe & Scott, 1998). To
change, everyone in the organisation – leaders as well as other employees – needs
to shift their mind-set, their ways of seeing the organisation, and their established
roles to take on new activities that are unfamiliar and sometimes highly
threatening (Hammer, 1990).
2.10.2.3 Technology
Bottlenecks within the system can only be effectively dealt with through the
implementation of new technology. Although the major thrust has been in the
application of IT, shop floor technology is equally important. However, the
technology must be able to cope with the new environment that re-engineering
and integration within the supply chain bring. For an extensive list of
methodologies, techniques and tools see Kettinger et al. (1997).
2.10.2.4 Innovation
Incremental process innovation ideas are linked to the make-up of personnel but
the business structure dictates if these ideas are prematurely rejected or not. The
concept of encouraging and then implementing good ideas from the shop floor is
not a new one. This concept is well anchored in TQM programmes. Further,
supplier and customer relationship management falls under this category.
A successful change process of any kind (BPR or CI) in the area of supply chain
management should result in improved material and/or information flow. Hence
the successful change process should result in a further integrated supply chain.
Page 62
44
However, van der Vaart and van Donk (2007) concluded that there is little
consensus on how to capture the essence of integration.
2.11 Achieving supply chain integration
2.11.1 Supply chain integration in theory and practise
Despite more than 20 years of academic publications there remains a significant
gap between supply chain theory and practise. Many scholars report that few
companies are actually engaged in extensive and advanced supply chain
integration practises (Akkermans et al., 1999; Halldorsson et al., 2008; Harps &
Hansen, 2000; Kilpatrick & Factor, 2000; Towill et al., 2002, Zailani &
Rajagopal, 2005).
Fawcett and Magnan (2002) carried out a multi-method research approach
involving both surveys and case study interviews in the USA. Their findings
reveal that supply chain practise seldom resembles the theoretical ideal and only
very few companies have truly begun to establish a supply chain management
culture. These companies have begun to map their supply chain, analyse value
propositions and core competencies, and evaluate the appropriateness of existing
and future supply chain relationships (Fawcett & Magnan, 2002). Towill et al.
(2002) carried out detailed case studies on 20 supply chains from the European
automotive sector; a sector well-known for its advanced supply chain practises
(e.g. Toyota Production System). They found that 80% of the sample struggle to
be internally integrated, with the remainder advancing further, towards external
integration. McAdam and McCormack (2001) presented a qualitative study of the
relationship between managing business processes and managing supply chains.
They found little evidence of companies actually exploiting the integration of
business processes in their supply chains (McAdam & McCormack, 2001).
Similar findings were reported by Potter et al. (2004), who concluded that,
although the steel supply chain has evolved between 1990-2001 towards an
integrated structure, there are currently constraints imposed by organisational
boundaries.
Page 63
45
Many books reporting on customer responsive supply chain practises are using
Procter & Gamble, together with Wal-Mart, as best practise examples. Storey et
al. (2005) investigated Procter & Gamble‟s supply chain practises with key
customers (retailers) and reported that while a customer responsive supply chain is
technical feasible both parties lack top management support to implement the
necessary change.
Recently, quantitative studies report the poor application of the supply chain
management concept (Poirier & Quinn, 2003; Zailani & Rajagopal, 2005). Zailani
and Rajagopal (2005) report that companies are still in their infancy stage when it
comes to supply chain management and integration with customers and suppliers.
Supply chain integration is a desirable concept; however, practitioners seem to
struggle with its successful application. Certain barriers exist that hinder the
implementation of an integrated supply chain. Poirier and Quinn (2003) report
that companies within such industries as high technology manufacturing,
telecommunications, and wholesale distribution, had moved into more advanced
levels of supply chain management in parts of their business application areas.
Overall, however, the vast majority of companies reported a poor uptake of the
concept of supply chain management (Poirier & Quinn, 2003).
2.11.2 Pathways to supply chain integration
Narasimhan and Kim (2001) note that much of the research on integration has
been predicated on the assumption that integration occurs in distinct stages.
Possibly the most influential work regarding a stage process towards supply chain
integration is by Stevens (1989), who proposed a four stage evolutionary model of
supply chain integration: baseline integration, functional integration, internal
integration, and external integration. Figure 2.3 represents Stevens (1989)
integration model.
Page 64
46
Figure 2.3: Supply chain integration model by Stevens (1989)
Source: Stevens, 1989
Stevens (1989) suggests that companies follow an integration process that goes
through different stages by integrating internally first and then extending the
integration process to other supply chain members externally. Empirical evidence
(Towill et al., 2000; Koufteros et al., 2005) as well as case study research
(Romano, 2003) support the evolutionary integration model developed by
Stevens.
However, it has been shown that even similar companies may progress through
quite different stages to achieve a fully integrated, seamless supply chain (Towill
et al., 2002; Lambert et al., 1998; Lee, 2000; Stevens, 1989). Towill et al. (2002)
have codified the evolutionary integration model by Stevens and applied it to 20
value streams from the automotive sector. Although none portrayed the
characteristics of the traditional structure, three (15%) are shown as undergoing
functional integration. However, thirteen (65%) of the value streams were in the
process towards internal integration. Only four (28%) had progressed beyond this
stage towards external integration. This work particularly highlights that it is
unusual for supply chains to display all the characteristics of a particular stage at
the same time, therefore indicating that Stevens‟ stepwise progression does not
always reflect reality (Potter et al., 2004). Further, Gimenez‟ (2004) qualitative
study identified one exemplar that did not follow Stevens integration model.
Finally, Halldorsson et al. (2008) report that managers seem to achieve more
PurchasingMaterial
ControlProduction Sales Distribution
Materials
Management
Manufacturing
ManagementDistribution
Materials
Management
Manufacturing
ManagementDistribution
SuppliersInternal Supply
ChainCustomers
Page 65
47
successful integration externally with their suppliers and customers than they do
internally with their managers and departments.
Many researchers have identified a lack of understanding/knowledge regarding
the path to further integrate the supply chain (Cigolini et al., 2004; Frohlich &
Westbrook, 2001; van Donk & van der Vaart, 2005b). Frohlich and Westbrook
(2001), in their award winning paper, raise the question of what are the necessary
steps towards supply chain integration. Pagell (2004) likewise identified that there
is far less research on how to achieve integration and that what research does exist
tends to look at a specific factor such as the use of information technology (e.g.
Narasimhan & Kim, 2001) or a single set of purchasing practises (e.g. Anasai et
al., 1999). Lacking in the literature is a comprehensive study on the pathways to
supply chain integration including factors that enable and inhibit integration. This
thesis aims to close this research gap in understanding, and investigate what
routes companies take to integrate their supply chain. Hence, the following
research question is raised:
Research question 4: What is an effective methodology to investigate
supply chain integration maturity, barriers, and enhancement in practise?
Research question 5: In what ways do companies pursue supply chain
integration in practise?
Furthermore:
Research question 6: How do companies achieve supply chain integration
in practise?
In the light of the preceding discussions, existing supply chain integration models
(e.g. Figure 2.3) need to be tested and also a suitable research methodology that
enables the researcher to investigate pathways to supply chain integration needs to
be identified or, in case of need, developed. Then, the overarching research
question can be addressed.
Page 66
48
In order to be able to answer the overarching research question, a conceptual
model is needed capable of capturing all relevant characteristics of supply chain
integration. Currently, there is no commonly agreed framework for the
components of supply chain integration (Zhao et al., 2008). Van der Vaart and van
Donk (2007) proposed one conceptual model focusing on three main categories;
attitudes (e.g. attitude towards customers or suppliers), practises (e.g. EDI and
VMI) and patterns (e.g. face-to-face contact with suppliers and customers).
However, their model is conceptual only and externally focused. Hence, a new
conceptual model capable of capturing the essence of internal and external
integration is proposed next.
2.11.3 Assessing supply chain integration in practise
Stevens (1989), Towill (1997b), Kim (2006) and Das et al. (2006) concluded that
advanced supply chain management practises lead to a higher level of supply
chain integration. Supply chain practises are viewed as tangible activities or
technologies that play an important role regarding integration. Hence, advanced
supply chain integration practises have been identified in the literature (Potter et
al., 2004). The authors identified 10 supply chain integration practises, which are
included in the following Tables 2.12 - 2.16. An additional 12 practises have been
identified (including intangible characteristics that have been reported as being
critical to supply chain integration) to capture a focal company‟s supply chain
integration status. The combined set of 22 characteristics has been grouped into
five different categories termed; information generation and sharing; relationship
management; technology integration; people/culture; and performance outcome.
The developed conceptual model (Tables 2.12 - 2.16) enables the researcher to
clearly evaluate the effect of the change process on supply chain integration. The
Evans et al. (1995) categories for comparison of business process reengineering
and supply chain management, set the basis for the developed conceptual model
because the authors identified that companies that have already integrated the
supply chain will have likely have already travelled the same path as business
process reengineering. Further, a detailed literature review for each proposed
category has been conducted, which resulted in 22 supply chain integration
practices.
Page 67
49
Tables 2.12 - 2.16 follow Stevens (1989) stepwise approach, each table describing
the four different stages of supply chain integration; traditional supply chain,
functional supply chain, reactive supply chain and seamless supply chain. The
N/A column has been utilised in case a practise is not applicable. Functional
supply chain integration and early reactive supply chain integration stages
emphasise capabilities of cost reduction rather than balanced performance
improvement, while enhanced reactive supply chain integration and seamless
supply chain stages are characterised by capabilities enabling a smooth flow of
material and information through full systems visibility and complete information
sharing, and long-term commitment with key external entities of choice (Kim,
2006). Next, each identified supply chain practise category is discussed in detail
along these supply chain stages of progression.
2.11.3.1 Information generation and sharing
Information integration makes inventory and production visible throughout the
supply chain, creating a more congenial climate for collaborative planning and
forecasting (Bagchi & Skjoett-Larsen, 2002). Data includes production schedules,
forecasts or delivery data between different functions within a focal company and
with other supply chain members like customers, suppliers or carriers (Mouritsen
et al., 2003). Many improvements within supply chains are enabled by
developments in the areas of information sharing (van der Vaart & van Donk,
2004). Table 2.12 highlights four information integration characteristics:
operational data, visibility, communication, and performance measures.
Page 68
50
Table 2.12: Information generation and sharing assessment
Source: Author
In the traditional supply chain setting, operational data is not shared. However, as
supply chain practises improve, the sharing of information becomes more critical
and expands from sharing within a function to extensive sharing within the focal
organisation. The last stage includes suppliers and customers in the data sharing
activity; however, many academics argue that prior to the extensive sharing of
information, trust needs to be built up between the focal company and its external
entities (Wisner et al., 2005).
Holweg et al. (2005) developed a four stage integration model where visibility
played a crucial part. They argue that reducing uncertainty via visibility of
information flow is a major objective in supply chain integration. Unpredictable
or non-transparent demand patterns have been identified as causing artificial
demand amplification. This leads to poor service levels, high inventories and
frequent stock-outs. In the traditional supply chain, no visibility is present. The
visibility of information improves internally until full pipeline visibility is reached
in the seamless supply chain stage (Holweg et al., 2005)
Pagell (2004) identified communication as one of the key enablers to supply chain
integration. Bagchi and Skjoett-Larsen (2002) similarly identified that supply
chain management requires various actors at all levels of hierarchy in multiple
organisations to work and communicate together for achieving a common goal.
The traditional supply chain value reflect poor communication practises.
Communication strongly improves internally and externally until multiple contact
Characteristics N/A Traditional SC Functional SC Reactive SC Seamless SC
Operational data
(Mouritsen et al.,
2003)
Visibility (Holweg et
al., 2005)
Communication
(Bagchi & Skjott-
Larsen, 2002)
Not shared Shared throughout
supply chainShared within
organisation
Shared within
function
No visibilitySmall amount of
cross-functional
visibility
Complete visibility
within organisation
Poor
communication
Improved
communication
within the company
Few contact points
between companies
in the supply chain
Multiple contact
points at all
management levels
Full supply chain
visibility
Performance
measures (Bagchi &
Skjott-Larsen, 2002)
Performance
measurement across
supply chain
Supply chain
measures within
company
Measurement of
delivery performance
and inventory
None
Page 69
51
points at all management levels have been established (Bagchi & Skjoett-Larsen,
2002).
The final characteristic is integrated measurement systems, which are required to
manage and coordinate supply chain operations. Good metrics and strong
measurement systems serve to provide timely feedback that enables management
to take corrective action and for superior results. These systems must track
performance across the borders of internal functional areas and external supply
chain partners, measuring the operations of the overall supply chain (Stank et al.,
1999b). Bagchi and Skjott-Larsen (2002) developed and successfully tested a
three stage performance measurement model ranging from low integration over
medium to high levels of integration. Again, the traditional supply chain value
reflects poor performance measurement.
2.11.3.2 Relationship management
Relationship management is concerned with the integration of key customers and
suppliers. Without a foundation of effective supply chain organisational
relationships, any efforts to manage the flow of information or materials across
the supply chain are likely to be unsuccessful (Power, 2005). Five key integration
practises have been identified and are presented in Table 2.13.
Table 2.13: Relationship management assessment
Source: Author
Characteristics N/A Traditional SC Functional SC Reactive SC Seamless SC
Supplier relationship
(Spekman et al.,
1998)
Customer relationship
(Holweg et al., 2005)
Procurement
(Ellram & Carr,
1994)
Open market
bargaining – large
supplier base
Collaboration –
with supplier of
choice
Co-ordination –
information linkages
Co-operation –
fewer suppliers
(longer contracts)
Poor customer
service
Reactive customer
service
Some few major
customer
integration
Reactive buyingIndependent
procurement
Essential business
function
Internally and
externally
integrated function
Lasting relationships
with customers of
choice
VMI / CPFR (Holweg
et al., 2005)Not implemented
CPFR/VMI with
key suppliers and
customers
Implementation stage
with a few supplier /
customers
Used only in an
experimental stage
SC strategy (Peck &
Juttner, 2000)None
Each function
individualCompany aligned Supply chain aligned
Page 70
52
Spekman et al. (1998) identified a four stage transition regarding supplier
relationship management. In the first stage, supplier relationship management is
immature. Companies have a strong price focus, and manage a large supplier base
with predominantly adversarial relationships. As supplier relationship
management practises mature, the company significantly reduces the number of
suppliers and engages in longer-term contracts. The third stage is termed co-
ordination. Here the focus is on information linkages with key suppliers and
improvement of material and information flow. Collaboration with suppliers of
choice is the final stage. Here, the focus is on optimising material and information
flow with key suppliers. The terminology choice in the seamless supply chain
stage points to their being no supplier dominance present in those relationships.
Holweg et al. (2005) proposed a four stage collaboration model focusing on
VMI/CPFR and customer relationship management. In the traditional supply
chain stage, companies purely react to customer demand; techniques like VMI and
CPFR have not been implemented. The poor information flow leads to high
inventory and frequent stock outs, which is associated with poor customer service.
In the functional supply chain setting, customer and supplier still order
independently, yet exchange demand information to overcome poor customer
service. This step is frequently advertised as the first implementation of VMI
and/or CPFR. In the reactive supply chain stage, key customer integration is
achieved using long-term contractual agreements. VMI and CPFR practises are
mature. In the seamless stage, all key customers of choice are closely linked to the
focal company, with extensive information exchange and VMI/CPFR practises
(Holweg et al., 2005).
Ellram and Carr (1994), propose a four stage purchasing development model. The
first stage is the passive stage. Purchasing is viewed as a reactor to requests from
the other departments. Many of purchasing‟s legitimate activities are handled by
other functions outside of purchasing. In the independent stage, purchasing
departments spend time to professionalise the purchasing function by introducing
formalised supplier programs. In the third stage, purchasing departments are
viewed by top management as essential business functions. Purchasing is
expected to support and strengthen the company‟s competitive advantage (e.g.
Page 71
53
providing timely information to all departments in the company about changes in
price and availability of materials). In the integrative stage, the company‟s
competitive success rests significantly on the capabilities of the purchasing
department‟s personnel.
Mejias-Sacaluga and Prado-Prado (2002) highlight the importance of strategic
alignment. To take full advantage of the supply chain approach, the supply chain
strategy for key customers and suppliers need to be linked to the overall business
strategy. Pagell (2004), and Peck and Juttner (2000) point out that in an ideal
world, all the companies within a supply chain are committed to a single and
aligned proactive strategy.
2.11.3.3 Technology integration
Ideally a company‟s IS system provides effective support for the functioning of
the supply chain. The overall information systems architecture must be capable of
linking and coordinating the information systems of the individual parties into a
cohesive whole (Fawcett & Magnan, 2002). Bagchi and Skjoett-Larsen (2002)
developed and successfully tested a three stage information integration model.
Table 2.14 represents Bagchi and Skjoett-Larsen‟s model for the functional supply
chain, reactive supply chain and seamless supply chain column. A fourth column
(traditional supply chain) has been added reflecting a poor uptake on information
systems.
Table 2.14: Technology integration assessment
Source: Author
Characteristics N/A Traditional SC Functional SC Reactive SC Seamless SC
Track-and-trace
system (Bagchi &
Skjoett-Larsen, 2002)
Data transfer system
(Bagchi & Skjoett-
Larsen, 2002)
Transaction system
(Bagchi & Skjoett-
Larsen, 2002)
No IT system
being used
Bar coding of
products
Increased bar-coding,
automated updated
with key players
Track-and-trace
system throughout
the supply chain
Manual – facsimile
or telephone
PC based IS (E-
Mail, Internet,
Extranet)
Few EDI/Internet
links to customer /
suppliers
Extensive use of
EDI/Internet/XML
links within SC
Separate
independent
incompatible
MRP/MRP II legacy
system
ERP/DRP with MRP
II / intra company /
rigid interface
ERP + SC planning
inter company /
flexible interface
Page 72
54
Track and trace systems monitor the real-time location of materials. This real-time
information improves a company‟s response to customer questions regarding
deliveries. Track and trace systems also allow those receiving goods to be
prepared when materials arrive and thus to perform all the loading, unloading, and
corresponding administrative work in a more efficient manner (Chopra & Meindl,
2006). The seamless supply chain has full pipeline visibility. In complete contrast,
the traditional supply chain has no IT system in use (Bagchi & Skjoett-Larsen,
2002).
Electronic data interchange (EDI) technology provides suppliers with information
about their production needs by giving suppliers access to production planning
and control systems, vendors can then arrange deliveries without the need of any
paper transaction (Gattorna & Walters, 1996). Similarly, the cash flow is
optimised by timely payments using EDI. Reduction of payment delays
significantly lowers the cost of doing business and makes the supply chain more
efficient, and supports external integration (Bagchi & Skjoett-Larsen, 2002). The
seamless supply chain makes extensive use of EDI technology, whereas the
traditional supply chain typically still uses facsimile and phone.
ERP systems are primarily built on transactions-based systems, while supply
chain management provides visibility, planning, collaboration, and control across
and beyond the enterprise. Hence, ERP and supply chain management should be
integrated to provide higher business value (Bose et al., 2008). Bose et al. further
identified that the successful implementation of an ERP system resulted in a
strong increase of order fulfilment as well as a considerable reduction in
inventory. The seamless supply chain has a fully integrated transaction system
with flexible interfaces, whereas the traditional supply chain applies separate
independent and incompatible transaction systems.
2.11.3.4 People
Supply chain management requires various actors at all levels of the hierarchy in
multiple organisations to work together to achieve a common goal. Managing and
coordinating the human/people factor along the supply chain is therefore very
Page 73
55
important (Trkman et al., 2007). Table 2.15 presents the six main characteristics
identified in this area.
Table 2.15: People/ culture assessment
Source: Author
Towill (1997b) identified decision points as a key attribute in supply chain
management. He defines decision points as points where information is brought
together and acted upon. Potter et al. (2004) developed and successfully tested a
four stage integration model including decision points. The traditional supply
chain consists of multiple decision points. The functional supply chain has
reduced these down to a single point for each process. In a reactive supply chain, a
single decision point within the organisational boundary is present whereas the
seamless supply chain is defined as a coordinated control from a single point
(Potter et al., 2004).
Part of supply chain integration is the capability to process relevant information.
One type is investment in information systems (see Table 2.14) and the other is
establishment of lateral linkages. Lateral linkages could be direct contact between
managers at different levels and from different functions or companies,
establishing project teams (Lambert & Cooper, 2000). Those linkages provide a
mechanism for decentralised general management decisions, which provides
flexibility to a supply chain (Galbraith, 1994; Bagchi & Skjoett-Larsen, 2002).
Characteristics N/A Traditional SC Functional SC Reactive SC Seamless SC
Decision points
(Towill, 1997)
Lateral organisation
(Bagchi & Skjoett-
Larsen, 2002)
Organisational
structure (Harrington,
1995)
Organisational culture
(Harrington, 1995)
Multiple decision
points
Coordinated
control from single
point
Single decision point
within organisational
boundary
Single decision
point for each
process
NoneFunctional teams
only
Cross functional
teams / key
account manager
Teams across the
supply chain –
regular interaction
Separate almost
independent
departments
Discrete business
functions
Less hierarchical,
flat organisational
structure
Process orientated
organisational
structure
Defensive
chief/boss
watching our backs
Internal team focus,
Prepared for
functional trade offs
Willingness to
improve. Internal
trade-offs
Embrace change,
understanding of
external violence
Supply chain focus
(Stevens, 1989)Asset focussed /
quick fix
Inbound or
outbound flow /
cost focus
Process flow / cost
focusCustomer focus
Human resources
KPI (Wisner et al.,
2005)
None Functional driven Cross functional Supply chain aligned
Page 74
56
Bagchi and Skjoett-Larsen developed and successfully tested a three stage lateral
organisation model. Here a fourth column (traditional supply chain) has been
added reflecting no lateral organisations in place.
Some researchers opine that flatter organisations work better than hierarchical
ones (Cooper et al., 1997; Hammer, 2001; Harrington, 1995; Stevens, 1989). The
traditional, hierarchical model of management prevalent in most enterprises drives
control and efficiency by segregating business activities into standardised sub-
tasks, which is represented by the traditional supply chain (Hewitt, 1994). The
new principle suggests that the people who do the work should make the decisions
and that the process itself can have built-in controls. Pyramidal management
layers can therefore be compressed and the organisation flattened, which is
represented by the seamless supply chain (Hammer, 1990).
Organisational culture also plays a role in integration. Culture is defined as the
“set of values, guiding beliefs, understandings, and ways of thinking that is shared
by members of an organisation and is taught to new members as correct” (Daft,
1995, p.576); it is viewed to be critical when integrating the supply chain
(Christopher & Towill, 2001). A very defensive culture is present in the
traditional supply chain, where individuals purely react to the given orders. In the
functional supply chain, a team approach has developed, where individuals are
prepared for functional trade-offs. In the reactive supply chain, individuals have
developed a willingness to improve and an acceptance of change. Here, people are
prepared for internal trade-offs on a company level. In the seamless supply chain,
individuals embrace change and have developed an understanding for „external
violence‟ (Sirkin et al., 2005; Wisner et al., 2005).
The fifth category is supply chain focus. To achieve a high level of integration
there is a need for all parties in the supply chain to change from a product and cost
focus to a customer orientation (Gattorna & Walters, 1996; McAdam &
McCormack, 2001). Stevens (1989) describes supply chain focus as a critical
characteristic for supply chain integration. He uses a four stage supply chain
integration model. In Stage 1 the supply chain has a strong asset and quick fix
focus. Stage 2 is defined by an inbound or outbound flow and cost focus. Stage 3
Page 75
57
includes the cost for the entire process, whereas Stage 4 takes a strong customer
focused approach.
The final category is human resources key performance indicators (KPIs). Supply
chain integration can be achieved by establishing cross-functional human
resources key performance indicators (Bagchi & Skjott-Larse, 2002; Lee, 2000).
Cross-functional KPIs will help to overcome the silo mentality present in many
companies. Hence, it is important to align supply chain goals with the incentive
system of the focal company. Performance reviews of managers should include
their ability to integrate processes internally and externally and to meet overall
supply chain goals (Wisner et al., 2005). In the traditional supply chain, no human
resources performance indicators are present. The functional supply chain is
focusing on functionally driven KPIs, whereas the reactive supply chain is
represented by cross functional KPIs. Here, rewards are given to staff working
successful in cross-functional teams. The seamless supply chain aligns the human
resource KPIs with the overall supply chain goals (Wisner et al., 2005).
2.11.3.5 Performance Outcome
Supply chain integration is expected to improve material and information flow
and hence improve the overall performance of the supply chain. Table 2.16
enables the researcher to identify the impact certain integration characteristics
have on material and information flow.
Table 2.16: Outcome assessment
Source: Author
Characteristics N/A Traditional SC Functional SC Reactive SC Seamless SC
Physical flow
(Stevens, 1989)
Inventory (Stevens,
1989)
Lead times (t)
(Stevens, 1989)
Functional,
uncoordinatedIntegrated across
company boundariesFully coordinated
within company
Fragment of
coordination within
company
High levels; multiple
stock holding
between echelons
Each company
function buffered
No intermediate
inventory except
company boundaries
Long storage,
process and
distribution
Few reduction in
storage, process and
distribution time
Strong reduction in
storage, process and
distribution time
Minimised
throughout supply
chain
Minimal strategic
inventory
Information flow
(Bagchi & Skjoett-
Larsen, 2002)
Functional,
uncoordinated
Fragment of
coordination within
company
Fully coordinated
within companyIntegrated across
company boundaries
Page 76
58
Stevens (1989) identified four stages of supply chain integration. The traditional
supply chain represents the fragmented operations within the individual company,
defined by functional uncoordinated material flow, high levels and multiple stock-
holding between echelons and long storage, process and distribution time. The
functional supply chain is defined as having limited integration between
functions. Here, a fragment of coordination within the focal company is present;
inventory is buffered at each company function and a few reductions in storage,
process, and distribution time are present. The reactive supply chain requires
internal integration in the individual company, defined by fully coordinated
material flow within the focal company, no intermediate inventory except at
company boundaries and strong reduction in storage, process and distribution
time. Finally, the seamless supply chain extends upstream to suppliers and
downstream to customers. Material flows are integrated across company
boundaries, minimal strategic inventory exists in the supply chain and the lead
time is minimised (Stevens, 1989).
Bagchi and Skjoett-Larsen (2002) extended the performance outcome of supply
chain integration by also focusing on integrated information flow. Here,
information flows alongside the material. In Stage 1, information flows are
functional and uncoordinated. Stage 2 is defined as having a fragment of
coordination within the company. In Stage 3, a full coordination of information
flow within the company is present. In the final stage, information flows are
coordinated, even across company boundaries.
In order to verify the characteristics in Tables 2.12-2.16, the findings have been
compared with Gimenez‟ (2004) assessment of nine manufacturers and six
retailers. The results from this exercise can be seen in Appendix A.2; where the
comparison highlights that there does appear to be good consistency with
Gimenez‟s assessment.
Page 77
59
2.12 Conclusion
The research contained in this thesis is in the field of supply chain management
and, more specifically, concerns supply chain integration. The concept of supply
chain management was highlighted, and an historical review of its development
presented. Further, the scope of the supply chain management concept was
discussed. Some different methodologies used to evaluate current supply chain
practises were also presented. Here, the Quick Scan Audit Methodology has been
identified as being potentially most suitable to investigate supply chain integration
maturity.
The central focus of the literature review is the concept of supply chain
integration. The literature identified three „layers of confusion‟ regarding supply
chain integration. The first layer is the range of the integration concept; some
authors include internal integration, others solely focus on external integration.
The second layer is introduced by the industry focusing on different supply chain
integration practises. Finally, academia adds to the confusion around the concept
of supply chain integration by focusing on selected small areas of supply chain
integration. The three layers of confusion combined highlight that the concept of
supply chain integration is ill defined and not well understood. The literature lacks
a common, universal view of supply chain integration. The confusion around the
supply chain integration topic also reflects the different views of supply chain
management by different researchers (Mann et al., 2008). The author‟s view on
the supply chain integration concept has been described and another definition has
been added to the literature; one which the author judges to be very valuable for
the understanding of supply chain integration.
Barriers to, and enablers of, supply chain integration were highlighted because
academia has already identified that removal of barriers is critical for integration
of the supply chain. As a consequence brief mention was made of change
management within the supply chain. Finally, the conceptual model of the supply
chain integration evaluation tool was presented. This tool enables the researcher to
map out the current level of supply chain integration in practise and the impact of
change initiatives on supply chain integration. This tool also represents the
Page 78
60
author‟s understanding and scope of the concept of supply chain integration. A
main purpose of this chapter was to identify the present shortfalls and thus the
areas requiring further research. As a result, six research questions in the area of
supply chain integration have been formulated. These are considered in further
detail in the following chapter, “Research Problem Definition”.
Page 79
61
3. Research Problem Definition
3.1 Introduction
Research into supply chain integration is a fundamentally important area for
current research because integration is claimed by many authors to be a supply
chain Utopia synonymous with supply chain management excellence. The
effective management of supply chains requires integration of business processes
internally within an organisation and externally across suppliers and customers.
The majority of supply chain integration research addresses the relationship
between integration and performance (e.g. Frohlich & Westbrook, 2001). There is
far less research on how to achieve integration internally as well as with suppliers
and customers, and what research does exist tends to look at a specific factor such
as the use of information technology (e.g. Narasimhan & Kim, 2001) or a single
set of purchasing practises (e.g. Anasai et al., 1999). The present research is a
comprehensive study on how supply chain integration is actually achieved in
practise, including factors that enable and inhibit integration. This thesis aims to
close this research gap in understanding, by identifying what routes and means
companies take to integrate their supply chain.
However, a PhD is constrained by time and resources which means that a thesis
cannot consider all factors and variables. Instead, the most influential and most
relevant factors must be identified and the boundaries of the research problem
specified in order to provide a manageable focus. Thus, the purpose of this chapter
is to provide a clear definition of the research questions. The objective of this
thesis is stated, together with a proposed procedure for investigating the identified
research questions. Chapter 2.8.2 clearly expressed the author‟s view on supply
chain integration. The research questions raised in the literature review are
considered in the context of this procedure. Finally, the scope and boundaries of
the thesis are defined in order to illustrate which factors are to be considered in
depth and which factors are peripheral, yet may still influence any conclusions
drawn from the thesis.
Page 80
62
3.2 Procedure for investigating supply chain integration
Figure 3.1 illustrates a five step procedure for investigating pathways to supply
chain integration. The objective of the first two steps is to evaluate the current
status of a focal company‟s supply chain. This involves a thorough understanding
and documentation of current practises and the resultant evaluation of supply
chain integration maturity. Once the current status is identified, barriers to internal
and external integration need to be investigated. This step is necessary to fully
understand why the focal company chose a certain route as well as to understand
which barriers are addressed to integrate the supply chain; barriers are identified
as being crucial when integrating the supply chain. Once the current status and the
key barriers are established, longitudinal studies allow the researcher to
investigate how companies achieve supply chain integration in practise.
Figure 3.1: Five step procedure to investigate supply chain integration in practise
Source: Author
The five step procedure illustrated in Figure 3.1 forms the backbone of this thesis.
All of the research contained within this thesis is aimed at investigating each of
these five steps so as to investigate the pathways to supply chain integration.
Hence, the overarching research question is: What routes do companies follow
when integrating their value streams? The procedure proposed in Figure 3.1 also
provides the practitioner with guidance when aiming to integrate their own supply
chain, by providing unique supply chain assessment techniques for each of the
five steps.
Understand
and document
current supply
chain practises
Evaluate supply
chain integration
maturity.
Identify internal
barriers to
supply chain
integration
Evaluate
external barriers
to supply chain
integration
Current Status Barriers Pathways
Achieving
supply chain
integration in
practise
Page 81
63
3.3 Research Questions
All of the research questions raised have been previously identified in the
literature review chapter. Each one is specifically related to one of the five steps
illustrated in Figure 3.1; hence Figure 3.2 presents a summary of the research
questions in relations to the proposed five step procedure.
Figure 3.2: Order of research questions addressed in this thesis
Source: Author
The lack of a systematic procedure for evaluating current supply chain practises
and pathways to supply chain integration in the literature raises the first research
question. Once the most suitable methodology to investigate this has been
identified and further developed to suit longitudinal case studies, it can be applied
to case companies. Here the focus is on the identification of the current status of
supply chain maturity. Additionally, there is a need to investigate the barriers to
supply chain integration because the removal of barriers has been identified as
being of vital importance when aiming to integrate a focal supply chain. Supply
chain integration barriers can occur internally and externally. Hence, two distinct
research questions have been raised addressing each integration area. The research
question regarding the state of internal integration is a result of the findings on the
current stage of supply chain integration in New Zealand. However, Cox, (2001)
and van der Vaart and van Donk (2004) both identified that the key barrier to
Understand and
document current
supply chain
practises
Evaluate supply
chain integration
maturity.
Identify internal
barriers to supply
chain integration
Evaluate
external barriers
to supply chain
integration
Achieving
supply chain
integration in
practise
What is an
effective
methodology to
investigate
supply chain
integration
maturity,
barriers, and
enhancement in
practice?
How integrated
are New
Zealand supply
chains?
What barriers
obstruct internal
supply chain
integration in
practise?
How do
companies
achieve supply
chain integration
in practise?
How do power
and dependency
affect external
supply chain
integration?
Page 82
64
external integration is power and dependency. Hence, the effects of power and
dependency on external integration are examined. Once the current state of supply
chain integration is identified and the barriers are understood, research can
address the overarching research question: What routes do companies follow
when integrating their value streams? This research question was first raised by
Frohlich and Westbrook (2001) in their award winning paper, „Arcs of
integration: An international study of supply chain strategies‟. Until now, there
has been no clear answer on the routes companies choose. Hence, this research
makes an early attempt to investigate the identified research gap. The
methodological approach most suitable to answer that question involves
longitudinal case studies.
3.4 Scope and boundaries of the thesis
A PhD inevitably has boundaries; it is constrained by a number of factors,
including time, finances, and competencies. Therefore, there is a limit to the scope
of the research undertaken. Figure 3.3 illustrates all the major factors covered by
the thesis, together with some of the most influential factors that fall outside the
scope of the research and which could have an effect on any conclusions drawn.
There are also a number of factors that are considered but not totally covered by
the thesis. These are represented in Figure 3.3 as small overlaps with the central
theme of pathways to supply chain integration.
Page 83
65
Figure 3.3: Scope and boundaries of the thesis
Source: Based on Childerhouse, 2002
This thesis views supply chain integration as involving two dimensions: internal
and external integration. Internal integration is closely linked to operations
management, lean manufacturing, and change management in the form of
continuous improvement and business process reengineering. External integration
focuses on external relationships and the concepts of power and dependency.
Topics such as supply chain best practise, information systems, and barriers to
supply chain integration belong to both dimensions.
Supply chain diagnostics definitely come within the scope of the thesis. One
especially strong supply chain diagnostic method, the Quick Scan Audit
Methodology, is outlined in Chapter 4.8.1. This method is strongly anchored
within the systems thinking paradigm. Further, each findings chapter includes a
model capable of assessing aspects of supply chains. Chapter 5 applies the
uncertainty circle to assess supply chain maturity; Chapter 6 contains a „barrier to
supply chain integration‟ assessment model; Chapter 7 measures power and
Achieving
supply chain
integration in
practice
International trade
(regulations) Governmental
incentives
Public sector
services
National governments
Consumer
Services
Macro and Micro
Economics
Ethics of supply
chain management
Organisational
behaviourSupply chain
relationships
Customer
focus
Systems
Thinking
Change
Management
Business
Process
Reengineering
Continuous
improvement
Marketing
Customer
focus
Demand
amplification
Supply chain
diagnostics
Lean
Manufacturing
Operations
Management
Distribution
and Logistics
Quality
Information
Systems
Supply chain
integration
barriers
Power
Supply chain
integration tools
and techniques
Page 84
66
dependency in external relationships, and finally Chapter 8 maps the potential
pathways to supply chain integration.
Business process re-engineering (BPR) is not specifically covered by the thesis,
although a few BPR principles in relation to change management are used. The
same is true of continuous improvement. The quest for further integrating the
supply chain (Towill, 1997b) lies at the heart of the research. Although demand
amplification (also termed Bullwhip effect) is not covered in any great detail, it is
considered in relation to optimised material and information flows.
Only a limited amount of micro- and macroeconomics is considered. Chapter 6
includes environmental factors that can create a barrier to supply chain
integration, such as access to a qualified labour market, which belongs to the
macroeconomics discipline. The fully integrated, seamless supply chain results in
a strong customer focus. Therefore, a number of principles from the field of
marketing have been used in the research. Marketing is a wide field of research,
hence only particular areas have been fully considered in the research. Similarly
for the field of organisational behaviour. Chapter 6 addresses barriers to supply
chain integration and identifies culture and people barriers as key barriers to
internal integration, which is also strongly linked to psychology and
organisational behaviour studies.
While academia acknowledges the importance of integrated distribution and
logistic systems (Gattorna & Walters, 1996; Gimenez, 2006; Stank et al., 1999b),
this thesis does not have any particular focus on this topic. The same holds true
for quality. However, arguably one positive outcome of supply chain integration
is an increase in quality (Maloni & Benton, 2000).
Three further factors that fall outside the thesis require explanation. Firstly, the
ethics of supply chain management are not considered, even though they could
have a major effect on any research conclusion. Secondly, national governments
can have a major effect on supply chains. For instance, incentives may encourage
development within a specific region or industry, which could therefore result in
Page 85
67
distorted perception of the supply chain integration concept. Thirdly, international
trade regulations are not considered when investigating supply chain integration.
3.5 Conclusion
A five step procedure has been proposed to investigate pathways to supply chain
integration. By dividing the problem into five stages, manageable problems that
can be individually tested have been identified. The overarching research question
regarding routes to supply chain integration was presented. Further, this chapter
highlighted why the current status and barriers to supply chain integration need to
be assessed prior to the investigation into how supply chain integration is actually
achieved. The boundaries of the research have been clearly stated and those
factors outside its scope will not be considered further. Next, the research methods
chosen to investigate into the identified research questions are justified.
Page 86
68
4. Research Methodology
4.1 Introduction
Research methods are the data collection techniques which refer to the specific,
fact-finding procedures that yield information about the research phenomenon
(Mentzer & Kahn, 1995; Frankel et al., 2005). The quality of research needs to be
ensured by constructive critical reflection on knowledge production, its scope, and
the extent of its significance (Lalle, 2003). This proceeding is known as
epistemology, and is crucial to any research because a good theory is the only
valid basis for practitioners (Aram & Salipante Jr., 2003).
Chapter 4 embeds the research conducted into the wider ontological,
epistemological, and methodological setting and provides justification for the case
study approach applied in this thesis. Further, Chapter 4 explains the data
collection technique applied, specifically, the Quick Scan Audit Methodology
(QSAM). The QSAM provides a consistent rigorous assessment of current supply
chains practises that yields rich research data. The application of the QSAM to
New Zealand supply chains has enhanced the generalisability of the method.
Further, a rigorous adaptation of the QSAM has been developed to make it
suitable for longitudinal case studies. A methodological approach for the
investigation of power and dependency in external relationships is also presented.
Understand
and document
current supply
chain practises
Identify internal
barriers to
supply chain
integration
Evaluate
external barriers
to supply chain
integration
Achieving
supply chain
integration in
practise
Current Status Barriers Pathways
Evaluate supply
chain integration
maturity.
Research Question: What is an
effective methodology to investigate
supply chain integration maturity,
barriers, and enhancement in
practise?
Page 87
69
Chapter 4 begins by explaining different paradigms before matching the research
question with the methodological approach. Then, a literature review of case study
research is presented, followed by an in-depth explanation of the QSAM. Finally,
the chapter presents the limitations of case study research and how those
limitations have been addressed.
4.2 Paradigms
Different paradigms exist to generate knowledge. A paradigm is the researcher‟s
world-view or Weltanschauung and includes the following three elements:
epistemology, ontology, and methodology (Denzin & Lincoln, 1994).
Epistemology deals with how one perceives the world, and the relationship
between the researcher and the known. According to Burrell and Morgan (1985),
epistemology deals with how one might understand the world and communicate
this as knowledge to others. Ontology focuses on the basic questions about the
nature of reality – whether an objective really exists or not (Naslung, 2002).
Epistemological and ontological assumptions consequently influence
methodological decisions. Basically, methodology focuses on how one gains
knowledge about the world.
Figure 4.1 illustrates the difference between positivist and non-positivist
paradigms in a simplistic way.
Figure 4.1: The subjective-objective dimension
Source: Burrell & Morgan, 1985
Positivists believe that an “objective” world, or an objective reality, exists.
Consequently, reality can be studied using objective methods. Typically,
quantitative methods such as surveys and mathematical/statistical analysis are
Anti-positivism epistemology Positivism
Nominalism Realism
Ideographic Nomothetic
ontology
methodology
Page 88
70
used. Quantitative research seeks general laws and studies tend to emphasize the
measurement and the analysis of causal relationships between variables. The
growth of knowledge is a cumulative process (Naslund, 2002). New knowledge is
added to existing knowledge and false hypotheses are eliminated. Positivists apply
four quality criteria to research (van der Vorst & Beulens, 2002):
(1) Internal validity: The degree to which findings correctly map the
phenomenon in question;
(2) External validity: The degree to which findings can be generalised to other
settings similar to the one in which the study occurred;
(3) Reliability: The extent to which findings can be replicated, or reproduced,
by another inquirer; and
(4) Objectivity: The extent to which findings are free from bias.
Qualitative researchers, on the other hand, belong to many different paradigms
(Naslund, 2002). However, a common theme amongst qualitative researchers is
the rejection of positivism and its perception of objectivity. Thus, in general,
qualitative researchers are more interpretive and subjective in their approach. This
anti-positivist approach states that the world is essentially relativistic and thus one
must understand it from the inside rather than the outside. It can only be
understood from the point of view of the individuals who are directly involved in
the activities which are to be studied (Denzin & Lincoln, 1994). Knowledge is
created by representing the way the world actually is. Within this view of the
world, the goal is to construct a theory of the stable and universal relationship
between parts of the system under study. Table 4.1 summarises the main
differences between Positivism and Interpretivism focusing hereby on goal,
people, research finding, and self perception.
Page 89
71
Table 4.1: Comparison of Positivism and Interpretivism
Interpretivism Positivism
Aim to understand a phenomenon, but not
explain or predict. To analyse the
world and to understand the basis for
action within such perspectives without
holding the pretence that these views
are objective representations of reality
to explain and predict reality, where
reality is considered to be objective,
tangible, and fragmentable
People are considered to be proactive and
voluntaristic
are considered to be deterministic and
reactive
Research
findings
are considered time-specific,
contextual, and idiographic, and
causality is unattainable
are considered value-free, time-free,
and context independent, with the
general agreement that causal
relationships can be discovered
Self
perception
is interactive, cooperative, and lacking
a privileged point of observation
is separate from the research setting
and at a privileged point of observation
Source: Adapted from Aram & Salipante Jr., 2003; Mentzer & Kahn, 1995
4.2.1 Paradigms applied in supply chain management research
Traditional logistics and supply chain management researchers tend to belong to
the positivist paradigm (Eisenhardt, 1989). This approach is still very prevalent in
today‟s management research. Mentzer and Kahn (1995), for example, reviewed
the articles published in the Journal of Business Logistics between 1978 and 1993
and identified that 50% of all publications were survey based. Case study research
accounted only for 3.2%. In 2005, Kotzab followed up on Mentzer and Kahn‟s
study and found that 40% of all publications were still survey based. Seuring
(2005) instead focused on two distinct areas of supply chain management: (1)
sustainable supply chain management, and (2) supply chain performance
management. The study covered the period from 1990 to 2005. The topic of
supply chain performance management is also dominated by survey methods
(42%) where case study research only accounts for 11%. However, the field of
sustainable supply chain management is different. Case studies account for up to
40%, whereas the survey method accounts for only 25%. Finally, Carter and
Ellram (2003) studied 35 years of publication in The Journal of Supply Chain
Management. They identified that the dominant type of primary research design
employed is mail survey (approximately 60%); case study research only
accounted for approximately 18%. The dominance of surveys indicates that a
Page 90
72
positivist paradigm and, thus, mainly quantitative methods, are preferred by
supply chain management researchers.
However, supply chain management deals with a complex environment. Each
layer and component subsystem adds complexity that makes generalisations more
difficult to substantiate. This complexity creates barriers to developing well-
substantiated theories (Stuart et al., 2002). Supply chain management also lacks
well-developed measures and standards that would make inter-organisational
comparisons easier. Hence, many authors conclude (Frankel et al., 2005; Mentzer
& Kahn, 1995; New & Payne, 1995; Seuring, 2005; Westbrook, 1994) that supply
chain management problems are often unstructured, even messy, real-world
problems. The authors suggest that to gain relevance for supply chain researchers,
“a one paradigm, one approach” perspective should not automatically be the
obvious choice (Frankel et al., 2005; Mentzer & Kahn, 1995; New & Payne,
1995; Seuring, 2005; Westbrook, 1994).
In order to accurately describe, truly understand, and begin to explain these
complex phenomena, supply chain scholars are calling for more research using
case studies because case study research is flexible in terms of paradigms
(Christensen & Raynor, 2003; Mouritsen et al., 2003; McCarthy & Golicic, 2005;
Burrell & Morgan, 1985; Denzin & Lincoln, 1994). However, the process to
identify the methodology that best suits the research phenomenon and achieve
rigour is, amongst other things, highly dependent on the research questions
(Naslund, 2002; McCarthy & Golicic, 2005; van Donk & van der Vaart, 2005a).
4.3 Research Questions
The type of research strategy used depends on the following three conditions: the
type of research question posed, the extent of control an investigator has over
actual behavioural events and the degree of focus on contemporary as opposed to
historical events (Yin, 1994). Table 4.2 displays these three conditions and shows
how each is related to the five major research strategies in social science:
experiments, surveys, archival analysis, histories, and case studies (Yin, 1994).
Page 91
73
Table 4.2: Relevant situations for different research strategies
Strategy Form of research
question
Requires control
over behavioural
events?
Focuses on
contemporary
events?
Experiment how, why
yes yes
Survey who, what where,
how many, how much
no yes
Archival analysis who, what, where,
how many, how much
no yes/no
History how, why
no no
Case study how, why (key) no yes
Source: Yin, 1994
The overarching research question in this thesis is:
How do companies achieve supply chain integration in practise?
Further research questions are:
o What is an effective methodology to investigate supply chain
integration maturity, barriers, and enhancement in practise?
o How integrated are New Zealand supply chains?
o In what ways do companies pursue supply chain integration in
practise?
o What barriers obstruct internal supply chain integration in practise?
o What is an appropriate technique to measure power and
dependency across inter-organisational boundaries?
o How do power and dependency affect external supply chain
integration?
The overarching research question focuses on the change processes that occur in a
focal company to further integrate the supply chain. Naslund (2002) clearly points
out that if research attempts to study change in organisations, surveys is not the
most appropriate form. Also, the objective is to explore and understand how
companies achieve supply chain integration. Due to limited empirical evidence, it
is too early to develop testable hypothesis; thus, this research is exploratory in
nature. Further, the research questions identified are predominantly „how‟ and
„why‟ questions. Yin (1994) suggests case study methodology is well suited to
Page 92
74
meet the requirements of answering „why‟ and „how‟ questions such as the ones
raised in this thesis that examine contemporary phenomena in context, and where
control over behavioural events is not required. In this research, the boundaries
(factors which may influence supply chain integration) are still relatively unclear.
Supply chain management is a relatively new research area that lacks well-
developed measures and standards; yet exploratory research is under represented
within the supply chain management literature. These factors point to case study
research as being the primary candidate for the present research. Next, case study
research and the form of its application are presented in detail.
4.4 Case study research
Case study research has its roots in the broader field of social sciences, in
particular ethnographic studies and anthropology (Voss et al., 2002). Kurt Lewin
was the developer of field theory, which, among other things, emphasizes the
importance of understanding the total situation rather than abstracting a few
measurable variables from a situation (Westbrook, 1994). Although case studies
are typically considered to be qualitative studies, they are not necessarily only
qualitative and quantitative methods may be appropriate too. Thus, case studies
can be based on both qualitative and quantitative evidence (Yin, 1994; Naslund,
2002).
A case study is an objective, in-depth examination of a contemporary
phenomenon where the investigator has little control over events (Yin, 1994).
This definition covers several significant points. First, the study typically involves
one or more researchers gathering a considerable volume of data from within an
organisation, to develop the clearest possible picture of the phenomenon. The data
may come from primary sources (such as direct observations or interviews of
people involved) or secondary sources (documents or records, for example). It
may examine a single situation or, with multiple-case studies, several related
situations. Second, case study research generally focuses on current conditions,
using historical data primarily to understand or substantiate the information
gathered about the ongoing situation. Third, the researcher usually has little or no
Page 93
75
capability for manipulating events (in contrast to action research, where the
researcher is involved as a participant and director of events in a natural setting)
(McCutcheon & Meredith, 1993). Benbasat et al. (1987) summarise case studies
as having eleven characteristics:
1) Phenomenon is examined in a natural setting;
2) Data are collected by multiple means;
3) One or few entities (person, group or organisation) are examined;
4) The complexity of the unit is studied intensively;
5) Case studies are more suitable for exploration, classification and
hypothesis development stages of the knowledge building process; the
investigator should have a receptive attitude towards exploration;
6) No experimental controls or manipulation are involved;
7) The investigator may not specify the set of independent and dependent
variables in advance;
8) The results derived depend heavily on the integrative powers of the
investigator;
9) Changes in site selection and data collection methods could take place as
the investigator develops new hypotheses;
10) Case study research is useful in the study of „why‟ and „how‟ questions
because these deal with operational links to be traced over time, rather
than frequency or incidence; and
11) The focus is on contemporary events.
Page 94
76
Deriving from this summary, four key strengths of case study research can be
identified (Meredith, 1998; Voss et al., 2002).
The study of the phenomenon in its natural setting leads to relevant theory
generated from the understanding gained through observing actual
practises.
Answering why and how questions enables the researcher to develop a
relatively full understanding of the nature and complexity of the complete
phenomenon.
The case method lends itself to early, exploratory investigations where the
variables are still unknown and the phenomenon not at all understood.
The case method is flexible in terms of number of researchers and scope.
In total, four types of case study are identified in the literature: single, multiple,
retrospective and longitudinal. Table 4.3 presents the advantages and
disadvantages of each type.
Table 4.3: Choice of number and type of cases
Choice Advantages Disadvantages
Single case Greater depth Limits on generalisability of
conclusions drawn. Biases such as
misjudging the representativeness
of a single event and exaggerating
easily available data.
Multiple cases Augment external validity, help
guard against observer bias.
More resources needed, less depth
per case.
Retrospective /
historical cases
Allow collecting data on
historical events
May be difficult to determine cause
and effect, participants may not
recall important events.
Longitudinal cases Overcome the problems of
retrospective cases
Have long elapsed time and thus
may be difficult to do.
Source: Voss et al., 2002
The single case is particularly appropriate for completely new, exploratory
investigations, and the multiple case study is appropriate when there is some
knowledge about the phenomenon but much is still unknown (Meredith, 1998;
Seuring, 2005). But while single-case studies can richly describe the existence of
a phenomenon, multiple-case studies typically provide a stronger base for theory
building (Yin, 1994). The theory is better grounded, more accurate, and more
Page 95
77
generalisable when it is based on multiple case experiments. The third form of
case study research is retrospective cases. This form of case study research
focuses on the collection of data on historical events and is consequently not very
widespread in supply chain management research. A longitudinal case study can
be particularly valuable in supply chain management research. One of the most
difficult but most important issues academia tries to identify in research is the
relation between cause and effect. The longer the period over which phenomenon
are studied, the greater the opportunity to observe at first hand the sequential
relationships of events (Voss et al., 2002). The type of case study, again, is highly
dependent on the purpose of the research and hence dependent on the research
question(s). Table 4.4 presents multiple purposes of case study research and the
related research question.
Table 4.4: When to use case study research
Purpose Research question Type of case
Exploration
Uncover areas for research and
theory development
Is there something
interesting enough to
justify research?
In-depth case studies
Unfocused, longitudinal
field study
Theory building
Identify/describe key variables
Identify linkages between
variables
Identify why these relationships
exist
What are the key variables?
What are the patterns? Why
should these relationships
exist?
A few focused case studies
In-depth field studies
Multi-site case studies
Best-in-class case studies
Theory testing
Test the theories developed
Predict future outcomes
Are the theories able to
survive the test of empirical
data?
Experiment
Multiple case studies
Large scale samples
Theory extension/refinement
To better structure the theories in
light of observed results
How generalisable is the
theory? Where does the
theory apply?
Experiment
Case studies
Large scale sample
Source: Adapted from Handfield & Melnyk, 1998
Table 4.4 shows that case study research is not only good at investigating how and
why questions, but also it is particularly suitable for developing new theory and
ideas and can also be used for theory testing and refinement (Voss et al., 2002).
Table 4.5 puts the identified research questions for this thesis in perspective,
regarding purpose and research structure.
Page 96
78
Table 4.5: Purpose of the identified research questions
Research Question Purpose Research structure
How do companies achieve supply chain
integration in practise?
Exploratory Multiple longitudinal
field studies
What is an effective methodology to
investigate supply chain integration maturity,
barriers, and enhancement in practise?
Theory extension/
refinement
Multiple case studies
How integrated are New Zealand supply
chains?
Theory testing/
refinement
Multiple case studies
In what way do companies pursue supply
chain integration in practise?
Theory testing/
refinement
Multiple case studies
What barriers obstruct internal supply chain
integration in practise?
Theory building Multiple case studies
What is an appropriate technique to measure
power and dependency across inter-
organisational boundaries?
Theory building Multiple case studies
How do power and dependency affect external
supply chain integration?
Theory building Multiple case studies
Source: Author
Table 4.5 highlights that this thesis aims for multiple purposes. The overarching
research question is truly exploratory, whereas the remaining research questions
predominantly focus on theory testing, building, or refinement. The research
structure for each research is identical, using multiple case studies. Next, the
different phases of conducting multiple case studies are described.
4.5 Methodological process within case study research
Multiple case study research constitutes a continuous cycle of interaction between
theory and practise, ensuring that case study research is both rigorous and relevant
(Lalle, 2003). Figure 4.2 outlines the methodological process applied in this
thesis.
Page 97
79
Figure 4.2: Applied methodological process
Source: Lewis, 1998, p.459
Figure 4.2 shows four phases within the methodological process consisting of six
different steps. Next, each phase is explained in detail.
Phase 1: Groundwork
Phase 1 includes two major steps, (1) literature review and (2) case selection. A
literature review is a valid approach, as it is a necessary step in structuring a
research field and forms an integral part of any research. Seuring and Mueller
(2007) classified literature review as an archival research method. Further,
conceptual frameworks have been developed based on an in-depth literature
review. The conceptual models developed for this thesis are highlighted in
Chapter 2.11.3, Figure 6.1, Figure 7.1, Figure 8.1 and Figure 8.2. Phase 1 further
consists of case selection, which is crucial because the population defines the set
of entities from which the research sample is to be drawn.
Phase 1: Groundwork
- Define theoretical
domain
- Develop review
framework
- Define population
and identify
sampling frame
- Skim cases and
tabulate codes
- Sample cases
Review
LiteratureSelect
Cases
Phase 2: Induction
-Analyse data within
cases
-Analyse data across
cases
- Develop initial
conjectures
- Compare
conjectures to data
Analyse case
dataShape
Conjectures
Phase 3: Iteration
- Extend conjectures
- Do mental experiments
- Survey case authors
- Reach closure
Refine
Theory
Phase 4: Conclusion
- Evaluate theory
- Suggest future research directions
Conclude
Page 98
80
Phase 2: Induction
The second phase also consists of two major steps, (1) analysis of case data and
(2) shaping of conjectures. Case data can be analysed from two distinct angles,
first the analysis of the data within cases and the cross case analysis. Once the
data is analysed, propositions, hypothesis or conjectures are developed and
constantly compared with the analysed data.
Phase 3: Iteration
Phase 3 focuses on the refinement of theory. The quality of research needs to be
ensured by constructive critical reflection on knowledge production, its scope, and
the extent of its significance. Further, the new theory needs to anchored into the
literature. If closure cannot be reached further analysis needs to be undertaken.
Reaching closure is the predecessor for the conclusion phase, where the new
theory is evaluated.
Phase 4: Conclusion
Phase 4 is the conclusion phase. Future research directions are also identified in
this phase.
This thesis applies Lewis‟s (1989) framework for knowledge development.
Chapter 2 presented the in-depth literature review including two conceptual
models developed by the author. Next, the case selection is presented in order to
complete Phase 1 of the initial research.
4.6 Case selection
The case selection is crucial because it defines the limits for generalising the
findings (Eisenhardt, 1989). Stuart et al. (2002) point out that the case study
method is often chosen to identify a relationship or effect, not to describe an
average effect; hence cases are often not aimed at being representative, but rather
exemplary. The researcher does not need to assume that what is observed is truly
representative of all similar situations. Site selection should be guided more by
diversity and the site‟s potential to help contribute to the research objectives rather
than by any concern for randomness. Hence, when building theory from case
Page 99
81
studies, case selection using replication logic, rather than sampling logic, should
be used (Yin, 1994). Each case should be selected so that it either:
Predicts similar results (a literal replication); or
Produces contrary results but for predictable reasons (a theoretical replication)
(Voss et al., 2002).
Eisenhardt (1989) further argues that a number between four and ten cases usually
works well. With fewer than four cases, it is often difficult to generate theory with
much complexity, and its empirical grounding is likely to be unconvincing. With
more than ten cases, it quickly becomes difficult to cope with the complexity and
volume of data (Eisenhardt, 1989).
4.6.1 Background of selected cases
In total, eleven different companies from a variety of industries are included in
this thesis. The selected companies vary in size, industry setting, and production
process.
Food 1
Food 1 is part of the process industry and has been manufacturing food products
in New Zealand for more than 70 years. The New Zealand business employs
around 1,900 people, of which approximately 350 are temporary or casual. Food 1
operates three production centres in New Zealand. The company processes and
distributes a wide range of food and covers a total of approximately 1600 different
product lines. Food 1‟s supplier base is strongly locally focused and produces
food products for domestic and export markets. Food 1 is part of a globally
operating food processor. The scope of the Food 1 research included three value
streams produced at two North Island production facilities, evaluation of the
supplier base, and a longitudinal study.
Food 2
Food 2 is also part of the process industry. The company is one of New Zealand‟s
largest importers, manufacturers and marketers of nuts, dried fruits, snacks,
cereals and confectionery products. The company was founded in 1984. From
Page 100
82
small beginnings, the company now employs 180 full time and 100 part time staff.
Food 2‟s manufacturing capabilities include nut roasting and flavouring, dry
blending, oven roasting and packaging finished food products. Food 2 operates
with a strong international supplier base and a domestic customer base. The scope
of the Food 2 research comprised evaluation of the supplier base only.
Dairy 1.
Dairy 1 is an independent co-operative dairy company owned by its farmer
shareholders. It has a history of more than 60 years of dairy production. Currently,
Dairy 1 employs over 240 personnel at two different locations. Each year the
company processes more than 400 million litres of milk supplied by more than
380 farms. The milk is processed into milk powder, protein, milk fat products and
nutritional products. The majority of Dairy 1‟s manufactured goods are marketed
internationally to over 40 different countries with 10-20% sold domestically. The
scope of the Dairy 1 research included three major value streams, the evaluation
of the supplier base, and a longitudinal study.
Dairy 2
Dairy 2 is New Zealand‟s largest dairy producer and one of the top six dairy
companies in the world. Dairy farmers are also the main shareholders. The
company operates with production sites all over the country, employing
approximately 16,400 staff members. The major process steps are milk
pasteurisation, separation, drying, packaging and distribution. Dairy 2‟s global
supply chain stretches from New Zealand farms to customers and consumers in
more than 140 countries. The scope of the Dairy 2 research consisted of the
evaluation of the supplier base only.
Manufacturer 1
Manufacturer 1 is part of a wider group, that operates predominantly in New
Zealand. The company was established over 110 years ago to provide specialist
services to the dairy industry. It is privately owned and specialises in stainless
steel and high alloy fabrication. Over the decades it has extended the initial core
business to design, development, manufacture, installation and commissioning of
stainless steel vessels and processing plant. Manufacturer 1‟s customer base is
Page 101
83
predominantly within Australasia. The scope of the Manufacturer 1 research
included two value streams produced at plants on the east cost of New Zealand‟s
North Island.
Manufacturer 2
Manufacturer 2 is a medium-sized company in the central North Island and is a
wholly owned subsidiary of a European-based corporation. The New Zealand-
based sister company develops and produces a medium sized machine deployed in
construction sites. The major process steps are sheet metal cutting, welding,
machining, painting and final assembly. Approximately 90% of all products are
shipped to globally established corporate owned sales offices. The key suppliers
are predominantly local, medium-sized businesses. Currently, Manufacturer 2 is
transforming from a project-driven production environment into a lean
manufacturing batch production. The scope of the Manufacturer 2 research
included two value streams, the evaluation of the supplier base, and a longitudinal
study.
Steel
Steel is one of the largest and longest established engineering works in New
Zealand and is wholly owned by an American investor group. The company
employs approximately 130 personnel in heavy engineering. Steel operates an
iron, steel and non-ferrous foundry, backed by patternmaking and laboratory
facilities. The range of general engineering products manufactured by Steel covers
a wide spectrum and includes the design and manufacture of special purpose
machinery and components for a wide range of industries. Steel‟s end to end
supply chain was predominantly domestic focus. Nowadays, the company attracts
an increasing number of global customers. Many products are highly customised,
one-off productions that are treated as individual projects. The scope of the Steel
research included two value streams and evaluation of the supplier base.
Retail
Retail was introduced to New Zealand more than 30 years ago via 15 hardware
retailer stores nationwide. The group is originally from Australia. Currently the
group operates over 120 stores throughout New Zealand and follows the franchise
Page 102
84
concept where each store is owned individually. The major value adding steps
from a supply chain management perspective include retail display and inventory
control. The scope of the Retail research comprised of an interview with one
branch manager on the east coast of New Zealand‟s North Island.
Storage
Storage is a small medium-sized New Zealand-based company. The business is
employing approximately twenty staff members at their three storage facilities, all
positioned in the central North Island. Hence, Storage‟s end to end supply chain is
locally (New Zealand North Island) focused only. Storage is a service provider
that stores predominantly frozen and chilled food items. One of the key customers
(approximately 50% of the revenue) hires storage to act as a buffer between
market demand and supply. The scope of the Storage research comprised one
value stream belonging to Storage‟s key customer.
Forestry
Forestry is a large pulp and paper manufacturer. Forestry is a wholly owned
subsidiary of a New Zealand-based corporation. This corporation is one of New
Zealand‟s larger manufacturers. It produces a broad range of forestry products at
several manufacturing sites in New Zealand and Australia, with nearly 60 percent
of revenue earned in overseas markets. Currently, the corporation is undergoing a
major restructuring process. In 2004, Forestry implemented a supply chain
management function to better control its production processes. Forestry is
operating with a large supplier base, supplying Forestry with wood, chemicals,
energy and a large group of maintenance parts. Pulp and paper are both stored at
the plant and at several warehouses in New Zealand and China. The outbound
logistics has been outsourced to a third party logistics provider. Paper is
predominantly made to order; pulp is made to stock. The scope of the Forestry
research included both value streams, the evaluation of the supplier base, and a
longitudinal study.
Page 103
85
Service
Service is part of the public sector providing healthcare. It is responsible for
planning, funding, providing and monitoring health and disability services for the
region. Hence, the customer base is domestic/regional only. With a budget of
more than $700 million, Service provides or buys the health and disability support
services that meet the needs of the community. The major value adding processes
from a supply chain management perspective include purchasing, internal transfer
of material, material replenishment and inventory control. The scope of the
Service research included four value streams at the major health facility in the
operating region.
In summary, a large amount of primary data was extracted from eleven different
case companies. The eleven case companies belong to four different industry
sectors. The case companies were selected based on arguments by Yin (1994) and
Voss et al (2002) that cases should be selected that either: (a) predict similar
results; or, (b) produce contrary results but for predictable reasons. Food 1 was
selected based on its reputation for advanced supply chain management practises.
Dairy 1 and Forestry were studied to gain a greater insight into New Zealand‟s
process industry. Manufacturer 1, Manufacturer 2, and Steel represent a part of
New Zealand‟s manufacturing sector. This allows for comparison of two different
industry sectors within New Zealand. Retail, Storage, and Service further broaden
the industry sector scope. The two remaining cases: Dairy 2 and Food 2, were
chosen based on their power position within the supply chain. Dairy 2 is the
largest dairy company in New Zealand and was expected to have a strong power
position, whereas Food 2 is a small medium-sized enterprise, predominantly
sourcing from overseas and therefore was expected to have a weak power position
within the supply chain. Table 4.6 provides a summary of the eleven selected
cases including their contribution to this thesis. Next, the role of the researcher in
case studies is determined.
Page 104
86
Table 4.6: Summary of the cases and the contribution to the thesis
Case (Industry) Size Products Value Adding Domestic/Export Chapter
Food 1
(process)
Large Wide range of imperishable foods Food processing, packing and
distribution
Domestic and Export 5, 6, 7, 8
Food 2
(process)
Medium Small range of perishable and
imperishable foods
Food processing, packing and
distribution
Domestic market only 7
Dairy 1
(process)
Large Milk powder, butter and proteins Pasteurisation, separation, drying,
packaging and distribution
Predominantly Export 5, 6, 7, 8
Dairy 2
(process)
Large Broad range of dairy products Pasteurisation, separation, drying,
packaging and distribution
Predominantly Export 7
Manufacturer 1
(manufacturing)
Medium Large, stainless steel tanks Machining and assembly Domestic and Export 5
Manufacturer 2
(manufacturing)
Medium Multi-tonne machine deployed in
construction sites
Sheet cutting, machining and
assembly
Predominantly Export 5, 6, 7, 8
Steel
(manufacturing)
Medium Design and manufacturer of
special purpose machinery and
components
Patternmaking, foundry, large
scale machining and welding
Domestic and Export 5, 6, 7
Retail
(retail)
Large Hardware items Retail display and inventory
management
Domestic only 5
Storage
(service)
Medium Cool storage Storage, chilling and retrieval Domestic only 5
Forestry
(process)
Large Pulp and paper Wood chipping, purification,
drying and packaging
Domestic and Export 5, 6, 7, 8
Service
(service)
Large Healthcare Purchasing, internal transfer,
replenishment and inventory
control
Domestic only 5, 6
Source: Author
Page 105
87
4.7 Role of the case study researcher
The role of the researcher within qualitative research projects includes being
research facilitator, research investigator, and research observer. Therefore, it is
crucial that case study researchers who work with an organisation are able to
analyse themselves within the process (Lalle, 2003). While doing case study
research, the researcher enters a real world situation and aims both to acquire and
to improve (Checkland & Holwell, 1998). Therefore, the organisation, as well as
being the subject matter of the observation, is also the arena of application and of
confrontation between theory and practise. The researcher‟s task is to bring theory
and practise closer together and hence reduce the researcher - practitioner gap by
being practitioner relevant as well as rigorous (Beer, 2001; Böhme et al., 2008a).
Knowledge becomes practitioner relevant when it is context specific. On the other
hand, rigour conveys the academic‟s commitment to build general theory, and
academic knowledge involves the quest for general or covering laws and
principles concerning the fundamental nature of things; the more context free, the
more general and the stronger the theory (Aram & Salipante Jr., 2003). The
researcher-practitioner gap thus consists of the apparent tension between rigour
and relevance, between the particular and the general (Aram & Salipante Jr.,
2003). The challenge of narrowing the gap consists of generating knowledge that
mitigates the apparent tension between these criteria (Aram & Salipante Jr.,
2003). In doing so, it is important that the researcher distinguishes case study
research from consultancy. A consultant shares a single common goal with the
organisation whereas the case study researcher will have this goal as part of a
larger primary goal, namely the discovery of new knowledge (Westbrook, 1994).
Next, the data collection and data analysis technique that aim to close the
researcher-practitioner gap are presented.
Page 106
88
4.8 Data collection and data analysis
As the case study method can be used to investigate problems within a number of
research paradigms, the researcher may take an interpretive approach in
understanding and explaining the data; or a more positivist approach, relying to
some extent on research objective (Aram & Salipante Jr., 2003). Combining more
than one approach can be especially fruitful in increasing the researcher‟s
deductive efforts (McCutcheon & Meredith, 1993). Hence, the thesis applies a
multi-method, rigorous data collection technique termed the Quick Scan Audit
Methodology (QSAM) that also produces practitioner relevant outputs.
The Quick Scan is a site-based audit methodology. During a Quick Scan audit,
material and information flows are process mapped and key managers are
interviewed, company archival information is evaluated, and attitudinal
questionnaires are completed. As a result, an in-depth understanding of a focal
supply chain is obtained and comprehensively documented. The Quick Scan was
applied at the beginning of the data collection process and it has proven to be a
rich and time-effective method of investigation, given the resources and adequate
shop floor and managerial access.
4.8.1 Quick Scan Audit Methodology (QSAM)
4.8.1.1 The development of the QSAM
To improve supply chain performance within the UK automotive industry a three
year project funded by the Engineering and Physical Sciences Research Council
(EPSRC), was established between Lucas Varity, Computer Science Corporation,
and the Logistics Systems Dynamics Group at Cardiff University (Lewis et al.
1998). Entitled „Supply Chain 2001‟, the aim of the project was to develop a route
map to enable a company to move from an existing functional, differentiated
supply chain to a process-orientated seamless supply chain (Lewis et al., 1998).
Since the late 1990s, the QSAM has continued to be refined by the original
members with assistance from other academics around the world. The
methodology was designed from the start to be both practitioner relevant and
supportive of academic need, by yielding rigorous supply chain data with which
Page 107
89
to develop new theory and refine the QSAM method itself. Although originally a
collaborative effort with the UK automotive industry, QSAM has since been
applied in organisations of varying sizes and different business sectors in
Germany, New Zealand, and Thailand, as outlined in Table 4.7.
Table 4.7: Number of QSAM applications in different countries
Country Number Sector
Germany 2 Automotive component and system supplier
New Zealand 7 FMCG, consumer foods
Engineering service provider
Dairy producer
Service provider, health sector
Pulp and paper mill
Steel foundry
Thailand 9 Small manufacturer
Cable manufacturer
Steel fabricator
Service provider, scanning
Concrete producer
UK 16 Automotive component and system supplier
OEM, non-automotive
Lighting product manufacturer
FMCG producer
Automotive heat treatment subcontractor
Steel fabricator
Service provider, utility and logistics
Source: Author
Currently, 34 Quick Scans have been undertaken in four different countries in
many different sectors and in three different organisation sizes: large
organisations, medium-sized, and family-owned businesses (Banomyong et al.,
2005; Böhme et al., 2007b; Potter & Bowles, 2006). Applying the QSAM to
different countries, sectors, and company sizes helped to develop the methodology
into a robust supply chain diagnostic tool. Further, the QSAM enables the
generation of comparable data needed to transfer best practises, maturity
benchmarking and longitudinal reengineering programmes across different
countries and industry sectors. Next, the scope of the QSAM is presented.
4.8.1.2 Scope of the QSAM
Figure 4.3 identifies the scope of a QSAM within the overall reengineering
process. It can be seen to be primarily focused on the first two (Understand and
Document) stages. Although any identified high impact, quick-hit opportunities
Page 108
90
tend to be tackled early in the Simplification stage, in order to demonstrate in-
house capability and an early return on the QSAM investment, the ultimate aim of
QSAM is to identify the types of soundly underpinned and customised supply
chain integration recommendations that tend to require persistent implementation
effort and longer-term company commitment. QSAM team members frequently
take on a steering group role for such endeavours.
Figure 4.3: The UDSO business process re-engineering procedure
Source: Watson, 1994
By closing the gap between researcher and subject, QSAM yields consistent
results and provides close, customised supply chain integration support to
practising supply chain professionals. In essence, it helps managers to identify the
root causes of the „major pain‟ that is being felt by the organisation, and provides
guidance on which elements of errant supply chain processes need to be
reengineered.
4.8.1.3 The QSAM process
The audit process is conducted by experienced supply chain academics in a
structured approach designed to fit around the limited time availability of busy
managers and employees. To this end, typically four researchers will spend three
days actually on site, assisted by an in-house business champion.
The six major process steps involved in conducting the QSAM, the associated key
objectives, and the reasoning for each are provided in Table 4.8. Once an
Within the
scope of a
Quick
Scan
Within the
scope of longer
term projects
including
redesigns
Select Business Process
Understand
Document
Simplify
Optimise
Re-engineer Business Process
U
D
S
O
Page 109
91
organisation has agreed to being audited, the first key step is the preliminary
presentation. The objective here is mainly to obtain buy-in from the key
managers and hence overcome any fear of the audit. During this presentation, the
QSAM process is explained and the advantages to the organisation highlighted.
To save time during the very busy data collection days, specific requirements are
requested at this point and the questionnaires (both attitudinal and quantitative)
are distributed to appropriate managers.
The second process step highlighted in Table 4.8 comprise a very intensive day
on-site, involving the overall evaluation of the value streams status via the
collection of three data sources. The use of questionnaires, process mapping of
material and information flows and multiple interviews of a cross-section of
managers facilitates methodological triangulation and hence increases internal
validity. During the next day, this data is analysed off-line in a brainstorming
session aimed at preliminary identification of good and bad practises. The output
of this stage is a list of hypothesised reasons for the bad practises and a resultant
list of further data requirements to validate the initial evaluation.
The second day on-site, and the fourth step illustrated in Table 4.8, is the
collection of specific data to investigate the hypotheses. Probing interviews are
conducted to investigate why poor practise is present. Often archival data from the
organisation‟s information systems is available to be collected to verify the bad
practises and establish causes. However, this data is often incomplete and new
data is generated via live observation of key processes. This frequently exploits
the use of activity sampling. During the following day, the team of researchers
analyse all the data via a systematic process centred around cause and effect
analysis (detailed in Chapter 6). The output of this penultimate step is a ranked list
of improvement opportunities to enhance the performance of the value streams.
Page 110
92
Table 4.8: The QSAM process
QS Process Location/
Duration
Key Objectives Reasoning
Preliminary
presentation
On-site
2 hours Identify value stream(s) The selection of value stream(s) allows focus & detailed investigation within the
limited QS duration.
Issue data request Pre-emptive requests for archival data & the issuing of questionnaires minimises
wasted time during intensive on-site data collection.
Obtain buy-in Successful buy-in is key for access to data & to avoid political game-playing via the
distortion and withholding of information.
Evaluate
supply chain
status
On-site
1day Collect questionnaires
Conduct interviews
Process map
Methodological triangulation significantly reduces the errors of each individual data
collection approach. Different researchers collect each of the data types hence
reducing bias via investigator triangulation.
Brainstorm
supply chain
barriers
Off-line
1 day Identify good & bad practises Initial impressions are first discussed between the team members.
Develop hypotheses
Identify further data requirements
The inter-relationships & possible causes of the bad practises are hypothesised and
the data required to validate each is identified.
Hypothesis
investigation
On-site
1 day Collect archival data Specific historical data such as time series or inventory levels are collected to test each
hypothesis.
Conduct probing interviews Further interviews are conducted that delve into why current practises are deficient.
Observe current practise The material flow process is observed and documented, especially when there is a
lack of archival data.
Analyse the
findings
Off-line
1day Identify major pain(s) The over-riding problem(s) is(are) first identified.
Cause and effect analysis The heart of the analysis is the development of a cause and effect diagram based
around the major pain that inter-relates all the bad practises and identifies root
causes.
Develop improvement opportunities Improvement opportunities for the root causes are identified and ranked by benefit,
time and cost to implement.
Feedback
presentation
On-site
3 hours Present findings to management
Initiate round table discussion
Agree upon an action plan
This is the most important stage for the target company, as the objective is a group
understanding of the key shortcomings of the supply chain and the agreement to an
action plan to rectify the most significant poor practises.
Source: Adapted from Naim et al., 2002
Page 111
93
The final step of the QSAM is the most important for the target organisation and
involves a half day presentation and discussion of findings with management.
The objective of this meeting is not just to feed back the audit team findings but
also for management to obtain a more holistic perspective of their supply chain.
This includes understanding the ramifications of their individual decisions on the
actors up and down the value stream. The ideal output of this step is an action
plan for change. The focal company is further provided with a brief summary
report of the Quick Scan. A selection of summary reports is provided in Appendix
D.
In summary, the key QSAM elements that result in a successful supply chain
audits are:
• A team of four researchers can ensure investigator triangulation
• The use of four data collection methods provides methodology triangulation
• The application of a refined, systematic and hence holistic methodology
• The considerable skills and knowledge of the QSAM team
• The buy-in obtained during the preliminary presentation based around the
win-win situation of the provision of improvement opportunities and
gathering of rigorous research data.
Next, the data collection methods are explained in detail.
4.8.1.4 Data collection techniques utilised during a Quick Scan
Supply chain management spans the organisational boundaries, making the
identification and collection of useful practise and performance data difficult. The
supply chain perspective implies that an organisation‟s success is due not only to
its own internal practises, but also those of its suppliers and downstream
customers. This means that the unit of analysis for considering practise is an inter-
organisational operation, where valid measures of success may be difficult to
identify exactly (New & Payne, 1995). The combination of data types can be
highly synergistic (Eisenhardt, 1989), while the data collection from various
sources helps to give validity, and any misunderstanding or wrong assumptions
Page 112
94
have multiple opportunities of exposure and correction (Westbrook, 1994). The
goal of the different data collection techniques is to understand as fully as possible
the phenomena being studied through triangulation, with the accumulation of
multiple entities as supporting sources of evidence, to assure that the facts being
collected are indeed correct (Meredith, 1998). Hence, the QSAM combines
qualitative with quantitative evidence.
The Quick Scan procedure uses four data collection techniques: attitudinal and
quantitative questionnaires, process maps, structured interviews, and archival
information. The questionnaires have a number of purposes. The preliminary
questionnaire is used to gain initial knowledge of the focal organisation being
analysed, including information such as key customers, suppliers, production
volumes, product variants, and company structure (Böhme et al., 2008a). The
second format of data collection is process mapping, which provides a detailed
understanding of the material and information flows for the business processes.
The third type of data collection during the Quick Scan is semi-structured
interviews. These are conducted with a cross-section of senior and middle
management from all functions and include coverage similar of all the
questionnaires as well as the process mapping. The final type of data collection
during the Quick Scan is archival data. Archival data is relevant as it is perceived
as being unbiased and being able to provide historical factual data from
respondents (Flynn et al., 1990).
The mix of quantitative and qualitative data enables the research team to obtain a
good understanding of the supply chain, while also enabling triangulation (Potter
& Bowles, 2006). Two means are identified to achieve triangulation. The first is
by multiple data collection methods that provide stronger substantiation of
constructs and hypotheses (Eisenhardt, 1989); the second is by employing
multiple investigators to visit the case study sites. This allows the case to be
viewed from the different perspectives of multiple observers. Multiple
investigators have two key advantages. First, they enhance the creative potential
of the study as team members often have complementary insights which add to
the richness of the data (Eisenhardt, 1989). Secondly, the use of more
investigators builds confidence in the findings and increases the likelihood of
Page 113
95
surprising findings. Overall, by providing several sources of verification,
triangulation improves the researcher‟s judgment accuracy (Flynn et al., 1990).
4.8.1.5 QSAM’s position within research paradigms
Here, the QSAM is anchored into the wider epistemological setting. In Figure 4.4,
Frankel et al. (2005) provide a very insightful review of method usage in the field
of logistics and supply chain management and categorise the eight most common
methods based on epistemology; the focus here is on researcher involvement and
on social reality.
Figure 4.4: Mapping out eight research methods
Source: Frankel et al., 2005
While surveys and questionnaires are rather objective and the researcher is
detached from the research setting, case studies are more subjective and require
the involvement of the researcher. There is a substantial „white space‟ in logistics
research in the top right hand corner of Figure 4.4, where very little research is
Content Analysis
OBJE
CTIV
E, EXTERN
AL S
OCIA
L R
EALIT
Y
SU
BJE
CTIV
E, C
OG
NIT
IVE S
OCIA
L R
EALIT
Y
INVOLVED RESEARCHER
DETACHED RESEARCHER
Interviews
Experiments
Case Studies
Observations
Survey/ Questionnaires
Literature Review
Focus Groups
Page 114
96
being carried out. The QSAM, being a form of case study research, attempts to fill
that gap with high researcher involvement and a tendency towards subjectivity.
Figure 4.5 compares the QSAM to alternative research methods regarding depth
of knowledge and sample size.
Figure 4.5: Scope and depth of understanding gained via QS analysis
Source: Towill et al., 2002
The depth of knowledge obtained from each Quick Scan reflects the large
investment in time by the researchers conducting the analysis, although the
understanding is not as great as the comprehensive knowledge obtained via case
study analysis, for example by Burbridge and Halsall (1994). However, a far
greater in-depth understanding is gained via a Quick Scan than either telephone or
postal surveys, see, for example, Schmenner and Swink (1998). The QSAM leads
to specific knowledge creation. These research outputs are presented next.
4.8.1.6 Research outputs generated by the QSAM
QSAM adopts the most common supply chain perspective: that of a focal
organisation and its integration into the wider supply chain. By capturing
0 1 7 300
Number of companies / sample size
Questionnaire
Surveys
Case Studies
Quick Scan Audit
Methodology
Depth of
Knowledge
Acquired
from Each
Company
Comprehensive
Overview
In-depth
Page 115
97
organisational data related to theory, tools use, and people a validated in-depth
understanding is obtained and documented. This holistic view of the supply chain
is both unbiased and based on non-historical information, and provides a valuable
and rich source of research data.
Table 4.9 provides a list of the most significant original contributions to-date
enabled via analysis of the empirical QSAM case data.
Table 4.9: Original contribution enabled through the QSAM application
Original contribution Publication(s) Key findings
Supply chain integration
evaluation
Towill et al.
(2000)
Despite much rhetoric, supply chain integration
is the exception not the norm in practise
Validation of Stevens‟
(1990) integration model
Towill et al.
(2000)
Stevens‟ (1990) model provides an effective
route to improve supply chain integration
Supply chain integration
beaten path
Towill et al.
(2000)
Most companies proceed through the three
phases when advancing their supply chain
integration
Construction supply
chain assessment
Barker et al.
(2000)
It is feasible to audit project based construction
supply chains via the QSAM
Benefits of reducing
supply chain
uncertainties
Geary et al.
(2002)
Reductions in demand, control, supply and
process uncertainties significantly affect the
company bottom line
Seamless supply chain
objective
Towill et al.
(2002)
The seamless supply chain (Towill, 1997b) can
be effectively used as a re-engineering guide
Factors that affect real
world supply chain
performance
Childerhouse &
Towill (2002)
There is a limited set of factors that statistically
affect supply chain integration
12 rule toolkit validation Childerhouse &
Towill (2003)
Empirical validation of the operation advantages
of Towill‟s (1999b) 12 rule tool kit
The criticality of
simplicity
Childerhouse &
Towill (2003)
Statistical analysis highlighting the correlation
between supply chain simplicity and integration
VMI and transport Potter et al.
(2005)
Empirical investigation into the impact of VMI
on transport and its tradeoffs with other supply
chain metrics
Steel supply chain
assessment
Potter & Bowles
(2006)
It is feasible to audit process-based steel supply
chains via the QSAM
Usefulness of bullwhip Potter et al.
(2008)
Customer pressure can lead to businesses
inducing bullwhip in order to maintain customer
service levels to all customers
Source: Author
Page 116
98
The understanding gained from the multiple Quick Scans has manifestly enabled
the development of new management theory and the validation and, more often
than not, further refinement of research ideas. Next the value of the Quick Scan to
practitioners is presented.
4.8.1.7 Value to practitioners
The QSAM provides practitioners with an unbiased and rigorously researched set
of recommendations for improving the state of their supply chain. Such
recommendations are underpinned by validated theory, plus a cause-effect
diagram that provides clear pointers to high leverage change initiatives, since the
diagram clearly identifies the root causes of a company‟s major pains. Only when
managers begin to appreciate the nature of the various root causes, and how
specific problems being experienced are interlinked, can they begin to identify
high-leverage actions for effective change (Böhme et al., 2008b). Managers
frequently report that the QSAM process was a very positive experience for them:
The process provided what we thought was a very accurate representation of
our supply chain and provided a number of very useful solutions to the
problem areas identified. (Ian Hill, Distribution Director, Nestle Ltd, UK)
The audit had tremendous value for us. The interaction between our staff and
the research team was outstanding and stimulated some healthy debate as you
would expect between „Academics‟ and „Supply Chain professionals.‟ The
formal review process followed by an executive summary and documented,
detailed findings from the review was the perfect route map for us to change
our behaviour and address major shortcomings. We are confident that from
what we have seen of our performance in a relatively short time we will
continue to deliver the desired improvements in our end-to-end supply chain.
(Supply Chain Manager, Food 1)
QSAM was a worthwhile investment giving us actionable results. What I
liked was being able to get some of the best supply chain minds in NZ
Page 117
99
working on our business while helping the university in their data collections.
Totally win/win. (Managing Director, Manufacturer 2)
The statements highlight some of the particular strengths of the QSAM. However,
a SWOT (strengths, weaknesses, opportunities, threats) analysis, presented next,
also focuses on the weaknesses and threats of the QSAM.
4.8.1.8 SWOT analysis of the QSAM
The SWOT analysis is embedded in the strategic management literature and aims
to strategically position a focal company against its competitors (Thompson &
Strickland, 2003). Here, the analysis is used as a reflection technique since
applying a SWOT analysis to the QSAM enables the researcher to develop a
perceptive understanding of QSAM capabilities, and the deficiencies,
methodological opportunities and threats for future applications. Table 4.10
presents the outcome of the SWOT analysis.
Table 4.10: QSAM SWOT analysis
Strengths Weaknesses
Holistic view of the supply chain
Provides a good depth of insight
Independence of the research team
Triangulation of data sources
Provides focus on key issues and root
causes
Flexible in terms of the tools used and
research focus
Quick and efficient process
Flexible in terms of researchers involved
(min 2, max 5)
Researcher support by business champion
Training required in data collection
techniques, and data analysis
Data analysis complicated by broadening
product variety funnel as a broad product
variety adds complexity.
Opportunities Threats
Develop diagnostic expertise within
industrial partner
Complementarities with wider business
process reengineering initiatives
Education tool to teach upcoming
academics real supply chain management
Opportunity to develop long-term research
partnerships within the industry
Establishment of longitudinal data sources
Development of an industry network and
best practise database
Getting buy in and managing expectations
of participating companies
Vague aims and objectives
Collecting too much data which increases
analysis time
Experienced researchers take on leadership
Are findings for a certain product really
reflecting all products of that particular
value stream?
Large production areas become time
consuming
Source: Adapted from Potter & Bowles, 2006
Page 118
100
The strengths of the QSAM have already been highlighted in this chapter. In
contrast the major weakness of the QSAM is the time required to train new
researchers on the method. Hand in hand with the major weakness comes one of
the major threats; often when training inexperienced researchers, the experienced
researchers take on a leadership role, which weakens investigator triangulation.
Further threats arise when the objective of the QSAM is not clearly stated.
However, the QSAM provides many opportunities. First, it can possibly be a
catalyst to develop long-term research partnerships, which ultimately lead to
further research funding. Second, the QSAM focal companies can develop into an
industry network, which brings people from different companies together to
discuss and exchange supply chain best practises (focus groups). Finally the
Quick Scan provides the opportunity to collect longitudinal research data. This
thesis makes a first rigorous attempt to adapt the QSAM to longitudinal case data.
The adaptation of the QSAM to longitudinal case data is presented next.
4.8.1.9 QSAM adaption to longitudinal case data
This thesis aims at identifying pathways to supply chain integration, hence
longitudinal data is required. The initial Quick Scan provides the researcher with
in-depth company and supply chain knowledge and raises awareness for a second
round of data collection. Familiarity with the site and the previously gained in-
depth plant knowledge enable the researcher to conduct follow up case study
within a shortened timeframe that depends on the changes implemented by the
focal company. A structured approach has been developed for the follow up case
study. Table 4.11 outlines the time requirements and the necessary actions
required for the collection of appropriately structured longitudinal qualitative and
quantitative data.
Page 119
101
Table 4.11: Longitudinal research process
QS Process Location/
Duration
Key objective Reasoning
Evaluate supply
chain status
On-site
3 hours
Collect questionnaire Fill out the quantitative
questionnaire for value stream
previously investigated during the
QSAM (see Appendix C)
Overview of
change process
On-site
3 hours
Collect questionnaires
Conduct interviews
Discussions around the Cause and
Effect diagram to identify which
areas (root causes) have been
addressed
What further barriers occurred after
the QSAM
Fill out integration evaluation tool
Evaluate
change process
On-site
1 day
Conduct interviews
Observe “new”
practise(s)
Collect archival data
Interview with new appointed staff
members
Interview with people responsible
for the implementation of change
projects
Interview shop floor supervisors
who experienced the change
process
Collection of quantitative data that
supports the success/failure of
improvement projects
Consent of
change process
On-site
3 hours
Present findings to
management Seek consents from staff members
involved in the follow up study.
Source: Author
The developed four stage follow up process combines four data collection
techniques. First, the quantitative data collected during the Quick Scan is re-
assessed using questionnaire (Appendix C). Second, interviews are conducted to
identify the changes which have occurred within the focal company/supply chain
and the experience gained from the change process. The cause and effect diagram
developed initially helps to identify which root causes have been addressed.
Thirdly, the developed integration evaluation tool is applied to identify which area
of supply chain integration has improved most. The fourth data collection
technique is collection of archival data, which is useful to identify how the change
process has affected supply chain performance. Applying four different data
collection techniques provides for data triangulation and hence rigour.
In summary, QSAM provides a sound investigation method that is also strongly
underpinned by theory, and is well specified and communicated to practitioners.
Next, the data collection technique for the evaluation of power and dependency in
external relationships is described in detail.
Page 120
102
4.8.2 External relationship evaluation method
The second major investigation area is the external power and dependency
structure that helps to identify the prospects for companies to externally integrate
with supply chain stakeholders. Table 4.12 presents a five step method to
evaluate the power and dependency structure of the supplier base.
Table 4.12: Methodological outline of the research
Research Objective Step Data Collection Method
Identification of supply
chain integration
practise
1) QSAM The QSAM is only an optional step
and helps to understand supply chain
integration practises in the country
setting
Identification of current
relationship
management practises
2) As-is relationship
management
Semi-structured interviews to identify
the current relationship practises
supported by performance data
Identification of key
variables for external
dependencies
3) Identification of key
dependency variables
Structured interviews to identify the
most relevant dependency variables
related to the particular case study
Identification of the
idealised relationship
management practise
4) Evaluation of
supplier / customer base
(idealised relationship
management)
Sample of 17-28 external
relationships from the supplier base
picked by experts from the focal
organisation. Identification of
dependency scores for each
relationship
Identification of ways
to overcome external
dominance.
5) Identification of
improvement
opportunities
Feedback presentation and expert
discussion with people involved in the
study.
Source: Author
Olsen and Ellram (1997) suggested a three step evaluation model: analysis of the
company‟s purchase transactions; analysis of supplier relationships; and the
development of an action plan. The present study includes two additional steps
which are considered important. The first is a scoping step that aims to gain
insights into supply chain management within the wider national context.
However, it is important to mention that the scoping is only an option and not a
necessary step. The second addition is the identification of key dependency
variables for consideration, since each one has different significance to different
companies in different industrial settings. The developed semi-structured
interview guide can be found in Appendix G.1. Next, the final data collection
technique, structured interview, is presented.
Page 121
103
4.8.3 Structured interview
In two cases an in-depth interview was conducted and in both cases, the
interviewee was the supply chain manager. Interviews commenced with a brief
tour around the plant and some open ended questions to clarify the business model
and to gain an overview of the supply chain and its operations. Following these
open-ended questions the structured interview guide that is also applied during the
Quick Scan (Appendix C) was utilised. Statistical analysis has previously
validated the alignment of the Quick Scan and structured interview data collection
methods (Childerhouse et al., 2004). Next, the timeframe of the research is
presented.
4.8.4 Timeframe
Table 4.13 shows the research timetable. Data was collected between September
2003 and May 2008. Seven Quick Scans, seven supplier evaluations, four follow
up studies, and two in-depth interviews were conducted during this time. In total,
239 person days were spent in eleven New Zealand companies. Next, the theory
building process is explained.
Page 122
104
Table 4.13: Research timetable
Case Data collection technique Person Days Date
Food 1 QSAM
Supplier evaluation
Follow up
24
4
3
June, 2006
March, 2007
May, 2008
Food 2 Supplier evaluation
4 January, 2007
Dairy 1 QSAM
Supplier evaluation
Follow up
30
4
4
January, 2004
December, 2006
December, 2006
Dairy 2 Supplier evaluation
2 April, 2007
Manufacturer 1 QSAM 24 September, 2003
Manufacturer 2
QSAM
Supplier evaluation
Follow up
36
5
5
December, 2006
December, 2006
April, 2008
Steel
QSAM
Supplier evaluation
30
2
February, 2008
February, 2008
Retail
Interview 1 August, 2006
Storage
Interview 1 June, 2005
Forestry QSAM
Supplier evaluation
Follow up
30
3
2
February, 2006
April, 2007
April, 2008
Service QSAM 24 January, 2007.
Source: Author
4.9 Theory building from case study research
A feature of research to build theory from case studies is the frequent overlap of
data analysis with data collection (Eisenhardt, 1989; Lewis, 1989). During the
theory-development process, logic replaces data as the basis for evaluation
(Meredith, 1989). The central idea during the theory building process is to
constantly compare theory and data – iterating toward a theory which closely fits
the data. To build good theory this closeness is important because it takes
advantage of the new insights possible from the data and yields a valid theory
(Eisenhardt, 1989).
The theory building process also includes the comparison of the emergent
concepts, theory, or hypotheses with the extant literature. This involves asking,
Page 123
105
what is this similar to? What does it contradict and why? (Lewis, 1989)
Schmenner and Swink (1998) argue that the transition from data to theory requires
creative imagination because theories are not derived from observed facts, but
invented in order to account for them. Although sometimes seen as subjective,
well-done theory building from cases is surprisingly objective, because its close
adherence to the data keeps researchers “honest” (Eisenhardt & Graebner, 2007).
Next, the limitations of case study research are presented.
4.10 Limitations of case study research
Qualitative research in general is commonly perceived as exhibiting a tendency
for construct error, poor internal and external validation, and questionable
generalisability (Meredith, 1998). Hence, the same quality criteria apply to case
study research as to quantitative studies. The four areas of limitation are further
discussed.
Another concern in case study research is the internal validity of the proposed
relationships, that is, whether the right cause-and-effect relationships have been
established (Yin, 1994). In contrast to mathematical modelling or simulations,
where the number of variables is limited and their interactions are usually clearly
specified, the field-based researcher may easily attribute outcomes to the wrong
causes, based on spurious relationships (McCutcheon & Meredith, 1993).
Generalisability to new populations (such as other industries, other suppliers in
the supply chain, etc.), also known as external validity, is problematic. The
rationalists often maintain that their results are highly generalisable because they
apply in any situation and timeframe where the assumptions hold, whereas the
findings from case study research (interpretivist) have little generalisability
because the results are only valid for that case situation. In general, external
validity cannot be established without replication of research results in different
contextual settings (Mentzer & Kahn, 1995). One way to overcome this difficulty
is the application of multiple settings to help to extend the generalisability of the
results (Meredith, 1998). Further enlargement of the scope of the investigation,
particularly via literature research, drawing connections with existing theories,
Page 124
106
making contact with other research centres, conferences, and researching other
work methods and other epistemological positions; helps with this difficulty. The
actor-researcher confronts his or her own hypothesis by comparing it with those of
other researchers, revealing the convergences and analysing the divergences
(Lalle, 2003). In this way, the results of research become a transferable generic
scientific product, ensuring the cumulative dimension of academic research (Lalle,
2003).
As with any attempt to evaluate real-world conditions, the reliability of the case
information (the extent to which data would be duplicated if collected at another
time or through another means) is a concern. While experiments or field studies
that use multi-item scales can check scale reliability through statistical means, in
most situations a case researcher must find other ways to ensure measure
reliability (Yin, 1994). Using a variety of data gathering methods and the
involvement of more than one researcher are two possible solutions. Also, an
advantage of case study is that steps can be taken midstream to verify suspicions
and improve data-gathering procedures (McCutcheon & Meredith, 1993).
Another limitation is a lack of neutrality because the case study research is fully
implicated in the organisation and the way it operates. Thus, the understanding
that is achieved is only meaningful within the perspectives specified by the
researcher. Hence the understanding is not without bias (Meredith, 1998). To
optimise neutrality, multiple methods, tools, and entities for triangulation, and
temporal dynamics are necessary (Meredith, 1998). Table 4.14 summarises the
four key limitations and explains how those limitations are addressed during a
Quick Scan.
Page 125
107
Table 4.14: Assessment of the QSAM against research quality criteria
Dimension of
research quality
Definition How achieved within
case study?
How achieved
within the QSAM?
Internal validity –
how accurately are
cause/effect
relationships
identified?
Establishing causal
relationships between
research variables
(certain conditions are
shown to lead to other
conditions)
Use of team of
researchers to obtain
different viewpoints
(Eisenhardt, 1989)
Use of a team of
researchers for data
collection (Böhme
et al., 2008a)
External validity –
can the findings be
translated to other
settings?
Establishing the
domain to which a
study‟s findings can
be generalised.
Comparison to a
theoretical framework
or against a database
of results (Ellram,
1996)
Comparison against
database of
previous QSAM
applications (such
as in Böhme et al.,
2008b; Towill et
al., 2002)
Reliability – can the
findings be
reproduced by others?
Demonstrating that
the operations of a
study can be repeated
with the same results
Documentation of the
protocol (Yin, 1994)
or maintenance of a
database of findings
(Ellram, 1996)
Process well
documented in
literature (Böhme et
al. 2008a and
2008b; Lewis et al.,
1998; Naim et al.,
2002) and existence
of database (Towill
et al., 2002)
Objectivity – are the
results free from bias?
Establishing correct
operational measures
for the concepts being
studied.
Triangulation of
qualitative and
quantitative data
sources (Jick, 1979).
Triangulation via
process mapping,
data analysis,
interviews and
questionnaires
(Böhme et al.,
2008a).
Adapted from: Potter & Bowles, 2006; van der Vorst & Beulens, 2002
4.11 Discussion
Supply chain management suffers from a weak theory base (Cigolini et al., 2004;
Cooper et al., 1997; Croom et al., 2000; New & Payne, 1995). Most studies based
on survey data suffer from lack of internal validity due to indifferent respondent
question clarity and possible bias (Naslund, 2002). Also the complexity and
variety of real-world supply chains make external validity difficult as it is often
very hard to compare apples with oranges (Stuart et al., 2002). Hence, many
academics suggest an increase of exploratory studies that apply multiple data
collection methods (Frankel et al., 2005; Mentzer & Kahn, 1995; New & Payne,
1995; Seuring, 2005; Westbrook, 1994). Case study is one of the research
strategies capable of combining multiple paradigms. The Quick Scan Audit
Page 126
108
Methodology (data collection methods) match the requirements of case studies as
well as applying multiple data collection tools. QSAM is further capable of
closing the researcher-practitioner relevance gap, which makes it a highly
valuable data collection technique when investigating messy real world supply
chains. The strength of the QSAM is certainly the researcher team and data
triangulation.
The multiple data collection methods provide very strong substantiation of
constructs and hypotheses (Eisenhardt, 1989). The team of four researchers also
enables the case to be viewed from different perspectives. This is especially so
due to individuals using specific methods which increases the chances of each
investigator viewing case evidence in divergent ways (Eisenhardt, 1989). The
QSAM excels at this as it is constituted of multiple methods, ranging from
observing and measuring processes to conducting semi-structured interviews and
the completion of quantitative and attitudinal questionnaires.
This methodology chapter has highlighted that the QSAM has been applied within
New Zealand to a range of different industries as well as different company sizes.
By applying the QSAM to three small medium-sized enterprises (SMEs) the
research team identified that the focal organisation had only a maximum of two
major value streams. Therefore, those value streams represent the focal SME‟s
entire internal supply chain resulting in a more complete picture of the focal
organisation. Further, the relatively small size of New Zealand companies has
allowed the researcher to spend more time looking into supply chain-related areas
such as staff development, strategic direction of the enterprise, staff turnover, and
leadership. In short, applying the QSAM to SMEs expands the initial focus on
value streams to an enterprise scan with a strong process focus.
Of course, the QSAM is still capable of improvement. As such, a great deal of
further validating research is required. The method itself is constantly being
updated, strengthened, streamlined, and may, therefore, be regarded as still
evolving. One of the improvements of the QSAM presented in Chapter 4 is the
adaptation of the QSAM to longitudinal case data. However, the longitudinal data
collection process could be improved further by introducing a second researcher.
Page 127
109
This would increase validity and also extend triangulation practise, from data
triangulation to researcher triangulation. Even more ideal would certainly be a
second Quick Scan.
4.12 Conclusion
This chapter has presented different paradigms for conducting research. Academia
has clearly identified that supply chain management lacks common theory and
that “a one paradigm, one approach” should not be the obvious choice. Hence,
case study research is applied to the research question identified. The data
collection technique termed Quick Scan Audit Methodology uses multiple
paradigms and three means of data triangulation: (a) investigator triangulation, (b)
data triangulation, and (c) methodology triangulation. The Quick Scan approach is
the initial step in a generic, robust methodology for identifying change
management opportunities in the supply chain (Naim et al., 2002). The
contribution to theory of this chapter is manifold. First, a rigorous method has
been developed to adapt the initial Quick Scan to suit longitudinal case studies.
Second, a method has been developed to measure power and dependency in
external relationships. Third, applying the QSAM to New Zealand supports the
increase of rigour for the methodology developed. Fourth, Quick Scan has been
applied to new industry settings, especially the New Zealand process industry,
which further validates the method. In the next chapter, the QSAM application in
New Zealand is presented.
Page 128
110
5. Supply Chain Integration in New Zealand
5.1 Introduction
In this chapter the nature of uncertainty is described, and is used to explain why
exemplary value stream integration remains an elusive goal for most New Zealand
organisations. Uncertainty levels of value streams are evaluated for a wide range
of organisations, using the „uncertainty circle‟ concept, thereby enabling
benchmarking comparisons of value streams performance to be made. Twenty
value streams of nine different companies were investigated, using predominantly,
the Quick Scan Audit Methodology (QSAM). The uncertainty data is validated
via application of the supply chain integration evaluation tool developed in
Chapter 2.11.3. The NZ uncertainty data is further compared to the Towill et al.
(2002) investigation results of twenty value streams in the UK automotive sector.
Finally, the collected data is considered in light of Stevens (1989) integration
model and also Frohlich and Westbrook‟s (2001) integration model to identify
whether companies follow particular distinct paths to supply chain integration. By
presenting current value stream integration practises in New Zealand, this chapter
becomes the basis for the following three chapters which discuss the findings.
Once the current state is determined, internal and external barriers to integration
are identified and, by using longitudinal studies, the pathways to value stream
integration can be ascertained. Towill et al. (2002) and Böhme et al. (2008b) have
provided the foundation of this findings chapter, and the relevant literature is
reviewed in the following section.
Main Research Question: How
integrated are New Zealand supply
chains?
Understand
and document
current supply
chain practises
Evaluate supply
chain integration
maturity.
Identify internal
barriers to
supply chain
integration
Evaluate
external barriers
to supply chain
integration
Current Status Barriers Pathways
Achieving
supply chain
integration in
practise
Page 129
111
5.2 Supply chain integration
The integration of supply chains has been the subject of significant debate and
discussion within the academia (e.g. Bagchi & Skjott-Larsen, 2002; Frohlich &
Westbrook, 2001; Ota, 2001; Power, 2005; Stevens, 1989; Towill et al., 2002).
Supply chain integration originates from a systems perspective (Christopher,
1998), where optimisation of the whole achieves better performance than a string
of optimised sub-systems. The argument is that via integration, trade-offs and
wider ranging decisions can be made based on shared information and co-
ordination (Frohlich & Westbrook, 2001; Lambert et al., 1998; Pagell, 2004;
Romano, 2003; Sabath, 1995; Spekman et al., 1998; Wong & Boon-itt, 2008).
Hence, research into supply chain integration is a fundamentally important area
for current research. However, despite more than 20 years of academic
publications there remains a significant gap between supply chain theory and
practise; many scholars report that few companies are actually engaged in
extensive supply chain integration practises (Akkermans et al., 1999; Böhme et
al., 2008b; Kilpatrick & Factor, 2000; Towill et al., 2002). Here, the concept of
supply chain integration is studied by focusing on supply chain uncertainty.
The development of comparative measures of supply chain integration maturity is
complicated by the variety of supply chains encountered in practise; the
operational contexts within which they operate; and the complex multi-function,
multi-organisation measures required. However, a growing number of researchers
have begun to use uncertainty as a comparative means for assessing and framing
supply chain concepts (van der Vorst & Beulens, 2002; Vidal & Goetschalck,
2000; van Donk & van der Vaart, 2005a; Wong & Boon-itt, 2008; Lee, 2002; van
der Vorst et al., 2001 and Sun et al., 2009). Numerous authors have identified the
need to manage, minimise, and remove uncertainties from their business so as to
increase control and co-ordination and improve the effectiveness of their decision
making processes (Chopra & Meindl, 2007). This also holds true in a supply chain
context as Christopher (2005) explains, “One of the main reasons why any
company carries safety stock is because of uncertainty” (p. 51). This point is
further emphasised by Bowersox et al., (2002) when they state, “… a basic
objective of overall logistical performance is to minimise variance” (p.164).
Page 130
112
Further, Sabri and Beamon (2000) state, “uncertainty is one of the most
challenging but important problems in supply chain management” (p. 582).
Finally, according to Lee (2002) “it is necessary to understand the sources of the
underlying uncertainties and explore ways to reduce these uncertainties” (p. 107).
The Logistics Systems Dynamics Group at Cardiff University, in collaboration
with staff of the Management Systems Department at Waikato University in New
Zealand have explored the issue of supply chain uncertainty in some detail. A
relationship between best-in-class practise, where the supply chain is highly
integrated, and levels of supply chain uncertainty has been established using the
Quick Scan Audit Methodology (QSAM). During a QSAM, supply chain
uncertainty is quantified using the supply chain uncertainty circle (see Figure 5.1).
The uncertainty circle and the quantifying process are now further explained.
5.2.1 The supply chain uncertainty circle
Davis (1993), and later Mason-Jones and Towill (1998), segmented supply chain
uncertainties into four areas termed the „uncertainty circle‟, so that root causes and
methods for minimisation can be developed (Childerhouse et al., 2007). The
supply chain uncertainty circle has been applied and validated successfully
(Towill et al., 2002; Childerhouse et al., 2007; Böhme et al., 2007a). Figure 5.1
illustrates the systems engineering view of supply chains.
Figure 5.1: The supply chain uncertainty circle
Source: Davis, 1993; Mason-Jones and Towill, 1998
Control
Side
Supply
Side
Manufacturing
ProcessDemand
Side
Product Delivery Process
Material Flow
Information Flow
Page 131
113
In applying the uncertainty circle to a focal company each uncertainty area is
investigated in detail. Control and manufacturing process uncertainties can be
addressed predominantly internally; whereas demand and supply uncertainty areas
require the involvement of the external entities. The four areas of uncertainty are
summarised and evaluated in Table 5.1.
Table 5.1: Description of the four uncertainty areas
Area of
Uncertainty
Explanation
Process
Process uncertainty affects an organisation‟s internal ability to meet a production
delivery target. The amount of process uncertainty can be established by
understanding each work process‟s yield ratios and lead time estimates for
operations. Also, if the particular production delivery process is competing against
other value streams for resources, the interaction must be studied and codified
Control
Control uncertainty is associated with information flow and the way an organisation
transforms customer orders into production targets and supplier raw material
requests. The level of control uncertainty can be determined by comparing
customer requirements, supplier requests to deliver, and production targets over the
same time periods. In a pure demand-pull environment the linkage between supply
and demand is clear and control uncertainty is eliminated. However, companies
typically use order batching and lot sizing
Supply
Supply uncertainty results from poorly performing suppliers not meeting an
organisation‟s requirements and thereby handicapping value-added processes. It
can be evaluated by looking at supplier delivery performance, time series of orders
placed or call-offs, and deliveries from customers, actual lead times, supplier
quality reports, and raw material stock time series
Demand
Demand uncertainty can be thought of as the difference between actual end-market-
place demand and the orders placed with an organisation by its customers. Demand
uncertainty can also be quantified by measuring how well companies meet
customer demand. Poor on-time delivery, fill rates or high finished goods inventory
are often a result of demand uncertainty.
Source: Naim et al., 2002
One common way to deal with uncertainty is by holding buffer inventory
internally and at the company boundaries (Christopher, 1998), which results in a
decline in operational performance. Process uncertainty results in high work-in-
progress stock levels and insufficient manufacturing lead times. Supply and
demand uncertainty both cause high inventory at a focal company‟s boundaries.
Control uncertainty negatively impacts all three previously described stock levels
as well as the customer satisfaction level. Next, a detailed investigation into
supply chain uncertainty/integration in New Zealand is presented.
Page 132
114
5.3 Supply chain integration in New Zealand
The research focuses on two distinct ways to investigate supply chain integration
maturity in New Zealand. First, a detailed supply chain uncertainty analysis is
presented using the supply chain uncertainty circle developed by Davis (1993)
and Mason-Jones and Towill (1998). Second, the application of the integration
evaluation tool (see Chapter 2.11.3) highlights the current stage of supply chain
integration practises applied to New Zealand value streams.
5.3.1 Application of the supply chain uncertainty circle
The research question raised in this chapter was investigated via comparative
analysis of twenty value streams. The term „value stream‟ has been popularised by
Womack and Jones (2005), and is defined as “the special activities required to
design, order, and provide a specific product, from concept to launch, from order
to delivery, and from raw materials to final end consumer” (p.68). In many
respects „supply chain‟ and „value stream‟ are synonymous. A practical
interpretation is that a supply chain consists of a bundle of one, or more often
multiple, value streams. Data was collected from nine different companies
consisting of twenty different value streams. Of theses the Quick Scan Audit
Methodology was applied to seven companies consisting of seventeen value
streams. Further, three interviews with supply chain managers were conducted,
applying the quantitative questionnaire presented in Appendix C. A detailed list of
the primary data used for assessing uncertainty during Quick Scan investigations
is listed in Table 5.2.
Page 133
115
Table 5.2: Primary archival data sources collected during a QSAM
Uncertainty area Primary data collection during a Quick Scan
Process side
(internal uncertainty)
Scrap reports, cycle times and variability of cycle times, production
targets and output, downtime reports, stock consolidation, costed bill of
materials, capacity planning and asset register
Control side
(internal uncertainty)
Time series of customer orders, supplier orders, demand forecasts,
kanban logic, batching rules, MRP logic, call-offs, purchase orders, bill
of materials number of variants, delivery frequency and number of
value streams, human resource performance indicators
Supply side
(external uncertainty)
Measures of performance placed on suppliers; especially schedule
adherence, invoices, call-offs, bill of materials, forecasts, receipts,
supplier quality reports, lead times, stock report
Demand side
(external uncertainty)
Delivery frequency, echelons to end consumer, marketplace variability,
stage of product lifecycle, customer ordering procedures and forecast
accuracy.
Source: Naim et al., 2002
The codifying of the four uncertainty sources was undertaken by all members of
the Quick Scan team. Qualitative and quantitative data related to the four types of
uncertainty described above were used to assign the integration value by ranking
each of the four areas of uncertainty. A 4-point Likert scale was applied to each
uncertainty area, which anchors 1 = lowest uncertainty; 4 = highest uncertainty.
The seamless value chain clearly exhibits low uncertainty scores for process,
control, supply and demand. The choice of a 4-point Likert scale was aimed at
reducing any tendency towards the mean, and instead focuses on strengths and
weaknesses of individual value chains (Towill et al., 2002). Where necessary, the
Likert scores were verified by cross-reference to detailed Quick Scan reports;
available in Appendix E. Table 5.3 lists the uncertainty scores for the twenty
value streams.
Page 134
116
Table 5.3 Detailed uncertainty data for the 20 identified value streams
Company Person
days
Value
stream
Method Process Control Supply Demand
Manufacturer 1 24 1 Quick Scan 4 4 3 3
Manufacturer 1 2 Quick Scan 3 3 3 4
Dairy 1 30 3 Quick Scan 1 4 3 4
Dairy 1 4 Quick Scan 1 4 4 4
Forestry 30 5 Quick Scan 2 3 4 3
Forestry 6 Quick Scan 2 3 4 2
Food 1 24 7 Quick Scan 1 3 1 1.5
Food 1 8 Quick Scan 2 3 1.5 3
Food 1 9 Quick Scan 1 3 1 3
Manufacturer 2 36 10 Quick Scan 2.5 3.5 2 2.5
Manufacturer 2 11 Quick Scan 3.5 3.5 2 4
Service 24 12 Quick Scan 1 3 3 1
Service 13 Quick Scan 2 3 3 3
Service 14 Quick Scan 4 4 3 2
Service 15 Quick Scan 4 4 3 3
Steel 30 16 Quick Scan 4 4 3 3.5
Steel 17 Quick Scan 3 4 3 4
Dairy 1 1 18 Interview 1.5 4 3 4
Retail 1 19 Interview 1 2 3 3
Storage 1 20 Interview 1 2 1.5 4
Source: Author
In total, 201 person days were spent investigating twenty value streams in nine
different companies. Next, the detailed uncertainty analysis for all four
uncertainty areas is presented.
5.3.1.1 Detailed uncertainty analysis
The detailed uncertainty analysis compares two uncertainty areas. As mentioned
earlier, the control and manufacturing process uncertainties can be addressed
predominantly internally whereas the demand and supply uncertainty areas
require the involvement of the external entities. Hence, control and process
uncertainties are compared before supply and demand uncertainties.
5.3.1.1.1 Control and process uncertainty
The evaluation of control and process uncertainty is supported with industry
insights from New Zealand, and Figure 5.2 shows the distribution of control and
process uncertainty levels.
Page 135
117
Figure 5.2: Comparison of control and process uncertainty
Source: Author
The x-axis in Figure 5.2 presents the level of uncertainty, the y-axis the
percentage of value streams studied. Figure 5.2 shows that New Zealand value
streams face higher uncertainty from the control side than from the process side.
The mean value for control uncertainty is 3.35, which is significantly higher than
the mean for process uncertainty (2.23). The t-test results in a p-value of 0.00004,
which is significant at the p ≤ 0.01 level. Further, Figure 5.2 clearly shows that no
value stream was identified having minimised control uncertainty. However, 50%
of the sample faces the highest control uncertainty.
The reasons for the high control uncertainty are manifold. The most common are
inappropriate information systems and functional silos within the company. All
the value streams suffered from inappropriate supply chain management
information systems. Often the information systems are outdated and/or are
designed to support a company‟s finance and accounting function. These
information systems were not capable of capturing common supply chain
management performance indicators. Hence, most of the supply chain data was
analysed by individuals and shared using e-mail, which result in incomplete
information flows and often inconsistent results for the same performance
indicator. The lack of an integrated information system is of great concern in five
of the nine cases, where sales/marketing is physically separated from the
[% of
sample size]
[level of
uncertainty]
Page 136
118
production plant. Regular face-to-face meetings have not been set up. This poor
information flow results in poor sales and operational planning procedures
because relevant demand and supply information is not included in the production
planning process. Hence, mismatch of supply and demand is very common.
High process uncertainty was predominantly identified within the medium-sized
businesses, Steel, and Manufacturing 1 and 2. In all three cases, the factory layout
was neither logical nor clear, resulting in excessive manufacturing lead times,
high work-in-progress inventory, and high non-conformance in production. For
example, Figure 5.2 shows the supply chain map example of Steel.
Figure 5.2: Steel’s supply chain map
Source: Author
The grey shaded areas in Figure 5.2 are suppliers (left hand side and bottom) and
customers (right hand side). The white shaded rectangles are internal workshops,
and the triangles represent stocking points. The arrows highlight the convoluted
material flow. Material needs to be handled and coordinated between six different
internal workshops and two outsourced process steps. Three distinct material
stocking points supply those workshops with material. In the case of Steel, the
research identified that one of their core value streams currently operates with a
Local supply
International
supply
Raw
Material
Scrap
Consu-
mables
Moulding Foundry
Fit/Fab
shop
Dispatch
M/C
shop
Pattern
Domestic
customers
International
customers
Quality
InspectionBlasting
Page 137
119
two month average manufacturing lead time, of which for only 24% of the time is
valued added to the product.
The comparison of control and process uncertainty reveals a second interesting
insight. Thirty five percent of all value streams face low process uncertainty and
the remaining 65% are spread more or less evenly across the remaining levels of
uncertainty. Hence, the standard deviation of process uncertainty (1.1863) is
significantly higher than the standard deviation of control uncertainty (0.6509).
The f-test results in a p-value of 0.006, which is significant at p ≤ 0.01 level. The
reason for the significantly higher standard deviation of process uncertainty is
twofold. On the one hand, some value streams face low process uncertainty
because of the simplicity of the process or because the value stream is highly
automated. On the other hand, especially Manufacturer 1 and 2 and Steel, face
high(est) process uncertainty (as described earlier). The reason for the comparably
low standard deviation of control uncertainty is that 90% of the sample face
medium-high or high control uncertainty; most New Zealand companies have
implemented poor value stream control mechanisms. Overall, New Zealand value
streams are weakly internally integrated and face high uncertainty, especially from
the control side. Next the external uncertainty consisting of demand and supply
uncertainty is investigated.
5.3.1.1.2 Supply and demand uncertainty
The external uncertainty category consists of demand uncertainty and supply
uncertainty. The evaluation of supply and demand uncertainty is supported with
industry insights from New Zealand and Figure 5.3 shows the distribution of
supply and demand uncertainty.
Page 138
120
Figure 5.3: Comparison of supply and demand uncertainty
Source: Author
The x-axis in Figure 5.3 presents the level of uncertainty, the y-axis the
percentage of value streams studied. The mean for demand uncertainty (3.08) is
0.38 points higher than the mean for supply uncertainty (2.7). The t-test results in
a p-value of 0.093206, which is significant at the p ≤ 0.1 level. Hence, New
Zealand value streams are significantly less integrated on the customer side than
on the supplier side. The standard deviation for demand uncertainty (0.9072) is
only marginally higher than the standard deviation for supply uncertainty
(0.9090). The f-test results in a p-value of 0.4966, which is not significant.
On the demand side, sixteen value streams face medium-high or high demand
uncertainty. On the supply side, 55% of all value streams face medium-high
supply uncertainty. Fifteen percent face the highest level of uncertainty compared
with only 10% of all the value streams that have minimised supply uncertainty.
All exemplars facing low supply and demand uncertainty are value streams from
Food 1, a company that has the most advanced relationship management practises
in place compared to its New Zealand counterparts.
The reasons for the high demand uncertainty are twofold. First, in a few instances
demand uncertainty is introduced by the different markets. Steel, for example,
operates predominantly in a project-based environment, where future projects are
[% of
sample size]
[level of
uncertainty]
Page 139
121
often hard to forecast. Hence, Steel can often only react to market demand
fluctuations. Also, some companies produce more innovative products, which
automatically lead to higher demand volatility (Christopher, 2000). The second
reason for high demand uncertainty is poor customer relationship management
and inaccurate forecasting procedures. In many cases, the forecasting mechanisms
are immature and lack real-time market information. Manufacturer 2, for example,
is part of a global operating enterprise with sales offices worldwide. However, the
global enterprise has no system in place that increases warehouse visibility at the
worldwide operating sales offices. The low level of visibility results in poor sales
and operations planning and late and/or inefficient deliveries. A second example
is provided by Food 1, which currently has one of the more advanced customer
integration practises in place; including vendor managed inventory (VMI)
agreements with major local retailers. However, Food 1 did not manage to
implement collaborative planning, forecasting, and replenishment (CPFR) or even
a VMI agreement with its own sister company in Australia; head office places
both production plants under considerable internal competitive pressure.
New Zealand companies manage to better integrate with their suppliers than with
their customers, hence supply uncertainty is significantly lower than demand
uncertainty. Good integration practises range from VMI agreements with key
suppliers; strong performance measurements; and minimised supplier bases.
However, 55% of the sample still face medium-high supply uncertainty. Forestry,
for example, is currently managing a very large supply base (~1200) resulting in
transactional relationships with key suppliers. Other examples are provided by
Dairy 1 and Steel, that have no procurement or supplier relationship management
function; they both purchase on demand. Purchasing authority is given to key
people in different functional areas, resulting in predominantly transactional
relationships and poor supplier performance. Good indicators for demand and
supply uncertainty are finished goods stock level and stock turn ratios. Table 5.4
presents four examples of companies facing high supply and demand uncertainty
resulting in high inventory levels and low stock turns.
Page 140
122
Table 5.4: Inventory levels and stock turns by value stream
Company Value stream Supporting data
Forestry
6 4.3 finished goods stock turn (3 months of stock). Annual
stock holding cost of NZD 1.5 million (est.)
Food 1
7 1.5 months of finished goods stock resulting in NZD 9
million annual inventory carrying cost
Forestry
5, 6 NZD 22.5 million of maintenance stock. 2.5 years of
inventory. NZD 3.6 million of machine clothing inventory.
1.3 years of inventory
Dairy 1 3, 4 On average, 3.1 months of raw material inventory.
Source: Author
Table 5.4 provides inventory examples of three different companies (seven
different value streams). The research identified high stock levels and low stock
turns throughout the cases. In many the high stock levels function as a buffer
against future uncertainty demand and unreliable suppliers. New Zealand
companies face high external uncertainty due to poor relationship management
and incomplete information flows with external entities. The four quantified
supply chain uncertainty measures enable benchmarking of the twenty value
streams; these benchmarks are presented next.
5.3.1.2 Supply chain uncertainty benchmarking
The benchmarks have been established via calculation of Euclidean Norm values.
The formula for the Euclidean Norm calculation and the uncertainty score for
each value stream is highlighted in Appendix E.1.The Euclidean Norm for each
value stream was calculated because „a chain is only as strong as its weakest link‟.
Using this measure a non-integrated supply chain facing highest uncertainty
would score 6 and the seamless supply chain facing lowest uncertainty would
score 0. Figure 5.4 presents the resulting uncertainty scores for each value stream.
Page 141
123
Figure 5.4: Uncertainty benchmark of the New Zealand sample
Source: Author
Figure 5.4 highlights that most value streams are positioned closer to the non-
integrated supply chain side. Only three value streams were identified that were
clearly beyond the mid-point of integration, i.e. progressing towards being a
seamless supply chain. The research identified much good practise for value
streams 7, 9 and 12. However, the value of the mean (µ) lies between the non-
integrated supply chain and the mid-point. In the next section, the uncertainty data
is validated via the application of the supply chain integration evaluation tool.
5.3.2 Application of the integration evaluation tool
As described earlier, the integration evaluation tool was developed with the aid of
recent publications in the area of supply chain integration; hence, it is strongly
anchored in the supply chain literature (see also Chapter 2.11.3). With the
exception of value stream 19 and 20, the tool was applied during the Quick Scans.
The data from value streams 19 and 20 were revised. Key personnel within each
category were interviewed, followed by a discussion between all the researchers
involved to judge if the collected data reflected reality. Finally, the average score
was calculated to identify the current stage of supply chain integration for each
category. The individual company scores for each identified characteristic can be
found in Appendix H and Figure 5.5 presents the average level of supply chain
integration for each identified category.
Supply Chain Integration SeamlessNon-integrated
1 2
34
5 6 78 91011
12
13
14
15
16
17
18
19
20
Mid-Point of integration
Much good practice
µ
µ = Mean
Page 142
124
Figure 5.5: Outcome of the application of the integration assessment tool
Source: Author
Figure 5.5 again highlights that good value stream integration practises are rare.
No value stream was positioned in the seamless supply chain integration stage for
any of the four categories. The non-integrated and functional integrated supply
chain stages dominate. Only 18% of all value streams achieved the reactive stage
for three of the four categories. The category that scored least is the people/culture
category. Overall, 45% of all value streams fall within the non-integrated stage
and the remaining 55% are in the functional integrated stage. The most advanced
category is information sharing, were approximately 70% of all value streams
reached the functional integration stage, 18% are in the reactive supply chain
stage, and the remaining 12% are in the non-integrated supply chain stage.
Overall, the assessment revealed a similar picture of current supply chain
integration practises to the earlier benchmarking exercise in Figure 5.4, hence the
application of the integration assessment further validates the uncertainty
benchmarks.
In spite of this, further validation of the developed integration evaluation tool is
desirable because of the importance of the tool to the overall thesis (the
integration evaluation tool is used to assess a focal company‟s efforts to further
integrate its supply chain). The resulting uncertainty score is then compared to the
company‟s value stream integration practise, since it is expected that the higher
the supply chain uncertainty score, the lower will be the level of supply chain
0
20
40
60
80
Non-Integrated Functional
Integration
Reactive SC Seamless SC
Informtion Sharing Relationship Management
Information System People / Culture
[Level of
integration]
[% of
sample size]
Page 143
125
integration practises. Figure 5.6 presents the outcome of this comparison
(integration evaluation was not conducted for value streams 19 and 20).
Figure 5.6: Validation of integration assessment tool using value streams 1-18
Source: Author
The x-axis in Figure 5.6 presents the uncertainty score and the y-axis the value
stream integration level using the developed supply chain integration evaluation
tool. As expected, Figure 5.6 highlights that higher uncertainty score values
correlate with lower levels of supply chain integration, and vice versa (correlation
coefficient = 0.7864). This means that a high correlation between uncertainty
score and level of integration is present at a significance level of 0.0002
(significant at p ≤ 0.01 level). Hence, Figure 5.6 verifies the legitimacy of the
developed supply chain integration evaluation tool. Next, the comparison of the
New Zealand uncertainty data with the UK automotive sector is presented.
5.3.3 Comparison of the UK automotive sector with NZ data set
Towill et al. (2002) carried out detailed case studies of 20 value streams from the
European automotive sector between November 1997 and February 1999. They
found that some 80 percent of value streams faced high uncertainties and are
therefore weakly integrated. A detailed list of the UK automotive supply chain
uncertainty data can be found in Appendix E.3. In Table 5.5 this data is compared
1.00
2.00
3.00
4.00
0.00 1.00 2.00 3.00 4.00 5.00 6.00
Functional SC
[Level of integration]
Traditional SC
Reactive SC
Seamless SC
[Uncertainty score]
Page 144
126
to the New Zealand sample, which was collected between September 2003 and
February 2008.
Table 5.5: Comparison of NZ value streams with UK automotive
NZ sample UK sample t-test f-test
Uncertainty Mean Stdev Mean Stdev p-value p-value
Process 2.23 1.1863 2.30 1.0311 0.8092 0.2735
Control 3.35 0.6509 2.50 1.3179 0.0158 0.0017
Supply 2.70 0.9090 2.45 1.0990 0.4462 0.2078
Demand 3.08 0.9072 3.15 1.0400 0.8272 0.2787
Euclidean Norm 4.07 0.9951 3.78 1.401 0.0103 0.6034
Source: Author
Table 5.5 compares the mean and standard deviation of both samples. Further, a t-
test and an f-test have been conducted to determine whether significant
differences exist between means (t-test) and standard deviations (f-test)
(significant at p ≤ 0.05). Some insights can be drawn from the comparison. First
of all, both samples follow similar patterns. The demand and process uncertainty
of both samples is similar. However, one key difference between the samples is
that the UK value streams face highest uncertainty from the demand side followed
then by control, supply and process uncertainty. New Zealand value streams,
instead, face highest uncertainty from the control side followed then by demand,
supply and process uncertainty.
The difference between the mean control uncertainty scores is 0.85, and the New
Zealand score is significantly higher; also the paired t-test indicates this difference
is significant. New Zealand companies have significantly poorer control
mechanisms in place than their UK counterparts. The f-test (p-value = 0.0017)
also shows significant differences between both standard deviations (significant at
p-value ≤ 0.01). These findings are supported by Closs and Mollenkopf (2004)
who identified, using a quantitative comparison between Australian and New
Zealand (ANZ) and the USA, that ANZ companies place less emphasis on
internal integration (control and process uncertainty reduction) than their US
counterparts. Finally, the mean of the Euclidean Norm between both countries is
significantly different (significant at p ≤ 0.05). Figure 5.7 presents the Euclidean
Norm benchmarking comparison of the New Zealand data set and the UK
automotive sector data.
Page 145
127
Figure 5.7: Benchmark comparison between NZ and UK automotive
Source: Author
Figure 5.7 shows that the UK data is more evenly and more widely spread.
Because some 50% of New Zealand value streams are located closer to the non-
integrated region. On average New Zealand companies face higher uncertainty
than their UK counterparts. One commonality is that both data sets have three
value streams clearly positioned beyond the mid-point, and progressing towards
the seamless region. However, while Towill et al. (2002) identified two exemplar
value streams within their data set; the New Zealand data only revealed three
value streams exhibiting much good practise. Overall, both samples highlight that
value stream integration is poor in both countries and that highly integrated supply
chains remain exceptional. In the next section the uncertainty data is applied to
existing supply chain integration models. Here, the research aims to identify
whether companies follow a distinct path to supply chain integration.
5.4 Validation of existing supply chain integration models
Narasimhan and Kim (2001) note that much of the research on integration has
been predicated on the assumption that integration occurs in distinct sequential
stages. Possibly the most influential work regarding a staged process is by Stevens
(1989), who suggests that companies follow an integration process that goes
through different stages; integrating internally before then extending the
integration process to include other supply chain members externally (Stevens,
Supply Chain Integration SeamlessNon-integrated
1 2
34
5 6 78 91011
12
13
14
15
16
17
18
19
20
Mid-Point of integration
Much good practice
µ
40 36 21 37 2627
3233
24
25
3122 30
39
23 2928 34 35
38
ExemplarsMuch good practice
µ
UK Automotive dataNew Zealand data
Page 146
128
1989). Empirical evidence, (Towill et al., 2002; Koufteros et al., 2005) and case
study research (Gimenez, 2004) support the conceptual model developed by
Stevens.
Bowersox & Daugherty (1995), Hewitt (1994) and Gimenez (2004) also
emphasize that the improvement of each internal function should precede the
external connection with suppliers and customers in the external integration stage.
However, Gimenez‟s (2004) highlighted that one exemplar did not follow Stevens
(1989) integration model. Halldorsson et al. (1999) similarly report that managers
seem to achieve more successful integration with external business partners than
they do with managers and departments within their own company.
The original uncertainty circle developed by Davis (1993) and Mason and Jones
(1998) (see also Figure 5.1) is adapted in order to verify the currently available
supply chain integration models. This adapted version of the supply chain
uncertainty circle divides the original circle into two categories: (1) internal
uncertainty; and (2) external uncertainty. Internal uncertainty consists of control
and process uncertainty, ans external uncertainty consists of supply and demand
uncertainty. The clustering of the supply chain uncertainty circle into internal and
external uncertainty allows the researcher to identify the focal company‟s focus
area for value stream integration. Figure 5.8 presents the adapted version of the
uncertainty circle.
Figure 5.8: Adapted version of the supply chain uncertainty circle
Source: Adapted from Davis, 1993; Mason-Jones and Towill, 1998
Control
Side
Supply
Side
Manufacturing
ProcessDemand
Side
Product Delivery Process
Material Flow
Information Flow
Internal
Uncertainty
External
Uncertainty
External
Uncertainty
Page 147
129
The Euclidean Norm for both the internal (process and control) and external
(supply and demand) uncertainty category were calculated for each of the 20
value streams. These values (Appendix E.2) are shown in the 2x2 matrix in Figure
5.9.
Figure 5.9: Validation of Stevens (1989) integration model (NZ data)
Source: Author
The matrix consists of four quadrants. The top right quadrant (IV) reflects the
situation of a non-integrated value chain having high internal and external
uncertainty. In contrast, the bottom left quadrant (I) represents the seamless
supply chain facing minimised internal and external uncertainty. The top left
quadrant (II) reflects low internal integration, where internal uncertainty is
reduced, but external uncertainty remains high. Finally, quadrant (III) reflects low
external integration, where external uncertainty is reduced but high internal
uncertainty remains.
Figure 5.9 also identifies that, overall, New Zealand companies face slightly
higher levels of internal integration than external integration (observe the position
of µ in Figure 5.9). Forty five percent of the value streams are positioned in the
top-right quadrant (IV) representing the non-integration area. Twenty five percent
of the value streams studied are currently in a transition stage between quadrants.
Low Internal Uncertainty High
Lo
w
E
xte
rnal U
nce
rtain
ty
H
igh
I
14
10
7
4
11
8
13
6
5 2
1/15
12/9
3
16
17
20
18
19
IV
III
II
µSteven‟s (1989) integration
model
Page 148
130
Only fifteen percent of the sample lie within quadrant (I) and are facing low
uncertainty internally and externally. Ten percent of the sample have managed to
reduce their internal uncertainty significantly; however, high external uncertainty
remains. Only five percent (1 value stream) was assessed as being in quadrant
(III). This value stream managed to considerably reduce external uncertainty;
however, high internal uncertainty remains.
Figure 5.9 also shows a Stevens‟ integration model curve. Stevens (1989)
suggests that companies follow an integration process by integrating internally
first and then extending the integration process to other supply chain members
externally; all the value streams should appear above Stevens integration model
curve. However, three value streams (15%) have been identified that do not
follow Steven‟s integration model, and it is important to note that these belong to
three different companies.
Value stream 14 has managed to halve its external uncertainty, yet it still faces
highest internal uncertainty. In contrast, value stream 10 has managed to reduce
some internal uncertainty but clearly most of the company‟s efforts were on the
external side. Finally, value stream 7 has managed to reduce external uncertainty
almost to a minimum but still faces some internal uncertainty. In conclusion, this
study supports the Gimenez (2004) and Potter et al. (2004) findings that
companies do not always follow Stevens (1989) integration model.
In the next section, external integration is further divided into supply uncertainty
and demand uncertainty. Here the intention is to identify whether the twenty value
streams follow Frohlich and Westbrook‟s (2001) integration model. These authors
identified that companies tend to integrate with customers first, before integrating
with their main suppliers. Figure 5.10 maps the twenty value stream values.
Page 149
131
Figure 5.10: Validation of Frohlich & Westbrook’s (2001) integration model
Source: Author
The x-axis represents demand uncertainty, the y-axis supply uncertainty. Quadrant
(IV) represents high external (supply and demand) uncertainty and quadrant (III)
represents minimised external uncertainty. Some fifty five percent of the value
streams studied are positioned in quadrant (IV). Only ten percent of the sample
lies within quadrant (I), facing low(er) supply and demand uncertainty. Fifteen
percent of the sample has managed to considerably reduce demand uncertainty;
however, high supply uncertainty remains. Quadrant (III) represents those value
streams that have managed to reduce supply uncertainty but demand uncertainty
remains high. In total twenty percent of all value streams have been identified in
this quadrant. Overall New Zealand value streams are weakly integrated on the
supply and demand side, which is reflected by the position of the mean value in
quadrant (IV).
Again, Figure 5.10 shows a Frohlich and Westbrook (2001) integration model
curve. These authors identified that companies tend to reduce demand uncertainty
before reducing supply uncertainty, hence all the value streams are expected to lie
above the Frohlich and Westbrook (2001) integration model curve. However, the
current research identified that twenty five percent of all value streams do not
follow Frohlich & Westbrook‟s (2001) integration model; these studied value
streams are more strongly integrated with suppliers than with customers.
Low Demand Uncertainty High
Lo
w
S
up
ply
Un
cert
ainty
H
igh
I
14
10
7
4
11
8
13
6 5
215
12
3
1617
20
1819
IV
III
II
1
9
Frohlich & Westbrook‟s (2001)
integration modelµ
Page 150
132
Halldorsson et al.‟s (2008) quantitative study reports similar findings. These
authors compared the Scandinavian and North American perspectives on supply
chain management and identified that companies in both countries found it easier
to integrate upstream with suppliers than downstream with customers.
5.5 Discussion
The development of comparative measures of supply chain integration maturity is
complicated by the variety of supply chains encountered in practise; the
operational contexts within which they operate; and the complex multi-function,
multi-organisation measures required. As a result, many researchers use
subjective Likert scale measures (e.g. Rosenzweig et al., 2003) to assess
respondents‟ perception of their supply chain. Chapter 5 applied the subjective
measure termed uncertainty to evaluate supply chain integration maturity in
practise. Measurement of uncertainty essentially enables the researcher to
compare and benchmark a supply chain independent of the context within which it
operates.
Both the supply chain uncertainty analysis and the supply chain integration
evaluation tool highlight that New Zealand value streams are weakly integrated.
New Zealand value streams face highest uncertainty from their control side,
followed by demand uncertainty. However, some islands of good practise have
been identified. Overall, the research into value stream integration in New
Zealand reveals that a significant gap remains between value stream integration
theory and practise. Hence, this research supports the existing literature regarding
the lack of practitioner uptake of supply chain integration concepts. Many
scholars report that few companies are actually engaged in extensive supply chain
integration practises (Akkermans et al., 1999; Harps & Hansen, 2000; Kilpatrick
& Factor, 2000; Towill et al., 2002; Poirier & Quinn, 2003).
The comparison of the New Zealand data with the UK automotive sector revealed
many similarities between the data sets. However, the control uncertainty paired t-
test demonstrates a significant difference exists. Basnet et al. (2003) reported that
New Zealand companies lack proper control mechanisms and that information
Page 151
133
systems particularly are often outdated. Closs and Mollenkopf (2004) report that
Australian and New Zealand (ANZ) companies place less emphasis on internal
integration than do their US counterparts.
The uncertainty data further validates the developed integration evaluation tool
(see Chapter 2.11.3). The tool is underpinned by the supply chain literature and
was shown to be strongly correlates with the uncertainty scores; thus concluding
that it is a useful supply chain integration audit tool.
Finally, Chapter 5 supports the latest research in supply chain integration by
highlighting that Stevens‟ (1989) supply chain integration model does not always
reflect reality (Potter et al., 2004; Gimenez & Ventura 2005). Companies do not
always follow Stevens‟ (1989) supply chain integration model when integrating
their supply chain; internal and external integration can occur simultaneously.
Further, the New Zealand sample highlights that value streams face higher
uncertainty from the demand side than from the supply side; a finding that
contradicts the research findings of Frohlich and Westbrook (2001) who deduced
that companies tend to integrate with customers first, before focusing on the
supply side. It seems that there exists more than a single path to a seamless supply
chain and Figure 5.11 proposes a supply chain integration model consisting of six
distinct paths.
Figure 5.11: Proposed supply chain integration model
Source: Author
Non-integrated supply chain
Internal integration Customer integrationSupplier integration
Supplier
integration
Customer
integration
Internal
integration
Supplier
integration
Internal
integration
Customer
integration
Customer
integration
Supplier
integration
Supplier
integration
Internal
integration
Customer
integration
Internal
integration
Seamless
Supply chain
Page 152
134
Narasimhan and Kim (2001) note that much of the research on integration has
been predicated on the assumption that integration occurs in distinct stages. In
contrast, the integration model developed in Figure 5.11 follows the findings of
the present research. At the top of Figure 5.11 is the non-integrated supply chain
stage. Companies that are at this non-integrated stage may choose to integrate
internally or externally (with customers or suppliers) first. Once the first
integration stage is achieved, the remaining integration areas are tackled until the
seamless supply chain is achieved. The question remains, why does a company
take a certain path to integrate its supply chain? This thesis will further explore
the paths to value stream integration and seeks to validate the proposed supply
chain integration model (later Chapter 8). Chapter 8 also includes a discussion
around the desirability and feasibility of supply chain integration in practise.
This exploratory investigation into the current stage of supply chain integration in
New Zealand is not without limitations. The most obvious is that the sample
cannot be used to generalise to the overall population of New Zealand value
streams. The question remains whether other companies are similarly weakly
integrated. Mollenkopf and Dapiran (2005), for example, report in their
quantitative study that world class supply chains do exist in ANZ. However, this
research has only identified that a few value streams are applying good supply
chain practise. Further research is needed to explore the level of supply chain
integration in New Zealand.
5.6 Conclusion
Supply chain integration in practise remains an elusive goal. This chapter
evaluated and benchmarked uncertainty levels of value streams, utilising the
„uncertainty circle‟ developed by Davis (1993) and Mason-Jones and Towill
(1998). The benchmarking revealed that New Zealand value streams are weakly
integrated and face high uncertainty, especially from the control and demand
sides. These findings are further validated through data triangulation by the
application of the developed supply chain integration evaluation tool. This chapter
also compared New Zealand findings with the UK findings by Towill et al. (2002)
and concluded that differences in supply and process uncertainty are marginal; but
Page 153
135
the UK sample faces less uncertainty on the control and demand sides than their
New Zealand counterparts. The New Zealand companies even have significantly
lower control mechanisms in place compared with their UK counterparts. Finally,
the uncertainty scores were applied to Stevens‟ (1989) and Frohlich and
Westbrook‟s (2001) staged integration models. The research identified that both
models do not always reflect reality; internal and external integration can happen
simultaneously. Finally and in light of these findings a new supply chain
integration model was developed, which will be further validated in Chapter 8.
Chapter 5 has made two major contributions to theory. First, this research
supports the current literature that a gap exists between supply chain integration
theory and the actual uptake in practise. Best-in-class performance remains an
elusive goal for most value streams in New Zealand and best practises adoption is
patchy. Second, the research contradicts existing supply chain integration models
and proposes a new supply chain integration model, which will be further
explored. However, before moving to the paths to value stream integration, the
question remains recording the internal and external barriers that value streams
face when attempting to integrate. The following chapter provides insights into
internal value stream integration barriers.
Page 154
136
6. Barriers to Internal Supply Chain Integration
6.1 Introduction
The previous chapter assessed supply chain uncertainty and concluded that New
Zealand value streams are weakly integrated. A gap was identified between
supply chain integration theory and its uptake in practise. This chapter focuses on
the barriers to internal supply chain integration. The research seeks to understand
why supply chains are so weakly internally integrated and what common supply
chain integration barriers exist. It enhances the understanding of the causes of
certain internal supply chain integration barriers. To answer the research question,
insights from six companies are presented. The chapter predominantly uses
systems thinking in form of cause and effect analysis, which is one of the core
analysis elements used during a Quick Scan. First, the developed conceptual
model is introduced. This is capable of capturing different internal barriers to
supply chain integration and categorising them into environmental barriers,
company barriers, and value stream barriers. Further explanation of systems
thinking and cause and effect analysis is provided, and the application of the
conceptual model to six distinct cases is presented.
6.2 Barriers to internal supply chain integration
Many scholars acknowledge the existence of barriers to internal supply chain
integration (Bagchi & Skjott-Larse, 2002; van Donk & van der Vaart, 2005a;
Understand
and document
current supply
chain practises
Evaluate supply
chain integration
maturity.
Identify internal
barriers to
supply chain
integration
Evaluate
external barriers
to supply chain
integration
Current Status Barriers Pathways
Achieving
supply chain
integration in
practise
Research Question: What barriers
obstruct internal supply chain
integration in practise?
Page 155
137
Whipple & Frankel, 2000). Frohlich (2002) goes a step further when he argues
that internal barriers are the most important to address when implementing supply
chain integration solutions. However, in-depth investigations into the topic are
rare and barriers to supply chain integration remain not well understood (Storey et
al., 2005).
Barriers to internal integration have their origins in traditional functional practises
related to organisational structure, measurement and reward system, information
technology, and supply chain skills (Wisner et al., 2005). The two key
publications in the field of barriers to supply chain integration are by Gimenez
(2004) and Pagell (2004). Gimenez‟s (2004) exploratory study focuses on supply
chain management implementation in the Spanish grocery sector. Pagell (2004)
focuses on the integration of three separate departments within a focal company,
and both authors focus solely on a company level when investigating the barriers
to supply chain integration. Other authors (e.g. Basnet et al., 2006; Keegan et al.,
2001) investigated country specific or industry specific (e.g. Post & Altman,
1994) barriers to supply chain excellence. Towill (1999b) went beyond the
company level and identified that competing value streams can inhibit integration
efforts; these can create a barrier to supply chain integration when resources need
to be shared amongst the different value streams.
Gimenez (2004) points out that most identified barriers to supply chain integration
lack a commonly agreed structure. Consequently, Figure 6.1 proposes a supply
chain barrier structure consisting of three distinct layers: environmental barriers,
company barriers, and value stream barriers.
Page 156
138
Figure 6.1: Three layers of internal supply chain integration barriers
Source: Author
The three layer structure proposed in Figure 6.1 can be viewed from outside
(broad environmental context) to inside (detailed internal company context). Next,
each layer is explained in detail.
6.2.1 Environment level
Here, the environmental level is related to internal integration barriers because a
focal company‟s specific environmental aspects are assessed, which has an impact
on internal integration. Previous research on the environmental barriers to supply
chain integration is limited. Perhaps, the most relevant research is by Basnet et al.
(2006) and Keegan et al. (2001). Whereas Keegan et al. conducted their research
in the Irish grocery sector, Basnet et al. carried out in-depth case study research
with two New Zealand-based companies. However, Keegan et al.‟s study
potentially gives some valuable insight into the New Zealand context due to the
similarities between the two countries: small population size, low population
density, indifferent logistical infrastructure, and a high proportion of small and
medium-sized companies. Thus unsurprisingly, the research findings by Basnet et
al. and by Keegan et al. are similar, Table 6.1.
Value
Stream A
Value
Stream BValue
Stream N
Company
Environment
Environment
Company
Page 157
139
Table 6.1: Similarities between Irish and NZ supply chain integration barriers
Environmental
barrier
New Zealand Ireland – grocery sector
Competition The lack of a highly competitive
domestic marketplace influences the
need to adopt advanced supply chain
management practises
The lack of a highly competitive
domestic marketplace influences the
need to adopt advanced supply chain
management practises
Geographical
factors
New Zealand‟s geographical
isolation acts as a barrier to
organisations developing good
supply chain management practises
Low population density restricts
supply chain management use;
however, economic growth and
increased consumer spending
increases its adoption
Infrastructure/
Logistics
The indifferent logistical
infrastructure is a barrier to the
adoption of leading edge supply
chain practises
Physical as well as IT infrastructure
can be restrictive. High logistical
costs in Ireland compared to EU
result from the poor infrastructure
Average
company size
The high proportion of small and
medium-sized organisations limits
the uptake of supply chain
management
Multiple small sized stores provide a
challenging context to achieve
supply chain economies
Country
specifics
The independent/pioneer mindset of
many New Zealanders is an inhibitor
to the utilisation of leading supply
chain management practises.
Governmental policies can restrict
the uptake of SCM. Further,
regulations favour independent
operators and restrict the emergence
of a dominant operator.
Source: Basnet et al., 2006; Keegan et al., 2001
Table 6.1 highlights many similarities between the countries and because
environmental factors can play an important role, they need to be assessed when
investigating barriers to supply chain integration. The present research seeks to
further validate the key environmental barriers identified in Table 6.1.
6.2.2 Company level
Most of the current research into barriers to supply chain integration is at the level
of the company. Common barriers include functional silos, inappropriate
information systems, and lack of top management support (for a more detailed list
see also Table 2.9). The high number of barriers (see also (Halldorsson et al.,
2008; Gimenez, 2004)) at this level calls for a more detailed structure to identify
key areas that inhibit internal supply chain integration. The Cardiff business
process reengineering (BPR) change model, represented in Figure 6.2, was
Page 158
140
selected to identify and cluster the barriers to supply chain integration at a
company level. Childerhouse et al. (2003) has previously successfully applied this
model to 23 value streams.
Figure 6.2: Cardiff BPR change model
Source: Childerhouse et al., 2003, p.493
As Figure 6.2 indicates, the barriers are not independent, since there is often
considerable overlap between them. However, it is helpful to classify them
primarily as being either technology, culture, financial, or company barriers.
Technology integration is predominantly concerned with linking different
information systems within the organisation (Bagchi & Skjoett-Larsen, 2002).
Culture assumes a strong human approach to supply chain integration, as
Andraski (1994) claims that in real-world supply chains some 80% of problems
are due to people and people‟s skills. However, people are embedded with the
company structure, measurement and reward systems; hence, the organisation has
a strong impact on culture and behaviour. In considering finance barriers, two
factors are important; first a company‟s willingness to invest in supply chain
integration efforts and second, the capability to invest (Halldorsson et al., 2008).
Technology
Culture
Finance
Organisation
Page 159
141
6.2.3 Value stream level
The final barriers to supply chain integration occur at the value stream level. A
company can have multiple value streams (Fisher, 1997) and Towill (1999b)
identified that these value streams are often not well separated and share resources
in the form of labour, machines, and/or materials, which all impacts material flow
optimisation. Hence, the management and planning that takes place around these
value streams is (also) considered in this category. Next, the cause and effect
analyses used to investigate barriers to supply chain integration is explained in
detail.
6.3 Cause and effect analysis
One possible way of describing, analysing and communicating problems that deal
with complex causal relationships in a supply chain is a cause and effect analysis.
Cause and effect analysis is anchored within the systems thinking discipline. The
idea of a system is generally expressed as encompassing inter-connected
components separated from their environment by a system border. Fawcett et al.
(2007) provide the following definition:
Systems thinking is the holistic process of considering both the
immediate local outcomes and the longer-term system-wide
ramification of decisions. Whereas traditional functional thinking
seeks the local optimum – often at the expense of the overall
system‟s performance – systems thinking aligns efforts; getting
everyone to pull in the same direction. (pp. 74-75)
Systems thinking provides a method for describing, analysing and planning
complex systems of different kinds. It offers a way of understanding problems in
the present case, barriers, and communicating this understanding to others.
Systems analysis helps to depict real world systems by using a structured way of
building models (Holmberg, 2000).
A cause and effect analysis is one of the core elements of the Quick Scan Audit
Methodology (QSAM); revealing the „major pain(s)‟ a company is feeling as well
as the root causes of the identified „major pain(s)‟. The cause and effect diagram
Page 160
142
is also the centre point of the feedback presentation and reflects the researcher‟s
holistic view of the focal company. The diagram has two main strengths: It is
developed jointly by all the researchers, hence does not reflect one person‟s
opinion (researcher triangulation); Also, by taking a holistic/systems perspective
of the focal company; supply chain specific issues are combined with the wider
company and environmental issues to gain a complete „rich‟ picture of the focal
company situation.
The cause and effect analysis for Manufacturer 1 has been excluded from this
Chapter because, being the first application of the methodology in New Zealand,
its main purpose was to train other researchers in the method. Thus, the cause and
effect analysis was predominantly developed by the leading researcher and lacks
investigator triangulation. Figure 6.3 presents Dairy 1‟s cause and effect diagram
as an example only; the remaining diagrams are presented in Appendix F.
Figure 6.3: Cause-effect diagram: Dairy 1
Source: Author
Page 161
143
As highlighted in Figure 6.3, the root cause for the excessive raw material is that
no single person is responsible for procurement. Multiple authorisations are given
to key personnel to make procurement decisions. Production and sales
misalignment are being caused by two areas of major weakness: (a) limited
production responsiveness, caused by capacity constraints; a lack of scheduling
tools; and an historical focus on high volume production; and (b) poor
communication between marketers and operations, being exacerbated by a lack of
information visibility across well-entrenched functional silos. Such misalignment,
in turn, causes profit reduction via missed and late customer deliveries, excessive
finished goods stocks, and attendant inventory storage costs. Profits also suffer
directly as the result of excessive raw materials and a lack of focus on the most
profitable product mix.
The barriers to supply chain integration are extracted from the cause and effect
diagram and applied to the developed conceptual model. Next, each barrier
category (environment, company and value stream) is assessed using a three point
Likert scale, with anchors: 1 low, 2 medium and 3 high. Next, the in-depth
investigation into barriers to supply chain integration is presented.
6.4 Investigation into barriers to supply chain integration
The Quick Scan team developed six cause and effect diagrams, enabling the
researcher to clearly deduce key barriers to supply chain integration. These
findings are now presented.
6.4.1 Forestry: Internal barrier assessment
Forestry is a wholly owned subsidiary of a New Zealand-based corporation. Two
value streams were evaluated. Quick Scan resulted in high uncertainty for both of
them. Table 6.2 presents the outcome of the barrier assessment (see also the cause
and effect diagram for Forestry in Appendix F.1).
Page 162
144
Table 6.2: Supply chain integration barrier assessment: Forestry
Source: Author
Table 6.2 highlights that high barriers for all categories are present with the single
exception of the category „value stream‟. For this company environment factors
create a high barrier to supply chain integration; corporate has been taken over by
an investor creating uncertainty because the future corporate structure is unknown.
Timber purchasing and transportation costs are steadily increasing due to
indifferent logistical infrastructure and an increasing oil price. Finally, an unstable
New Zealand dollar adds to the environmental concerns because Forestry is
highly dependent on the export market.
At the company level of barriers to internal integration, Forestry‟s working culture
and attitude is cause for great concern. Managers throughout the company often
struggle to implement improvements because of a lack of willingness to
implement and to accept change, especially on the shop floor. Also, a strong union
further inhibits the implementation of necessary change programmes. Further,
Forestry‟s information system is outdated and only loosely coupled, which results
in a lack of supply chain visibility (Wisner et al., 2005). Financially, the new
investor creates a high barrier to integration because policies will not allow
investments with a cash-back period of more than one year. Finally, the
organisation itself creates a great barrier to supply chain integration; it is set up
hierarchically, resulting in independent, almost separate departments. Research
further revealed a lack of top management support regarding end-to-end process
optimisation (Pagell, 2004). Also, the company‟s reward system is functionally
driven; rewarding the optimisation of functions and discouraging cross-functional
Environment
Value Stream
Culture
Technology
Finance
Organisation
Co
mp
any
High
High
High
High
High
Low
Page 163
145
activities such as material and information flows optimisation, and hence supports
the further development of functional silos (Bowersox et al., 2002).
On the plus side, Forestry is facing no barrier to integration on an individual value
stream basis. Both value streams are set up individually and do not compete for
resources in form of raw materials, labour or machinery.
6.4.2 Manufacturer 2: Internal barrier assessment
Manufacturer 2 is a medium-sized, wholly owned subsidiary of a European-based
corporation. The Quick Scan revealed that the main product value stream faces
high uncertainty; however, uncertainty is less for the spare and wares value
stream. Table 6.3 presents the outcome of the barrier assessment (see also the
cause and effect diagram for Manufacturer 2 in Appendix F.4).
Table 6.3: Supply chain integration barrier assessment: Manufacturer 2
Source: Author
Table 6.3 shows that Manufacturer 2 faces predominantly medium barriers to
supply chain integration. The company operates in a stable environment.
Concerns mainly involve the strong New Zealand dollar as the business heavily
depends on exports. However, fluctuations are less severe due to high product
profit margins. The company is established in a remote part of the central North
Island and thus faces problems in hiring qualified staff for its expanding business.
Finally, the business feels the pressure of globalisation because new competitors
are offering a cloned product at a significantly reduced price.
Environment
Value Stream
Culture
Technology
Finance
Organisation
Co
mp
any
Medium
High
Medium
Medium
High
Low
Page 164
146
On a company level, the research revealed a poor culture and attitude. Functional
silos exist between different shop floors, as well as between management and the
shop floor. Key supply chain people often have no tertiary qualification and have
gained most of their knowledge through work experience. Although current
information system is modern and aligned to the corporation, it is suitable for
financial accounting only and additional components are necessary to make it
suitable for supply and operations management. On the finance side,
Manufacturer 2 is stable and is willing to invest in supply chain improvement. In
fact the only constraint identified was the larger investments needing to be signed
off by head office in Europe (often a highly bureaucratic process). The major
barrier at the company level is poor material flow. Manufacturer 2 operates with
multiple production facilities (workshops) in one plant. The material flow is
neither logical nor clear. Products move several times between the workshops
resulting in double handling and excessive production lead times. Finally, the
company lacks appropriate and meaningful supply chain measures.
However, Manufacturer 2 is facing no barrier to integration on an individual value
stream basis. Both value streams are set up individually and do not compete for
resources.
6.4.3 Dairy 1: Internal barrier assessment
Dairy 1 is an independent co-operative dairy company which is owned by its
farmer shareholders. The Quick Scan revealed that both value streams face high
uncertainty and hence are weakly integrated. Table 6.4 presents the outcome of
the barrier assessment (see also the cause and effect diagram for Dairy 1 in Figure
6.2).
Page 165
147
Table 6.4: Supply chain integration barrier assessment: Dairy 1
Source: Author
Dairy 1 faces high barriers to supply chain integration. Environmental concerns
concern the strong New Zealand dollar as the business heavily depends on the
export market. The company is also established in an isolated part of the South
Island, hence Dairy 1 faces high logistics cost due to poor infrastructure. The
geographical isolation also results in problems with hiring qualified staff. Finally,
Dairy 1 is a comparably small player in a market dominated by New Zealand‟s
leading dairy producer. Dairy 1 can often only react to the market that is
dominated by the main competitor.
On a company level, the research identified a strong functional silo mentality
between management and shop floor and between management functions. The
information system is outdated and loosely coupled, providing only limited supply
chain visibility (Wisner et al., 2005). However, Dairy 1 has a strong finance
underpinning and is willing to invest in supply chain improvements. The company
has a hierarchical organisational structure which supports the existence of
functional silos. Further, the sales and marketing function is physically remote
from the production plant; further limiting cross-functional information exchange
and supporting the functional silo mentality.
Finally, the value streams create a barrier to supply chain integration. The two
different value streams both depend on the same raw material supply. However,
this resource (milk) is limited, seasonal and not well managed. Currently, the
marketing department dictates the input of milk to each value stream.
Environment
Value Stream
Culture
Technology
Finance
Organisation
Co
mp
any
High
High
High
Low
High
High
Page 166
148
6.4.4 Steel: Internal barrier assessment
Steel is one of the largest and longest established engineering works in New
Zealand. The Quick Scan revealed that both value streams face high uncertainty
and hence are weakly integrated. Table 6.5 presents the outcome of the barrier
assessment (see also the cause and effect diagram for Steel in Appendix F.3).
Table 6.5: Supply chain integration barrier assessment: Steel
Source: Author
Steel faces high barriers to supply chain integration in all categories except
finance. The company operates in a difficult environmental setting. First, it is
located in a remote part of New Zealand‟s central North Island, and faces
difficulties in accessing the skilled labour market. Also, Steel is a comparatively
small player on the world market, hence cannot compete on price with its
competitors, who continue to enter the New Zealand market. Finally, Steel
operates in a project-based environment, which creates high future demand
uncertainties.
On the company side, the research identified strong functional silos between the
engineers, management team, and shop floor, which is exacerbated by union
activity. Steel also lacks skilled staff, especially at the management level; many
positions are filled by engineers lacking specific management skills. One result is
an outdated and loosely coupled information system, which results in a lack of
supply chain visibility. The medium barrier to supply chain integration is finance
although the financial situation is stable, the research revealed an unwillingness to
invest in upgrading assets and staff resources. Further, the material flow is neither
Environment
Value Stream
Culture
Technology
Finance
Organisation
Co
mp
any
High
High
High
Medium
High
High
Page 167
149
logical nor clear; products move several times between the workshops, resulting
in double handling and excessive production lead times. Finally, the company
lacks appropriate and meaningful supply chain measures.
The different value streams also create a serious barrier. Frequently the product
flow is interrupted because multiple products require the same resources in the
form of machinery and staff, which results in queuing and large increases in
production lead time.
6.4.5 Service: Internal barrier assessment
Service is part of the public sector and is responsible for planning, funding,
providing and monitoring health and disability services for the region. The Quick
Scan revealed that most value streams face high uncertainty and hence are weakly
integrated. Table 6.6 presents the outcome of the barrier assessment (see also the
cause and effect diagram for Service in Appendix F.2).
Table 6.6: Supply chain integration barrier assessment: Service
Source: Author
Service only faces internal barriers to supply chain integration because it operates
in a stable environment. The organisation is government owned and has a strong
local/regional focus.
The working culture and attitude is of great concern. Managers struggle to
implement improvements because of a lack of willingness to change and there is
Environment
Value Stream
Culture
Technology
Finance
Organisation
Co
mp
any
Low
High
Medium
Medium
High
Low
Page 168
150
mistrust between the product replenishment team and the nurses, resulting in high
buffer inventory. The information system is modern but is predominantly used for
financial accounting and lack supply and materials management modules. The
financial situation is stable; however, a strong budget focus makes the realisation
of major re-engineering projects difficult. Further, Service has a functionally
driven reward system, which is aligned to the hierarchical organisational structure.
Hence, the organisational structure and the reward system support the existence of
functional silos.
On the plus side, Service is facing no barriers to integration on an individual value
stream basis. All value streams are set up individually and do not compete for
resources in the form of raw materials, labour, finance or machinery.
6.4.6 Food 1: Internal barrier assessment
Food 1 is part of the process industry and has been manufacturing food products
in New Zealand for more than 70 years. The Quick Scan revealed that Food 1 has
managed to considerably reduce uncertainty of its value streams. Table 6.7
presents the outcome of the barrier assessment (see also the cause and effect
diagram for Service in Appendix F.5).
Table 6.7: Supply chain integration barrier assessment: Food 1
Source: Author
Food 1 operates in a stable environment and the company has managed to build a
strong brand presence, both in New Zealand and worldwide. The research
Environment
Value Stream
Culture
Technology
Finance
Organisation
Co
mp
any
Low
Medium
High
Low
High
Medium
Page 169
151
revealed mounting environmental pressures due to changing consumer behaviour.
However, the business is currently putting processes in place to meet future
customer demand expectations.
Although company culture and attitude, in the guise of functional silos is a
problem; this is not as severe as in the previous cases. The company has managed
to retain highly qualified staff in key positions and it places strong emphasis on
staff training. The current information system is outdated, which causes a high
integration barrier due to the complexity of the operations (the business currently
operates approximately 1600 individual production runs on two distinct
production lines per year). The finance situation is stable and the company is
willing to invest in supply chain improvement projects. The biggest barrier to
supply chain integration has been identified at the company level; Food 1 has a
hierarchical organisational structure. The reward system is aligned to this; hence,
the organisational structure and reward system support the existence of functional
silos. Furthermore, the sales and marketing function is physically separated from
the production plant, limiting cross-functional information exchange and
encouraging the functional silo mentality. Also, supply chain management is
treated as a function responsible for just inbound and outbound logistics, which
limits the opportunity to optimise end-to-end material and information flow. Top
management support is lacking and senior managers are not willing to address the
strong functional mindset.
Finally, competing value streams create an integration barrier. The two main
production lines need to share resources in the form of labour and machinery.
Value streams are also poorly defined and analysed.
Next, a cross-case analysis of these six companies is presented.
6.5 Cross-case Analysis
The previous section revealed that all six companies face significant barriers to
supply chain integration, which results in weakly integrated and poorly
performing supply chains. Figure 6.4 summarises the findings, and the case
Page 170
152
companies are arranged, left to right, in improving order of supply chain
integration; the final row contains the associated internal uncertainty scores (for
the most dominant value stream).
Figure 6.4: Cross-Case comparison for barriers to supply chain integration
Source: Author
The individual scores can also be found in Appendix E.2. Figure 6.4 highlights
that all six companies face a variety of high organisational barriers to supply chain
integration, dominated by culture and organisation categories. Halldorsson et al.
(2008) report similar findings, and identified that the top barriers for companies in
Scandinavia and America relate to organisational issues (e.g. organisational
structures) and people issues (e.g. lack of employee skills). A further interesting
insight highlighted by Figure 6.4 is that the three companies facing the highest
barriers to supply chain integration have high environment scores. Arguably, the
environmental barriers impact the company and value stream barriers.
The low barriers to supply chain integration are finance and value stream. Figure
6.4 shows that the company facing the lowest barriers to supply chain integration
is Food 1. This company scored lowest in the environment and finance categories.
However, high barriers in the technology and organisation categories remain. Not
surprisingly, Food 1 is also the company facing the lowest internal uncertainty.
Environment
Value Stream
Culture
Technology
Finance
Organisation
Co
mp
any
Steel Dairy 1 Forestry Manuf. 2 Service Food 1
Internal Uncertainty 3.61 3.00 2.24 3.54 4.24 2.00
LowMediumHigh
Page 171
153
Surprisingly, the company facing the highest internal uncertainty (Service) is not
the company facing highest barriers (Steel). Also, Forestry is facing
comparatively low internal uncertainty but high internal/environmental barriers to
supply chain integration. The reasons are twofold. First, internal uncertainty
consists of process and control uncertainty. However, companies like Food 1,
Dairy 1 and Forestry are all part of the process industry and their processes are
highly automated to minimise process uncertainty, which is reflected in the
internal uncertainty score. Secondly, the environmental factors are not reflected in
the uncertainty score.
Figure 6.4 also highlights that all six companies experience cultural barriers in the
form of functional silos, which inhibit the optimisation of material and
information flows. Functional silos often result in a lack of operational ownership
due to multiple decision points for a single value stream (Towill, 1997b). Further,
functional silos discourage communication across functions as well as the
development of cross-functional team work and relationships (Bagchi & Skjoett-
Larsen, 2002). The organisational structure and reward system also contribute to
the existence of functional silos. All companies are set up hierarchically. The
reward system follows the organisational structure, which strongly supports the
functional silo mentality. Further, in four cases, the sales and marketing function
is physically separated from the production plant. This geographical dispersion
causes not only high control uncertainty, it also limits cross-functional
information exchange and supports the functional silo mentality.
Figure 6.4 further shows that, in many cases, the information system creates a
barrier to supply chain integration. It was noted that most organisations
investigated currently operate with multiple independent and loosely coupled
information systems, which leads to incomplete and inadequate end-to-end
information flows. Further, employees have little faith in the information being
provided. The reason is twofold. First, too many employees have the ability to
manipulate the data and/or, secondly, the parameters in the systems are not
frequently updated. It was also noted that most of the supply chain data available
is in fact financial and/or accounting data. This data represents the financial status
Page 172
154
of a focal company but is in many cases inappropriate for supply chain or
operational management decision-making.
The research revealed a stable financial situation for all six companies, where
differences occur only in the willingness to invest in supply chain and/or process
improvement projects and in the bureaucratic procedures involved with overseas
headquarters. Forestry had implemented a policy that amortisation of investments
need to be achieved within one year. Service, on the other hand, operates in a
budget focused environment, which inhibits the necessary major supply chain
investments.
6.6 Discussion
This chapter reported how cause and effect analysis was used to gain a holistic
perspective of the barrier to internal supply chain integration a focal company
faces; hereby focusing on environment, company, and value stream aspects. This
categorisation is very useful as it provides supply chain managers with a barrier
assessment so that they may then assign resources accordingly. Also, the
developed conceptual model provides academia with a framework that integrates
all the identified barriers to supply chain integration in one model. Table 6.8
presents an overview of all identified barriers to supply chain integration, which
have been categorised following the conceptual model developed in Figure 6.1.
Page 173
155
Table 6.8: Identified barriers within each category
Barrier category Identified barriers to internal supply chain integration Frequency
(%)
Barrier identified by other
authors
Environment Geographical isolation as well as isolation within the country
Indifferent logistical infrastructure
The fluctuation of exchange rates
Lack of a highly competitive domestic market
6/6 (100)
6/6 (100)
5/6 (83)
2/6 (33)
(Basnet et al., 2006; Keegan
et al., 2001; Post & Altman,
1994)
Culture / People
Defensive culture, internal team focus, negative attitude towards change
Lack of skilled management staff
Lack of skilled shop floor staff
Union activity creates „us vs them‟ attitude
Poor knowledge management. Knowledge is power and not shared
5/6 (83)
5/6 (83)
4/6 (67)
2/6 (33)
2/6 (33)
(Gimenez, 2004; Halldorsson
et al., 2008; Harrington, 1995;
Pagell, 2004; Walker et al.,
2008; Wisner et al., 2005
Technology IS system supports finance and accounting only
Multiple independent information systems
6/6 (100)
4/6 (67)
(Gimenez, 2004; Lee, 2000;
Wisner et al., 2005)
Finance Lack of willingness to invest in supply chain improvement
Unable to invest in supply chain improvement
3/6 (50)
1/6 (17)
(Halldorsson et al, 2008; van
Donk & van der Vaart,
2005b)
Organisation
Organisational structure
Lack of staff training
Insufficient value stream measures
Reward System
Geographical dispersion
Lack of top management support
Strategic misalignment
Poor material flow
6/6 (100)
5/6 (83)
5/6 (83)
4/6 (67)
4/6 (67)
4/6 (67)
3/6 (50)
2/6 (33)
(Bagchi & Skjott-Larsen,
2002; Bowersox et al., 2002;
Chopra & Meindl, 2006;
Halldorsson et al., 2008;
Stevens, 1989; Walker et al.,
2008)
Value Stream Competing value streams 3/6 (50) (Towill, 1999b)
Source: Author
Co
mp
an
y
Page 174
156
Most of the barriers listed in Table 6.8 have been identified by other authors and
hence are strongly anchored within existing literature. The present study
contributes to literature by testing and verifying barriers to supply chain
integration using in-depth cross-case analysis. However, Table 6.8 highlights that
the conceptual model developed in Figure 6.1 is capable of capturing barriers to
supply chain integration in one cohesive model.
Table 6.8 highlights that most barriers to internal supply chain integration belong
to the company level and, more precisely, to the culture and organisation
categories. Arguably, barriers to supply chain integration are predominantly about
people, people development and the organisational structure(s) provided by the
company. As Andraski (1994) has remarked, supply chains are 80% people-
centred and 20% technology-centred. A similar argument holds true for the
barriers to supply chain integration. Mentzner et al. (2000) came to a similar
conclusion when they learned how many barriers were related to people and
personal interaction, as opposed to technology and infrastructure. Pagell (2004)
likewise discussed that the company culture and structure are critical for the
development of an internally integrated supply chain. Lambert and Cooper (2000),
and Storey et al. (2005) point out that the importance of corporate culture and its
compatibility across the internal and external supply chain cannot be
underestimated. Finally, Whipple and Frankel (2000) point out that the largest
barrier to integration is organisational (e.g. culture) rather than technical or
financial.
Thus, the organisational culture and the organisational structure(s) are expected to
be very critical regarding internal integration; the six case companies performed
most poorly in the culture and organisation category. Additionally, those two
categories have a strong overlap because people are embedded in the real-world
structures and situations offered by the focal company (Childerhouse et al., 2003).
Further, the remote geographic setting of some companies in New Zealand is
expected to provide one of the most severe environmental barriers to supply chain
integration. Many potential qualified employees are not willing to settle down in
isolated parts of New Zealand. These critical people-related barriers are
summarised in Figure 6.5.
Page 175
157
Figure 6.5: Interrelation of key barriers to internal supply chain integration
Source: Author
The key environmental constraint is positioned at the top left of Figure 6.5.
Companies face problems accessing qualified staff due to their remote setting.
This has a direct impact on the supply chain skill level within a focal company.
Often, the lack of supply chain skills is also reflected at the top management level,
which negatively affects top management support regarding process integration
and optimisation. However, other factors such as company politics are expected to
result in a lack of top management support appetite for change and internal
integration. A lack of top management support as well as a lack of supply chain
skills is therefore expected to be the main reasons for functional silo practises and
structures. Halldorsson et al. (2008) and Pagell (2004) also identified top
management support and employee skills as two highly critical variables. Those
practises and structures result in poor internal supply chain integration decisions
which can impact on the organisational structure and reward system. These are
expected to be key barriers and, if present, result in poor internal supply chain
integration.
Companies need to address these issues by exploiting opportunities to overcome
the barriers and top management support is expected to be very critical
(Halldorsson et al., 2008; Hammer, 1990; Pagell, 2004). In many cases, top
managers are in positions to positively influence the organisational structure and
Geographical
Isolation
Lack of Supply
Chain Skills
Lack of Top
Management Support
Other company
factors (e.g. politics)
Functional silo
structure + practises
Poor internal supply
chain integration
Page 176
158
reward system and hence, indirectly, make a positive impact on the culture and
people working in the focal company (Bagchi & Skjott-Larse, 2002; Harrington,
1995; Lee, 2000). Top managers can increase budgets for up-skilling and staff
training, and they need to identify the right incentives to persuade skilled
employees to join companies located in remote parts of New Zealand.
Barriers should not be viewed in isolation as they are often uniquely interlinked
and managers need to understand the resulting affects of their actions (internally
as well as externally) as visualised in the cause and effect diagram (see, for
example, Figure 6.2). Further, New Zealand companies not only need to tackle
their identified in-house barriers, they also need to identify ways to deal with New
Zealand specific environmental factors/barriers. Basnet et al. (2006), for example,
identified environmental barriers (see also Table 6.1) that strongly support the
findings of this chapter.
There are a multitude of further research avenues to expand this exploratory
research. Firstly, the barriers identified need further validation from a larger
empirical data source. Although, the environmental barriers discussed in this
chapter are specific to the New Zealand context, it is expected that many of the
findings can be transferred to other regions. For example, other countries with a
high proportion of small and medium-sized organisations may also suffer from
limited supply chain knowledge. The barriers identified at the company and value
stream levels are expected to be a global phenomenon because other researchers
report similar barriers to internal integration. However, further research is
required to validate the conceptual model presented in Figure 6.1. Also, the list of
barriers presented in Table 6.8 is not expected to be exclusive and further research
is needed to identify others or even categories that create barriers to supply chain
integration. Post and Altman, (1994) for example, focused on industry specific
barriers rather than environmental barriers. More significantly, now that barriers
have been identified, research needs to identify ways to remove or at least
mitigate their effects, thereby improving the uptake of supply chain management.
Page 177
159
6.7 Conclusion
Chapter 5 identified that supply chain integration in New Zealand remains an
elusive goal. This chapter provided insights into the factors that obstruct internal
supply chain integration in practise. Barriers to internal supply chain integration
have been identified and categorised using the three layer conceptual model
developed in this chapter. The categories are termed (a) environment barriers, (b)
company barriers, and; (c) value stream barriers. The data was collected and
analysed to improve understanding of the barriers organisations face that inhibit
integration within a focal organisation. Furthermore, the research demonstrated
that barriers identified by the literature are also common in New Zealand.
The particular strength of the research is twofold. First, using cause and effect
analysis enables the researcher to take a holistic, systems perspective of supply
chain integration barriers. Second, researcher triangulation ensures that the cause
and effect diagram represents not just one person‟s opinion. Thus, the key
contribution of this research is that it has furthered our understanding of a very
complex phenomenon, and in a manner that is only possible using qualitative
methods. The major contribution lies in the categorisation and close examination
of the barriers to internal supply chain integration. Further, the research revealed
that many barriers to internal integration are related to people and the structure
offered to those people by the focal organisation. Top management support is
expected to be very critical when companies aim to overcome internal barriers to
supply chain integration.
This chapter focused predominantly on the focal company and its barriers to
internal supply chain integration. Chapter 7 provides a focus study on external
integration, due taking the presence of power and dependency in external
relationships into consideration.
Page 178
160
7. Barriers to External Supply Chain Integration
7.1 Introduction
The first findings chapter, Chapter 5, identified that New Zealand value streams
are weakly integrated. The previous chapter classified barriers to internal supply
chain integration and concluded that many barriers to internal integration are
related to people and the organisational structure offered to those people by the
focal organisation. This chapter is focused on the study of supply chain
relationships, which inevitably involve considerations of power and dependency.
The significance of the research area has been highlighted in the literature (Cox,
2001; Maloni & Benton, 2000) (see also Chapter 2.9.2), and this chapter aims to
understand how power and dependency affect supply chain integration with
external entities. Furthermore, the measurement of power and dependency in
external relationships is considered. First, the key variables of power and
dependency in external relationships are identified. Then, a conceptual model is
developed, which is capable of capturing the identified variables. Based on the
conceptual model, relationships are then evaluated, to identify idealised
relationship management practise. Finally, a cross-case analysis is undertaken,
focusing on each company‟s capability to integrate externally. The discussion
section details how practitioners can generally apply the results to improve
supplier relationship management practises. This chapter is based on Böhme et al.
(2008c).
Main Research Question: How do
power and dependency affect external
supply chain integration?
Understand
and document
current supply
chain practises
Evaluate supply
chain integration
maturity.
Identify internal
barriers to
supply chain
integration
Evaluate
external barriers
to supply chain
integration
Current Status Barriers Pathways
Achieving
supply chain
integration in
practise
Page 179
161
7.2 Barriers to external integration
External integration is often viewed as comprising partnerships and strategic
alliances (e.g. Droge et al., 2004; Kim, 2006; Maloni & Benton, 1997; Spekman
et al., 1998). However, supply chain integration aims to achieve efficient flows of
material and information (Stevens, 1989). Hence, Gimenez (2004) focus solely on
the maturity of vendor managed inventory (VMI) practises in a focal company to
determine the level of supplier integration. Others focus on advanced information
systems such as EDI to determine the degree of external integration (Vickery et
al., 2003). Frohlich and Westbrook (2001), likewise, place most emphasis on
information flow and communication channels when investigating „arcs of
integration‟. Hence, it can be argued that evidence of advanced supply chain
integration practise by the focal company defines the degree of external
integration; and that partnerships and strategic alliances go beyond simple
consideration of external integration and the pursuit of optimisation of material
and information flows.
Many scholars acknowledge that a key barrier to any form of external integration
with customers and/or suppliers is the power and dependency existing between
the two organisations (Cox, 1999; van der Vaart & van Donk, 2004). The Quick
Scans reinforced the overall importance of power and dependency as the key
barrier to external integration. Much of the research on interorganisational
relationships among interdependent actors has been grounded in the interrelated
notions of power and control. As Pfeffer and Salancik (1978, p. 52) argued, “The
concentration of power is inevitable.” They defined interdependence as a
phenomenon that “exists whenever one actor does not entirely control all of the
conditions necessary for the achievement of an action or for obtaining the
outcome desired from the action”. By this definition, interdependence and its
implications are closely identified with power and trust. This early work set the
tone for subsequent research on organisational interdependence (Gulati & Sytch,
2007).
Page 180
162
7.2.1 Trust, Power, and Dependency
Power and dependency in relationships has been studied extensively (Bensaou,
1999; Caniels & Gelderman, 2005; Cox, 2001; Kraljic, 1983). The power
phenomenon can be defined as the ability of one entity in the chain to control the
decision of another entity (Daparin & Hogarth-Scott, 2003). However, power as
a concept is of little analytical value since the nature of power itself is less
important than the origins of power. Dependence, being the inverse of power, is
the reliance of one party on the other in maintaining a relationship to achieve
respective goals (Emerson, 1962). The literature draws a distinction between
buyer dependency and supplier dependency. Supplier dependency typically
exists when the buying company is significant for the supplier; the buying
company has a high percentage of the supplier‟s total market (Motwani et al.,
1998). Conversely, buyer dependency can be characterised as having a high need
for, but relatively low possibility of, integrative practises with suppliers (Cox,
2004).
7.2.2 Purchasing portfolio models
Power and dependence are generally considered important for the understanding
of relationships (Caniels & Gelderman, 2005; Cox, 2001, 2004). A popular
technique for capturing power and dependency in relationships occurs in the
form of (2x2) purchasing portfolio models, which allow the researcher to analyse
and cluster the relationships. Such portfolio models have received much attention
in recent literature on strategic planning (Bensaou, 1999; Caniels & Gelderman,
2005; Cox, 2001; Kraljic, 1983). They can be used as analytical tools to organise
information and create a classification framework of the variables included in the
portfolio (Ellram, 1992), with the final outcome being identification of the
groups of products, suppliers, customers or relationships which warrant greater
resources allocation than others (Olsen & Ellram, 1997). Kraljic (1983)
developed one of the first purchasing portfolio models that was used to analyse a
focal organisation‟s supplier relationships; and other authors have since followed
this approach (Bensaou, 1999; Caniels & Gelderman, 2005; Cox, 2004; Gadde &
Hakansson, 2001; Spekman et al., 1998). Table 7.1 reviews five portfolio
models, and includes their classification dimensions and the four resultant taxa.
Page 181
163
Table 7.1: Review of portfolio models listed by publication date
Author Classification Dimensions Four taxa
Kraljic (1983) Complexity of supply market
Importance of purchase
Purchasing -, Material-, Sourcing-
, and Supply Management
Spekman et al..
(1998)
Strategic importance
Complexity
Open market negotiations, Co-
operation, Co-ordination,
Collaboration
Bensaou (1999) Supplier‟s specific investment
Buyer‟s specific investment
Market Exchange, Captive- Buyer
or Supplier, Strategic Partnership
Cox (2004) Supplier- relative to buyer- power
Buyer- relative to supplier- power
Independence; Buyer- or Supplier-
Dominance, Interdependence
Caniels &
Gelderman (2005)
Supply risk
Profit impact
Non-Critical-, Leverage-,
Bottleneck-, and Strategic- Items
Source: Böhme et al., 2008c
Recent adaptations and refinements of Kraljic‟s (1983) classification approach
have produced alternative portfolio models with different classification
dimensions. The underlying premise of all the models is that the need for
collaboration differs from one organisation to the next (van Donk & van der
Vaart, 2005b).
7.2.3 Dependency Variables
Table 7.2 is a summary of the different supplier dependency variables identified
in the literature. While several authors have addressed the issue of dependence
from a purchasing volume perspective, it appears that there is still a gap in the
literature regarding identification of the myriad reasons for the existence of
different levels of dependency in buyer-supplier relationships. Similarly, Table
7.3 provides a summary of the different buyer dependency variables identified in
the literature.
Page 182
164
Table 7.2: Supplier dependency variables
Variable Description of supplier dependency
Purchasing volume
/Profit impact
Purchasing volume is the total value of products an organisation
purchases from one source, which is the basis of buyer dominance (Cox,
2004; Olsen & Ellram, 1997). Kraljic (1983) instead focuses on the
percentage a special product is responsible for in terms of organisational
profit.
Switching Cost Some authors call switching cost a level of specific investment (Bensaou,
1999; Monczka et al., 1995); however, if an organisation has invested
highly in a relationship then the switching costs are high and therefore the
organisation is dependent.
Branding
Reputation
Branding is linked to the reputation a product/organisation has. If
customers demand a special brand, the buying organisation can depend
on its suppliers (Cox, 2001; Olsen & Ellram, 1997).
Real time demand
information
To be efficient, the manufacturer depends on EPOS data and information
transparency. Having ownership of the data is a power source and makes
the supplier depend on the buyer (Burt & Sparks, 2003).
Number of
alternative
customers
In an oligopolistic market, the number of alternative available customers
is often limited. This increases the level of supplier dependency.
Source: Böhme et al., 2008c
Table 7.3: Buyer dependency variables
Variable Description of supplier dependency
Capabilities /
Supplier Skills
The supplier can have certain skills (Gadde & Hakansson, 2001). Those
skills can be performance (Kraljic, 1983), or technically related.
Technical complexity describes the equipment a supplier requires to
manufacture a product (Cox, 2001) as well as the skills to produce a
special product or product component.
Switching Cost see Table 7.2
Resources
available by
supplier
Resource availability can be related to the final product, added value
services, advertising support, and risk sharing (Gadde & Hakansson,
2001; Olsen & Ellram, 1997). Goffin et al. (2006) further identified the
form of involvement in new product development as a resource a certain
supplier offers.
Branding /
Reputation
See Table 7.2
Number of
alternative
suppliers
This variable describes the number of alternative available suppliers
capable of delivering the same product. Olsen and Ellram (1997) look at
product substitutability; however, if the product is not substitutable, then
fewer alternative suppliers are available, hence the purchasing
organisation highly depends on the supplier (Geyskens et al., 1996).
Source: Böhme et al., 2008c
Page 183
165
7.2.4 Power and Dependency Dyadic Relationship Model
The portfolio approaches by Cox (2004) and Kraljic (1983) had a major influence
on the strategic supplier relationship research model used in this study. Both
authors applied two dyadic power constructs that emerge from Emerson‟s (1962)
exchange theory, which yields two distinct theoretical dimensions of resource
dependence: power imbalance, or the power differential between two
organisations; and mutual dependency, or the sum of their dependencies (see also
Figure 7.1) (Casciaro & Piskorski, 2005). Although Cox (2004) used broad
classification dimensions that covered different power and dependency variables
(earlier Table 7.1), by only focusing on five variables the approach lacks
completeness. In contrast, Kraljic (1983) focused on product criticality. The
strategic supplier relationship research model used in the present research is
shown in Figure 7.1.
Figure 7.1: Power and dependency dyadic relationship model
Source: Author
Figure 7.1 arrays the five Supplier dependency variables identified in Table 7.2
on the y-axis; and the five Buyer dependency variables in Table 7.3 on the x-axis.
The various combinations of dimensions then allow the type of relationship to be
categorised. Thus, if the supplier dependency and the buyer dependency in a
relationship are both low (bottom left-hand quadrant), the organisations are
relatively independent. If the supplier is highly dependent on the buying
Independence Supplier
Dominance
InterdependenceBuyer
Dominance
Low High Buyer dependency
Low
H
igh
Sup
pli
er d
epen
den
cy
Integration is supported
by the power and
dependency structure
Integration is not
supported by the power
and dependency structure
Page 184
166
organisation, and vice versa, interdependency exists. If supplier dependency is
high and buyer dependency is low, the buying organisation is dominating the
relationship. Conversely, if buyer dependency is high and supplier dependency is
low, the supplying organisation is dominating the relationship. Cox (2004)
suggests that organisations should develop relationships appropriate to the power
and dependency circumstances in which they find themselves, and Appendix G.2
provides a detailed description of such relationship management styles.
Particularly interesting is the conclusion by Cox (2001) that integrative supply
chain structures are supported by buyer dominance or buyer/supplier
interdependence. Therefore, the power regime in a supply chain can also be
considered as a possible barrier that blocks the creation of streamlined
information and material flows. On the other hand, power can be used to enforce
the elimination of certain barriers (van der Vaart & van Donk, 2004); particularly
in buyer dominance and interdependency situations. In the next section, the data
collection process is highlighted.
7.3 Method used to investigate power and dependency
The data collection process included five crucial steps. A more detailed data
collection process can be found in Chapter 4.8.1.9. and Figure 7.2 outlines the
most critical steps.
Page 185
167
Figure 7.2: Five-step process to investigate power and dependency
Source: Author
Step 1 is predominantly about gaining an overview of current supply chain and
relationship management practises. In Step 2 the key dependency variables are
identified, followed by the evaluation of the idealised relationships with key
suppliers. In the final step, improvement opportunities are developed and
discussed with the focal organisation.
Seven Quick Scan audits were conducted between 2004-2008 to gain a good
understanding of New Zealand‟s environmental impacts, barriers, and
challenges. Six further in-depth case studies were undertaken during 2006-2007.
The semi-structured interview guide applied during the research can be found in
Appendix G.1. During this latter period, Food 2 and Dairy 1 were included
because significant differences were expected in their power structures due to
their relative sizes (Food 2 is a SME and Dairy 1 is one of New Zealand‟s largest
organisations). At this stage, the research focused only on the supplier side
because the power and dependency structure on the customer side could easily be
identified. For example, the company Forestry and Dairy supply commodity to
the market and the relationship is transactional. In contrast, the two Food
companies supply major retailers operating in the Australia and New Zealand
region, hence are dominated by their customers. Finally, Manufacturer 2 supplies
all its products to the wider organisation, hence interdependency is present. Case
1a) Quick Scan scoping
1b) Current relationship evaluation
2) Identification of key dependency variables
3) Evaluation of key relationships based on step 2
4) Identification of improvement opportunities
Page 186
168
descriptions were created principally from interviews with key managers and
workers at the focal organisations, and from company brochures and company
websites. Information was gathered at each site in as much rich detail as
possible. While analyzing the data, similarities and differences between the sites
were noted and documented. Next, scoping and the current supplier relationship
management practises are presented.
7.4 Investigation into barriers to external integration
7.4.1 Findings in Steps 1 and 2: Scoping and evaluating relationships
Application of QSAM, involving interviews with 35 employees (supply chain
managers and procurement managers, together with other purchasing and
contracting staff) enabled the researchers to gain in-depth knowledge around the
six companies studied. Table 7.4 outlines the current relationship management
practises between the organisations and their suppliers.
It can be seen that all six organisations perform only relatively low level supplier
integration activities, such as minor information sharing. With the exception of
Food 2, every organisation had VMI agreements in place with their suppliers
although these were at an experimental stage. In particular, a strong price focus
in every organisation appeared to be damaging the trust between buyers and
suppliers, and commensurately impacting supplier integration efforts (Burt et al.,
2003). All the organisations face the problem that much procurement knowledge
is tacit and the processes are not mapped; also, supplier information is seldom
shared or formally recorded (in some cases the reasons for choosing a particular
supplier were unclear or even appeared to defy logic). Multiple unstructured and
non-transparent interfaces between suppliers and the focal organisations were
commonly identified.
It was also commonly reported that the large supplier bases made it unfeasible to
routinely measure supplier performance or to have every supplier signed up to a
formal contractual agreement. This creates uncertainty in delivery performance,
leading to buffer inventories on the inbound side of the focal organisation.
Page 187
169
Table 7.4: Supplier relationship management practises
SRM Practises Food 1 Food 2 Dairy 1 Dairy 2 Forestry Manufacturer 2 Steel
Supplier base
350 120 500 300 1200 350 350
Procurement staff
members
8 2 15+ 3 10+ 3 1
Supplier Contracts
All on contracts All on contracts Partly on
contracts
Partly on
contracts
Partly on
contracts
All on contracts Partly on
contracts
Performance
Measurement
Delivery on full
on time, quality,
Goal
achievement
None Delivery on full
on time, quality
None Delivery on full
on time
Delivery on full
on time, quality
Delivery on
time
Main SRM Focus
Price/Cost
reduction
Price/Cost
reduction
Price/Cost
reduction
Price/Cost
reduction
Price/Cost
reduction
Supplier
development
None
R&D
Very little No Very little No No Extensive Very little
Information
Sharing
Demand
forecasts
No Demand
forecasts
No No No No
Supplier Meetings
Quarterly Yearly Quarterly Half yearly Yearly Half yearly No
VMI
Few No Few Few Few Few Few
Supplier visits
Seldom Frequent No Seldom No Seldom Random
Socialisation
Tactics
Yearly social
supplier event
None None None None Yearly social
supplier event
None
Future Direction Global sourcing Supplier
performance
measurement
Supplier base
consolidation
Supplier
contracts
Supplier base
consolidation
and supplier
contracts
Supplier
Development
Implementing
SRM
Source: Author
Page 188
170
Overall, although many of the participants recognised that that they should be
taking a more strategic approach to sourcing, only Food 1 was actively doing so.
Dairy 1 and Forestry were moving slowly toward a more strategic procurement
approach although they were focusing only on their first tier suppliers.
With regard to the top 17-28 suppliers (by purchasing volume), and of the 158
relationships examined, some 25% were described as being transactional, 41%
were described as a close supplier, and 34% were described as a partnership.
Such clustering highlights that the focal organisations perhaps do not fully
comprehend all the nuances of the power/dependency situation. This finding
supports an earlier study by Maloni and Benton (2000). Particularly in light of
the significant spend being placed with the top suppliers, the high proportion of
relationships reported as transactional was somewhat of a surprise. Also, as
mentioned above, relationships reported as partnerships were frequently being
managed along quite different lines to any literature description, i.e. of the six
organisations:
Suppliers on long term contracts (All suppliers on contracts: 3; Partly on
contracts: 3)
Continuous improvement
o E.g. frequency of supplier meetings (Quarterly: 2; Half-yearly: 3;
Yearly: 1)
o E.g. frequency of supplier visits (Frequent: 1, Seldom; 3, Never: 2)
Openness in all areas including cost, information, and accounting.
o E.g. Information sharing. (Yes, demand forecasts: 2; Yes, part sharing
of information: 1; No information sharing: 3)
Supplier score card (Yes: 1; No: 5)
Development of appropriate KPIs (Yes, all key measures: 1; Yes, a few key
measures: 3; No key measures: 2)
Supplier develops production skills tailored to the buyer‟s organisation (Yes:
1; No: 5).
Page 189
171
7.4.2 Findings in Step 3: Identification of key variables
In this step, the key power and dependency variables are identified. Supply chain
managers, procurement managers, contract managers, and procurement staff in
all six organisations were interviewed to identify the key variables they
considered when making purchasing decisions. This is a crucial step as these
variables form the starting point for the evaluation of the supplier base and
selection of appropriate future action plans. Only when the focal organisation has
agreed upon the variables, and their importance to the company, should the Step
4 analysis proceed. Figure 7.3 indicates the four key supplier dependency
variables, and also indicates their relative importance.
Figure 7.3: Key supplier dependency variables
Source: Author
Figure 7.3 clearly indicates that purchasing volume (by dollar value) is by far
the most important variable on the Supplier Dependency side, when the buying
company has a high percentage of the supplier‟s total market. Purchasing
volume accounts for 60% of the total supplier dependency followed by
switching cost (20%), alternative customers (15%) and finally branding and
reputation (5%). Interestingly, real-time demand information is not considered
important by purchasing professionals within these New Zealand‟s companies.
Supplier Dependency
Purchasing
Volume
Branding
Reputation
Alternative
Customers
Switching
Cost
Page 190
172
Cox (2004), and Olsen and Elram (1997) likewise report that, next to switching
costs, purchasing volume is one of the most important variables influencing
supplier dependency. Figure 7.4 illustrates the buyer dependency variables, and
also indicates their relative importance.
Figure 7.4: Key buyer dependency variables
Source: Author
The importance of the variables on the buyer dependency side is more evenly
distributed. Capabilities and supplier skills account for 40% of the total buyer
dependency, followed by switching cost and alternative suppliers (both 30%).
Surprisingly, supply chain and procurement managers in New Zealand do not
believe that branding and reputation impact buyer dependency. Although,
Bensaou (1999) highlights the importance of switching cost by solely focusing
on relationship-specific investments when investigating buyer-supplier
relationships Gadde and Hakkanson (2001) point out the importance of
capabilities and supplier skills for dependencies. However, these authors do not
position these variables in relation to each other.
Buyer Dependency
Capabilities /
Supplier Skills
Branding
Reputation
Alternative
suppliers
Switching
Cost
Page 191
173
7.4.3 Findings in Step 4: Idealised supplier relationship
Paying particular regard to the key variables identified in Step 3, dependency on
the top 17-26 suppliers by purchasing volume was objectively assessed using a
4-point Likert scale (with anchors 1=low dependency; 4=high dependency).
Table 7.5 defines each anchor for each identified variable.
Table 7.5: Definition of anchor for identified variables
Variable Low Low - Medium Medium – High High
Alternative
customers or
suppliers
Many Few Duopoly Monopoly
Switching
Cost
No relationship
specific
investments
Few
relationship
specific
investments
Some
relationship
specific
investments
Heavy
relationship
specific
investments
Branding /
Reputation
Insignificant Little
significance
Some
significance
Strong
significance
Purchasing
volume
Insignificant Little
significance
Some
significance
Strong
significance
Capabilities /
Skills
None Few Some Specific
Source: (Author)
To achieve a representative evaluation of each relationship, the weighted average
score for buyer and supplier dependency was evaluated by the relevant
procurement staff and by the supply chain manager. Figure 7.5 contains the
results for all (158) relationships.
Page 192
174
Figure 7.5: Supplier relationship evaluation
Source: Author
Some 28.5% of the relationships were determined to be of type Independence,
where the focal organisation essentially needs to ensure that the lowest market
price for acceptable quality and timely delivery is being achieved. A main reason
for this high figure is that New Zealand organisations increasingly source large
amounts of bulk products from overseas suppliers. Of the top 17-26 suppliers by
volume, around 13.9% are characterised as Buyer Dominance, being highly
dependent on the focal organisation. This was judged to be a relatively low
figure considering that most of the focal organisations are large New Zealand
businesses with a strong local supplier base. Conversely, some 27.2% of the top
17-26 volume relationships are characterised as Supplier Dominance, having
focal organisations that depend highly on them. New Zealand‟s small market size
means that, although goods are produced by multiple suppliers, often only one
supplier can deliver the volume required by the larger enterprises. Finally, some
30.4% of relationships were clearly identified as being Interdependent, hence
should be able to justify relationship integration practises. Figure 7.5 underscores
that every organisation needs to manage a portfolio of different relationships
based on a realistic assessment of the actual dependency situation that exists.
Evidently, power and dependency is limiting the level of integration in all of the
companies studied and thus presenting a key barrier to integration. This finding
IndependenceSupplier
Dominance
InterdependenceBuyer
Dominance
Low High Buyer dependency
Lo
w
Hig
h
Su
pp
lier
dep
end
ency
28.5 % 27.2 %
13.9 % 30.4 %
IndependenceSupplier
Dominance
InterdependenceBuyer
Dominance
Low High Buyer dependencyLow High Buyer dependency
Lo
w
Hig
h
Su
pp
lier
dep
end
ency
Lo
w
Hig
h
Su
pp
lier
dep
end
ency
28.5 % 27.2 %
13.9 % 30.4 %
Page 193
175
supports earlier power and dependency research that identified power as a key
barrier to supply chain integration (Cox, 2001; van der Vaart & van Donk, 2004).
A comparison of the current style of relationship management being practised
(evaluated in Step 2), with the ideal relationships identified from objective
consideration of actual power and dependency, highlights the misalignments in
contemporary relationship management practise. The major misalignments are
presented in Figure 7.6.
7.4.5 Comparison of current relationships with the ideal
Comparison of the current relationship with the identified idealised relationship
highlights the misalignments in relationship management practises. These
misalignments are highlighted in Figure 7.6
Figure 7.6: Misalignments of current and idealised relationships
Source: Author
The biggest misalignment occurs in the Buyer Dominance category, where it can
be seen that some 37% of buyer-dominated relationships are currently being
managed as a partnership, rather than as a relationship predominantly focused on
achieving the best price. This is resulting in unwarranted expenditure of
resources and (frequently) a suboptimal purchasing price being achieved.
Similarly, for the Independence category, some 22% of relationships are
currently being managed as partnerships even though the parties do not actually
Low High Buyer dependency
Lo
w
Hig
h
Su
pp
lier
dep
end
ency
15% of all
interdependence
relationships are
managed as
transactional
18% of all
supplier
dominated
relationships are
managed as
transactional
37% of all buyer
dominated
relationships are
managed as
partnerships
22% of all
independent
relationships are
managed as
partnerships
Page 194
176
depend on each other. Again, the result is a waste of resources and (frequently) a
suboptimal purchasing price being achieved. A relatively minor misalignment
occurs in the Interdependence category, where currently some 15% of all
interdependent relationships are being managed as transactional relationships
rather than as some closer style of relationship, which this situation deserves.
These organisations may not be gaining all of the value that would be afforded
by the recognition of their mutual dependency. Perhaps the most disconcerting
situation occurs in the Supplier Dominance category where, even though the
focal organisation is actually highly dependent on its key suppliers, 18% of those
relationships are currently being managed as if the organisations are
independent. These findings support those of earlier research that reported very
similar misalignments (Cox, 2004).
7.4.6 Overcoming power and dependency to external integration
The current research included expert discussions with the managers contributing
to this research. In identifying supplier dominance as a threat to every manager,
it was stressed that the key is having the ability to reduce the power of the
suppliers (Cox, 1999), even though van Donk and van der Vaart (2005b)
highlighted that the power structure cannot easily be influenced. Discussions
identified four strategies to overcome a disadvantageous supplier dominance
situation: insourcing; volume increase; global sourcing; and socialisation.
1. Insourcing: The large forestry organisation (Forestry) is currently heavily
dependent on the sole power supplier in its region that can meet its needs.
Forestry could reduce this dependency by incinerating wood scrap from the
production process to generate its own electricity. By increasing generating
capacity to a level that enables alternative (smaller) providers to become
eligible, the organisation will increasingly become independent of its current
sole provider (Cox, 1999).
2. Volume Increase: Dairy 2 is planning to rationalise and consolidate its supply
base by appointing one of its many suppliers to be its sole provider for farm
equipment; thereby moving the remaining first tier suppliers into the second
tier. Increasing the sales volume through one particular farm supplier will
Page 195
177
increase that supplier‟s dependency on Dairy 2, thereby shifting the nature of
the relationship more towards one of interdependence.
3. Global Sourcing: Food 1 is highly dependent on local ingredient suppliers
and has established a project team to investigate overseas suppliers for some
specific ingredients to achieve a better purchasing price. In this way, Food 1
is hoping to reduce its dependency on its local suppliers and aiming to shift
the relationship more towards one of independence.
4. Socialisation: Socialisation helps build interpersonal relationships and trust
and is argued as being an increasingly important mechanism for facilitating
and enhancing supply chain integration processes (Cousins & Menguc,
2006). Through familiarity, socialisation and integration reduce the perceived
risk between buyers and suppliers as they together contemplate increasing
information flows and transaction-specific investments. In this way, the
likelihood of opportunistic behaviour is reduced (Cousins & Menguc, 2006).
While socialisation tactics do not change the dependency on a particular
supplier, they help to make the situation more bearable. All of the
organisations studied could usefully apply socialisation tactics.
7.5 Cross-Case Analysis
Chapter 7 began with a comparison of idealised supplier relationship
management. This was followed by a brief case description, which also
includes customer dependency and the identified supplier and customer
uncertainty data from Chapter 5. The evaluated relationships for each sample
are presented in Table 7.6.
Table 7.6: Idealised supplier relationship management
Integration not supported Integration supported
Company Independence Supplier
Dominance
Buyer
Dominance
Interdependence
Food 1 19% (4) 29% (6) 9% (2) 43% (9)
Food 2 19% (5) 46% (12) 8% (2) 27% (7)
Dairy 1 15% (3) 20% (4) 20% (4) 45% (2)
Dairy 2 47% (13) 39% (11) 7% (2) 7% (9)
Forestry 0% (0) 15% (3) 5% (1) 80% (16)
Manuf. 2 42% (11) 15% (4) 31% (8) 12% (3)
Steel 52% (9) 18% (3) 18% (3) 12% (2)
Source: Author
Page 196
178
Table 7.6 identifies that Forestry has the „strongest‟ power and dependency
structure of the seven cases. Eighty percent of their top 20 volume suppliers
have been identified within the interdependence category. At the other end,
Food 2 and Dairy 2 face a weak power and dependency structure. Both
companies are highly dependent on their key suppliers. Further, the evaluation
of the top 20 volume suppliers surprisingly resulted into a strong independence
power and dependency structure for Dairy 2, Manufacturer 2 and Steel.
However, focusing on supplier dominance, Table 7.6 reveals that integration is
very difficult to achieve for most New Zealand businesses. Power and
dependency limits the level of integration for all companies included in this
study and has been identified as a key barrier to supplier integration. Each case
is dominated by at least three of their Top 17-26 volume suppliers. A detailed
case description for each sample organisation is presented in Appendix G.3.
In addition to the demand and supply uncertainty values identified in earlier
Chapter 5, Table 7.7 broadens the scope from a purely supplier perspective by
including the power and dependency structure on the customer side. This table
also utilises well established symbols when describing relationship
circumstances based on power and dependency (e.g. Cox, 2004; Sanderson,
2004).
Table 7.7: Summary table of individual case analysis
Supply Side Focal Company Customer Side
Supply
Uncertainty
Power
structure
Company
Name
Relationship
Mngt
Power
structure
Demand
Uncertainty
1.5 </= Food1
Mature </= 2.5
N/A > Food 2
Immature < N/A
3.5 >/= Dairy 1
Immature 0 4.0
N/A </= Dairy 2
Mature 0/= N/A
4.0 </= Forestry
Immature 0/= 2.5
2.0 </= Manuf. 2
Mature = 3.0
3.0 0/> Steel Immature 0/= 4.0
> (dominance of the supplying entity); < (dominance of the receiving entity); 0 (independence);
= (interdependence)
Source: Author
Page 197
179
Table 7.7 clearly shows that power structure has no direct influence on the supply
uncertainty scores. This is highlighted by Forestry, where the power structure on
the supplier side is very positive regarding integration and yet the supply
uncertainty score has the highest value (4.0). The supply uncertainty score is
influenced by current relationship management practises and those companies
having more mature relationship management practises managed to considerably
reduce supply and demand uncertainty. Also, companies producing commodities
for international markets suffer from a weak power and dependency structure on
the demand side.
7.6 Discussion
The results of this research clearly show that New Zealand organisations are only
weakly integrated with their suppliers. Every company in this sample was
simultaneously dominated by at least three suppliers, which considerably reduces
the chances of supplier integration. The research continuous that purchasing
volume is the key dominant variable regarding supplier dependency (Olsen &
Ellram, 1997). Further, the research showed that companies with mature supplier
relationship management and procurement practises monitor relationship
performance, especially with their top 20 dollar value suppliers. Also, employing
managers responsible for relationship management results in a better
understanding of the power and dependency structures that exist in their supply
chains (Cox, 1999, 2004), and in reduced external uncertainty.
Every company in this sample identified their key suppliers prior to the
evaluation. The number of suppliers lies between 17-28. Hence, it can be assumed
that all businesses have a strong transactional – independence portfolio of
relationships to manage. Many examples of poor and misaligned supplier
relationship management practise were identified. If this is in any way
representative of all New Zealand organisations, it is evident there exists a
considerable gap between „best practise‟ supplier relationship management theory
and its application by New Zealand practitioners (Böhme et al., 2008c). Thus,
considerable scope for improvement exists. McAdam and McCormack (2001)
Page 198
180
presented a qualitative study of the relationship between managing business
processes and managing supply chains, and found that there was little evidence of
firms actually exploiting the integration of intra- and inter- company business
processes in their supply chains. Also Zailini and Rafagopal (2005) report that
companies are still in the infancy stage when it comes to supply chain
management and the integration with customers and suppliers. Finally, Walters
(2008) reports that organisations need to adapt to the new order of business
relationships and seek to form alliances and partnerships both within and outwith
national boundaries.
The research also identified no direct link between power and dependency
structure and external integration in the form of external uncertainty. However, it
is expected that the power and dependency structure indirectly influences
integration practises. Figure 7.7 illustrates the interplay between these different
variables.
Figure 7.7: Preconditions to external integration
Source: Author
Figure 7.7 shows that the relationship management style directly impacts
external integration. Relationship managers have the possibility to implement
advanced supply chain integration practises like EDI or VMI to improve material
and information flow. This improvement will positively impact on the external
Relationship
Management
Power and
Dependency
Structure
External
Integration
External
Uncertainty
Page 199
181
uncertainty measure. However, a positive power and dependency structure can
actually support the implementation of certain integration practises. If a supplier
or customer is highly dependent on a focal company, certain integration practises
can be forced onto the external entity. However, if interdependency is present,
win-win situations need to be created that enhance material and information
flow. The link between relationship management and power and dependency
structure is shown dotted because ways have been identified to influence the
power and dependency structure. However, a shift in the relationship might not
always be feasible. The critical power and dependency variables identified in this
chapter give good guidance to the variables having the greatest leverage, when
influencing the power and dependency structure. Hence, the power and
dependency structure is viewed as a precondition for external integration. Power
(2005) and Romano (2003) also identified the importance of dependency by
stating that the recognition of the interdependence of all partners in a supply
network appears to be an important precursor to effective integration.
The power and dependency structure of key suppliers and customers needs to be
closely monitored. Movements in the market (new entrants, joint ventures, etc.)
need to be integrated in the power and dependency measure. Also, the
company‟s own purchasing behaviours (e.g. annual volume levels) need to be
reviewed. Finally, the uncertainty score in combination with the power and
dependency structure are expected to provide companies with an excellent
indicator of where major performance improvement gains are hidden. High
uncertainty indicates waste and poor performing operations. However, a positive
power and dependency structure signals that the preconditions for achieving
integration are in place; change is likely to occur fast(er) and is expected to have
a higher impact on supply chain performance.
The model and the methodology presented inevitably have limitations. Although
it is a fact that the model focuses primarily on process and manufacturing industry
purchasing of a variety of different products and services, it is judged that it could
be readily adapted for use with service, government, and not-for-profit
organisations. The five step data collection process (as described here) focuses on
Page 200
182
improving the current situation; however, some companies would also benefit
from using the process for scenario analysis during strategic planning. It is
recognised that the research setting, being New Zealand, plus the small sample
size could limit the generalisability of the findings.
7.7 Conclusion
New Zealand value streams are poorly integrated. Internally, managerial and
socio-cultural factors are the main barriers to internal supply chain integration.
This chapter has sought to gain a better understanding of how power and
dependency affects external integration. Further, the research has revealed how
strategic supply chain decision-making can be conceptually supported and has
specifically focused on power and dependency in external relationships. It has
demonstrated that there is considerable scope for improved management practises
to be applied within New Zealand organisations. The research also highlighted
that organisations tend to be only weakly integrated with their suppliers and that
power and dependency frequently limit the level of integration achieved. Some
focal organisations that are highly dependent on their key suppliers are
mismanaging the relationship. The research further revealed three ways to actively
influence the power and dependency with suppliers and thereby strengthen the
company‟s own position. In cases where the power and dependency structure
cannot easily be influenced, companies often apply socialisation tactics to make a
weak situation bearable.
This study contributes to theory by uniquely measuring power and dependency
in buyer supplier relationships. The five step power and dependency evaluation
process developed was very valuable when measuring dependencies in
buyer/supplier relationships. Further, insights into the power and dependency
structure of New Zealand business have been provided. Finally, the role that
power and dependency play in external integration has been identified. A
positive power and dependency structure has been identified as a precondition to
achieve external integration.
Page 201
183
Notwithstanding its contribution, this study has focused on the New Zealand
situation. The question remains; How well are others externally integrated? Are
they too being highly dominated by their suppliers? Based on the power and
dependency considerations discussed here, is supply chain integration a feasible
option for every company? Further research in New Zealand and elsewhere is
needed, both to generalise the developed purchasing portfolio model, and to
comment more generally on power and dependency between organisations and
the influence on external integration.
In the next chapter, the pathways that New Zealand companies have taken to
further integrate their supply chain is presented.
Page 202
184
8. Achieving Supply Chain Integration in Practise
8.1 Introduction
The first findings chapter, Chapter 5, identified that New Zealand value streams
are weakly integrated. Because the removal of barriers between and within
organisations is critical for integrating the supply chain (e.g. Gimenez, 2004;
Romano, 2003), Chapter 6 investigated internal barriers to supply chain
integration and Chapter 7 investigated external barriers to supply chain
integration. In order to address the overarching research question “how do
companies achieve supply chain integration in practise”, this chapter aims to
identify the pathways to supply chain integration. It also outlines the change
processes undertaken by New Zealand companies and the consequent impact on
the identified barriers to supply chain integration.
To answer the overarching research question, preconditions to supply chain
integration are identified with the aid of a literature review plus findings from four
longitudinal case studies. The impact of the change process on supply chain
integration is assessed using: (a) the supply chain uncertainty circle (see Figure
5.1); (b) the developed supply chain integration evaluation tool (see Chapter
2.11.3); and, (c) the identified barriers to supply chain integration (see Chapter 6).
Hence, Chapter 8 synthesises all the previous research findings, bringing together
all the assessment tools and insights to show how supply chain integration is
actually achieved in practise. The supply chain uncertainty scores are used to
Research Question: How do
companies achieve supply chain
integrate in practice?
Understand
and document
current supply
chain practises
Evaluate supply
chain integration
maturity.
Identify internal
barriers to
supply chain
integration
Evaluate
external barriers
to supply chain
integration
Current Status Barriers Pathways
Achieving
supply chain
integration in
practise
Page 203
185
assess whether a focal company has managed to reduce supply chain uncertainty
and hence has further integrated its supply chain. The developed integration
evaluation tool highlights the focus area of supply chain integration efforts and
measures supply chain performance improvements. The supply chain integration
model developed in Chapter 5 is also further validated. First, a literature review is
presented, followed by a detailed description of each case study. A cross-case
analysis is then undertaken to highlight differences and similarities between the
supply chain integration attempts.
8.2 Pathways to supply chain integration
Narasimhan and Kim (2001) note that much of the research on integration has
been predicated on the assumption that integration occurs in distinct stages.
Possibly the most influential work regarding a stage process towards supply chain
integration is by Stevens (1989) (see also Figure 2.3). He suggests that companies
follow an integration process that goes through different stages by first integrating
internally and then extending the integration process externally to other supply
chain members. Empirical evidence (Towill et al., 2000; Koufteros et al., 2005)
and case study research (Gimenez, 2004) support the conceptual model developed
by Stevens.
Bowersox & Daugherty (1995), Hewitt (1994) and Gimenez (2004) also
emphasize that the improvement of each internal function should precede the
external connection with suppliers and customers in the external integration stage.
However, Gimenez‟s (2004) qualitative study identified one exemplar that did not
follow Stevens (1989) integration model. Also, Halldorsson et al. (2008) report
that managers seem to achieve more successful integration with external business
partners than they do with managers and departments within their own company.
Finally, Chapter 5 identified further cases that did not follow Stevens‟ conceptual
integration model. Hence, Chapter 5 proposed a four stage integration model with
six distinct pathways to the seamless supply chain. Figure 8.1 presents the
proposed supply chain integration model from Chapter 5.
Page 204
186
Figure 8.1: Proposed supply chain integration model (see also Figure 5.11)
Source: Author
At the top of Figure 8.1 is the non-integrated supply chain stage. Companies that
are at this non-integrated stage may choose to integrate internally or externally
(with customers or suppliers) first. Once the first integration stage is achieved, the
remaining integration areas are tackled until the seamless supply chain is
achieved. The question remains, why does a company take a certain path to
integrate its supply chain? Next, the key enablers for supply chain integration are
identified.
8.2.1 Key enablers for supply chain integration
Halldorsson et al. (2008) provide an extensive list of identified supply chain
integration enablers. However, the latest research shows that not all enablers are
equally important. Halldorsson et al. (2008), Hammer (1990), Pagell (2004) and
Story et al. (2005) identified top management support as the key enabler for
internal supply chain integration and other types of major change efforts. These
authors also agree that technology solutions to supply chain integration are of
lesser importance and value. Chapter 7, Cox (2001) and van der Vaart & van
Donk (2004) identified that a positive power and dependency structure
(interdependence and/ or supplier dependency) is a key enabler for external
integration. Resulting from the latest research on enablers for supply chain
integration, the following conceptual model has been developed; Figure 8.2
highlights the preconditions to achieving a fully integrated, seamless supply chain.
Non-integrated supply chain
Internal integration Customer integrationSupplier integration
Supplier
integration
Customer
integration
Internal
integration
Supplier
integration
Internal
integration
Customer
integration
Customer
integration
Supplier
integration
Supplier
integration
Internal
integration
Customer
integration
Internal
integration
Seamless
Supply chain
Page 205
187
Figure 8.2: Preconditions to achieving a fully integrated, seamless supply chain
Source: Based on Böhme et al., 2008c; Cox, 2001; Pagell, 2004; Storey et al.,
2005; van der Vaart & van Donk, 2004
Top management support is expected to have a major impact on internal
integration. However, the power and dependency structure is key to enabling
external integration, especially if both parties equally depend on each other or the
power is held by the focal organisation. Romano (2003) also concluded that the
focal company‟s power position in the supply chain influences supply chain
integration. The status of these three preconditions to supply chain integration is
expected to have a major influence on the path a focal company takes to further
integrate its supply chain. Consider for example, if a company lacks top
management support for internal integration but dominates or is independent of its
external entities; this company is expected to integrate externally first, before
then integrating internally.
8.3 Method for investigating the pathways to integration
Four longitudinal studies were undertaken using Manufacturer 2, Forestry, Dairy
1 and Food 1. The longitudinal studies followed a structured approach; first, the
supply chain status was re-evaluated using the same quantitative questionnaires,
and for the same value streams previously investigated by the earlier Quick Scan,
including the supply chain uncertainty analysis (see also Appendix C). Second, by
predominantly interviewing staff members, the researcher gained an overview of
Top Management
Support
Internal IntegrationSupplier
Integration
Customer
Integration
>/=</=
+
_+ (Top Management Support)
(Lack of Top Management Support)
< (Dominance of receiving entity)
> (Dominance of supplying entity)
= (Interdependence)
0 (Independence)
Page 206
188
the change process before evaluating the change process. In a final step, the
findings were presented to management and staff to gain consent. A detailed
methodological description is highlighted in Chapter 4.8.1.9 and Table 8.1
presents the dates of the Quick Scan and the follow up study for each of the four
cases.
Table 8.1: Time overview of case studies for longitudinal data
Company Quick Scan Follow up Timeframe (months)
Manufacturer 2 December, 2006 March, 2008 16
Forestry March, 2006 April, 2008 25
Dairy 1 January, 2004 December, 2006 35
Food 1 May, 2006 May, 2008 24
Source: Author
The longest timeframe between Quick Scan and follow up study was almost three
years, with Dairy 1. Forestry and Food 1 cover a timeframe of approximately two
years, whereas Manufacturer 2 covers only 16 months. The average time between
the initial Quick Scan and the follow up case study is some 25 months. As many
longitudinal case studies within the supply chain management discipline are
conducted using timeframes of between one and four years (e.g. Harland et al.,
2007; Holland, 1995; Leonard-Barton, 1989), the timeframe chosen to answer the
research question is in line with other longitudinal case studies. Quantitative
studies tend to encompass longer timeframes (e.g. Johnson & Leenders, 2008;
Lorenzoni & Lipparini, 1999).
The uncertainty data was used to evaluate the conceptual model in Figure 8.1.,
which highlights three distinct areas for uncertainty reduction, and hence for
supply chain integration, exist. In essence, a focal company can concentrate its
efforts internally, thereby focusing on control and process uncertainty, or
externally by focusing on supply or demand uncertainty reduction. Each of the
three uncertainty areas were evaluated during the initial Quick Scan and a second
time during the follow up case study. Table 8.2 presents these three distinct areas
of uncertainty.
Page 207
189
Table 8.2: Assessing the path to supply chain integration
Internal
uncertainty
Demand
uncertainty
Supply
uncertainty
Outcome
High
High High No integration
Low Supplier integration
Low High Customer integration
Low External integration only
Low
High High Internal integration only
Low Internal + supply integration
Low High Internal + customer integration
Low Seamless supply chain
Source: Author
The research applied a 4-point Likert scale, which anchors 1=lowest uncertainty
and 4=highest uncertainty. For simplicity, values of 1 and 2 were taken to
represent low uncertainty; and 3 and 4 were taken to represent high uncertainty.
Hence, Table 8.2 highlights that a focal company can be placed into one of eight
possible outcomes. If a company faces high uncertainty in all of internal, demand
and supply uncertainty no integration is present. Conversely, if a company faces
low uncertainty in all these areas, the supply chain is seamless. The intervening
six stages present uncertainty reduction for one or two uncertainty areas, and are
named accordingly.
The supply chain integration evaluation tool (see Chapter 2.11.3), which was
verified in Chapter 5, was applied during the initial Quick Scan and follow up
case studies. Key personnel were interviewed to identify the current state of each
of the 22 characteristics and the average score for each category was calculated
for both data collection points. The individual company scores for each identified
characteristic for each data collection point can be found in Appendix H.
Finally, the impact of the change process on the barriers to supply chain
integration is highlighted using the research findings from Chapter 6. The detailed
description of each case helped to identify which barriers were reduced or
overcome by the focal company. Next, each change process is presented in detail.
Page 208
190
8.4 Individual longitudinal case study findings
8.4.1 Manufacturer 2: Change process
A Quick Scan was conducted in December 2006. The research identified an
absence of the necessary preconditions for achieving a seamless supply chain.
Figure 8.3 presents these preconditions, and shows that Manufacturer 2 has strong
top management support, which supports a drive to change internally.
Figure 8.3: Preconditions for achieving a seamless supply chain: Manufacturer 2
Source: Author
Further, the external power and dependency structure is positive. Many suppliers
are interdependent to or dominated by Manufacturer 2 and most of the customers
belong to the wider corporate, hence interdependency is present. Therefore, the
initial QSAM in 2006 identified Manufacturer 2 as possessing all the
preconditions necessary to achieve a seamless supply chain.
The first change initiative occurred within days of the Quick Scan. Manufacturer 2
introduced a daily production meeting to better control and coordinate its
operations. Manufacturer 2 also decided to hire a business process re-engineer to
improve productivity on site. The re-engineering of the different shop floors
followed closely the UDSO (Understand, Document, Simplify, Optimise) method
(Watson, 1994) explained in Chapter 4.8.1.2. Table 8.3 presents an overview of
the change process and how it is related to the UDSO method.
Top Management
Support
Internal IntegrationSupplier
Integration
Customer
Integration
=</=
+
Page 209
191
Table 8.3: Overview of the change activity for Manufacturer 2
Step Activity
1) 1. Stabilise Stabilisation of production
2) 2. Understand Analysis of production
Implementation of additional operational measures
3) 3. Document Documentation of current practises
Increase in production reporting
4) 4. Simplify Up-skilling and empowerment of staff members
Increase in visibility of production
Implementation of two-bin system
5) 5. Optimise Kanban on shop floor (infancy stage)
E-Kanban with key supplier
Upgrade of technology
Source: Author
Before analysing current operational practise, the business process reengineer
needed to stabilise the production. The analysis stage required additional
operational measures focusing on effectiveness as well as efficiency. Once the
operational measures were in place, visibility of production was increased. The
simplification of production followed. Key to the simplification step was the up-
skilling and empowerment of current staff members. The staff members were
trained to identify improvement opportunities. On the shop floor, a two bin system
was introduced, to lead to a Kanban system for the entire plant in the optimisation
stage. Also, each shop floor must deliver a progress report on a daily basis. The
planning office functions as a central information hub where information is
collected and processed. In fall 2007, major changes in the shop floor layout were
introduced with the aim of reducing double handling and avoiding unnecessary
movement between different workshops. Also, an E-Kanban system was
implemented with the main steel supplier aimed at optimising raw material stock
levels. Finally, the outdated ERP system, which captures only financial and
accounting information is planned to have a MRPII function as well as an
enhanced planning tool and reporting features.
Within the first ten months, a cultural shift was achieved using a communication
platform. This was developed to improve the information flow and to move the
organisation away from a blaming culture (Pagell, 2004). This platform was
Page 210
192
further extended to the management level. In the first half of 2008, major changes
to the reward system on the shop floor occurred. Staff are now rewarded for
DIFOTIS (delivery in full on time in required specification), attendance, and
health and safety. Especially, DIFOTIS is expected to cross-link each shop floor
and bridge the functional silo mentality. In total, three supply chain management
professionals have been hired.
Figure 8.4 summarises the impact of the change process on the
internal/environmental barriers.
Figure 8.4: Longitudinal internal barrier assessment: Manufacturer 2
Source: Author
Figure 8.4 clearly shows that Manufacturer 2 has managed to reduce
internal/environmental barriers to supply chain integration on a culture and
organisation level. In short, Manufacturer 2‟s change programme is strongly
anchored in the culture and attitude of the people working at the plant.
Externally, the remaining barrier for Manufacturer 2 is on the customer side.
Manufacturer 2 requires top management (headquarter) support to be able to
overcome this barrier because most customers are internal and belong to the wider
corporate.
The integration evaluation tool was applied during the QSAM and the follow up
study, so that major improvement areas in the area of supply chain integration
Environment
Value Stream
Culture
Technology
Finance
Organisation
Co
mp
any
2006 2008
Medium Medium
Medium
Medium
Medium
Medium
Low
High
Medium
Medium
High
Low
Page 211
193
might be identified. Figure 8.5 presents the outcome of the application of the
integration evaluation tool.
Figure 8.5: Integration assessment: Manufacturer 2
Source: Author
Figure 8.5 clearly shows that the changes have greatly impacted on integrating
people working at the plant. The development of cross-functional KPIs and a
strong team focus to reinforce the culture and attitude are responsible for the
strong improvement in the people/culture category. The implementation of visual
management and better relationships between individuals has helped to improve
information-sharing. However, the initiated upgrade of the information system
was not in place at the second point of data collection, hence has not apparently
improved the information system category yet.
Figure 8.6 presents the supply chain performance improvements for Manufacturer
2.
1.00
2.00
3.00
4.00
Information
sharing
Relationship
Management
Information
system
People /
Culture
Quick Scan
Follow up
No integration
Functional
integration
Reactive
supply chain
Seamless
supply chain
Page 212
194
Figure 8.6: Supply chain performance improvement: Manufacturer 2
Source: Author
The changes implemented by Manufacturer 2 have resulted in positive effects on
all four performance measures. Over the last 16 months changes have resulted in a
decrease of steel scrap (from 45% scrap down to 18%) and an increase of machine
utilisation. Further, the production lead-time has been reduced from five weeks to
two weeks, which has resulted in a 100% increase of plant output. Also, the work
in progress has been reduced by 240%. The visual management style and the
implementation of a new working culture have improved the information flow in
the plant. Finally, the change has positively influenced supply chain uncertainty.
Figure 8.7 presents the improved supply chain uncertainty situation.
Figure 8.7: Supply chain uncertainty improvement: Manufacturer 2
Source: Author
P
C
S
DQuick Scan
Follow up
Process
ControlDemand
Supply
1.00
2.00
3.00
4.00
Physical
Flow
Inventory Lead times Information
flow
Quick Scan
Follow up
No integration
Functional
integration
Reactive
supply chain
Seamless
supply chain
Page 213
195
Figure 8.7 highlights that Manufacturer 2 has managed to reduce internal
uncertainty in the form of process and control uncertainty only with greater gains
for control uncertainty because the process side initiatives were only recently
implemented.
8.4.2 Forestry: Change process
A Quick Scan was conducted in March 2006. The research identified an absence
of the necessary preconditions in many areas for achieving a seamless supply
chain. Figure 8.8 presents those preconditions and highlights that Forestry lacks
top management support to further enhance internal integration.
Figure 8.8: Preconditions for achieving a seamless supply chain: Forestry
Source: Author
Also the power and dependency structure on the customer side is rather negative.
Many commodities are sold to unknown customers to a market price.
Interdependency exists only with the New Zealand-based customers and
customers that are part of the wider corporate. However, focusing on the supplier
side, Forestry has a positive power and dependency structure.
Soon after the Quick Scan was conducted, Forestry suffered major staff turnover
within the supply chain management department; hence, the first three months
were occupied with integrating new staff members. In the second half of 2006 a
crucial decision was made to combine the management of four closely located
pulp, paper and packing plants, rather than operate them as individual business
units. The supply chain manager now became responsible for four separate plants
consisting of three different value streams, and increasing complexity from a
Top Management
Support
Internal IntegrationSupplier
Integration
Customer
Integration
0/=</=
__
Page 214
196
management perspective. However, it also created opportunities in terms of
potential purchasing power and synergy effects between the plants. A highly
experienced national procurement manager was hired towards the end of 2006 and
it was decided to implement a track and trace system for the make-to-order value
stream (Bagchi & Skjoett-Larsen, 2002). This new information system allows
customers to track their orders online.
In the first half of 2007, the supply chain manager introduced staff training in the
areas of supply chain management and procurement. Also, the outbound logistics
side was process mapped and the material and information flow further improved.
Finally, an intranet web page was intended to centralise all supply chain relevant
information. This increases cross-functional visibility and makes sure that only
one version of the required information is used for decision-making (Fawcett &
Magnan, 2002).
In June 2007, the national procurement manager started to consolidate the supplier
base by establishing a preferred vendor list. The latest project started in February
2008, aimed at standardising the sales and operational planning process for all
four plants, including aggregate planning and weekly allocation meetings for the
sales and marketing team (Bagchi & Skjoett-Larsen, 2002). Table 8.9 presents
Forestry‟s barriers to supply chain integration and highlights the impact of the
change process on those barriers.
Figure 8.9: Longitudinal internal barrier assessment: Forestry
Source: Author
Environment
Value Stream
Culture
Technology
Finance
Organisation
Co
mp
any
2006 2008
High High
High
Medium
High
High
Low
High
High
High
High
Low
Page 215
197
Forestry has not fully addressed even one internal barrier to supply chain
integration. Instead, the supply chain team implemented solutions affecting just
their own departments. For example although, a cultural shift has occurred within
the supply chain management team, functional silos on the shop floor and other
parts of the management team remain. The only barrier that has been lowered is
on the technology side; the intranet website strongly supports cross functional
visibility. Because a wider implementation across different functions is not
supported by the top management, the key remaining barrier for Forestry is the
lack of top management support.
Figure 8.10 presents the supply chain performance improved for Forestry.
Figure 8.10: Integration assessment: Forestry
Source: Author
Figure 8.10 shows that the changes here mainly impacted information sharing and
relationship management. Minor integrational changes have occurred within
category information system. The implementation of the extranet has resulted in
an increase of operational data sharing as well as data visibility. Further, the
employment of a new national procurement manager supports the integration of
key suppliers. This manager has also impacted the relationship management
category by enhancing VMI practises with key suppliers. Further, a track and
trace system for outbound logistics has been implemented.
1.00
2.00
3.00
4.00
Information
sharing
Relationship
Management
Information
system
People /
Culture
Quick Scan
Follow up
No integration
Functional
integration
Reactive
supply chain
Seamless
supply chain
Page 216
198
The implementation of the changes has resulted in the supply chain performance
improvements highlighted in Figure 8.11, which shows that major improvements
have occurred within the information flow category and minor improvements on
the physical flow (focusing on outbound logistics only).
Figure 8.11: Supply chain performance improvement: Forestry
Source: Author
Forestry focused predominantly on low cost improvement opportunities, thereby
limiting necessary long term strategic changes. All the changes implemented so
far have had only a very minor impact on overall stock levels (raw material and
finished goods) and no impact on production and/or customer lead time. Hence,
the implemented change has had only minor influences on supply chain
uncertainty. Figure 8.12 presents the positive outcome regarding supply chain
uncertainty, and highlights that Forestry has managed to reduce uncertainty on the
supply side and the control side.
1.00
2.00
3.00
4.00
Physical
Flow
Inventory Lead times Information
flow
Quick Scan
Follow up
No integration
Functional
integration
Reactive
supply chain
Seamless
supply chain
Page 217
199
Figure 8.12: Supply chain uncertainty improvement: Forestry
Source: Author
The implemented intranet webpage impacts positively on control uncertainty and
the newly hired national procurement manager has already taken uncertainty out
of the supply side by reducing the supplier base and identifying key suppliers.
8.4.3 Dairy 1: Change process
A Quick Scan was conducted in January 2004. The research identified an absence
of the necessary preconditions in most areas for achieving a seamless supply
chain. Figure 8.8 presents those preconditions, and indicates that Dairy 1 has top
management support to further enhance internal integration.
Figure 8.13: Preconditions for achieving a seamless supply chain: Dairy 1
Source: Author
Dairy 1 operates with a weak external power and dependency structure. Most
commodity products are sold to market price, hence many independencies are
P
C
S
DQuick Scan
Follow up
Process
ControlDemand
Supply
Top Management
Support
Internal IntegrationSupplier
Integration
Customer
Integration
0≥
+
Page 218
200
present. Also, the company suffers from under supplier dominated relationships.
Only a few interdependencies have been identified.
Six months after the Quick Scan, a new CEO was appointed. The new CEO has a
strong Marketing background and gained experience on the board of directors for
one of New Zealand‟s leading dairy companies. One of his first actions was to
restructuring the business and flatten its structure (Harrington, 1995). Further, to
overcome the geographical dispersion of sales/marketing and production,
fortnightly sales and operational planning meetings were introduced and the
information flow improved.
In the second half of 2004, the new CEO established a customer focused vision
statement and aligned the company strategy accordingly (Peck & Juttner, 2000).
Dairy 1 also appointed a procurement manager. To gain better control of
procurement spending, all process managers and most management staff were
deprived of procurement accreditation. Stronger links to key suppliers were
developed, including three vendor managed inventory agreements.
In early 2005, cross-functional staff training through staff rotation was introduced.
The staff rotation increased awareness and understanding for others‟ tasks, and
staff flexibility (Pagell, 2004). In mid-2005, Dairy 1 introduced new operational
measures focused on efficiency as well as effectiveness. Also the visibility of the
supply chain related data was increased via more formal and informal cross-
functional meetings (Bagchi & Skjoett-Larsen, 2002). Key supply chain data is
displayed and made accessible. Dairy 1 also implemented a new outbound
information system that is capable of measuring desired stock levels.
In late 2005, Dairy 1 introduced a new value stream to the business, when a new
onsite production facility was set up to produce a variety of protein products. The
maintenance department was centralised. Aside from synergy effects, a reduction
in maintenance stocks and increase in maintenance stock turn has been achieved.
Page 219
201
One of the final improvements focused on the strategic element of supply chain
management. The old operational strategy was one of „make to stock‟ for the
entire product range. Now, high volume low margin products continue to be made
to stock; however, low volume high profit margin products are made to order
(Aitken et al., 2005).
Figure 8.14 presents summarises the impact of the change process on the internal
barriers to supply chain integration.
Figure 8.14: Longitudinal internal barrier assessment: Dairy 1
Source: Author
Although the environment barrier and value stream barrier remain high the
coordination of the different value streams has improved due to the increased
complexity of a new value stream as well as an increased product mix. The
change at the company level is closely linked with the newly appointed CEO, who
restructured the business and developed a company strategy to give employees a
shared direction. Hence, the organization category barrier reduced from a high to
a medium barrier. The restructuring of the business positively affected the
company culture.
Figure 8.15 presents the effects of the changes on supply chain integration.
Environment
Value Stream
Culture
Technology
Finance
Organisation
Co
mp
any
2006 2008
High High
Medium
High
Low
Medium
High
High
High
Low
High
High
Page 220
202
Figure 8.15: Integration assessment: Dairy 1
Source: Author
The appointment of the new CEO, and his restructuring of the business, had a
major impact on the people/culture category. The procurement manager
implemented vendor managed inventory agreements, which positively impacted
the relationship management category. Further, job rotation and visual display of
key operational data increased integration in the information sharing category.
Finally, the new outbound logistics software positively impacted the information
system category.
Figure 8.16 presents the supply chain performance improvement of Dairy 1 over
the three year period.
Figure 8.16: Supply chain performance improvement: Dairy 1
Source: Author
1.00
2.00
3.00
4.00
Information
sharing
Relationship
Management
Information
system
People /
Culture
Quick Scan
Follow up
No integration
Functional
integration
Reactive
supply chain
Seamless
supply chain
1.00
2.00
3.00
4.00
Physical
Flow
Inventory Lead times Information
flow
Quick Scan
Follow up
No integration
Functional
integration
Reactive
supply chain
Seamless
supply chain
Page 221
203
Information flow is the only performance improvement area; due to the fortnightly
sales and operational planning process that, improved data sharing. The
appointment of the procurement manager resulted in only a marginal reduction of
supplier lead-time. Also, the reduction of the maintenance warehouse did not
impact the inventory category; because the inventory level was previously judged
to below except at company boundaries for both of their value streams. Hence, the
inventory category has not improved. Figure 8.17 shows the impact of the
changes on supply chain uncertainty.
Figure 8.17: Supply chain uncertainty improvement: Dairy 1
Source: Author
Dairy 1‟s processes are highly automated, hence process uncertainty is minimised.
Most improvement appeared on the demand side; the newly introduced supply
chain strategies for the different value streams allow the business to take
uncertainty out of the demand side. Further, the additional value stream allows for
better customer integration because low volume products are now sold to key
customers. Also, the new procurement manager improved some major supplier
integrations. Finally, uncertainty on the control side was reduced by restructuring
the business, thereby leading to increased visibility.
P
C
S
DQuick Scan
Follow up
Process
ControlDemand
Supply
Page 222
204
8.4.4 Food 1: Change process
A Quick Scan was conducted in May 2006. The research identified mostly an
absence of the necessary preconditions for achieving a seamless supply chain.
Figure 8.18 presents those preconditions.
Figure 8.18: Preconditions for achieving a seamless supply chain: Food 1
Source: Author
Food 1 has a weak power and dependency structure on the customer side. Many
large retailers dominate the relationship. Interdependency is present only with
customers belonging to the wider corporate. Further, the research identified a lack
of top management support to optimise processes internally. However, a strong
power and dependency structure is present on the supplier side.
The research revealed two major change areas. Early in 2007, Food 1
implemented a new S&OP software solution that is integrated with the current
ERP system (Bagchi & Skjoett-Larsen, 2002). Food 1 implemented three major
modules of the S&OP software; the first is an outbound logistics scheduling tool,
which enables the company to schedule production towards the shipping schedule,
hence reducing customer lead time. The second module is an aggregate planning
tool, which allows production planning for 12 months in advance and breaks
down the aggregate plan into monthly and weekly production plans. The software
also takes changeover and inventory cost into account, hence striving for
operational cost optimisation. The final module is a sequencing module that
supports the daily production scheduling.
Top Management
Support
Internal IntegrationSupplier
Integration
Customer
Integration
__
≤ ≤
Page 223
205
In June 2006, a new logistics manager was appointed. The newly appointed
manager further enhanced the relationship with the third party logistics provider,
updated the warehouse management systems, upskilled and empowered
warehouse management staff, and restructured the information flows.
Figure 8.19 presents the impact of these changes on the internal and
environmental barriers to supply chain integration.
Figure 8.19: Longitudinal internal barrier assessment: Food 1
Source: Author
Due to the high production complexity, Food 1 concentrated on improving the
sales and operational planning by implementing new software and thereby
weakened the technology barrier. However, many of the issues that cause
functional silos such as organisational structure and reward system, have not been
addressed. Hence, the key remaining barrier for Food 1 is on the organisation
level.
Next, the outcome of the application of the supply chain integration assessment
tool is presented and Figure 8.20 visualises the outcome for the four identified
categories.
Environment
Value Stream
Culture
Technology
Finance
Organisation
Co
mp
any
2006 2008
Low Low
Medium
Medium
Low
High
Medium
Medium
High
Low
High
Medium
Page 224
206
Figure 8.20: Integration assessment: Food 1
Source: Author
Figure 8.7 highlights that most of the changes implemented by Food 1 have had
only marginal impact on supply chain integration. The newly appointed logistics
manager developed stronger relationships with key customers, including using
vendor managed inventory agreements; which positively affected the relationship
management category. However, the people category remains at the level of
functional integration.
Figure 8.21 presents the supply chain performance outcome of the change process.
Figure 8.21: Supply chain performance improvement: Food 1
Source: Author
1.00
2.00
3.00
4.00
Information
sharing
Relationship
Management
Information
system
People /
Culture
Quick Scan
Follow up
No integration
Functional
integration
Reactive
supply chain
Seamless
supply chain
1.00
2.00
3.00
4.00
Physical
Flow
Inventory Lead times Information
flow
Quick Scan
Follow up
No integration
Functional
integration
Reactive
supply chain
Seamless
supply chain
Page 225
207
Figure 8.21 shows that the change process has positively impacted on three
performance attributes. The upgrade of the warehouse management system and
the sales and operational planning software improved the information flow. Also,
better co-ordination with key customers resulted in an improved physical flow and
a reduction in order lead time.
Figure 8.22 presents the impact of the change programme on supply chain
uncertainty.
Figure 8.22: Supply chain uncertainty improvement: Food 1
Source: Author
Uncertainty reduction only occurred on the demand side. The main reasons are the
vendor managed inventory agreements and improved customer relationships. The
new S&OP software is expected to reduce control uncertainty; however, at the
time of data collection the software was not fully implemented.
The next section discusses the cross-case analysis.
8.5 Cross-Case Analysis
The cross-case analysis focuses on three distinct areas. First, the change process
of the four case companies is compared to identify common patterns among the
cases. Second, the developed supply chain integration evaluation tool examines
which category received the highest attention and the outcome of those changes
P
C
S
DQuick Scan
Follow up
Process
ControlDemand
Supply
Page 226
208
for supply chain performance. Finally, the impact of the change process on the
uncertainty score is presented.
8.5.1 Cross-case analysis of supply chain change processes
The first section places emphasis on the common patterns among the four case
companies when addressing certain supply chain integration issues. Here, Evans
et al.‟s (1995) parallel assessment between business process reengineering and
supply chain management is used to highlight a focal company‟s sequencing of
the area of change (see also Table 2.10).
Table 8.4 presents the outcome of the cross-case analysis. The first column
presents the area of change, the second column a description of the terminology.
The remaining columns highlight each case company and the order in which each
supply chain change areas were addressed.
Table 8.4: Similarities within the four change processes
Sequence of Events
Area for
change
Terminology Manuf 2 Forestry Dairy 1 Food 1
People Board level commitment
A management that questions
A work force that questions
Multi-skilled work force
Attitudinal changes
1st 1st 1st 1st
Relationship
Management /
Innovation
Supplier relationship
management
Customer focus
Constant innovation at the
interfaces of the company
Constant product / process
innovation
3rd 2nd 2nd 2nd
Process Elimination of waste around the
cores processes
Speed up core processes
Concentration on core processes
2nd - 3rd -
Technology Technology change
IT-a key to SCM
4th 3rd - 3rd
Source: Based on Evans et al., 1995
Table 8.4 highlights that all four companies invested effort into people first. Often
the upskilled and/or newly hired staff had a positive effect on the working culture
Page 227
209
and attitude within the function and/or entire company. In a second step,
companies tend to improve supplier/customer relationship management or internal
process. Many newly hired people were supply chain specialists. Once the new
staff has been inducted, they addressed relationship related issues or improved
internal core processes. However, only as the final step did all companies focus on
improving or upgrading their current technology.
The impact of the changes on supply chain integration is presented in section
8.5.2.
8.5.2 Assessing the affects of change via the integration evaluation tool
All four companies implemented new supply chain management practises.
However, each company also had different emphases regarding supply chain
integration. Figure 8.23 presents the overall supply chain integration
improvements across the four cases using the developed integration evaluation
tool.
Figure 8.23: Integration assessment across the four cases
Source: Author
Figure 8.23 highlights that, previously, all categories were either at or
approaching functional integration. Currently, all four categories have passed the
functional integration stage and are progressing towards the reactive supply chain.
The categories showing the biggest gains over the 25 month average period are
1.00
2.00
3.00
4.00
Information
sharing
Relationship
Management
Information
system
People /
Culture
Quick Scan
Follow up
No integration
Functional
integration
Reactive
supply chain
Seamless
supply chain
Ø time = 25 month
Page 228
210
relationship management and people/culture. Improvements in the relationship
management category are predominantly related to better relationship
management styles and an increase in numbers of vendor managed inventory
agreements. The people category gained from the upgrade and upskilling of staff
with supply chain management knowledge, as well as an improvement in the
culture and attitude in the work place.
The two categories showing least improvements are information sharing and
information system. In many cases, although operational data was centralised and
made available across functions and the visibility of data increased, the
investments in an improved information system were minor.
Figure 8.24 highlights the overall supply chain performance improvement from
the four cases.
Figure 8.24: Supply chain performance improvement across the four cases
Source: Author
Process improvement over some 25 months improved all four performance
categories. The two areas with the greatest performance gains are lead times and
information flow, which were also the areas that performed most poorly during
the initial Quick Scan. The superior performance of the inventory category is
predominantly related to the process industry, where work in progress inventory is
almost non-existent (due to high production automation).
1.00
2.00
3.00
4.00
Physical
Flow
Inventory Lead times Information
flow
Quick Scan
Follow up
No integration
Functional
integration
Reactive
supply chain
Seamless
supply chain
Page 229
211
It is evident that companies face different integration barriers and address those
barriers differently, hence, the pathways to supply chain integration are next
described on a more holistic level using uncertainty data. The impact of the
changes on supply chain uncertainty for the four case study companies is
presented next.
8.5.3 Assessing the affects of change using the uncertainty circle
The detailed case description revealed that uncertainty was reduced in all four
case companies. Figure 8.25 presents this uncertainty reduction for the four case
companies representing a total of nine value streams.
Figure 8.25: Uncertainty reduction
Source: Author
Figure 8.25 shows, with the exception of value stream seven, the uncertainty
associated with all value streams has been reduced. Companies implemented
many good practises resulting in internal and/or external value stream integration.
Figure 8.25 shows that many value streams have progressed towards the half-way
Food 1
34
Half-Way
Mark
Much good practice Exemplars
34
Dairy 1
Forestry
Manufacturer 2
Supply Chain Integration SeamlessNon-integrated
1011
Much good practice Exemplars
1011
56
Much good practice Exemplars
56
789
Much good practice Exemplars
89
Page 230
212
mark. Two value streams actually crossed the half-way mark; one belongs to
Forestry (6) and the other to Food 1 (8). Further, Forestry (6) and Dairy 1 (4)
achieved the largest uncertainty reduction. The most advanced supply chain
integration practises were adopted by Food 1, with all three value streams falling
within the „much good practise‟ category. They were also benchmarked the
highest for supply chain integration. Additionally, only Forestry managed to
improve one of its value streams (6) into the „much good practise‟ category.
Minor gains were achieved by value streams 8, 9, and 10. Further, the research
revealed no exemplars and no seamless supply chains in the sample. A reasonable
amount of uncertainty remains in all value streams.
Applying the uncertainty data to Table 8.2 allows the researcher to map the
current stage of each value stream on the developed conceptual model in Figure
8.1. Figure 8.26 has been slightly amended from the original conceptual model
shown in Figure 8.1. The reason lies with the measurement process. Consider
value stream 7, for example, which experienced considerably reduced supplier
and customer uncertainty. Also, while the process uncertainty was reduced to a
minimum, medium to high control uncertainty remains. Calculation of the
Euclidean norm results in a low-medium value of internal uncertainty. However,
value stream 7 still needs to implement many improvements on the control side in
order to become truly seamless. Thus for any value stream that only reduces
uncertainty to low-medium levels uncertainty remains, and the value stream is not
truly seamless. Thus a new, seamless supply chain stage has been added at the
bottom of Figure 8.26.
Page 231
213
Figure 8.26: Validation of proposed integration model
Source: Author
The value streams of the four case companies are at various stages on their
individual pathway to supply chain integration and have chosen various routes to
achieve the seamless supply chain. Dairy 1 has reduced uncertainty but still faces
high uncertainty in all three areas. Hence, both value streams (3, 4) remain in the
non-integrated supply chain stage. Manufacturer 2 has reduced supplier
uncertainty in the past and therefore is placed in the supplier integration stage.
Currently, Manufacturer 2 is reducing internal uncertainty; however, internal
uncertainty remains high. Further, all of Food 1‟s value streams integrated with
their suppliers in the past. However, from the supplier integration stage, value
stream seven took a different route than the remaining two value streams eight and
nine. Value stream seven is one of Food 1‟s high volume products and the
company place high emphasis on reducing process uncertainty to a minimum.
Hence, internal integration was achieved before recently reducing demand
uncertainty. However, control uncertainty remains medium-high. Therefore, Food
1 still needs to put a lot of effort to achieve the seamless supply chain stage for
value stream seven. Internal uncertainty (process and control) remains medium-
high for value stream eight and nine. Hence, Food 1 managed to achieve external
Non-integrated supply chain
Internal integration Customer integrationSupplier integration
Supplier
integration
Customer
integration
Internal
integration
Supplier
integration
Internal
integration
Customer
integration
Customer
integration
Supplier
integration
Supplier
integration
Internal
integration
Customer
integration
Internal
integration
4
Food 1 (7 & 8 & 9)Dairy 1 (3 & 4) Forestry (5 & 6) Manufacturer 2 (10 &11)
3
109
5
68
7
11
98
5
6
Seamless supply chain
7
Page 232
214
integration with customers and suppliers before integrating internally. Finally,
Forestry‟s value streams predominantly reduced internal uncertainty.
Value stream five moved from the non-integrated supply chain stage to the
internal integration stage. Therefore, value stream five is currently the only value
stream that follows Stevens‟ (1989) integration model. Value stream 6 instead
managed to reduce uncertainty on the customer side in the past and likewise
benefits from better supply chain control mechanisms. The key reason for
Forestry and Food 1 to manage to move into the internal integration stage is a
highly automated process, which impacts positively on internal uncertainty.
However, control uncertainty for those two companies remains high. Part of the
follow up study was a discussion about the future improvement opportunities. The
outcomes of the discussions are presented next and provide further insights into
the expected future path.
8.5.4 Future supply chain improvement outline
Manufacturer 2 will focus on re-engineering its internal processes as well as
supplier/customer development in the near future. Internally, the aim is to increase
automation. Further, bar-coding of finished goods will be introduced. Also, lean
manufacturing will be further matured to sustain lean production. Externally, the
global enterprise will introduce a software solution that allows for more customer
visibility. Supplier development will also increase as Manufacturer 2 aims for
more visibility in the supplier cost structure (open book costing).
Forestry plans to introduce current best practise used in the main plant to the three
remaining plants as well as to the corporate customers in Australia. Further,
supplier performance will be closely measured, and actions will be taken with
poor performing suppliers. Finally, the third party logistics provider will
implement a new software tool that enables more visibility of cost and volume for
the outbound logistics side.
Dairy 1 will continue restructuring its business and further integrate internally.
Externally, Dairy 1 will emphasize supplier relationship management, since most
Page 233
215
cost savings for the company are predicted in this area. The supplier base will be
evaluated and new international supply sources will be developed to reduce
dependency on key New Zealand suppliers.
Food 1 plans to roll out the three sales and operational planning modules for the
remaining production facilities. The company also plans to implement continuous
improvement at the production process level. Further, Food 1‟s key customers
have requested the implementation of EDI. In the long term, this is expected to be
rolled out to key suppliers. Further, the development of an integrated track-and-
trace system is planned. Also, some cross functional activities are planned by
integrating R&D in the supplier selection process.
In light of these planned developments, Figure 8.27 presents the expected
pathways to supply chain integration.
Figure 8.27: Expected future pathways to supply chain integration
Source: Author
Manufacturer 2 (value stream 10 and 11) will most likely continue to integrate
internally before integrating with in-house customers because customer
Non-integrated supply chain
Internal integration Customer integrationSupplier integration
Supplier
integration
Customer
integration
Internal
integration
Supplier
integration
Internal
integration
Customer
integration
Customer
integration
Supplier
integration
Supplier
integration
Internal
integration
Customer
integration
Internal
integration
4
Food 1 (7 & 8 & 9)Dairy 1 (3 & 4) Forestry (5 & 6) Manufacturer 2 (10 & 11)
310
5
7
11
98
5
6
Seamless supply chain
4
3
6
7
98
1011
Page 234
216
integration is highly dependent on European headquarters input. Due to the
positive power and dependency structure on the supplier side, Forestry (value
stream 5 and 6) is expected to integrate with key suppliers next. Dairy 1 (value
streams 3 and 4) instead will continue to restructure their business and will most
likely move into internal integration. Finally, Food 1 has managed to integrate
externally, hence only internal integration for value stream 8 and 9 remains. Value
stream 7 will benefit from the internal integration efforts only if control
uncertainty can be addressed.
8.6 Discussion
This research makes an early attempt at investigating how companies achieve
supply chain integration in practice using longitudinal studies. Chapter 8 provides
some evidence that the pathway to supply chain integration is not a single one as
proposed by Stevens (1989). The four cases reveal that currently only one value
stream followed the Stevens‟ integration model. Hence, the research contradicts
Stevens conceptual supply chain integration model and Romano‟s (2003) findings
that intra-company integration is a precondition for inter-company integration. In
fact, the research reveals that the case companies have tended to take the „path of
least resistance‟ when integrating their supply chain. This path of least resistance
is closely related to the preconditions to achieve a seamless supply chain, as
identified in Figure 8.2. The external preconditions are in the form of the power
and dependency structure (independence and/or buyer dominance) and, internally
the presence of top management support. Food 1, for example, due to a positive
power and dependency structure, integrated on the supplier side before focusing
on the customer side. However, the internal functional silos remain due to a lack
of top management support. Manufacturer 2 is a similar case; the company is
predominantly working with smaller local suppliers and has managed to integrate
with those suppliers first. Currently, the company is addressing internal
integration with strong top management support. However, Manufacturer 2
depends on the European headquarters to better integrate with key customers
because the majority of the customers are part of the wider corporate. Hence, the
Page 235
217
research supports the conceptual model developed in Figure 8.2 and the following
proposition can be stated.
Proposition 8.1:
Companies face internal and external barriers and choose „the path of least
resistance‟ when integrating their supply chain.
Six distinct pathways to supply chain integration have been identified. It should
be noted that, in this early stage of the research, it is impossible to compare or
rank the pathways to supply chain integration. Arguably, companies in the non-
integrated stage face high uncertainties in all four areas of control, process,
supply, and demand. Reducing process and control uncertainty first will take
waste out of their own operations and will have a direct impact on a focal
company‟s bottom line. The drive to further enhance efficiency will result in
targeting the purchasing price on the supply side next. Lastly, customer
integration will be addressed to increase the effectiveness of the supply chain.
Frohlich‟s (2002) findings also suggest that an „inside-out‟ strategy of first
removing internal barriers and then bringing upstream suppliers and downstream
customers onboard is the best way to change the supply chain. Hence, it might be
argued that Stevens‟ (1989) conceptual integration model represents the ideal
theoretical path to supply chain integration; however, as shown by the findings of
this chapter, in many cases this is not the most feasible pathway to supply chain
integration in the real world. Notwithstanding the fact that Fine (1998) introduced
clock speed as a concept to characterise different rates of evolution in various
industries, the present research has clearly demonstrated that there is no single
route to supply chain integration; that the pathway to supply chain integration is
essentially organisation specific.
Further, the cross-case analysis revealed that companies follow similar behaviour
patterns when further integrating their supply chain. They hired new supply chain
management expertise and upskilled/empowered their existing staff. As a second
step, processes and/or external relationships were addressed before investing in an
Page 236
218
upgrade to integrated technology. Figure 8.28 presents the conceptual model
developed based on these findings.
Figure 8.28: Sequencing of target areas to further integrate the supply chain
Source: Author
The research identified that all companies upgraded knowledge and skills in a
particular area before addressing internal processes and/or external relationships.
The second step in Figure 8.28 is highly dependent on the preconditions or key
moderators for supply chain integration, identified earlier in Figure 8.2. If a focal
company has a weak power and dependency structure externally and strong top
management support internally, it would choose path 2a before moving to
technology improvement. If a focal company has a strong power and dependency
structure and lacks top management support, it would choose path 2b before
moving to technology improvement. However, if a focal company has both strong
power and dependency externally and top management support internally, it
would choose either 2a or 2b, before addressing technology.
Food 1 followed pathway 2b by integrating externally before investing in
technology. However, internal functional silos remain due to a lack of top
management support. Dairy 1 is currently in step 2a focusing on internal process
Internal
Process
People
External
Relationships
Technology
1
3
2B2AKey
Moderator:
Positive Power
and
Dependency
Structure
Key
Moderator:
Top
Management
Support
Only if both,
external and
internal moderators
are present
Page 237
219
integration after investing in people. However, external integration will be
difficult to achieve due to a weak power and dependency structure. Manufacturer
2 heavily invested in people before improving internal processes due to top
management support. Currently, the supplier base is further developed because of
the positive power and dependency structure in place before upgrading the current
information system.
Halldorsson et al.‟s (2008) quantitative study stressed that people appear to be
more important than computers in supply chain management implementation, in
both Scandinavia and the USA. Also, Pagell (2004) identified that face-to-face
communication and visual management aids seem to be more important than
implementing a highly sophisticated information system. Zhao et al. (2008), in
their recent quantitative study, identified that normative relationship commitment
had a very strong positive impact on customer integration, whereas instrumental
relationship commitment had no impact on customer integration.
Longitudinal studies give further opportunity to investigate the rate of change.
Here, the achieved uncertainty reduction is compared to the time it took to reduce
uncertainty to a certain level. Figure 8.29 presents this comparison.
Page 238
220
Figure 8.29: Speed of supply chain integration
Source: Author
The x-axis in Figure 8.29 contains time units; the y-axis, the level of integration
based on consideration of supply chain uncertainty. A best fit line has been added
which is adapted from the learning curve. This is based on the proposition that
companies can move from poor integration to a medium level of supply chain
integration faster than from medium integration to a seamless supply chain (also
called diminishing returns). The initial Quick Scan data is then placed on the best
fit line. The second data point is than placed according to the time-lag and
uncertainty reduction.
The proposition that it is faster to move from a low to a medium level of supply
chain integration than from a medium level to high level of supply chain
integration is only conditionally true. Food 1‟s value streams (7, 8, 9) are the most
advanced value streams and all follow the best fit line. So are value streams 6
(Forestry) and 10 (Manufacturer 2). However, value streams 3 and 4 (Dairy 1), 5
(Forestry) and 11 (Manufacturer 2) all appear below the best fit line. Hence, to
move from a low level of integration to a medium level of integration is not as fast
3
4
6
11
3
4
77
8
8
9
11
10
10
6
5
5
[Time Units]
[Level of
Integration]
Food 1 (7 + 8 + 9)Dairy 1 (3 + 4) Forestry (5 + 6) Manufacturer 2 (10 + 11)
9
Best Fit Line
Page 239
221
as predicted by the best fit line. The value stream with the steepest line is value
stream 11 (Manufacturer 2). The company considerably improved their value
stream in a short period of time. In conclusion, Figure 8.29 highlights that the
speed of integrating the supply chain is slow. Fawecett and Magnan (2002) also
identified that supply chain change is slow, especially in regard to people and
culture.
It seems that the speed of change does not necessarily depend purely on the
current level of supply chain integration; it is more complex than this.
Preconditions to achieving the seamless supply chain (see Figure 8.2) need to be
considered as well as the significance of environmental, internal and external
barriers. It is also reasonable to expect that company size impacts the speed of
change.
This exploratory investigation into the pathways to supply chain integration is not
without limitations. The most obvious is that the small sample of four
organisations does not allow for generalisation. The question remains if other
companies follow different or similar pathways to supply chain integration shown
in Figure 8.1. Also, part of the Quick Scan Audit Methodology is the development
of improvement opportunities. Hence, the Quick Scan is already pointing
companies in the direction of where to put most emphasis to further integrate the
focal company‟s supply chain (Böhme et al., 2008b). Finally, all four case
companies were studied during a time of continuous growth and (relative) global
economic stability.
There are a multitude of further research avenues to extend this exploratory
research. Firstly, the identified six pathways to supply chain integration need
further validation. Also the question remains, which of the six pathways is the
ideal path to achieve the seamless supply chain? And, unless being concerned
with speed of change, what is considered ideal for one company is unlikely to be
ideal for another. Is the achievement of the seamless supply chain always feasible
or even desirable? Chapter 7 provided some insights that supply chain integration
is difficult to achieve if the focal company depends highly on an external entity.
Page 240
222
Similarly van Donk and van der Vaart (2004) identified that integration is not
always feasible in the context of shared resources, i.e. the academia already points
out that limitations to integration are present. The academia recently also started
debating the desirability of supply chain integration. Here, it is important to
emphasise that the debate is not about full integration versus zero integration.
Rather, it is about how much integration is justified and under what
circumstances. The answer to these questions depends very much on the nature
and purpose of the individual value stream. For example, it is difficult to envisage
any circumstance in which internal integration will not prove essential to
competitiveness (Stevens, 1989). Indeed as described by Busalacchi (1999), for
those companies responding to electronic auctions this may be the single most
important action that they can take. Other authors argue that supply chain
integration should follow investment logic (e.g. van Donk & van der Vaart,
2005b).
Further, the supply chain integration evaluation assessment tool needs further
validation from larger empirical data sources. One successful application of the
integration of the evaluation assessment tool within the UK steel industry can be
found in Böhme et al. (2007c). However, further applications in other countries
are necessary. Also, further characteristics or even categories need to be identified
to capture the totality of supply chain integration in different industry sectors and
countries. This chapter made an attempt to investigate the speed of change
towards the seamless supply chain and further research is required on this aspect.
Also of interest, is the question of which changes have the greatest impact on
supply chain integration and supply chain performance.
8.7 Conclusion
This chapter aimed to answer the overarching research question How do
companies achieve supply chain integration in practise? Here, the initial Quick
Scan Audit Methodology has been extended to enable longitudinal case study data
collection. Four longitudinal case studies into achieving supply chain integration
in practice were conducted. The average timeframe between Quick Scan and
Page 241
223
follow up study was 25 months. The effects of the change process have been
measured in three distinct ways. First, the effect of a focal company‟s change
process on internal supply chain barriers was assessed. Secondly, the impact of
the change on supply chain uncertainty was measured. Finally, the effect of the
change on supply chain integration was assessed using the supply chain
integration evaluation assessment tool developed in Chapter 2.11.3.
The conceptual model developed in Chapter 5 containing six pathways to supply
chain integration has been validated. The conceptual model contains three
different areas to supply chain integration: internal integration, supplier
integration and customer integration. Which path a focal company chooses is
highly dependant on the external power and dependency structure and the internal
top management support, because the research identified that companies tend to
take the „path of least resistance‟ when further integrating their supply chain.
Hence, there is no single path to supply chain integration. Some common patterns
regarding supply chain change have been identified among the four cases studied.
All four cases invested in people before addressing supply chain related issues.
Only in the final step did companies invest in technology improvements.
The major contribution to theory lies in the close examination of pathways to
supply chain integration. First, the conceptual integration model developed in
Chapter 5 (see also Figure 8.1) has been validated. Here also, the preconditions
that influence the choice of one of the six paths to supply chain integration have
been identified. Second, the effect of change on barriers to supply chain
integration has been examined. Finally, the research revealed key supply chain
integration categories and their impact on supply chain performance via the
application of the developed supply chain integration assessment tool.
Page 242
224
9. Discussion
9.1 Supply chain integration in practise: An exploration
One of the most significant shifts in the paradigm of modern business
management is that individual companies no longer compete as autonomous
entities, but rather as supply chains (Christopher, 1998). Success of business
management in an era of inter-network competition will depend on management‟s
ability to integrate the company internally, as well as, externally with customers
and suppliers (Lambert et al., 1998). Supply chain management offers the
opportunity to capture the synergies afforded by intra- and inter-company
integration. Thus, for almost two decades, researchers have sought to identify a
common pathway to supply chain integration with possibly the most influential
work being by Stevens (1989), who suggested that companies follow an
integration process that proceeds through different stages; first by integrating
internally, then extending the integration process to other supply chain members
externally (Stevens, 1989). However, Stevens conceptual model has many
proponents (e.g. Towill et al., 2000; Frohlich, 2002; Koufteros et al., 2005;
Romano, 2003) as well as opponents (e.g. Gimenez, 2004; Halldorsson et al.,
2008; Potter et al., 2004). In conclusion, many researchers have identified a lack
of understanding/knowledge of the pathways to supply chain integration (Cigolini
et al., 2004; Frohlich & Westbrook, 2001; van Donk & van der Vaart, 2005b).
This thesis has made an early attempt at closing the gap in understanding of the
routes companies actually follow when integrating their value streams. A
summary table of all original contribution of this thesis can be found in Table
10.1.
A particular challenge, when investigating pathways to supply chain integration,
is that academia has not agreed on a common framework, or even a definition, of
supply chain integration. In this thesis, supply chain integration is viewed as three
dimensional; having internal supply chain integration, and external (customer and
supplier) integration (Bowersox et al., 2007; Frohlich, 2000). Here, external
integration is viewed as advancing supply chain management practises that
support the optimisation of end-to-end material and information flow. Following
Page 243
225
clarification and definition of the term supply chain integration the overarching
research question regarding the pathways to supply chain integration was
addressed, and a stepwise procedure was introduced to enable researchers to
investigate the actual pathways to supply chain integration. The five step
procedure also gives practitioners clear guidance when aiming to integrate their
supply chain because each step includes unique supply chain integration
assessment techniques. Figure 9.1 presents the five step procedure, which mirrors
the overall structure of this PhD Thesis.
Figure 9.1: Five step procedure to investigate supply chain integration in practise
Source: Author
The overall objective of the first two steps is to evaluate the current status of the
company focal supply chain. This involves a thorough understanding and
documenting of current practises and the resultant evaluation of supply chain
integration maturity. Once the current status is assessed barriers to internal and
external integration are investigated. This step is necessary to fully understand
why the focal company chose a certain route, and to understand which barriers to
supply chain integration need to be addressed. Once the current status and the key
barriers are established, a longitudinal study allows the researcher to investigate
the pathway to supply chain integration that was taken.
9.1.1 Current supply chain status
The current understanding of supply chain management established the basis for
the investigation into barriers and pathways to supply chain integration. Here, the
Quick Scan Audit Methodology (QSAM) was identified as a very valuable
Understand
and document
current supply
chain practises
Evaluate supply
chain integration
maturity.
Identify internal
barriers to
supply chain
integration
Evaluate
external barriers
to supply chain
integration
Current Status Barriers Pathways
Achieving
supply chain
integration in
practise
Page 244
226
methodology for investigating the current status of real life supply chains and to
gain in-depth insight into a focal company‟s supply chain practises.
Many scholars report that few companies are actually engaged in extensive supply
chain integration practises (Akkermans et al. 1999; Harps & Hansen, 2000;
Kilpatrick & Factor, 2000; McAdam & McCormack, 2001; Towill et al., 2002;
Poirier & Quinn, 2003; Zailini & Rafagopal, 2005). This research into supply
chain integration in New Zealand revealed that overall a significant gap remains
between integration theory and practise. The research identified weak practitioner
uptake of the supply chain integration concept. If this is in any way representative
of New Zealand organisations, it is evident there exists a considerable gap
between best practise supply chain management theory and its adoption and
application by New Zealand practitioners. Thus, considerable scope for
improvement exists.
9.1.2 Barriers to supply chain integration
The question of why supply chains are so weakly integrated internally was also
investigated. The internal supply chain barriers were identified and assessed using
systems thinking, a method that offers a way of understanding complex problems
and communicating this understanding to others (Holmberg, 2000). The research
revealed that most internal integration barriers are people related. Some are
directly related, like supply chain skills of individuals or company culture, and
some are indirectly related to people in the form of the organisational structure
and reward systems; because people are embedded in the real-world structures
provided by the focal company (Childerhouse et al., 2003). Many other authors
agree (Andraski, 1994; Lambert & Cooper, 2000; Mentzer et al., 2000; Pagell
2004; Storey et al., 2005; Whipple & Frankel 2000).
The research also revealed that the case companies are only weakly integrated
with their suppliers. Every company in the sample was simultaneously dominated
by at least three of their key suppliers, which considerably reduces the chances of
supplier integration. Power and dependency appear to play a mediator role (also
Page 245
227
termed a precondition) for external integration, as no direct link between power
and dependency and external integration has been identified.
9.1.3 Achieving supply chain integration in practise
After establishing current supply chain status and the barriers to supply chain
integration, longitudinal studies enabled investigation of how supply chain
integration is actually achieved. QSAM was extended to allow for longitudinal
data collection. The impact of the integration change process were assessed using
three distinct measures; (a) the effect on barriers to supply chain integration; (b)
the effect on supply chain uncertainty; and (c) the effect on integration using the
developed supply chain integration assessment tool.
The thesis provides some evidence that there are many pathways to supply chain
integration, which contradicts Stevens (1989). The four cases studied revealed that
only one value stream followed the Stevens‟ integration model; Stevens‟ supply
chain integration model does not always reflect reality (Potter et al., 2004;
Gimenez & Ventura, 2005). In fact, the research revealed that the case companies
tended to take the „path of least resistance‟ when integrating their supply chain.
This path of least resistance is closely related to the preconditions to achieve a
seamless supply chain; namely, external power and dependency structure
(independence and/or buyer dominance) and internal, top management support.
Further, the investigation revealed that companies follow similar pathways when
further integrating their supply chain: the four case companies all invested in
people before addressing internal processes and/or relationship issues. Only as the
final step was the current information technology improved.
This thesis has increased the understanding of supply chain integration for
academics and for practitioners. It appears that organisational and behavioural
complexity are often underestimated, (Storey et al., 2005) and, conversely,
strategic alliances (Drago, 1997) and partnerships (Spekman et al., 1998) are
overrated within the supply chain integration literature.
Page 246
228
Figure 9.2 adapts the Handfield and Nichols (2002) supply chain integration
model. It illustrates the key findings of this PhD thesis in a single diagram and
proposes several key focus areas regarding supply chain integration.
Figure 9.2: Implications of the research for the wider integration landscape
Source: Adapted from Handfield and Nichols, 2002
The adapted version integrates the research findings and places them into
perspective. Firstly, the study acknowledges the existence of barriers, both
internally and externally. Internally, people in the guise of a company culture and
a company structure can encourage functional silos, which seem to be the most
critical barrier to supply chain integration. Whipple and Frankel (2000) similarly
highlighted that the largest barrier to integration is organisational (e.g. culture)
rather than being technical or financial. Externally, a predominantly high
dependency on external entities can limit the integration efforts (Cox, 2001; van
der Vaart & van Donk, 2004).
Figure 9.2 also highlights the pathways to supply chain integration. The pathways
are visualised by including the preconditions to supply chain integration shown at
the top of Figure 9.2. The research revealed that top management support plays a
critical role when aiming to integrate internally. Externally, a positive power and
Internal
Integration
External
Integration
Key Enabler: People, Culture and Organisational Structure(s)
Procurement
Manufacturing
Distribution
Top Management
Support≤ ≥
Enabler: Technology
External
Integration
En
d C
on
sum
er(s)R
aw
Mate
ria
l(s)
Preconditions for Enabling the
Seamless Supply Chain
Pow
erP
ow
er
Po
wer
Pow
erFunctional Silos
Page 247
229
dependency structure involving both, buyer dependency and interdependency,
play a critical role. All of these preconditions appear to dictate the route a focal
company will take, as the research showed that companies tend to take the supply
chain integration path of least resistance.
The preconditions to supply chain integration also contribute to research on the
feasibility of supply chain integration. In circumstances when the balance of
power is held by the external entity, an integrated supply chain can likely only be
achieved if the company that holds the power desires integration. Even then,
Chapter 7 identified some strategies to overcome such supplier or customer
dominance. Also, if there is a lack of top management support, a company will
most likely struggle to integrate internally.
Enablers to supply chain integration have been added to the lower part of Figure
9.2. Successful supply chain integration is a function of how well people work
internally and with key external entities. Although technology is a powerful
enabler, it is not the key to supply chain integration; people are (Mentzer et al.,
2000). The culture and the organisational structure have been found by this
research to be very critical for achieving internal integration. Managerially, this
implies encouraging cooperation, information sharing, co-ordination, and joint
planning across organisational boundaries. Specific tools and mechanisms to
achieve these goals can be generally found in the organisational behaviour
management literature (e.g. Murphy and Poist, 1992). The present research
findings support Halldorsson et al.‟s (2008) quantitative study that reported that
people appear to be more important than technology in supply chain management
implementation in both Scandinavia and the USA. Pagell (2004) also identified
that face-to-face communication and visual management aids seem to be more
important than implementing a highly sophisticated information system.
Similarly, Zhao et al. (2008) recently identified in their quantitative study that
normative relationship commitment had a very strong positive impact on customer
integration, whereas instrumental relationship had no impact on customer
integration. In summary, the adapted version of the Handfield & Nichols (2002)
model in Figure 9.2 visualises a holistic, systems perspective regarding supply
Page 248
230
chain integration, which requires systems thinking for properly managing and
researching supply chain integration.
This research also revealed that integrating a supply chain is a slow and
incremental process, especially with regard to people and culture (Gattorna &
Walters, 1996; Fawcett & Magnan, 2002); the effort and resources required to
implement supply chain integration should not be underestimated. It is a
marathon, not a sprint (Halldorsson et al., 2008). Hence, the road to supply chain
integration is not an easy one; however, it is a road well worth travelling (Mentzer
et al., 2000).
9.2 Areas of investigation where further evidence is required
Although this thesis makes significant contributions to both academia and
practise, there are several limitations that open up avenues for further research.
Research constraints include time, finances and access to data. As a consequence,
it is not possible to conduct comprehensive, robust research that takes into account
every factor that affects the subject area (see also Figure 3.3). Further, the author
acknowledges the limitation of conducting this research as a one-sided approach,
in which the information is acquired only from the focal company. No information
is acquired from the suppliers and customers. This section reflects on these
shortfalls through a review of the areas that require further evidence.
9.2.1 Current supply chain status
The current status relates to the QSAM and its application within New Zealand.
Firstly, limitations arise around the methodology itself due to the limited amount
of time spent on a Quick Scan. It is simply not possible to understand and
document the entire supply chain, so focus is instead placed on gaining in-depth
knowledge of specific value streams. There is also a clear need for buy-in from
those organisations under analysis. Since, if this is not forthcoming, the quality of
the information and resultant understanding of the supply chain can be
significantly reduced.
Page 249
231
Limitations also result from the application of the Quick Scan to identify the level
of value stream integration in New Zealand. The New Zealand sample was fairly
small and biased to companies with low levels of internal and external integration,
and high levels of uncertainty. The sample is not a comprehensive representation
of New Zealand value streams but does allow for insights to be gained on the
general health of New Zealand value streams. Also, some industry sectors, like the
retail sector, are not included in the sample and others like the service sector, are
underrepresented.
9.2.2 Barriers to supply chain integration
Although there is no evidence, it is possible that the supply chain systems in New
Zealand may exhibit different characteristics to those in other countries. Hence,
the barriers identified need further validation from larger empirical data sources.
Also, the power and dependency dyadic relationship model, (see Figure 7.1) and
the three layers of internal supply chain integration barriers models (see Figure
6.1) lack robustness due to the limited number of cases and single New Zealand
research setting. Hence, both conceptual model require wide verification.
9.2.3 Achieving supply chain integration in practise
The investigation into how companies actually achieve supply chain integration is
limited by a small sample size (four companies, nine value streams in New
Zealand) and the results cannot be used to generalise about pathways to supply
chain integration; the research setting of companies in New Zealand, could limit
the generalisability of the findings. Finally, the application of the QSAM may
have biased the longitudinal research results because part of the QSAM involves
the development of improvement opportunities. The Quick Scan advices
companies to move in a particular direction to further integrate the company
supply chain. However, the follow up studies revealed that practitioners only
partially need the advice provided by the Quick Scan team (Böhme et al., 2008b).
Finally, all four case companies were studied during a time of continuous growth
and (relative) global economic stability. The question remains how different
economic climates impact supply chain integration in practise.
Page 250
232
9.3 Research strengths
The major strength of the thesis is the large quantity, and more importantly the
high quality, of case data gathered via the Quick Scan Audit Methodology; which
has impacted on all the findings chapters. The author was in a very fortunate
position to be part of the Waikato Management Quick Scan Audit team. Here, the
author was able to work alongside well known researchers like A Prof Paul
Childerhouse and A Prof Eric Deakins from Waikato University, as well as Prof
Stefan Seuring from the University of Kassel, during the process of data
collection.
Many authors conclude (Frankel et al., 2005; Mentzer & Kahn, 1995; New &
Payne, 1995; Seuring, 2005; Westbrook, 1994) that supply chain management
problems are often unstructured, even messy, real-world problems. The authors
suggest that, to gain relevance for supply chain researchers, a “one paradigm, one
approach” perspective should not automatically be the obvious choice (Frankel et
al., 2005; Mentzer & Kahn, 1995; New & Payne, 1995; Seuring, 2005;
Westbrook, 1994).
The Quick Scan Audit Methodology has been developed in order to accurately
describe, truly understand, and explain a complex and messy environment by
applying multiple data collection methods (data triangulation). Further, a team of
researchers ensures that the research does not reflect simply one person‟s opinion
(investigator triangulation). Also, the applicability of the Quick Scan and the
different integration assessment tools and techniques to different industry sectors,
using case study research, is a further strength (method triangulation). The Quick
Scan is anchored within the systems thinking theory. Systems thinking is
particularly fruitful for investigating supply chain integration issues because it
takes a holistic view of the supply chain. Systems thinking is the holistic process
of considering both the immediate outcomes and the longer-term systems wide
ramifications of decisions (Fawcett et al., 2007).
Seven Quick Scans, four follow up studies, seven relationship evaluations, and
three interviews were conducted to explore supply chain integration in practise. In
Page 251
233
total, some 240 person days were spent on site observing, interviewing, auditing,
and analysing archival data in eleven different case companies. The researcher
gained an in-depth insight into the real world managerial context of supply chain
integration and was able to extract a large amount of rich case study data. Since
the case companies also belong to four distinct industries all of the findings
chapters feature at least two different industry sectors; which increases the
generalisablility of the findings.
10. Conclusion
Successful supply chain management requires integrating business processes
internally and with key members of the supply chain (Lambert et al., 1998). The
literature is clear on the importance of integration, but lacking in terms of
prescribing the manner in which companies create integration across operations
internally and with suppliers and customers externally. This research has taken an
early step in investigating how supply chain integration is actually achieved using
qualitative research and longitudinal case studies. The backbone of this thesis is a
five step methodology developed to investigate pathways to supply chain
integration. This methodology proposes that, before investigating pathways of
supply chain integration, the current status of a supply chain should be evaluated
and internal and external barriers identified. This barrier assessment is critical
because the removal of barriers between and within organisations seems to be the
crucial issue in integrating any supply chain (Gimenez, 2004; Romano, 2003).
The major foci of this thesis are twofold. First, the thesis aimed at the
development of a method to investigate how companies achieve supply chain
integration in practise. Second, each findings chapter focused on the development
of conceptual models that enabled the researcher to assess current supply chain
status, as well as barriers and pathways to, supply chain integration. A systematic
methodology for supply chain diagnostics was presented in Chapter 4, followed
by two distinct assessment methods to investigate the current status of supply
chain integration: the uncertainty circle; and the developed supply chain
integration assessment tool. Chapter 6 provides a conceptual model that allows for
Page 252
234
categorisation and assessment of internal and environmental barriers to supply
chain integration. Chapter 7 proposes a five step method to assess external
relationships on the basis of power and dependency. Finally, Chapter 8 enables
the researcher to map out the change processes within a focal company and assess
the impact of the change on (a) barriers to supply chain integration, (b) supply
chain uncertainty, and, (c) the developed supply chain integration assessment tool;
thereby highlighting the pathways to supply chain integration.
10.1 Original contribution
The original contribution to knowledge is best explained in relation to the
stepwise method presented in Figure 9.1. Table 10.1 illustrates the research
questions and resultant original contribution of each findings chapter. There now
follows a detailed summary of the research conducted at each step and the
resultant original contribution to knowledge.
10.1.1 Quick Scan Audit Methodology
The first major contributions to knowledge appeared in the methodology chapter.
Here, a rigorous method was developed which adapted the Quick Scan method to
suit longitudinal case studies. Applying the Quick Scan Audit Methodology
(QSAM) to New Zealand increased its rigour and generalisability; Quick Scan
was applied in new industry settings (the New Zealand process industry and the
health sector), further demonstrating its validity and reliability.
10.1.2 Supply chain integration in New Zealand
The investigation into current supply chain integration practises in New Zealand
supports the current literature of its assessment that a gap exists between supply
chain integration theory and actual uptake in practise. Best-in-class performance
remains an elusive goal for most companies in New Zealand, with best practises
adoption being patchy. The investigation further revealed that New Zealand value
Page 253
235
streams are significantly less integrated on the customer side than on the supplier
side.
The data collected was also used to validate currently available supply chain
integration models. Here, the research findings contradicted existing models and a
new supply chain integration model has been proposed, which was subsequently
validated in Chapter 8.
10.1.3 Internal and environmental barriers to supply chain integration
The major contribution regarding internal and environmental barriers to supply
chain integration lies in the clear categorisation and close examination of the
topic. Barriers to supply chain integration were identified and categorised using a
three layer conceptual model. The categories are termed: (a) environmental
barriers; (b) company specific barriers; and, (c) value stream barriers. The
research further provided support for the literature that the identified barriers are
also common to New Zealand, and that a multitude of barriers obstruct supply
chain integration in practise. Finally, the research revealed that many barriers to
internal integration relate to people and the structures and working arrangements
imposed on those people by the focal organisation.
10.1.4 Power and dependency barriers to external integration
The assessment of external barriers to supply chain integration in terms of power
and dependency made three contributions to theory; first, by uniquely measuring
power and dependency in external relationships. Here, commonplace variables
have been identified influencing the power and dependency structure. The
developed five step power and dependency evaluation process was very valuable
when measuring dependencies in buyer/supplier relationships. Second, insights
into current relationship management practises and the power and dependency
structure of New Zealand business were presented. Here, poor relationship
management practises and a high number of supplier and customer dominance
relationships were highlighted. Indifferent customer relationship management and
supplier relationship management practises are common; therefore often external
Page 254
236
integration is immature. Finally, the role that power and dependency play for
external integration was identified. A positive power and dependency structure
has been identified as an important precondition for achieving of external
integration. Likewise, unfavourable external dependencies often obstruct supply
chain integration uptake.
10.1.5 Achieving supply chain integration
Regarding the pathways to enhancing supply chain integration, the major
contribution to theory lies in the close examination of supply chain integration
practises using longitudinal case studies. First, the conceptual integration model
developed in Chapter 5 (see also Figure 8.1) was validated.
Second, the preconditions or moderators that influence the selection of one of the
identified six paths to supply chain integration were highlighted. These
preconditions are: a positive power and dependency structure externally (buyer
dominance and interdependency); and good top management support internally.
The research revealed that managerial buy-in significantly enhances internal
supply chain integration. Also, favourable external dependencies coupled with
senior management conviction offers the best setting for supply chain integration
in practise. However, if a focal company lacks top management support and/or
has an unfavourable power and dependency structure; managers follow the path of
least resistance when enhancing integration in practise.
Third, the effect of change on: (a) barriers to supply chain integration; (b) supply
chain uncertainty, and; (c) supply chain integration were examined. The research
revealed commonalities among the four case companies regarding targeted
improvement areas during the change process. The „people‟ factor and the cultural
change to supply chain management philosophy is often the first step in
integration. Either internal functional boundaries or external dyadic relationships
are tackled afterwards, depending on the practical setting. Technological
inhibitors to supply chain integration are often left to last when enhancing
integration. Finally, the research presented early exploratory insights that the
Page 255
237
speed of supply chain integration development in practise follows a learning curve
trajectory.
Table 10.1 provides an overview of the major theoretical contributions provided
by this thesis; including research questions, the methodological approach used to
answer the research questions, and the key theoretical basis for each of the
findings chapters.
Page 256
238
Table 10.1: Research question and original contribution
5 Step Method Theory Research Question Methodology Major contribution Chapter
Understand &
document
current supply
chain practises
Watson (1994) What is an effective
methodology to investigate
supply chain integration
maturity, barriers, and
enhancement in practise?
Verification by
multiple
applications
1.1 Generalisability of the QSAM
1.2 Development of the QSAM to collect
longitudinal case study data
1.3 Rigorous method to measure power and
dependency in external relationships
1.4 Development of an integration assessment
toolkit
4
Evaluate supply
chain
integration
maturity
Frohlich & Westbrook
(2001); Mason-Jones &
Towill (1998); Stevens
(1989); Towill et al.
(2002)
How integrated are New
Zealand supply chains?
In what ways do companies
pursue supply chain
integration in practise?
Seven QSAMs
Two interviews
2.1 The application of supply chain theory is
poorly represented in practise. Most New
Zealand supply chains are poorly integrated
2.2 Currently available supply chain integration
models do not reflect reality
2.3 Upstream integration is more common than
downstream integration
2.4 New Zealand companies have significantly
lower control mechanisms in place than their
UK counterparts
2.5 Supply chain managers do not always
integrate internally first
5
Identify internal
barriers to
supply chain
integration
Gimenz (2004);
Halldorsson et al.
(2008); Pagell (2004)
What barriers obstruct
internal supply chain
integration in practise?
Six QSAMs 3.1 Close assessment and categorisation of
internal and environmental barriers
3.2 A multitude of barriers obstruct supply chain
integration in practise
3.3 Managerial, socio-cultural factors are the
major obstacles to supply chain integration in
practise
6
Evaluate
external barriers
to supply chain
integration
Cox (2001); van der
Vaart & van Donk
(2004)
What is an appropriate
technique to measure power
and dependency across inter-
organisational boundaries?
Seven case
studies
4.1 Identification of commonplace variables
influencing the power and dependency
4.2 Indifferent customer relationship
management and supplier relationship
management practises are common, therefore
often external integration is immature
7
Page 257
239
How do power and
dependency affect external
supply chain integration?
4.3 Unfavourable external dependencies often
obstruct supply chain integration uptake
4.4 Dependent suppliers are easier to implement
integrative practises with
Achieving
supply chain
integration in
practise
Stevens (1989) How do companies achieve
supply chain integration in
practise?
Four
longitudinal
case studies
5.1 Conceptualisation of feasible integration
pathways
5.2 Managerial buy-in significantly enhances
internal supply chain integration
5.3 Favourable external dependencies coupled
with senior management conviction offers the
best setting for supply chain integration in
practise
5.4 Managers and change agents follow the path
of least resistance when enhancing integration
in practise
5.5 The speed of supply chain integration
development in practise follows a learning
curve trajectory
5.6 The „people‟ factor and the cultural change to
supply chain management philosophy is often
the first step in integration in practise
5.7 After „people‟, either internal functional
boundaries or external dyadic relationships
are tackled depending on the practical setting
5.8 Technological inhibitors to supply chain
integration are often left to last when
enhancing practise.
8
Source: Author
Page 258
240
10.2 Relevance of thesis to industry and practitioners
This thesis also makes strong contributions to practitioners. First of all, the five
step methodology to investigate pathways to supply chain integration provide
practitioners with a roadmap to improve supply chain integration. Further, each of
the findings chapters supports the practitioner with supply chain integration
assessment tools and techniques. The developed supply chain integration
assessment tool enables practitioners to undergo a self-assessment of their current
supply chain integration level, and identifies major shortcomings.
The Quick Scan Audit Methodology cause and effect analysis enables
practitioners to gain a holistic view of the various internal supply chain integration
barriers; hereby focusing on environmental, company and value stream aspects.
This categorisation is very useful as it provides supply chain managers with a
barrier assessment so they might align resources accordingly. However, barriers
should not be viewed in isolation; they are often uniquely interlinked and
managers also need to understand the resulting effects of their actions internally as
well as externally, as visualised via the cause and effect diagram (see, for
example, Appendix F). This, however, requires staff with systems thinking
capabilities.
The application of the Quick Scan Audit Methodology identified that supply chain
theory is poorly represented in practise. Most New Zealand supply chains are
poorly integrated. These findings should comfort supply chain practitioners
because practical integration seems to be very difficult to achieve. Both data sets,
from the UK and New Zealand, further show that not one single value stream has
achieved a seamless status. However, much good practise is present in some value
streams and practitioners need to understand that advanced practises are
attainable.
This thesis offers opportunities and guidelines for practitioners to enhance their
performance through understanding the role of power in supply chain integration
and better management of external relationships. Here, key variables and their
Page 259
241
overall importance for power and dependency in external relationships have been
identified. The power and dependency model provides better understanding of
how strategic decision-making can be conceptually supported via a focus on
power and dependency in external relationships. The five step methodology for
measuring power and dependency provides managers with a self-assessment
technique to investigate their own particular external power and dependency
structure. Suggestions have also been made to mitigate situations where a focal
company is highly dependent on a key external entity.
The thesis also highlights the importance of people, culture and relationships
regarding supply chain integration. Companies that initiate an integration process
have to overcome some internal barriers, such as resistance to change, the existing
company culture, and functional silos. Managerial, socio-cultural factors are the
major obstacles to supply chain integration in practise. Companies also need to
overcome external barriers in the form of unfavourable power and dependency.
Appropriate upskilling of staff and management of the changes needed can
substantially reduce these internal and external barriers.
If managers intend to further enhance supply chain integration practises, this study
reveals that currently available supply chain integration models do not reflect
reality well. Companies tend to take the path of least resistance when integrating
their supply chain. „Areas‟ with a positive power and dependency structure and/or
top management support are easier to address then those with unfavourable power
and dependency structures or a lack of top management support. The developed
supply chain integration assessment tool (see Chapter 2.11.3) combined with the
preconditions to supply chain integration offer a road map for practitioners as they
channel future efforts into further integrating their supply chain to reduce
uncertainty.
However, the speed of supply chain integration development in practise is slow.
In all cases managers invested in people and the necessary cultural change to
supply chain management philosophy first. Staff members need to understand the
wider trade-offs of their actions, before effective process and relationship changes
Page 260
242
can take place. Technological inhibitors to supply chain integration are best left
until the end when seeking to enhance practise.
10.3 Further Research
There are a number of opportunities for further research which arise from this
thesis. Research is a continuous process. The starting point for this thesis was
presented in the literature review and the contributions to the body of knowledge
were summarised in this chapter. This final section identifies further research that
can build upon this new knowledge to further investigate the validity of the
findings. Three key areas for further research are highlighted.
10.3.1 Investigation into supply chain integration
The central focus of this thesis is the pursuit of supply chain integration. The
literature review highlighted the confusion that exists around the concept.
Currently, supply chain management as well as supply chain integration is ill-
defined and not well understood; and the academia lacks a common, universal
view of supply chain integration. This thesis identified three „layers of confusion‟.
The first layer is the range of the integration concept; for example, some authors
include internal integration, while others solely focus on external integration. The
second layer is introduced by the industry focusing on different supply chain
integration practises. Finally, academia adds to the confusion around the concept
of supply chain integration by focusing on selected aspects of supply chain
integration. These three layers of confusion highlight the fact that supply chain
integration lacks well-developed measures and standards that would make inter-
organisational comparisons easier. This thesis has addressed this by highlighting
the importance of viewing integration internally and externally. Also, a first set of
supply chain integration measures has been developed (see Chapter 2.11.3).
However, much more research is required to identify and standardise supply chain
integration research.
Page 261
243
10.3.2 Investigation into supply chains practise
The Quick Scan Audit Methodology (QSAM) is still capable of improvement. As
such, a great deal of further validating research is required. The method itself is
constantly being updated, strengthened, and streamlined, and may therefore be
regarded as evolving. Currently, only four research groups are applying the
QSAM; based in the UK (2), New Zealand and Thailand. Obviously further
applications in other countries would be beneficial. To further establish the
transferability of the method, other researchers need to utilise the QSAM. Also,
the process and the results of QSAM imply the necessity of further development
of the QSAM interviews and questionnaires. Regarding the current status of
supply chain integration in New Zealand, the question remains whether other
companies in New Zealand are similarly weakly integrated; hence more research
is needed to explore the level of supply chain integration in New Zealand.
10.3.3 Barriers to supply chain integration
Barriers to supply chain integration have been identified internally (within a focal
company) and externally (with suppliers and customers). Regarding the internal
barriers, further research is required to validate the conceptual model presented in
Figure 6.1. Also, the list of internal barriers presented in Table 6.2 is not expected
to be exclusive. Further research is required to identify additional barriers, or even
barrier categories to supply chain integration.
Externally, much more work is needed to further clarify the role of power
asymmetry in the supply chain. First, methodologies similar to the one used in this
thesis (see Table 4.12) could be applied in other industries and countries where
power plays a prominent role. Longitudinal analyses could study the effects of
power over time. Furthermore, power was only measured from the viewpoint of
the supplier base as the power target, so the dyadic perspective of power in the
supply chain remains to be fully explored. Analysis could also be extended to the
multiple echelons of the supply chain in order to understand power effects on a
network of relationships. Finally, the effects of power-based relationships upon
Page 262
244
performance could be greatly expanded through the use of objective performance
measures.
More significantly, now that internal and external barriers to supply chain
integration have been identified, research needs to identify ways to remove or at
least mitigate their effects, thereby improving the uptake of supply chain
integration.
10.3.4 Achieving supply chain integration
There are a multitude of further research avenues to expand this exploratory
research. The six pathways to supply chain integration identified need further
validation. Also, the question remains: which of the six pathways is the ideal path
to achieve the seamless supply chain and; Does this „ideal‟ vary according to
circumstances? Is achievement of a seamless supply chain always feasible or even
desirable? Further research is required to investigate the speed of change in
achieving a seamless supply chain. Also of interest, is the question of the changes
with the greatest impact on supply chain integration and supply chain
performance. Perhaps there is no single path to supply chain integration which is
always ideal. However, even if this is the case, the key principles supported by
this research might provide a beginning and an impetus for the search for the ideal
guiding principle for a company achieving supply chain integration.
This study draws on data from the process, manufacturing, and service industries.
There may be particular characteristics of such supply chains that do not apply to
other sectors. Sector specific studies of pathways to supply chain integration and
their relation to performance improvement will potentially yield different insights.
Finally, the adaptation of the QSAM to suit longitudinal studies can be further
refined; for example, the follow up data collection process could be improved by
introducing a second researcher to increase validity and extend the triangulation
practise from that of data triangulation to researcher triangulation.
Page 263
245
References
Aitken, J., Childerhouse, P., Christopher, M., & Towill, D. R. (2005). Designing
and managing multiple pipelines. Journal of Business Logistics, 26(2), 73-
96.
Akkermans, H., Bogerd, P., & Vos, B. (1999). Virtuous and vicious cycles on the
road towards international supply chain management. International
Journal of Operations and Production Management, 19(5/6), 565-581.
Allen, M. K., & Helferich, O. K. (1990). Putting expert systems to work in
logistics. Oak Brook, IL: Council of Logistics Management.
Anasai, A., Lockwood, D. L., & Modarress, B. (1999). Supplier product
integration: A new competitive approach. Production and Inventory,
40(3), 57-61.
Andraski, J. C. (1994). Foundations for successful continuous replenishment
programs. International Journal of Logistics Management, 5(1), 1-8.
Angeles, R. (2005). RFID technologies: Supply chain applications and
implementation issues. Information Systems Management, Winter, 51-65.
Aram, J. D., & Salipante Jr., P. F. (2003). Bridging scholarship in management:
Epistemological reflections. British Journal of Management, 14, 189-205.
Bagchi, P. K., & Skjott-Larsen, T. (2002). Integration of information technology
and organisations in a supply chain. The International Journal of Logistics
Management, 14(1), 89-108.
Bainbridge, C. (1996). Designing for change: A practical guide to business
transformation. New York: John Wiley & Sons.
Balle, M. (1995). The business process re-engineering action kit. London: Kogan
Page Ltd.
Banomyong, R., Basnet, C., Childerhouse, P., Deakins, E., Disney, S., Naim, M.
M., et al. (2005). Internationalising the Quick Scan Audit Methodology.
Paper presented at the 18th International Conference of Production
Research, Salerno, 31st July - 4th August.
Barker, R., Hong-Minh, S., & Naim, M. M. (2000). The terrain scanning
methodology. Assessing and improving construction supply chains.
European Journal of Purchasing & Supply Management, 6, 179-193.
Basnet, C., Childerhouse, P., Foulds, L. R., & Martin, V. (2006). Sustaining
supply chain management in New Zealand. International Journal of
Logistics Systems and Management, 2(3), 217-229.
Basnet, C., Corner, J., Wisner, J., & Tan, K.-C. (2003). Benchmarking supply
chain management practice in New Zealand. Supply Chain Management:
An International Journal, 8(1), 57-64.
Bechtel, C., & Jayaram, J. (1997). SCM: A strategic perspective. The
International Journal of Logistics Management, 8(1), 15-34.
Beer, M. (2001). Why management research findings are unimplementable: An
action science perspective. Reflections, 2(3), 58-65.
Benbasat, I., Goldstein, D. K., & Mead, M. (1987). The case study research in
studies of information systems. MIS Quarterly, September, 369-386.
Bensaou, M. (1999). Portfolios of buyer-supplier relationships. Sloan
Management Review, 40(4), 35-44.
Benton, W. C., & Maloni, M. (2005). The influence of power driven buyer/seller
relationships on supply chain satisfaction. Journal of Operations
Management, 23, 1-22.
Page 264
246
Berger, A. (1997). Continuous improvement and Kaizen: Standardisation and
organisational designs. Journal of Integrated Manufacturing Systems, 8(2),
110-117.
Bessant, J., Caffyn, S., Gilbert, J., R., H., & Webb, S. (1994). Rediscovering
continuous improvment. Technovation, 14(1), 7-28.
Bhuiyan, N., & Baghel, A. (2005). An overview of continuous improvement:
From the past to the present. Management Decision, 43(5), 761-771.
Böhme, T., Childerhouse, P., & Corner, J. (2007a). Supply chain integration in
New Zealand: Fact or fantasy? Paper presented at the 11th Annual
Waikato Management School Student Research Conference, Hamilton,
New Zealand.
Böhme, T., Childerhouse, P., Deakins, E., & Corner, J. (2008c). Balancing power
and dependency in buyer-supplier relationships. International Journal of
Electronic Customer Relationship Management, 2(3), 195-214.
Böhme, T., Childerhouse, P., Deakins, E., Potter, A., & Towill, D. R. (2008a).
Supply chain diagnosis. Operations Management, 34(2), 12-17.
Böhme, T., Childerhouse, P., Deakins, E., Potter, A., & Towill, D. R. (2008b).
Why diagnosis supply chain uncertainty? Operations Management, 34(3),
19-23.
Böhme, T., Ma, Y. X., Childerhouse, P., Corner, J., Seuring, S., Basnet, C.
(2007b). The application of the Quick Scan Audit Methodology in SME’s.
Paper presented at the Small Enterprise Conference, New Zealand,
Manukau.
Böhme, T., Potter, A., Childerhouse, P., Corner, J., & Deakins, E. (2007c). The
development of a generic supply chain integration model using the Quick
Scan Diagnostic Methodology. Paper presented at the 12th International
Symposium on Logistics, Budapest.
Bose, I., Pal, R., & Ye, A. (2008). ERP and SCM systems integration: The case of
a value manufacturer in China. Information and Management, article in
press.
Bowersox, D. J., Closs, D. J., & Cooper, M. B. (2002). Supply chain logistics
management. Boston: McGraw-Hill.
Bowersox, D. J., Closs, D. J., & Cooper, M. B. (2007). Supply chain logistics
management (2nd ed.). New York: McGrawHill.
Bowersox, D. J., & Daugherty, P. J. (1995). Logistics paradigm: The impact of
information technology. Journal of Business Logistics, 16(1), 65-80.
Bruce, M., Daly, L., & Towers, N. (2004). Lean or agile, A solution for supply
chain management in the textiles and clothing industry? International
Journal of Operations and Production Management, 24(2), 151-170.
Burbridge, J. L., & Halsall, J. (1994). Group technology and growth at Shalibane.
Journal of Production Planning and Control, 5(2), 213-218.
Burgess, K., Singh, P. J., & Koroglu, R. (2006). Supply chain management: A
structured literature review and implications of future research.
International Journal of Operations and Production Management, 26(7),
703-729.
Burrell, G., & Morgan, G. (1985). Sociological paradigms and organisational
analysis: Elements of the sociology of corporate life. Aldershot: Gower.
Burt, D. N., Dobler, D. W., & Starling, S. L. (2003). World class supply
management : The key to supply chain management (7th ed.). Boston:
McGraw-Hill/Irwin.
Page 265
247
Burt, S., & Sparks, L. (2003). Power and competition in the UK retail grocery
market. British Journal of Management, 14, 237-254.
Busalacchi, F.A. (1999). The collaborative, high-speed, adaptive, supply chain
model (CHASM) for lightweight procurement. Paper presented at the 15th
International Conference of Production Research, UK, Limerick, pp. 585-
588.
Buzzell, R., & Ortmeyer, G. (1995). Channel partnerships streamline distribution.
Sloan Management Review, Spring, 85-96.
Cagliano, R., Caniato, F., & Spina, G. (2006). The linkage between supply chain
integration and manufacturing improvement programmes. International
Journal of Operations and Production Management, 26(3), 282-299.
Caniels, M. C. J., & Gelderman, C. J. (2007). Power and independence in buyer
supplier relationships: A purchasing portfolio approach. Industrial
Marketing Management, 36, 219-229.
Carr, D., & Johansson, H. (1995). Best practices in reengineering. New York:
McGraw-Hill.
Carter, C. R., & Ellram, L. M. (2003). Thirty-five years of The Journal of Supply
Chain Management: Where have we been. The Journal of Supply chain
Management, Spring, 27-39.
Casciaro, T. & Piskorski, M.J. (2005). Power imbalance, mutual dependence, and
constraint absorption: A closer look at resource dependence theory.
Administrative Science Quarterly, 50, 167-199.
Chang, H. H. (2005). The influence of continuous improvement and performance
factors in total quality organisation. Total Quality Management, 16(3),
413-437.
Checkland, P., & Holwell, S. (1998). Action research: Its nature and validity.
Systemic Practice and Action Research, 11(1), 9-21.
Childerhouse, P. (2002). Enabling seamless market-orientated supply chains.
Unpublished PhD, University of Wales, Cardiff.
Childerhouse, P., Aitken, J., & Towill, D. R. (2002). Analysis and design of
focused demand chains. Journal of Operations Management, 20, 657-689.
Childerhouse, P., Christopher, M., & Towill, D. (2005). Designing and managing
multiple pipelines. Journal of Business Logistics(2), 73-96.
Childerhouse, P., Deakins, E., Böhme, T., Towill, D. R., Disney, S., &
Banomyong, R. (2007). Supply chain integration: An international
comparison of maturity. Paper presented at the Fifth International
Conference on Supply Chain Management and Information Systems,
Melbourne.
Childerhouse, P., Disney, S. M., & Towill, D. R. (2004). Tailored toolkit to enable
seamless supply chains. International Journal of Production Research,
42(17), 3627-3646.
Childerhouse, P., Hermiz, R., Mason-Jones, R., Popp, A., & Towill, D. R. (2003).
Information flow in automotive supply chains - identifying and learning to
overcome barriers to change. Industrial Management & Data Systems,
103(7), 491-502.
Childerhouse, P., & Towill, D. R. (2004). Reducing uncertainty in European
supply chains. Journal of Manufacturing Technology Management, 15(7),
585-598.
Page 266
248
Childerhouse, P., & Towill, D. R. (2006). Enabling seamless market-orientated
supply chains. International Journal Logistics Systems and Management,
2(4), 357-370.
Childerhouse, P., & Towill, D. R. (2002). Analysis of the factors affecting real-
world value stream performance. International Journal of Production
Research, 40(15), 3499-3518.
Childerhouse, P., & Towill, D. R. (2003). Simplified material flow holds the key
to supply chain integration. Omega The international Journal of
Management Science, 31, 17-27.
Chopra, S., & Meindl, P. (2007). Supply chain management: Strategy, planning &
operation (3rd
ed.). New Jersey: Pearson Prentice Hall.
Christensen, C. M., & Raynor, M. E. (2003). Why hard-nosed executives should
care about management theory. Harvard Business Review, 81(9), 67-74.
Christopher, M. (1998). Logistics and supply chain management. London: FT
Prentice Hall.
Christopher, M. (2000). The agile supply chain. Industrial Marketing
Management, 29, 37-44.
Christopher, M. (2005). Logistics and supply chain management: Creating value-
adding networks (3rd
ed.). Harlow, England: Pearson Education Ltd.
Christopher, M., & Towill, D. R. (2001). An integrated model for the design of
agile supply chains. International Journal of Physical Distribution &
Logistics Management, 31(4), 235-246.
Cigolini, R., Cozzi, M., & Perona, M. (2004). A new framework for supply chain
management: Conceptual model and empirical test. International Journal
of Operations and Production Management, 24(1), 7-41.
Closs, D. J., & Mollenkopf, D. A. (2004). A global supply chain framework.
Industrial Marketing Management, 33, 37-44.
Cooper, M. C., Lambert, D. M., & Pagh, J. D. (1997). Supply chain management:
More than a name for logistics. The International Journal of Logistics
Management, 8(1), 1-14.
Cousins, P. D., & Menguc, B. (2006). The implications of socialisation and
integration in supply chain management. Journal of Operations
Management, 24, 604-620.
Cox, A. (1999). Power, value and supply chain management. Supply Chain
Management: An International Journal, 4(4), 167-175.
Cox, A. (2001). Supply chains, markets and power: Mapping buyer and supplier
power regimes. London; New York: Routledge.
Cox, A. (2004). The art of the possible: Relationship management in power
regimes and supply chains. Supply Chain Management: An International
Journal, 9(5), 346-356.
Croom, S., Romano, P., & Giannakis, M. (2000). Supply chain management: An
analytical framework for critical literature review. European Journal of
Purchasing & Supply Management, 6, 67-83.
Da Villa, F., & Panizzolo, R. (1996). Buyer-subcontractor relationships in the
Italian clothing industry: An interpretive framework. International Journal
of Operations & Production Management, 16(7), 38-61.
Daft, R. L. (1995). Organization theory and design. Minneapolis: West
Publishing Company.
Page 267
249
Daparin, G. P., & Hogarth-Scott, S. (2003). Are co-operation and trust confused
with power? International Journal of Retail and Distribution Marketing,
31(5), 256-267.
Das, A., Narasimhan, R., & Talluri, S. (2006). Supplier integration - Finding an
optimal configuration. Journal of Operations Management, 24, 563-582.
Das, T. K. (2005). Deceitful behaviors of alliance partners: Potential and
prevention. Management Decision, 43(5), 706-719.
Davenport, T. H. (1993). Process innovation, reengineering work through
information technology. Boston, Massachusetts: Harvard Business School
Press.
Davis, T. (1993). Effective Supply chain management. Sloan Management
Review, Summer, 35-46.
de Treville, S., Shapiro, R. D., & Hameri, A.-P. (2004). From supply chain to
demand chain: The role of lead time reduction in improving demand chain
performance. Journal of Operations Management, 21, 613-627.
Deetz, S. A., Tracy, S. J., & Simpson, J. L. (2000). Leading organisations through
transition. Thousand Oaks, California: Sage Publications, Inc.
Denzin, N., & Lincoln, Y. (1994). "Introduction: Entering the field of qualitative
research", Handbook of Qualitative research. London: Sage Publications.
Disney, S. M., Naim, M. M., & Towill, D. R. (1997). Dynamic simulation
modelling for lean logistics. International Journal of Physical Distribution
& Logistics Management, 27(3/4), 174-196.
Drago, W. A. (1997). When strategic alliances make sense. Industrial
Management & Data Systems, 2, 53-57.
Droge, C., Jayaram, J., & Vickery, S. K. (2004). The effects of internal versus
external integration practices on time-based performance and overall firm
performance. Journal of Operations Management, 22, 557-573.
Eisenhardt, K. M. (1989). Building theories from case study research. Academy of
Management Review, 14(4), 532-550.
Eisenhardt, K. M., & Graebner, M. E. (2007). Theory building from cases:
Opportunities and challenges. Academy of Management Journal, 50(1),
25-32.
Ellinger, A. E. (2000). Improving marketing/logistics cross-functional
collaboration in the supply chain. Industrial Marketing Management, 29,
85-96.
Ellram, L. (1992). International purchasing alliances: An empirical study.
International Journal of Logistic Management, 2(1), 83-95.
Ellram, L. M. (1991). Life-cycle patterns in industrial buyer-seller partnerships.
International Journal of Physical Distribution & Logistics Management,
21(9), 12-21.
Ellram, L. M., & Carr, A. (1994). Strategic purchasing: A history and review of
the literature. International Journal of Purchasing and Materials
Management, Spring, 10-18.
Emerson, R. (1962). Power dependence relations. American Sociological Review,
27(2), 31-41.
Evans, G., Towill, D., & Naim, M. (1995). Business process re-engineering the
supply chain. Production Planning and Control, 6(3), 227-237.
Farrell, M., & Schroder, B. (1998). Power and influence in the buying centre.
European Journal of Marketing, 33(11/12), 1161-1170.
Page 268
250
Fawcett, S., E., Ellram, L. M., & Ogden, J. A. (2007). Supply chain management:
From vision to implementation. New Jersey: Pearson Prentice Hall.
Fawcett, S. E., & Magnan, G. M. (2002). The rhetoric and reality of supply chain
integration. International Journal of Physical Distribution & Logistics
Management, 32(5), 339-361.
Fine, C. (1998). Clockspeed. Perseus Books, New York.
Fisher, M. L. (1997). What is the right supply chain for your product? Harvard
Business Review, March-April, 105-116.
Flynn, B. B., Sakakibara, S., Schroeder, R. G., Bates, K. A., & Flynn, E. J. (1990).
Empirical research methods in Operations Management. Journal of
Operations Management, 9(2), 250-284.
Foggin, J. H., Mentzer, J. T., & Monroe, C. L. (2004). A supply chain diagnostic
tool. International Journal of Physical Distribution & Logistics
Management, 34(10), 827-855.
Forrester, J. W. (1961). Industrial Dynamics. Camebridge, MA: MIT Press.
Frankel, R., Naslund, D., & Bolumole, Y. (2005). The "white space" of logistics
research: A look at the role of methods usage. Journal of Business
Logistics, 26(2), 185-209.
Frohlich, M., & Westbrook, R. (2001). Arcs of integration: An international study
of supply chain strategies. Journal of Operations Management, 19, 185-
200.
Frohlich, M. T. (2002). e-integration in the supply chain: Barriers and
performance. Decision Sciences, 33(4), 537-556.
Fuller, J. B., O'Connor, J., & Rawlinson, R. (1993). Tailored logistics: The next
advantage. Harvard Business Review, May-June, 87-98.
Gadde, L., & Hakansson, H. (2001). Supply chain strategies. Chichester, UK:
John Wiley & Sons Ltd.
Galbraith, J. R. (1994). Competing with flexible lateral organisations. Reading,
MA: Addison-Wesley.
Gattorna, J. L., & Walters, D. (1996). Managing the supply chain: A strategic
perspective. New York: Palgrave Publishers Ltd.
Gaukler, G. M., Seifert, R. W., & Hausman, W. H. (2007). Item-level RFID in the
retail supply chain. Production and Operations Management, 16(1), 65-
76.
Geary, S., Childerhouse, P., & Towill, D. R. (2002). Uncertainty and the seamless
supply chain. Supply Chain Management Review (July/August), 52-61.
Geyskens, I., Steenkamp, J.-B. E. M., Scheer, L. K., & Kumar, N. (1996). The
effects of trust and interdependence on relationship commitment: A trans-
Atlantic study. International Journal Of Research in Marketing, 13, 303-
317.
Gimenez, C. (2004). Supply chain management implementation in the Spanish
grocery sector: An exploratory study. International Journal of Integrated
Supply Management, 1(1), 98-114.
Gimenez, C. (2006). Logistics integration processes in the food industry.
International Journal of Physical Distribution & Logistics Management,
36(3), 231-249.
Gimenez, C., & Ventura, E. (2005). Logistics-production, logistics-marketing and
external integration: Their impact on performance. International Journal
of Operations and Production Management, 25(1), 20-38.
Page 269
251
Goffin, K., Lemke, F., & Szwejczewski, M. (2006). An exploratory study of
'close' supplier-manufacturer relationships. Journal of Operations
Management, (24), 189-209.
Goffin, K., Szwejczewski, M., & New, C. (1997). Managing suppliers: When
fewer can mean more. International Journal of Physical Distribution &
Logistics Management, 27(7), 422-436.
Goldratt, E. M., & Cox, J. (1992). The goal. New York: North River Press.
Gulati, R. & Sytch, M. (2007). Dependence asymmetry and joint dependence in
interorganisational relationships: Effects of embeddedness on a
manufacturer‟s performance in procurement relationships. Administrative
Science Quarterly, 52, 32-69.
Gunasekaran, A., & Ngai, E. W. T. (2004). Information systems in supply chain
integration and management. European Journal of Operational Research,
159, 269-295.
Halldorsson, A., Larson, P. D., & Poist, R. F. (2008). Supply chain management:
A comparison of Scandinavian and American perspectives. International
Journal of Physical Distribution & Logistics Management, 38(2), 126-
142.
Hammer, M. (1990). Reengineering work: Don't automate, obliterate. Harvard
Business Review, July-August, 104-112.
Hammer, M. (2001). The Agenda: What every business must do to dominate the
decade. London: Random House Business Books.
Handfield, R. B., & Bechtel, C. (2004). Trust, power, dependence, and economics:
Can SCM research borrow paradigms? International Journal Integrated
Supply Management, 1(1), 3-25.
Handfield, R. B., & Melnyk, S. A. (1998). The scientific theory-building process:
A primer using the case of TQM. Journal of Operations Management, 16,
321-339.
Handfield, R.B. and Nichols, Jr. E.L., (2002). Supply chain redesign. New Jersey:
Prentice Hall.
Harland, C., Lamming, R., Zheng, J., & Johnsen, T. (2001). A taxonomy of
supply networks. Journal of Supply Management, Fall, 21-28.
Harland, C. M., Caldwell, N. D., Powell, P., & Zheng, J. (2007). Barriers to
supply chain information integration: SMEs adrift of eLands. Journal of
Operations Management, 25, 1234-1254.
Harps, L., & Hansen, L. (2000). The haves and the have nots: Supply chain
practices for the new millenium. Inbound Logistics, January, 75-111.
Harrington, L. (1995). Logistics, agent for change: Shaping the integrated supply
chain. Transportation and Distribution, 36(1), 30-34.
Heckert, J. B., & Miner, R. B. (1940). Distribution costs. New York: The Ronald
Press Company.
Hewitt, F. (1994). Supply chain redesign. The International Journal of Logistics
Management, 5(2), 1-9.
Ho, D.C.K., Au, K.F. & Newton, E. (2002). Empirical research on supply chain
management: A critical review and recommendations. International
Journal of Production Research, 40 (17), 4415-4430.
Holland, C. P. (1995). Cooperative supply chain management: The impact of
interorganisational information systems. Journal of Strategic Information
Systems, 4(2), 117-133.
Page 270
252
Holmberg, S. (2000). A systems perspective on supply chain measurement.
International Journal of Physical Distribution & Logistics Management,
30(10), 847-868.
Holweg, M., Disney, S., Holmström, J., & Smaros, J. (2005). Supply chain
collaboration: Making sense of the strategy continuum. European
Management Journal, 23(2), 170-181.
Houlihan, J. B. (1987). International supply chain management. International
Journal of Physical Distribution & Logistics Management, 17(2), 51-66.
Huan, S. H., Sheoran, S. K., & Wang, G. (2004). A review and analysis of supply
chain operations reference (SCOR) model. Supply Chain Management: An
International Journal, 9(1), 23-29.
Huang, G. Q., & Mak, K. L. (2000). WeBid: A web-based framework to
supportearly supplier involvement in new product development. Robotics
& Computer-Integrated Manufacturing, 16(2/3), 169-179.
Huettner, H., & Song, W. (2007). Follow the leaders: Scoring high on the supply
chain maturity model - Mainland China perspectives on forward-planning
supply chain processes. IBM Institute for Business Value, July, 1-13.
Hugos, M. H. (2003). Essentials of supply chain management. Hoboken, NJ:
Wiley.
Ireland, R., & Crum, C. (2005). Supply chain collaboration: How to implement
CPFR and other best collaborative practices. Boca Raton, FL: J. Ross
Pub.
Jaffe, D. T., & Scott, C. D. (1998). Reengineering in Practice: Where are the
people? Where is the learning? Journal of Applied Behavioral Science,
34(3), 250-267.
Johnson, P. F., & Leenders, M. R. (2008). A longitudinal study of supply
organisational change. Journal of Purchasing and Supply Management,
article in press.
Jones, T. C., & Riley, D. W. (1985). Using inventory for competitive advantage
through supply chain management. International Journal of Physical
Distribution & Logistics Management, 15(5), 16-26.
Kahn, K. B., & Mentzer, J. T. (1998). Marketing's integration with other
departments. Journal of Business Research, 42, 53-62.
Keegan, J., O'Callaghan, E., & Wicox, M. (2001). Facilitators and inhibitors of
supply chain innovation: Prospects for supply chain management in the
Irish grocery sector. Irish Marketing Review, 14(2).
Kettinger, W. J., Teng, J. T. C., & Guha, S. (1997). Business process change: A
study of methodologies, techniques and tools. MIS Quarterly, 21(1), 55-
80.
Kilpatrick, J., & Factor, R. (2000). Logistics in Canada survey: Tracking year
2000 supply chain issues and trends. Materials Management and
Distribution, 45(1), 16-20.
Kim, S. W. (2006). Effects of supply chain management practices, integration and
competition capability on performance. Supply Chain Management: An
International Journal, 11(3), 241-248.
Koplin, J., Seuring, S., & Mesterharm, M. (2007). Incorporating sustainability
into supply chain management in the automotive industry - the case of the
Volkswagen AG. Journal of Cleaner Production, 15, 1053-1062.
Kotzab, H. (2005). The role and importance of survey research in the field of
supply chain management. In H. Kotzab, S. Seuring, M. Mueller & G.
Page 271
253
Reiner (Eds.), Research methodologies in supply chain management.
Heidelberg: Physica-Verlag.
Koufteros, X., Vonderembse, M., & Jayaram, J. (2005). Internal and external
integration for product development: The contingency effects of
uncertainty, equivocality, and platform strategy. Decision Sciences, 36(1),
97-133.
Kraljic, P. (1983). Purchasing must become supply management. Harvard
Business Review, 61(5), 109-117.
Kwak, Y. H., & Anbari, F. T. (2006). Benefits, obstacles, and future of six sigma
approach. Technovation, 26(708-715).
Lalle, B. (2003). The management science researcher between theory and
practice. Organisation Studies, 24(7), 1097-1114.
Lambert, D. M., & Cooper, M. C. (2000). Issues in supply chain management.
Industrial Marketing Management, 29(65-83).
Lambert, D. M., Cooper, M. C., & Pagh, J. D. (1998). Supply chain management:
Implementation issues and research opportunities. International Journal of
Logistic Management, 9(2), 1-19.
Lamming, R. (1993). Beyond partnership: Strategies for innovation and lean
supply. New York: Prentice-Hall.
Larson, P. D., & Lusch, R. F. (1990). Quick response retail technology:
Integration and performance measurement. The international Review of
Retail, Distribution and Consumer Research, October, 17-34.
Lee, H. L. (2000). Creating value through supply chain integration. Supply Chain
Management Review, September/October, 30-36.
Lee, H. L. (2002). Aligning supply chain strategies with product uncertainties.
California Management Review, 44(3), 105-118.
Lee, H. L., & Billington, C. (1992). Managing supply chain inventory: Pitfalls and
opportunities. Sloan Management Review, 33(3), 65-73.
Leonard-Barton, D. (1990). A dual methodology for case studies: Synergistic use
of a longitudinal single site with replicated multiple sites. Organization
Science, 1(3), 248-266.
Lewis, J., Naim, M., Wardle, S., & Williams, E. (1998). Quick scan your way to
supply chain improvement. Control, June.
Lewis, M. W. (1998). Iterative triangulation: A theory development process using
existing case studies. Journal of Operations Management, 16, 455-469.
Li, S., Rao, S. S., Ragu-Nathan, T. S., & Ragu-Nathan, B. (2005). Development
and validation of a measurement instrument for studying supply chain
management practices. Journal of Operations Management, 23, 618-641.
Linderman, K., Schroeder, R., Zaheer, S., & Choo, A. (2003). Six sigma: A goal -
theoretic perspective. Journal of Operations Management, 21(2), 193-203.
Lorenzoni, G., & Lipparini, A. (1999). The leveraging of interfirm relationships as
a distinctive organisational capability: A longitudinal study. Strategic
Management Journal, 20(4), 317-338.
Lummus, R. R., & Vokurka, R. J. (1999). Defining supply chain management: A
historical perspective and practical guidelines. Industrial Management &
Data Systems, 99(1), 11-17.
Maloni, M., & Benton, W. C. (1997). Supply chain partnerships: Opportunities for
operations research. European Journal of Operational Research, 101, 419-
429.
Page 272
254
Mann, I. J. S., Kumar, V., Kumar, U., & Mann, H. (2008). Supply chains: An
organisation theory perspective. The International Journal of Knowledge,
Culture and Change Management, 8(8), 81-93.
Maloni, M., & Benton, W. C. (2000). Power influences in the supply chain.
Journal of Business Logistics, 21(1), 49-73.
Mason-Jones, R., & Towill, D. R. (1998). Shrinking the supply chain uncertainty
circle. Control (September), 17-22.
Mason-Jones, R., & Towill, D. R. (1997). Information enrichment: Designing the
supply chain for competitive advantage. Supply Chain Management, 2(4),
137-148.
Matson, J. E., & Matson, J. O. (2007). Just-in-time implementation issues among
automotive suppliers in the southern USA. Supply Chain Management: An
International Journal, 12(6), 432-443.
McAdam, R., & McCormack, D. (2001). Integrating business processes for global
alignment and supply chain management. Business Process Management
Journal, 7(2), 113-130.
McCarthy, T. M., & Golicic, S. L. (2005). A proposal for case study methodology
in supply chain integration research. In H. Kotzab, S. Seuring, M. Mueller
& G. Reiner (Eds.), Research methodologies in supply chain management.
Heidelberg, Germany: Physica Verlag.
McCutcheon, D. M., & Meredith, J. R. (1993). Conducting case study research in
operations management. Journal of Operations Management, 11, 239-256.
Mejias-Sacaluga, A., & Prado-Prado, J. C. (2002). Integrated logistics
management in the grocery supply chain. The International Journal of
Logistics Management, 13(2), 67-77.
Mentzer, J. T., Foggin, J. H., & Golicic, S. L. (2000). Collaboration: The enablers,
impediments, and benefits. Supply Chain Management Review,
September/October, 52-58.
Mentzer, J. T., & Kahn, K. B. (1995). A framework of logistic research. Journal
of Business Logistics, 16(1), 231-250.
Mentzer, J. T., & Konrad, B. P. (1991). An efficiencies/effectiveness approach to
logistics performance analysis. Journal of Business Logistics, 12, 33-62.
Mentzer, J. T., Min, S., & Bobbitt, L. M. (2004). Toward a unified theory of
logistics. International Journal of Physical Distribution & Logistics
Management, 34(8), 606-627.
Meredith, J. (1998). Building operations management theory through case and
field research. Journal of Operations Management, 16, 441-454.
Min, S., & Mentzer, J. T. (2000). The role of marketing in supply chain
management. International Journal of Physical Distribution & Logistics
Management, 30(9), 765-787.
Mollenkopf, D., & Dapiran, G. P. (2005). World-class logistics: Australia and
New Zealand. International Journal of Physical Distribution & Logistics
Management, 35(1), 63-74.
Monczka, R. M., Callahan, T. J., & Nichols Jr, E. L. (1995). Predictors of
relationships among buying and supplying firms. International Journal of
Physical Distribution & Logistics Management, 25(10), 45-59.
Morash, E. A., & Clinton, S. R. (1997). The role of transportation capabilities in
international supply chain management. Transportation Journal, Spring,
5-17.
Page 273
255
Motwani, J., Larson, L., & Ahuja, S. (1998). Managing a global supply chain
partnership. Logistics Information Management, 11(6), 349-354.
Mouritsen, J., Skjott-Larsen, T., & Kotzab, H. (2003). Exploring the contours of
supply chain management. Integrated Manufacturing Systems, 14(8), 686-
695.
Murphy, P. R., & Poist, R. F. (1992). The logistics-marketing interface:
Techniques for enhancing cooperation. Transportation Journal, Winter,
15-22.
Myhr, N., & Spekman, R. E. (2005). Collaborative supply-chain partnerships built
upon trust and electronically mediated exchange. The Journal of Business
and Industrial Marketing, 20(4/5), 179-186.
Naim, M. M., Childerhouse, P., Disney, S., & Towill, D. R. (2002). A supply
chain diagnostic methodology: Determining the vector of change.
Computers & Industrial Engineering, 43, 135-157.
Narasimhan, R., & Das, A. (2001). The impact of purchasing integration and
practices on manufacturing performance. Journal of Operations
Management, 19, 593-609.
Narasimhan, R., & Kim, S. W. (2001). Information system utilization strategy for
supply chain integration. Journal of Business Logistics, 22(2), 51-75.
Naslund, D. (2002). Logistics need qualitative research - especially action
research. International Journal of Physical Distribution & Logistics
Management, 32(5), 321-338.
Naylor, J. B., Naim, M. M., & Berry, D. (1999). Leagility: Integrating the lean
and agile manufacturing paradigms in the total supply chain. International
Journal of Production Economics, 62, 107-118.
Netland, T. H., Alfnes, E., & Fauske, H. (2007). How mature is your supply
chain? A supply chain maturity assessment test. Paper presented at the
Euroma, Ankara 17.06. - 20.06.
New, S. J., & Payne, P. (1995). Research frameworks in logistics: Three models,
seven dinners and a survey. International Journal of Physical Distribution
& Logistics Management, 25(10), 60-77.
NIST (2004). Planning report 04-2: Economic impact of inadequate infrastructure
for supply chain integration. Viewed 12 March 2009,
http://www.nist.gov/director/prog-ofc/report04-2.pdf.
Novack, R. A., & Simco, S. W. (1991). The industrial procurement process: A
supply chain perspective. Journal of Business Logistics, 12(1), 145-167.
Oliver, R. K., & Webber, M. D. (1982). Supply-chain management: Logistics
catches up with strategy. In M. Christopher (Ed.), Logistics: The strategic
issue (pp. 63-75). London: Chapman & Hall.
Olsen, R. F., & Ellram, L. M. (1997). A portfolio approach to supplier
relationship management. Industrial Marketing Management, 26, 101-113.
Ota, M. (2001). The concepts of production-marketing integration towards agile
manufacturing. International Journal Manufacturing Technology and
Management, 3(3), 225-237.
Pagell, M. (2004). Understanding the factors that enable and inhibit the
integration of operations, purchasing and logistics. Journal of Operations
Management, 22, 459-487.
Peck, H., & Juttner, U. (2000). Strategy and relationships: Defining the interface
in supply chain contexts. The International Journal of Logistics
Management, 11(2), 33-44.
Page 274
256
Pfeffer, J. & Salancik, G.R. (1978). The external control of organisations. New
York: Harper and Row.
Poirier, C. C., & Quinn, F. J. (2003). A survey of supply chain progress. Supply
Chain Management Review, 7(5), 40-47.
Post, J. E., & Altman, B. W. (1994). Managing the environmental change process:
Barriers and opportunities. Journal of Organizational Change
Management, 7(4), 64-81.
Potter, A., & Bowles, D. (2006). Developing the Quick Scan Audit Methodology
as a tool for the steel industry. Paper presented at the 14th International
Working Seminar on Production Economics, Innsbruck.
Potter, A., Mason, R., Naim, M., & Lalwani, C. (2004). The evolution towards an
integrated steel supply chain: A case study from the UK. International
Journal Production Economics, 89, 207-216.
Potter, A., Towill, D. R., Böhme, T., & Disney, S. (2009). The influence of
production strategy on factory induced bullwhip. International Journal of
Production Research, 47(20), 5739-5759.
Power, D. (2005). Supply chain management integration and implementation: A
literature review. Supply Chain Management, 10(3/4), 252-263.
Raisinghani, M. S., Ette, H., Pierce, R., Cannon, G., & Daripaly, P. (2005). Six
Sigma: Concepts, tools, and applications. Industrial Management & Data
Systems, 105(4), 491-505.
Randolph, W. A., & Sashkin, M. (2002). Can organizational empowerment work
in multinational settings? Academy of Management Executives, 16(1), 102-
115.
Reijers, H. A., & Liman Mansar, S. (2005). Best practice in business process
redesign: An overview and qualitative evaluation of successful redesign
heuristics. Omega, 33, 283-306.
Rogers, D., & Tibben-Lembke, R. (1999). Going backwards: Reverse logistics
trends and practices. Reverse Logistics Executive Council.
Romano, P. (2003). Co-ordination and integration mechanisms to manage
logistics processes across supply networks. Journal of Purchasing and
Supply Management, 9, 119-134.
Rosenzweig, E.D., Roth, A.V. & Dean, J.W. Jr (2003). The influence of an
integration strategy on competitive capabilities and business performance.
Journal of Operations Management, 21 (4), 437-456.
Sabath, R. (1995). Volatile demand calls for quick response: The integrated
supply chain. Logistics Information Management, 8(2), 49-52.
Sabri, E. H., & Beamon, B. M. (2000). A multi-objective approach to
simultaneous strategic and operational planning in supply chain design.
Omega, 28, 581-598.
Sanderson, J. (2005). Opportunity and constraint in business-to-business
relationships: Insights from strategic choice and zones of Manoeuvre.
Supply Chain Management: An International Journal, 9(5), 392-401.
Schmenner, R. W., & Swink, M. L. (1998). On theory in operations management.
Journal of Operations Management, 17, 97-113.
Schonberger, R. J. (1986). World class manufacturing: The lessons of simplicity
applied. New York: Free Press.
Scott, C., & Westbrook, R. (1991). New strategic tools for supply chain
management. International Journal of Physical Distribution & Logistics
Management, 21(1), 23-33.
Page 275
257
Seuring, S. (2005). Case study research in supply chains - An outline and three
examples. In H. Kotzab, S. Seuring & G. Reiner (Eds.), Research
methodologies in supply chain management (pp. 619). Heidelberg,
Germany: Physica-Verlag.
Seuring, S., & Mueller, M. (2007). Integrated chain management in Germany -
Identifying schools of thought based on a literature review. Journal of
Cleaner Production, 15, 699-710.
Simatupang, T. M., & Sridharan, R. (2004a). A benchmarking scheme for supply
chain collaboration. Benchmarking: An International Journal, 11(1), 9-30.
Simatupang, T. M., & Sridharan, R. (2004b). The collaboration index: A measure
for supply chain collaboration. International Journal of Physical
Distribution and Logistics Management, 35(1), 44-62.
Singh, P. J., Smith, A., & Sohal, A. S. (2005). Strategic supply chain management
issues in the automotive industry: An Australian perspective. International
Journal of Production Research, 43(16), 3375-3399.
Sinha, R. K., & Babu, S. A. (1998). Quality of customer service in supply chain
system: A diagnostic study. International Journal of Quality & Reliability
Management, 15(8/9), 844-859.
Sirkin, H. L., Keenan, P., & Jackson, A. (2005). The hard side of change
management. Harvard Business Review, October, 109-118.
Spekman, R. E., Kamauff Jr., J. W., & Myhr, N. (1998). An empirical
investigation into supply chain management: A perspective on
partnerships. International Journal of Physical Distribution & Logistics
Management, 28(8), 630-650.
Stalk, G., Evans, P., & Shulman, L. E. (1992). Competing on capabilities: The
new rules of corporate strategy. Harvard Business Review, 70(2), 57-69.
Stalk, G. H., & Hout, T. M. (1990). Competing against time: How time based
competition is re-shaping global markets. New York: Free Press.
Stank, T. P., Daugherty, P. J., & Ellinger, A. E. (1999a). Marketing/Logistics
integration and firm performance. International Journal of Logistics
Management, 10(1), 11-24.
Stank, T. P., Keller, S. B., & Closs, D. J. (1999b). Performance benefits of supply
chain logistical integration. Journal of Business Logistics, 20(2), 21-41.
Stefansson, G. (2002). Business-to-business data sharing: A source for integration
of supply chain. International Journal of Production Economics, 75, 135-
146.
Stern, L. W., & El-Ansary, A. I. (1992). Marketing channels. Englewood Cliffs,
NJ: Prentice-Hall.
Stevens, G. C. (1989). Successful supply-chain management. Management
Decision, 28(8), 25-30.
Storey, J., Emberson, C., & Reade, D. (2005). The barriers to customer responsive
supply chain management. International Journal of Operations and
Production Management, 25(3), 242-260.
Stuart, I., McCutcheon, D. M., Handfield, R. B., McLachlin, R., & Samson, D.
(2002). Effective case research in operations management: A process
perspective. Journal of Operations Management, 20, 419-433.
Sun, S., Hsu, M. & Hwang, W. (2009). The impact of alignment between supply
chain strategy and environmental uncertainty on SCM performance.
Supply Chain Management: International Journal, 14(3), 201-212.
Page 276
258
Swink, M., Narasimhan, R., & Wang, C. (2007). Managing beyond the factory
walls: Effects of four types of strategic integration on manufacturing plant
performance. Journal of Operations Management, 25, 148-164.
Szwejczewski, M., Lemke, F., & Goffin, K. (2005). Manufacturing-supplier
relationships: An empirical study of German manufacturing companies.
International Journal of Operations & Production Management, 25(9),
875-897.
Thompson, A. A., & Strickland, A. J. (2003). Strategic management: Concepts
and cases. New York: McGraw-Hill Higher Education.
Thorelli, H. B. (1986). Networks: Between markets and hierachies. Strategic
Management Journal, 7, 37-51.
Towill, D. R. (1997a). Forridge - Principles of good practice in material flow.
Production Planning and Control, 8(7), 622-632.
Towill, D. R. (1999a). Management theory: Is it of any practical use? Or how
does a fad becomes a paradigm? Engineering Management Journal, June,
111-122.
Towill, D. R. (1999b). Simplicity wins: Twelve rules for designing effective
supply chains. Control, March, 9-13.
Towill, D. R. (2005). A perspective on UK supermarket pressures on the supply
chain. European Management Journal, 23(4), 426-438.
Towill, D. R., Childerhouse, P., & Disney, S. (2002). Integrating the automotive
supply chain: Where are we now? International Journal of Physical
Distribution & Logistics Management, 32(2), 79-95.
Towill, D. R. (1997b). The seamless supply chain - the predator's strategic
advantage. International Journal of Technology Management, 13(1), 37-
56.
Towill, D. R., Childerhouse, P., & Disney, S. M. (2000). Speeding up the progress
curve towards effective supply chain management. Supply Chain
Management: An International Journal, 5(3), 122-130.
Tranfield, D., & Starkey, K. (1998). The nature, social organization and
promotion of management research: Towards policy. British Journal of
Management, 9(4), 341-353.
Trkman, P., Stemberger, M. I., Jaklic, J., & Groznik, A. (2007). Process approach
to supply chain integration. Supply Chain Management: An International
Journal, 12(2), 116-128.
van der Vaart, T., & van Donk, D. P. (2004). Buyer focus: Evaluation of a new
concept for supply chain integration. International Journal of Production
Economics, 92, 21-30.
van der Vaart, T., & van Donk, D. P. (2006). Buyer-focused operations as a
supply chain strategy: Identifying the influence of business characteristics.
International Journal of Operations and Production Management, 26(1),
8-23.
van der Vaart, T., & van Donk, D. P. (2008). A critical review of survey-based
research in supply chain integration. International Journal of Production
Economics, 111, 42-55.
van der Vorst, J. G. A. J., & Beulens, A. J. M. (2002). Identifying sources of
uncertainty to generate supply chain redesign strategies. International
Journal of Physical Distribution & Logistics Management, 32(6), 409-
430.
Page 277
259
van der Vorst, J.G.A.J., van Dijk, S.J. & Beulens, A.J.M. (2001). Supply chain
design in the food industry. International Journal of Logistics
Management, 12(2), 73-85.
van Donk, D. P., Akkerman, R., & van der Vaart, T. (2008). Opportunities and
realities of supply chain integration: The case of food manufacturers.
British Food Journal, 110(2), 218-235.
van Donk, D. P., & van der Vaart, T. (2005a). Methodological issues. In H.
Kotzab, S. Seuring, M. Mueller & G. Reiner (Eds.), Research
methodologies in supply chain management. Heidelberg: Physica Verlag.
van Donk, D. P., & van der Vaart, T. (2004). Business conditions, shared
resources and integrative practices in the supply chain. Journal of
Purchasing and Supply Management, 10, 107-116.
van Donk, D. P., & van der Vaart, T. (2005b). A case of shared resources,
uncertainty and supply chain integration in the process industry.
International Journal of Production Economics, 96, 97-108.
Van Landeghem, R., & Persoons, K. (2001). Benchmarking of logistical
operations based on a causal model. International Journal of Operations
& Production Management, 21(1/2), 254-266.
Vickery, S. K., Jayaram, J., Droge, C., & Calantone, R. (2003). The effects of an
integrative supply chain strategy on customer service and financial
performance: An analysis of direct versus indirect relationships. Journal of
Operations Management, 21, 523-539.
Vidal, C.J. & Goetschalck, M. (2000). Modelling the effect of uncertainty on
global logistics systems. Journal of Business Logistics, 21 (1), 95-120.
Voss, C., Tsikriktsis, N., & Frohlich, M. (2002). Case research in operations
management. International Journal of Operations and Production
Management, 22(2), 195-219.
Walker, H., Di Sisto, L., & McBain, D. (2008). Drivers and barriers to
environmental supply chain management practices: Lessons from the
public and private sector. Journal of Purchasing and Supply Management,
article in press.
Walters, D. (1999). Marketing and operations management: An integrated
approach to new ways of delivering value. Management Decision, 37(3),
248-258.
Walters, D. (2008). Demand chain management + response management =
increased customer satisfaction. International Journal of Physical
Distribution & Logistics Management, 38(9), 699-725.
Walters, D., & Jones, P. (2001). Value and value chains in healthcare: A quality
management perspective. The Total Quality Management Magazine,
13(5), 319-333.
Walters, D., & Lancaster, G. (1999). Value and information - concepts and issues
for management. Management Decision, 37(8), 643-656.
Watson, G. H. (1994). Business Process Engineering. New York: John Wiley and
Sons.
Westbrook, R. (1994). Action research: A new paradigm for research in
production and operations management. International Journal of
Operations and Production Management, 15(12), 6-20.
Whipple, J. M., & Frankel, R. (2000). Strategic alliance success factors. The
Journal of Supply Chain Management, Summer, 21-28.
Page 278
260
Wilson, T. H., & Sankaran, J. K. (2001). Vendor-manufacturer partnerships in the
supply chain: An inductive case study from New Zealand. Advances in
Qualitative Organisation Research, 3, 205-251.
Wisner, J. D., Leong, G. K., & Tan, K.-C. (2005). Principles of supply chain
management: A balanced approach. Mason, Ohio: Thomson South-
Western.
Womack, J. P., & Jones, D. T. (2005). Lean consumption. Harvard Business
Review, 83(3), 58-68.
Wong, C. Y., & Boon-itt, S. (2008). The influence of institutional norms and
environmental uncertainty on supply chain integration in the Thai
automotive industry. International Journal of Production Economics,
Accepted Manuscript.
Yaibuathet, K., Enkawa, T., & Suzuki, S. (2006). Influential factors in
establishing supply chain performance in east asian countries. Paper
presented at the EUROMA, Glasgow.
Yin, R. K. (1994). Case study research : Design and methods (2nd
ed.). Thousand
Oaks: Sage Publications.
Youndt, M. A., Snell, S. A., Dean Jr., J. W., & Lepak, L. P. (1997). Human
resource management, manufacturing strategy, and firm performance.
Academy of Management Journal, 39(4), 836-866.
Zailani, S., & Rajagopal, P. (2005). Supply chain integration and performance:
US versus East Asian companies. Supply Chain Management: An
International Journal, 10(5), 379-393.
Zhao, X., Huo, B., Flynn, B. B., & Yeung, J. H. Y. (2008). The impact of power
and relationship commitment on the integration between manufacturers
and customers in a supply chain. Journal of Operations Management, 26,
368-388.
Page 279
261
Appendices
Appendix A: Gimenz (2004) investigation into supply chain
integration
Appendix A.1: Barriers to supply chain integration
Table A. 1: Barriers to implementing SCM programmes
Barriers Ratio
History, habits (traditional commercial relationship) 2/14
Knowledge (the need of a know how) 1/14
Size 1/14
Information systems and information technologies 4/14
Culture and attitudes of people working in the company 8/14
Departmental barriers 4/14
Lack of trust 4/14
Lack of culture of sharing information 1/14
Being afraid of the benefits going only to the retailer 3/14
Conditions established by retailers (such as small batches) 1/14
Source: Gimenez, 2004
Page 280
262
Appendix A.2: Validation of the supply chain integration assessment tool using Gimenez (2004) case description
Table A.2: Application of Gimenez (2004) case description to the developed supply chain integration assessment tool
Manufacturer
from Gimenez
(2004)
Degree of integration
according to Gimenez
(2004)
People Relationship
Management
Information
Systems
Information
sharing
Final Comment
Manufacturer A Developing external ✔ ✔ ━ ✔ Consistent
Manufacturer B Internal ━ ━ ━ ━ Insufficient evidence to assess
internal integration
Manufacturer C Internal, starting external ✔ ✔ ━ ✔ Consistent
Manufacturer D Internal and external ✔ ✔ ✔ ✔ Consistent
Manufacturer E Internal, starting external ✔ ✔ ✔ ✔ Consistent
Manufacturer F Internal and external
integrated ✔ ✔ ✔ ✔ Consistent
Manufacturer G Not internal integrated yet
but signs of externally
integrated
✔ ✔ ━ ⇓ Slightly lower assessment
Manufacturer H Neither internal nor
externally integrated ✔ ✔ ✔ ✔ Consistent
Manufacturer I Internally and externally
integrated ✔ ✔ ✔ ✔ Consistent
Retailer 1 Internal and external ✔ ⇓ ⇓ ⇓ Slightly lower external assessment
Retailer 2 Neither internal nor
externally integrated ⇑ ⇑ ━ ⇑ Slightly higher assessment
Retailer 3 Neither internal nor
externally integrated ✔ ✔ ━ ━ Consistent, however only 2 data
points
Retailer 4 Internal and external ✔ ✔ ✔ ✔ Consistent
Retailer 5 Internal and external ✔ ✔ ⇓ ⇓ Slightly lower assessment
Retailer 6 Neither internal nor
externally integrated ✔ ✔ ━ ✔ Consistent
Source: Author
Page 281
263
Appendix B: Further supply chain assessment techniques
B.1 Other commercially available supply chain assessment techniques
1) Andersen Consulting developed a web-based supply chain diagnostic tool
called the Supply Chain Value Assessment Model. It was promoted as
enabling users to cut the time spent on a supply chain evaluation process to
less than four weeks (Foggin et al., 2004).
2) The Ernst and Young Navigator is developed from an IT approach to suit
business process reengineering programs. The Navigator contains a tool box
with a best practise database, example work sheets and an implementation
methodology. However, it is only available via consultant and under licence
(Towill 1999a).
3) The IBM on demand supply chain maturity model is a tool that IBM designed
for evaluation of how customer-driven and responsive a supply chain is. The
model groups supply chains into the following five categories of increasing
integration, customer-orientation and responsiveness: (1) static supply chain;
(2) functional excellence; (3) horizontal integration; (4) external collaboration
and (5) on demand supply chain (Huettner & Song, 2007)
Page 282
264
B.2 Other academically available supply chain assessment techniques
1. Allen & Helferich (1990) suggested the use of expert systems for supply
chain and logistics diagnoses. However, these examples were, in large part,
narrowly focused on limited functions within purchasing and logistics. Like
most such expert systems, Allen & Helferich (1990) used heuristics to work
through decision trees or networks to reach decisions.
2. Mentzer & Konrad (1991) describe a process to develop a tailored, company-
specific, performance measurement system built upon an earlier diagnostic
12-step process by Novak (1984) to budget transportation costs.
3. Sinha & Babu‟s (1998) diagnostic study termed „Depot Service Index‟ was
intended to provide insight into the dynamics of a supply chain. The Index
applies statistical techniques, including analysis of variance (ANOVA) and
multiple regression. Four clusters of facilities were identified and the
properties of each cluster were analysed, which enabled the authors to
develop a supply chain simulation model.
Page 283
265
Appendix C: Supply chain integration maturity questionnaire
Select a single value stream to analysis. The value stream should be a major product family that is reasonably representative of the supply chain operations. If
necessary repeat the questionnaire for other value streams if major differences are present.
Organisation Name
Interviewee Name
Product Name
Brief description of the product and its associated value stream
Major value adding processes (e.g. assembly or machining)
Location of Plant/ organisation
Outbound Logistics Definition Response Units
Customer
Delivery Lead Time
Please state the time between when a firm order is placed and when the product is delivered.
(Call-off)
Customer
Delivery Frequency
State the frequency of deliveries to your customers for the specified product.
Number of Customers Please state the number of alternative customer companies.
Customer Locations State the number of customer locations the specified product is deliver to.
Customer
Delivery Distance
State the average customer delivery distance.
Page 284
266
Internal Logistics Definition Response Units
B.O.M. Levels Please state the number of levels in the Bill of Materials for the specified product.
Manufacturing Lead Time
State the average time between when the raw materials are taken out of stock to when the
final product is completed ready for delivery.
Position of De-Coupling
Point
Products are manufactured and distributed to stocking points close to the customer.
End products are held in stock at the end of the production then sent to customers on demand.
Sub-assemblies held in stock, no FG stock, final assembly triggered by specific customer
order. Only raw materials are kept in stock; each order for a customer is a specific project.
No stocks are kept at all; purchasing takes place on the basis of the specific customer order.
Make and ship to stock
Make to stock
Assemble to order
Make to order
Purchase and make to order
Product Characteristics Definition Response Units
Product Variety State the number of variants of finished goods for the specified product. (i.e. FG live part
numbers)
Product Margins What is the products profit margin?
Annual Volume What was last years total sales volume? Please also specify the units (e.g. tones, pallets).
Echelons from end consumer Number of organisations carrying out activities on the product before end consumption,
excluding transport.
Length of product life-cycle Please state your best estimate of the products total life-cycle length.
Customer Schedule Stability Please give your best estimate of the percentage variation between what was scheduled one
month ahead and what was actually required on the day.
Stage of product life-cycle Which of the three alternatives best describes the current stage of the products life-cycle? Infancy Maturity
Decline
Page 285
267
Inbound Logistics Definition Response Units
Number of Suppliers How many different suppliers do you require for the specified product?
Customer Specified
Suppliers
How many suppliers are specified by the customer?
Suppliers Delivery Lead
Time
Please state the average time between when you place a firm order with your suppliers and
when they deliver the product (Call-off).
Suppliers Delivery
Frequency
How frequently do your suppliers deliver components for the two specified products?
Suppliers Delivery Distance State the average delivery distance for the suppliers of the specified product.
Bought Out Components How many different bought out components are required to produce one product?
Supplier relationships On the whole how close a relationship do you have with your suppliers?
Partnership Adversarial
1 2 3 4
Source: Childerhouse, 2002
Page 286
268
Complex Material Flow
Class of symptoms
Symptoms of complex material flow
Observed Symptom
1= present, 2= not present or ?= not looked
for or investigated
Dynamic behaviour Systems-induced behaviour observed in demand patterns.
System behaviour often unexpected and counter-intuitive.
Causal relationships often geographically separated.
Excessive demand amplification as orders are passed upstream.
Rogue orders induced by system “Players”.
Poor and variable customer service levels.
Physical situation Large and increasing number of products per pound of turnover.
High labour content.
Multiple production and distribution points.
Large pools of inventory throughout the system.
Complicated material flow patterns.
Poor stores control.
Operational
characteristics
Shop floor decisions based on batch-and-queue.
“Interference” between competing value streams.
Causal relationships often well separated in time.
Failure to synchronise all orders and acquisitions.
Failure to compress lead times.
Variable performance in response to similar order patterns.
Organisational
characteristics
Decision-making by functional groups.
Excessive quality inspection.
Multiple independent information systems.
Overheads and indirect costs allocated across product groups, and not by activity.
Excessive layers of management between CEO and shop floor.
Bureaucratic and lengthy decision-making process.
Source: Childerhouse & Towill, 2003
Page 287
269
Simplified Material Flow Questionnaire
For each of the following 12 simplicity rules rank how closely they are adhered to.
Rule Description and definition Adherence
(1=never, 2=sometimes, 3=most of the
time or 4=always)
1 Only make products which can be quickly despatched and invoiced to customers
2 In any one „time bucket‟ only make components needed for assembly in the next period
3 Streamline material flow and minimise throughput time, i.e. compress all lead times.
4 Use the shortest planning period, i.e. the smallest run quantity that can be managed efficiently
5 Only take deliveries from suppliers in small batches as and when needed for processing or assembly
6 Synchronise „time buckets‟ throughout the supply chain
7 Form natural clusters of products and design processes appropriate to each value stream
8 Eliminate all uncertainties from all processes
9 Understand, document, simplify and only then optimise (UDSO) the supply chain
10 Streamline and make highly visible all information flows throughout the chain
11 Use only proven, simple yet but robust Decision Support Systems
12 The operational target is to facilitate a Seamless supply chain i.e. all players to “think and act as one”
Source: Childerhouse & Towill, 2003
Page 288
270
Uncertainty Questionnaire
Questions asked of each value stream
Rating by QS Team
Strongly
agree
Weakly
agree
Weakly
disagree
Strongly
disagree
The value added process(es) generates low system
uncertainty
1
2
3
4
The supplier side generates
low system uncertainty
1
2
3
4
The demand side generates
low system uncertainty
1
2
3
4
The system controls
do not generate uncertainty
1
2
3
4
Source: Towill et al., 2002
Page 289
271
Appendix D: Quick Scan reports
D.1: Forestry – Quick Scan report
Executive Summary
Forestry supply chain achieved functional integration and is moving towards
internal integration. Seven improvement areas were identified: cross-functional
integration, implementation of one overall ERP/information systems, conversion
from tacit to explicit knowledge, reduction of stock levels at every point of the
supply chain, implementation of strategic procurement to overcome supplier
dominance, customer relationship management and trimming cost improvement.
Islands of good practise have been identified; those good practises need to be
better integrated so as to optimise the whole. The current loosely coupled
information system is inadequate and has been adapted several times, but is
currently holding back the organisation in terms of full systems visibility and
supply chain integration. Finally, regarding staff development, a silo mentality
needs to be addressed by adopting cross-functional performance measures.
Forestry needs to invest in staff, plus a range of actions to reinforce a cross-
functional, team-based Forestry culture.
Quick Scan Audit Methodology
The Quick Scan is a tried and tested method for auditing the health of supply
chains. Five researchers from the University of Waikato conducted the audit in
February 2006. In total, 26 person days were invested in evaluating the status of
supply chain operations at Forestry. The Quick Scan team examined the
integration of the internal supply chain and its fit with the wider supply chain.
Findings
The overall level of supply chain integration was judged somewhat on a medium
level, mostly due to internal procedures that result in control uncertainty. Of the
two value streams, Pulp was better integrated and was placed above the mid-point
(46th
percentile) - when compared to the value streams of 70 other companies. In
Page 290
272
contrast the Paper process suffered slightly from higher demand uncertainty and
was ranked at the 57th
percentile.
Although the Quick Scan was primarily focused on identifying weaknesses and
developing a route map for advancement at Forestry, four important positive
aspects were noted during the investigation:
1. Forestry operates in a very efficient manner with an increased plant reliability
despite age.
2. There is a strong desire for improvement at all levels within the organisation.
3. Employees have strong ability to work around problems including
knowledgeable operations managers.
4. A good and strong working relationship with five of their key suppliers.
Seven major areas of shortcoming were observed namely functional silos,
multiple loosely coupled information system, lack of integration inbound and
outbound, high tacit knowledge in all areas of supply chain activities, high stock
levels (including low stock turns especially with maintenance) and high paper
trimming cost.
Information systems / Stock levels
It was noted that Forestry currently operates with multiple independent and
loosely coupled information systems which leads towards incomplete and
inadequate end-to-end information flows.
Considering the size of the organisation, the ideal long-term and costly solution
for Forestry would be a fully integrated information system (ERP). However,
even in the medium term an IS solution for inbound logistics and In-Transit
finished good stocks would gain high benefits by reducing excessive stock levels.
Strategic Procurement / High Stock levels
Forestry‟s supplier base numbers 1206 suppliers. Twenty out of 1206 are
currently main suppliers and of strategic importance for the organisation however,
the investigation identified that Forestry is highly dependent on some of their key
strategic suppliers.
Page 291
273
Solutions to such problems are suggested for the medium and long term. Forestry
needs to address procurement from a strategic point of view to reduce its supplier
base and manage relationships with key strategic suppliers. Further, ways need to
be identified to overcome the strong supplier dependency. A more strategic
approach to procurement will automatically also lead to a reduction of stock levels
on the inbound side, due to better information flows, consignment stock and/or
VMI (vendor managed inventory) agreements.
Customer Integration / High stock levels
Forestry currently operates in a plant efficiency mode instead of focusing on
effectiveness. Therefore, Forestry has NZD 1.9 million finished good holding
costs. Solutions to such problems are again rather medium to long term. Firstly
Forestry needs to segment their customers and analyse them. In a second step a
customer/market profitability analysis needs to be undertaken. From those
analysis long-term customer alliance can be build up which will support forecast
accuracy and therefore reduce stock levels on the outbound side.
High paper trimming cost
Currently paper is produced “make to order” and trimmed to the customer needs.
The “make to order” strategy causes the current yield produces too much waste.
Forestry is on average 5 days behind schedule. A statistical correlation has been
identified between trimming costs and days late what leads towards excessive
trimming costs.
A significant percentage of the paper has been identified as a functional type
product. Therefore, Forestry should make paper to stock and to order to reduce
waste to a minimum. To be able to do that Forestry needs to catch up with current
production and reduce the production delays down to 0. This will also have a great
impact on the reduction of the trimming cost.
Tacit Knowledge
Forestry has knowledgeable staff especially on the shop floor. Most of the staff
members are with the organisation for decades and therefore gained especially
tacit plant knowledge. Forestry currently has no procedure in place to capture the
Page 292
274
knowledge that is tight up in individuals. Forestry needs to address this problem to
all staff members and convert the tacit knowledge into explicit knowledge by
mapping out processes, update manuals for modified machinery and by writing
down procedures.
Staff Development / Functional silos
Reasons for Forestry‟s functional silos are many (and common to most
organisations); for example, the geographical dispersion of production and
management fosters a „them and us‟ mentality supported by a strong union culture
and the organisational structure obstructs the horizontal flow of information and
teamwork across functional boundaries. Further, existing performance measures
and reward systems are primarily functionally focused and show inconsistency
„down‟ the organisation. To overcome this functionalism in the short term
Forestry needs to emphasize the importance of cross-training at all organisation
levels. In a second step a training matrix should be developed.
Forestry‟s functional areas are also not interlinked. A systems perspective of a
supply chain clearly identifies the need for optimisation of the whole of the
system; not just each of the sub-systems. To help overcome this, cross-functional
performance measures need to be developed, and staff on either side of the
functional boundaries made aware of each others needs and problems; the
potential for working together jointly is to vastly improve performance. Second,
shared total process performance indicators are needed, and staff should be
empowered to make production improvements without the need to refer to higher
authority; simple measures of customer service and cost-to-serve would be
appropriate here. Third, a most important change is the introduction of total
process owners having authority to operate across multiple functions and
empowered to challenge the functional heads. This would result in a more matrix-
type organisational structure, with total process champions for product groups.
Further, hiring excellent staff and investing in their training, and having clearly
linked shared goals and reward systems tied to the strategic plan, will help cement
in place and continually refresh a new company culture of Forestry being a great
place to work.
Page 293
275
D.2: Food 1 Quick Scan Report
Executive Summary
Overall, the supply chain was judged to be in very good health and with many
examples of best practise. Three areas requiring improvement were identified:
cross-functional integration, information systems development/use and market
orientation. There are islands of excellence that need to be better integrated so as
to optimise the whole, rather than each functional area; this can be achieved
through shared performance indicators and total process champions. The current
ERP system is inadequate and has been adapted as best possible, but is currently
holding back the organisation in terms of full systems visibility and supply chain
integration. Finally, the single focus on efficiency is not appropriate for all
product types; specific value streams need to be partitioned and a more responsive
supply chain developed for the innovative/fashionable products.
Quick Scan Audit Methodology
The Quick Scan is a tried and tested method for auditing the health of supply
chains. Four researchers from the University of Waikato conducted the audit in
June 2006. In total, 22 person days were invested in evaluating the status of the
Food 1‟s (NZ) supply chain operations. In particular, the Quick Scan team
examined the integration of the internal supply chain and its fit with the wider
supply chain.
Findings
The overall level of supply chain integration was very good; in fact the three
products studied in depth are the best of fourteen examined in New Zealand to-
date. From a more global perspective, Food 1‟s supply chain maturity is in the top
ten percentile. In particular, the team noted operational excellence in procurement,
manufacturing and logistics. Further, the audit team was especially impressed
with the „can-do‟ attitude of middle and senior management and their positive
mindset towards change.
Page 294
276
The Quick Scan is primarily focused on identifying weaknesses and developing a
route map for advancement. To this end three major shortcomings were observed;
functional silos, information systems development/use and market orientation. It
was noted that a strategic imperative for Food 1 is "... to deliver lowest cost,
flexible, responsive, high valued-added manufacturing” (FOOD 1 Strategic Plan
FY07-FY09 dated Nov. 2005); consequently, the following conclusions and
improvement opportunities are being made within that strategic context:-
Food 1 Functional Silos
The excellent functional areas are not fully interlinked, with limited cross-
functional trade-off analysis. A systems perspective of a supply chain clearly
identifies the need for optimisation of the whole, not each, of the sub-systems.
Hence, as indicated above, to advance the effectiveness of the Food 1 supply
chain a more holistic perspective is required with a total process-based focus.
The reasons for the functional silos are many and common to most organisations.
The geographical dispersion of marketing and manufacturing fosters a „them and
us‟ mentality. The historical and somewhat traditional hierarchical organisational
structure obstructs the horizontal flow of information and team work across
functional boundaries. Further, performance measures and reward systems are
primarily functionally focused and (for example) limit acceptance of extra costs in
one area for a large decrease in costs in another.
To overcome this functionalism, four key improvement opportunities are
suggested based on theoretical and practical best practise. First, more performance
indicators must be cross-functional and those on either side of the functional
boundaries made aware of each other and the potential of working together to
jointly improve performance. Second, a number of total process performance
indicators are required that all members share and are empowered to improve.
Simple measures like customer service and cost-to-serve would be appropriate.
Third, the most important and key change is the introduction of total process
owners that cut across multiple functions and are empowered to challenge
functional heads. This would result in a more matrix type organisational structure,
Page 295
277
with total process champions for product groups. Finally, an effective enterprise
information system (discussed below) would provide visibility to all functions, the
effects of any changes they are considering, and notification of changes by others
that affect them.
Food 1 Information Systems
Improvement opportunities for information systems development/usage relate to
three key areas:-
(1) Information Technology is not currently perceived as being of strategic
importance:
It was reported that the company spends approximately 1 percent of its sales value
on IT, whereas a Gartner Group survey notes an average of around 2.5 percent
(for a follower/adopter organisation) and 5 percent (for a leader/cutting edge IT
organisation).
It was also noted that, during the last 12 months, approximately eighty percent of
systems development was devoted to non cross-functional systems. Such 'private'
information systems and databases inevitably lead to „multiple-truths‟ and a
functionally optimised style of decision making.
Perhaps of most concern is that the Information Systems Manager reports to the
Executive via an accounting (CFO) function, which is in contrast to many other
organisations. To put this into perspective, CIO Magazine‟s well respected latest
annual survey indicated that just 24% of companies have this reporting
arrangement, and provided evidence of a rising trend of CIOs at Executive level
reporting directly to the CEO (reversing an earlier trend). The CIO's role should
be to provide a sound business case for any proposed IT intended to support
business strategy, AND to directly contribute to business strategic direction by
proactively envisioning innovative IT-enabled business possibilities.
(2) The Food 1‟s information system is limited in its ability to serve the business
in its new operating environment:
It was noted that Food 1 has done a remarkable job of extending its
(predominantly functionally-focused) systems. However, the current information
Page 296
278
systems are very dated and hence lack the fundamental integration abilities
required in a contemporary agile manufacturing organisation.
(3) Future IS requirements and considerations:
It was noted that a new enterprise information system (possibly SAP) could be in
the wings for Food 1. Any such ERP system, if utilised appropriately, has the
ability to provide real-time visibility across the entire supply chain (including with
external suppliers and customers). Such a system enables a cross-functional
(process view) to be obtained, improving company decision making, reducing
handoffs, and breaking down functional silos (ERP systems enable cross-
functional KPIs and reward systems to be set).
In choosing an appropriate ERP architecture, the key decision for FOOD 1 is
whether to use SAP as the ERP backbone, and hang 'best of breed' applications
from it; or to adopt SAP and the relevant SAP planning modules (which would
virtually eliminate the integration problems inherent with the first option).
Although FOOD 1 may be constrained in this choice it needs to begin planning
and to initiate process realignment/redesign ahead of the ERP implementation.
Food 1‟s Market Orientation
The internal supply chain is very cost focused and attempts to remove waste of
any form. This efficiency mindset is common to all functional areas and results in
a „one size fits all‟ approach to matching supply with demand. This is all well and
good when the market characteristics dictate an efficient supply chain strategy.
The batch and queue mentality and capacity utilisation of manufacturing is
particularly an issue for low volume or seasonal products. For example some
products are produced in six month batches and hence incur a large inventory
carrying cost for that individual product. As a result the internal supply chain
treats all products equally. This problem is known as „averaging‟ and results in
those customers of low volume or unusual products being underserved, whilst the
high volume customers are over charged. This issue has not been of great
consequence in the past due to the high proportion of predictable, high volume
products. However, desired future markets are more innovative and hard to
Page 297
279
forecast and often have short life cycles; if the current „one size fits all‟ approach
is not corrected niche competitors will be able to compete, based on their
responsiveness regardless of Food 1‟s efficiency.
The solution to this problem is to become more market orientated through
alternative supply chain strategies. As a first step, two separate value streams need
to be set-up; one using the current efficiency focus aimed at traditional high
volume products and the other needs to be responsive and agile to best serve the
more innovative/fashionable type products. The agile value stream could possibly
utilise the concepts of postponement or base and surge to achieve the best of both
worlds, with some elements of efficiency and some responsive elements, where
appropriate.
Page 298
280
D.3: Service – Quick Scan report
Executive Summary
Service‟s supply chain was benchmarked in the lower percentile (overall) for
supply chain integration. Major reasons for this are the convoluted and disjointed
internal supply processes, and the un-rationalised, outdated information systems.
Root causes centre on a significant lack of strategic investment and a lack of
strategic vision and leadership. Consequences are very severe, including:
increased risks of critical patient incidents, inventory management and human
resource inefficiencies, reduced staff morale and a lack of control/security of
pharmaceuticals. Three main areas for improvement were identified: an
overarching and shared focus on service quality, a consolidated logistical service,
and an integrated information system. Overall, a step change is required to
radically improve the supply chain, and this should be possible with excellent
staff in place that has the desire and willingness for change.
It is recommended that the un-rationalised and multiple supply routes need to be
consolidated to remove the excessive complexity and resultant uncertainty of the
current processes. It is also recommended that the sound IMS replenishment
process be enhanced and used as a template for the supply of consumables. Due to
its increased risk of slippage and the higher value of products, a dedicated channel
for pharmaceuticals appears appropriate. To rectify the disjointed and incomplete
information flows, significant investment in an integrated information system is
needed to provide needed information for decision makers; one that removes the
current guess work and lack of data integrity. However, before either of these two
improvements is implemented a fundamental change in mindset is required, away
from a blame culture and functional viewpoint, to a more team-based
collaborative approach. This change will need be signalled from the top via a
continually reinforced shared vision of service quality; a vision that also
acknowledges that the supply chain is an integral part of providing excellent
patient care delivery. Furthermore, a cross-functional, process view is needed
driven by shared performance indicators and an over-riding cost-to-serve
perspective.
Page 299
281
Quick Scan Audit Methodology
The Quick Scan is a tried and tested method for objectively auditing the health of
supply chains. Four researchers from the University of Waikato conducted the
audit in January 2007. In total, 20 person days were invested in evaluating the
status of supply chain operations at Service. By examining selected wards and
operating theatres, the Quick Scan team was able to examine the integration of the
internal supply chain and its fit with the wider external supply chain.
Findings
The overall level of supply chain sophistication at Service was judged as
„functional integration‟. This is a minimal level of integration and highlights the
very limited inter-functional and external integrations. Each functional area
appears solely concerned with its own objectives and has no time to invest in
managing the shared processes manifest in all supply chains.
Although the Quick Scan was primarily focused on identifying weaknesses and
developing a route map for advancement at Service, five important positive
aspects were noted during the investigation:
The resilience of the staff, coupled with a focus on patient care and a clear
recognition that the current poor situation needs to be addressed
Some good inventory management practises are present, but only in isolation.
For example, the IMS replenishment process is sound and worthy of further
refinement and replication; also the suture‟s Vendor Managed Inventory (VMI)
process is similar to best practises found in USA, for example
The openness to trial new information system solutions and the willingness of
clinical staff to use new technology; for example, the (repetitive) functions of
Oracle…
Suppliers (mostly) achieve the specified service levels.
The internal auditing process is commendable and points towards continuous
improvement.
Three major areas of shortcoming were observed: internal supply processes,
associated information flows, and the lack of top level prioritisation of strategic
supply chain management. While some of the lack in vision and strategy is
Page 300
282
acknowledged, nevertheless considerable shortcomings are evident. As one
example the information systems strategic plan (ISSP) discusses the apportioning
of tasks, but does not outline an integrated information system to span the whole
organisation and support its overall goals.
Improvement Opportunities
The following conclusions and improvement opportunities were identified:-
Supply Processes
Service operates with multiple, often convoluted, supply channels; multiple
replenishment options have been identified for identical products. The key
resultant effect is inefficiencies in time and money spent; staff members are
confused about non-defined responsibilities for the replenishment process.
Further, theatres are carrying expired products.
Currently, IMS is responsible for the wards, Pharmacy for most of the
pharmaceuticals and the theatres operate with warehouse management staff. A key
concern is that pharmaceuticals are being pushed into the facilities without
specific documentation of the final usage.
Two separate supply chain channels are suggested. To overcome the issue of
nurses chasing materials around the facilities, the first is to be a lean channel
where all replenishment activities are done by IMS staff members (with 24/7
availability). The second supply channel is to be a pharmaceutical channel and the
responsibility of the Pharmacy; ideally supported by machines in all wards and
theatres, to enable document drugs usage.
Information Flows
It was noted that Service currently operates with multiple, convoluted,
independent and loosely–coupled information systems. These cause incomplete
and error-prone end-to-end information flows so that staff do not trust the limited
information they are receiving. These also create fire-fighting activities among
clinical staff members because information is not available where and when it is
Page 301
283
needed. While some investment in information technology would be required, this
is not perceived to be the major challenge; rather, without a vision of an integrated
information system, there is the danger of fragmented investments continuing
with little beneficial impact to the overall situation. The suggestion is to move
beyond the proliferation of „islands of technology‟ that is proposed in the
Information Systems Strategic Plan. Other health providers in New Zealand and
overseas, both public and private, can provide benchmarks for the needed
enterprise-wide information system.
Supply Chain Management Prioritisation
It appears that the strategic value of supply chain management has not been
recognised by Service for some considerable time, leading to longstanding
underinvestment in personnel and training, and in the management systems that
such staff need to do their jobs effectively. It is suggested that a suitably qualified
supply chain manager be given the mandate, and the resources, to integrate supply
chain processes. Such an appointment must have demonstrable support from the
Executive.
Functional Silos
Functional silos are a particularly acute issue at Service, fostering a „them and us‟
blame mentality; further obstructing the horizontal flow of information and
teamwork across functional boundaries. Furthermore, the performance measures
and reward systems that would help break down such attitudes are absent. To
overcome this functionalism in the short term, Service must emphasise the
importance of cross-training at all organisation levels. To help optimise the whole
supply chain and not just each of the sub-systems, cross-functional performance
measures need to be developed; staff on either side of a functional boundary must
be made aware of each others‟ needs and problems. Shared total process
performance indicators are needed such as simple measures of customer service
and cost-to-serve.
Page 302
284
Manage suppliers to service level targets
Management of the ISDS agreement needs improvement as the current service
levels and management fees (for example) appear to be both unsophisticated and
strongly favour of the supplier. Rather than applying pressure, it is suggested that
a close supplier partnership be developed, with a view to requiring the supplier to
achieve higher service levels while remaining profitable.
Vision for change
Getting a first wave of improvements underway will help in two major aspects.
Firstly, staff will see that Management is serious about making improvements and
this will help improve staff morale and overcome the inevitable resistance to
change. Secondly, the first successful projects can be expected to have rather short
payoff-periods that would free up resources to help drive further investment.
Page 303
285
D.4: Manufacturer 2’s Quick Scan report
Executive Summary
Manufacturer 2‟s overall supply chain was benchmarked in the lower percentile
segment for supply chain integration. The main reason for this is the company‟s
planned significant increase in production volume requiring a critical step change
in supply chain management and (particularly) operational planning. Three main
areas for improvement were identified: production planning, physical flow, and
staff development.
As production planning is predominantly based on experience and tacit
knowledge, it was judged that the production volume increase will require that
more formalised planning approaches become the norm at Manufacturer 2. These
include a daily production meeting of all supervisors; creation of Manufacturing
Resource Planning (MRP) procedures; and, in time, the adoption of Enterprise
Resource Planning tools. Regarding physical flows, production processes need to
be mapped in order to identify opportunities to remove wasteful production lead
times and work in progress (WIP). Finally, regarding staff development, a silo
mentality needs to be addressed by adopting cross-functional performance
measures. The very high staff turnover (in the shop floors especially) requires
investment in staff, plus a range of actions to reinforce a cross-functional, team-
based Manufacturer 2 culture.
Quick Scan Audit Methodology
The Quick Scan is a tried and tested method for auditing the health of supply
chains. Six researchers from the University of Waikato conducted the audit in
December 2006. In total, 26 person days were invested in evaluating the status of
supply chain operations at Manufacturer 2. The Quick Scan team examined the
integration of the internal supply chain and its fit with the wider supply chain.
Findings
The overall level of supply chain integration was judged somewhat neutral,
mostly due to internal procedures that result in control uncertainty. Of the two
Page 304
286
products, Spare and ware parts was better integrated and was placed at the mid-
point - when compared to the value streams of other companies. With further
„leaning‟ of the process Spare and ware parts would be a good example for the
other Manufacturer 2 processes to emulate. In contrast the Machine process
suffered from process uncertainty and, as the material flow is overly complex, was
ranked at the 79th percentile.
Although the Quick Scan was primarily focused on identifying weaknesses and
developing a route map for advancement at Manufacturer 2, 5 important positive
aspects were noted during the investigation:
The strong niche market position of the machine, enabled by an excellent
R&D product development function
Long-established relationships with key suppliers who support the R&D
function to stay ahead of competitors
ISO 9001 and ISO 14001 certification
A financial reporting system that supports management with reports and
performance measurement
Shop floor staff with a strong „can do‟ attitude produce high quality product
geared toward individual customer needs.
Three major areas of shortcoming were observed: production planning and
control, physical flow and staff development. It was noted from the strategic plan
that , „Manufacturer 2 wants to become the industry benchmark via customer
satisfaction, solutions that best meet customer needs and customer-oriented
approaches in all operations, operational excellence, continuous productivity and
quality improvement, a great place to work (paraphrased).‟ The following
conclusions and improvement opportunities were identified in light of this
strategic intent:
Page 305
287
(Please note that the improvement initiative order is indicated from left to right in
the table; for example in the Production Planning area „Scheduling‟ would
logically be initiated before „Logic of MRP‟ and so on. Similarly, „Short Term,
Medium Term, and Long Term‟ denote the time needed to achieve an
improvement).
Production Planning
Observed production planning procedures showed weaknesses at the strategic,
operational, and tactical levels of management. At the tactical-level Manufacturer
2 lacks a formal production plan, which is currently solely based on the shipping
schedule for the finished product; this does not allow decomposition of activities
and the related backward scheduling. Production decisions are based on historical,
tacit production planning knowledge and lacks world-wide „best practise‟
approaches. At the strategic level, „wears and spares‟ have still to be recognised as
a strong value stream in their own right.
Suggested short term improvement opportunities to overcome this situation are,
first, that management needs to take process ownership and schedule production
on a daily basis, -which leads to the need for a daily production meeting attended
by all supervisors to align the production schedule of each shop. Further, there is a
need for the service department to cut to plan, because four shops are dependant
on timely supply from this particular department.
Knowledge
culture
Formalised up-skilling
Reward system
Operator
training
Staff Development
Factory layout WIP locations
Lean Tips production
Physical Flow
ERP
S&OP (forecasts)
Logic of MRP Scheduling Production
Planning
Long Term Medium Term Short Term Area
Page 306
288
In the medium to long term, Manufacturer 2 needs to map its processes and adopt
Manufacturing Resource Planning (MRP) procedures; perhaps with a view to
eventually implementing Enterprise Resource Planning (ERP) tools, and a Sales
and Operations Planning (S&OP) system – hence sales forecasting data should
begin to be routinely collected from the overseas sales divisions.
Physical flow
The process map developed for the Machine and the Spare and ware parts
highlighted some inefficient operating practises; including double handling and
documentation of products, a „chaotic‟ production process flow and multiple WIP
storage areas.
Solutions to such problems are suggested for the medium and long term in order
to align with the timing of production planning improvements. In the medium
term a single dedicated area for WIP is recommended to reduce the search for
parts. In the long term, it is suggested that Manufacturer 2 develop a factory
layout plan from a mapping of material flows across the entire facility and
estimation of capacity limitations. Further, the production process flows need to
be re-engineered towards more of a streamlined, lean operation.
Staff Development
Reasons for Manufacturer 2‟s functional silos are many (and common to most
organisations); for example, the geographical dispersion of production and
management fosters a „them and us‟ mentality and the organisational structure
obstructs the horizontal flow of information and teamwork across functional
boundaries. Further, existing performance measures and reward systems are
primarily functionally focused and show inconsistency „down‟ the organisation.
To overcome this functionalism in the short term, Manufacturer 2 needs to
emphasize the importance of cross-training at all organisation levels. In a second
step a training matrix should be developed.
Manufacturer 2‟s functional areas are also not interlinked. A systems perspective
of a supply chain clearly identifies the need for optimisation of the whole of the
Page 307
289
system; not just each of the sub-systems. To help overcome this, cross-functional
performance measures need to be developed, and staff on either side of the
functional boundaries made aware of each others needs and problems; the
potential for working together jointly is to vastly improve performance. Second,
shared total process performance indicators are needed, and staff should be
empowered to make production improvements without the need to refer to higher
authority; simple measures of customer service and cost-to-serve would be
appropriate here. Third, a most important change is the introduction of total
process owners having authority to operate across multiple functions and
empowered to challenge the functional heads. This would result in a more matrix-
type organisational structure, with total process champions for product groups.
Further, hiring excellent staff and investing in their training and having clearly
linked shared goals and reward systems tied to the strategic plan, will help cement
in place and continually refresh a new company culture of Manufacturer 2 being a
great place to work.
Page 308
290
Appendix E: Euclidean Norm
Appendix E.1: Overall supply chain benchmark
Figure E.1: Euclidean Norm fomula
Source: Towill et al., 2002
Table E.1 presents the Euclidean Norm values for all twenty value streams.
Table E.1: New Zealand uncertainty data scores
Company Value stream Method Euclidean Norm
Manufacturer 1 1 Quick Scan 5.10
Manufacturer 1 2 Quick Scan 4.58
Dairy 1 3 Quick Scan 4.69
Dairy 1 4 Quick Scan 5.20
Forestry 5 Quick Scan 4.24
Forestry 6 Quick Scan 3.87
Food 1 7 Quick Scan 2.06
Food 1 8 Quick Scan 3.04
Food 1 9 Quick Scan 2.83
Manufacturer 2 10 Quick Scan 3.43
Manufacturer 2 11 Quick Scan 4.74
Service 12 Quick Scan 2.83
Service 13 Quick Scan 3.61
Service 14 Quick Scan 4.80
Service 15 Quick Scan 5.10
Steel 16 Quick Scan 5.32
Steel 17 Quick Scan 5.10
Dairy 1 18 Interview 4.72
Retail 19 Interview 3.00
Storage 20 Interview 3.20
Mean 4.07
Source: Author
Euclidean NormProcess – 1
Score
Control – 1
Score+
2 2
=
½
Supply – 1
Score
Demand – 1
Score+
2 2
+
Page 309
291
Appendix E.2: Internal and external uncertainty benchmarks
Figure E.2: External and internal uncertainty split Euclidean Norm formula
Source: Böhme et al., 2007a
Table E.2 presents the internal and external value stream uncertainty (Euclidean
Norm values) for all twenty value streams.
Table E.2: New Zealand uncertainty data scores
Company
(Value stream)
Data collection
method
Internal
Uncertainty
External
Uncertainty
Manufacturer 1 (1) Quick Scan 4.24 2.83
Manufacturer 1 (2) Quick Scan 2.83 3.61
Dairy 1 (3) Quick Scan 3.00 3.61
Dairy 1 (4) Quick Scan 3.00 4.24
Forestry (5) Quick Scan 2.24 3.61
Forestry (6) Quick Scan 2.24 3.16
Food 1 (7) Quick Scan 2.00 0.50
Food 1 (8) Quick Scan 2.24 2.06
Food 1 (9) Quick Scan 2.00 2.00
Manufacturer 2 (10) Quick Scan 2.92 1.80
Manufacturer 2 (11) Quick Scan 3.54 3.16
Service (12) Quick Scan 2.00 2.00
Service (13) Quick Scan 2.24 2.83
Service (14) Quick Scan 4.24 2.24
Service (15) Quick Scan 4.24 2.83
Steel (16) Quick Scan 4.24 3.20
Steel (17) Quick Scan 3.61 3.61
Dairy 1 (18) Interview 3.04 3.61
Retail (19) Interview 1.00 2.83
Storage (20) Interview 1.00 3.04
Mean 2.79 2.84
Source: Author
½
Euclidean Norm
(internal)
Process – 1
Score
Control – 1
Score+
2 2
=
½
Euclidean Norm
(external)
Supply – 1
Score
Demand – 1
Score+
2 2
=
Page 310
292
The mean for the internal uncertainty is marginally lower than the mean for
external uncertainty. The t-test results in a p-value of 0.8640, which is not
significant.
Page 311
293
Appendix E.3: Uncertainty data UK automotive
Table E.3: Detailed uncertainty data for the 20 UK automotive value streams
Value stream
ID
Process Control Supply Demand Euclidean
Norm
01 4 4 3 2 4.8
02 2 3 3 3 3.6
03 2 1 1 4 3.2
04 2 1 2 1 1.4
05 2 1 2 1 1.4
06 2 3 4 2 3.9
07 1 4 1 4 4.2
08 4 1 4 4 5.2
09 2 1 3 3 3.0
10 2 2 1 4 3.3
11 2 1 2 3 2.4
12 2 3 2 4 3.9
13 3 4 2 3 4.2
14 1 2 4 4 4.4
15 1 2 4 3 3.7
16 4 4 2 4 5.3
17 4 4 2 2 4.5
18 2 4 1 4 4.4
19 1 1 2 4 3.2
20 3 4 4 4 5.6
Source: Author
Page 312
294
Appendix F: Cause and effect diagrams
F.1: Forestry - Cause and effect analysis
Source: Author
For a detailed description see also Appendix D1.
Volume/
tonnage
focus
Individualism
functionalism
culture
SC function not
an integrated SC
Functionally
based KAs
Functional
silos
Incomplete
information
flows
Disconnect between
Executive committee
and rest of org.
Multiple independent
information systems
High reliance
on tacit procurement
knowledge
Over-reliance on
key highly knowledgeable
managers
High reliance
on tacit sales/ marketing
knowledge
Paper
MTO only
Limited strategic
procurement
Limited off-site
integration
Lack of operational
ownership of KAs
Focus on efficiency
not effectiveness
Excessive
paper trimming
costs
Excessive
raw material
stocks
Limited
customer demand/
segmentation
management
Constraint based
Loadstar contract
Limited in-transit
finished goods
visibility
High pulp
finished goods
stock
Limited ownership
& visibility of vision
Marketing
incentivesMarketing of
excessive grades
Limited paper
FG stock
Volume
based strategic
objectives
Blocked
invoices
Page 313
295
F.2: Service - Cause and effect analysis
Source: Author
For a detailed description see also Appendix D3.
Increased risk
of critical patient
incidents
Excessive
costs
Lost
productivity
Lost
opportunities
Reduced
staff morale
Inventory
slippage & lack
of control
Inappropriate
& Inefficient
Staff Time
Critical info
not passed on
Admin burden
of purchasingConvoluted &
disjointed supply
info flow
Unrationalized
info systems
Lack of
strategic
investment
Lack of
strategic
SC vision
Real-time
patient info
not utilised
Short-term
budget focus
Lack of
investment in
SC expertise
Lack
of strategic
Procurement
Unrationalized
internal supply
processesMultiple
convoluted
supply routes
Unreliable
supply & poor
service
Competing
operational
visions/ goals
Excessive
inventory
Increased risk
of critical patient
incidents
Excessive
costs
Lost
productivity
Lost
opportunities
Reduced
staff morale
Inventory
slippage & lack
of control
Inappropriate
& Inefficient
Staff Time
Increased risk
of critical patient
incidents
Excessive
costs
Lost
productivity
Lost
opportunities
Reduced
staff morale
Inventory
slippage & lack
of control
Inappropriate
& Inefficient
Staff Time
Critical info
not passed on
Admin burden
of purchasingConvoluted &
disjointed supply
info flow
Unrationalized
info systems
Critical info
not passed on
Admin burden
of purchasingConvoluted &
disjointed supply
info flow
Unrationalized
info systems
Lack of
strategic
investment
Lack of
strategic
SC vision
Real-time
patient info
not utilised
Short-term
budget focus
Lack of
investment in
SC expertise
Lack
of strategic
Procurement
Lack of
strategic
investment
Lack of
strategic
SC vision
Real-time
patient info
not utilised
Short-term
budget focus
Lack of
investment in
SC expertise
Lack
of strategic
Procurement
Unrationalized
internal supply
processesMultiple
convoluted
supply routes
Unreliable
supply & poor
service
Competing
operational
visions/ goals
Excessive
inventoryUnrationalized
internal supply
processesMultiple
convoluted
supply routes
Unreliable
supply & poor
service
Competing
operational
visions/ goals
Excessive
inventory
Page 314
296
F.3: Steel – Cause and effect analysis
Source: Author
History/
Culture
Single
(Cost Redn.)
KPI
Lack of
Strategic
Direction
Reliance
on Tacit
Knowledge
Unsuitable
IS
Lack of
Analytical
Rigor
Multiple
DSS/Truths
Lack of
Knowledge
Sharing
Excessive
WIP &
Throughput
Time
Declining
Profitability
Poor
Material/
Product
Status
Inefficient
Practices
Busy-ness
Focus
Continuous
Work
attitude
Poor
Inventory
Control
Schedule
Instability
Lost
Market
Opps.
Poor
External
Relationship
Mangt.
Poor
Shop floor
Morale
No
Quality
Culture
Unfocused
Supply Chain
Strategy
Unfocused
Customer
Strategy
Unfocused
Production
Averaging
Poor
Customer
Delivery
Perf.
Excessive
Rework
Poor
Supplier
Performance
Disconnect
Between
Management &
Shop Floor
Functional
Compartments
Lack of Proc.
Ownership
Self-serving
Reward
Systems
“No
Reflection
Time”Resistance
to Change
Poor
Customer
Service
Lack of
Confidence
Resistance
to Change
Page 315
297
F.4: Manufacturer 2 – Cause and effect analysis
Source: Author
For a detailed description see also Appendix D4.
Lost business
opportunity
Excessive
fire fightingSupply chain
inefficiency
Excessive
lead timeExpanding
costs
Bullwhip
effect
Limited market
interface
Double
handling
No strategic
facility layout
Strategic
production
planning
Production
planning and
control
Shop floor vs
managementFunctional
KPI‟s
Functional
silos
Lack of process
ownership
Backorder
Inter shop
communication
High staff
turnover
Internal factors
(lack of staff
training)
External factors
(location)
International
organisational
structure
No clear job
description
Spares and
wears viewed
as poor cousin
Competing
value streams
Scheduling
No formal
process planning
Each shop
bufferedMissing
WIP control
Inadequate
forecasts
Poor IS
support
Operational
production planning
Management art
instead of
science
Lack of supply
chain knowledge
Lost business
opportunity
Lost business
opportunity
Excessive
fire fighting
Excessive
fire fightingSupply chain
inefficiency
Supply chain
inefficiency
Excessive
lead time
Excessive
lead timeExpanding
costs
Expanding
costs
Bullwhip
effect
Bullwhip
effect
Limited market
interface
Limited market
interface
Double
handling
Double
handling
No strategic
facility layout
No strategic
facility layout
Strategic
production
planning
Strategic
production
planning
Production
planning and
control
Production
planning and
control
Shop floor vs
management
Shop floor vs
managementFunctional
KPI‟s
Functional
KPI‟s
Functional
silos
Functional
silos
Lack of process
ownership
Lack of process
ownership
BackorderBackorder
Inter shop
communication
Inter shop
communication
High staff
turnover
High staff
turnover
Internal factors
(lack of staff
training)
Internal factors
(lack of staff
training)
External factors
(location)
External factors
(location)
International
organisational
structure
International
organisational
structure
No clear job
description
No clear job
description
Spares and
wears viewed
as poor cousin
Spares and
wears viewed
as poor cousin
Competing
value streams
Competing
value streams
SchedulingScheduling
No formal
process planning
No formal
process planning
Each shop
buffered
Each shop
bufferedMissing
WIP control
Missing
WIP control
Inadequate
forecasts
Inadequate
forecasts
Poor IS
support
Poor IS
support
Operational
production planning
Management art
instead of
science
Management art
instead of
science
Lack of supply
chain knowledge
Lack of supply
chain knowledge
Page 316
298
F.5: Food – Cause and effect analysis
Source: Author
For a detailed description see also Appendix D2.
Cost focus
Organisational
structure
Lack of
functional
integration
Functional
silos
Functional
rewards
Functional
KPIs and PIPs
Mismatch
of supply and
demand
Batch & queue
Excessive
FG inventory
Multiple
changes to
MPS
Variable
Cost to serve
Single
(efficiency) SC
strategy
Geographic
dispersion
History
Material
expediting
Excessive
raw material
inventory
Limited ownership
of total process
Single
function
systems
Inter-company
competition
Decreasing brand
competitiveness
Future
fashion
market
Responsive
SC strategy
required
Niche
Competitors
Page 317
299
Appendix G: Power and dependency in external relationships
G.1: Semi - structured interview guide (relationships)
Introduction
What is your role, what are your day-to-day responsibilities?
What are your personnel performance measures and how does this affect
your behaviour?
Operations Questions
How do you place orders on the suppliers?
Do you have a choice of suppliers for identical products?
How do you track the incoming material?
Do you penalise your suppliers for late deliveries?
What performance measures do you collect on the suppliers?
How are the performance measures used to improve performance?
How do you interface with the information system?
What sorts of problems does the information system cause you?
How are the parameters in the systems updated?
What information are the suppliers supplied with?
Are suppliers given forecasts?
Are they given access to your information system?
Who are your internal customers?
Who has the power, do you bend over backwards for your internal
customers or do they get what they are given?
How do you attempt to best service your internal customers?
Do your internal customers listen to your recommendations on such things
as lead times, provision of forecasts and preferred suppliers?
Strategic Questions
How do you select suppliers?
How often do you review current suppliers and do you have a supplier
database to capture tacit supplier knowledge?
Page 318
300
What kinds of contracts are used with suppliers?
Are all suppliers equal?
Are some suppliers treated as partners and others as single transactions?
How are supplier relationships matched to product/ supplier type?
Are you dependent on any of your suppliers (who has the power)?
How do the companies overarching supply chain strategy impact your
supplier selection and relationships?
How has the supplier base changed over the past 5 years?
Has the supply base been rationalised?
How has the way you treat your suppliers changed during this time period?
Where are you going with your supply base in the next 5 years?
What are your long term objectives in regard to the suppliers?
What are the next (1 year) goals for supply base improvement?
How much joint work do you perform with your suppliers?
Do you perform any form of supplier development of joint R&D?
Do you perform joint marking with any of your suppliers?
Do you have any VMI or concinement agreements with suppliers?
Generic Questions
What is the most annoying thing about your day-to-day job?
What problems keep re-accruing?
What things do you have to do repeatedly that you feel are unnecessary?
What information would make your job so much easier?
What is your major pain?
Page 319
301
G.2: Description of dyadic relationship model
The strategic supplier relationship research model used in the present research:
Figure G.1: Power and dependency dyadic relationship model
Source: Author
According to Figure 7.1, in a Buyer Dominance situation the buying organisation
appropriates most of the commercial value and sets price and quality trade-offs.
The Independence category contains relationships that are relatively
straightforward to manage and indicate a low strategic importance. If the
products have been identified as non-critical, the organisation should reduce the
number of suppliers and the number of duplicate products; hence, key
considerations are standardisation and consolidation of purchase (Bechtel &
Jayaram, 1997; Olsen & Ellram, 1997). The focus of most Interdependence
relationships is to achieve the simultaneous objectives of continuous
improvement (Buzzell & Ortmeyer, 1995). However, such relationships are very
resource intensive to maintain and are therefore not applicable to every
relationship/organisation (Das, 2005). Finally, when an organisation is cornered
in a Supplier Dominance situation, effort is needed to modify the relationship.
Regarding prospects for supply chain integration, the best possibility of the focal
organisation achieving supplier integration occurs in the Interdependence
Independence Supplier
Dominance
InterdependenceBuyer
Dominance
Low High Buyer dependency
Low
H
igh
Sup
pli
er d
epen
den
cy
Integration is supported
by the power and
dependency structure
Integration is not
supported by the power
and dependency structure
Page 320
302
category due to the even balance of power and dependency between the
organisations. In contrast, the focal organisation will likely find it hardest to
achieve supplier integration with any supplier that falls into the Supplier
Dominance category, since the power held by the supplier potentially creates a
real barrier to integration. In a Buyer Dominance situation, when the power is
held by the focal organisation, integration can be forced on the supplier to an
extent (e.g., via insistence that the supplier acquires an inter-organisational
information system). As organisations will not generally enter into arrangements
in which the costs outweigh the benefits, implementing advanced integration
practises in an Independence relationship may not even be desirable; particularly
if it involves a one-off transaction.
Page 321
303
G.3: Individual case finding – power and dependency structure
Food 1
Food 1 has the most advanced supplier relationship management practises in place
(see Table 7.2). Regarding supplier uncertainty, Food 1 scored lowest with a score
of 1.5. Food 1 has no misalignment of current and ideal relationship management.
More than half of the relationships (52%) are within the interdependence and
buyer dominance category, which should enable Food 1 to integrate even further.
Food 1‟s key customers are major supermarket chains in Australasia. Those
supermarket chains clearly dominate the relationships. The second key customer
is the sister company in Australia. Here, power is balanced. Food 1 scored higher
on demand uncertainty (2.5) than on supply uncertainty.
Food 2
Food 2‟s power structure is of concern. In total, 65% of all relationships are
within the categories of independence and supplier dominance, which creates a
real barrier to supply chain integration. The research identified some major
misalignments in Food 2‟s current approach of supplier relationship management
and idealised relationship management. Overall, Food 2 is among the most
immature businesses regarding relationship management. External integration is
not supported by the power and dependency structure because Food 2 is supplying
major retail chains in Australasia (the uncertainty scores are not available).
Dairy 1
Dairy 1‟s power structure exhibits the strong market dominance of Dairy 2. Both
companies operate with a similar supplier base; however, Dairy 2 dominates the
New Zealand market. Currently, the opportunity to integrate with suppliers based
on a power and dependency approach is rather limited because 86% of all
relationships are within the supplier dominance and independency category. The
immaturity of the procurement function also results in a high supply uncertainty
score of 3.5; and this disregard of procurement and supplier relationship
management results in misalignments of current and ideal relationship
management. The customer side is predominantly independent because the
Page 322
304
company supplies international customers with commodities to a market price.
The demand uncertainty score was joint highest (4.0).
Dairy 2
The power and dependency structure of Dairy 2 has been evaluated as good when
compared to other companies in this sample. In total, 65% of all the top 20
volume suppliers are within the interdependence and the buyer dominance
categories. This outcome is not surprising since Dairy 2 is the largest dairy
producer in New Zealand. Only minor misalignments have been identified so that
Dairy 2 has minor problems integrating with the remaining suppliers. The
customer side is predominantly independent because the company supplies
international customers with commodities to a market price. The uncertainty
scores are not available.
Forestry
Forestry has by far the healthiest power and dependency structure. In total, 85% of
all the relationships evaluated are within the interdependence and buyer
dominance categories, which support integration efforts. However, regarding the
supply uncertainty score Forestry scored the highest (4.0). The research identified
a strong misalignment of current relationship management and ideal relationship
management. Purely focusing on power and dependency, Forestry has the highest
potential to engage in truly integrative practises with key suppliers. The customer
side is predominantly independent because the company supplies international
customers with commodities to a market price. The second key customer is the
sister company in Australia. Here, power is balanced. Also the strong local market
results in many interdependent relationships. Forestry scored lower on demand
uncertainty (2.5) than on supply uncertainty (4.0).
Manufacturer 2
Manufacturer 2 implemented many good relationship management practises.
Further, the company has the largest proportion of buyer dominated relationships
(32%). Overall, 43% of the evaluated relationships fall within buyer dominance
and interdependence. Hence, the power and dependency structure supports
Page 323
305
integration. The good practises applied by Manufacturer 2 result in a low
uncertainty score of 2.0. Misalignments in current relationship management and
ideal relationship occur predominantly within the buyer dominance category. On
the customer side, most products are delivered to corporate-owned sales
businesses, hence interdependency exist. Due to poor visibility on the demand
side, demand uncertainty scored higher (3.0) than supply uncertainty (2.0).
Steel
Steel‟s overall power structure is evaluated as poor compared to the sample. In
total, 71% of Steel‟s top 20 volume suppliers are in the independence and supplier
dominated categories, hence supplier integration will be difficult to achieve. Poor
supplier relationship management causes major misalignments between current
supplier relationship management and idealised relationship management. This
poor practise also results in a high supply uncertainty score of 3.0. Steel has weak
links to key customers. The customer base is predominantly independent and
poorly managed, which results in a customer uncertainty score of 4.0.
Page 324
306
Appendix H: Supply chain integration evaluation scores
Dairy 1 Forestry Food 1 Manufacturer 1
QS Follow up QS Follow up QS Follow up QS Follow up
Operational data 2 3 2 3 3 3 1 2
Visibility 2 2 1 3 2 2 1 2
Performance Measurement 2 2 2 2 3 3 2 2
Communication across SC 2 2 2 2 3 3 2 2
Supplier relationship 1 2 1 2 3 3 2 2
Customer relationship 2 2 1 2 2 3 1 1
SC strategy 1 1 2 3 2 2 1 3
VMI/ CPFR 1 2 2 3 3 4 3 3
Procurement 1 2 1 2 3 3 2 2
Track & trace system 1 2 2 3 3 3 1 1
Data & communication system 2 2 2 2 2 2 2 2
Transaction system 1 1 2 2 3 4 1 1
Decision points 1 2 1 1 2 2 1 2
Formal lateral org 2 2 2 2 2 2 2 3
Organisational structure 1 3 1 1 1 1 1 2
HR KPI 1 1 2 2 2 2 2 3
SC focus 1 2 2 2 3 3 1 3
Organisational culture 2 2 2 2 2 2 1 3
Physical flow 2 2 2 2 2 2.5 1 2
Inventory 3 3 3 3 3 3 1 2
Lead time 1 1 1 1 2 2.5 1 2
Information flow 1 2 1 2 2 2 1 2
1 = traditional supply chain (sc); 2 = functional sc; 3 = reactive sc; 4 = seamless sc
Source: Author
Page 325
307
Reflection of the study of supply chain integration
Trying to find answers to the identified research questions highlighted the fact that
supply chain management is embedded in a complex environment. Each layer and
component subsystem adds complexity that makes generalisations more difficult
to substantiate. This complexity creates barriers to developing well-substantiated
theories (see also Stuart et al., 2002). Further, working hand in hand with
practitioners the research highlighted that supply chain management problems are
in many cases unstructured and messy.
The Quick Scan Audit Methodology, being a multiple paradigm approach, was
applied in order to accurately describe, truly understand, and explain the complex
and messy supply chain environment. Although the Quick Scan is a fairly new
method developed in the early 1990s, its rigour is well established.
Since the late 1990s, the method has continued to be refined by the original
members with assistance from other academics around the world. As expressed in
both Chapter 6 and 7, the application of the method to the New Zealand
environment has resulted in a heightened people and relationship focus when
studying supply chain integration. The Quick Scan method is flexible in its
approach, allowing both for personal researcher preferences, and also making it
attractive to other researchers in other subject areas. Currently the Quick Scan is
branching off in different directions including knowledge management audits,
information systems audits, and innovation management audits.
Page 326
308
Reflection of the PhD journey
This journey has been a fantastic opportunity to engage with practitioners and
discuss the supply chain through an applied lens. Likewise, discussing the subject
area with my supervisors, publishing journal articles, and visiting international
conferences stimulated the academic lens. Particular highlights have included
Quick Scan trips throughout New Zealand and visits at international conferences
including Euroma in Glasgow, ISL in Budapest, and SCMIS in Melbourne.
Of course, the study was constrained by limitations of time and other resources.
For example, the Quick Scan team had to be opportunistic regarding company
willingness to engage in a supply chain audit. Time constraints meant that the
Quick Scan team only managed to conduct two Quick Scans per year, which
resulted in a long data collection process; a more compressed data collection
period would have been desirable. Also, much time was spent at the beginning of
the PhD in defining the initial scope of the research area. This process could have
been streamlined by engaging early on with practitioners to discuss the feasibility
and relevance of the research.
On the plus side, having the opportunity to carry out research as part of a team
together with the supervisors was an ideal way of action learning. This process
was stimulating and advanced my system thinking capabilities. Even though it
was time consuming, attendance at several national and international conferences
and publishing in journals added to the “apprenticeship” of becoming an
academic. Finally, the close collaboration with other Universities, including
Cardiff University in the UK was very valuable for narrowing down the scope of
this PhD, and enabled me to present the results of collaborative research at
international conferences, and jointly publish peer reviewed articles. Similarly,
receiving supportive critical feedback and being able to discuss ideas with subject-
related researchers and PhD students proved to be invaluable.
Page 327
309
Vita
Tillmann Böhme holds a Master in Business Administration (with Distinction)
degree from Waikato University, New Zealand and a Diploma in Business Studies
from the University of Applied Sciences in Kiel, Germany. His current research
has focused on supply chain integration, change management, supply chain
assessment, and the development of methodologies to investigate real life supply
chains. He has published a number of research papers in: Operations Management
Journal, The International Journal of Production Research, and The International
Journal of Electronic Customer Relationship Management. He has served as a
referee for Supply Chain Management: An International Journal. Further, he
presented his research at international conferences, including The International
Symposium for Logistics, The International European Operations Management
Association and The International Conference for Supply Chain Management and
Information Systems. He is a student member of the Operational Research Society
of New Zealand (ORSNZ).


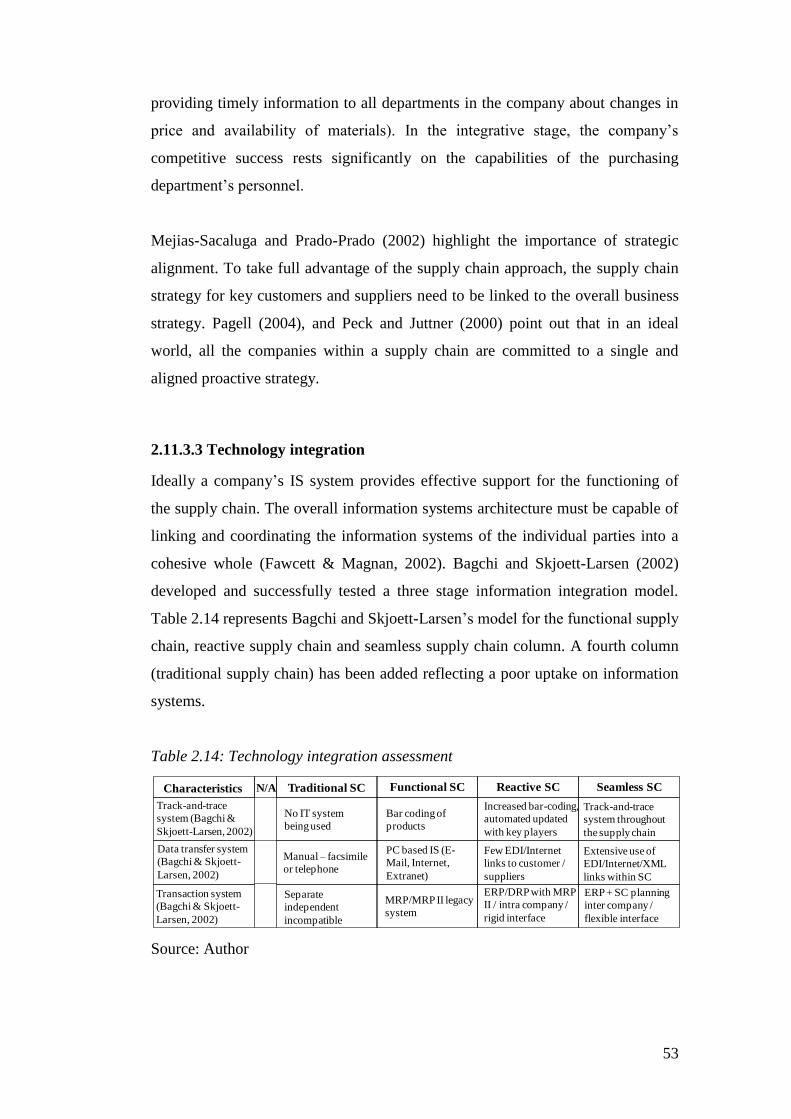


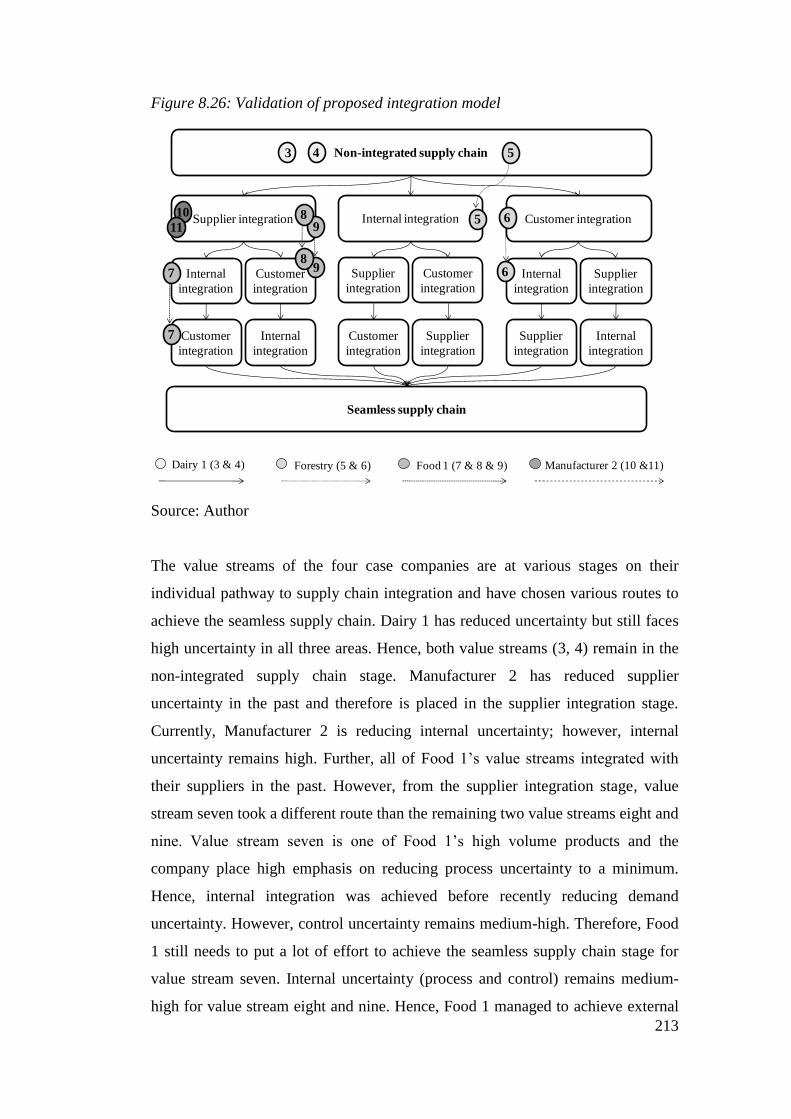


![PythonAPI - Cisco€¦ · Python 2.7.5 (default, Jun 17 2014, 18:11:42) [GCC 4.8.2 20140120 (Red Hat 4.8.2-16)] on linux2 Type "help", "copyright", "credits" or "license" for more](https://static.documents.pub/doc/80x56/5f0baf367e708231d431b642/pythonapi-cisco-python-275-default-jun-17-2014-181142-gcc-482-20140120.jpg)


