46
Research Design By Aparna Bhaduri

Research DesignBy Aparna Bhaduri

Definition and Characteristics
Research design Is a plan or Blue Print for
conducting a studyIndicates basic structure of
the studyMaximizes control over
factors that could interfere with the validity of the findings

Characteristics continued
Guides the researcher in planning and Implementing a study
Not specific to a particular study but must link to the other steps of the research process in the study.

Elements of Good Design is controlling
The environment
The equival
ence
Subjects &
groups
Measurement
Treatment

Elements Continued
Appropriateness to research question
Absence of bias, precision, Power
Maintain integrity of research design
* Maximize control
* Minimize bias
* Control threats to validity

Concepts relevant to Research Design
Causality & multi-
causality
Probability or Bias
Manipulation
Control Validity

Nursing Research Methods
Qualitative
• Phenomenological
• Grounded Theory
• Ethnographic• Field theory• Historical
Quantitative
• Descriptive
• Experimental
• Historical
• Historical
Outcome research

Definitions of Research Methods
Qualitative Research: A systematic, interactive, subjective approach used to describe life experiences and gives them
meaning ( Burns and Grove)
Quantitative Research: A formal, objective, systematic process to describe and test relationships, and examine causes and atudy effects of intervention s.
Outcome Research
Scientific methodology that was developed to examine the end result patient care, The strategies used in outcomes research are departure from traditional scientific style and incorporate evaluation research , epidemiology, and economic theory perspectives.

Types of Desgn
Is random assignment used?
Yes No Is there a control group or
multiple measure?
yes no
Quasi experiment pre-experimental or
Non-experimental
Randomized or true
experiment

Types of Survey design
Descriptive
Comparative
Correlated
Evaluative
Developmental – Cross sectional, Longitudinal, trend study

Survey Design : Descriptive Survey
VARABLE 1
VARIABLE 2
VARIABLE 3
VARIABLE 4
DESCRIP
TION
DESCRIPTION
DESCRIPTION
DESCRIPTION
I
N
T
E
R
P
R
E
T
A
T
I
O
N

Descriptive design
To describe systematically a situation or area of interest factually and accurately
•PURPOSE IS EXPLORATION AND DESCRIPTION OF PHENOMENA IN REAL LIFE SITUATION

Survey Design – Comparetive Survey
GROUP 1
GROUP 2
Description of variables
Compare the
variablesbetween
group 1 and 2
I
n
t
e
r
p
r
e
t
a
t
i
o
n
Description of variables
Comparative Descriptive design
Used to describe differences in variables in two or more groups in natural settings
A study is comparative survey if the researcher takes at least 2 entities now in existence and compare against known criteria

Survey Design: Evaluative Survey
•
E
V
A
L
U
A
T
I
O
N
C
R
I
T
E
R
I
A
• Description of Variables
• Could be one or more groups
• Evaluating against criteria
• Description
• AND• EVALUA
TION AGAINST CRITERIA

Correlation Design
A systematic investigation of relationships between two or more variables to explain the nature of relationships in the world and not to examine causes an effect

Correlation Design: Types
Descriptive Correlation design
Predictive Design
Model-Testing Design
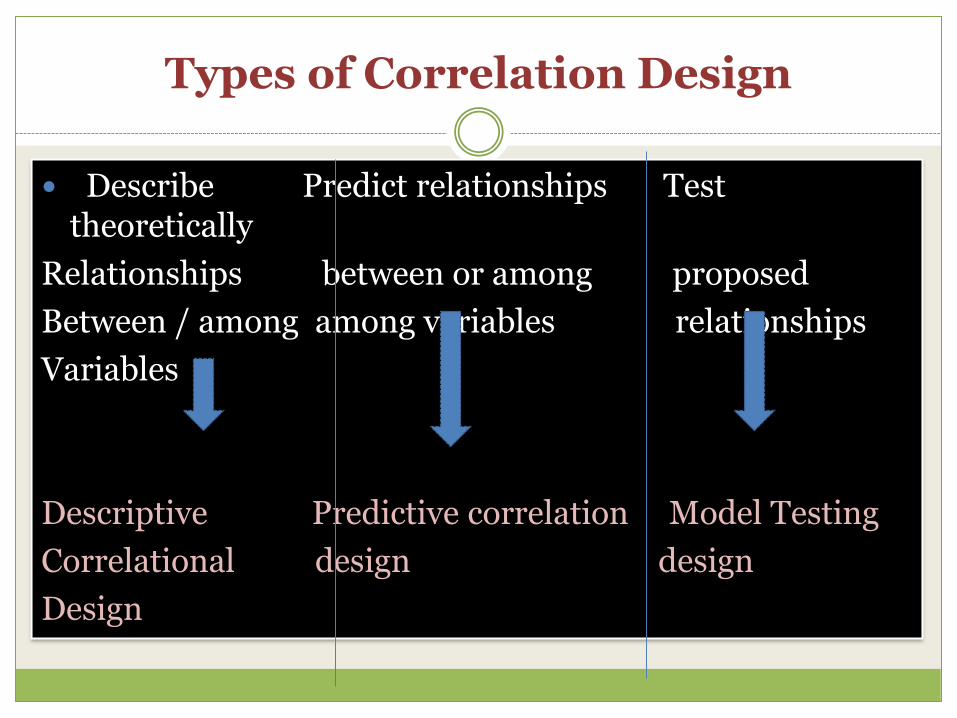
Types of Correlation Design
Describe Predict relationships Test theoretically
Relationships between or among proposed
Between / among among variables relationships
Variables
Descriptive Predictive correlation Model Testing
Correlational design design
Design
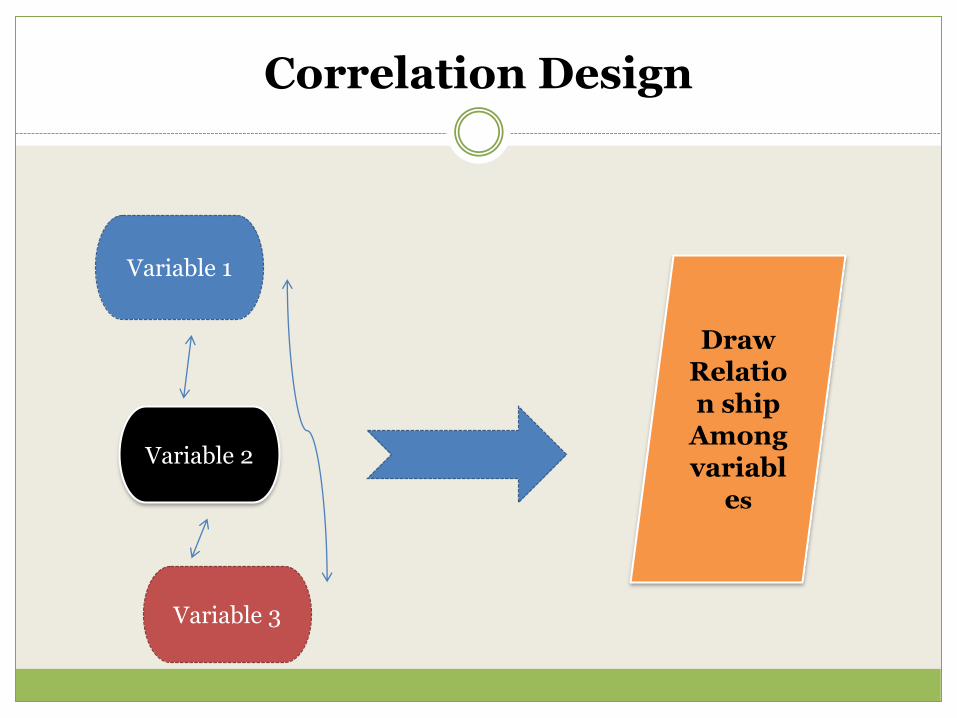
Correlation Design
Variable 1
Variable 2
Variable 3
Draw Relation ship
Amongvariabl
es

Application of statistics in correlation design
Correlation between two variables is computed by Rank Difference method, and Pearson Product moment method
If the data are in nominal /ordinal levelassociation is computed by chi-square
For computing relationship among more variables compute multiple regression

TIME DIMENTIONAL DESIGN S
designed within the discipline of epidemiology in which occurrences and distribution of diseases among population are studied
designs examine occurrences and sequences and patterns of change, growth or trends across time - Dimension of time is an important factor.

Cohorts
Within the field of epidemiology the samples in time
dimensional studies are called COHORTS- means classifying populations that have relevance in relation to time include : age, time of diagnosis, point of entry into treatment protocol, point of entry into new life style, age at which started smoking, etc.
Design is usually used to determine risk factors or causal factors of illness state: called inferred causality continued next slide

Strategies used in studying inferred causality
1 Retrospective: Group of people who have experienced a particular event
Prospective: Group of people who are at risk for experiencing a particular event

Developmental studies-Longitudinal
Time 1
MeasureVariables
Sample 1
Time 2
Measure variables
Sample 1
Time 3
MeasureSample 1variables
Sample 1
Time 4
MeasureVariables
Sample 1
Time ….n
Measure Variables
Sample 1
Longitudinal Design

Cross Sectional design
Time 1
MeasureVariables
Sample 1
Time 1
Measure VariablesSample 2
Time 1
MeasureVariables
Sample 3
Time 1
MeasureVariables
Sample 4
Time 1
MeasureVariables
Sample…n

Trend Study Design
Time1
MeasureVariables
Sample
1
Time2
MeasureVariables
Sample2
Time3
MeasureVariables
Sample
3
Time4
MeasureVariables
Sample
4
Time,,,n
MeasureVariables
Sample… n
Predictions

Experimental Study Designs
Pre experimentalExamples: One group pretest-post-test designs, One group
post test only design, post test only design with non-equivalent groups, static group design
True ExperimentalExamples : Pretest-post-test control group designs, Post-
test only control group designs, Solomon four-group design, Factorial design , nested designs
Quasi experimentalExamples: The time series experiment, the equivalent time samples design, the non-equivalent control
group design

Pre-experimental Designs
1. The one-shot Case study
Common knowledge comparison- Single group is studied once
Expose subjects to X, the new teaching method,
Administer test (O),the post test to measure mean reading speed after exposure to X
There is complete absence of control and no internal validity
X O

Pre-experimental Design
2. The one-group pretest-post0test design
Advantages: Pre-test provides a comparison between performances by the same group of subjects before and after exposure to X .
Provides a control for selection and mortality variables
O1 X O 2

Pre-experimental Design
3. The static group comparison
Here a group which has experienced X, is compared with one which has not, for the purpose of establishing the effect of X.
History , Testing, instrumentation and regression factors are controlled .
X O 1O2

True Experimental Design
4. Pretest - Posttest Control group Design
Experimental group( R)
Control group ( R )
R Random assignment
In general , internal validity gains strength in this design
O1 X O2O3 O4

True Experimental Design
5. Variation of Design 4 . Pretest- posttest control Group design
E1 ( R )
E 2 ( R )
Control
X 1 and X 2 are two methods / interventions
O 1 X 1 O 2O 3 X 2 O 4O 5 O 6

True Experimental Method
6.Randomized Solomon Four-group Design
Pretested ( R ) O 1 X 1 O 2
Pretested ( R ) O 1 _ O 2
Un-pretested ( R ) _ X 1 O 2
Un-pretested R) _ _ O 2
Greater confidence can be placed on the findings

True experimental Designs
7. Randomized control group post- test only design
Usually planned where pretest is not necessary, unavailable, inconvenient, or likely to be reactive
Controls internal validity factors
E ( R )
C ( R )
X O 1_ O 2

Quasi-Experimental Designs
These designs are suitable for researches which are taken out of laboratory and into operating situation
8. The Time-series Experiments
The essence of the time-series design is the presence of a periodic measurement process on some group or individual and the introduction of an experimental change into this series of measurements. Chief potential sources of internal validity are History and instrumentation
O 1 O 2 O 3 O 4 X O 5 O 6 O 7 O 8

Quasi- Experimental Design
9. Equivalent Time Sample Design
A recurrent form of one group experimentation employs two equivalent samples of occasions, in one of which experimental variable is present and in another of which it is absent, The effect of the experimental variable is anticipated to be transient or reversible character
X 1 O X 0 O X 1 O X 0 O

The Quasi Experimental Design
10 , The Non Equivalent Control group Design
O 1 X O 2O 1 O 2
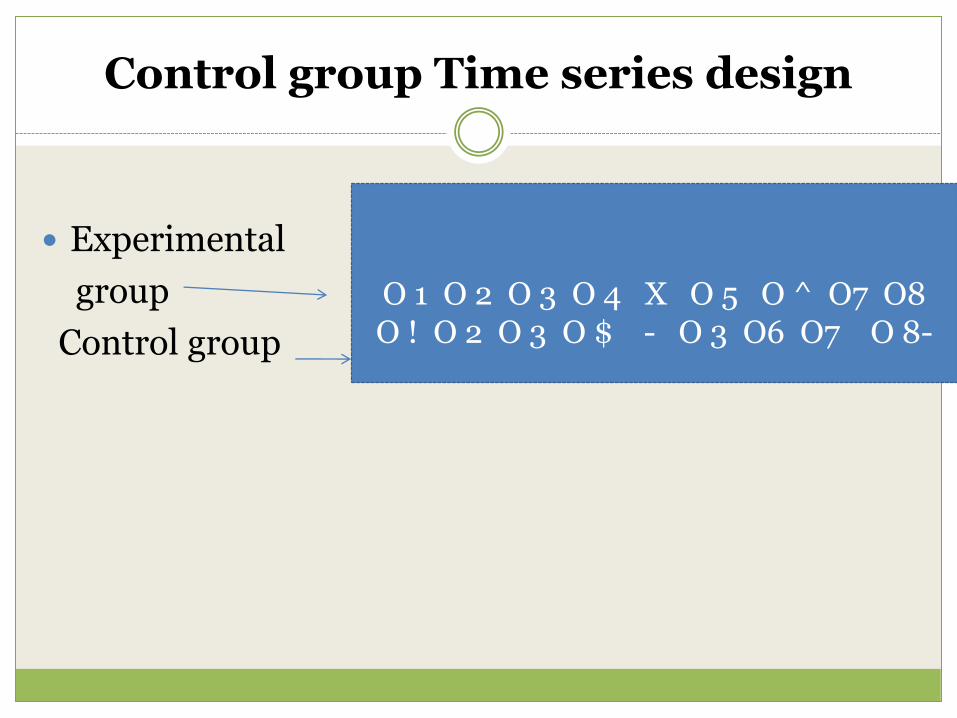
Control group Time series design
Experimental
group
Control group
O 1 O 2 O 3 O 4 X O 5 O ^ O7 O8O ! O 2 O 3 O $ - O 3 O6 O7 O 8-

Factorial Design
The simplest factorial design permits to study the effects of the two Xs (treatment) each of which is varied in two ways, i.e. , levels or values
Length of periods 50’ 30’ Mean dif
Teaching methods
Lecture A 59.0 B 58,0 -1.0
Discussion C 82.0 D 84.0 + 2.0
Mean difference + 23.0 + 26.0

Counter-balanced Design
Time 1 Time 2 Time 3 Time4
Group A X1 O X 2 O X 3 O X 4 O
Group B X 2 O X 3 O X 4 O X 1 O
Group C X 3 O X 4 O X 1 O X 2O
Group D X 4 O X1 O X2 O X 3 O
This is a post test only design where pretests are inappropriate . Note each treatment occurs once in each column
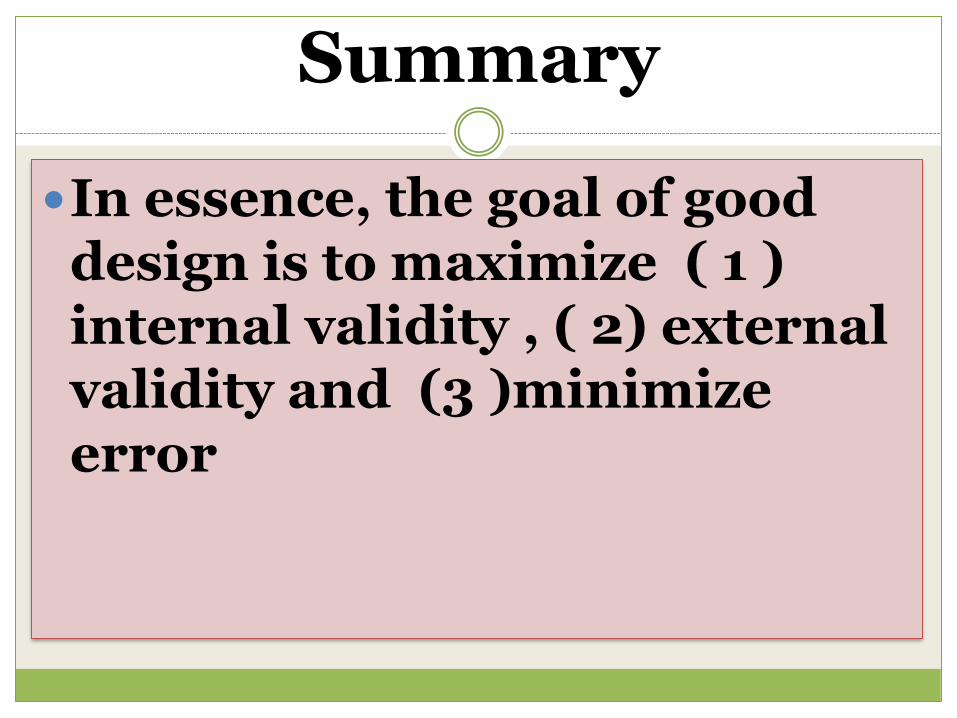
Summary
In essence, the goal of good design is to maximize ( 1 ) internal validity , ( 2) external validity and (3 )minimize error

Key Concepts in Experimental Design
Maximize the experimental
Variance – done by designing
and planning

Key Concepts - continued
Control the Extraneous Variance
a) Select homogeneous subjects (b) employ randomization technique © Build extraneous variable right into the study (d)Control extraneous variable by matching (e) Use appropriate statistics. (

Key Concepts - Continued
Minimize the Error Variance
• CONTROL MEASUREMENT CONDITION
• INCREASE RELIABILITY


![Aparna Kumar.doc[1]](https://static.documents.pub/doc/80x56/577d26681a28ab4e1ea11f5b/aparna-kumardoc1.jpg)


![[Amit Bhaduri, Deepak Nayyar] Intelligent Person's guide](https://static.documents.pub/doc/80x56/5695d18a1a28ab9b0296f197/amit-bhaduri-deepak-nayyar-intelligent-persons-guide.jpg)


