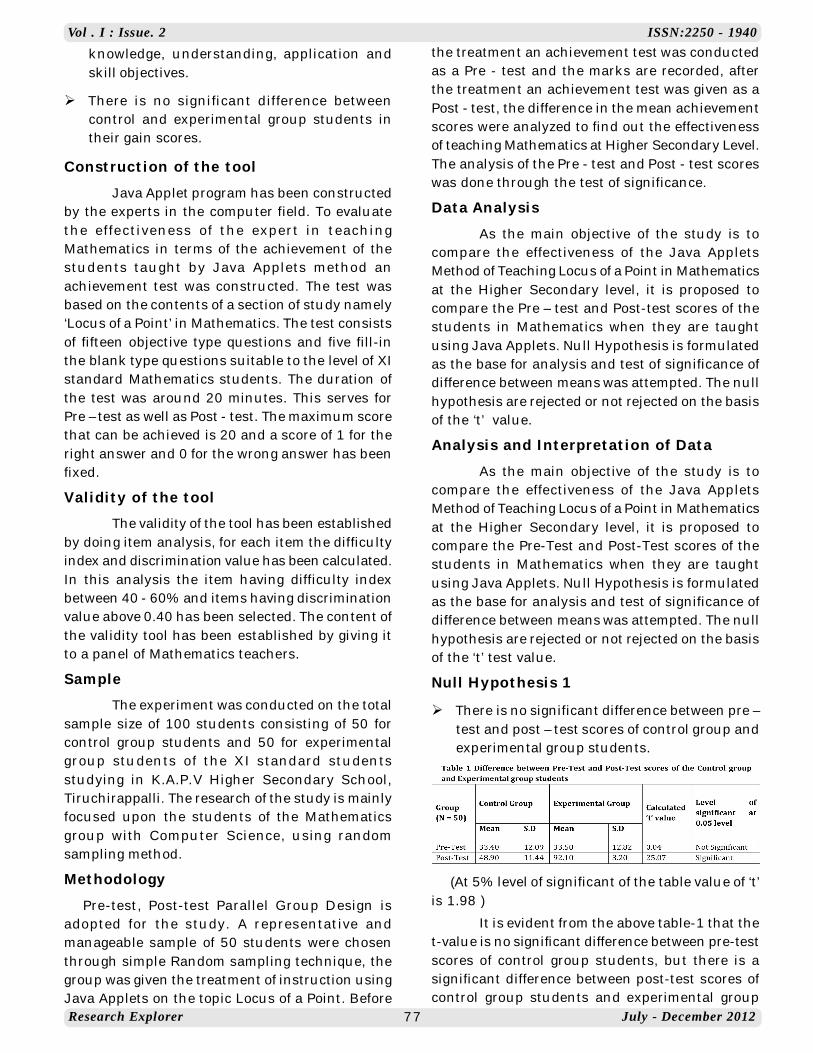
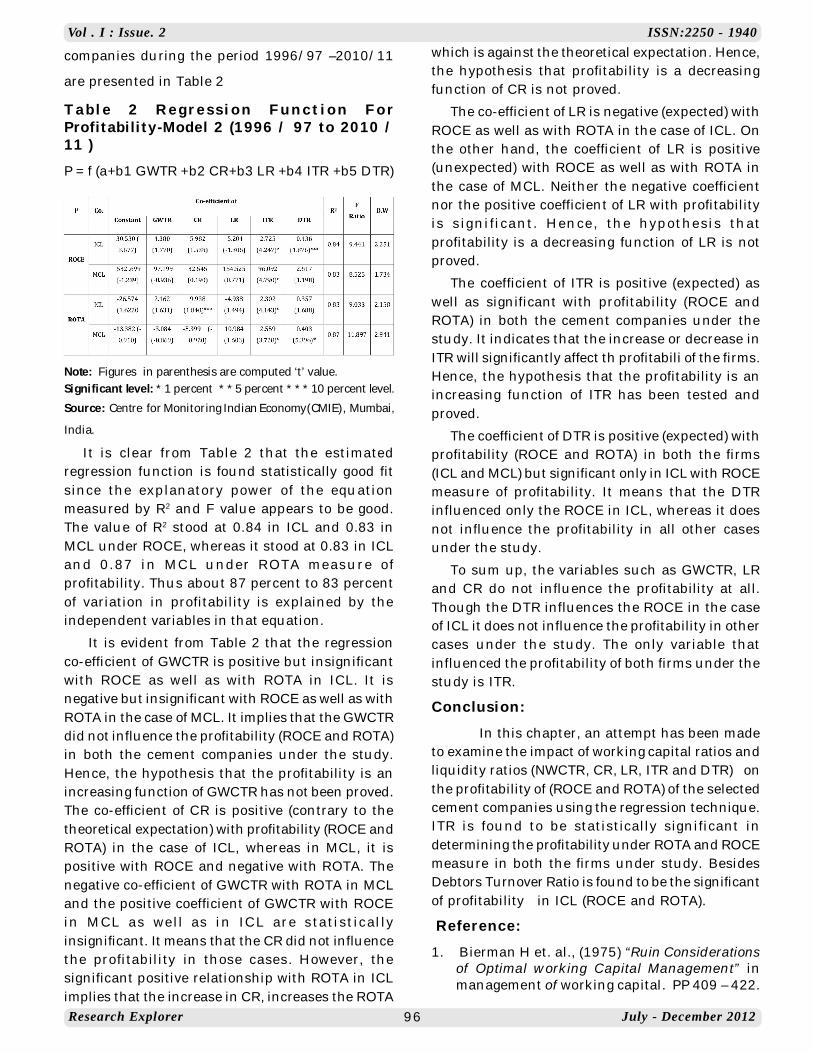
Research Explorer July - December 2012 Vol . I : Issue. 2 ISSN:2250 - 1940 1 DUAL MODE SERIES RESONANT DC-DC CONVERTER FOR WIDE LOAD VARIATIONS Harine Kanagaraj Institute of System Science National University of Singapore, Singapore ABSTRACT In order to satisfy demands like higher conversion efficiency and power density, many topologies and control methods are proposed. Among them, dc to dc series resonant converters with zero voltage switching features are getting more attention. This paper presents the design of a dual mode full-bridge series resonant converter (FB-SRC). It is operated in series resonant mode at normal loads or higher loads. The switching frequency is varied to regulate the output voltage. The fixed frequency phase shifted pulse width modulation, on the other hand, is used to adjust the effective duty cycle and regulate the output voltage at light loads . The proposed converter exhibits high conversion efficiency for wide range load conditions. Keywords : Conversion efficiency, phase-shifted full-bridge converter, series resonant converter (SRC), Zero volatge switching (ZVS), pulse width modulation (PWM) Introduction The switching devices in converters with a pulse width modulation (PWM) control can be gated to synthesize the desired shape of the output voltage or current. However, the devices are turned on and off at the load current with a high di/dt value. The switches are subjected to a high voltage stress and the switching power losses increases [2]. The turn on and turn off losses could be a significant portion of the total power loss. The electromagnetic interference is also produced due to the high di/dt and dv/dt in the converter waveforms. The disadvantages of the pwm control can be eliminated if the switching devices are turned on and turned off when the voltage and current are forced to pass through zero crossing by creating an LC-resonant circuit , thereby called a resonant pulse converter [4]. The primary design feature of ZVS PWM power converters is the addition of an auxiliary switch in the quasi-resonant circuit. Resonance is dominated by the auxiliary switch, which generates resonance and temporarily stops a period that can be regulated, there by overcoming the disadvantages of fixed conduction or cutoff time in a quasi- resonant power converter. The main design feature of ZVT soft-switching power converters is the installation of resonant components that reduce conduction losses [6]. The main benefit of the converter is the extension of resonant time using two clamp diodes. The improvement in the voltage and current stress over those obtained using traditional resonant components implies in reduction of switching losses and the elimination of parasitic effect. Due to its high current gain, series resonant converters are mainly used for applications like arc welding, electronic ballast, induction heating and fluorescent lighting involving wide range load variations. Series Resonant Converter Principle of operation The series resonant converter shown in fig.1 converts dc voltage into ac through full bridge inverter and then converts ac voltage again to dc. It works on the basis of resonant current oscillation. The resonating components and switching devices are placed in series with the load to form an underdamped circuit. The size of resonating components is small due to the high switching frequency. The operating frequency is generally Research Explorer ISSN : 2250 - 1940 Vol I : Issue. 2 July - December 2012
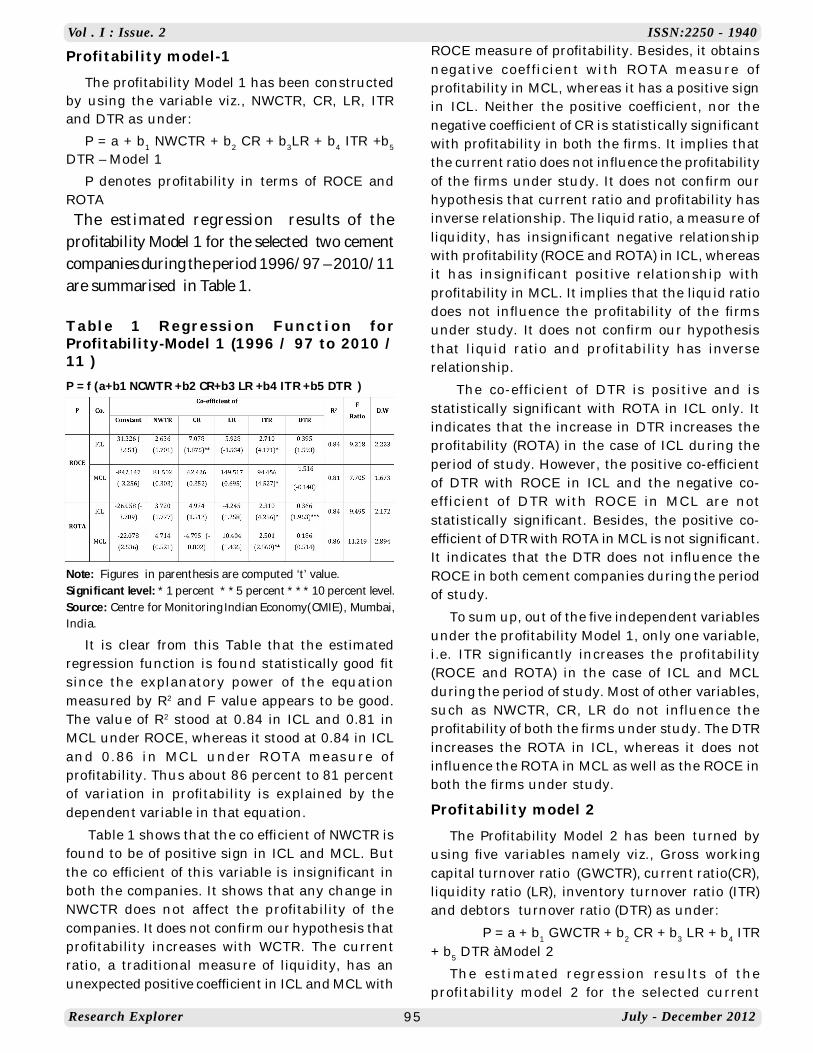
Transcript
Research Explorer July - December 2012
Vol . I : Issue. 2 ISSN:2250 - 1940
1
DUAL MODE SERIES RESONANT DC-DC CONVERTER FOR WIDE LOADVARIATIONS
Harine KanagarajInstitute of System Science
National University of Singapore, Singapore
ABSTRACTIn order to satisfy demands like higher conversion efficiency and power density, many topologies and
control methods are proposed. Among them, dc to dc series resonant converters with zero voltage switchingfeatures are getting more attention. This paper presents the design of a dual mode full-bridge series resonantconverter (FB-SRC). It is operated in series resonant mode at normal loads or higher loads. The switchingfrequency is varied to regulate the output voltage. The fixed frequency phase shifted pulse width modulation,on the other hand, is used to adjust the effective duty cycle and regulate the output voltage at light loads . Theproposed converter exhibits high conversion efficiency for wide range load conditions.
IntroductionThe switching devices in converters with a pulse
width modulation (PWM) control can be gated tosynthesize the desired shape of the output voltageor current. However, the devices are turned on andoff at the load current with a high di/dt value. Theswitches are subjected to a high voltage stress andthe switching power losses increases [2]. The turnon and turn off losses could be a significant portionof the total power loss. The electromagneticinterference is also produced due to the high di/dtand dv/dt in the converter waveforms. Thedisadvantages of the pwm control can be eliminatedif the switching devices are turned on and turnedoff when the voltage and current are forced to passthrough zero crossing by creating an LC-resonantcircuit , thereby called a resonant pulse converter[4].
The primary design feature of ZVS PWM powerconverters is the addition of an auxiliary switch inthe quasi-resonant circuit. Resonance is dominatedby the auxiliary switch, which generates resonanceand temporarily stops a period that can beregulated, there by overcoming the disadvantagesof fixed conduction or cutoff time in a quasi-resonant power converter. The main design feature
of ZVT soft-switching power converters is theinstallation of resonant components that reduceconduction losses [6].
The main benefit of the converter is the extensionof resonant time using two clamp diodes. Theimprovement in the voltage and current stress overthose obtained using traditional resonantcomponents implies in reduction of switching lossesand the elimination of parasitic effect.
Due to its high current gain, series resonantconverters are mainly used for applications like arcwelding, electronic ballast, induction heating andfluorescent lighting involving wide range loadvariations.
Series Resonant Converter Principle ofoperation
The series resonant converter shown in fig.1converts dc voltage into ac through full bridgeinverter and then converts ac voltage again to dc.It works on the basis of resonant current oscillation.The resonating components and switching devicesare placed in series with the load to form anunderdamped circuit. The size of resonatingcomponents is small due to the high switchingfrequency. The operating frequency is generally
Research ExplorerISSN : 2250 - 1940
Vol I : Issue. 2July - December 2012
Research Explorer July - December 2012
Vol . I : Issue. 2 ISSN:2250 - 1940
2
close to the resonant frequency of the tank.Operation with switching frequency lesser thanresonant frequency is called sub resonantfrequency operation. The input voltage sees a netcapacitive tank circuit and facilitates ZCS. Whenswitching frequency is greater than resonantfrequency, the operation is termed as superresonant frequency and the tank presents a netinductive circuit which facilitates ZVS.
Dual mode condition For a series resonant converter, the output
voltage is regulated by changing the switchingfrequency. However, it is impractical to raise theswitching frequency at lighter loads due to thelimitation of semiconductor switch device. Severalschemes are proposed to solve this problem suchas burst mode control [7] , turn off timemodulation,etc. The penalty is that the ZVS featureis no longer kept. In this paper, the phase-shiftedduty cycle control with ZVS at a fixed highestswitching frequency is proposed to regulate theoutput voltage at light loads. Although the phase-shifted modulation features the constant switchingfrequency and ZVS function over wide input voltageand output load ranges, its efficiency at heavy loadis lower than that of an SRC due to the high dutycycle loss. Therefore, the proposed control schemeadopts the frequency modulation with heavy-loadefficiency and the phase-shifted modulation [5] witha better output voltage regulation and ZVS functionat light loads. Through this dual mode operationhigher conversion efficiency is fulfilled for wide-range load variations.
Zero voltage switching When the PM-SRC is operated such that
its switching frequency is greater than the resonantfrequency of the tank, zero-voltage turn-on of theinverter devices is possible because the effectiveimpedance offered by the resonant tank isinductive. Tank current lags the input voltage. ZVSensures the inherent output capacitance in theswitching devices is discharged prior to switch turn-on, thus prevent turn-on losses and generated EMI.
Basic requirements of ZVS· The device should turn off with a positive
current flowing through it
· The delay time and turn off current have tobe large enough to completely charge/discharge the
snubber capacitors and subsequent turn on of thereverse diode for conduction
The delay time has to be small enough to preventthe tank current from reversing before the switchturns on.
The Resonance ConceptFrom a circuit standpoint, a dc-to-dc resonant
converter can be described by three major circuitblocks as shown in the figure 2
The dc-to-ac input inversion circuit, the resonantenergy buffer tank circuit, and the ac-to-dc outputrectifying circuit
The resonant tank serves as an energy bufferbetween the input and the output is normallysynthesized by using a lossless frequency selectivenetwork
The ac-to-dc conversion is achieved byincorporating rectifier circuits at the output sectionof the converter
Proposed Circuit and Its OperationIt consists of a full bridge inverter consisting of
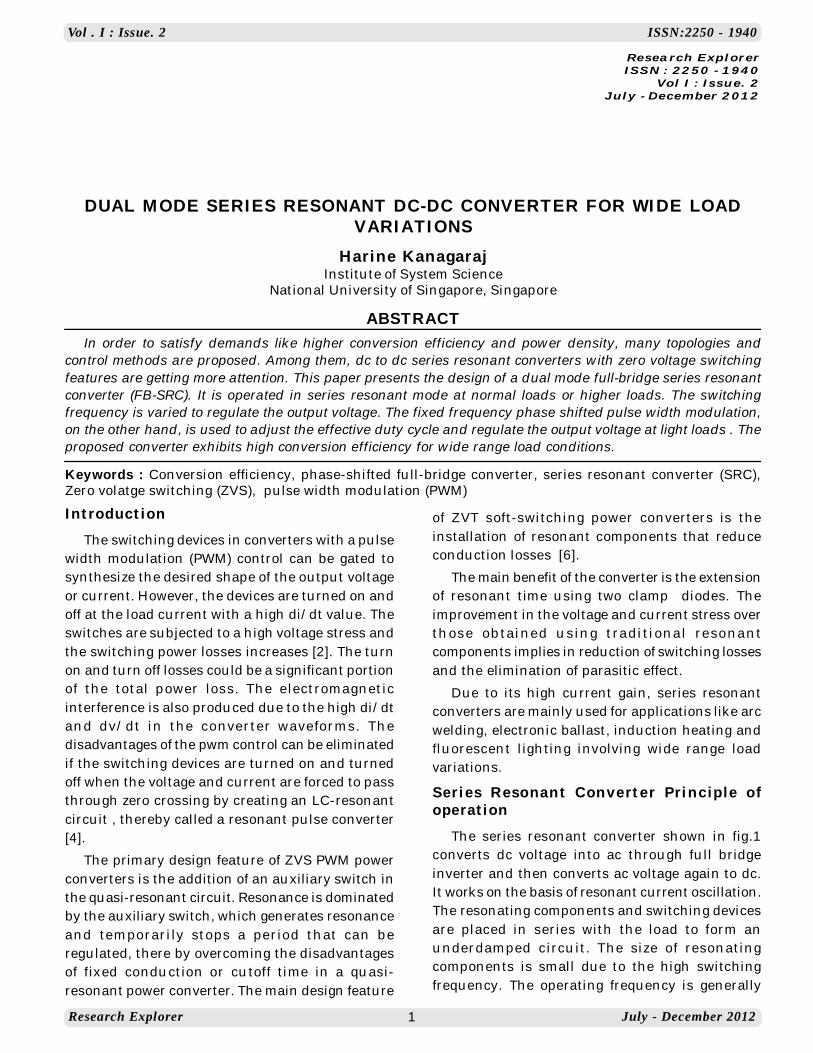
four MOSFETS fed by a dc source. The next sectionis the resonant tank section formed by a resonantinductor and capacitor connected in series. Finallya diode rectifier along with filter and load circuit isused. Here Dc to Ac and again to Dc conversion iscarried out. Figure 3 shows the circuit diagram ofthe proposed series resonant converter.
Fig 1 Proposed series resonant converter
The proposed FB-SRC has 4 MOSFETswitches Q A ~ Q D with the output parasiticcapacitors Coss, A ~ Coss, B. Lr and Cr forms theseries resonant circuit. A centre tapped transformerof turn ratio n: 1:1 is used. Two rectifying diodesD1 and D2 are employed. The filter capacitor is Co.RL is the load resistance. The control signals ofQA/QD and QB/QC are complementary. Deadtimes preventing the simultaneous conduction ofswitches are inserted to delay the turn-ons of the
Research Explorer July - December 2012
Vol . I : Issue. 2 ISSN:2250 - 1940
3
switches. When QA/QD or QB/QC conducts, theinput power is transferred to the output load. Zerovoltage switchings are achieved by the resonanceof Lr and the equivalent capacitor formed by theparallel connection of Cr and the output parasiticcapacitors of the switches during dead times.
The gate pulses applied to the above converteris shown in fig 3. The leading leg switches are givenby S1 and S1’ and lagging leg switches are givenby S2 and S2’. The tank current i(t) is rectified by adiode bridge rectifier and filtered by a capacitivefilter to get required output voltage. The magnitudeand wave shape of the resonant current dependson fs, D and the load factor (Q) of the converter. Qis defined as the ratio of resonant tankcharacteristic impedance and the resistive load asseen from the resonant tank.
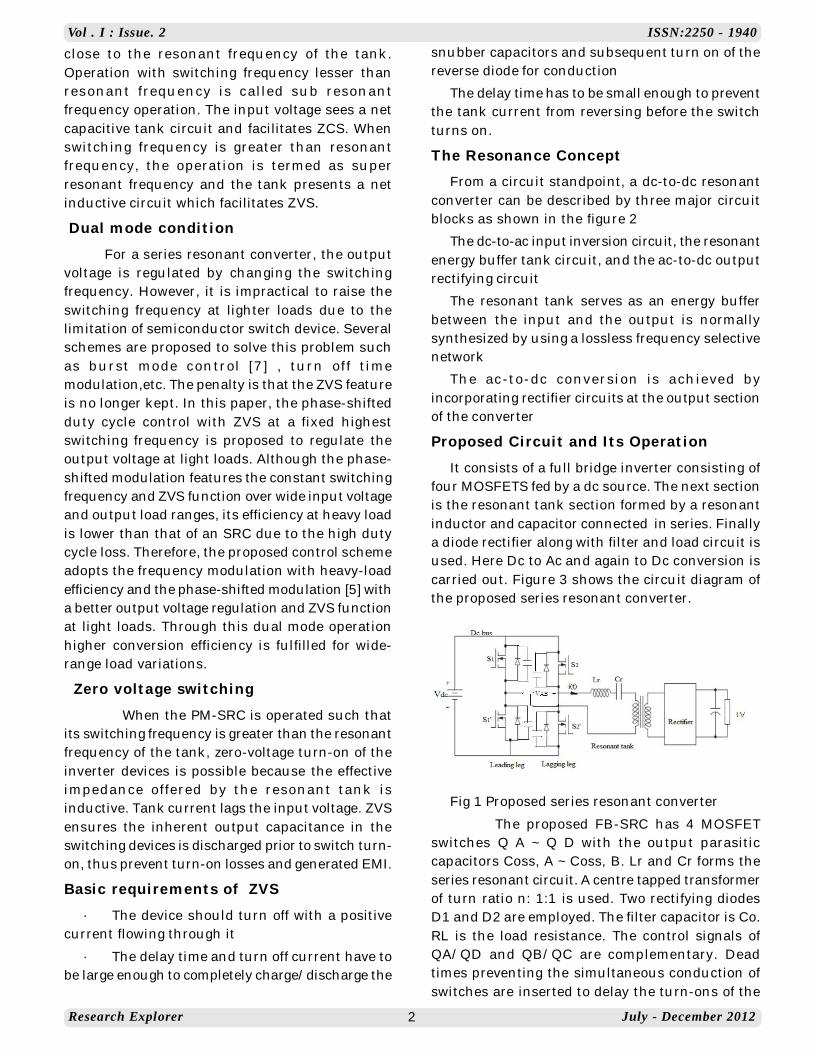
For phase modulation full bridge inverterwith fully controlled devices is required as shownin fig 3 each device is switched at 50% duty ratiowith the switching of the devices on the same legbeing complementary. As shown in fig 4, conductionof switches on the same leg of the inverter (S1 andS1’) is phase shifted with respect to the conductionof switches on the lagging leg (S2 and S2’) , resultingin the quasi-square input voltage.
Fig 2 Gate waveforms of series resonantconverter
Modes of Operation There are two modes of operation in the
A. Switching frequency modulation mode The gate signals for switching frequency
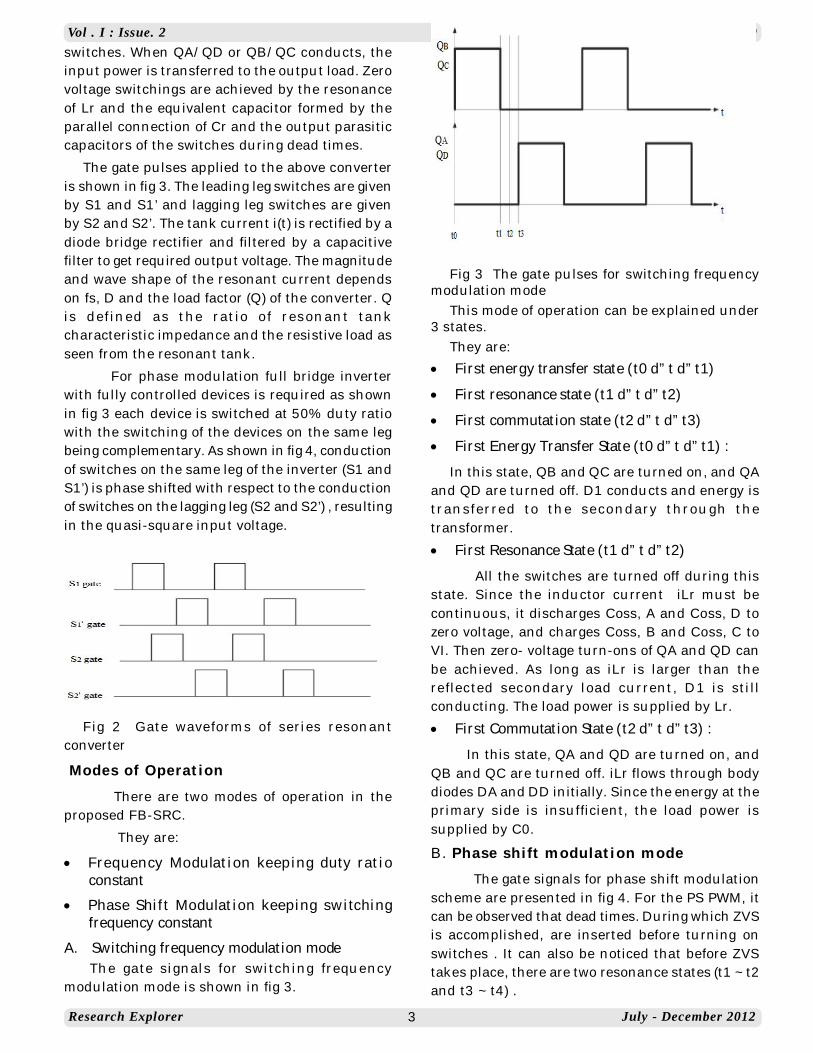
modulation mode is shown in fig 3.
Fig 3 The gate pulses for switching frequencymodulation mode
This mode of operation can be explained under3 states.
They are:
First energy transfer state (t0 d” t d” t1)
First resonance state (t1 d” t d” t2)
First commutation state (t2 d” t d” t3)
First Energy Transfer State (t0 d” t d” t1) :
In this state, QB and QC are turned on, and QAand QD are turned off. D1 conducts and energy istransferred to the secondary through thetransformer.
First Resonance State (t1 d” t d” t2)
All the switches are turned off during thisstate. Since the inductor current iLr must becontinuous, it discharges Coss, A and Coss, D tozero voltage, and charges Coss, B and Coss, C toVI. Then zero- voltage turn-ons of QA and QD canbe achieved. As long as iLr is larger than thereflected secondary load current, D1 is stillconducting. The load power is supplied by Lr.
First Commutation State (t2 d” t d” t3) :
In this state, QA and QD are turned on, andQB and QC are turned off. iLr flows through bodydiodes DA and DD initially. Since the energy at theprimary side is insufficient, the load power issupplied by C0.
B. Phase shift modulation mode The gate signals for phase shift modulation
scheme are presented in fig 4. For the PS PWM, itcan be observed that dead times. During which ZVSis accomplished, are inserted before turning onswitches . It can also be noticed that before ZVStakes place, there are two resonance states (t1 ~ t2and t3 ~ t4) .
Research Explorer July - December 2012
Vol . I : Issue. 2 ISSN:2250 - 1940
4
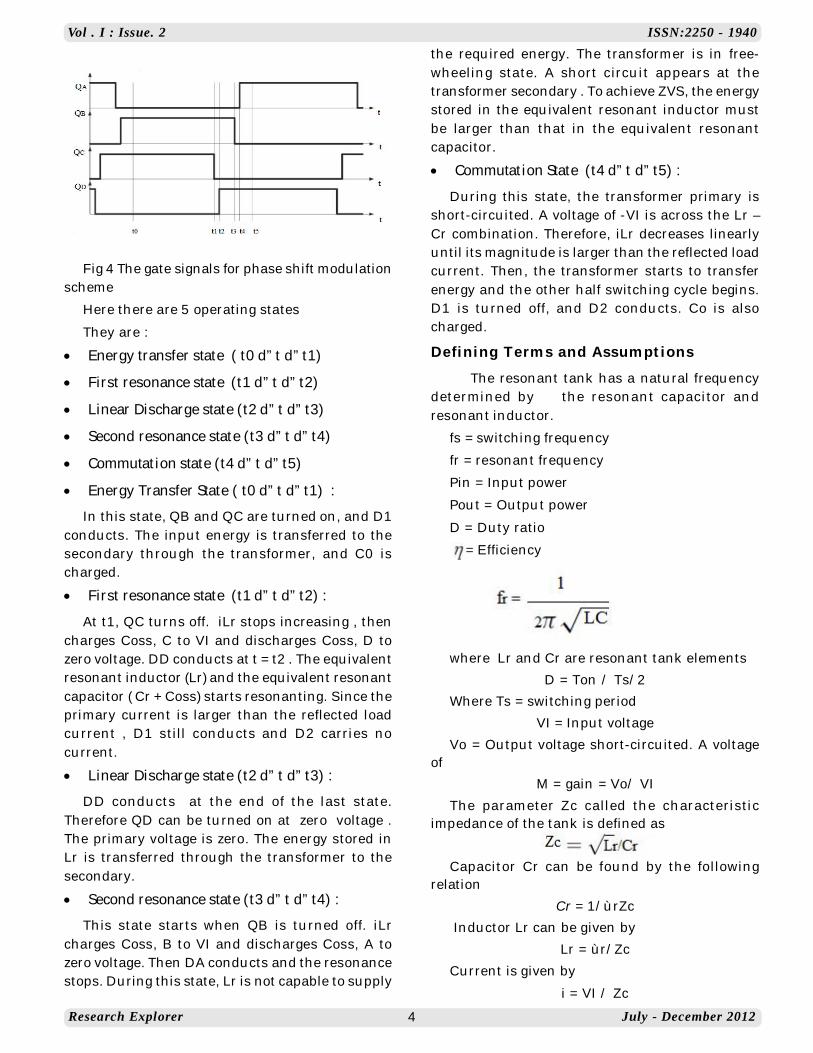
Fig 4 The gate signals for phase shift modulationscheme
Here there are 5 operating states
They are :
Energy transfer state ( t0 d” t d” t1)
First resonance state (t1 d” t d” t2)
Linear Discharge state (t2 d” t d” t3)
Second resonance state (t3 d” t d” t4)
Commutation state (t4 d” t d” t5)
Energy Transfer State ( t0 d” t d” t1) :
In this state, QB and QC are turned on, and D1conducts. The input energy is transferred to thesecondary through the transformer, and C0 ischarged.
First resonance state (t1 d” t d” t2) :
At t1, QC turns off. iLr stops increasing , thencharges Coss, C to VI and discharges Coss, D tozero voltage. DD conducts at t = t2 . The equivalentresonant inductor (Lr) and the equivalent resonantcapacitor ( Cr + Coss) starts resonanting. Since theprimary current is larger than the reflected loadcurrent , D1 still conducts and D2 carries nocurrent.
Linear Discharge state (t2 d” t d” t3) :
DD conducts at the end of the last state.Therefore QD can be turned on at zero voltage .The primary voltage is zero. The energy stored inLr is transferred through the transformer to thesecondary.
Second resonance state (t3 d” t d” t4) :
This state starts when QB is turned off. iLrcharges Coss, B to VI and discharges Coss, A tozero voltage. Then DA conducts and the resonancestops. During this state, Lr is not capable to supply
the required energy. The transformer is in free-wheeling state. A short circuit appears at thetransformer secondary . To achieve ZVS, the energystored in the equivalent resonant inductor mustbe larger than that in the equivalent resonantcapacitor.
Commutation State (t4 d” t d” t5) :
During this state, the transformer primary isshort-circuited. A voltage of -VI is across the Lr –Cr combination. Therefore, iLr decreases linearlyuntil its magnitude is larger than the reflected loadcurrent. Then, the transformer starts to transferenergy and the other half switching cycle begins.D1 is turned off, and D2 conducts. Co is alsocharged.
Defining Terms and Assumptions The resonant tank has a natural frequency
determined by the resonant capacitor andresonant inductor.
fs = switching frequency
fr = resonant frequency
Pin = Input power
Pout = Output power
D = Duty ratio
= Efficiency
where Lr and Cr are resonant tank elementsD = Ton / Ts/2
Where Ts = switching periodVI = Input voltage
Vo = Output voltage short-circuited. A voltageof
M = gain = Vo/ VIThe parameter Zc called the characteristic
impedance of the tank is defined as
Capacitor Cr can be found by the followingrelation
Cr = 1/ùrZc Inductor Lr can be given by
Lr = ùr/ZcCurrent is given by
i = VI / Zc
Research Explorer July - December 2012
Vol . I : Issue. 2 ISSN:2250 - 1940
5
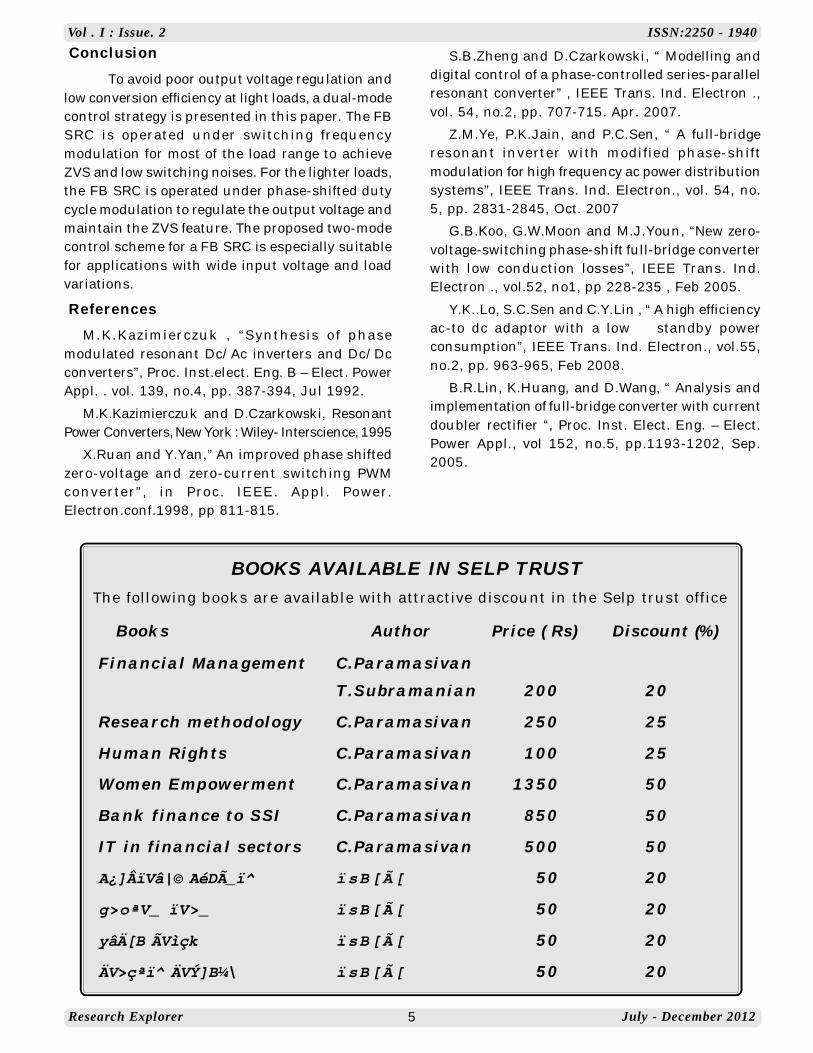
Conclusion To avoid poor output voltage regulation and
low conversion efficiency at light loads, a dual-modecontrol strategy is presented in this paper. The FBSRC is operated under switching frequencymodulation for most of the load range to achieveZVS and low switching noises. For the lighter loads,the FB SRC is operated under phase-shifted dutycycle modulation to regulate the output voltage andmaintain the ZVS feature. The proposed two-modecontrol scheme for a FB SRC is especially suitablefor applications with wide input voltage and loadvariations.
ReferencesM.K.Kazimierczuk , “Synthesis of phase
modulated resonant Dc/Ac inverters and Dc/Dcconverters”, Proc. Inst.elect. Eng. B – Elect. PowerAppl. . vol. 139, no.4, pp. 387-394, Jul 1992.
M.K.Kazimierczuk and D.Czarkowski, ResonantPower Converters, New York : Wiley- Interscience, 1995
X.Ruan and Y.Yan,” An improved phase shiftedzero-voltage and zero-current switching PWMconverter”, in Proc. IEEE. Appl. Power.Electron.conf.1998, pp 811-815.
S.B.Zheng and D.Czarkowski, “ Modelling anddigital control of a phase-controlled series-parallelresonant converter” , IEEE Trans. Ind. Electron .,vol. 54, no.2, pp. 707-715. Apr. 2007.
Z.M.Ye, P.K.Jain, and P.C.Sen, “ A full-bridgeresonant inverter with modified phase-shiftmodulation for high frequency ac power distributionsystems”, IEEE Trans. Ind. Electron., vol. 54, no.5, pp. 2831-2845, Oct. 2007
Y.K..Lo, S.C.Sen and C.Y.Lin , “ A high efficiencyac-to dc adaptor with a low standby powerconsumption”, IEEE Trans. Ind. Electron., vol.55,no.2, pp. 963-965, Feb 2008.
B.R.Lin, K.Huang, and D.Wang, “ Analysis andimplementation of full-bridge converter with currentdoubler rectifier “, Proc. Inst. Elect. Eng. – Elect.Power Appl., vol 152, no.5, pp.1193-1202, Sep.2005.
The following books are available with attractive discount in the Selp trust office
Research Explorer July - December 2012
Vol . I : Issue. 2 ISSN:2250 - 1940
6
TOBACCO USE AMONG STUDENTS IN A RURAL COLLEGE IN ANDAMANAND NICOBAR ISLANDS
Dr. B. PrabhuramAssociate Professor and Head,
Department of Cooperative Management, Mahatma Gandhi Government College,Mayabunder-744 204, Andaman and Nicobar Islands
ABSTRACTThe present study was conducted in order to find out the use of tobacco among the students in a rural
college of North and Middle Andaman District. From the total 556 students, 283 were boys (51 per cent) and273 girls (49 percent). Majority of them hailed from rural areas and stayed in hostel. About 180 (32.4 percent) were using tobacco in both smoking as well as smokeless form (boys 53.7 per cent and girls 10.3 percent); 72 (12.9 per cent) were past tobacco users and remaining were non-users. Smokeless form of tobaccouse was more popular among boys and girls and girls did not smoke. Use of tobacco was high among thestudents hailing from rural areas and among the students staying in hostels.
Key Words : Tobacco use, college, Students, Andaman and Nicobar Islands
IntroductionTobacco is the second major cause of mortality
leading to the death of one in ten adults worldwide,accounting for about 5.4 million deaths every yearconstituting approximately 12 per cent of globaldeaths. The death toll from tobacco is expected toincrease to eight million a year by 2030; and if thecurrent trend continues unchecked, there will beup to one billion tobacco-related deaths during 21st
century, many of which will be from developingcountries. The state of the epidemic of tobaccouse in India was comprehensively described in therecently completed Global Adult Tobacco Survey(GATS). Over 35 per cent of adults in India usetobacco, primarily smokeless (about 164 million),but there are 42 million users of both smokelessand smoked products, and an additional 69 millionwho only smoke. India is the second largestconsumer of tobacco in the world; second only toChina where tobacco is popular both in smokelessas well smoked forms. With the growing evidenceof harmful and hazardous effects of tobacco, theGovernment of India enacted various legislation andcomprehensive tobacco control measures. TheGovernment of India enacted comprehensivelegislation, the “Cigarettes and Other Tobacco
Products (prohibition of Advertisement andRegulation of Trade and Commerce, Production,Supply and Distribution) Act” (COTPA) as a multi-measure law in May 2003. This Act sought to curbtobacco use through a variety of measures,including requiring smoke free public places,banning advertising of tobacco products and saleof tobacco products to minors, mandating pictorialdepiction of health warnings on tobacco packets,and prohibiting tobacco sponsorship of sports andcultural events. Rules were framed to implementthis law, most recent was “The Cigarettes and OtherTobacco Products (Packing and Labeling) Rules,2006” on July 5, 2006. India has played a strongleadership role in the global fight against tobaccoand in the development of the WHO FrameworkConvention on Tobacco Control (FCTC).
Materials and MethodsIn the Union Territory of Andaman and Nicobar
Islands, there are four colleges established by theGovernment – three situated in Port Blair the capitalof the UT (each one in Arts and Science; Educationand Engineering) and the fourth one in a rural areaof North and Middle Andaman district. The studywas carried out in Mahatma Gandhi Government
Research ExplorerISSN : 2250 - 1940
Vol I : Issue. 2July - December 2012
Research Explorer July - December 2012
Vol . I : Issue. 2 ISSN:2250 - 1940
7
College, Mayabunder in North and Middle Andamandistrict(offers three year degree course in sixdisciplines in arts and science) being the only collegein rural area; covering total students of 556. Ase lf-administered, anonymous pre-testedquestionnaire for tobacco use survey of collegestudents consisting of questions related with theidentification data and tobacco use by students wasused. The self-administered questionnaire wasadministered in the class room. Students wereexplained about how to fill up the questionnaireand motivated to provide authentic information.They were assured that all information would bekept confidential. The survey was carried out inFebruary and March 2012. There were 556 (86.5per cent) responses out of 643 students on roll; 87students (13.5 per cent) were absent. From a totalof 556 students 283 were boys (85.6 per cent tototal boys of the college) and 273 were girls (87.2per cent to total girls).
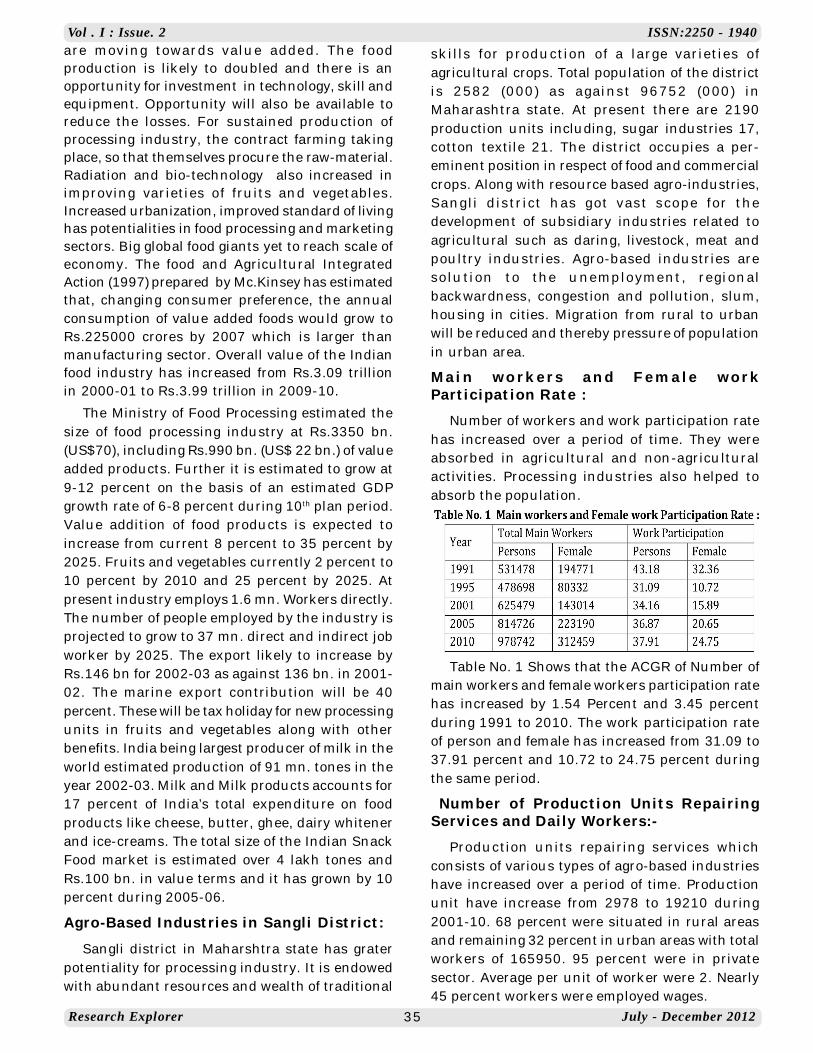
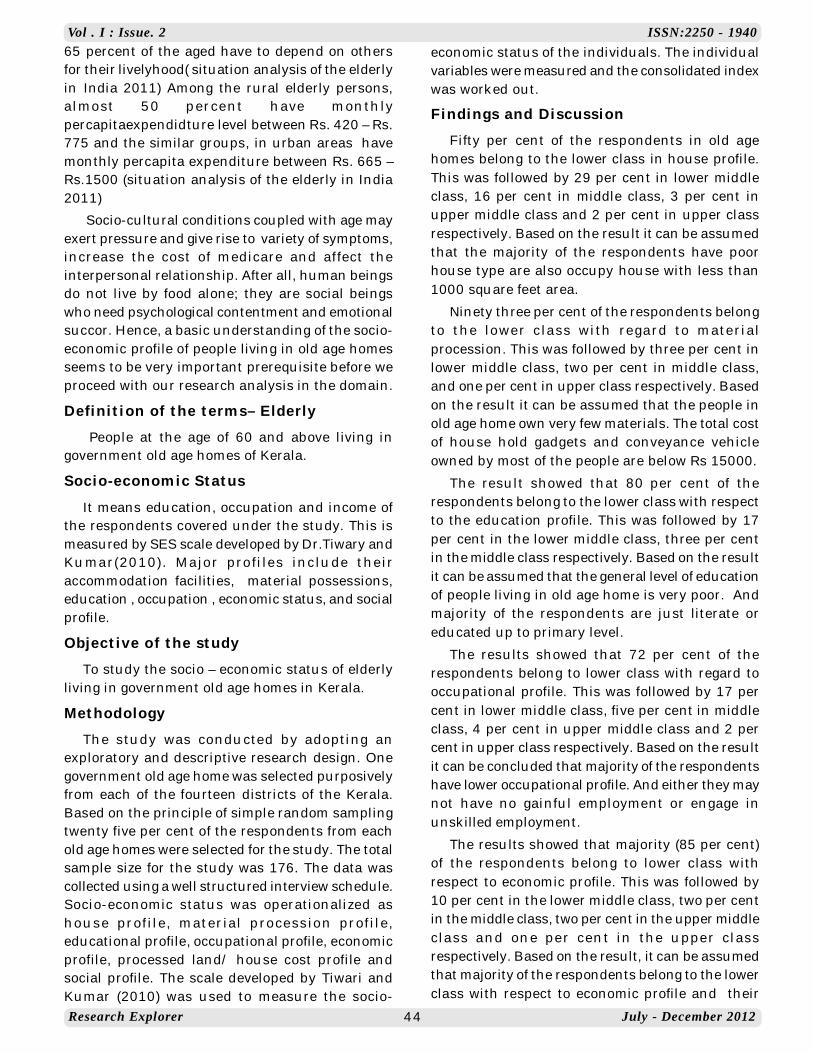
ResultA total of 556 (51 per cent boys and 49 per cent
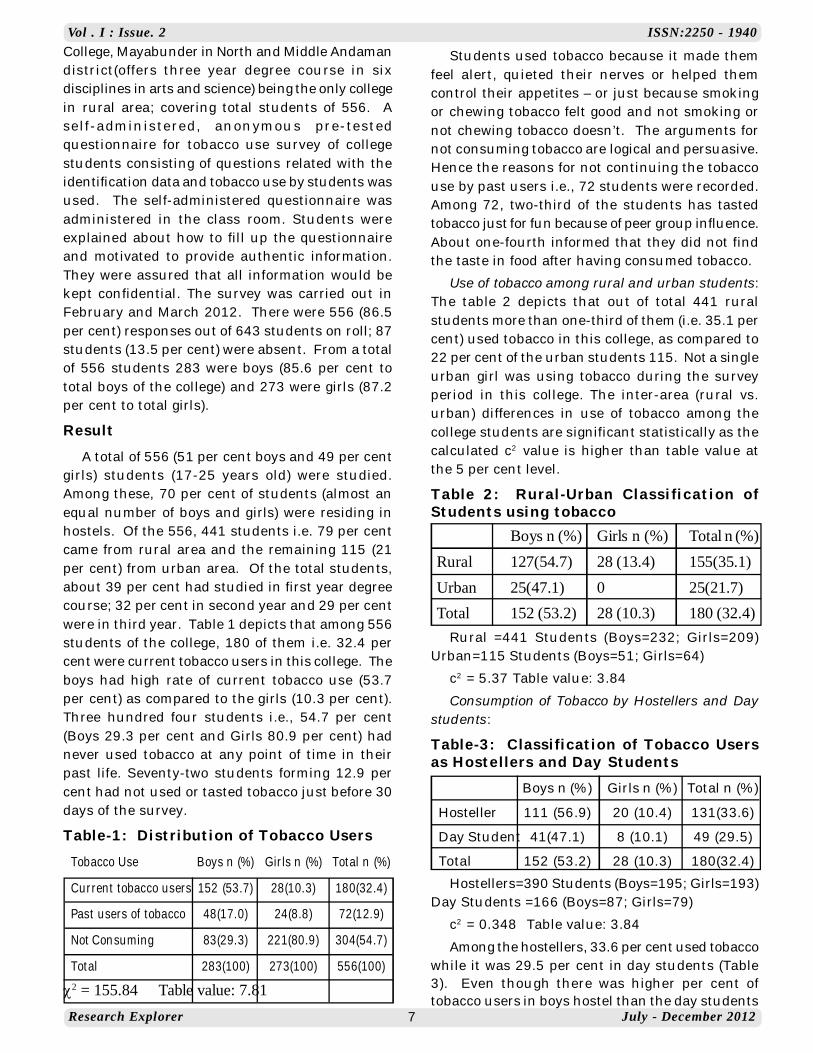
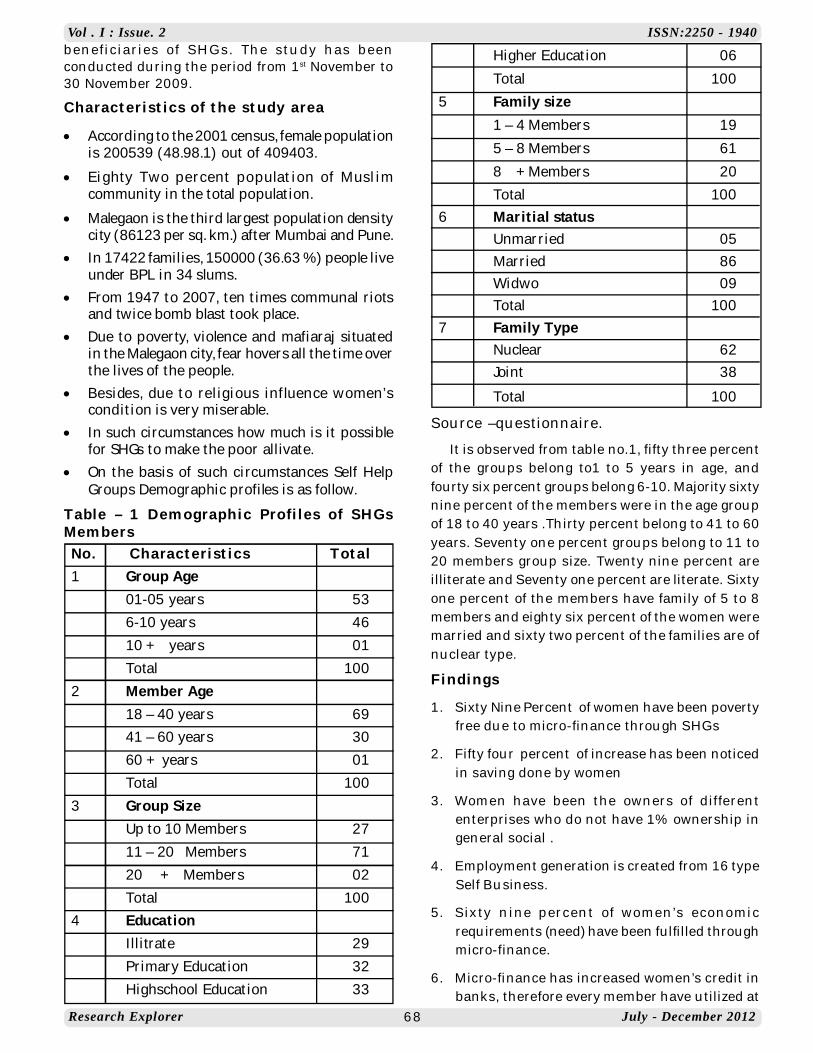
girls) students (17-25 years old) were studied.Among these, 70 per cent of students (almost anequal number of boys and girls) were residing inhostels. Of the 556, 441 students i.e. 79 per centcame from rural area and the remaining 115 (21per cent) from urban area. Of the total students,about 39 per cent had studied in first year degreecourse; 32 per cent in second year and 29 per centwere in third year. Table 1 depicts that among 556students of the college, 180 of them i.e. 32.4 percent were current tobacco users in this college. Theboys had high rate of current tobacco use (53.7per cent) as compared to the girls (10.3 per cent).Three hundred four students i.e., 54.7 per cent(Boys 29.3 per cent and Girls 80.9 per cent) hadnever used tobacco at any point of time in theirpast life. Seventy-two students forming 12.9 percent had not used or tasted tobacco just before 30days of the survey.
Table-1: Distribution of Tobacco UsersTobacco Use Boys n (%) Girls n (%) Total n (%)
Current tobacco users 152 (53.7) 28(10.3) 180(32.4)
Past users of tobacco 48(17.0) 24(8.8) 72(12.9)
Not Consuming 83(29.3) 221(80.9) 304(54.7)
Total 283(100) 273(100) 556(100)
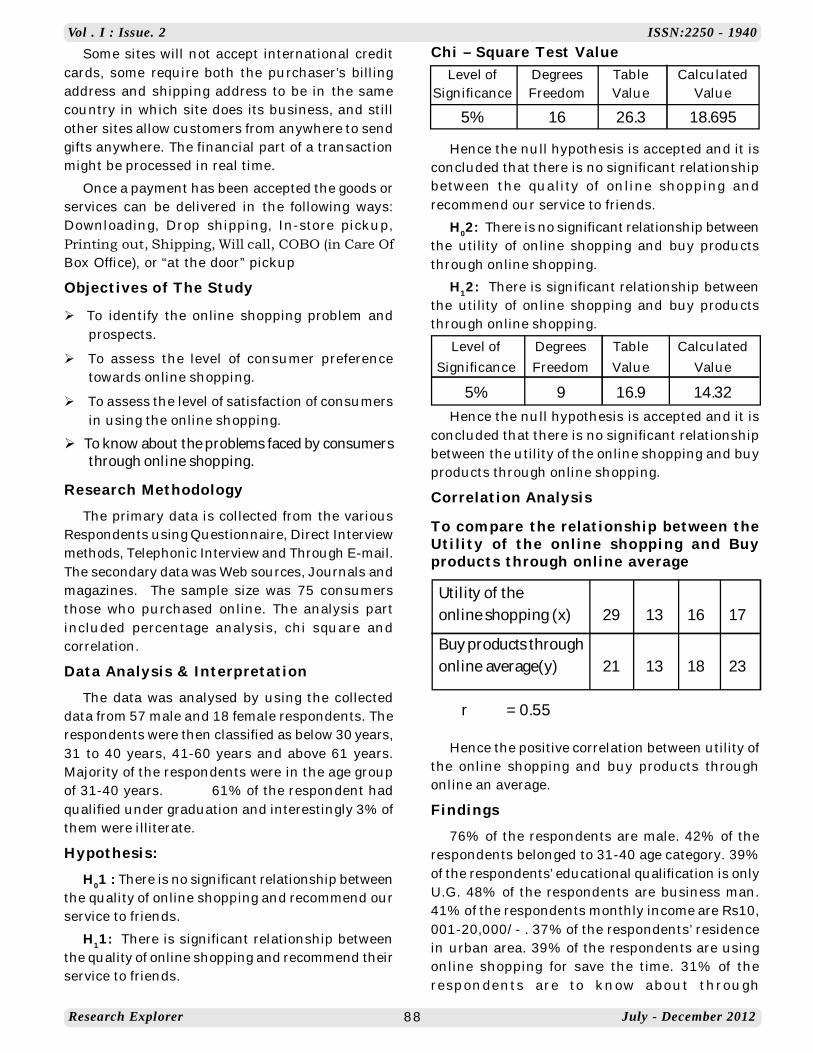
2 = 155.84 Table value: 7.81
Students used tobacco because it made themfeel alert, quieted their nerves or helped themcontrol their appetites – or just because smokingor chewing tobacco felt good and not smoking ornot chewing tobacco doesn’t. The arguments fornot consuming tobacco are logical and persuasive.Hence the reasons for not continuing the tobaccouse by past users i.e., 72 students were recorded.Among 72, two-third of the students has tastedtobacco just for fun because of peer group influence.About one-fourth informed that they did not findthe taste in food after having consumed tobacco.
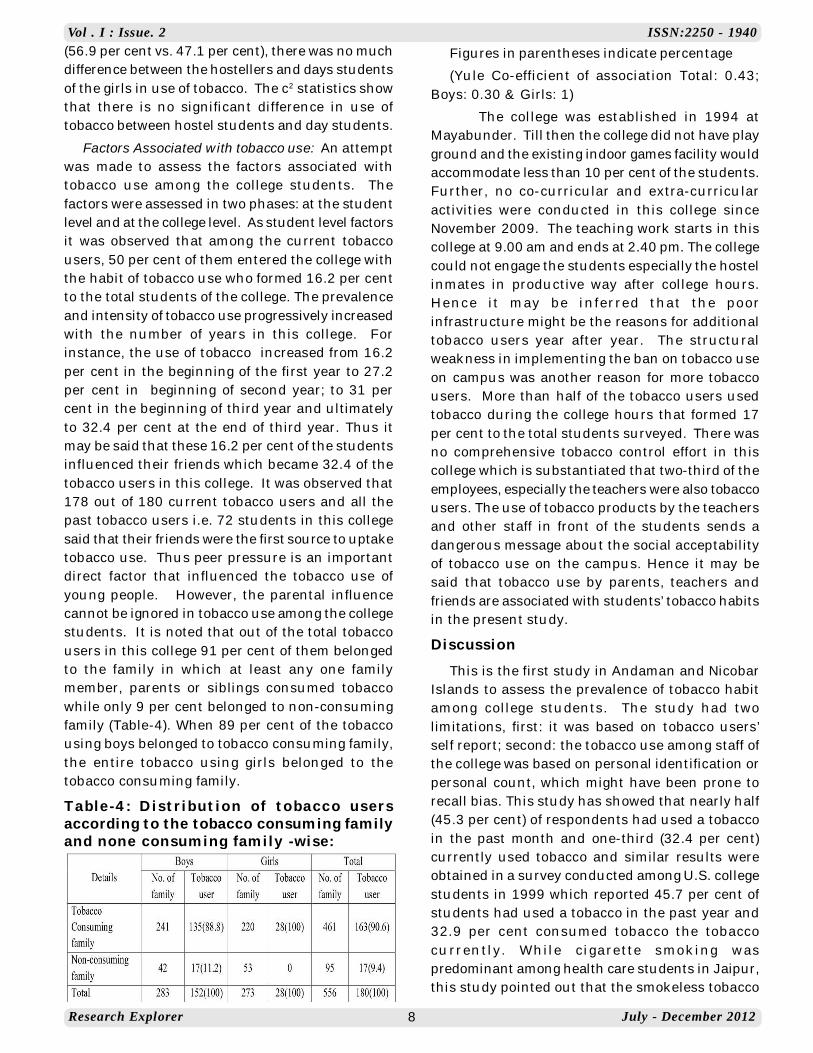
Use of tobacco among rural and urban students:The table 2 depicts that out of total 441 ruralstudents more than one-third of them (i.e. 35.1 percent) used tobacco in this college, as compared to22 per cent of the urban students 115. Not a singleurban girl was using tobacco during the surveyperiod in this college. The inter-area (rural vs.urban) differences in use of tobacco among thecollege students are significant statistically as thecalculated c2 value is higher than table value atthe 5 per cent level.
Table 2: Rural-Urban Classification ofStudents using tobacco
Boys n (%) Girls n (%) Total n (%)Rural 127(54.7) 28 (13.4) 155(35.1)Urban 25(47.1) 0 25(21.7)Total 152 (53.2) 28 (10.3) 180 (32.4)
Rural =441 Students (Boys=232; Girls=209)Urban=115 Students (Boys=51; Girls=64)
c2 = 5.37 Table value: 3.84
Consumption of Tobacco by Hostellers and Daystudents:
Table-3: Classification of Tobacco Usersas Hostellers and Day Students
Boys n (%) Girls n (%) Total n (%)
Hosteller 111 (56.9) 20 (10.4) 131(33.6)
Day Student 41(47.1) 8 (10.1) 49 (29.5)
Total 152 (53.2) 28 (10.3) 180(32.4)
Hostellers=390 Students (Boys=195; Girls=193)Day Students =166 (Boys=87; Girls=79)
c2 = 0.348 Table value: 3.84
Among the hostellers, 33.6 per cent used tobaccowhile it was 29.5 per cent in day students (Table3). Even though there was higher per cent oftobacco users in boys hostel than the day students
Research Explorer July - December 2012
Vol . I : Issue. 2 ISSN:2250 - 1940
8
(56.9 per cent vs. 47.1 per cent), there was no muchdifference between the hostellers and days studentsof the girls in use of tobacco. The c2 statistics showthat there is no significant difference in use oftobacco between hostel students and day students.
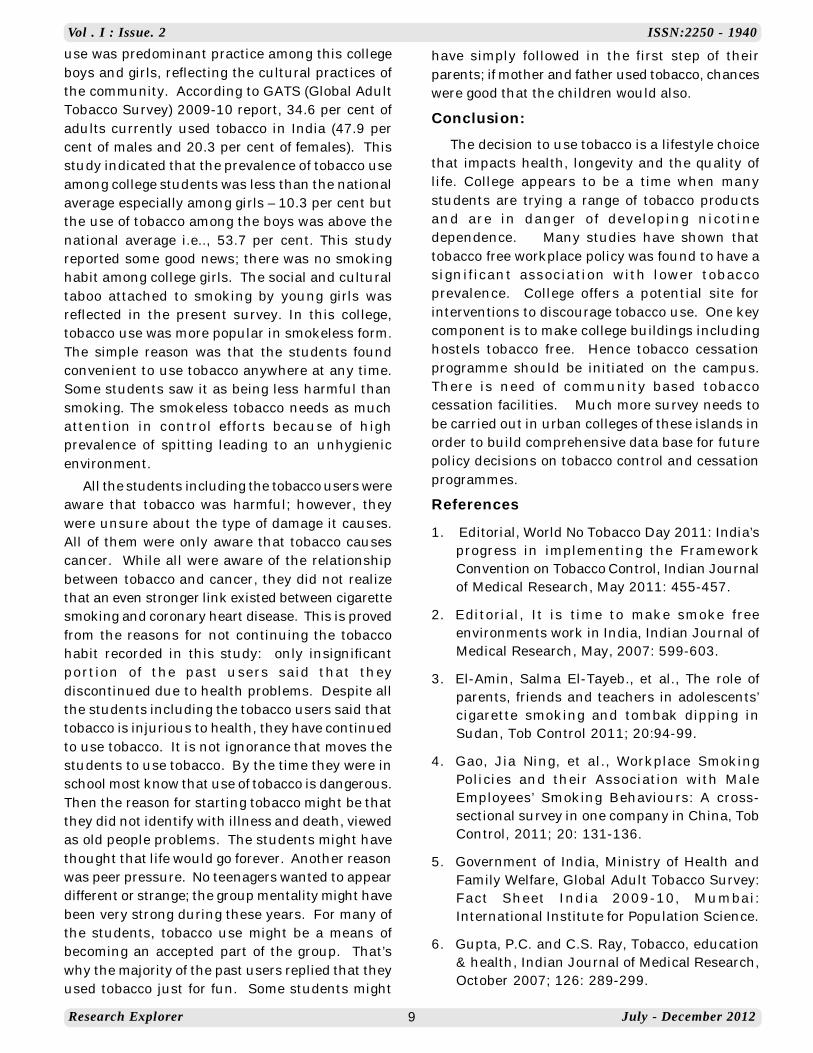
Factors Associated with tobacco use: An attemptwas made to assess the factors associated withtobacco use among the college students. Thefactors were assessed in two phases: at the studentlevel and at the college level. As student level factorsit was observed that among the current tobaccousers, 50 per cent of them entered the college withthe habit of tobacco use who formed 16.2 per centto the total students of the college. The prevalenceand intensity of tobacco use progressively increasedwith the number of years in this college. Forinstance, the use of tobacco increased from 16.2per cent in the beginning of the first year to 27.2per cent in beginning of second year; to 31 percent in the beginning of third year and ultimatelyto 32.4 per cent at the end of third year. Thus itmay be said that these 16.2 per cent of the studentsinfluenced their friends which became 32.4 of thetobacco users in this college. It was observed that178 out of 180 current tobacco users and all thepast tobacco users i.e. 72 students in this collegesaid that their friends were the first source to uptaketobacco use. Thus peer pressure is an importantdirect factor that influenced the tobacco use ofyoung people. However, the parental influencecannot be ignored in tobacco use among the collegestudents. It is noted that out of the total tobaccousers in this college 91 per cent of them belongedto the family in which at least any one familymember, parents or siblings consumed tobaccowhile only 9 per cent belonged to non-consumingfamily (Table-4). When 89 per cent of the tobaccousing boys belonged to tobacco consuming family,the entire tobacco using girls belonged to thetobacco consuming family.
Table-4: Distribution of tobacco usersaccording to the tobacco consuming familyand none consuming family -wise:
Figures in parentheses indicate percentage
(Yule Co-efficient of association Total: 0.43;Boys: 0.30 & Girls: 1)
The college was established in 1994 atMayabunder. Till then the college did not have playground and the existing indoor games facility wouldaccommodate less than 10 per cent of the students.Further, no co-curricular and extra-curricularactivities were conducted in this college sinceNovember 2009. The teaching work starts in thiscollege at 9.00 am and ends at 2.40 pm. The collegecould not engage the students especially the hostelinmates in productive way after college hours.Hence it may be inferred that the poorinfrastructure might be the reasons for additionaltobacco users year after year. The structuralweakness in implementing the ban on tobacco useon campus was another reason for more tobaccousers. More than half of the tobacco users usedtobacco during the college hours that formed 17per cent to the total students surveyed. There wasno comprehensive tobacco control effort in thiscollege which is substantiated that two-third of theemployees, especially the teachers were also tobaccousers. The use of tobacco products by the teachersand other staff in front of the students sends adangerous message about the social acceptabilityof tobacco use on the campus. Hence it may besaid that tobacco use by parents, teachers andfriends are associated with students’ tobacco habitsin the present study.
DiscussionThis is the first study in Andaman and Nicobar
Islands to assess the prevalence of tobacco habitamong college students. The study had twolimitations, first: it was based on tobacco users’self report; second: the tobacco use among staff ofthe college was based on personal identification orpersonal count, which might have been prone torecall bias. This study has showed that nearly half(45.3 per cent) of respondents had used a tobaccoin the past month and one-third (32.4 per cent)currently used tobacco and similar results wereobtained in a survey conducted among U.S. collegestudents in 1999 which reported 45.7 per cent ofstudents had used a tobacco in the past year and32.9 per cent consumed tobacco the tobaccocurrently. While cigarette smoking waspredominant among health care students in Jaipur,this study pointed out that the smokeless tobacco
Research Explorer July - December 2012
Vol . I : Issue. 2 ISSN:2250 - 1940
9
use was predominant practice among this collegeboys and girls, reflecting the cultural practices ofthe community. According to GATS (Global AdultTobacco Survey) 2009-10 report, 34.6 per cent ofadults currently used tobacco in India (47.9 percent of males and 20.3 per cent of females). Thisstudy indicated that the prevalence of tobacco useamong college students was less than the nationalaverage especially among girls – 10.3 per cent butthe use of tobacco among the boys was above thenational average i.e.., 53.7 per cent. This studyreported some good news; there was no smokinghabit among college girls. The social and culturaltaboo attached to smoking by young girls wasreflected in the present survey. In this college,tobacco use was more popular in smokeless form.The simple reason was that the students foundconvenient to use tobacco anywhere at any time.Some students saw it as being less harmful thansmoking. The smokeless tobacco needs as muchattention in control efforts because of highprevalence of spitting leading to an unhygienicenvironment.
All the students including the tobacco users wereaware that tobacco was harmful; however, theywere unsure about the type of damage it causes.All of them were only aware that tobacco causescancer. While all were aware of the relationshipbetween tobacco and cancer, they did not realizethat an even stronger link existed between cigarettesmoking and coronary heart disease. This is provedfrom the reasons for not continuing the tobaccohabit recorded in this study: only insignificantportion of the past users said that theydiscontinued due to health problems. Despite allthe students including the tobacco users said thattobacco is injurious to health, they have continuedto use tobacco. It is not ignorance that moves thestudents to use tobacco. By the time they were inschool most know that use of tobacco is dangerous.Then the reason for starting tobacco might be thatthey did not identify with illness and death, viewedas old people problems. The students might havethought that life would go forever. Another reasonwas peer pressure. No teenagers wanted to appeardifferent or strange; the group mentality might havebeen very strong during these years. For many ofthe students, tobacco use might be a means ofbecoming an accepted part of the group. That’swhy the majority of the past users replied that theyused tobacco just for fun. Some students might
have simply followed in the first step of theirparents; if mother and father used tobacco, chanceswere good that the children would also.
Conclusion:The decision to use tobacco is a lifestyle choice
that impacts health, longevity and the quality oflife. College appears to be a time when manystudents are trying a range of tobacco productsand are in danger of deve loping nicotinedependence. Many studies have shown thattobacco free workplace policy was found to have asignificant association with lower tobaccoprevalence. College offers a potential site forinterventions to discourage tobacco use. One keycomponent is to make college buildings includinghostels tobacco free. Hence tobacco cessationprogramme should be initiated on the campus.There is need of community based tobaccocessation facilities. Much more survey needs tobe carried out in urban colleges of these islands inorder to build comprehensive data base for futurepolicy decisions on tobacco control and cessationprogrammes.
References
1. Editorial, World No Tobacco Day 2011: India’sprogress in implementing the FrameworkConvention on Tobacco Control, Indian Journalof Medical Research, May 2011: 455-457.
2. Editorial, It is time to make smoke freeenvironments work in India, Indian Journal ofMedical Research, May, 2007: 599-603.
3. El-Amin, Salma El-Tayeb., et al., The role ofparents, friends and teachers in adolescents’cigarette smoking and tombak dipping inSudan, Tob Control 2011; 20:94-99.
4. Gao, Jia Ning, et al., Workplace SmokingPolicies and their Association with MaleEmployees’ Smoking Behaviours: A cross-sectional survey in one company in China, TobControl, 2011; 20: 131-136.
5. Government of India, Ministry of Health andFamily Welfare, Global Adult Tobacco Survey:Fact Sheet India 2009-10, Mumbai:International Institute for Population Science.
6. Gupta, P.C. and C.S. Ray, Tobacco, education& health, Indian Journal of Medical Research,October 2007; 126: 289-299.
Research Explorer July - December 2012
Vol . I : Issue. 2 ISSN:2250 - 1940
10
7. Gupta, Prakash C. et al., Smokeless Tobacco:A Major Public Health Problem in the SEARegion: A review, Indian Journal of PublicHealth, 2011; 55(3): 199-209.
8. HRIDAY (Health Related InformationDissemination Amongst Youth), TobaccoControl Laws and Initiatives in India: IssueBased Factsheets, New Delhi, n.d.
9. Jiloha, R.C. Tobacco Smoking: How far do thelegislative control measures address theproblem? Indian Journal of Psychiatry, 2012;54(1): 64-68.
10. Kaur, Jagdish and D.C. Jain, Tobacco ControlPolicies in India: Implementation andChallenges, Indian Journal of Public Health,2011; 55(3): 220-227.
11. Kishore, Surekha, et al., Tobacco AddictionAmongst Adolescents in Rural Areas of DistrictWardha, JK Science, 2007; 9(2): 79-82
12. Man-kit Leung, C. et al., Fighting TobaccoSmoking – a Difficult but Not Impossible Battle,International Journal of Environmental Researchand Public Health, 2009; 6(1): 69-83.
13. Mathur, Prashant and Bela Shah, EvidenceBuilding for Policy: Tobacco Surveillance/Surveys and Research in India, Indian Journalof Public Health, 2011; 55(3): 177-183.
14. Mishra, Gauravi A. et al., Workplace tobaccocessation program in India: A success story,Indian Journal of Occupational andEnvironmental Medicine, 2009; 13(3): 146-153.
15. Narain, Raj, et al., Age at Initiation andprevalence of tobacco use among schoolchildren in Noida, India: A cross-sectionalquestionnaire based survey, Indian Journal ofMedical Research, March 2011; 133: 300-307.
16. Satyanarayana G. et al., A Smoking Survey ofCollege Students in India: Implications forDesigning Antismoking Policy, Japan Journalof Cancer Research, 1991; 82: 142-145.
17. Singh, Iqbal., et al., Prevalence of TobaccoHabits Among Health Care Students in Jaipur,JK Science, 2010; 12(3): 116-119.
18. Sinha, D.N. et al., Tobacco Use among Youthand Adults in Member Countries of South-EastAsia Region: Review of Findings from Surveysunder the Global Tobacco Surveillance System,Indian Journal of Public Health, 2011; 55(3):169-176.
19. Rigotti, Nancy A., et al., US College Students’Use of Tobacco Products, JAMA, 2000; 284(6):699-705
20. Toghianifar, Nafiseh, et al., Smoking CessationSupport Availability, Sources & predictors,Indian Journal of Medical Research, June 2011;133: 627-632.
SELP ACADEMYSELP academy is a unit of SELP trust which established mainly for
providing in-depth coaching to the competitive examinations andspecialized in TRB, TET, NET, SET. Classes are conducted by eminentprofessors and subject experts with intensive teaching and modelexaminations. Success rate will be predetermined with restrictivestrength in each section of classes
Reader gracious study material with full coverage of syllabus willbe supplied to the candidates in the first class itself and reviewing theperformance in regular intervals.
Research Explorer July - December 2012
Vol . I : Issue. 2 ISSN:2250 - 1940
11
INEQUALITY AND GROWTH: CHALLENGES FOR INDIAN ECONOMYDr. Anurodh Godha
Assistant Professor,Department of Commerce,
Vardhaman Mahaveer Open University, Kota (Rajasthan) India
ABSTRACTIndia is the largest democracy in the world, something to be very proud of, but, does this democracy really
offer average Indian the choice that it ought to? Rapid economic growth over the past decade in India was themain driver of poverty reduction, but, rising income and non income inequalities (e.g. inequalities in health,education, and economic assets such as land) could be an inherent by-product of the growth process. Inclusivegrowth focuses on creating opportunities rapidly and making them accessible to everyone but in India thegrowth is not uniform across various sectors; and large cross sections of the population remain outside itspurview. Several economic, political and social factors need to be tackled for sustaining a rapid rate of growth,as well as to make the growth inclusive.
Key Words: Inequality, Inclusive growth.
Introduction“The benefits of growth seems to have bypassed
the overwhelming majority of India’s population,the Indian economy’s rapid expansion has actuallywidened inequality, shrunken job opportunities andreduced wages” - National Commission forEnterprises in the Unorganized Sector (NCEUS).
The pain of hunger is the worst thing to happenin someone’s life. We can never feel how it feels,when there is nothing to eat, and it is impossiblefor those people who take pills to increase theirappetite. We are living in a society where one personis dieing of over eating and the other without food.
The growth of income inequality is aphenomenon that is being witnessed in allcountries, both developed and developing, but in ademocracy like India, these inequalities are likelyto lead to social unrest because greater degree ofincome inequality put lower impact of growth onpoverty reduction. As rising income inequalities andthe persistence of unacceptably high levels of nonincome inequalities pose a clear and present dangerto India’s progress, so the paper advocates somestrategies to make that growth inclusive.
Since independence the Indian economy hasstriven hard for improving its pace of development.Notably in the past few years the cities in Indiahave undergone tremendous infrastructure up
gradation and it obviously gives us pride to seehighest Billionaires in Asia are from India. India isroaring but I bet they need to save face to knowthat India houses highest numbers of BPL (belowpoverty line) people in world. Our malnutrition dataare worst. According to a recently conducted surveyby the NSSO, around one- fifth of rural Indiasurvives on Rs 12 a day.
Looking at the darker side the growth is lopsided.There are people in this country still who can’tafford two square meals a day. We still find so manypeople begging, picking rags and plastics fromgarbage. The government instead of doing thebalancing act is playing facilitator to big industries.
Likewise in the realm of health and educationand other human development indicators, India’sperformance has been far from satisfactory. Therich-poor divide has increased and povertyreduction figures of India are now lower than thoseof Bangladesh. There are disparities among regions,states, sectors, and communities. Among the states,the north-eastern and the central regions, whichhave large tribal populations, are lagging behind.Among sectors, agriculture has fallen behindindustry and the service sector. Although some ofthe poorest states are rich in natural and forestresources, the predominantly tribal population isunable to take advantage of this.
Research ExplorerISSN : 2250 - 1940
Vol I : Issue. 2July - December 2012
Research Explorer July - December 2012
Vol . I : Issue. 2 ISSN:2250 - 1940
12
All countries: rich or poor, all administrators:politicians or bureaucrats, all governments:democratic or totalitarian, all systems: capitalistor socialist have claimed to be working for “inclusivegrowth”. They have all perhaps done their bit infinding ways for such a growth. There are theoriesand philosophies propounded for the purpose; thereare programmes and schemes announced with thatintent. There are measures and machineries put inplace. Governments have won and lost electionson this issue. However, the issue remains theretoday, as it was before centuries and decades.
What is Inclusive Growth?Each one of us will have a different definition of
the term “inclusive growth”, different approachesfor analyzing the issue and different strategies forarriving at solutions. However, the term, in commonparlance, would mean “growth by which everyonebenefits”. There cannot be any dispute with eitherthe letter or spirit of this definition. It is an ideal,which must be achieved.
Growth is inclusive when it allows all membersof a society to participate in, and contribute to thegrowth process on an equal footing regardless oftheir individual circumstances. Inclusive growth byits very definition implies an equitable allocation ofresources with benefits accruing to every sectionof society. There are some attributes ofinclusiveness and these are:
Opportunity: Is the economy generating moreand varied ways for people to earn a living andincrease their incomes over time?
Capability: Is the economy providing the meansfor people to create or enhance their capabilities inorder to exploit available opportunities?
Access: Is the economy providing the means tobring opportunities and capabilities together?
Security: Is the economy providing the meansfor people to protect themselves against a temporaryor permanent loss of livelihood?
In India growth is far from inclusive. We all knowit, we see the beggars on the streets, about thebiggest slums in the world, we know of the cleaninglady who cannot afford treatment for her ailinghusband, we read about the farmer suicides inPunjab and Maharashtra but who went to IndiaGate with candles??? Who talked hours togetherin Main TV channels??? Who came voluntarily tofight their case...??? We all understand their plight;we even sympathize and empathize with them, forthe ten minutes after reading an article in anewspaper or seeing an amputated beggar on thestreet.
Challenges and Prescriptions: collectiveefforts for inclusive growth
“If inclusive growth is the objective, we need toshift focus from formal to informal sector given itssize,” - K.P. Kannan (a former commission memberof National Commission for Enterprises in theUnorganized Sector)
The main problems in India are poverty &corruption. The later one that is corruption is themain cause for the underdeveloped condition of ourcountry even after 60 yrs. There is a race amongstbureaucrats, politicians and entrepreneurs toenrich themselves at any cost: corruption being acentral tool in this game of enrichment. Corruptionis definitely one of the ills that prevent inclusivegrowth, rather, enabling the rich to get richer andkeeping the poor poorer. In India you have to workhard to get something correctly and in legal waybut if you offer bribe to somebody in the middlethen your work would be over in minutes. RajivGandhi had once remarked that hardly ten percentof the money earmarked for rural projects in Indiareached the actual beneficiaries. Unfortunately, thesituation hasn’t changed much at all since.
The most disquieting aspect of the widespreadcorruption in India is the fact that it is not anymoreconfined to politicians or the government machineryalone. It is prevalent amongst almost every sectionof the society at every level. It does not shockIndians anymore to know that not only thepoliticians, ministers and IAS & IPS officers arecorrupt but even the judges, professors, doctorsand NGO organisations are.
The study of world phenomenon on corruptionhas repeatedly branded India as one of the mostcorrupt countries in the world. Unfortunately, thisview has not disturbed most of the Indians at alland they do not seem to care as to what othersthink of them.
The ‘educated’ Indian is well aware of thecondition of the poor, the apathy of the corruptpolitician and the flawed system, but is too selfcentred, busy in making the most of the everballooning stock market, they are not at all botheredabout the system, everyone want to be a part ofthe ‘dirty game’ that is politics, movies like RangDe Basanti are rare to make and if produced thanthese type of movies put impact on Indian youthonly in theatres.
Now, what can be the future of the Indian societyin such conditions? Corruption exists in all societiesat all levels, especially developing ones. The pointis how serious we are about tolerating it. It is sadthat those who are in charge of the nation today do
Research Explorer July - December 2012
Vol . I : Issue. 2 ISSN:2250 - 1940
13
not appear to realise this and still are merrily goingahead with their dealings unconcerned about theharm that it would inevitably do to the largernational cause.
The strategy to tackle corruption mustnecessarily be multi-pronged – at the legal level,the enforcement level, as well as at the educationaland social levels. Efforts at inclusiveness of societyare predestined to failure unless more than just asemblance of attention is brought about on thecorruption front. The system would be changed onlywhen there is a perfect legislation that the handsthat give bribe and take them should be cut andwhen it is implemented the scenario would change.
One of the tools to deal with the corruption issueis to bring about greater transparency, both in thepolicy making and in the delivery systems. TheRight to Information Act was a step in this direction.Though in its infancy still, its implementation doesappear tardy. Governments have been defensive intheir thinking.
No growth can be inclusive unless it takesadequate care of women and children. In Indiaexploitation of labour is widely prevalent. Despitethe promulgation of minimum wages, the feudalsystem in the rural areas and industry in the urbanconglomerates continue to fleece labour, payingthem wages far below than prescribed.
Child labour has been banned by law in Indiaand there are stringent provisions to deter thisinhuman practice. But millions of young childrencontinue to work in roadside eateries, glassfactories, carpet looms or sweeping and cooking inhomes which is a violation of the Child Labour(Prohibition and Regulation) Act.
To stop this there is a need to tackle povertywhich is the main reason driving parents intopushing their young children to work instead ofsending them to schools. This mammoth problemis one of the main challenges to resolve inaddressing inclusive growth. We need to attractchildren from poverty stricken families to schools.Mid-day meal schemes of Governments have metwith partial success. Again, however, lack oftransparency has ensured that funds and rationsare misappropriated and misused.
Rights of women, children, minoritycommunities and the other marginalised sectionsof society must be constantly watched andprotected if we wish to reach our goal of a trulydeveloped society.
In recent years, India has become a countryof demonstrations, agitations and ‘bandhs’(forcible closure of shops, offices & transport). For
the slightest pretext, trains are stopped, buses andprivate vehicles burnt and offices and businessestablishments forcibly closed. This leads tounimaginable loss of man hours and economicoutput, besides loss of confidence of the outsideworld for making investments. A peaceful andstable environment is a must for sustained foreignand domestic investments.
In this regard, one has to look at initiating properreforms in the criminal justice system, especiallyin the police. The Supreme Court has time andagain reminded the Government of the need toreform the police force. The outdated Police Act of1861 needs to be replaced with a modern Act. ThePolice force needs to be made more responsive andaccountable. It should no longer be a tool in thehands of corrupt politicians but responsible to thelaw of the land. Only then would it be able to providea secure atmosphere for economic activity toprosper and remove age old impediments towardsinclusiveness.
While on the subject of economic growth andits impediments, we must also refer to the impactand consequences of increasing world fuel pricesand the associated threat that looms large overIndia’s future economic growth as oil prices gothrough the roof, India’s situation is becomingdifficult. Within the last one year, the fuel priceshave more than doubled from 65 dollars to nearly150 dollars a barrel of crude oil, upsetting the entireeconomic applecart. We need to do some seriousreflection on how to tackle this. We have to paymuch more attention towards alternative sourcesof energy.
“An overall growth of nine per cent will furtherincrease income disparity between agriculture andnon-agriculture households, unless around 10million people currently employed in agriculturefind remunerative non-agricultural employment,”- RBI Governor Y V Reddy.
Every major industrialised economy in the worldhas followed a path which began with agriculturebeing the main source of income for the majority ofthe population and ended with agriculturalemployment being a very small fraction of the totallabour force. In India more than 60 per cent of thepopulation depended on agriculture while itcontributes only 20 per cent to the GDP.
Agriculture is extremely important for inclusivegrowth, since a large majority of the Indianpopulation is dependent on farming. Improvedagricultural productivity would bring in its wakeincreased family incomes for this vast majority. Itis possible that growing urbanization, improved
Research Explorer July - December 2012
Vol . I : Issue. 2 ISSN:2250 - 1940
14
standards of living and consumption, would see abuild up of pricing pressures on cereals, pulsesand oilseeds in India. As an opportunity, this givesscope to revitalizing investments and returns inagriculture.
The centre of focus for the business has shiftedsomewhere else but not the villages and agrarianeconomy. To achieve high pay-offs in terms ofgrowth and inclusiveness we have to pay specialemphasis on development of rural infrastructuresuch as rural roads and housing, primary andsecondary education, health and sanitation SMEsand labour-intensive export-oriented industriesand social sector expenditure like MGNREGA.
Such contra-cyclical small-ticket targetedgovernment expenditure (eg. MGNREGA) attemptsto address the issue of a equitable distribution ofincome and balanced growth. They are very basicsocial security schemes at best and lodestones ofcorruption at worst. But Inclusive growth doesn’tmean farm loan waiver and the National RuralEmployment Guarantee Scheme only.
True inclusive development would mean thateven the poorest Indians get a chance to move intothe modern, high-productivity sectors. For that,we will need greater liberalization. Three reformswill be especially important. One, we have tocreate a entrepreneurial spirit, Two, new labourlaws that will give companies a reason to use lessexpensive capital and more permanent labour,Three, The national rural employment guaranteescheme needs to be extended to urban areas wheremost of the affected workers are likely to be found.We believe some of the following reforms will alsoensure truly inclusive growth. These include:• The quantity and quality of public investment
(in electricity, irrigation, rural roads, andstorage and transport of food grains) inagriculture and rural infrastructure needs tobe substantially increased.
• R&D for innovation in agriculture needs to beencouraged. The Green Revolution thatsubstantially increased food grain output andproductivity were as a result of better seedsand technology. India needs to continue toleverage global technologies to increase yields.
• Abolishing controlled prices, eliminating taxeson inter-state movement of goods, allowingfarmers to sell directly to organised retail, andremoving restrictions on land holdings (whichare currently circumscribed by land ceilingacts), leading to fragmented land holdings,would increase productivity. It is important to
include elements of technology training andintroduction to new practices, to improve farmefficiencies and productivity. It is also equallyimportant to invest in value addition, inmarketing chains and food processing.
• Increased credit availability, particularly tofarmers and others, and offering themremunerative prices for their crops.
• Increased rural employment, including theprovision of a unique social safety net in theshape of the Mahatma Gandhi National RuralEmployment Guarantee Programme.
• There should be a policy of distribution ofcooking fuels like kerosene and domestic gasat subsidized prices, as well a food grains atbelow market prices to urban poor.
• Increased public spending on education andhealth care, including strengthening the middaymeal programme and offering scholarships tothe needy
• Empowering the scheduled castes, scheduledtribes, other backward classes, minorities,women and children, socially, economically andeducationally.
• Ensuring that, through public investment, thegrowth process spreads to backward regionsand districts of our country. Local self-government, as elaborated in our Constitution,provides the essential means of reconciling‘accelerated growth’ with ‘inclusive growth.
India has the third largest pool of scientists,engineers and doctors in the world, but it has yetto reach anywhere near its full potential with amajority of its vast population still illiterate or semi-literate. There are around 550 million youths inthe country, almost half of the total population.However, due to poverty and social inequalities andcaste system, more than a hundred million youthsare illiterate or uneducated. In rural India, dropout rates of children attending school are very high.There are many institutions in rural areas, but theirprospects are dim, because of lack of goodgovernance, lack of far-sighted policies oneducation, etc.
In fact, the challenges are mighty and it maytake long years to achieve the goal. Nevertheless,we need to work towards the betterment of ourcountry through cooperation and collaboration.We need to go to the base; we need to explore ourvillages, not the forests and mineral resources only,but their inner talents of the people. Being about
Research Explorer July - December 2012
Vol . I : Issue. 2 ISSN:2250 - 1940
15
70% of our population are in rural India; thedevelopment of the country depends totally on thedevelopment of rural communities. And thatdevelopment will be achieved only when the peopleare educated for what education is one of the mostpowerful instruments to reduce poverty, inequalityand sound governance. The meaning of ademocratic country will be clearer and clearer onlywhen its people are educated.
Literacy levels have to rise to provide theskilled workforce required for higher growth. Weshould give emphasis on building an intellectualenvironment in our villages and rural areas. Thisimplies that the government should increase itsspending on educational sector far and wide acrossthe country.
Better governance is the need of the hour,because the government in India still has a majoritystake in almost all essential sectors e.g. the crucialsectors of health, sanitation, water arms, railwaysetc. A well-functioning democracy should allowcitizens to have more voice in evaluating the qualityof services they receive, for governments and serviceproviders to be accountable, and for citizens to paydirectly for services received.
Without better governance, delivery systems andeffective implementation, India will find it difficultto educate its citizens, build its infrastructure,increase agricultural productivity and ensure thatthe fruits of economic growth are well established.To resolve these issues, there has been greateraccountability of politicians to the citizen, greaterability of citizens to hold service providers toaccount for the services they deliver. The elementsof reform, in our view, should comprise:
Encourage greater private-sectorparticipation; the regulatory constraints need tobe removed. The private sector should take moresocial responsibility and contribute towards makinggrowth more inclusive. There also ought to begreater accountability for politicians and civilservants. Allowing the private sector to providepublic services in most essential sectors such ashealth, primary education, building infrastructure,water supply and inner-city transport would solveseveral important problems. It would enable thegovernment to fulfil its obligations to supply coreservices, which are badly served. Citizens wouldexercise choice over providers, and it would clearlyseparate the role of provider and regulator, withthe government becoming the latter (regulator). Bydecentralising provision of public services, thegovernment can unbundle responsibilities acrosstiers of government to create checks and balances.
This can only happen if the Government andthe private sectors become equal and willingpartners. All impediments in the path of public-private partnership should be removed. TheGovernment needs to come out with transparentprocedures for schemes like Special EconomicZones (SEZ), and also make willing partners andshareholders in the process to the people/farmers,whose lands are acquired for this purpose.
Inflation, which is a major obstacle today tomake the growth inclusive, worst affect the poorman. To reduce the impact of price hike on poorpeople the government should subsidise only thelowest income people and not special groups ofpeople, provide help to people in investing their ownskills and future incomes, playing the role ineconomy as light as possible (to the regulatoryextent), making tax rates low and broad based, tryto keep the ratio of public debt to GDP under controlby limiting liabilities and finally applying rigoroussocial cost benefit tests to all spending andregulation decisions.
The main instrument for a sustainable andinclusive growth is assumed to be productiveemployment. Employment growth generates newjobs and income for the individual (from wages inall types of firms, or from self employment, usuallyin micro firms), while productivity growth has thepotential to lift the wages of those employed andthe returns to the self-employed. After all, in manylow-income countries the problem is notunemployment, but rather underemployment.Hence, inclusive growth is not only aboutemployment growth, but also about productivitygrowth. Moreover, it is not only about wage-employment but also about self-employment whichmeans that returns to capital, land and other assetsmatter to the income potential of the focus groupas shown in the identity above.
ConclusionIndia has been endowed with some of the world’s
most essential minerals, beautiful places, culturaldiversities and capable & talented people. It is thetime to make the most of what other countries cannever even dream to have. There is much to be done,but if done and done correctly and then nothingcan stop us from reaching the pinnacle of the world.
MICRO FINANCE BY BANKS IN INDIADr. C. Paramasivan, Ph. D.,
Assistant Professor & Research Supervisor
R. AnandaramanPh. D Full Time Research Scholars
PG & Research Department of Commerce, Periyar EVR College, Trichy – 23
ABSTRACTMicro finance is the basic concepts helping to self-employment people, low income groups, poor entrepreneurs
in rural areas. It provides thrift, credit, savings and other financial services and products of small amount topoor in rural, semi urban or urban areas. Micro finance is the target raising their income, improve standardliving, increasing economic growth, and reduce poverty. Micro finance is another aspect given empowers topoor women especially for handicapped women, divorce women, widow women. This paper focus on the roleof banks in micro finance in India
Key words: Entrepreneurship, Eradication of Poverty, Social Capital, Bank Finance
IntroductionThe term Micro finance refers to extending
the whole range of financial services from savingsto credit to micro insurance to micro enterprisesand a lot more for the poorer sections of societywhose scale of operations are so small and henceare generally excluded from the purview of theexisting service providers. The effectiveness ofmicrofinance is better realized by the deprivedsections when their capacities are also enhancedalong with access to financial services. In the Indiancontext, the search for supplementary deliverymechanism to provide microfinance started withinternal introspection regarding the innovations,which the poor had been traditionally making, tomeet their financial service needs.
Micro FinanceThe concept of micro finance was introduced
Grammen bank of Bangladesh by Mohammedyunus severing over 7.34 million people withrecovery rate of 98.35 percent. Micro finance refersto the provision of financial service to low incomegroups and self employment people. Micro financehas come to include a broader range of serviceslike saving, credit, insurance, remittance,
marketing, money transfer, life cycle product, fundtransfer etc. Microfinance means provide smallloans to poor families helping them to engage inproductive activities of small business namely pettyshop ,flower shop, idly shop, candle making,vegetables, vending, wire basket, weaving etc.
Review of literatureAmutha. J and Ramakrishnan (2011) suggest
that the Government of India encouragesentrepreneurship among micro entrepreneursthrough EDP. Cooperative banks linkage to retailcredit outlets of the formal banking sectorcomprising 12,000 branches of district-levelcooperative banks, over 14,000 branches ofRegional Rural banks and over 30,000 rural andsemi-urban branches of commercial banks; inaddition to 1,12,000 cooperative credit societies atvillage level.
Kayar Kami (2011) concluded that the Self HelpGroup really helps the women folk to participate inorganized activities apart from helping membersto mobilize funds. The present study concludes thatthe respondents are economically and socialempowered by becoming members of SHGs inTuticorin District.
Research ExplorerISSN : 2250 - 1940
Vol I : Issue. 2July - December 2012
Research Explorer July - December 2012
Vol . I : Issue. 2 ISSN:2250 - 1940
17
Saravanan. S (2008) said that micro financeProgrammes have proved that is an effectiveinstrument for eradication of poverty. The spreadof micro finance and the mobilization of womenserve the twin purposes for enabling the state towithdraw from economic activities and diffusingany form of resistance against the state in thepresent economic conditions.
Narbada Ghimire (2011) concluded that eventhough microfinance collateralizes social capitaland makes credit accessible to the poor more thantraditional banking institutions, some of thepoorest women remain excluded, particularly thosewho might represent high risk in the eyes of othergroup members who evaluate the appropriatenessof loan.
Narayanan. B (2008) pointed that micro creditProgramme has become an important tool toeradicate poverty in India. It is gatheringmomentum to become a major force in India. TheSelf-help groups (SHG) model with bank lendingto groups of poor women without collateral hasbecome an accepted part of rural finance.
Table – 1 Savings of SHGs with BanksAgency –Wise
(Rs. in Lakhs)
Soruce: NABARD Report 2011
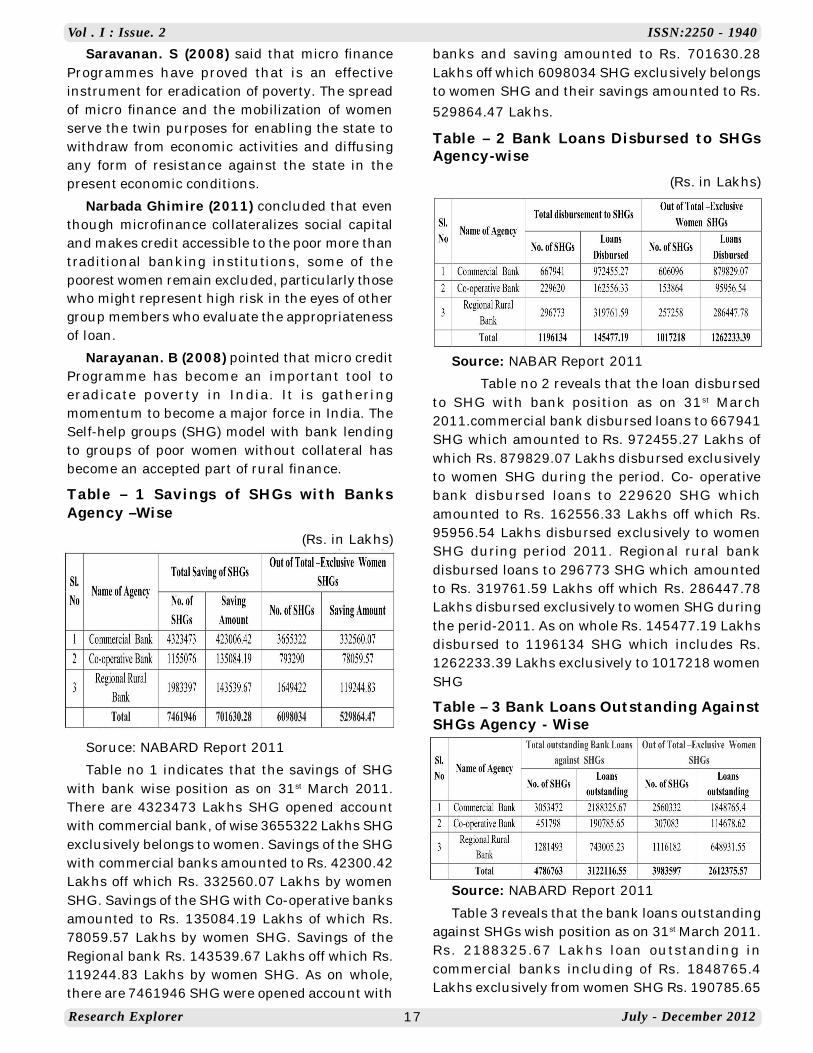
Table no 1 indicates that the savings of SHGwith bank wise position as on 31st March 2011.There are 4323473 Lakhs SHG opened accountwith commercial bank, of wise 3655322 Lakhs SHGexclusively belongs to women. Savings of the SHGwith commercial banks amounted to Rs. 42300.42Lakhs off which Rs. 332560.07 Lakhs by womenSHG. Savings of the SHG with Co-operative banksamounted to Rs. 135084.19 Lakhs of which Rs.78059.57 Lakhs by women SHG. Savings of theRegional bank Rs. 143539.67 Lakhs off which Rs.119244.83 Lakhs by women SHG. As on whole,there are 7461946 SHG were opened account with
banks and saving amounted to Rs. 701630.28Lakhs off which 6098034 SHG exclusively belongsto women SHG and their savings amounted to Rs.529864.47 Lakhs.
Table – 2 Bank Loans Disbursed to SHGsAgency-wise
(Rs. in Lakhs)
Source: NABAR Report 2011
Table no 2 reveals that the loan disbursedto SHG with bank position as on 31st March2011.commercial bank disbursed loans to 667941SHG which amounted to Rs. 972455.27 Lakhs ofwhich Rs. 879829.07 Lakhs disbursed exclusivelyto women SHG during the period. Co- operativebank disbursed loans to 229620 SHG whichamounted to Rs. 162556.33 Lakhs off which Rs.95956.54 Lakhs disbursed exclusively to womenSHG during period 2011. Regional rural bankdisbursed loans to 296773 SHG which amountedto Rs. 319761.59 Lakhs off which Rs. 286447.78Lakhs disbursed exclusively to women SHG duringthe perid-2011. As on whole Rs. 145477.19 Lakhsdisbursed to 1196134 SHG which includes Rs.1262233.39 Lakhs exclusively to 1017218 womenSHG
Table – 3 Bank Loans Outstanding AgainstSHGs Agency - Wise
(Rs. in Lakhs)
Source: NABARD Report 2011
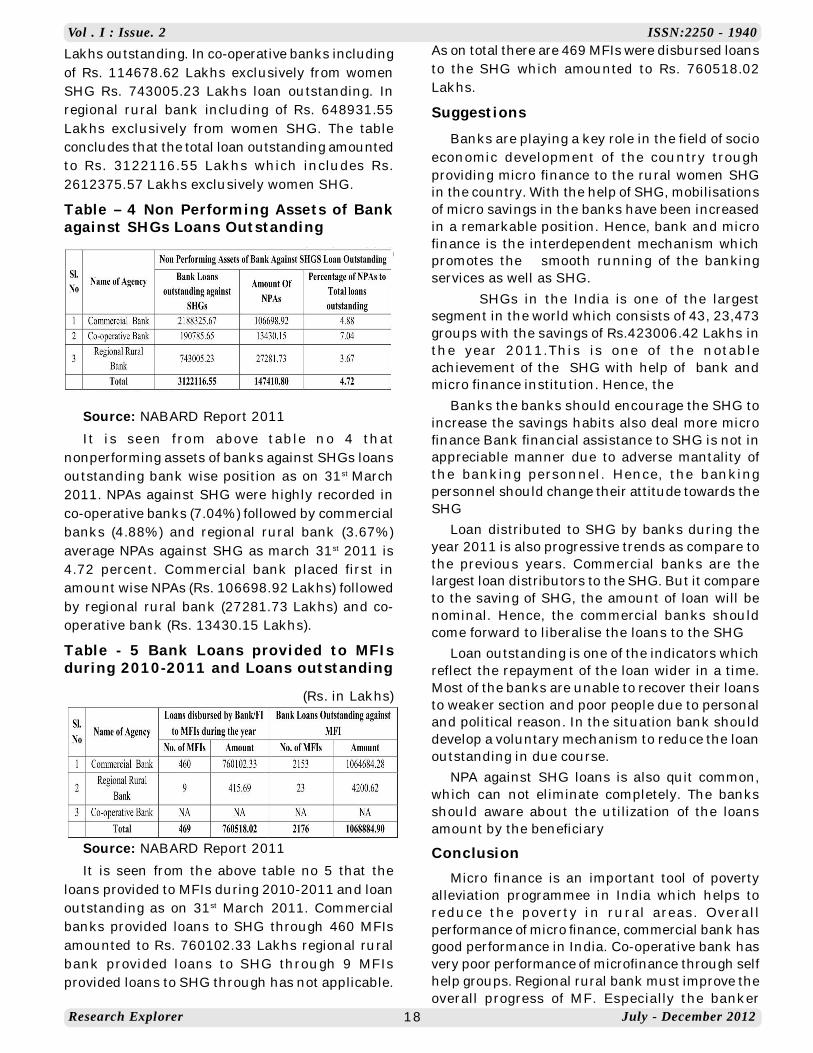
Table 3 reveals that the bank loans outstandingagainst SHGs wish position as on 31st March 2011.Rs. 2188325.67 Lakhs loan outstanding incommercial banks including of Rs. 1848765.4Lakhs exclusively from women SHG Rs. 190785.65
Research Explorer July - December 2012
Vol . I : Issue. 2 ISSN:2250 - 1940
18
Lakhs outstanding. In co-operative banks includingof Rs. 114678.62 Lakhs exclusively from womenSHG Rs. 743005.23 Lakhs loan outstanding. Inregional rural bank including of Rs. 648931.55Lakhs exclusively from women SHG. The tableconcludes that the total loan outstanding amountedto Rs. 3122116.55 Lakhs which includes Rs.2612375.57 Lakhs exclusively women SHG.
Table – 4 Non Performing Assets of Bankagainst SHGs Loans Outstanding
(Rs. in Lakhs)
Source: NABARD Report 2011
It is seen from above table no 4 thatnonperforming assets of banks against SHGs loansoutstanding bank wise position as on 31st March2011. NPAs against SHG were highly recorded inco-operative banks (7.04%) followed by commercialbanks (4.88%) and regional rural bank (3.67%)average NPAs against SHG as march 31st 2011 is4.72 percent. Commercial bank placed first inamount wise NPAs (Rs. 106698.92 Lakhs) followedby regional rural bank (27281.73 Lakhs) and co-operative bank (Rs. 13430.15 Lakhs).
Table - 5 Bank Loans provided to MFIsduring 2010-2011 and Loans outstanding
(Rs. in Lakhs)
Source: NABARD Report 2011
It is seen from the above table no 5 that theloans provided to MFIs during 2010-2011 and loanoutstanding as on 31st March 2011. Commercialbanks provided loans to SHG through 460 MFIsamounted to Rs. 760102.33 Lakhs regional ruralbank provided loans to SHG through 9 MFIsprovided loans to SHG through has not applicable.
As on total there are 469 MFIs were disbursed loansto the SHG which amounted to Rs. 760518.02Lakhs.
SuggestionsBanks are playing a key role in the field of socio
economic development of the country troughproviding micro finance to the rural women SHGin the country. With the help of SHG, mobilisationsof micro savings in the banks have been increasedin a remarkable position. Hence, bank and microfinance is the interdependent mechanism whichpromotes the smooth running of the bankingservices as well as SHG.
SHGs in the India is one of the largestsegment in the world which consists of 43, 23,473groups with the savings of Rs.423006.42 Lakhs inthe year 2011.This is one of the notableachievement of the SHG with help of bank andmicro finance institution. Hence, the
Banks the banks should encourage the SHG toincrease the savings habits also deal more microfinance Bank financial assistance to SHG is not inappreciable manner due to adverse mantality ofthe banking personnel. Hence, the bankingpersonnel should change their attitude towards theSHG
Loan distributed to SHG by banks during theyear 2011 is also progressive trends as compare tothe previous years. Commercial banks are thelargest loan distributors to the SHG. But it compareto the saving of SHG, the amount of loan will benominal. Hence, the commercial banks shouldcome forward to liberalise the loans to the SHG
Loan outstanding is one of the indicators whichreflect the repayment of the loan wider in a time.Most of the banks are unable to recover their loansto weaker section and poor people due to personaland political reason. In the situation bank shoulddevelop a voluntary mechanism to reduce the loanoutstanding in due course.
NPA against SHG loans is also quit common,which can not eliminate completely. The banksshould aware about the utilization of the loansamount by the beneficiary
ConclusionMicro finance is an important tool of poverty
alleviation programmee in India which helps toreduce the poverty in rural areas. Overallperformance of micro finance, commercial bank hasgood performance in India. Co-operative bank hasvery poor performance of microfinance through selfhelp groups. Regional rural bank must improve theoverall progress of MF. Especially the banker
Research Explorer July - December 2012
Vol . I : Issue. 2 ISSN:2250 - 1940
19
provided credit to MFI has poor performance inIndia. Banks are responsible to actively involvedin the field of Micro finance wide social developmentof the country. Cooperative banks must meet therural people to promote the Micro credit and provideliberal micro finance to needed people and makethem as a self sustainable person in the society.
Reference1. Amutha. J and Ramakrishnan. (2011). Role of
women Self Help Groups in Co-operative BankLinkage-with Reference to NagapattinamDistrict, Tamil Nadu Journal of Co-operation.
2. Aranganathan. T Sundar. K and Satheeskumar. L (2008). Micro Credit and RuralDevelopment, Sabanayagam Publication,Chidambaram.
3. Jamie Morgan and Wendy Olsen. (2011).Aspiration Problems for the Indian rural Poor:Research on SHGs and MF, Institute forDevelopment Policy and Management,University of Manchester, pp 1-22.
4. Kayarkani. (2011). SHG Based Micro financeon Women Development-an Empirical Study,Self Journal of Social Science Volume. 2, No.7.
5. Narayanan. B (2008). Micro credit in India-anOverview, Micro Credit and Rural Development,pp 21-26.
6. Narbada Ghimire. (2011). Micro finance as aPolicy Tool for Women Empowerment, OregonState University, pp 1-33.
7. Neeta Tapan. (2010). Micro Credit Self HelpGroups and Women Empowerment, NewCentury Publication, New Delhi.
8. Paramasivan.C. (2012). Women EmpowermentIssue and Challenges, Regal Publications, NewDelhi.
9. Prasenjit Bujar Baruch. (2009). Self HelpGroups and Asset Creation: A Case Study ofDeharkuchi Gaon Panchayat of Nalbari DistrictAssam, Journal of the Centre for Micro FinanceResearch, Volume. 1, No. 1, pp 183-194.
10. Saravanan. S (2008). Micro Finance and RuralDevelopment in Tamil Nadu, kissan world,Volume.35,No.8, pp 9
11. Sudhansu kumar Das and Sanjay kavi Das.(2011). Micro finance and India’s, RuralEconomy, New Century Publications, NewDelhi.
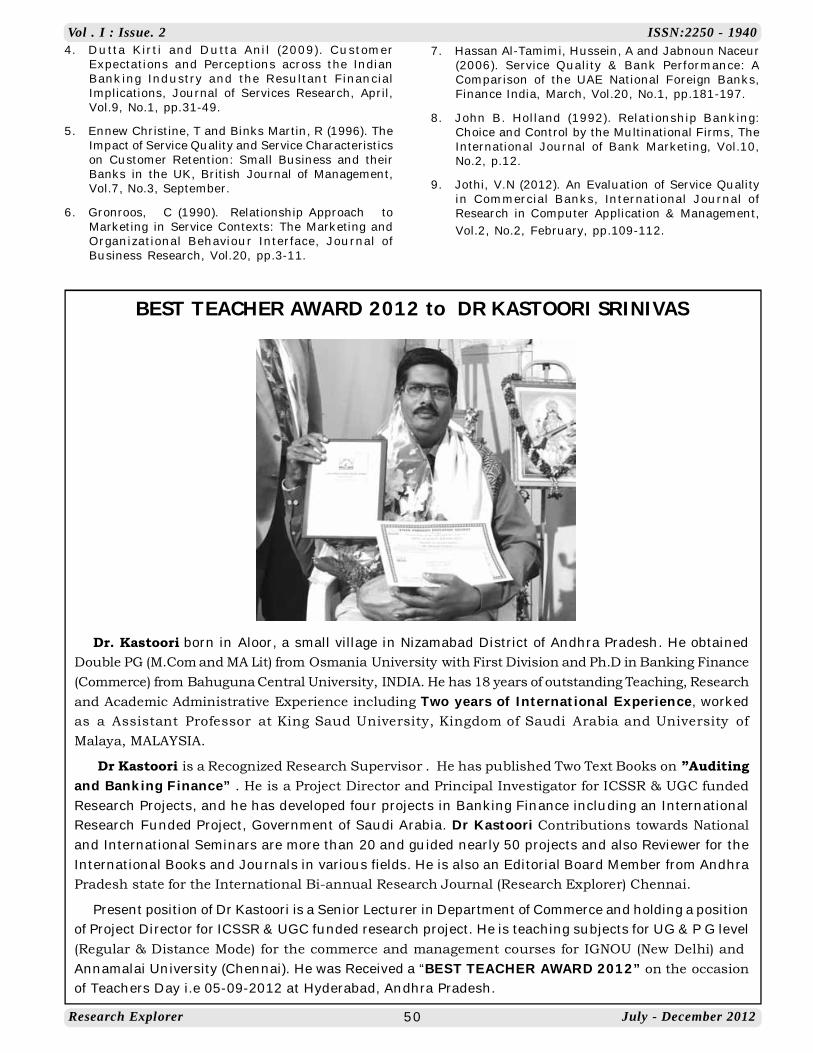
SELP AWARDScientist and academicians with outstanding contribution in their
academic and social service fields are honoured by the trust by confirmingthem awards on the recommendation of the experts. Resume should besubmitted to the president of the trust in the concerned application forms.SELP- Young Social Scientist Award
Academician and researchers in the field of social sciences below theage of 40 are motivated in their field.SELP - Best Faculty Award
To motivate the college teachers belong to the social sciences subjectwith the age of below 35 years are eligible to apply.Ambethkar Social Service Award
Those who are contributing outstanding performance in the field ofupliftment of weaker sections are eligible to apply.
Periyar Social Reformer AwardThose who are contributing outstanding performance in the field of inter
caste marriage, abolition of caste and religions are eligible to apply.
Research Explorer July - December 2012
Vol . I : Issue. 2 ISSN:2250 - 1940
20
INDIAN BANKING INDUSTRY: A FOCUS STUDY ON HOUSING FINANCE Dr. Kastoori Srinivas
Sr. Lecturer & Project DirectorDepartment of Commerce, Vivek Vardhini (AN) College of Arts & Commerce,
Jambagh, Hyderabad- 95.
ABSTRACTShelter is a basic human need. To a modern man no other problem is as intriguing and mind boggling
as the housing problem. The capital cost of a house is very high multitude of the average income of the person.Against the milieu of rapid urbanization and a changing socio-economic scenario, the demand for housing hasgrown explosively. Having identified housing as a priority area in the present five year plan, the NationalHousing Policy has envisaged an investment target of Rs. 2500 billion (App) for this sector. In order to achievethis investment target, the Government needs to make low cost funds easily available and enforce legal andregulatory reforms. The present paper analyzes the extent of role for public sector and private banks relatedto housing finance.
IntroductionThe scale of housing problems in Latin
America is vast, and the dimensions of the problemvaried and broad. Currently most Latin Americaneconomies do not supply fully serviced dwellingsfor all the population. The formal mechanisms ofhousing production and financing do not reach allsegments of the population, while informalmechanisms produce solutions that are eithersubstandard r expensive. Lack of sanitationservices, overcrowding and insufficientenvironmental protection are the most pervasiveproblems, while extended travel time to employmentand urban services centers worsens the problemfor most urban households. Poor housing affectsmostly low-income households in urban areas.Rural housing problems are also serious yet attractless attention.
One set of factors deserves emphasis.Poverty is both cause and effect of poor housingconditions. Lack of effective demand resulting fromthe low income of households is the underlyingcause that prevents the private provision of housesthrough normal channels for most of the populationand presents a challenge for governments
attempting to reduce the scale of national housingproblems through public expenditure. Conversely,improving housing conditions can have a majorinfluence on poverty al leviation throughimprovements in the living standards of low-incomefamilies, and on poverty reduction via increasedemployment opportunities. Furthermore, theproblems of poor housing and poor environmentalconditions are closely interrelated in many cities.
Housing problems are not only complex andsevere, but vary in character from place to place.Interventions in one housing sub market often havespillover effects in others. The physical housing unitsuperstructure is only one dimension of theproblem. Indeed the critical issue of poor housingmay have little to do with the condition of thephysical superstructure. Infrastructure (water,sewerage, electricity, telephones, transport) andaccess to employment are often as or moreimportant problems. Moreover, when it comes toproviding solutions, families and communities havesome capacity to build their own houses, but havedifficulty solving these other non-divisibleproblems.
Research ExplorerISSN : 2250 - 1940
Vol I : Issue. 2July - December 2012
Research Explorer July - December 2012
Vol . I : Issue. 2 ISSN:2250 - 1940
21
Bank activity in the Housing Sector: Low-Income Focus:
Bank experience with housing projectsshows the difficulties of establishing efficient andsustainable mechanisms to reach the poor. Manyattempts have proven unsustainable and otherslacked the capacity to reach the target population.Success often came with a high financial andinstitutional price tag for governments. However,IDB-8 mandates commit the Bank to emphasizelending for poverty alleviation projects, and lendingfor housing can be very effective in solving poverty-related problems of households. Shelter andsanitation services provided by housing projectsrank high in the priorities of households andgovernments. Cautious adaptation of successfulcases will enable the Bank to effectively collaboratewith governments in establishing low-incomehousing support mechanisms that respond tohousehold needs and priorities, and areinstitutionally and financially sustainable.Management of the Bank will ensure that, as partof the process of project identification, the relativemerits of different types of programs will be dulyconsidered. This consideration should include anestimate of how the benefits of different programsmight be distributed over different income groups.
Housing Finance:Housing finance is becoming major issue
and major area of operation for corporate in India.Besides private sector, semi government andnationalized banks are in the race. With variousschemes to suit your requirement and withattractive interest rates, these housing financecompanies are offering most attractive financeoptions for home seekers.
Recently entered ICICI and IDBI bank havechanged total equations in the housing financemarket. With personalized housing finance loansto suit every need are offered by ICICI. IDBI Bankhas first experimented with in-house customers,and now in big leap with other corporate in theleague. It is learnt, that more then 100 croredisbursement by ICICI, has started ball rolling inthe market. With most professional team, theinstitution has achieved and created new horizonin the housing finance market. The retail outlaysof the institutions are giving services, which homeseekers often do not get with traditional housingfinance companies. One has to take countless
leaves to do documentation for housing loans.Interest rates were also made by the institution amajor issue to think before deciding on housingloans.
ICICI Opens New Era in Housing FinanceIt is life time achievement for a person to
purchase a sweet home for him and his family. Theaccommodation in Mumbai is affordable by andlarge with the help of housing finance. One has tokeep in mind so many options available in themarket.
ICICI, a premier financial institution in thecountry is offering best financial product with valueadded services. It is not just finance but it is loveand affection, which is been transacted. Mostpersonalized service at your door step offered bythe ICICI for housing finance seekers. Like a familymember and good friend ICICI fulfills your need tohave your sweet home. When you want someoneto guarantee on your behalf to some financialinstitution, it is quite embarrassing. As if you arebeggar, begging for your own money. ICICI is givingloans only on your credentials. There is no need togive any guarantor to ICICI.
If you are lucky enough and had won a lotteryor your father has given a large sum in his will oryou have got casual income in lumsum and youare in a position to repay entire loan at one go,then you have to pay penalties. But ICICI iswelcoming such steps and imposing no penaltieson prepayment of loans. Most competitive interestrates and services at your door step, so that youdo not bunk office hours, is been offered by ICICI.People working in ICICI are real assets since mostprofessionalism and polite in manner gives ICICItrue sense of belonging in the industry. With hi-tech technology ICICI also offer on-line processingof your loan application.
Commercial banks and housing finance:The commercial banking sector, consisting
mainly of the nationalized banks, makes a smallcontribution to house financing efforts. An overallquantum equivalent to about 0.5 per cent of totalbank credit is earmarked every year for housingfinance for various category for borrowers,excluding housing loans to banks own employees.The major portion is to be provided by way ofsubscriptions to the guaranteed bonds anddebentures of HUDCO and various state housing
Research Explorer July - December 2012
Vol . I : Issue. 2 ISSN:2250 - 1940
22
boards as well as by way of direct finance toindividuals / groups of borrowers belonging toscheduled castes / tribes and economically weakersections of the community. The balance amount isto be provide directly to HDFC. Commercial Bankscould also finance housing cooperative societies,depending upon the feasibility of such housingprojects. In case any housing project requires biginvestment, a consortium may have to be arrangedcomprising commercial banks, HUDCO, LIC,housing boards and other bodies, depending uponthe type of scheme.
The RBI’s Working Group on Housing (1978)in its report on “Finance for Housing Schemes”estimated that the total annual advances of bankingsector averaged at Rs. 75 Crore till 1980 and Rs.100 Crore in 1991. Commercial banks do not lendmoney for more than 10 years for any housingscheme, because long-term housing loans haveproblems like (i) problems of liquidity arising outof the high statutory reserve ratio imposed by theRBI, (ii) lack of technical and financial expertisefor appraising housing finance proposals and (iii)the feeling that housing is basically a speculativeactivity in nature. Another problem for banks isthat of security, against which they have to lendfor housing. Though house property has some bookvalue, it has negligible marketable value and furtherlegal problems make it difficult for banks to realizethe value of security in the event of default.
In view of these risks and peculiar natureof housing finance, the commercial bankscautiously refrained from this field. But, however,of late, there has been a tremendous change in theiroutlook.
Banks now have been directed to treathousing as a priority sector for the purpose oflending. Under the 20-Point Economic Programme,the banks are required to extend direct loans up toRs. 5,000 to scheduled castes and scheduled tribesand other weaker sections of the society. They alsofinance Government agencies for constructinghouses exclusively for the benefit of scheduledcastes / tribes and low income groups where theamount of loan does not exceed Rs. 5,000 per unit.
Bank loans can be availed for : ( i)Construction of houses and hostels for scheduledcastes / tribes. (ii) Houses under the slum clearanceschemes. (iii) Family planning clinics and healthcenters covered under the public health programs.(iv) Housing schemes in urban and semi-urban
areas for low /middle income groups. (v) Education,health, social, cultural and other institutions /centers which are part of housing projects andconsidered essential for the development of marketsor townships. (vi) Shopping centers / marketscatering to the daily needs of residents of housingcolonies.
NHB’s as an apex in housing finance:The National Housing Bank (NHB),
established by an Act of Parliament (1987) as anApex Housing Finance Institution, startedfunctioning from July 9, 1988. NHB is responsible,inter alia, for the development of housing financesystem on sound lines. The Act empowers NHB tomake loans and advances, among others toscheduled commercial banks in respect of theirlending for housing. Accordingly, a refinancescheme has been formulated for scheduledcommercial banks in respect of certain categoriesof housing loans extended by them. The refinancescheme will be effective from January 1, 1989 andspecified housing loans granted by the scheduledcommercial banks as from that date will be eligiblefor being covered under the scheme. Scheduledcommercial banks desirous of availing refinancefacilities from the NHB will have to execute anagreement in the prescribed form and have anappropriate resolution passed by their respectiveBoards of Directors. The agreement will need to bestamped in accordance with the laws in force in aparticular state where the agreement is executed.After execution of the agreement, the bankconcerned will become eligible for refinance facilityfrom NHB in respect of housing loans sanctionedon or after January 1, 1989.
The objective of this refinance scheme is toencourage construction of new houses / flats asalso extension and up gradation (including majorrepairs) of the existing stock by persons belongingto low income category, i.e., the small man first.
Refinance will be provided only in respectof direct lending to individuals / groups ofborrowers (formal or informal, including cooperativesocieties). Housing finance routed through RegionalRural Banks by Sponsor banks will be treated asdirect lending of the latter. Refinance will berestricted to housing loans – (i) up to Rs. 50,000per individual for acquisition or construction of anew housing unit not exceeding 40 sq.mtrs., ofbuilt-up area, and (ii) up to Rs. 30,000.
Research Explorer July - December 2012
Vol . I : Issue. 2 ISSN:2250 - 1940
23
The HFCs are now eligible to basic refinancelimit from NHB up to 5 times their Net Owned Funds(NOF is paid up capital plus reserves). Additionallya separate refinance limit is given to HFCs up toRs. 10 crore of NOF, additional refinance up to 3times the amount of their deposits is allowed. ForHFCs above Rs. 10 crore of NOF, additionalrefinance up to 2 times the amount of deposits isallowed. Special consideration is given by NHB forfinance provided to rural areas by the concernedHFCs. Taking all these factors into account, anoverall ceiling is kept at 15 times the NOF for alltypes of refinance by NHB to HFCs.
The Extent ProblemThe Working Group on Rural Housing for the
Eleventh Five Year Plan (2007- 12), has estimatedthe total housing shortage in rural areas at 47.43million units at the end of 2012. As per Governmentestimates, the total housing shortage in the urbanareas, at the beginning of the 11th Plan period wasaround 24.71 million units and is likely to go up to26.53 million units by 2012. The urban situationis equally appalling with 99 per cent of the housingshortage pertaining to the Economically WeakerSection (EWS) and Low Income Group (LIG)categories. It is also of major concern that 90 percent of the rural housing shortage (approximately,42.69 million units) are in respect of Below thePoverty Line (BPL) categories.
According to a report of ICRA†, housing loans asa percentage of GDP have remained at around 7per cent, significantly lower than the levels achievedin most of the developed countries. It indicates theextent of opportunity for deeper penetration of suchmarket. With improving demographics andeconomies of scale, the mortgage to GDP ratio islikely to increase. The stakeholders, however, needto reckon with problems and impediments in theprocess which may arise from changes in theeconomic cycle, uncertainties surrounding landacquisition policies, changes in the policyframework and systemic risk that could arise outof rapid credit expansion with lax due diligencestandards.
ConclusionHousing shortage has always been a major
problem over the years in our country sinceindependence. Such shortage estimated as excesshouseholds over houses including houselesshouseholds, congestion (number of married couples
requiring separate house), and replacement/ up-gradation of kutcha/ unserviceable kutcha housesand obsolescence/ replacement of old houses, etc.had grown over the decades. Indian public sectorbanks to lead and initiate to improve the housingsituations in india.
References
1. Basu D.N. and Mehta V.K., 1993. HousingFinance System in India, Urban India, XIII (1),January – June; 36 – 50.
11. Narasimham N.V., 2005. The Indian Journal ofCommerce, Vol. 58, NO. 2, PP 71 – 78, April –June, 2005.
12. Vasant Dasai, 2006 – 07. Banks andInstitutional Management in India, HimalayaPublishing House, Hyderabad, Housing Finance(23), PP 372 – 389.
13. Annual Reports, ICFAI Publications in BankingSector, Journals and Other Response Books.
14. Jasmaindeep Kaur Brar and J.S. Paricha, 2005.Article on Housing Loans – A Comparative Studyof Institutions published in the Indian Journalof Commerce, Vol. 58, No. 2, April – June, 2005.
Research Explorer July - December 2012
Vol . I : Issue. 2 ISSN:2250 - 1940
24
E-GOVERNANCE IN INDIA: SOME ISSUESDevendra N. Vyas
Asst. Professor, Department of Commerce,G. S. Science Arts and Commerce College Khamgaon, Dist. Buldhana 444 303 (MS)
ABSTRACTE-Governance means giving the citizens the choice of when & where the access to the government information
and services so that openness, accountability, effectiveness and efficiency may be achieved. E-Governancewould also cater to automated applications for the government sector, which helps in achieving SMARTgovernance which some define as - Simple, Moral, Accountable, Responsive and Transparent Governance. E-governance is not just about government web site and e-mail. In this paper objective, challenges, opportunitiesin terms of different models and issues for successful implementation of e-governance are discussed. Forsuccessful implementation of e-governance Standards, Infrastructure, Legislations, Strategy all needs to be inplace. It requires a Global Vision and local implementation.
Key Words : E-Governance, accountability , back office automation, knit infrastructure
IntroductionE-governance is the application of electronic
means in (1) the interaction between governmentand citizens and (2) in internal governmentoperations to simplify and improve democratic,government and business aspects of Governance.In simpler terms E-Governance means giving thecitizens the choice of when & where the access tothe government information and services so thatopenness, accountability, effectiveness andefficiency may be achieved. There are three aspectsof E-governance:a) IT enabling the government functions something
similar to back office automationb) Web enabling the government functions so that
citizens will have direct access and
c) Improving government process.
Objectives of E-Governance:
The strategic objective of e-governance is tosupport and simplify the process and activities forgovernment and citizens. For a government tooperate effectively government-community-citizensinfrastructure should be in place. A closed knitinfrastructure would yield to fold benefits, whichwould save time and money for all concerned-1) Citizens can enjoy faster, effective and timely
government services. This would also evolve a
culture of self-service wherein citizens can helpthemselves wherever and whenever required.
2) Government can become more integrated intothe community itself. Also government canfocus its resources where they are needed themost.
The specific objectives are:1. To develop the high-level awareness and
commitment that wil l carry forward e-Governance for development.
2. To develop the capacities necessary to addresse-governance strategically.
3. To develop the human and data infrastructurenecessary for e-governance.
4. To implement pilot projects.
Challenges:The fundamental strategic challenge faced by e-
governance is e-readiness. This is a multi foldchallenge posing basic questions such as:
i) Are the Data Systems infrastructure Ready?ii) Is the institutional infrastructure Ready?iii) What about the Legal infrastructure?iv) Can we count on the technological
infrastructure?v) Is the human infrastructure ready?
Research ExplorerISSN : 2250 - 1940
Vol I : Issue. 2July - December 2012
Research Explorer July - December 2012
Vol . I : Issue. 2 ISSN:2250 - 1940
25
vi) Are we equipped with the leadership andstrategic thinking?
Opportunities for e-governance:
There is no dearth of opportunities for e-governance; government may follow some of thepopular models implemented world across, whichis bound to create varied opportunities.
Government-Citizen conjoined model:With the advent of information technology, there
is a probability of adoption of governmentcommunity conjoined model, which will inherit itstraits from the culture of each government andsociety.
Service delivery model:In the service delivery model, citizens will also
participate in decision making processes, replacingthe top-down process that characterizes too manygovernments. The ultimate focus will be on effectiveand efficient delivery of government services.
Gartner’s ModelThis is an innovative model suggest by Gartner
(An E-business Research consulting Firm). As perthis model, the e-governance is a FOUR-phaseactivity.
Phase I: InformationIn the first phase e-governance means being
present on the web, providing the external public(G2C and G2B) with relevant information. Theformat of the first government websites is similarto that of a brochure or leaflet. The value to thepublic is that government information is publiclyaccessible; processes are described and thusbecome more transparent, which improvesdemocracy and service. Internally (G2G) thegovernment can also disseminate information withstatic electronic means, such as the Internet.
Phase II : InteractionIn the second phase the interaction between
government and the public (G2C and G2B) isstimulated with various applications. People canask questions via e-mail, use search engines forinformation and are able to download all sorts offorms and documents. These functionalities savetime. In fact the complete intake of (simple)applications can be done online 24/7. Normally thiswould have only been possible at a counter duringopening hours.
Phase III: TransactionWith phase three the complexity of the
technology is increasing, but customer (G2C andG2B) value will also be higher. Completetransactions can be done without going to an office.Examples of online services are filing income tax,filing property tax, extending/renewal of licenses,visa and passports and online voting. Phase threeis mainly complex because of security andpersonalization issues – e.g., digital (electronic)signatures are necessary to enable legal transfer ofservices.
Phase IV: Transformation The fourth phase is the transformation phase
in which all information systems are integrated andthe public can get G2C and G2B services at one(virtual) counter. One single point of contact for allservices is the ultimate goal.
Issues for E-Governance:The fundamental issues that need to be stressed
to meet good governance goals in India are
Funding:Since there will be more focus on the long term
capitalisation of the investments made in this area,though the e-governance could have very laudableobjectives and ambitious work plans, they have tobe weighed in terms of available resources both inthe plan sector and outside it. Funding is theforemost issue in e-Governance initiatives.
Management of Change:Most often, when the E-governance initiatives
are implemented, it would lead to mandatorychanges which do affect both people and levels ofthe Delivery chain through which services aredelivered. The delivery of Government servicesthrough the electronic media including Internet andother IT based technologies would necessitateprocedural and legal changes in the decision anddelivery making processes.
Privacy: The privacy of the citizen also needs to be
ensured while addressing the issues. Whenever acitizen gets into any transaction with a Governmentagency, he shells out lot of personal information,which can be misused by the private sector. Thus,the citizen should be ensured that the informationflow would pass through reliable channels andseamless network.
Research Explorer July - December 2012
Vol . I : Issue. 2 ISSN:2250 - 1940
26
Authentication:Secured ways of transactions for the Government
services are another issue of concern. The identityof citizens requesting services needs to be verifiedbefore they access or use the services. Here digitalsignature will play an important role in delivery ofsuch services. But the infrastructure needed tosupport them is very expensive and requiresconstant maintenance. Hence a pertinent need stillsurvives, compelling the authorities to ensure theauthenticity in their transactions thereby gainingabsolute trust and confidence of the citizen.
Interoperability: A major design issue for integrated service
delivery sites is, how to capture data in a Web-based form and transfer it to an agency’s systemsfor processing and sharing that information in acommon format. In fact the interoperation of variousstate Governments, the various ministries within astate Government is a critical issue.
Delivery of services:The ability of citizens to access these services is
another major issue. Since the penetration of PCsand Internet is very low in the country, someframework needs to be worked out for delivery ofthe e-Services that would be accessible to thepoorest of the poor. What will be the Government’snetwork to deliver those services? Could we havesomething like a single stop shop of theGovernment?.Standardization:
Defining the standards for the variousGovernment services is another issue that needsto be addressed.
Technology Issues:A number of organizations, both in the Center
and the States functions autonomously in India, itis very likely that they might go in for heterogeneoushardware/software platforms. The major challengewill lie with integration of the data and integrationof subsets of these applications from all these on acommon platform, which is bound to pose aproblem in the near future.
Use of local languages:The access of information must be permitted in
the language most comfortable to the public user,generally the local language. There do already existtechnologies such as GIST and language softwareby which transliteration from English into otherlanguages can be made.
Cyber laws:Cyber laws should be available to the public as
early as possible so that IT system and informationdocuments stored in the system will have the samelegal validity as the documents stored on the paper.
Spreading Awareness:Perhaps the most important aspect of
computerization and spreading awareness of IT isbringing a change in the mindset of the governmentservants who have accustomed to work only in themanual mode. It is necessary to train all employeesin basic IT usage. There should be workshop &seminars at all levels.
ConclusionE-Governance would also cater to automated
applications for the government sector, which helpsin achieving SMART governance which some defineas- Simple, Moral, Accountable, Responsive andTransparent Governance. According to one schoolof thought, e-governance is not just aboutgovernment web site and e-mail. It is not just aboutservice delivery over the Internet. It is not just aboutdigital access to government information orelectronic payments. It will change how citizensrelate to government as much as it changes howcitizens relate to each other. It will bring forth, newconcepts of citizenship, both in terms of needs andresponsibilities.
References:1. Amsden, H.A. (1994). “Why isn’t the Whole World
Experimenting with the East Asian Model to Develop?Review of the East Asian Miracle in World DevelopmentVol. 22, No. 4, pp 627-633.
2. Becker T. (1981) ‘Teledemocracy, Bringing power back tothe people’, The Futurist, December 6-9
3. Bhatnagar Subhash, Schware Robert (2000), ‘Informationand Communication Technology in Development - Casesfrom India’. Sage Publications, New Delhi / Thousand Oaks/ London
4. Blackburn, P. Coombs, R and Green, K(1985) Technology,economic growth and the labour process , Basingstoke :Macmillan
5. David Whitely ,E-Commerce Strategy & Applications, ( TMGH).6. Ramraj Palanisamy, Issues and challenges in governance,
International J of Electronic, Vol 1, no.3/2004.7. Taylor J.A. (1992) Information networking in government’,
International Review of Administrative Sciences, 69: 375-89.
8. Venkataraman N. (1991) ‘ IT-induced businessreconfiguration’, in M.Scott Morton (ed.) The corporationof the 90s. Information technology and organizationaltransformation. Oxford University Press.
9. Ministry of Information Technology, Govt of India, http://egov.mit.gov.in
Research Explorer July - December 2012
Vol . I : Issue. 2 ISSN:2250 - 1940
27
A STUDY ON NON-PERFORMING ASSETS IN PRIMARY CO-OPERATIVEAGRICULTURE AND RURAL DEVELOPMENT BANKS IN CUDDALORE
ABSTRACTAgriculture is the largest sector of economic activity and has a crucial role to play in the country’s economic
development. Agricultural credit in a practical sense is a nucleus of the system of farm operation. Co-operativemovement dawned in India a century ago to eradicate indebtedness and to accelerate agricultural productionin India. However, credit risk is acute in co-operative credit system, predominantly manifested in short-termcredit. However, non-performing assets are growing by both external and internal factors. One of the mainreasons for non-repayment or less repayment of loans was the unwillingness of the borrowers to repay ratherthan their inability to pay and that willful defaults were responsible for the pathetic state of co-operativebanking system. In this context the authors examined the perception of the defaulters towards non-performingassets of the PCARDBs in Cuddalore District.
IntroductionFinance is the lifeblood of all economic activities
and plays a dominant role in the economicdevelopment of a country which is true in India asits major activity is agriculture. Agriculture is thelargest sector of economic activity and has a crucialrole to play in the country’s economic developmentby providing food, raw materials and employmentto a very large population, capital for its owndevelopment, and surpluses for national economicdevelopment. Agriculture is a productive occupationand one of the essentials of agriculture productionis capital. This may be provided by the cultivatorhimself or may borrow it from someone else andrepay it from the output of the field in which hehas invested. According to an old French proverb“credit supports the farmer as the hangman’s ropesupports the hanged.” Thus credit injects life intolifeless agriculture, resulting in enhanced cropproductivity which benefits both the farmers andthe country. Agricultural credit in a practical senseis a nucleus of the system of farm operation. It
provides a flow to the system averting ruin whichwould have occurred due to lack of monetarycapacity of a farmer. In India agricultural credit isa two-fold problem of inadequacy and unsuitabilitythat perennially presented. Co-operative movementdawned in India a century ago to eradicateindebtedness and to accelerate agriculturalproduction in India. However, credit risk is acutein co-operative credit system, predominantlymanifested in short-term credit. Mounting overduescontribute to the accumulation of non-performingassets in the co-operative banks.
Concept of Non-Performing AssetsThe concept of non-performing assets evolved
through the Narasimham Committee Report, 1991,has a critical impact on profit ascertainment ofbanks. Non-performing assets, according to theReserve Bank of India, are those loans advancedby the bank that have not yielded interest for 180days and the amount of principal that needs to berepaid is also defaulted. They are also called asbad debts. Further, if any one of the credit facilities
Research ExplorerISSN : 2250 - 1940
Vol I : Issue. 2July - December 2012
Research Explorer July - December 2012
Vol . I : Issue. 2 ISSN:2250 - 1940
28
enjoyed by a client becomes non-performing asset,all of the other credit facilities enjoyed by the clientalso deemed to have become non-performing assetsand are treated accordingly.
Statement of the ProblemNon-performing assets are the smoking gun
threatening the very stability of Indian banks. Non-performing assets smash a bank’s profitability boththrough a loss of interest income and write-off ofthe principal loan amount itself. Non-performingloans may spill over the banking system andcontract the money stock, which may lead toeconomic contraction. Non-performing assets aregrowing by both external and internal factors.Majority of defaults occurred not because ofinabil ity of the borrowers to repay due tocircumstances beyond their control but due to thelack of will and initiative of the defaulters to repay.One of the main reasons for non-repayment or lessrepayment of loans was the unwillingness of theborrowers to repay rather than their inability topay and that willful defaults were responsible forthe pathetic state of co-operative banking system.
Socio-economic conditions of borrowers beingresponsible for non-payment of debts. The size ofland holdings of the defaulters, amount ofborrowings, educational status, etc. had a directbearing on the repayment of dues. Low repaymentcapacity, cropping intensity, consumptionexpenditure and income from dairy farming, etcsignificantly influenced the repayment performanceof the borrowers. Absence of linking of credit withmarketing led to lesser income, resulting in higherincidence of non-performing assets. Even a properlyselected activity, though economically viable, wouldsuffer from non-availability of adequate and timelyfinance. If adequate finance is not available, theborrowers restrict the scope of operations and underthese circumstances, an account becomes non-performing. In this context the authors examinedthe perception of the defaulters towards non-performing assets of the PCARDBs in CuddaloreDistrict.
Objectives of the StudyThe objectives of the present study are as follows:
1. To assess the perception of the defaulterstowards non-performing assets of the PrimaryCo-operative Agriculture and RuralDevelopment Banks in Cuddalore District.
2. To offer suitable suggestions for effectivemanagement of non-performing assets in the
Primary Co-operative Agriculture and RuralDevelopment Banks in Cuddalore District.
Testing of HypothesisThe study is based on the formulation of the
following null hypotheses. Ho1: There is nosignificant relationship among the acceptance levelof the defaulters belonging to different socio-economic conditions towards influence ofpsychological factors for non-repayment of loan inthe Primary Co-operative Agriculture and RuralDevelopment Banks.
Sampling DesignThe study is confined to all 6 Primary Co-
operative Agriculture and Rural DevelopmentBanks in Cuddalore District. Regarding therespondents, the defaulters in the farm and non-farm loans were considered as total population. Thetotal defaulters of farm and non-farm loans were338 as on 31.03.2010 in all Primary Co-operativeAgriculture and Rural Development Banks inCuddalore District. By adopting census method,all 338 defaulters were taken for this study. Table3.1 shows the defaulters distribution of the presentstudy.
Tools for Data CollectionThe present study is empirical in nature based
on survey method. The first-hand information forthis study was collected from the officials of thePrimary Co-operative Agriculture and RuralDevelopment Banks. The study encompasses bothprimary and secondary data. The primary data werecollected from the defaulters of the farm and non-farm loans from six Primary Co-operativeAgriculture and Rural Development Banks inCuddalore district. A pilot study was conductedduring August 2011, selecting 25 defaulters. In thelight of the experience gained from the pilot study,few changes were incorporated in the revisedschedule. On account of low level of education and
Research Explorer July - December 2012
Vol . I : Issue. 2 ISSN:2250 - 1940
29
poor comprehension of banking operations,schedule method was employed to collect primarydata from the defaulters. The data so collected wereentered into a master table and tabulated to arriveat useful conclusions. For collecting the primarydata relating to policy matters, personal discussionswere held with the Special Officers and officials ofthe PCARDBs. The secondary data were mainlycollected from books, journals and governmentreports. The secondary sources of information alsowere extracted from the records of the Primary Co-operative Agriculture and Rural DevelopmentBanks of Cuddalore district.
Framework of AnalysisIn order to study the perception of the defaulters
towards non-performing assets of the PCARDBs,various statistical analyses such as student t test,analysis of variance, co-efficient of variation,multiple regression analysis, multiple discriminantfunction analysis, discriminant function analysis,and percentage analysis were employed.
Findings
1. There is no significant relationship among theacceptance levels of the respondents belongingto different genders towards influence ofpsychological factors for non-repayment of loanto PCARDBs. However, a significant relationshipis found among the satisfaction level of therespondents belonging to different age groups,educational status, categories, purposes ofborrowing, banks they belong to and types ofdefaults towards influence of psychologicalfactors for non-repayment of loan to PCARDBs.
2. Female respondents, respondents in the agegroup above 50 years, the illiterate respondents,big farmers, respondents who borrowed loanfor farm purpose, borrowers in the PCARDB-Cuddalore, non-willful defaulters have higherlevel of acceptance towards influence ofpsychological factors for non-repayment of loanto PCARDBs.
3. There is a consistency in the acceptance levelamong the male borrowers, among theborrowers in the age group 41-45 years, amongthe borrowers having H.Sc qualification, amongthe medium farmers, among the respondentswho borrowed loan for non-farm purpose,among the borrowers in the PCARDB-Kattumannarkoil and among the will ful
defaulters towards influence of psychologicalfactors for non-repayment of loan to PCARDBs.
4. Out of 338 respondents, 18.93%, 22.48%,25.14%, 18.34% and 15.08% of the respondentsstrongly agree, agree, neither agree nor disagree,disagree and strongly disagree respectivelytowards influence of psychological factors fornon-repayment of loan to PCARDBs. Theaverage acceptance score reveals that therespondents have higher acceptance leveltowards involvement of political elements fornon-repayment of loan (3.28), followed by thediversion of loan for non-productive purposes(3.24. However, with regard to inadequate loandue to lack of security, the respondents havelower acceptance score (2.88).
5. Discriminant function analysis was employedto construct a function with what are all theattitude items which significantly discriminatethe will ful de faulters from non-wil lfuldefaulters. The ‘borrowers need not pay backthe loans’ is the maximum discriminatingvariable between willful defaulters and non-willful defaulters, followed by ‘repayment of loanis secondary’, ‘insufficient income to repay theloan’ in that order. Other variables’ contributionin discriminating between willful defaulters andnon-willful defaulters are less than 8%.
6. Multiple discriminant function analysis is usedto study the attitude of the borrowers ofPCARDBs towards the influence ofpsychological factors on non-repayment basedon their land holdings. The borrowers weredivided into 3 categories based on their landholdings as small, medium and big farmers. Thediscriminant function have predicted 63.90%of the cases correctly in to their respectivegroups, where as considering each category, thefunction has predicted 76.60% of small farmersinto its own group and 49.60% of the mediumfarmers into its own group and 60.70% of bigfarmers into its own group indicating that onthe whole, the classification accuracy of thediscriminant functions is 63.9% for the givenselected variables.
7. Respondents ranging from 33.13 per cent to40.82 per cent suggest that regular monitoring,preventive measures, use of extra-ordinaryrecovery methods and recovery camps will
Research Explorer July - December 2012
Vol . I : Issue. 2 ISSN:2250 - 1940
30
enhance the PCARDBs to reduce their non-performing assets in Cuddalore district. About42.89%, 44.97% and 49.11% of the respondentssuggest that training to the employees forrecovery, education to borrowers on repaymentethics and giving the warning signalsrespectively will reduce the amount of non-performing assets in the PCARDBs. More than52.667% of the respondents state that regularrecovery, establishment of recovery cell, carefulscrutiny and appraisal system and recoveryincentives to the employees of PCARDBs willhelp the PCARDBs to reduce their non-performing assets in Cuddalore district.
Suggestions1. Names of defaulters should be published in the
local news paper and the list of defaulterborrowers under NPA category may also benotified on the notice board of the PCARDBs.The idea is simply to draw attention of thedefaulters to contact the officials of thePCARDBs for the repayment of loan.
2. There is a need for the PCARDBs to streamlinetheir efficiency of recovery and the developmentof compressive procedure. A special cell maybe established in each PCARDB to monitor andtake follow up action for the recovery of non-performing assets. This special cell mustmonitor at least the top 50 non-performingassets accounts directly.
3. Suitable training programs should be organizedfor the employees of the PCARDBs connectedwith recovery and credit aspects. They shouldbe properly trained on effective and scientificappraisal.
4. The PCARDBs should institute a system of earlywarning signals for potentially weak loansaccounts. Some key signals are persistentdefault over-drawl, diversion of funds, loweringof rates, etc. It requires different stages, namelyearly and comprehensive detection of all signalspertaining to the health of the borrowers;thorough analysis of those signals to take a viewin the borrowers business; and fast initiationof action upon warning signals to containdamage.
5. Regular recovery should be organized by thePCARDBs in order to reduce the level of non-performing assets. The provision of SARFAESIAct should be used for seizure of securities.Besides, regular monitoring makes the borrowersnot to divest the funds for purposes other thanthe purpose for which the loan is sanctioned.
6. More careful and responsible scrutiny andappraisal system, which includes timelysanction, realism in fixing repayment scheduleand adequacy of credit with efficient delivery isto be implemented in the PCARDBs.
ConclusionThe co-operative banking sector, with its more
than a century old existence, plays an importantrole in enlarging the reach of institutional creditboth from geographic and socio-economicperspective. They came into existence with theenactment of Co-operative Credit Societies Act,1904. Since their inception, these banks and theiraffiliated agencies have been playing a significantrole in the socio-economic development of thecountry. However, the financial health of most ofthe co-operative banks has been a cause for concernand has so far proved to be a serious handicap inreaching out to the larger population.
References1. Ajjan, N (1994). An Analysis of Performance of Co-operative
Credit Institutions in Tamil Nadu, Indian Journal ofAgricultural Economics, Vo1.XLIX, No.3, July-September,p.511.
2. Baiju, S and Gabriel Simon Thattil (2003). PerformingBanks with Non-performing Assets: An analysis of NPAs,Yojana, Vol.44, March, pp. 5-9.
3. Debabrata Das (2001). A Study on Repayment Behaviourof Sample Borrowers, The Arunachal Pradesh State Co-operative Review, Vol.39, No.2, pp.139-147.
4. Ghosh Debarshi and Ghosh Sukanya (2011). Managementof Non-Performing Assets in Public Sector Banks: Evidencefrom India, International Conference on Management,pp.750-760.
5. Indira Raja Raman, Suman Bhoumik and Namita Bhatia(1999). NPA Variations across Indian Commercial Banks:Some Findings, Economic and Political Weekly, January,pp.14-16.
6. Jayasree, M and Radhika, R (2011). Non-performingAssets: A Study of Scheduled Commercial Banks in India,International Journal of Research in Commerce,Economics & Management, Vol.1, No.1, May, pp.60-63.
8. Majumdar, D.K and Baruah, H.K (1999). RepaymentPerformance of Institutional Finance on Allied AgriculturalActivities: A Case Study, Indian Co-operative Review, July.
9. Rajana Kumar (2005). Agricultural Rural DevelopmentBanks: Some Issues, The Co-operator, Vol.43, No.2, pp.61-65.
10. Ranga Reddy, A (1989). Measures for Reducing Farm Co-operative Overdues: A Study in Guntur District, IndianCo-operative Review, Vol.28, No.1, pp.27-39.
Research Explorer July - December 2012
Vol . I : Issue. 2 ISSN:2250 - 1940
31
THE ROLE OF ENGLISH IN ENHANCING EMPLOYMENT OPPORTUNITIESMs. Anuradha S.
PhD Scholar in EnglishMother Teresa Women’s University, Kodaikanal
ABSTRACTThe paper touches upon the use of English as the binding language across the world in various
areas of functioning. The advent of English as a force in the third world countries is dealt with indetail, including aspects like economic and financial growth of the third world countries. The impactof the rise in educational and awareness levels, combined with the growth in per capita income on theemployability of the citizens of the third world countries is also dwelt upon. Growing desires of thepeople, coupled with a deep-rooted need to have an improved standard of living and how these factorsplay a vital role in employability are also examined. The paper also identifies the various employmentopportunities that have opened up in the third world countries, with the opening up of the economyand the entry of brand names into the economy.
Key words: Economies, Education, Employment Opportunities, Developing/third world countries
IntroductionIn recent times, the world has gradually become
a global village. Accessibility amongst countries hasbecome easier, intercontinental relations haveincreased, and international economies have comeup more rapidly. With this gradual metamorphosisof the world into a global village, one striking aspectcomes out very vividly – the importance of English.It has become the language of commerce, politics,trade, economics and all types of development.Indeed, it can be said that it is the single languagethat has gained in importance as a fallout of theapparent shrinkage in the size of the world.Needless to say, this is due to the fact that onecommon binding factor was required to ensure thatcommunication channels were transparent andunambiguous amongst all the people concerned,and English fitted the bill perfectly.
The reach of English is evident even amongstthe third world countries. Majority of the people inthese countries belong to the lower middle class.This strata of society is gradually growing inawareness and nurturing a desire to raise itsstandard of living. Consequently, the economies ofKorea, India and Africa, to mention a few, have been
growing steadily in the recent past. In addition tohigher levels of awareness, better standards ofeducation have contributed to this development,which has resulted in an increase in the per capitaincome in these countries, as seen in South Korea,where it rose from $350 in 1980 to $2,900 by theend of the 80s.1 While agriculture has remainedthe major source of income in the developingcountries, the increase in the per capita income isevidence of an economy where employmentopportunities are now available in several differentfields, thereby bringing about a gradual decline inthe high levels of unemployment in these countries.This has been the fallout of the growing aspirationsamongst the people for a better lifestyle. No moreis there just one breadwinner in the family; doubleincome families are the norm, with more stressbeing laid on the education of the next generation,leading to better employment. Awareness levels arehigh and people know that education is the onlyway to rise above the lower class or lower middleclass strata of society, thus leading to a brighterfuture. In addition to this, there is awareness thatmore income is required to fulfil the various desiresand needs of the upcoming class; subsequently,there is an increase in the number of people seeking
Research ExplorerISSN : 2250 - 1940
Vol I : Issue. 2July - December 2012
Research Explorer July - December 2012
Vol . I : Issue. 2 ISSN:2250 - 1940
32
employment in the developing countries. Theaspirations and desires of this segment of peopleare not to reach for the skies; they are just to raisetheir present living conditions. And they arecompletely aware that the better employmentopportunities needed for this require bettereducational levels in general and improvedknowledge of English in particular. Employability,as the Chambers’ dictionary defines it, is “thequality in a person that makes him or heremployable or eligible to be hired for a particularjob”. As we are all aware, the employability of aperson improves with better levels of Englishknowledge2, which will be explained subsequently.
One of the varied employment opportunities thatare opening up in the third world countries istourism. In the case of our country, from beingknown as the land of ‘snake charmers andelephants’, India is today recognised as a culturallyrich country with a deep-rooted heritage. Thisrealisation, coupled with the suitable marketing ofour country’s many wonders, has given an impetusto the tourism industry in India. The milling touristshave given rise to employment opportunities in theform of travel agencies and guided tours, whichrequire a decent level of English knowledge to caterto the multitude of international tourists fromvarious countries.
Employment opportunities have also come updue to the increased sale of consumer goods in thedeveloping countries. This has manifested itself asthe fast-expanding ‘mall culture’. Malls catering tothe brand-conscious public have come upeverywhere and are continuing to do so. The openingup of the economy has also led to the influx ofvarious reputed foreign brands striving to establisha foothold in the burgeoning third world markets.In addition to various international brands,international supermarket chains like Walmart arealso making an entry into the developing countries3,competing with the existing chains like Food World,Spencer’s and Big Bazaar, all of which have nowstarted outlets even in smaller cities.
Other consumer goods stores seen making aname for themselves in the developing countriesare Shoppers’ Stop, Crossword and Pantaloons, toname a few.4 These consumer stores havepresented the local populace with tremendousemployment opportunities. There is scope foremployment as salespersons, marketing, desk jobs,liaison, and so forth. However, there is a basic
qualification required amongst those wishing to beemployed in these sectors of the economy – decentlevels of working knowledge of English. Given thenature of the jobs and the profile of the customersthat these outlets cater to, it is imperative that theprospective employees have sound knowledge inthose areas pertaining to their area of work. Thisis required as in the developing countries, most ofthe products in such chains are imported fromvarious parts of the world. Uniformity in packaginglanguage has been established by the exportingcountries by ensuring that the labelling is inEnglish. For better communication between theretailer and customer, suitable levels of English arerequired on the part of the salesperson. In the caseof FMCG items, the sales person needs to be ableto verify various aspects of the products like theexpiry date, constituents of food items and so onin order to cater to the queries from the customers.Thus, the level of English knowledge would need togo beyond mere mechanical understanding andinclude a level of anticipation and comprehension.
Another area where more and more employmentopportunities are opening up today is in callcentres. Today, almost 2,00,000 jobs have beenoutsourced to India through call centres5. Theprimary population working in call centres belongto the lower middle class where the employees arenot very highly qualified or educated and arerequired to work as an economic need in the family.Ironically, despite their social and educationalbackgrounds, these very employees, by virtue oftheir job description, are required to interactprimarily with people residing outside our country,understand their queries and problems and be ableto provide the right solution to them. Thus, thisincludes not just appreciable levels of Englishknowledge but also a decent level of comprehensionof different accents.
The growing employment opportunities havebeen added to with the entry of multi-nationalcorporations in to the third world countries6. TheseMNCs naturally, due to their very characteristic,expect decent levels of English knowledge amongsttheir employees. With the opening up of theeconomy, even government companies like PublicSector Undertakings today have regular dealingswith foreign companies through collaborations,exports, technological consultancy, etc. All of theserequire extensive communication in English toensure the success of the partnerships and
Research Explorer July - December 2012
Vol . I : Issue. 2 ISSN:2250 - 1940
33
profitability of the company. The market has alsotoday changed from being a sellers’ market to abuyers’ market, where the customer is king. Hence,presenting the right image about the company isabsolutely essential when interacting with thevarious foreign partners of the company.
English is equally important in other job profilesin PSUs. These key areas include Public Relations,Purchase, Education and Training, in addition toMarketing. All these aspects of work involveextensive use of English in fairly proficient levels;thus, even PSUs, which normally have a centralmethod of recruitment of officers, test the knowledgelevels of the aspirants in English. In the privatesector also, English language skills are expectedfrom those seeking employment and the same isassessed through the interviews that are conductedamong the candidates.
Keeping the above in mind, it can thus bereiterated that English is an absolute necessity toensure the employability of people today. Betterlanguage skills in English will increase employmentopportunities and provide more avenues, thereby
enhancing the standard of living amongst thepeople.
6 Ahiakpor, James CW. Multinational Corporationsin the Third World: Predators or Allies inEconomic Development? Religion & Liberty. Vol.2, No. 5.
CALL FOR PAPERSWe have the great pleasure to inform you that we are bringing out an Edited Book on
titled “EMERGING TRENDS IN FINANCIAL SYSTEM”. The Book will be published by a Delhibased reputed publisher with ISBN Number. We would like invite you to shareyour ideas, thoughts, and initiatives taken on the above topic. Hence, we are requesting thelearned researchers like you to send research paper(s) on any topic(s) in these areas.
Please intimate this invitation to other colleague’s /staff/ friends and Research Scholarswho have made significant contribution in these areas and notify the same in the academicnotification for wide publicity. We request you to kindly send your article to be included in thisbook. You may send your article to [email protected]
The objective of the book:
prime purpose of this book is to comprehend the recent concepts, practices, theoreticalbackground and results of empirical studies relating in the areas of financial system.
Look forward for your contribution on or before 31st December 2012 .
Editor
Research Explorer July - December 2012
Vol . I : Issue. 2 ISSN:2250 - 1940
34
IMPACT OF AGRO–BASED INDUSTRIES ON RURAL ECONOMY : A CASESTUDY OF SANGLI DISTRICT - MAHARASHTRA
Shri.S.S.ShejalAssistant Professor,
G.A.College of Commerce, Sangli (Maharashtra)
ABSTRACTIndia has the greater potential market for processed food the vis-a-vis states and districts. Sangli district in
Maharashtra state predominantly agricultural district endowed with abundant natural sources. These recoursescan be utilized for agro-based processing. The number of main workers and female work participation haveincreased over a period of time due to increases in processing industries which are absorbed in productionunits like sugar factories, agricultural processing, weaving, cotton mills. The membership, reserve fund andworking capital of production units with employment by size increased during 1980-98. Simultaneously, 1.04percent and 0.83 percent increased a Sangli district NDP and PCI during 2001 to 2010. Hence India in generalvis-à-vis a district.
Key words : Agro-Based Industries, labour intensive, food processing, plant protection
IntroductionThe feature of The development of Agro-Based
Industries in developing countries like India is thatthese Industries Integrate agriculture with industrywhich helps in solving the employment problem,inequalities of income, regional imbalance bylocating Agro-Based Industries in the Rural areas.NCAER [1965] has defined Agro-Based Industriesas those, which use either agriculture raw- materialor make things that farmers need their agricultureneeds. They include not only seeds, fertilizers,implements, plant protection chemicals but alsothe repair and servicing of farm implements.According to FAO these industries provides twothird of employment in developing counties. Theseindustries are labour intensive and save capital. Inour country the share in total production of agro-processing is 50 percent and the value addition is22.86 percent. Currently food production andprocessing account 26 percent of India’s GDP with60 percent of employment. India is largest producerof food and it has the growth potential of processingindustry because of her vast population.Accordingly the government is providing incentivesto encourage value addition and to boost the trade.It bridge gap between rural and urban economiesnearly 70 percent of the total population in India
lives in rural areas, and it has no means tochannelize the saving. The same can use in agro-industries in rural areas.
Opportunities for Food ProcessingFood processing industry helps for economic
growth. India is the largest producer of milk, tea,fruits and vegetables in the world. But it share inthe world Rs.280 bn. Global trade processed foodis less than 1 percent. 40 percent of the fruits andvegetables produce is wasted every year. Only 1.3percent of the fruits and vegetables are processedas against 40 percent in developing countries and70 percent in developed countries. From entireagricultural produce only 1 percent is convertedinto value added product in India.
India’s GNP has grown by 3.5 percent to 5.8percent and PCI by 1.2 to 3.6 percent during 1950-80 to 1990-00. Average Indian spends 52 percentof income on food. Due to increase in PCI he willspend more on processed food. The rapid economicdevelopment through processed industries, thecountry will translate into disposal income. Theincreased income due to increase in disposal incomeagain the Indian’s will spend more on processedfood. Hence food processing sector will increasefrom Rs.70 bn. to 140 bn. by 2010. The food habits
Research ExplorerISSN : 2250 - 1940
Vol I : Issue. 2July - December 2012
Research Explorer July - December 2012
Vol . I : Issue. 2 ISSN:2250 - 1940
35
are moving towards value added. The foodproduction is likely to doubled and there is anopportunity for investment in technology, skill andequipment. Opportunity will also be available toreduce the losses. For sustained production ofprocessing industry, the contract farming takingplace, so that themselves procure the raw-material.Radiation and bio-technology also increased inimproving varieties of fruits and vegetables.Increased urbanization, improved standard of livinghas potentialities in food processing and marketingsectors. Big global food giants yet to reach scale ofeconomy. The food and Agricultural IntegratedAction (1997) prepared by Mc.Kinsey has estimatedthat, changing consumer preference, the annualconsumption of value added foods would grow toRs.225000 crores by 2007 which is larger thanmanufacturing sector. Overall value of the Indianfood industry has increased from Rs.3.09 trillionin 2000-01 to Rs.3.99 trillion in 2009-10.
The Ministry of Food Processing estimated thesize of food processing industry at Rs.3350 bn.(US$70), including Rs.990 bn. (US$ 22 bn.) of valueadded products. Further it is estimated to grow at9-12 percent on the basis of an estimated GDPgrowth rate of 6-8 percent during 10th plan period.Value addition of food products is expected toincrease from current 8 percent to 35 percent by2025. Fruits and vegetables currently 2 percent to10 percent by 2010 and 25 percent by 2025. Atpresent industry employs 1.6 mn. Workers directly.The number of people employed by the industry isprojected to grow to 37 mn. direct and indirect jobworker by 2025. The export likely to increase byRs.146 bn for 2002-03 as against 136 bn. in 2001-02. The marine export contribution will be 40percent. These will be tax holiday for new processingunits in fruits and vegetables along with otherbenefits. India being largest producer of milk in theworld estimated production of 91 mn. tones in theyear 2002-03. Milk and Milk products accounts for17 percent of India’s total expenditure on foodproducts like cheese, butter, ghee, dairy whitenerand ice-creams. The total size of the Indian SnackFood market is estimated over 4 lakh tones andRs.100 bn. in value terms and it has grown by 10percent during 2005-06.
Agro-Based Industries in Sangli District:Sangli district in Maharshtra state has grater
potentiality for processing industry. It is endowedwith abundant resources and wealth of traditional
skills for production of a large varieties ofagricultural crops. Total population of the districtis 2582 (000) as against 96752 (000) inMaharashtra state. At present there are 2190production units including, sugar industries 17,cotton textile 21. The district occupies a per-eminent position in respect of food and commercialcrops. Along with resource based agro-industries,Sangli district has got vast scope for thedevelopment of subsidiary industries related toagricultural such as daring, livestock, meat andpoultry industries. Agro-based industries aresolution to the unemployment, regionalbackwardness, congestion and pollution, slum,housing in cities. Migration from rural to urbanwill be reduced and thereby pressure of populationin urban area.
Main workers and Female workParticipation Rate :
Number of workers and work participation ratehas increased over a period of time. They wereabsorbed in agricultural and non-agriculturalactivities. Processing industries also helped toabsorb the population.
Table No. 1 Shows that the ACGR of Number ofmain workers and female workers participation ratehas increased by 1.54 Percent and 3.45 percentduring 1991 to 2010. The work participation rateof person and female has increased from 31.09 to37.91 percent and 10.72 to 24.75 percent duringthe same period.
Number of Production Units RepairingServices and Daily Workers:-
Production units repairing services whichconsists of various types of agro-based industrieshave increased over a period of time. Productionunit have increase from 2978 to 19210 during2001-10. 68 percent were situated in rural areasand remaining 32 percent in urban areas with totalworkers of 165950. 95 percent were in privatesector. Average per unit of worker were 2. Nearly45 percent workers were employed wages.
Research Explorer July - December 2012
Vol . I : Issue. 2 ISSN:2250 - 1940
36
Table No.2. shows daily workers employed indifferent units. Daily workers employed in rural andurban area per unit has declined from 8.14 percentto 2.14 percent and 13.96 to 9.54 percent becauseof growth of production units and social servicesunits from 11.26 percent to 8.72 percent in ruralarea and 10.63 percent to 7.71 percent in urbanarea during 2001 to 2010. Which helped toincreases district net domestic product and percapita income. Because of growth of the varioussectors NDP has increased from Rs. 240075 Lakhto Rs. 362552 Lakh registering ACGR of 1.04percent and PCI has growth from Rs. 1038 to Rs.14476 registering ACGR of 0.83 percent during2004-05 to 2009-10.
Sector-wise Percentage Share in TotalDistrict:-
The percentage share of district income [NDDP]to state income at constant prices was increasedfrom 2.35 percent to 2.56 percent Sangli Districtcontribution was much higher compared to otherdistricts. Districts sector wise share in the totalincome was as follows.
Table No.4 shows the sector-wise percentage inthe district income sector-wise share of income was
more or less constant. The share of primary andsecondary sector has slightly increased from 32.71percent to 37.80 percent and 18.47 percent to 19.52percent whereas tertiary sector has marginallydeclined from 45.82 percent to 42.67 percent during2004-05 to 2009-10. The share of tertiary sectorwas higher because of expansion of primary andsecondary sector.
ConclusionAgro-based industries in developing country like
India is that these industry internet agriculture withindustry which helps to solve the unemployment,inequalities of income regional imbalance locatingagro based industries in rural this is industriesprovide two- third of employment in developingcountries theses industries are labour intensive andsave capital, India has the largest potential ofprocessing industry because of her vast population,India PCI has increased from 1.2 to 3.6 presentduring 1950-80 to 1900-00 the increased PCI willincrease the purchasing power which will bepotential market for processed food in export,processed food in less than 1.30 present of fruitsand vegetables are processed as against 40 percentin developing countries and 70 percent in developedcountries Mc.Kinsey has estimated that value addedfood would grow to Rs 225000 corers by 2007 theminster of food processing estimated the size ofprocessing industry at Rs 3150 bn. The export islikely to increases by 146 bn. For 2006-07. Indiansnack food has grown by 10 percent during 2005-2010.
Reference:-
1. Economic Survey of 2010-2011.
2. Socia-economic Survey of Sangli District 2001and 2010.
UNITY IN DIVERSITY IS THE HALLMARK OF INDIAN NATION HOODArvind.M.Managuli
Associate Professor, Department of HistoryC.M.Managuli Arts College, Sindgi-586128, Dist : Bijapur (Karnataka)
ABSTRACTIndia is the cradle of the human race, the birth place of human speech, the mother of history. The
grandmother of legends and the great grandmother of traditions our most valuable and most instructive materialsin the history of man are treasured up in India only. This kaleidoscopic view of India portrayed by mark Twain.India is a vast country with an area of 3,287,263 sq km. and a population of over one billion often described asa Sub-continent.
Key Words: human race , topography, diversities, civilization,
IntroductionThe people of this vast sub-continent are
as diverse as its topography. It has many diversitiesdiverse terrain, weather, races, languages, religions,customs, art, dress, food habits etc. “It is a museumof diversities” All most all world religions Hinduism,Jainism, Buddhism, Christianity, Islam, Judaism,Zoroastrian are found in India, Several differentlanguages are spoken among them only 22languages are constitutionally approved. Each parteach region has a distinctive flavor of its own. Notonly does the north differs from south and the eastfrom west but so do regions adjacent to one another.Punjab and Sindh are each distinctive entities,Maharastra differs from neighbor Karnataka, Keralafrom Tamilnadu, Bengal from Orissa. In the past ithas received adapted and digested elements of manydifferent cultures Indo-Aryan, Mesopotamian,Iranian, Greek, Roman, Scythian, Turkish, Persian,Arab etc. From Kashmir to Capecomorin, we seedifferent customs, traditions, food habits etc. Thequestion is now out of all these diversities peoplehow do they co exist and interact?
This gifted land attracted many foreigners andtempted many conquerors Alexander, MahamudGhazani, Gori, Khilji, Tagalaq, Timurlang, Babarseveral others to conquer and plunder the wealthof this nation. Trading companies of Portuguese,Dutch, French and English who come to Indiaexclusively for trade found the situation to establish
political authority, resulting in considerablepopulation of mixed Indo-European blood, derivedfrom the union of Portuguese, Dutch, FrenchBritish and other Europeans.
In spite of the all diversities mentioned abovethere is a deep underlying fundamental unity inIndia from Himalayas to Cape Comorin. The conceptof unity in India has persisted from the ages in thecourse of its entire history, overcoming all mannersof Political and external charges. It is India thathas given the ideal of tolerance and religionsconcord to humanity. It has a long past historywith unique civilization in the world. Arnold JosephToynbee the world famous historian identified 23civilizations out of the twenty three 18 civilizationsare dead and buried, India is one among thesurviving civilizations. The Indus civilizationdiscovered at mohenjodaro, Harappa and otherparts of western India depicts us earliest picture ofIndia’s past with an high standard of urban basedculture.
During the vedic period though there werediametrically opposed sects even those who denygod find a place in it. Religious freedom is one ofthe cardinal principles and religion was practicedin most democratic form. The vedic Rishi declared“Ekam Sat Viprah Bahudha Vadanti” Truth is onethe wise call it variously. This vedic ideal has beenaffirmed in the sutras and the smritis andrepeatedly re-started in the Gita and other popular
Research ExplorerISSN : 2250 - 1940
Vol I : Issue. 2July - December 2012
Research Explorer July - December 2012
Vol . I : Issue. 2 ISSN:2250 - 1940
38
treatises. In whatever way people approach me, Ireceive them in the self same manner” There isnothing besides me all are threaded in me as pearlson a string” says Sri Krishna in Gita. This attitudedid not remain confined to books it was noblypracticed and intensely believed in.
For Mahatma Gandhi religion was not a matterof orthodoxy it was a matter of faith. All religionsfor him were equally worthy of man’s respect, hisinterfaith prayer meetings were symbolic of hisspiritual position. He placed morality higher thaneverything else in life and insisted that truth shouldfrom every individual section whether political oreconomic, nation he said can hardly survive withoutcharacter. So in this gifted land religion brings unityand tolerance among all sections of the society, Soit has first generation of Christians, Jews who hadbeen persecuted in every other place on the globefound a safe and secure place in India not onlythat the prince of Cochin allowed them to build asynagogue close to the temple of royal family. Thefollowers of Zoroaster who fled from their motherland were welcomed in India, All these communitieswere warmly received and they still form an integralpart of India nation. Muslims once they settleddown after conquering, they were influenced by theIndian culture and tradition of accord and amity.
The Sufis of Islam have been influenced by vedanticthought. There is considerable population of mixedIndo European blood.
ConclusionThe concept of harmony and unity in India has
persisted from the ages as Jawaharlal Nehru Says.“That unity was not conceived as somethingimposed from outside, standardization of externalsor even of beliefs. It was something deeper andwithin its fold Tolerance is India’s innate spirit andit is her contribution to the common weal ofmankind”. Hence India is a museum of manydiversities but unity among all these diversities isits fundamental strength.
References
1) India A splendor in cultural Diversity - Sir,Paulias Matane. M.L. Ahuja.
2) Indian Nationalism a History – Jim masselos.
3) Humanism – English monthly InternationalJournal.
4) India – History, Religion, Vision, andContribution to the World
Vol-I - Alexander. P.Varghese.
Special issueon
CONTEMPORARY ISSUES IN MARKETING
SELP Journal of social science invites articles from acadamicians, researchscholars and students in the field of social science for special issue onCONTEMPORARY ISSUES IN MARKETING for puplication in December2012.
2 Contributors may follow the guidelines in selp journal of social scienceand submit a soft copy to sjss.selp@ yahoo in. on or before 30.10.2012.
2 Rs 750/- per article will be charged as publication fee in the form of DD infavour of SOCIAL EMPOWERMENT OF LOCAL PEOPLE TRUST, payable atTiruchi. (or) publication amount may be paid directly in the A/C. No.156305000371, RTGS / N EFT / I FSC Code- IC IC0001563, I CICI Bank,K .K .N aga r, T ir uchira ppal l i - 620 021.
Managing Editor
Research Explorer July - December 2012
Vol . I : Issue. 2 ISSN:2250 - 1940
39
MEASURING THE EFFECTIVENESS OF TOURISM SERVICE QUALITY INTIRUCHIRAPPALLI DISTRICT
Dr. P.A.Akbar BatchaAssociate Professor of Commerce, M.S.S. Wakf Board College, Madurai
D.S.A.Mehaboob,Assistant Professor of Commerce, Jamal Mohamed College, Tiruchirappalli
ABSTRACT Tourism is recognized as a major global service industry governed by the laws of supply and demand. It
has advanced as a concomitant to general development. It touches not only the economic fabrics of the societybut also has deep-rooted effects on social norms and moral values. The tourism industry holds tremendouspotential for nation’s economy. It provides thrust to other industries, create millions of new jobs and generateenough wealth to help economic development of the nation. That is why it has been included that amongst thecore sectors of the nation economy.
Key words: place , product , physical evidence , people , process , price , promotion
IntroductionTourism is recognized as a major global service
industry governed by the laws of supply anddemand. It has advanced as a concomitant togeneral development. It touches not only theeconomic fabrics of the society but also has deep-rooted effects on social norms and moral values.The ramification of tourism has reached out to manysectors of the economy. The explosion of globaltourism has occurred not only because of itscommercial expediency and economic profit,revolution in transport and communication, butalso due to the transformation of humancommunity into an increasingly leisure-orientedsociety. That is why more and more companiesinvolved themselves in the highly skilled businessof transporting, accommodating and catering fortourists all over the world. Tourism is no longer ajoy ride but a regular and reoriented promisingindustry having a flow of human contacts.
Definition of TourismOver the years the definitions of both tourism
as well as tourist has undergone significant changesin their approach and understanding. It was heldthat the world tourism originated from the Latinworld “Tornos”, which means a tool for describing
a circle or Turner’s wheel. It is from this word theconcept of round or package tour was evolved. Itwas as late as 1643 that this term was first used inthe sense of traveling from place to place. In simpleterms, tourism consists of all those trade terms,which together satisfy the varied needs of thetravelers. The following are some of the definitionsof tourism:
Proposed Conceptualized Research Model There are nine dimensions were framed for
this study. The dimensions are based on the Servicemarketing mix or the 7P’s approach. Those are:i) Place (Destination),
ii) Product(Tangibles),
iii) Physical Evidence(Interior & Exteriors),
iv) People (Staff),
v) Process (Protection / Safety),
vi) Price (Value for Money),
vii) Promotion (Information & Communication),
viii) Destination Satisfaction and
ix) Intention to Return.
Here Demographic variable, Place, Product,People, Process, Price, Promotion, Destination
Research ExplorerISSN : 2250 - 1940
Vol I : Issue. 2July - December 2012
Research Explorer July - December 2012
Vol . I : Issue. 2 ISSN:2250 - 1940
40
Satisfaction are independent variable and Intentionto return is the dependent variable.
Objectives of the Study
1. To analysis the macro-economic indicators ofthe Tourism in India, with special Referenceto Service quality.
2. To find out the service quality and itsdimensions of Tiruchirappall i tourism,Tamilnadu.
3. To upgrade the standard, quality andeffectiveness of tourism marketing to reach thegoal increased tourist arrival and receipts.
MethodologyThe primary data has been collected with help
of questionnaire from sample respondents amongtourists. The researcher conducted three categoriesof sample survey covering 200 tourists, includes100 tamilnadu tourists, 50 domestic tourists, 50foreign tourists in various cultural & heritagedestination of Tiruchirappalli district. Thesecondary data has been collected from journals,magazines, books, various libraries, reports andstatistical records. The collected data have beenclassified, tabulated, and analyzed systematicallyand inferences are drawn from it. The simplestatistical and mathematical tools like percentage,chi-square test were used for this analysis.
Statement of the Problem This study recognizes the importance of
service quality and the need of insightful researchcovering the area.
Tourism incorporate many of the features of theinformation or the society like as globalization,mobility and information richness.
Tourism has economically significant impact onlocal as well as global market.
It has a great social contribution by way ofbringing together people who belong to differentcultural, social economic background.
It contributes to the foreign exchange earnings.
Not only an assessment of the service quality inTiruchirappalli district but also an analysis of theways and means of promoting the service qualityof tourism industry.
Researcher would like to be innovative andproductive.
Description of the Study AreaTiruchirappalli Municipality was constituted
on 08.07.1866. The Municipality was upgraded asCity Municipal Corporation with effect from01.06.1994 by adding the adjacent Municipalities,Town Panchayats and Village Panchayats. Placesto visit in Tiruchirappalli District.
Mukkombu
Srirangam Temple
Thiruvanai koil
Vayalur Murugan Temple
Kulumandi Amman Temple,Puthur-Sholanganallur
Samayapuram Mariamman Temple
Vekkaliamman Temple, Woriyur
Rock Fort and Uchipillaiyar Temple
Kallanai
MEASURING SERVICE QUALITY INTOURISM IN TIRUCHIRAPPALLI DISTRICTON THE BASIS OF MARKETING MIX
Chi – Square AnalysisDegree of freedom in this case = (r-1) (c-1) = (4-
1) ((3-1) = 6 ,Chi – Square Value (Calculated Value)=25.26876 ,Table value = 12.592
As the calculated value of x2 at 5% level that is25.26876 is greater than the table value x2 that is12.592. Hence the hypothesis is rejected. It can beinferred that there is significant relationshipbetween place and their satisfaction of the tourist.
Research Explorer July - December 2012
Vol . I : Issue. 2 ISSN:2250 - 1940
41
Chi – Square AnalysisDegree of freedom (r-1) (c-1) = (4-1) ((3-1) = 6 ,
Chi – Square Value (Calculated Value) = 9.539085, Table value = 12.592
As the calculated value of x2 at 5% level that is9.53908 is less than the table value x2 that is12.592. Hence the hypothesis is accepted. It canbe inferred that there is no significant relationshipbetween physical evidence and their satisfaction ofthe tourist.
Chi – Square AnalysisDegree of freedom (r-1) (c-1) = (5-1) ((3-1) = 8 ,
Chi – Square Value (Calculated Value) = 7.810552, Table value = 15.507
As the calculated value of x2 at 5% level that is7.810552 is less than the table value x2 that is15.507. Hence the hypothesis is accepted. It canbe inferred that there is no significant relationshipbetween people and their satisfaction of the tourist.
Chi – Square AnalysisDegree of freedom (V) = (r-1) (c-1) = (4-1) ((3-1) =
6 , Chi – Square Value (Calculated Value) =27.87943 , Table value = 12.592
As the calculated value of x2 at 5% level that is27.87943 is greater than the table value x2 that is12.592. Hence the hypothesis is rejected. It can beinferred that there is significant relationshipbetween process and their satisfaction of the tourist
Chi – Square AnalysisDegree of freedom (r-1) (c-1) = (4-1) ((3-1) = 6 ,
Chi – Square Value (Calculated Value) = 10.4178 ,Table value = 12.592
As the calculated value of x2 at 5% level that is10.4178 is less than the table value x2 that is12.592. Hence the hypothesis is accepted. It canbe inferred that there is no significant relationshipbetween price and their satisfaction of the tourist.
Chi – Square AnalysisDegree of freedom (r-1) (c-1) = (4-1) ((3-1) = 6 ,
Chi – Square Value (Calculated Value) = 5.70201,Table value = 12.592
As the calculated value of x2 at 5% level that is5.70201 is less than the table value x2 that is12.592. Hence the hypothesis is accepted. It canbe inferred that there is no significant relationshipbetween product and their satisfaction of thetourist.
Research Explorer July - December 2012
Vol . I : Issue. 2 ISSN:2250 - 1940
42
Chi – Square AnalysisDegree of freedom (r-1) (c-1) = (4-1) ((3-1) = 6 ,
Chi – Square Value (Calculated Value) = 5.140838, Table value = 12.592
As the calculated value of x2 at 5% level that is5.140838 is less than the table value x2 that is12.592. Hence the hypothesis is accepted. It canbe inferred that there is no significant relationshipbetween promotion and their satisfaction of thetourist.
FindingsPlace: The x2 value is greater than the table
value. We reject the hypothesis. There is associationbetween Place (Destination) and satisfaction of thetourist.
Product: The x2 value is less then the table value.We accept the hypothesis. There is no associationbetween Product (Tangible) and satisfaction of thetourist.
Physical Evidence: The x2 value is less thenthe table value. We accept the hypothesis. There isno association between Physical Evidence (Interior& Exteriors, Hygiene, etc.,) and satisfaction of thetourist.
People: The x2 value is less then the table value.We accept the hypothesis. There is no associationbetween People (Staff) and satisfaction of thetourist.
Process: The x2 value is greater then the tablevalue. We reject the hypothesis. There is associationbetween Process (Protection / Safety) andsatisfaction of the tourist.
Price: The x2 value is less then the table value.We accept the hypothesis. There is no associationbetween Price (Value for Money) and satisfaction ofthe tourist.
Promotion: The x2 value is less then the tablevalue. We accept the hypothesis. There is no
association between Promotion (Information &Communication) and satisfaction of the tourist.
SuggestionsTourism industry in India is emerging and it has
immense potential for generating employment andearning huge amount of foreign exchange besidesgiving an impetus to the country’s overall economicand social development. Tourism in India shouldbe developed so as to accommodate and entertainvisitors in a way that is minimally intrusive ordestructive to the environment and sustains andsupports the native culture. Tourism industry ismulti- dimensional and basically a service industry,it would be necessary that all wings of the centraland state governments, private sector and voluntaryorganizations become active partners in theendeavor to attain sustainable growth.
ConclusionThe service provided by the destination then
takes the form of a global experience shaped bymultiple, frequent and varied interactions betweenall the factors of the system. Tourist destinationwill take account of economic development in thesense of social aspects, employment, etc.; theenvironment, culture and the heritage; the tourismmarket, in its universal sense; the professional aswell as local communities concerned. A largenumber of elements have an impact on the tourist’sperception of a destination, on the level of his/hersatisfaction and in consequence on the tourist’swillingness to make a repeat visit and to recommendthe destination of potential visitors.
to recreational customer satisfaction, Satisfaction- only versusgaps scores, Leisure sciences (363-380).
Chadee & Mattsson (1996). An empirical assessment ofcustomer satisfaction in tourism journal (305-320).
Iso-Ahola s. (1982). Towards a social psychology theory oftourism motivation. Annals of tourism research (256-262).
Kozak M (2002) Comparative analysis of tourist motivationsby nationality and destinations Tourism management (221-232)
McGeheee, N.G (1996). The Australian Internationalpleasure travel market, motivations from a genderedperspective. The journal of tourism studies (45-57)
Arulraj. A & Prabaharan. B (2009), A study on mediatingeffects of service quality in Tourism, International conferenceprocedding on marketing paradigms for emerging economics,Allied Publishers, India.
Poon & low (200s5) are travelers satisfied with Malaysianhotel industries, international journal of contemporaryHospitality management.
Tribe & Snaith (1998) Form service quality to HOLSAT,Holiday satisfaction in Varadero, cube, tourism management.
Research Explorer July - December 2012
Vol . I : Issue. 2 ISSN:2250 - 1940
43
SOCIO – ECONOMIC PROFILE OF ELDERLY LIVING IN GOVERNMENT OLDAGE HOMES IN KERALA
Bindhu P SubhashResearch scholar in Social Work , KarpagamUniversity,Coimbatore,TN.
Dr. I Goswami Research Supervisor in Social Work, KarpagamUniversity,Coimbatore,TN.
ABSTRACT The socio- economic status of elderly is a major factor which determines their entry in to the government old
age homes.Materials and Methods: An Exploratory and descriptive study carried out in selected old age homesfrom each district of Kerala State. A total of 176 elderly people were interviewed in the study. The overall socio– economic profile of the respondents, arrived from various socio – economic indicators, shows that majorityof respondents (55percent) belong to lower economic class. Conclusion: Based on the results it may be concludedthat the people living in government old age homes are mostly from the poorer section of the society.
Key words : Socio – economic profile , Government old age homes , Elderly.
Background:The global phenomenon of population ageing
affects India too. As per U.N classification, theIndian society would progress from a ‘ maturesociety’ to an ‘ageing society’. In Kerala, peopleabove 60 years constitute 13 percent of the state’spopulation of 3.34 crore compared to the nationalfigure of 8.2 percent, according to the 2011 census(Radhakrishnan,2011.)As the people grow oldertheir problems increasemanifold(Chandha etal,2004). This demographic transition,accompanied by social and cultural transitions,gives rise to many psycho-social problems of theelderly. The social forces, such as modernizationand urbanization have not only disrupted thetraditional social life of the elderly but also led tothe desertion of the elderly by their childrenmigrating to urban centres or cosmopolitan cities(Cherian , 2003).According to Vermanietal(2001:89), the values of younger generation havebeen changing and consequently moreindividualistic,utilitarian and indifferent attitudestowards elders have become prominent.
The socio – demographic transition givesrise to presenting different types of l ivingarrangement for the elderly. Living arrangement
should be treated as an important component ofthe wellbeing of the elderly ( Bali, 1996).Thecomparatively stable joint family system intraditional Indian society has been a place for theprotection of the aged.A country widesurvey(Arora,1995) reveales that there have beennearly 350 old age homes in India and of whichmany are located in Kerala.Every year adds aboutfive old age homes to the existingstrength(Irudaya,2000). Dave and John (2003), intheir study reported that older persons used todepend on their children for survival which manyultimately turned their life miserable. Peopleexpressing dissatisfaction with their lives were thosewho financially dependent,did not enjoy goodhealth and considered themselves a liability. It isimperative that the economic status will have abearing on the social status of the older persons.The social status inturn, determines the familialinteraction, participation in making importantdecisions and familial relationships.
Research in social epidemiology and medicalsociology has consistently shown that people withlower socio- economic status experience poorerhealth and live shorter lives than those withmoderatelyhigher status ( Bowling , 2004).About
Research ExplorerISSN : 2250 - 1940
Vol I : Issue. 2July - December 2012
Research Explorer July - December 2012
Vol . I : Issue. 2 ISSN:2250 - 1940
44
65 percent of the aged have to depend on othersfor their livelyhood( situation analysis of the elderlyin India 2011) Among the rural elderly persons,almost 50 percent have monthlypercapitaexpendidture level between Rs. 420 – Rs.775 and the similar groups, in urban areas havemonthly percapita expenditure between Rs. 665 –Rs.1500 (situation analysis of the elderly in India2011)
Socio-cultural conditions coupled with age mayexert pressure and give rise to variety of symptoms,increase the cost of medicare and affect theinterpersonal relationship. After all, human beingsdo not live by food alone; they are social beingswho need psychological contentment and emotionalsuccor. Hence, a basic understanding of the socio-economic profile of people living in old age homesseems to be very important prerequisite before weproceed with our research analysis in the domain.
Definition of the terms– Elderly People at the age of 60 and above living in
government old age homes of Kerala.
Socio-economic StatusIt means education, occupation and income of
the respondents covered under the study. This ismeasured by SES scale developed by Dr.Tiwary andKumar(2010). Major profi les include theiraccommodation facilities, material possessions,education , occupation , economic status, and socialprofile.
Objective of the studyTo study the socio – economic status of elderly
living in government old age homes in Kerala.
MethodologyThe study was conducted by adopting an
exploratory and descriptive research design. Onegovernment old age home was selected purposivelyfrom each of the fourteen districts of the Kerala.Based on the principle of simple random samplingtwenty five per cent of the respondents from eachold age homes were selected for the study. The totalsample size for the study was 176. The data wascollected using a well structured interview schedule.Socio-economic status was operationalized ashouse profile, material procession profile,educational profile, occupational profile, economicprofile, processed land/ house cost profile andsocial profile. The scale developed by Tiwari andKumar (2010) was used to measure the socio-
economic status of the individuals. The individualvariables were measured and the consolidated indexwas worked out.
Findings and DiscussionFifty per cent of the respondents in old age
homes belong to the lower class in house profile.This was followed by 29 per cent in lower middleclass, 16 per cent in middle class, 3 per cent inupper middle class and 2 per cent in upper classrespectively. Based on the result it can be assumedthat the majority of the respondents have poorhouse type are also occupy house with less than1000 square feet area.
Ninety three per cent of the respondents belongto the lower class with regard to materialprocession. This was followed by three per cent inlower middle class, two per cent in middle class,and one per cent in upper class respectively. Basedon the result it can be assumed that the people inold age home own very few materials. The total costof house hold gadgets and conveyance vehicleowned by most of the people are below Rs 15000.
The result showed that 80 per cent of therespondents belong to the lower class with respectto the education profile. This was followed by 17per cent in the lower middle class, three per centin the middle class respectively. Based on the resultit can be assumed that the general level of educationof people living in old age home is very poor. Andmajority of the respondents are just literate oreducated up to primary level.
The results showed that 72 per cent of therespondents belong to lower class with regard tooccupational profile. This was followed by 17 percent in lower middle class, five per cent in middleclass, 4 per cent in upper middle class and 2 percent in upper class respectively. Based on the resultit can be concluded that majority of the respondentshave lower occupational profile. And either they maynot have no gainful employment or engage inunskilled employment.
The results showed that majority (85 per cent)of the respondents belong to lower class withrespect to economic profile. This was followed by10 per cent in the lower middle class, two per centin the middle class, two per cent in the upper middleclass and one per cent in the upper classrespectively. Based on the result, it can be assumedthat majority of the respondents belong to the lowerclass with respect to economic profile and their
Research Explorer July - December 2012
Vol . I : Issue. 2 ISSN:2250 - 1940
45
Socio Economic Status No % of totalUpper Class 0 0Upper Middle Class 2 1Middle Class 6 3Lower Middle Class 72 41Lower Class 96 55Total 176 100
ConclusionBased on the result it can be assumed that the
majority of the respondents have poor house typeare also occupy house with less than 1000 squarefeet area. Further, the people in old age home ownvery few materials. Majority of the respondents arejust literate or educated up to primary level. Eitherthey may not have no gainful employment or engagein unskilled employment. The average per capitamonthly income is less than Rs 10000. From theresult it can be assume that most of therespondents own a house and land worth less than1.25 lakh rupees. Majority are poor inunderstanding and participating in social issues.
Based on the result it can be assume that peopleliving in old age homes run by governmentdepartments are mostly from the poor strata of thesociety.
References:
1. Arora,M.,&Chadha,N.K.(1995).Social supportand life satisfaction of InstitutionalisedElderlies.Ind. J. Gerontol, (304); 74 – 82
2. Bali, A.P.(1996). Socio – economic status andits relationship to morbidity among elderly.Indian Journal of Medical Research, 106,349 –360.
3. Bowling, A.(2004).Journal of EpidemologyCommunity Health 2004; 58: 438 – 440 doi:10.1136/jech.2003.017582
4. Chandha,N.K., Bhatia, H., Chao, D., Rohatgi,M.,& Mir, U.A. (2004). “ predictors of the physicalfunctional of the old”. Interim Report Submittedto the Indian Council of Medical Reserch (ICMR),New Delhi.
5. Cherian, J. (2003).Adjustment of elderly inrelation to living arrangements, Gender andFamily life. Indian Journal of Gerontology 2003,Volume 17, Nos. 1 & 2, pp. 99 – 108
7. RajanIrudaya, (2000). “Home away from Home”.A survey of old – age homes and inmates inKerala. CDS WP – 306.
8. PaulDave.,&GinuJohn.(2003).A look in to thelives of older persons. Indian journal ofGerontology. 2003,volume 17,nos 1&2,pp.109-116.
9. Situation analysis of the elderly in India 2011
10. Tiwari and Kumar (2010)S. E. S scale.Veermani,Savitha,et.al.(2001).Ageing andhuman development in EswasModi).RavattPublications Jaipur.
average per capita monthly income is less than Rs10000.
The data shows that 97 per cent of therespondents belong to the lower class with respectto processed land/ house cost profile. This wasfollowed by one per cent each in lower middle class,middle class and upper middle class respectively.Based on the result it can be assumed that most ofthe respondents own a house and land worth lessthan 1.25 lakh rupees.
The result shows that 60 per cent of therespondents belong to lower class with respect tosocial profile. This was followed by 32 per cent inthe lower middle class, four per cent in the middleclass, two per cent in the upper middle class andone per cent in the upper class respectively. Basedon the results it can be assumed that majority arepoor in understanding and participating in socialissues.
The overall socio-economic profile of therespondents arrived from various socio-economicindicators showed that majority of the respondents(55 per cent) living in old age homes fall to the lowerclass with respect to socio-economic status. Thiswas followed by 41 per cent in lower middle class,three per cent in middle class and one per cent inupper class respectively. Based on the result it canbe assume that people living i the society.
Research Explorer July - December 2012
Vol . I : Issue. 2 ISSN:2250 - 1940
46
SERVICE QUALITY OF THE COMMERCIAL BANKS IN THANJAVURDISTRICT: AN EMPIRICAL STUDY
Dr. C. NatarajanAssistant Professor of Commerce,
T.TamilmathiAssistant Professor of Commerce, Directorate of Distance Education,
Annamalai University, Annamalai Nagar - 608 002.
ABSTRACTThe importance of service quality in contributing to the development of banking relationships is well
acknowledged within the relationship banking literature. Excellent customer service can improve the bank’sability to lure affluent prospects, elevate the bank’s profitability, lower bank operation costs, and/or creategreater customer loyalty. In this context, the authors made an attempt to study the perception of the customerstowards service quality of the commercial banks in Thanjavur District. The findings of the study showed thatthere is no significant relationship among the acceptance levels of the respondents belonging to differentgenders, income groups, locations, type of banks and type of accounts towards perceived service quality.
Keywords: Service quality, perceived service quality, banking services, service performance, service gapanalysis.
IntroductionCustomers are the lifeblood of any business
regardless of its nature, type and size. In thechanging global economy, rapid technologicalgrowth has brought general awakening amongcustomers. Their perceptions control marketdynamics. For most organizations understandingcustomers is the key to success while notunderstanding them is a recipe for failure. It is soimportant that the constant drive to satisfycustomers is not only a concern for thoseresponsible for carrying out marketing tasks;satisfying customers is a concern of everyone inthe entire organization. The competitive marketposition and the good reputation of a company canquickly translate into market share and profit, butthat distinction is often earned only through aphilosophical commitment to service backed bydiligent attention to what customers want and need.Owing to change in the economic, business, culturaland political environment, the customers resort tochange in their preferences. Accordingly, the firmshave to make their business plans more
comprehensive and effective. Obviously, thebusiness firms have to use adequate andappropriate tools for the service quality withoutmore interruptions. As customers vary in age,income, educational level, mobility patterns, etc.,it is necessary for the marketers to understand thebehaviour of customer groups and develop productsthat can cater to their needs.
Service Quality in Banking IndustryBanking sector is the backbone of any economy.
Commercial banks play an important role in thedevelopment of economies by mobilization ofresources and their better allocation. This socialtransformation process resulted in unprecedentedexpansion of banking system. A journey fromprivate ownership and control of commercial banksto government ownership and control by way ofnationalization has come in full circle in the wakeof liberalization and introduction of new players inthe shape of private sector banks and foreign banks.Fresh induction of public stake and corporategovernance in government owned banks hasbrought the element of stiff competition in the
Research ExplorerISSN : 2250 - 1940
Vol I : Issue. 2July - December 2012
Research Explorer July - December 2012
Vol . I : Issue. 2 ISSN:2250 - 1940
47
environment with greater adoption of the newtechnologies and ideas, renewed perception ofservice quality along with high degree ofprofessional management in the Indian bankingsystem.
Statement of the ProblemThe financial reform process initiated in 1991
poses a lot of challenges before the Indian bankingsector as never before. With the entry of newgeneration tech-savvy private banks and theexpansion of operations of foreign banks, thebanking sector has become too competitive. The‘one for all’ and ‘all for one’ syndrome is being givena go-by. To deal with the emerging situations,bankers have to shed a lot of old ideas, change inpractices, develop customer loyalty programmes,and adopt a distinct approach to meet thechallenges ahead. Hence, it is desirable for banksto develop a customer-centric approach for futuresurvival and growth. The challenge for banks is tolower costs, increase efficiency, while improving thequality of their service, and increase customersatisfaction.
Moreover, banking has transformed into a‘buyers’ market where customers are given thechoice to select out of a large number of banks andtheir differentiated products and services.Therefore, service quality is the great differentiator;it gets and keeps the customers’ attention. As aresult, today the customers require moreinformation, comprehensive advice, honesty,integrity, consistency, responsiveness, commitmentand value for money. Thus, many banks haveintroduced new customer friendly measures like24-hour banking, 7-day and anywhere banking,internet banking, extended business hours, ATMnetwork and so on.
In today’s competition in Indian bankingindustry, customers have to make a choice amongvarious service providers by making a trade-offbetween relationships and economies, trust andproducts, or service and efficiency. In this context,expectations rise and customers become morecritical of the quality of service. Customers perceiveservices in terms of the quality of the service andhow satisfied they are overall with their experiences.If customers perceive quality as unsatisfactory, theymay be quick to take their businesses elsewhere.Thus, service quality offers a way of achievingsuccess among competing services, particularly in
banks, where establishing service quality may bethe only way of differentiating oneself. Excellentcustomer service can improve the bank’s ability tolure affluent prospects, elevate the bank’sprofitability, lower bank operation costs, and/orcreate greater customer loyalty. In this context, theauthors made an attempt to study the perceptionof the customers towards service quality of thecommercial banks in Thanjavur District.
Objectives of the StudyThe following are the objectives of the present
study:
1. To study the importance of service quality inbanking industry.
2. To analyze the perception of the customerstowards service quality of the select commercialbanks in Thanjavur district.
3. To offer suitable suggestions to improve theservice quality of the select commercial banksbased on the findings of the study.
HypothesesThe study is based on the formulation of the
following null hypotheses.
H01: There is no significant association in thesatisfaction level of the customers belonging todifferent socio-economic profiles towards theservices of the select commercial banks.
H02: There is no significant relationship amongthe acceptance levels of the respondents belongingto different demographic profiles towards theperceived level of service quality in the selectcommercial banks.
Sampling DesignThe present study is empirical in character,
based on survey method. The study is confined onlyto savings bank and current account holders whohave account with select commercial banks inThanjavur District. Moreover, the study is confinedonly to three public sector commercial banksnamely, Indian Overseas Bank, Indian Bank andState Bank of India, and two private sectorcommercial banks namely, City Union Bank andLakshmi Vilas Bank.
Framework of AnalysisThe ultimate object of the study is to analyze
the perception of the customers towards servicequality of the commercial banks in Thanjavur
Research Explorer July - December 2012
Vol . I : Issue. 2 ISSN:2250 - 1940
48
district. The data collected for the purpose of thestudy were quantified, categorized and tabulated.In order to study the perception of the customers,chi-square test, analysis of variance, student t test,paired comparison t-test, analysis of co-efficientof variation, discriminant function analysis,multiple discriminant function analysis, multipleregression analysis and percentage analysis havebeen employed.
Findings
1. Out of 550 respondents, 11.10%, 16.36%, 30%,12.80% and 30.36% of the respondents arehighly satisfied, satisfied, partially satisfied,neither satisfied nor dissatisfied, dissatisfiedand highly dissatisfied respectively towardsservices of the select commercial banks inThanjavur district.
2. A significant association is found among thesatisfaction levels of the respondents belongingto different genders, age groups, educationalqualifications, occupations, income groups,locations, type of accounts, type of banks andthe bank they belong to towards services ofthe select commercial banks in Thanjavurdistrict.
3. There is no significant relationship among theacceptance levels of the respondents belongingto different genders, income groups, locations,type of banks and type of accounts towardsperceived service quality. However, a significantrelationship is found among the acceptancelevel of the respondents belonging to differentage groups, educational qualifications,occupations and the bank they belong totowards perceived service quality.
4. There has been a low correlation between theperceived service quality and the selectedpersonal variables. The R square indicates that0.20 per cent of variation in the perceivedservice quality is explained by all personalvariables taken together. The gender, age,education, monthly income, and type ofaccount of the respondents have no significanteffect on the perceived service quality.
5. A significant difference is found in theacceptance level of the customers betweenexpected and perceived levels towards variousservice quality dimensions such as assurance,empathy, rel iability, responsiveness,
tangibility, competence, communication,understanding of the customers, access,security and complaint handling system.Besides, there exists service performance gapi.e. low level of perceived service quality withrespect to all the dimensions which are studied.
6. Sample customers state that delay in service,reducing rate of re liabil ity, absence ofinnovativeness, lack of understanding thecustomers, lack of staff involvement, absenceof user friendly skills and lack of customercompliant monitoring cell are their problemswith the select commercial banks in Thanjavurdistrict.
Suggestions
1. The needs and expectations of the customerschange from time to time and as suchinnovating of new services and refinement ofexisting services is imperative. Since thecustomers look for banks with convenience,flexibility having innovative ideas, changingtheir offerings according to the needs of thecustomers, the commercial banks must knowand prepare offers according to the changingenvironment. Customers of today have highexpectations and are demanding more fromtheir bankers. In order to maintain the sameleve l of service momentum, the se lectcommercial banks must keep innovating andserve their customers with better qualityservices.
2. The customers state that the select commercialbanks have not been able to provide quickservice. A long delay in making available theservices to the customers may erode thecredibility and goodwill as well as customers’confidence. Therefore, the select banks shouldoffer quick and prompt services to theircustomers.
3. Every one working in the commercial banksmust have a clear goal in mind. The employeesof the commercial banks should never turn theirback on the customers. They should suggestalternative banking services to the customers’benefit. This can be one way of ensuring“customers delight”. Since the service qualityis identified as the most important factor incustomer’s choice, the select commercial banksshould focus on hiring competent and friendly
Research Explorer July - December 2012
Vol . I : Issue. 2 ISSN:2250 - 1940
49
personnel, and train them in order to increasetheir efficiency of completing bankingtransactions and developing interpersonalcommunication skills.
4. The select commercial banks should establisha separate ‘Customer Compliant MonitoringCell’ in each branch. The function of the cellmust be to receive, register and classifycustomers’ complaints and forward them to therespective sections to initiate action, and followup until the compliant is attended to thesatisfaction of the customers concerned.Moreover, regular “customers satisfactionaudit” is to be carried out in each branch ofcommercial banks to find areas of discrepanciesand try to improve the customer’ perceptionlevel.
5. From customers’ perspective, contactprogramme greatly enhances the ability of thebanks to meet expectations by deliveringappropriate, coherent sales and relationshipbuilding messages across all channels. Aneffective customer contact strategy in the bankswill align marketing communications withcustomers and will deliver the right range ofcommunications to the right customers at theright time, and will drive responses through theright response channels. Therefore, the selectcommercial banks shall undertake customercontact programmes in order to understand theexpectations as well the problems of customers.For this purpose, customers meet, specialevents, direct mails, greeting cards, etc. can beused to have a regular contact with thecustomers.
6. Although customers are satisfied with theservice quality provided by their banks, it isnot guaranteed that their customers do notswitch to other banks. Therefore, the selectcommercial banks need to improve therelationship with customers. Every branch ofthe commercial banks shall constitute a“Customer Relationship Committee” consist ofstaff and customers of various segments. Thecustomers can lodge their complaints and offertheir suggestions on various matters pertainingto banking services. These complaints shall bediscussed at the Customer RelationshipCommittee meeting every month. A report ofthe committee is to be prepared and follow up
actions are to be reviewed in the subsequentmeeting.
7. The select commercial banks should continuallyassess and reassess how customers perceivebank services so as to know whether the banksmeets or exceeds or is below the expectationsof their customers. Frequent customer surveys,therefore, throw light on ratification andrefinement, which will go a long way to improveservice quality in banks. Some customersurveys should also be conducted throughexternal agencies so that public reposesconfidence on the results of the surveys.Opinion polls should be carried out from timeto time to understand the perceptions ofcustomers about the bank.
ConclusionThough, most banks in India claim to serve the
best interest of their customers with the increaseduse of information technology and RBI’s guidelinesregarding capital adequacy ratios, provisioningrequirements, risk management, etc., the findingof this study leads us to an adverse conclusion.The study brings to light that there exists asignificant gap between the expectations andperceptions in relation to quality of services offeredby both public and private sector banks in India.The results of the study also makes it clear thatservice quality of private sector banks is better thanthat of public sector banks on all dimensions. Inthe increasing competition in banking industry,banks want to differentiate themselves from thecompetitors and stay ahead in the race. Commercialbanks are facing increased competition on one frontand a decline in the market share on the otherhand. Commercial banks have always been in theforefront of utilizing its recourses effectively.
References1. Akroush Mamoun, N, Khatib Fahed, S (2009). The
Impact of Service Quality Dimensions onPerformance: An Empirical Investigation of Jordan’sCommercial Banks, Journal of Accounting, Business& Management, April, Vol.16, No.1, pp.22-44.
2. Biswa N. Bhattacharya and Ghose, B.K (1989).Marketing of Banking Services in the 90’s: Problemsand Perspectives, Economic and Political Weekly,February, pp.27-32.
3. Choudhury Koushiki (2007). Service QualityDimensionality: A Study of Indian Banking Sector,Journal of Asia-Pacific Business, Vol.8, No.4, pp.21-38.
Research Explorer July - December 2012
Vol . I : Issue. 2 ISSN:2250 - 1940
50
Dr. Kastoori born in Aloor, a small village in Nizamabad District of Andhra Pradesh. He obtainedDouble PG (M.Com and MA Lit) from Osmania University with First Division and Ph.D in Banking Finance(Commerce) from Bahuguna Central University, INDIA. He has 18 years of outstanding Teaching, Researchand Academic Administrative Experience including Two years of International Experience, workedas a Assistant Professor at King Saud University, Kingdom of Saudi Arabia and University ofMalaya, MALAYSIA.
Dr Kastoori is a Recognized Research Supervisor . He has published Two Text Books on ”Auditingand Banking Finance” . He is a Project Director and Principal Investigator for ICSSR & UGC fundedResearch Projects, and he has developed four projects in Banking Finance including an InternationalResearch Funded Project, Government of Saudi Arabia. Dr Kastoori Contributions towards Nationaland International Seminars are more than 20 and guided nearly 50 projects and also Reviewer for theInternational Books and Journals in various fields. He is also an Editorial Board Member from AndhraPradesh state for the International Bi-annual Research Journal (Research Explorer) Chennai.
Present position of Dr Kastoori is a Senior Lecturer in Department of Commerce and holding a positionof Project Director for ICSSR & UGC funded research project. He is teaching subjects for UG & P G level(Regular & Distance Mode) for the commerce and management courses for IGNOU (New Delhi) and Annamalai University (Chennai). He was Received a “BEST TEACHER AWARD 2012” on the occasionof Teachers Day i.e 05-09-2012 at Hyderabad, Andhra Pradesh.
BEST TEACHER AWARD 2012 to DR KASTOORI SRINIVAS
4. Dutta Kirti and Dutta Anil (2009). CustomerExpectations and Perceptions across the IndianBanking Industry and the Resultant FinancialImplications, Journal of Services Research, April,Vol.9, No.1, pp.31-49.
5. Ennew Christine, T and Binks Martin, R (1996). TheImpact of Service Quality and Service Characteristicson Customer Retention: Small Business and theirBanks in the UK, British Journal of Management,Vol.7, No.3, September.
6. Gronroos, C (1990). Relationship Approach toMarketing in Service Contexts: The Marketing andOrganizational Behaviour Interface, Journal ofBusiness Research, Vol.20, pp.3-11.
7. Hassan Al-Tamimi, Hussein, A and Jabnoun Naceur(2006). Service Quality & Bank Performance: AComparison of the UAE National Foreign Banks,Finance India, March, Vol.20, No.1, pp.181-197.
8. John B. Holland (1992). Relationship Banking:Choice and Control by the Multinational Firms, TheInternational Journal of Bank Marketing, Vol.10,No.2, p.12.
9. Jothi, V.N (2012). An Evaluation of Service Qualityin Commercial Banks, International Journal ofResearch in Computer Application & Management,Vol.2, No.2, February, pp.109-112.
Research Explorer July - December 2012
Vol . I : Issue. 2 ISSN:2250 - 1940
51
EFFECTIVENESS OF CONCEPT MAPPING ON ACHIEVEMENT INMATHEMATICS OF SECONDARY SCHOOL STUDENTS
Dr. K. VijayakumariAssociate Professor
Farook Training College , Farook College (P.O) , Calicut
Sreeja.T.PH.S.S .T. Junior (Guest Faculty)
G.G.V.H.S.S.Vengara , Malappuram, Kerala.
ABSTRACTMathematics is a systematized, organized and exact branch of science. For a better mathematical
background, a better understanding of the subject is needed. Applying new and interesting methods andtechniques suitable for the subject can help the teacher to achieve the different objectives or goals. Conceptmapping is such a different technique in the teaching learning process. Concept maps are spatial representationsof concepts and their interrelationships that are intended to represent the knowledge structures that humanbeings store in their mind.
key words : Mathematics , Concept mapping , teaching learning process , curriculum development ,
IntroductionMathematics is a systematized, organized and
exact branch of science. It is the science of logicalreasoning and numerical problems. In the presentage of rate, taxes, insurance, savings, interests etc.,only a person with good mathematical backgroundcan be reasonably sure that he is getting his due.For a better mathematical background, a betterunderstanding of the subject is needed. But it canbe seen that Mathematics is the most fearing anddifficult subject for a large group. This attitudetowards the subject must be changed for makingmathematics education more effective. Teacherscan help to remove this misunderstanding andmake the subject more interesting. Applying newand interesting methods and techniques suitablefor the subject can help the teacher to achieve thedifferent objectives or goals.
Concept mapping is such a different techniquein the teaching learning process. Concept maps arespatial representations; they play an important rolein teaching, learning, curriculum development andgovernance. Novak (1962) suggests Conceptmapping method as a better way to achieve
meaningful learning. Furthermore when studentsconstruct Concept map from verbal material, theycan encode that material in long term memoryvisually as well as verbally (Novak & Gowin, 1984).For the teacher, concept maps can be used todetermine pathways for organizing meanings andfor negotiations, managing with students as wellas to point out student’s misconceptions. For thelearners they help to make evident the key conceptsand propositions to be learned and also suggestlinkages between the new knowledge and what thestudents already know.
Concept Mapping- MeaningConcept mapping is a technique for externalizing
concepts and propositions. A concept is a mentalimage about objects, events or phenomena. Itrepresents a class of stimuli, which have commoncharacteristics. When pupil develops concepts, heor she learns to process information. One way todevelop concepts is to give experiences incategorization. Concept maps constructed bygroups help to develop a conceptual framework,which can guide evaluation or planning. They
Research ExplorerISSN : 2250 - 1940
Vol I : Issue. 2July - December 2012
Research Explorer July - December 2012
Vol . I : Issue. 2 ISSN:2250 - 1940
52
consist of network of concepts, with nodes andlinks. Nodes represent concepts and links representthe relation between concepts. Concepts andsometimes links are labeled. These links need notbe always unidirectional, they can be bi directionalalso.
In 1981, Novak, with the ideas from Ausubel,improved the concept mapping procedure forstudents to organize concepts in a meaningfulstructure. He established concept-mappingtechnique as a meta cognitive learning strategy inwhich special emphasis is given to the influence ofstudent’s prior knowledge and the importance offostering meaningful learning. Concept mapsattempt to render a concrete representation of thestructural knowledge of an individual and the waysin which the concepts are perceived to be connectedto one another and to existing structures.
Functions of Concept MapsConcept maps can be used as means of
representing pattern of relationships in aninstructional display. They are arranged in adiagrammatic text. For the students, the conceptmap represents a way of introducing structure into the process of knowledge acquisition.
According to Novak and Gowin (1984)concept maps produced by students could be usedas good evaluation tools. Analyzing the conceptmap prepared by a student, a teacher can identifythe concepts that are incorrectly included or omittedand valid relationships that are not justified in thelight of current understanding or that are missing.They identified, in many cases, concept maps havegreater sensitivity as measuring devices and in theiropinion concept maps are more valuable than thecommon evaluation devices such as objective testsand essays.
Starr and Krajcik (1990) have suggested thatconcept maps can be used as a means of developingcurriculum plans and sequences, and teacherswould value the structure that the use of theprocedure introduces in to planning of lessonsequences. The structure of hierarchies basedaround the major concepts in a given area andidentification of related, subordinated concepts areinvolved in the process of planning the lesson.
Construction of Concept mapsThere is a systematic procedure for
constructing concept maps. The steps in generalare the following.
1. Position the topic at the head of the map.
2. Arrange the other concepts beneath it on severallevels- more inclusive, general, abstractconcepts at higher level and the more specific,concrete concepts at lower level.
3. Arrange the concepts so that ideas go directlyunder ideas that they are related to.
4. Beneath the last row, examples to the conceptsare given sometimes.
5. Draw lines from upper concepts to lowerconcepts, which they are related to.
6. Do the same for any related concepts that areon the same level.
A sample concept map as given by Novak(1990) is given as figure 1. The methods of solvinga pair of simultaneous linear equations and thepeculiarity of solutions along with examples aredescribed in the concept map. The topic “Pair ofsimultaneous linear equations” is given at the top.At the next level two methods- algebraic solvingmethod and the graphical method are given. Thenthe number of solutions and at last example foreach type is given. These concepts are arranged inthe hierarchical order from top to bottom andprepositions are used to link them. Concepts arelinked with straight lines.
Objectives of the Study
1. To find out whether concept mapping is effectivein increasing achievement in Mathematics ofsecondary school students.
2. To find out whether there is significant genderdifference in achievement in Mathematics in theexperimental group.
Design of the StudyThe present study was conducted by
adopting the Quasi experimental design (Pre testpost-test non equivalent group design). Theexperimental group was taught through Conceptmapping strategy and the control group was taughtthrough the conventional method of teaching.
Sample for the StudyTwo intact classes of ninth standard
students each from two schools of Malappuramdistrict in Kerala were selected and assigned as theexperimental and control groups randomly. Boththe schools follow Kerala state syllabus and are from
Research Explorer July - December 2012
Vol . I : Issue. 2 ISSN:2250 - 1940
53
rural area with same academic status. Both schoolsfollowed Kerala state syllabus. The sample for thestudy thus consists of 100 ninth standard students,50 in the control group and 50 in the experimentalgroup.
Procedure
After seeking permission from the schoolprincipals, a test on pre- requisites for learning theselected topic ‘Circles’ was administered to both theclasses in order to test whether the two groups aresimilar in their previous knowledge. Anachievement test on the selected topic wasadministered as pre- test. Then the two groups weretaught the same topic by the same teacher. Thecontrol group was taught with the conventionalmethod followed in the schools of Kerala where asthe experimental group was taught with the samemethod followed by a short session on preparationof concept map after each lesson. After completingthe unit the same achievement test used as pre-test was administered for both groups.
Statistical Techniques Used
The statistical techniques like test of significanceof means for two independent groups, test ofsignificance of means for two dependent samplesand Cohen’s ‘d’ to know the effect size were used.
Major Findings of the Study
1. When the significance of difference of meanscores in pre-test of experimental and controlgroups were compared, the following resultswere obtained.
i. The experimental and control groups do notdiffer significantly in their mean pre-requisitescores (t=0,pe”0.05).
ii. Difference between the mean pre-test scores ofthe two groups is not significant(t=0.02,pe”0.05).
2. The mean gain scores of experimental andcontrol groups and the mean gain scores of boysand girls in the experimental group werecompared and the results obtained are,
i. The experimental group is significantly higherthan the control group in mean gain scores ofAchievement in Mathematics (t=3.77, p< .01).
ii. The difference between the mean gain scores ofboys and girls in the experimental group is not
significant (t=-1.71, pe” .05).
3. When the extent of effectiveness of conceptmapping over the conventional method wascalculated using Cohen’s ‘d’, it is found thatthe effect of concept mapping on Achievementin Mathematics is moderate (d = 0.87).
ConclusionThe experimental and control groups can
be considered as similar in the previous knowledgerequired for learning the topic and they are ofalmost same achievement level. Thus the twogroups can be taken as equivalent in their entrybehaviour. But the difference of mean gain scoresof the experimental and control groups were foundto be significant at 0.01 level.
The equal entry status of the two groupsensures that the change in the gain scores(difference between post test score and pre-testscore) is purely due to the treatment received bythe groups.
Experimental group is found to have highermean gain scores than the control group and hencethe experimental group has benefited more thanthe control group in learning Mathematics. Thusthe concept mapping has improved the performanceof students in Mathematics.
Boys and girls in experimental group arefound to be not significantly deviating in their meangain scores in Mathematics Achievement, indicatingthat the concept mapping is equally influencingboth boys and girls in their performance inMathematics.
The effect size of concept mapping onAchievement in Mathematics is found to bemoderate. So the concept mapping influencesmoderately the performance in Mathematics ofstandard IX students.
These made the investigator to concludethat concept mapping is an effective tool for theteaching and learning of Mathematics at secondarylevel.
Educational ImplicationsThe present study reveals that the use of
concept mapping as an instructional strategy iseffective for the proper understanding andmeaningful learning of the students. Even thoughthe investigation is carried out on a small sample,the findings throw light on the current educational
Research Explorer July - December 2012
Vol . I : Issue. 2 ISSN:2250 - 1940
54
practice at secondary level, especially in theteaching learning process of Mathematics.
The existing Mathematics curriculum maybe modified to suit concept mapping. Teachers maybe trained to practice this method. For teachersthey help to organize the content as well as to pointout student’s misconceptions, for learners they helpto connect the new knowledge with the existing one.Concept maps can hold a large amount of data andare also useful in curriculum planning andorganization.
References
Ausubel, D. P. (1986). Educational psychology:A cognitive view. New York: Holt, Rinehart andWinston.
Beissner, J., & Yacci, C. (1993). Moving learnerstowards independence: The power of scaffoldedinstruction. The reading Teacher. 44(9), 648-655.
Bris, K. E., & Sarah, D. T. (1991). AComprehensive use of Concept Mapping in design,instruction and assessment. Journal of Educationalresearch. 9(4), 36 40.
Krajcik, J. S., & Starr, R. S. (1990). Scaffoldingtechnology tools to promote teaching and learningin science. Educational Research and Evaluation.11(6), 545 560.
Kishore, L. (2000). Teaching Science throughConcept maps at Upper primary level. UniversityNews Journal of Teacher Education, 37, 60 63.
Novak, J. D., & Gowin, D. B. (1984). Learninghow to learn. New York: Cambridge UniversityPress.
Novak, J. D. (1990). Concept mapping: A usefultool for science education. Journal of Research inScience teaching. 27: 937 949.
Ozdemir, A. S. (2005). Analyzing Concept mapsas an assessment (evaluation) Tool in TeachingMathematics. Journal of Social Sciences. 1(3), 141149.
Willerman, D. A., & Hary, M. U. (1991). Effectsof knowledge map characteristics in informationprocessing. Contemporary Educational Psychology,17:136 155.
Articles are invited from the academician, research scholars and subject expertsfor the next issue of the Selp Journal of Social Science (October –December 2012)which wi ll be published in the month of November 2012.
Selp Journal of Social Science is an official publication of the SELP Trust. It featuresthe original research in all branches of Commerce, Business Management and othercognate branches of sufficient relevance. The manuscripts should be submitted throughmai l to the Managing Editor to [email protected] .
To faci litate an editorial decision on the acceptabi li ty, or otherwise, of theirmanuscript, and to speed-up subsequent publication, authors are strongly advised toconsult the format of papers in a recent issue of Research Explorer.
Review/Strategy/Case study etc should be comprehensive, up-to-date and criticalon a recent topic of importance. The maximum page limit is of 10 double spaced typedpages including tables and figures.
At the bottom of first page, Postal address of the corresponding author and co-author(s), and also Departmental address with designation, Tel. No. Fax No. and E-mailID etc. must be specified.
SELP JOURNAL OF SOCIAL SCIENCE(A Refereed Quartely Journal with ISSN : 0975-9999)
Indexed with RePEc, Thomson Reuters, CSA Data base & Collection, Open J.Gate
Research Explorer July - December 2012
Vol . I : Issue. 2 ISSN:2250 - 1940
55
THE PROBLEM OF PERSONAL INTEGRATION IN THE POETRY OF NISSIMEZEKIEL
M. NatarajanPh.D Research Scholar
Dr. S. SubbiahProfessor and Head, Dept. of English and Foreign Languages,
Alagappa University,Karaikudi-3.
A ‘presiding angel in the poetry circle in Bombay,’Nissim Ezekiel is the most well-known of the Indianpoets in English to-day. Ezekiel is a Bene- IsraelJew. Several years ago, his ancestors left Israel andsettled in India. Bombay is Ezekiel’s chosen home.The Jew in him seems to rebel against his declininghimself an Indian and accepting India as his homeand country. An attempt is made in the paperpresented here to study the problem of personalintegration with reference to Ezekiel’s poetry. Thisurban- based modern Indian writer feels alienatedfrom the cultural milieu. There is a split personalityin Ezekiel. He cannot identify himself with India.To quote Ezekiel:
I am a Hindu and my background makesme a natural outsider; circumstances anddecisions relate me to India…. Not being aHindu I cannot identify myself with India’spast as a comprehensive heritage or rejectit….I can identify myself with modern India.(Qtd. in Parthsarathy 28)
The ‘He’ of his poems represents, in thewords of David Mc Cutchion, ‘a projected self’ withwhich the poet is in dialogue. If so, there is an acuteself-analysis in almost all his poems. Ezekiel seemsto have gone through an identity crisis andstruggled under an oppressive sense of being ‘anexpatriate’ before accepting India as his countryand home. Ezekiel is ambivalent in his attitudetowards India. There is a double impulse operatingin him. One ‘keeps him at a distance’ and another‘reconciles him to his environment.’ As Vedamani
Palraj says, “He is in the Indian scene but not of it;in it, yet out of it.”(25)
Ezekiel’s alienation is aesthetically veryproductive. “The alienation theme is central toEzekiel works and it colors his entire poeticuniverse,” says M. K. Naik with reference to thepoetry of Ezekiel. Ezekiel himself has saidelsewhere: “If you are genuinely alienated… thiscan produce great literature.” As Parthsarathy says,“Ezekiel’s poetry is both the instrument and theoutcome of his attempt as a man to come to termswith himself.”(32)
As stated by M. K. Naik:In an interview given some years ago,
Ezekiel discussed phenomenon of alienationat some length. In answer to the question,“How would you react to the charge thatmost Indian wri ters in English arealienated?” Ezekiel said, “Actually, I wouldlike to see some alienation among Indo-English writers. However undesirable frommoral, social and other points of view, ithas been aesthetically very productiveprovided it is genuine. You can’t pretend,you can’t play the game of alienation. If youare genuinely alienated … and feel you arehostile towards others and they arehostile to you, you hate their guts and theyhate yours; this can produce greatliterature. This genuine alienation is reallyabsent.” Asked to define alienation, Ezekielreplied, “For an Indo- English writer to bealienated, he must have contempt for hisaudience and a similar failure on hispart, a pointle ssness in trying tocommunicate. I know no such Indian writer,
Research ExplorerISSN : 2250 - 1940
Vol I : Issue. 2July - December 2012
Research Explorer July - December 2012
Vol . I : Issue. 2 ISSN:2250 - 1940
56
isolated like a Camus or Dostovskycharacter. What they really mean is thatthese wri ters use an alienlanguage.”(“Nissim Ezekiel and Alienation”94)
In the poem entitled “Island”, Ezekiel says“the island flowers into slums/ and sky scrapers…./ unsuitable for song as well as sense.” But in theconcluding lines of the poem he gives himself, “Icannot leave the island/ I was born here andbelong.” K. R. Srinivasa Iyengar calls it the“testimonial of being a good native.” In “TheEgoist’s Prayer’s Ezekiel, is in the role of an egoistand prays to god to confiscate his passport:
Confiscate my passport, Lord,
I don’t want to go abroad
Let me find my song
where I belong(213).
If there is no desire to go abroad, where is theneed for the confiscation of passport? asksVedamani Palraj. It is very clear that Ezekiel’s is aself torn within itself because of its alienation fromthe traditional, social, religious and cultural moresof the masses.
Ezekiel admits his attitude to India to be ‘critical’and ‘sceptical’: “I am incurably critical andsceptical. That is what I am in relation to Indiaalso.” He keeps himself aloof from everything thatmakes the Indian scene unpleasant and ugly. Hecontradicts his stand when he asserts in“Background, Casually”: “My backward place iswhere I am.”(181). “In the poem “In India”, heexposes the poverty, squalor, heat and ugliness ofan Indian city. To him, India is a land of beggarsand hawkers, pavement sleepers and hutmentdwellers, burnt-out mothers and frightened virgins,wasted children and tortured animals. As BruceKing says, “That ‘squalid, crude city’ is the subjectand context of many poems for over a decade asEzekiel becomes poet of the discontent of Bombay,of the ‘Island’.”(Three Indian Poets 51)
Ezekiel strikes us as a detached observerof the Indian scene. In “Night of the Scorpion”Ezekiel has a dig at the traditional Indian societysteeped in ignorance and superstition. The motheris stung by a scorpion. The peasants sit around onthe floor with the mother in the centre. While themother twists through and through, they try toconsole her with words of philosophy.
In equating the movement of the escapedscorpion and that of the poison in blood stream,the peasants betray their superstition:
With every movement that the scorpionmadehis poison moved in Mothers blood, they
said.(130)The incantatory utterances made by the
peasants’ smack of their blind beliefs:be burned away tonight, they saidMay your suffering decreasethe misfortunes of your next birth, they
said.May the sum of evilbalanced in this unreal worldagainst the sum of goodbecome diminished by your pain(130)
The poet has a dig at the Hindu Law of Karma(Previous birth), the Hindu doctrine of rebirth (nextbirth) and the Hindu conception of the world asone of ‘Maya’ (unreal world) Indeed, as K.R.Srinivasa Iyengar says, “Ezekiel invests the poemwith deep significance by trying to understand theIndian ethos and its view of evil and suffering,though he makes no claim to sharing it.(628)
In “Good-bye party for Miss Pushpa T.S” Ezekielseems to mock at the half-educated Indians whoflaunt their little learning in English unabashedlyand at the tendency inherent in Indian psyche tocommunicate in English, however bad it may be.This poem is in the form of a farewell speech. Ezekielhas a dig at the national trait of calling every one‘Sister’: “Friends,/our dear sister/is departing offoreign/ in two three days”(190). The use of theterm ‘sister’ signifies relationship that is fraternal.But when the speaker says, she is most popularlady/ with men also and ladies also”(190) the linessmack of her flirting with men. She is a flirt whosmiles at all and never says ‘no’ to anyone.
The poet has his laugh at the Indian practiceof using the continuous tense in the place of simplepresent tense: “We are meeting today”, “you areall knowing, “Miss Pushpa is smiling and smiling… because she is feeling, “Miss Pushpa is coming/How a very high family, “I am not remembering…,” “That is sharing /good sprit.” “ I am always/appreciating the good spirit, “Pushpa miss is neversaying no” / whatever I anybody is asking /she isalways saying yes.”(190-91)
The poet parodies the use of superfluouswords , for example, ‘time’ in “that was long time
Research Explorer July - December 2012
Vol . I : Issue. 2 ISSN:2250 - 1940
57
ago” and also in “with men also and ladies also’ Healso makes fun of Indian’s craze for anything foreignand for dignified words like ‘lady’ in preference towomen.
The poet has a dig at the woeful missing oflogical connectives. The digression that follows isutterly unconnected with the central concern of thepoem and is characteristic of the Indian way ofthinking and speaking:
I am not remembering mow which placeSurat? Ah, yesonce only I stayed at suratwith family membersof my uncles very old friend –his wife is cooking nicelythat was long time ago (190)
The poet “reflects not what many Indian thinkbut the way they think”. There is the lack ofsympathy in Ezekiel representation of India. It onlyshows the poets self stand ill adjusted to the countryof its choice.
“Background Casually” is Ezekiel’s study inhis initial alienation and final commitment to India.Ezekie l background which is narrated in“Background Casually” relates, in the first part ofthe poem, how Ezekiel as a boy felt himself alienatedat school and on the playfield because of his Jewishbackground. He never learnt to fly a kite or spin atop. Perhaps, other boys did not accept him. Hewas a Jew. He went to Roman Catholic school buthe was harassed by the Christian boys, because itwas the Jew, his people, who had betrayed Christ.Ironically it was he , a Jew and not a Christianwho won the scripture prize
I went to Roman catholic schoolA mugging Jew among the wolvesThey told me I had killed the ChristThat year I won the scripture prize.(179)
A Jew that he was, Ezekiel found himself inan alien situation. At school he was placed amongthe Christians, the Muslims and the Hindus. TheChristian boys baited him because he was a Jew.A Muslim sportsman boxed his ear. Ezekiel “grewin terror of the strong but undernourished Hindulads. One day during a noisy quarrel, he had touse his knife to defend himself. A lone Jew, Ezekielwas ill-treated by the Christians, the Muslims andthe Hindus. He felt himself “a natural outsider.”
The ironic situation of being placed amongChristians, Muslims and Hindus alienated Ezekielfrom his own minority religious ethos. He confesseshis isolation from his milieu:
At home on Friday nights, the prayerswere said. My morals had declinedI heard of Yoga and of Zen.Could I, perhaps, be rabbi-saint? (179)
Everyone at home wanted him to become a rabbi-saint (a Jewish priest) but he felt he was unworthyof the noble profession. On Friday nights there wereprayers at home. He heard of the preaching’s ofHindu Yogis and Jewish priests but nothing couldmake him nobler. He was lacking in morals andreligious zeal. The boy- poet’s isolation is anoutcome of his inability to discover himself. Hehimself admits: “The more I searched, the less Ifound.” Ezekiel encounters these failures at homeand school. To quote Chetan Karnani: “Ezekiel’spoetry derives all its sustenance from his immediateenvironment though it is written within the broaderframework of the tradition of English poetry” (45).
In the second part of the poem Ezekiel narratesthe circumstances leading to a career of quickchanges and experiments. With the financialassistance by a family friend he went to London atthe age of twenty two. He lived in London for twoyears. A joyless life he led all alone. “Philosophy,Poverty and Poetry” were the three companions whoshared his basement room. Not morally strong, hefell a victim to the seductive charms of a woman.He realized he was a failure and he returned toIndia as a total failure:
The London seasons passed me byI lay in bed two years alone,And then a woman came to tellMy willing years I was the sonOf Man. I knew that I had failed.…………………………………In everything, a bitter thought.(180)
Ezekiel’s self- estrangement stems from his self-awareness that he had failed in everything.
Back in India he was faced with the problemof how to feel at home—how to acclimatize himselfto an environment dominated by the Hindus. Evenhis study of philosophy to resign himself to his hotwas of no use to him. His father’s words “All Hindusare like that” had the effect of making him feelfarther from ‘home’. After his return from London,he committed the folly of getting married. Since then
Research Explorer July - December 2012
Vol . I : Issue. 2 ISSN:2250 - 1940
58
he tried his hands at many — journalism,publishing and advertising, including his work asa factory manager for a short spell, before he settleddown to teaching.
The third part of the poem relates Ezekiel’stotal commitment to India, the country of his choice.Ezekiel did not take to crushing oil seeds as hisancestors’ or to bearing arms as one of hisforefathers but he settled down to writing poetry.To other worldly wise people, he may be a fool tohave taken to poetry and to have missed the worldlyprize but he feels it wise to be true to his chosencalling and his chosen country. He takes a look atthe environment and cultivates “a plainer view.”Ezekiel’s later dreams are all of words. He cashesin and on “the inner and outer storms.” To quotehis own words: “To start with, my own inspirationin and always was my ‘inner life.’ And writing is,for me, a way of coping with tension between myinner life and the outer life.”(Qtd. in. Parthsarathy28)
Ezekie l claims to have made hiscommitment to the country of his adoption and tothe city of Bombay, the home of his choice. Theclimate sears his eyes but he has become part of it.His foreign friends feel surprised to see himmanaging to survive in the heat and squalor ofIndia. He dismisses it as an exaggeration:
The Indian landscape sears my eyesI have become a part of itTo be observed by foreignersTheir letters overstate the case.(181)
Ezekiel is proud of his environment. He has madehis commitment, India is his home and he willcontinue to live in his chosen home:
I have made my commitment nowThis is one: to stay where I amAs others choose to give themselvesIn some remote and backward placeMy backward place is where I am(181)To quote Suresh Chandra Dwivedi:
Bombay is the best place for Ezekiel and it ishere that his temperament as a human being andas a poetic genius can find a rich soil to grow andblossom. Ezekiel’s Bombay is not inferior to Parisor for that matter any place of the world. Histemperament requires somewhere to belong to. Hedoes not want to be considered as a world poet. Hedetests the very idea of it. He is an Indian poet andwould like to be known as an Indian poet (177)
In an interview to John B. Beston, University ofHawai, Nissim Ezekiel affirms his identification withIndia: “I regard myself essentially as an Indian poetwriting in English. I have a strong sense of belongingnot only to India, but to this city. I would neverleave Bombay.”
In the course of a interview given to TheHindu, Ezekiel vouchsafes the commitment he hasmade:
If I hadn’t made myself part of the cultureof the city where I live I think no Indianpoet would’ve come within a hundred yardsof me. I’ve seen this happen to people whoare enormously gifted yet do not become apart of the culture around them. A lot ofpeople I know have ruined their lives bygoing abroad and settling somewhere theyno relation to the culture.(“Literary Review”2)
Works CitedEzekiel, Nissim. Collected Poems. New Delhi:
OUP, 2001.Print.—. “Nissim Ezekiel and Alienation.” Nissim
Ezekiel A Critical Companion. G. S. BalaramaGupta. Ed. New Delhi: Pencraft International, 2010.Print.
—. “Literary Review.” Hindu 13 July 2002:2.Print.
Dwivedi, R. C. “Spring Never Starts Outside:Ezekiel’s Capable Contemporaries.” Perspectives onNissim Ezekiel. Ed Dwivedi. 1st ed. New Delhi: KitabMahal, 1989. Print.
Ezekiel, Nissim. “An Interview with NissimEzekiel”, by john B. Beston . World LiteratureWritten in English. Apr 1977.
Iyengar, K. R. Srinivasa. Indian Writing inEnglish. Sterling Publishers, 2011. Print.
Karnani, Chetan. Nissim Ezekiel. New Delhi:Arnold Heinemann Publishers, 1974. Print.
King, Bruce. Three Indian Poets: Nissin Ezekiel,Dom Moraes and A. K. Ramanujan. NewDelhi: OUP, 2009. Print.
Mc Cutchion, David. Critical Essays on IndianWriting in English. Calcultta: WritersWorshop,1969. Print.
Naik, M. K. History of Indian Writing in English.New Delhi: Sahithya Akademi,1982. Print.
Parthasarathy, R. Ten Twentieth- Century IndianPoets. New Delhi: OUP, 1986. Print.
Research Explorer July - December 2012
Vol . I : Issue. 2 ISSN:2250 - 1940
59
HRD PRACTICES OF PUBLIC SECTOR INDUSTRIES IN CHANGINGBUSINESS ENVIRONMENT
Dr.A.Mahadevan,Professor & Director, Excel Business School
School of Management, Sri Krishna College of Engg.&Tech., Coimbatore, TN
ABSTRACTChange is the essence of life. In the 21st century, an environment has been created that almost compels
Indian Industries to rethink their vision and mission about HRD processes, practices and perspectives. Changesare inevitable everywhere i.e. in our personal life, social life, work life, in nature, in society, in universe etc.We cannot avoid changes, but we can adjust and adapt to such changes for betterment. HRD has to play acrucial role in today’s business scenario. Today’s age is age of globalization, which is characterized byintense competition, technological innovations consumer satisfaction, competitive advantages etc.
IntroductionIn the present scenario, an environment has
been created that almost compels Indian Industriesto rethink their vision and mission about HRDprocesses, practices and perspectives. HRD is theprocess of increasing the capacity of humanresources through development. The HRD practicesthat are utilized for sharpening the capabilities ofthe employees are many. Earlier, the only practicethat was synonymous with HRD was training. Buttoday organisations have realized that there arevarious tools available to them to tap the humanpotential. Various HRD thinkers and professionalshave designed the practices of HRD in differentways.
Concept of HRDHRD is the process of increasing the
capacity of human resources through development.In other words, HRD is a process of adding valueto individuals, team, and organization as humansystem. HRD includes development of people,organization and provides a frame work for selfdevelopment, training programmes and progressionto meet the organization’s future skill requirement,
(TVRao 1999). The most fundamental post of HRDis HRD philosophy. It represents those basic beliefs,ideas, principles and views which are held by themanagement with respect to the development andgrowth of its employees. It plays two importantfunctions i.e. (1) A management style of managerdevelops his practices on the basis of his philosophy(ii) Make organizational goal more explicit.
The Present StudyThe foregoing discussion amply supports
the view that the existence of efficient trained anddeveloped workforce to survival of public sectororganisations. How effectively and efficiently theseorganisations have been performing naturallydepend upon how best the management in theseorganisations have taken care of HRD practices inthe changing business environment.
Statement of the problemThe success of the organization depends
upon the rapport maintained by the supervisorswith subordinates. Happy employees are able tomaximise productivity only when they feel that theworking environment is conducive with smooth
Research ExplorerISSN : 2250 - 1940
Vol I : Issue. 2July - December 2012
Research Explorer July - December 2012
Vol . I : Issue. 2 ISSN:2250 - 1940
60
relationship. But it was observed that the selectindustries’ present HRD environment and humanrelationship are not upto the standards andprescribed HRD. But in practice, Human ResourceDevelopment faces various constraints in theorganisational context. The awareness of HRDpractice among employees is in absence. Theemployees’ satisfaction on HRD practices is differedfrom employee to employee. The employees’expectations also differed from industry to industry.The employees’ development in industrial sector isstill in developing stage. The top management isfollowed traditional methods of management. TheHRD policies are created by the top management.It is implemented by middle and lower levelmanagement and it crosses many hurdles in theimplementation process. It should get employees’co-operation and supports. From many practicalobstacles of HRD practices, this study evaluatesthe effectiveness of HRD practices in public sectorindustries.
The main objectives of this present study
To find out the nature of HRD climate in publicorganisation
To identify the managerial personnel ’sperception towards HRD climate
To determine the significant difference existamong the managers on HRD practices
To find out the relationship of executives andemployees mind set about the HRD climate andpractices
To offer suitable suggestions based on thefinding for improvement of HRD functions inthe public sector organisations.
MethodThis study was carried out by us in a few
public sector organisations located in the region ofTAMILNADU. These organisations areTAMILNADU’S largest manufacturing industries.This present study was under taken in variousmanufacturing and services units of the selectedorganisations. A group of 120 employees belongingto senior, middle and lower levels constitutes thesample of the study, more specifically 40 managersare senior levels, 40 staff and 40 operationalemployees were drawn randomly from variousdepartments of the organisations.
Results and DiscussionSome of the trends observed in the HRD
practices analysis were:-
The overall HRD practices in the public sectororganisation showed to be fine, The managersperceived that the existing HRD practices isfavorable one than the staff and operational levelemployees in the organisation because theoperational employees expects innovative andhighly specialized HRD system. Employees’recognition, rewards, personnel polices (HR policies)and team spirits of the organisation are reasonablemanner. Staff members stand on the neutralposition the existing HRD practices and climate.The top officials of the organisations shouldconcentrate the employees’ development activities.i.e. make sure the employees enjoy their work,believes about HR is important and humanetreatment, development of subordinates, ensure thedevelopment of employees. The top level HR officialsshould give attention to personnel policies,promotion decision, employees feel free discussion,special care to appreciation, superiors orsupervisors help to rectify mistake, feedback onemployees weakness
Some of the items which HRD practicesand climate was perceived unfavourably
Managerial personnel’s belief towardsemployees’ behaviour change and development, freediscussion of problems within the department andorganisation, the top management believes that HRis extremely important and to be treated morehumanely, Job rotation in this organisationfacilitates employee development, Personnel policyand top management willingness to ensure thedevelopment of the employees, Special care toappreciate the employees performance, promotion’sdecision, Senior officers interest to help their juniorto learn higher responsibility, Welfare facilities toemployees, Delegation of authority to encourage thejuniors to develop higher position, Free mindset ofemployees in the organisation, feel free discussionand expression of their feeling and thoughts withtheir superiors.
Few items of HRD practices and climatewere perceived favourably i.e.
Top management perception aboutemployees’ enjoyment in their work, Need basedtraining programme, top management efforts toidentify and utilize the potentialities of the
Research Explorer July - December 2012
Vol . I : Issue. 2 ISSN:2250 - 1940
61
employees. During the informal interviews with themanagers of the public sector organizations, therewas a clearly stated HR policy in the organisationsto promote the development of employees’capabilities.
The result of the‘t’ test indicates that thereis significant differences between the senior levelmanagers response and middle level managersresponse and also middle level managers responsesand junior level managers.
The result of ‘Ø2’ test indicates that there isno relationship between the senior level and middlelevel manager’s perception about present HRDsystem and also there is no relationship betweenthe middle level and senior level manager’sperception about present HRD system.
Hence, in our observation, the senior levelmangers understand with the top management andHRD policies through their experience andmaturity. All these items of HRD might have led toa better outlook in senior managers’ point of view.But in middle level HRD factors are good outlookthen the junior management level because juniormanagers state that average level of satisfactionabout present HRD factors (items).
Thus, on the whole, we find the existenceof reasonable HRD climate in the publicorganisation sectors covered under this study. Ingeneral, the managers showed favourable attitudetowards, HRD policies and practices but the staffand operational employees stand on the neutralposition. They expect more innovative HRDpractices. They will be given complete freedomthrough Human Resource – development policiesformation under the supervisions of the topmanagement based on the competitiveness ofbusiness environment. However, the observationof this study the managers should ensure thedevelopment and utilization of available HumanResources. Especially in staff and operational levelemployees should be motivated to learn and developtheir knowledge and capability by the topmanagement.
The management should make favorablefriendly informal relationship among the superiorand subordinates. It should be geared up trust,loyalty, and team spirit among the employees. Thesystems (HRD) of the organisation should be gearedto design innovative and highly specializedprogrammes as a measure to improve the
employee’s skills and knowledge. Psychologicalclimate in the organisation should be improved andefforts should be initiated to make it conducive tothe development of employees. The managementshould take care of existing HRD mechanisms andexplore the possibilities of introducing new ones.This study was conducted in the region ofTAMILNADU public sector organisations. Thefinding of this study is only applicable for publicsectors, not other types of organisation. Furtherthe sample consists of managerial personnel’s; thefinding may /may not be generalized to supervisorsand workers.
ConclusionOverall conclusion of this study is that the
development of human is a specialized operativefunction of personnel administration. In thischanging trend, the employees’ expectations arealways shifted in nature. Hence the topmanagement concentrates the new innovative andinitiative development methods to their workforce.Then only they develop the existing work force andcompete with other public and private competitororganizations. The top management should takeeffort to motivate, train and build their highpotential (workforce) employees upgrading ofselection, standards, formulation of suitablerewards and career deve lopment schemes,objectives and development oriented appraisalsystems will be the basis of these efforts. “Wecannot create the future (time) for the nextgeneration, but we can create the next generation(human resources) for the future”.
ReferenceHRD Practices in Indian Industries by V.K.Jain,
published by Anmol publications (P) Ltd., New Delhi.
Training & Development in HRD by S.K.Bhatia
Indian Journal Industrial Relations Vol.41, No:2 Oct.2005
HRD Audit by T.V.Rao published by TaTa Mc GrawHill New Delhi 2007
Dr Ajit Srivastan “HRD in Changing business trends”HRD News letter Vol.19. issue 10: Jan. 2004
N.T Garvan, Heraty Noreen and Morley Michael(1998), “Actors in the HRD process: An exploratory study,“International Studies of Management and Organization”,March.
U.Pareek, (1975), “The concept and the process ofO.D”, Indian Journal of social work, 36(2);109-125.
T.V.Rao and D.F.Pereira (1986), Recent Experiencesin HRD, (New Delhi: Oxford& IBM), PP3-4
Murthy, M.G.K “Global knowledge organization:Human Development perspective: The Indian Journal ofcommerce, Vol.54, No.4, Oct-Dec 2001, Page 164-169.
Ramanuracharya.S “Hr for whom?” The Hindu,opportunities page, sage speak column, Wednesday,August 20, 2003 open page.3.
The fag column, The Hindu, Wednesday, September25.2002, open page.5.
Samyuleta Koda, “the art of managing people” Focuscolumn, The Hindu, Wednesday, December 2002, openpage.
Curtis, B., William E. H., & Sally, M. (1995). Overviewof the People Capabil ity Maturity Model . SoftwareEngineering Institute: Carnegie Mellon University.
Friedman, B., James, H., & David, M. W. (1998).Delivering on the Promise: How to Attract, Manage andRetain Human Capital. Arthur Anderson, New York: FreePress.
Pareek, U. & Rao, T V (1977). HR Function in Larsen& Toubro, Ahmedabad: Indian Institute of management
Pareek, U. & Rao, T. V. (1982). Designing andManaging Human Resource Systems. New Delhi: Oxford& IBH.
Pareek, U & Rao, T. V. (1975). HRD System in Larsen&Toubro. Ahmedabad: Indian Institute of Management,Unpublished Consultancy Report.
Pareek. U. & Rao, T. V. (1998). Pioneering HumanResources development: The L&T System; Ahmedabad:Academy of Human Resources Development, (Publicationof the original consultancy reports, 1975 and 1977)
Rao, T. V. (1999). HRD Audit. New Delhi: ResponseBooks (A Division of Sage Publications),
www.shrm.org. (David A. Decenzo, StephenP.Robbins.2007)
You may send information which you want to share with all.
If your institution is going to organize or had organized a Conference,Workshop or Symposia related to Social Sciences (Commerce, Economics,Management, also)
If you have written a book and want it to be reviewed, Please send a copyto us. It will be reviewed in SELP JOURNAL OF SOCIAL SCIENCE /RESEARCH EXPLORER.
This journal is a platform for the Social Scientist and explore theknowledge in thne field of Social Science, through research, innovativeconcept frame work, new idiology and the current trends.
CUSTOMERS’ ATTITUDE TOWARDS IMPACT OF ORGANIZED RETAILERSIN TAMILNADU
A.ElavarasanAssistant Professor of Commerce,
Directorate of Distance Education, Annamalai University, Annamalai Nagar, Tamil Nadu – 608 002.
ABSTRACT
Despite being one of the largest employing industries in India and contributing a significant portion to GDP,it still lacks a clear policy which would allow Indian retail players to firmly establish themselves and enablethem to face competition on an equal footing. India is the most attractive retail destination among emergingmarkets globally, ahead of China despite the ban on foreign direct investment in the sector. But, with heightenedactivity in the retail scenario, the debate is going on whether FDI in the sector should be allowed or not. Thegovernment of India prohibits foreign direct investment in retail except for single-brand joint ventures with upto 51 per cent equity share.
Key Words : Organized retailing , hypermarket, supermarket, convenience stores, exclusive outlets,departmental stores, and cash-n-carryIntroduction
Retailing is one of the largest sectors in Indiaand is still largely dominated by the unorganizedretailing. Indian retail market is very large as wellas swelling, the huge scope and vast potential forthe prosperity of organized retailing are increasingday by day. Liberalization of the economy in thenineties and the entry of large players in the retailbusiness have brought the retail industry intospotlight. The organized retail sector has beenwitnessing winds of changes in the last couple ofyears. Despite the current slowdown of theeconomy, organized retail sector is feeling thewarmth of expansion by the participation of Indianbusiness houses and foreign players. Indian retailsector has not been affected much as their overseascounterpart and has been sailing smooth andgaining strength with the help of the ambiance of astrong financial system. Retailers like Pantaloonsand RPG have started hypermarket operations andthey are having plans to expand aggressively to allthe religions of India.
Organized RetailingOrganized retailing refers to trading
activities undertaken by licensed retailers, that is,
those who are registered for sales tax, income tax,etc. These include the corporate-backedhypermarkets and retail chains, and also the privateowned large retail businesses. The term “organizedretail” means to have a formal organization tocoordinate and carry out activities. The organizedretail formats are generally owned by corporate.Organized retail refers to a form of retailing wherebycustomers can buy goods in a similar purchaseenvironment across more than one physical locationfor verticals from food, grocery, apparel, consumerdurables, jewellery, footwear, beauty care, homedécor, and books to music. They mainly include:hypermarket, supermarket, convenience stores,exclusive outlets, departmental stores, and cash-n-carry.
Statement of the ProblemThe Indian retail industry has witnessed
rampant growth over the last decade. Despite therecent boom in the retail sector in India, organizedretail forms only around 4 per cent of the entireindustry. During the economic recession since thelatter half of the financial year 1999, the retailersin the organized segment suffered a set-back in the
Research ExplorerISSN : 2250 - 1940
Vol I : Issue. 2July - December 2012
Research Explorer July - December 2012
Vol . I : Issue. 2 ISSN:2250 - 1940
64
form of declining revenues and halt in their capexplans. Despite the rosy hopes, some facts have tobe considered to positively initiate the retailmomentum and ensure its sustained growth. Themajor constraint of the organized retail market inIndia is the competition from the unorganizedsector. India still predominantly houses thetraditional formats of retailing, that is, the localkirana shop, weekly haats, convenience stores, andbazaars, which together form the bulk. Mostsignificantly, Indian retail is highly fragmented, withabout 15 million outlets operating in the countryand only 4% of them being larger than 500 squarefeet in size. Traditional retailing has been deeprooted in India for the past few centuries and enjoysthe benefits of low cost structure, mostly owner-operated, therein resulting in less labour costs andlittle or no taxes to pay. On the contrary, organizedsectors have big expenses like higher labour costs,social security to employees, bigger premises, andtaxes to meet.
Therefore the new organized retail outlets initiallyexperienced slow success due to a number ofcontributing factors. The retailers were quick tolearn and then with little alterations they couldchange the customer perceptions; the changedshopping outlets are seeing success due to fairpricing, large assortments, supported by largemoving spaces, self-services, free packing and theidea of getting everything under one roof hasconquered customers. Moreover, organized retailingis considered to be efficient and apt to cater to thediversified and changing nature of the customerdemands in growing economies like India. Thegeneral benefits of organized retail also includeimproved supply-chain, improved marketability ofproducts and it is also expected that it willcontribute to heightened economic activity. Thus,the organized retailing has a promising future withmany avenues and prospects. In this context, theresearcher has made an attempt to analyse theattitude of the customers towards the impact oforganized retailers in Tamil Nadu.
Objectives of the Study
1. To study the growth drivers for the organizedretailing in general.
2. To analyze the impact of organized retailers inTamil Nadu based on customers’ attitude.
3. To offer suitable suggestions for the effectivefunctioning of organized retail outlets in Tamil
Nadu based on the findings of the study.
Testing of HypothesisThe present study is based on the formulation
of the following null hypothesis: H01: There is nosignificant difference between the average amountspent during pre-and-post-purchase periods in theselect organized retail outlets.
Sampling DesignThis study is confined to three major organized
retail segments namely, food and grocery, fashionand accessories and pharma. These three retailsegments cover nearly 60 per cent of retail businessin recent years. The present study is restricted tothree organized retailers, namely Reliance Fresh,Koutons, and Apollo Pharmacy. In order to collectprimary data for the purpose of the study, multi-stage sampling technique is adopted. At the firststage 3 cities i.e. one mega-metro city (Chennai)and two municipal corporations (Coimbatore andErode) were selected randomly.
Tools for Data CollectionThe present study is empirical in character,
based on survey method. The first-hand informationfor this study was collected from the selectorganized retail outlets. As an essential part of thestudy, the primary data were collected from 675customers with the help of exit interview. Thesecondary data have been collected mainly fromjournals, magazines, government reports, booksand unpublished dissertations. In order to studythe perception of the customers, multiple regressionanalysis, paired comparison t-test and percentageanalysis have been employed. Multiple regressionanalysis is used to measure the impact of theorganized retailers. The paired comparison t-testis employed to compare the average amount spentby the customers during pre-and-post-purchaseperiods in organized retail outlets.
Findings
1. Price, freedom in choosing products, customerrelationship, quality of the products, servicequality, more variants, one stop shopping andavailability of more brands are the factorsinfluencing the respondents to prefer organizedretailers at 32.88%, 34.96%, 36.74%, 44.14%,46.07% , 47.70% , 49.92% and 50.66%respectively.
2. There is a significant difference in the average
Research Explorer July - December 2012
Vol . I : Issue. 2 ISSN:2250 - 1940
65
monthly amount spent between the pre-and-post-purchase periods in Reliance Fresh retailoutlets. The respondents save on an averageRs.49.23 in the average monthly amount spentwhile purchasing at Reliance Fresh retailoutlets.
3. A significant difference is found in the averagemonthly amount spent between the pre-and-post-purchase periods in Koutons retail outlets.The customers spent on an average of Rs.88.49as extra while purchasing at Koutons retailoutlets.
4. There is a significant difference in the averagemonthly amount spent between the pre-and-post-purchase periods in Apollo Pharmacyoutlets. The respondents save on averageRs.6.51 in the average monthly amount spentwhile purchasing at Apollo Pharmacy.
5. The age, educational status, household size andfamily pattern of the respondents have nosignificant effect on their acceptance towardsimpact of Reliance Fresh retail outlets. On theother hand, gender of the respondents at 1%level and respondents’ monthly householdincome at 5% level has significant effect on theiracceptance towards impact of Reliance Freshretail outlets in Tamil Nadu.
6. The gender, age, educational status andmonthly household income of the respondentsat 1 per cent significance level and householdsize of the customers at 5 per cent level ofsignificance have significant effect on theiracceptance towards impact of Apollo Pharmacyoutlets in Tamil Nadu. Respondents’ familypattern has no significant effect on theiracceptance towards impact of Apollo Pharmacy.
7. The gender, age, educational status, householdsize and family pattern of the respondents haveno significant effect on their acceptance towardsimpact of Koutons retail outlets. On the otherhand, respondents’ monthly household incomeat 5% level of significance has significant effecton their acceptance towards impact of Koutonsretail outlets in Tamil Nadu.
8. Out of 675 respondents, 39.85%, 38.81% and21.33% of the respondents agree, partiallyagree, and disagree respectively towards theimpact of organized retail outlets. The averageacceptance score reveals that the respondents
have higher acceptance (2.34) towards the roleof organized retail outlets in increasing socialstatus of the customers, followed by its role inthrowing away middlemen (2.27). In case of timesaving, the respondents have lower acceptancelevel towards organized retail outlets (2.07).
9. Inconvenient location, absence of private labelbrand, inadequate visual merchandising, poorreply on enquiry, inadequate advertisement,poor co-operation of the staff, higher price,incompetent sales personnel, undue delay inbilling, absence of customer database andinadequate sales promotion are the problemsof the customers with the organized retailers inTamil Nadu.
Suggestions
1. People are highly oriented towards organizedretail. As people expect, good quality productsat reasonable price, the organized retailers shalloffer products at reasonable price with goodquality.
2. Organized retailers can reduce the perceptionof waiting, without necessarily reducing theactual wait. They can make outlets by displayingmerchandise to change customers’ perceptionsof waiting. Besides, they can enhance the storeatmospherics through visual communications,lighting, colours and odors. The visualcommunication strategy might be planned andalso be brand positioned.
3. The select organized retailers should train theiremployees to be cooperative with the customersas this is found to be the major problem facedby the customers in the select organized retailoutlets.
4. The modern retail is essentially looking out formore space for expansion. The availability ofthe main space would definitely enable the selectorganized retailers to deliver better qualityservices to the customers, resulting in increasein operational efficiencies and reduction insupply chain costs. It will overcome the problemof inconvenient location of stores.
5. The organized retailers may adopt crossmerchandising by offering complementary goodsand services to encourage customers to buymore. They can also aim at infusing newerproduct lines frequently to increase the volume
Research Explorer July - December 2012
Vol . I : Issue. 2 ISSN:2250 - 1940
66
of the sales by targeting the impulsive buyingbehaviour of customers.
6. The select organized retailers must ensure thatsales personnel have sufficient knowledge of theproducts offered, and also must be capable ofhandling complaints. They must also exhibitwillingness to handle returns, and should beavailable for advice or clarification. Overall,organized retailers must ensure courteousbehaviour of sales personnel. Well manneredand helpful staff can always lead to storepatronage decisions.
7. In an age of quick services, technology is anecessary ingredient for success of any retailoutlet. Customers would prefer to visit suchoutlets that would provide prompt and error-free billing services. Retailers may adoptdifferent technologies to manage faster billing.They should also work on having multiplepayment options like cash, credit cards, debitcards, and so on to facilitate customers.
8. Apollo Pharmacy offers discount card (All TimeMedicine) to their customers to make themfrequently visit their pharmacy outlets andpurchase the medicines at discount. It istherefore suggested that the other organizedretailers namely Reliance Fresh and Koutonscan follow similar strategies to promote theirbusiness.
ConclusionThe emergence of organized retailing in the retail
market scene is very significant in the recent past.Organized retailing is witness a wave of playersentering the industry. The entry of foreign playerswill not only affect the ownership, but also change
the basics of business. Indian’s vast middle classand its almost untapped retail industry are keyattractions for global retail giants wanting to enterthe newer market. The present study reveals thatinconvenient location, absence of entertainmentfacility, absence of home delivery, absence of privatelabel brand, inadequate visual merchandising, poorreply on enquiry, inadequate advertisement, poorco-operation of the staff, higher price, incompetentsales personnel, undue delay in billing, inadequateparking facility, absence of customer database andinadequate sales promotion are the problems of thecustomers with the select organized retailers.
References
1. Amatul Baseer and Laxmi Prabha, G (2007).Prospects and Problems of Indian Retailing, IndianJournal of Marketing, Vol.XXXVII, No.10, October,pp.29-33.
2. Praveenkumar, S and Mahalakshmi, V (2008). RetailManagement, Chennai, Rudhra Books, pp.1-10.
3. Coyle, W (2006). Revolution in Food RetailingUnderway in the Asia-Pacific Region, Amber Waves,Vol.4, No.3, pp.22-29.
4. Doug Lincoln (1985). Marketing Decision-makingProblems Faced by Small Business Retailers, Journalof the Academy of Marketing Science, Vol.13, No.3,June, pp.183-197.
5. Harpreet Singh and Narinder Kaur (2008). Retailingin India: Recent Trends & Challenges, Indian Journalof Marketing, Vol.XXXVIII, No.4, April, pp.49-55.
6. Nathan, N.V.R (2001). Requiem for Store basedRetailing, Indian Management, Vol.40, No.3, pp.35-39.
7. Pashigian B.Peter and Eric, D (1998). The Pricing ofSpace in Malls, Journal of Law and Economics,Vol.41, April, pp.42-115.
ATTENTION TO THE SEMINAR ORGANIZERSELP Publication is one of the fast growing academic friendly publisher in Tamilnadu
specialized in publication of seminar proceedings /Edited volume with ISBN.
We invite the articles of the participants in the national or international seminarorganized by the academic institutions published as edited volume with ISBN / specialissue of SELP journal of social science with ISSN -0975-9999 / Research Explorer withISSN -2250 - 1940
Seminar organizer/director may conduct us for the publication of Edited volume orspecial issue by mail at [email protected]
Research Explorer July - December 2012
Vol . I : Issue. 2 ISSN:2250 - 1940
67
A STUDY ON URBAN POVERTY ERADICATION THROUGH MICRO-FINANCEIN NASIK DISTRICT
Deore Sanjay ParasharamM. S. G. College Malegaon Camp , Dist. Nashik, Maharashtra state, India.
ABSTRACTThe main objective of Micro finance is to alleviate poverty and to make poor women self dependent. Micro
finance may be defined as provision of thirst, credit & other financial services to poor in rural, semi-urban orurban areas to enabling them to raise their income levels and improve their standard of living. It is achieved tolarge groups facilitated, as an intermediately to get credit and its effective utilization. The Government launchedSwarna Jayanthi Shahri Rojgar Yojana ( SJSRY) on Dec 1st 1997. Self Help Groups have been founded underthis SJSRY scheme for alleviation of poverty in urban areas which rest on foundation of women empowerment.This study focuses on urban women SHGs micro finance belonging to Malegaon city in Nasik District ofMaharashtra with the main focus the study has under taken to see whether the micro financial activities havehelped them to come out of poverty or not.
Key words: Micro finance , Urban poor, micro finance, Self Help Group , poverty eradication
IntroductionAccording to Adam Smith “ Man is rich or poor
according to the degree in which he can afford toenjoy the necessities, the conveniences and theamusement of the human life.” It indicates thecondition in which a person is not able to accessbasic needs of minimum living standards adequatefor his physical and mental development.
Urban poor are apparently visible by theirpeculiar way of living, a distinct sub standard oflife in extremely deprived conditions with-inadequate means of livelihood and insufficient basicamenities. Even though the infrastructure and theeconomic growth factors influence the extent, depthand nature of the poverty, income-earning activitiesof the poor depend on institutional factors thatdetermine access to production resources andemployment opportunities in the urban areas.
Micro credit was first started in Bangladesh byDr. Mohammad Yunus through Grameen Bankwhich was established in 1976. In India NABARDlaunched a pilot phase of Self Help Group (SHGs)Bank linkage programme in 1992. The Governmentlaunched Swarna Jayanthi Shahri Rojgar Yojana (SJSRY) on Dec 1st 1997. SJSRY is the only mosteffective programme launched by GOI for alleviation
of poverty in urban areas which rest on a foundationof women empowerment. All the SHGs ( underSJSRY) are women groups for the study, the studyfocuses on urban women SHGs belonging toMalegaon city in nasik district of maharashtra. Thisstudy makes an attempt to know what extent SHGsare able to attempt to reduce poverty through microfinance.
Objectives
1) To assess the financial activities of Self HelpGroup members .
2) To find out Whether micro finance can reducepoverty .
3) To provide recommendations for policyimplications to poverty eradication .
MethodologyA sample of 100 members has been selected
( one member of each group ) from 10 CDS (Tenmember of each CDS ). The selected members whobelong to the SHGs which are covered under theSHG Bank linkage programme which are alsoknown as DWCUA groups. 100 women wereinterviewed through questionnaire with the focusto know the effectiveness of the groups as well astheir individual economic activities of the
Research ExplorerISSN : 2250 - 1940
Vol I : Issue. 2July - December 2012
Research Explorer July - December 2012
Vol . I : Issue. 2 ISSN:2250 - 1940
68
beneficiaries of SHGs. The study has beenconducted during the period from 1st November to30 November 2009.
Characteristics of the study area
According to the 2001 census, female populationis 200539 (48.98.1) out of 409403.
Eighty Two percent populat ion of Musl imcommunity in the total population.
Malegaon is the third largest population densitycity (86123 per sq. km.) after Mumbai and Pune.
In 17422 families, 150000 (36.63 %) people liveunder BPL in 34 slums.
From 1947 to 2007, ten times communal riotsand twice bomb blast took place.
Due to poverty, violence and mafiaraj situatedin the Malegaon city, fear hovers all the time overthe lives of the people.
Besides, due to religious influence women’scondition is very miserable.
In such circumstances how much is it possiblefor SHGs to make the poor allivate.
On the basis of such circumstances Self HelpGroups Demographic profiles is as follow.
Table – 1 Demographic Profiles of SHGsMembersNo. Characteristics Total1 Group Age
01-05 years 536-10 years 4610 + years 01Total 100
2 Member Age18 – 40 years 6941 – 60 years 3060 + years 01Total 100
3 Group SizeUp to 10 Members 2711 – 20 Members 7120 + Members 02Total 100
It is observed from table no.1, fifty three percentof the groups belong to1 to 5 years in age, andfourty six percent groups belong 6-10. Majority sixtynine percent of the members were in the age groupof 18 to 40 years .Thirty percent belong to 41 to 60years. Seventy one percent groups belong to 11 to20 members group size. Twenty nine percent areilliterate and Seventy one percent are literate. Sixtyone percent of the members have family of 5 to 8members and eighty six percent of the women weremarried and sixty two percent of the families are ofnuclear type.
Findings
1. Sixty Nine Percent of women have been povertyfree due to micro-finance through SHGs
2. Fifty four percent of increase has been noticedin saving done by women
3. Women have been the owners of differententerprises who do not have 1% ownership ingeneral social .
4. Employment generation is created from 16 typeSelf Business.
5. Sixty nine percent of women’s economicrequirements (need) have been fulfilled throughmicro-finance.
6. Micro-finance has increased women’s credit inbanks, therefore every member have utilized at
Research Explorer July - December 2012
Vol . I : Issue. 2 ISSN:2250 - 1940
69
an average the loan around 57660/-.
7. This study also shows that seventy three percentof the loan taken is used for house-holdpurposes, existing business and education.
8. It is also observed that women in SHGs arebecome more aware of the education of theirchildren.
9. Women are being brought in to the mainstreamof economic development through micro-finance.
10. Illiteracy has made women loose their power toact, however they have regained this powerthrough micro-finance.
11. Micro-finance enables women to fulfill economicneeds of their families which results in peacefulatmosphere in the family.
12. Women belonging to Hindu and Muslimcommunity work together in SHGs, thereforecommunial harmony has been noticed asincreasing.
Recommendations1. Loan taken from bank shall be invested in
enterprises like mobile and
inverter repairing, processing of cashew nut,mobile floor mill, etc. which usually offermaximum production.
2. The Municipality shall make the provision to
purchase and sale the production.
3. SHGs shall be offered the works like sailing ofstamps, feed, milk and preparing telephone,Electricity bills and ration cards. Alongside, thework like survey for government data shall beoffered to SHGs.
4. There shall be an yearly audit of the Group’seconomic transactions.
5. To encourage the Suvarna Jayanti Department& SHGs they should be awarded .
6. All BPL families should be included in SHGsmovement.
References1. Ganeshmurthy V. S., 2007, India: Economic
Development and Empowerment. New Delhi, NewCentury publication.
2. Sahay, Sushama, 1998 Women and Empowerment-Approaches and Strategy, New Delhi, Discoverypublication.
3. Bhatia, J. K., 2001 “ Census of India”, Nasik Districtcenses, Handbook.
4. Dr. Lazar and Deo, 2009, “ Micro finance-performanceEvaluation……..” Puducherry, Allied publication Pvt.Ltd.
5. Mulani, M. V., 2007 “ The Role of the SHG in thesocio-economic Empowerment of women”. Pune.
6. Progress of SJSRY, Bank Linkages in Maharashtra.
7. NABARD Progress of SHGs, Bank Linkage in India.
BOOK REVIEW
Research Methodology for Commerce and ManagementBy
Dr.C.PARAMASIVAN, Ph.D.,
Publisher : Regal Publications, New DelhiPrice : 250
Research Methodology for Commerce and Management is the text bookwhich is purely based on the University Syllabus. The Presentation of theLanguage and Explanation of the Concept is based on the level of StudentCapacity.
Contact Included :Introduction to Research Methodology, Research Problem and Ethics, Research design,Sampling, Data Collection and analysis, Hypotheses, Research Report
Research Explorer July - December 2012
Vol . I : Issue. 2 ISSN:2250 - 1940
70
HUMAN RESOURCE MANAGEMENT POLICIES AND PRACTICES OF THECO-OPERATIVE SUGAR MILLS IN TAMIL NADU
ABSTRACTHuman resource is the most important resource that every organization has in the form of its employees. No
organization can think of viability and effectiveness without the efficient utilization of human resources. Thestudy reveals that employees have few problems with regard to human resource management policies andpractices such as lack of new recruitment, unsatisfactory organizational climate, existence of two differentpay structures, lack of career development opportunities, lack of promotion, lack of participation in decisionmaking, bias of superiors, dissatisfaction with grievance handling, no reward for better performance, lack offreedom to individual units, withdrawal of customary benefits, low salary, inadequate welfare measures andabsence of separate department for human resource function are the problems of the employees with regardto human resource management in the select co-operative sugar mills.
Keywords: Human resource management, personnel management, HRM in co-operatives, HRM in sugarmills, etc.
IntroductionThe success of any organization depends to a
large extent upon the capability, competence,efficiency, and level of development of humanresources, who are the active agents, accumulatecapital, exploit natural resources, and build social,economic and political organizations. Therefore,human resource is the most important resourcethat every organization has in the form of itsemployees. No organization can think of viabilityand effectiveness without the efficient utilizationof human resources. The optimal utilization ofnatural resources and the factor inputs of capitaland technology depend on the extent of use ofhuman resources. The management of humanresources represents a significant measure ofutil izing human resources to accomplishorganizational goals that include making profits,survival and growth.
Importance of HRM in Sugar Co-operativesSince people are becoming such a critical factor,
the only winning organizations will be those thatrespond quickly to change and are able to manage
their human resources effectively. The managementof human resource will play a crucial role in theperformance of organizations in the 1990s.Organizations increasingly rely on human resourcemanagement techniques to increase the ireffectiveness and ability to adapt to changingconditions. Taking into consideration the size andexpansion, the effective and innovative humanresource management is equally important for alltypes of co-operative enterprises. Introduction of aproper human resource management system in thesugar co-operatives has now become necessary, asthe conditions of the economy had changedconsiderably requiring introduction of newtechnology. Human resource management is boththe foundation and fountain source for developingprofessionalized management in sugar co-operatives. Survival of sugar co-operatives requirescompetent people and coordination of their effortstowards one or more goals. Therefore, there is noquestioning the importance of innovative rethinkingof human resource management practices. Theenvironmental changes have proved theineffectiveness of human resource strategies based
Research ExplorerISSN : 2250 - 1940
Vol I : Issue. 2July - December 2012
Research Explorer July - December 2012
Vol . I : Issue. 2 ISSN:2250 - 1940
71
on direction and control, and their failure to elicitcommitment of employees to co-operative objectivesthat is so crucial in today’s technologically orientedenvironment. Thus, it is evident from the abovearguments that e ffective human resourcemanagement is necessary to review, revamp andrejuvenate the existing people management systemsin sugar co-operatives.
Statement of the ProblemCo-operatives have significant quantum of
human resources, which are qualitatively different.Co-operatives in several Asian countries have maderemarkable progress in their respective economicfields, but very little has been done in streamliningtheir human resource management. During the last30 years, there has been a considerable change inthe core concept of management of people in allorganizations to which co-operative organizationsare no exception. Even though the co-operativemovement has made a significant progress and hasspread its tentacles to every corner of the countryand conceivable economic activity, especially withsocial content, the co-operative sugar mills in Indiaare still moving with traditional outlook on humanresources due to ideological gap, developmental gapand scientific thinking gap. The reasons lie in thelack of awareness of problems of human resources.
Most of the co-operative sugar mills in TamilNadu have been in the red for the last 15 years andwhenever certain demands arose in the past, themanagement pleaded its helplessness in meetingsuch demands because of financial stringency andsteadily declining profitability. It leads to poormorale of employees, lack of complete integrationbetween employees and mills, demoralization andlack of job security. Besides, the main factor, whichcan be attributed to un-economical working of co-operative sugar mills, is over-staffing. The co-operative sugar mills are seen as labour intensiveorganizations where they employ more workers thanthe required strength resulting heavy expenditureon wages and allowances and create labourproblems and duplicity of work, etc. Hence, theco-operative sugar mills require professionallycompetent as well co-operatively oriented humanresources. For bringing out management excellencein co-operative sugar mills, there is an urgent needto review the existing human resource managementpractices and evolve suitable parameters relatingto human resource management practices. This islikely to create a congenial work environment in
co-operative sugar mills. In this context, theresearcher has made an attempt to study thehuman resource management policies and practicesof the co-operative sugar mills in Tamil Nadu.
Objectives of the StudyThe objectives of the present study are as follows:
1. To study the need and importance of humanresource management in the select co-operativesugar mills in Tamil Nadu
2. To review the human resource managementpolicies and practices of the select co-operativesugar mills in Tamil Nadu.
3. To study the perception of the employeestowards human resource management policiesand practices of the select co-operative sugarmills in Tamil Nadu.
4. To suggest appropriate measures to improve theeffectiveness of the human resource functionof the select co-operative sugar mills based onthe findings of the study.
Testing of HypothesisThe study is based on the formulation of the
following null hypothesis.
H0: There is no significant relationshipamong the satisfaction levels of the employeesbelonging to different demographic profiles towardshuman resource management policies and practicesof the co-operative sugar mills.
Sampling DesignThere are 42 sugar mills in Tamil Nadu, of which
37 mills are in operation, which include 15 co-operative sugar mills, 2 public sector mills, and 20private sugar mills. Since the study is restricted toco-operative sugar mills only, the researcher hasselected 4 mills. For this purpose, the co-operativesugar mills are categorized into 3 groups based oncrushing capacity per day.
Tools for Data CollectionThe present study is empirical in nature based
on survey method. The first-hand information wascollected from the establishment sections of the co-operative sugar mills. As an essential part of thestudy, the primary data were collected from 513employees with the help of questionnaire. Pre-testing of questionnaire was done during December2011, involving 25 respondents to know the
Research Explorer July - December 2012
Vol . I : Issue. 2 ISSN:2250 - 1940
72
relevance of the questions. In the light of pre-testing, few changes were incorporated in thequestions and their sequences. The secondary datawere collected mainly from the journals, magazines,government reports, books and unpublisheddissertations. As an essential part of the study,the primary data were collected for a period of 6months from January 2012 to June 2012.
Framework of AnalysisThe ultimate object of the study is to examine
the perception of the employees towards humanresource management policies and practices of theselect co-operative sugar mills in Tamil Nadu. Inorder to study this aspect, analysis of variance,student t test, co-efficient of variation, discriminatefunction analysis, multiple discriminant functionanalysis, multiple regression analysis andpercentage analysis are employed.
Findings
1. No significant relationship is found in thesatisfaction level of the respondents belongingto different gender, age groups and length ofexperience towards human resourcemanagement policies and practices of the selectco-operative sugar mills in Tamil Nadu. Thereis a significant relationship in the satisfactionlevel of the respondents belonging to differenteducational status groups, salary groups,cadre, nature of employment and mill theybelong to towards human resourcemanagement policies and practices of the selectco-operative sugar mills.
2. Male respondents, respondents in the age groupabove 55 years, respondents having PG andabove qualifications, respondents belonging tomonthly salary of above Rs.35000, officers,respondents belonging to length of experienceabove 30 years, permanent employees andemployees of the Salem Co-operative SugarMills are more satisfied towards humanresource management policies and practices ofthe select co-operative sugar mills.
3. There exists consistency in the satisfaction levelof female employees, employees belonging toabove 55 years, employees having SSLCqualification, employees drawing salary uptoRs.15000, workmen, employees havingexperience upto 10 years, seasonal employees,and employees of N.P.K.R.R. Co-operative SugarMills towards human resource management
policies and practices.
4. The MDA technique applied has resulted in twodiscriminant functions, of which the factorsrelating to labour welfare measures andindustrial relationship contributed more to thefirst function (Employee-managementRelationship) and the variables recruitment andselection and employee motivation contributeto the second discriminant function(Recruitment and Training). The efficiency ofthese functions was tested using classificationmatrix which predicted 88.50% of the casescorrectly, The results of the MDA show thatthe officers and supervisors differ more fromworkmen in both the dimensions namely‘Employee-management Relationship’ and‘Recruitment and Training’.
5. “Safety and labour welfare measures” is themaximum discriminating variable(R2% =79.74% ) between permanent andseasonal employees, followed by ‘industrialrelations’ (48.72%)’, ‘workers’ participation inmanagement’ (46.24% ) and ‘employeemotivation’ (43.30%) in that order. The variable‘recruitment and selection’ discriminatingbetween permanent and seasonal employees isonly 1.85%.
6. Gender, age and length of experience of therespondents have no significant effect on thehuman resource management policies andpractices in the co-operative sugar mills. Onthe other hand, educational status and monthlysalary of the respondents have significant effecton the human resource management policiesand practices at 1 per cent level of significance.
7. Lack of new recruitment, unsatisfactoryorganizational climate, existence of two differentpay structures, lack of career developmentopportunities, lack of promotion, lack ofparticipation in decision making and bias ofsuperiors are the problems of the employeesranging from 23.97 per cent to 47.75 per centwith regard to human resource managementin the select co-operative sugar mills in TamilNadu. About 52.04%, 55.94%, 56.33% and57.89% of the respondents state thedissatisfaction with grievance handling, noreward for better performance, lack of freedomto individual units and withdrawal of customarybenefits as the problems in human resourcemanagement in the select co-operative sugarmills respectively. More than 60 per cent of the
Research Explorer July - December 2012
Vol . I : Issue. 2 ISSN:2250 - 1940
73
respondents state the low salary, inadequatewelfare measures and absence of separatedepartment for human resource function astheir problems in human resource managementin the select co-operative sugar mills.
8. Respondents ranging from 23 per cent to 40.54per cent suggest that new recruitment,satisfactory organizational climate, existencecommon pay structure, avenues for careerdevelopment and retaining customary benefitswill improve the effectiveness of humanresource function of the co-operative sugarmills. About 42.69%, 45.61%, 46.97% and50.29% of the respondents suggest promotionof employees, participation in decision making,fairness of superiors and effective grievancehandling to improve human resource functionin the co-operative sugar mills. More than 52%of the respondents state reward for betterperformance, freedom to individual units,provision of reasonable salary, provision ofadequate welfare measures, provision ofdependant benefits and separate departmentfor human resource function to improveeffectiveness of human resource function in theco-operative sugar mills.
Suggestions
1. Since the co-operative sugar mills are becomingincreasingly more diversified with growingbusiness transactions, there is an urgent needto establish a full-fledged human resourcedepartment to look after the human resourcefunctions. A human resource manager notbelow the rank of chief of other functional areasof a sugar co-operative should head the humanresource department. However, the internalstructure of the department, its functions andscope may vary depending on the size,production capacity and number of employeesof the co-operative sugar mills.
2. Recruitment and selection of employees’ in theco-operative sugar mills should be madethrough establishment of a Co-operative ServiceCommission. In the state of Uttar Pradesh, Co-operative Institutional Service Board has beenestablished for recruitment of personnel for co-operatives. Therefore, similar recruitment boardcan be constituted by the Government of TamilNadu to recruit employees to the co-operativesugar mills.
3. Training forms part of an integrated approachto human resource management. It becomes awasteful effort if it is not harmonized with careerdevelopment of employees. The organizationshould classify the various categories of jobsand assess developmental needs in order toprovide need-based training to the employeesso as to increase their efficiency. Co-operativesugar mills do not have any formal trainingprogramme either for workmen or officers.Therefore, it is suggested that the employeeswho fulfill the requisite qualifications and haveaptitude for training should be deputed and awell-designed roster system should also beformulated for need based trainingprogrammes. In-service trained employees inthe co-operative sugar mills should be givenincentives by way of merit certificate, cashaward or advance increments.
4. The salary structure should be such that itwould help retain qualified and competentpeople. Existence of two different pay structuresmay adversely affect the morale of theemployees and it may create disparities amongthe employees. It is therefore suggested thatthe Commissioner of Sugar in consultation withstate government may streamline the commonpay structure. However, within the structurepay scale may vary depending on the skill,nature and designation of employees.
5. The employees of the co-operative sugar millswere enjoying the customary benefits such asmore leave facilities, more number of uniforms,leave travel allowance, double pay for overtimework, concessional rate of electricity inquarters, etc. Now these benefits have beenreduced. They have to be content with theoriginal rates, which will demoralize theemployees.
ConclusionBusiness organizations in competitive
environment are facing major challenges like fastpace of changing technology, acute shortage ofskilled manpower, and obsolescence of productsand services which are compelling for reorientingof existing employees in order to survive andcompete. Indian sugar industry, second largestagro-based processing industry after the cottontextiles industry in country, has a lion’s share in
Research Explorer July - December 2012
Vol . I : Issue. 2 ISSN:2250 - 1940
74
accelerating industrialization process and bringingsocio-economic changes in under developed ruralareas. In the era of globalization, sugar industryneeds more competitive edge which can be givenby way of modernization, enhancing productivity,employing competent people, and manufacturingexcellent quality sugar at competitive prices. Ahighly dedicated and committed workforce isessential for achieving organizational goals. In thiscontext, the present study was undertaken to studythe perception of the employees towards humanresource management policies and practices of theselect co-operative sugar mills in Tamil Nadu.
References
1. Drucker and Peter, F (1986). “Goodbye to theOld Personnel Department”, Wall Street Journal,No.22, May.
2. Dwivedi, R.S (1997). Managing HumanResources: Personnel Management in IndianEnterprises, New Delhi: Galgotia PublishingCompany.
3. Gulab Singh Azad (1998). “Human ResourceDevelopment in Co-operatives: StrategicIssues”, Labour Co-operatives, No.12, April-June.
4. Mathur, B.C (1996). Human ResourceDevelopment the New Horizons, New Delhi:Uppal Publishing House.
6. Paulk, A.K and Anantharaman, R.N (2000).“Impact of HRM Practices on Competence ofSoftware Professionals in India: An AnalyticalStudy”, Management and Change, Vol.6, No.1.
7. Ramachandra Gowda, M and ParameswaraGupta, E.A (2006). “HRD: Requiring TodayInnovative Techniques”, Southern Economist,Vol.45, No.13, November.
8. Sabhanayakam, S (1987). “Human ResourcesDevelopment in Co-operatives”, The Tamil NaduJournal of Co-operation, Vol.79, No.1, July.
9. Sharma, P.S (1996). “Policies and Perceptionson Co-operative Sugar Sector”, The Co-operator,June.
10. Subha Rao, P (2004). Essentials of HumanResource Management and Industrial Relations,Mumbai: Himalaya Publishing House.
>twVF¡ß ĺï\D(Ã[ªVâ| >tµ Ø\Va \u®D ÖéÂþB gF¡ Ö>µ)
TAMILAIVU SANGAMAM(An International Research Journal on Tamil language and Lilterature )
Dr.K.JayaramanAssistant Professor, Department of Educational Technology,
Bharathidasan University, Tiruchirappalli.
ABSTRACTThe educationists envisage the progress of Information and Communication Technology and its global
impact as the development process for learning mathematics. Mathematics is an important subject containinga number of basic concepts and is abstract and complex in nature. Therefore, students consider Mathematicsas a difficult subject. There is a great need to reshape the educational system and take an initiative in bringingthe computers into the classroom for regular teaching. This paper endows with the data that supports invalidating the effectiveness of Java Applets in learning Mathematics. The investigator educates the studentsthrough Java Applets which is an effective way of teaching than lecture method. In this paper the analysis isbased upon the usage of tools and the statistical significant difference has been found to prove that thedeveloped software is effective.
Key words: ICT, Java Applets, Locus of a Point, Achievement test
IntroductionInformation and Communication Technology is
the best hope for developing countries to acceleratetheir development process. It is the most powerfulengine of growth. It forms the backbone of severalindustries. Hence, gaining a better understandingof the trends, developments, issues and impact ofInformation and Communication Technology oneducation has been identified as a key researchpriority, giving rise to a multi attitude of researchstreams. Today the globe has shrunk into a tinyvillage and the entire globe scenario has beenbrought on to a tiny screen under the click of amouse button. Literacy in the 21st century has beenunderstood as computer literacy. It exhibitsknowledge as the power where as the informationtechnology provides the means of knowledge. Theworld of education is changing fast due to
technological developments. An application oftechnologies is screen pervasively. The widerchanges taking place in the society are providingcontent for instructional development. Over years,there is a shift from oral to written, formal to non-formal, teacher centered to student centered andrigid to flexible forms of instruction.
Java Applets and their advantagesJava applets are an interesting alternative
to enrich Web pages. Applets are Java programs,which are downloaded and run in the clients’browser. It may seem dangerous to run foreignprograms on client’s devices. However Java Appletsinsist on security and protection and are notallowed in performing dangerous operations.
Applets are for example permitted to recordsound, redirect to arbitrary WWW pages or callpublic methods of another applets situated on the
Research ExplorerISSN : 2250 - 1940
Vol I : Issue. 2July - December 2012
Research Explorer July - December 2012
Vol . I : Issue. 2 ISSN:2250 - 1940
76
same WWW pages. On the other hand applets areforbidden to connect to another server, write fileson the clients’ devices and run programs on thehome server. Yet restricted, Java applets have fullgraphical capabil ities and allow real-timeinteraction with users. Thanks to these featuresapplets are able to visualize processes in a moreunderstandable way, which makes them ideal foreducation of mathematics.
Java Applets are self-contained programs thatcan be embedded in a web page or standalone. JavaApplets can have any or all of the followingadvantages:
It is simple to make it work on Windows, MacOS and Linux
It is supported by most web browsers
It can have full access to the Java virtualmachine while it is running on if the user agrees
It can run at a comparable speed to othercompiled languages such as C++
It can be a real time application
It can move the work from the server to theclient, making a web solution more scalablewith the number of users/clients.
Need and Significance of the studyEffective teaching in any subject depends
largely upon the learning outcomes of teaching.Students need unique experiences in thepresentation of the content. It is therefore, theurgent need for trying out new methods of teachingand establishing their effectiveness is teaching andlearning.
Teaching by computer Java Applets programprovides unique experience to students. Animationand sound effects help to stimulate interest inlearning, student tend to remember the facts in abetter manner.
Systematic researches are necessary todevelop a Java Applets program, particularly, theconcepts like trigonometry to the XI standardMathematics students so as to see its effectivenessover the lecture method. As per the knowledge ofresearcher so far no such systematic effort has beenundertaken to develop Java Applets, for teachingof Mathematics to the student of Higher Secondarycourses or to effectively make use of the readilyavailable Java Applets on the net which are suitable
for teaching Mathematics to the Higher SecondaryLevel students. Hence the present study has beenattempted to make use of the Java Applets, whichare readily available on the net and suitable forthe purpose of teaching Mathematics to the HigherSecondary Level with the view to finding out thiseffectiveness.
Statement of the problemThough there have been a number of
attempts in mathematics education to integrate ICTand web tools into the teaching and learning ofMathematics, the technology of Java Applets hasnot been effectively applied for teaching – learningMathematics. Hence, a software program has beenconstructed using Java Applets for teaching thesection ‘Locus of a Point’ with a view to assessingthe effectiveness of Java Applets. Hence the problemof the study is state as, ‘Developing and Validatingthe Effectiveness of Java Applets in Teaching Locusof a Point in Mathematics at the Higher Secondarylevel.’
Objectives of the studyThe objectives of the study are as follows:
To develop suitable Java Applets package inLocus of a Point at the Higher Secondary level.
To find out whether there is any significantdifference between pre – test and post – testscores of control group and experimental groupstudents.
To find out whether there is any significantdifference between pre – test and post – testscores of control group and experimental groupstudents in attainment of knowledge,understanding, application and skill objectives.
To find out whether there is any significantdifference between control and experimentalgroup students in their gain scores.
HypothesesThe specific hypothesis formulated in tune with
the objectives and tested by the experiment are:
There is no significant difference between pre –test and post – test scores of control group andexperimental group students.
There is no significant difference between pre –test and post – test scores of control group andexperimental group students in attainment of
There is no significant difference betweencontrol and experimental group students intheir gain scores.
Construction of the toolJava Applet program has been constructed
by the experts in the computer field. To evaluatethe effectiveness of the expert in teachingMathematics in terms of the achievement of thestudents taught by Java Applets method anachievement test was constructed. The test wasbased on the contents of a section of study namely‘Locus of a Point’ in Mathematics. The test consistsof fifteen objective type questions and five fill-inthe blank type questions suitable to the level of XIstandard Mathematics students. The duration ofthe test was around 20 minutes. This serves forPre – test as well as Post - test. The maximum scorethat can be achieved is 20 and a score of 1 for theright answer and 0 for the wrong answer has beenfixed.
Validity of the toolThe validity of the tool has been established
by doing item analysis, for each item the difficultyindex and discrimination value has been calculated.In this analysis the item having difficulty indexbetween 40 - 60% and items having discriminationvalue above 0.40 has been selected. The content ofthe validity tool has been established by giving itto a panel of Mathematics teachers.
SampleThe experiment was conducted on the total
sample size of 100 students consisting of 50 forcontrol group students and 50 for experimentalgroup students of the XI standard studentsstudying in K.A.P.V Higher Secondary School,Tiruchirappalli. The research of the study is mainlyfocused upon the students of the Mathematicsgroup with Computer Science, using randomsampling method.
MethodologyPre-test, Post-test Parallel Group Design is
adopted for the study. A representative andmanageable sample of 50 students were chosenthrough simple Random sampling technique, thegroup was given the treatment of instruction usingJava Applets on the topic Locus of a Point. Before
the treatment an achievement test was conductedas a Pre - test and the marks are recorded, afterthe treatment an achievement test was given as aPost - test, the difference in the mean achievementscores were analyzed to find out the effectivenessof teaching Mathematics at Higher Secondary Level.The analysis of the Pre - test and Post - test scoreswas done through the test of significance.
Data AnalysisAs the main objective of the study is to
compare the effectiveness of the Java AppletsMethod of Teaching Locus of a Point in Mathematicsat the Higher Secondary level, it is proposed tocompare the Pre – test and Post-test scores of thestudents in Mathematics when they are taughtusing Java Applets. Null Hypothesis is formulatedas the base for analysis and test of significance ofdifference between means was attempted. The nullhypothesis are rejected or not rejected on the basisof the ‘t’ value.
Analysis and Interpretation of DataAs the main objective of the study is to
compare the effectiveness of the Java AppletsMethod of Teaching Locus of a Point in Mathematicsat the Higher Secondary level, it is proposed tocompare the Pre-Test and Post-Test scores of thestudents in Mathematics when they are taughtusing Java Applets. Null Hypothesis is formulatedas the base for analysis and test of significance ofdifference between means was attempted. The nullhypothesis are rejected or not rejected on the basisof the ‘t’ test value.
Null Hypothesis 1
There is no significant difference between pre –test and post – test scores of control group andexperimental group students.
(At 5% level of significant of the table value of ‘t’is 1.98 )
It is evident from the above table-1 that thet-value is no significant difference between pre-testscores of control group students, but there is asignificant difference between post-test scores ofcontrol group students and experimental group
Research Explorer July - December 2012
Vol . I : Issue. 2 ISSN:2250 - 1940
78
students, but there is significant difference betweenpost-test scores of experimental group studentsat 0.05 level.
Null Hypothesis 2 There is no significant difference between pre –
test and post – test scores of control group andexperimental group students in attainment ofknowledge, understanding, application andskill objectives.
(At 5% level of significant of the table value of ‘t’ is 1.98 )
It is evident from the above table-2 that the t-value is no significant difference between the pre-test scores of control and experimental groupstudents in attainment of knowledge,understanding, application and skill objectives andthere is a significant difference between the post-test scores of control and experimental groupstudents in attainment of knowledge,understanding, application and skill objectives at0.05 level.
Null Hypothesis: 3 There is no significance difference between
control and experimental group students intheir gain scores.
(At 5% level of significant of the table value of ‘t’ is 1.98 )It is evident from the above table-3 that the t-
value is a significant difference between control andexperimental group students in their gain scores.That is, the experimental group students are betterthan the control group students in their gain scores.Hence, the developed Java Applets package iseffective for the XI standard students.
Findings of the studyThere is no significant difference in pre – test
scores of control and experimental group students.
There is significant difference in post – test scoresof control and experimental group students.According to the t-test result the experimentalgroup is better than the control group. This maybe due to the factor that the experimental groupstudents are given exposure on through thedeveloped package. The developed Java Applets hasthe picture and special effects. So it is better.
There is no significant difference between thepre-test scores of control and experimental studentsin attainment of knowledge, understanding,application and skill objectives.
There is significant difference between the post-test scores of control and experimental students inattainment of knowledge, understanding,application and skill objectives.
There is significant difference between controland experimental group students in their groupstudents in their gain scores. That is, theexperimental group students are better than controlgroup students in their gain scores. According tothe t-test result experimental group students arebetter than the control group students. This maybe due to the factor that the experimental groupstudents are given exposure on through thedeveloped Java Applets. The developed Java Appletspackage has the special effects.
ConclusionIn our proposed investigation an experiment on
the effectiveness of Java Applets in teachingMathematics to the XI standard students has beenanalysed and this technology also providessuggestion for empowering the learners which haspotential in promoting learner autonomy.
ABSTRACTPoverty is a problem – a world-wide problem. Poverty was the curse of God-it deprived you of everything:
food, clothing, shelter, your self-respect, your humanity, even your soul. Poverty is a great curse on humanity.Rural poverty, without doubt, is primary cause of rural indebtedness. The rural poor have a negative propensityto save and are thus forced to borrow in order to meet their bare consumption needs.
key words : Poverty , unemployment, income generation, wealth , inflation
Introduction
India today is one of the poorest countries inthe world. Stark poverty exists throughout thecountry. Obviously while unemployment is adefinite source of poverty, the most common causeis underemployment or employment which yieldsless than a bare pittance. There has also been anincrease in the magnitude of rural poverty in almostall states of the Indian union. It must be clearlyrealized that the only objective of economicdevelopment is the elimination of poverty and thenational economic policy must be imbued with apassionate dedication towards attaining this end.
Poverty is a concept of infinite dimensions. Acountry is poor because it is poor. Poverty is anessentially organizational phenomenon. It is notsimply the lack of money. Rural poverty is vastlyexaggerated. Poverty is not a state of being; it isthe effect of dynamic process. Poverty is not onlywidespread but also intense. Poverty is hamperingthe human development.
The present study is concerned with problem ofrural poverty in a village of our country. Poverty isa problem of low income related with productivity,
whether a nation or a people, and its unequaldistribution in both. Indian rural poverty is verymuch historical.
Statement of the ProblemPoverty is interrelated to the problem of
unemployment, income generation, inequality ofincome and wealth and inflation. There is no viablesign to show that any improvement has been madeon these fronts. The primary cause of rural povertyis indebtedness so that problem is faced in thesurvey village. The main focus of the study is tofind the factor responsible for poverty in the surveyvillage. However, the present study is concernedwith non-farm collies, agricultural labourers andothers.
ObjectivesThe main objectives of this present study are as
follows.1. To study the extent of poverty in the survey
village.2. To analyse the reasons for poverty in the study
area.3. To measure the poverty and inequality in the
survey village.
Research ExplorerISSN : 2250 - 1940
Vol I : Issue. 2July - December 2012
Research Explorer July - December 2012
Vol . I : Issue. 2 ISSN:2250 - 1940
80
4. To suggest measures to alleviating poverty inthe village.
Nature and Sources of DateThe value of any research is closely related
to the methods used in the study. Primary dataare collected by direct personnel interview with thehelp of an interview schedule. The secondary dataare collected from the village administrative officer,panchayat office and published books. For ourconvenience 30 households have been taken forour analysis (2012 -2013).
MethodologyThe following methodology is adopted in this
study.
This study is a case study of incidence of poverty.
For assessing the expenditure, saving we haveused percentage, Gini Ratio and Head Count Ratio.
Importance of the StudyThis study helps us to understand the
incidence of poverty among Shanmugapuramvillage, Tiruchendur taluk, Thoothukudi district.Moreover this study explains the sources of incomeand pattern of expenditure of these poor people.Also this study helps us indentify their overalleconomic status and financial position. Finally thisstudy helps us identify the government measuresalready taken up for their betterment.
Profile of the study areaShanmugapuram is my study area which
belongs to Tiruchendur Taluk of Thoothukudidistrict, Tamil Nadu. The total geographical areaof this vi llage is 3 square kilo metre.Shanmugapuram vil lage is a part ofVirapandianpatnam rural Panchayat.Shanmugapuram is a small village. The totalnumber of population is 740. Out of them 430 aremales and 310 are females. The total number ofhouseholds is 280. Here the average size of thehousehold is about 3 person which is very small.
This village is electrified sufficiency. Thisvillage has seven long streets. In this village thereare 29 tube lights and only one sodium light in thestreet. This village has two television roomsprovided by the panchayat. This village has onlyone primary school. In this village there are 67students out of them 33 are boys and 34 are girls.This village has two wells of drinking water, sevenhand pumps and two water tanks. Here transport
facilities are well and good. This village has onlyone Nutritional Meal Centre. Most of the childrenare benefited by it. Besides, only one fair price shop.
The table – 4 clearly explains that 60 per cent ofthe household living above poverty line. Remaining40 per cent of the household living under belowpoverty line. The person below poverty line ismeasured using Head count Ratio.
Gini concentration ratio was computed. The Giniconcentration ratio is 0.23. This confirms that theincome inequality among the four groups ofhouseholds is very less. On the whole, the datasuggest that the income distribution among the fourgroups of households does not show widervariations.
Research Explorer July - December 2012
Vol . I : Issue. 2 ISSN:2250 - 1940
81
H= q/n where, H= Head count Ratio, q=number of people below poverty line, n = the size ofpopulation.
H= 12/30 =0.4 (So, 40 percent of the peopleliving under below poverty line).
Summary of Findings and SuggestionFrom the survey it is understood that the
following are the important factor responsible forpoverty among the households. The low level ofliving, illiteracy, low level of asset holding, seasonalemployment, low per capita expenditure these arethe factors are affected in this survey village. Thefindings and suggestions are presented the followingparagraph.
Majority of the household comes under backward community (96 per cent).
All the households in the study area are Hindus.Most of the households are having more than twochildren. The government family planningprogramme has not reached them. In the groupfifteen to thirty there are sixty seven people whichis more than 38 percentage of total population. Theaverage of family size is 5.83.
The most of the household comes under nuclearfamily (77 per cent). It is being observed that thejoint family system is a way irrespective of pooreconomic conditions and low literacy level.
The survey has included housing pattern. Themajority of the houses are thatched (93 percent).This indicates that most of the families arehaving little better housing condition.
All the households are electrified. 80% per centof the people have own houses.
Majority 60 percent of the people have primarylevel education only. 20 per cent of the respondentsare illiterate.
The survey reveals that the average per capitaconsumption expenditure is low. However, theproportion of food expenditure (74 percent) to thetotal consumption expenditure and the marginalpropensity to consume are very high among thehouseholds.
Non consumption expenditure includes wedding,loan repayment, white washing, donation andothers. 76.86 per cent of the expenditure is spenton loan repayment, 3.44 per cent on wedding, 16.26per cent on white washing and 3.44 per cent ondonation / gift.
Some households save LIC and few are savingwith Post Office and Bank.
Regarding debts whenever they need money tomeet the expenditure for the marriage of the femalechildren, they borrow mainly from money lenderand banks. No one has debt with their friends andrelatives.
Household articles consist of itemssuch as radio, television, cycle, two wheelers andothers. Majority of the households possess cycle,television and radio.
The level of poverty assessed that 40per cent of the households are live in below povertyline.
Most of the people are benefited by thepoverty alleviation programmes such as Indra AwazYojana (IAY) Andhyodaya Anna Yojana (AAY) and80 per cent of the households are benefited by theSelf Help Groups (SHG).
References
1. Awashi S.K., “Focus on Poverty”, KhadiGramadyog, Vol.XXVI, No:4, January 1980.
2. Bhupat F.N. M.Desai and Namboodiri N.V.,“Policy Strategy and Instruments for Poverty”Economic and Political Weekly, Vol. XXXIII, No:41, 10-16 October PP.2669.
3. Joshi V.H., “Rural Poverty in Third World: ARealistic Perception”, Southern Economist,Vol.23, No: 1, May 1984, PP. 33-35.
4. Sudip Kumar Mohapatra, “Poverty Alleviation:Anathema of the Indian Experience”, RBIOccasional Paper, Vol. 18, No. 2&3, June-September, 1997, PP.506.
Research Explorer July - December 2012
Vol . I : Issue. 2 ISSN:2250 - 1940
82
ACTIVITY PARAMETERS OF THE SELECT PAPER MILLS IN TAMIL NADUP.SenthilkumarAssistant Professor,
ABSTRACTPaper is one of the significant discoveries that turned the history of the world around. Paper pervades all
sectors of human activity from books to bullets and from morning newspaper to nuclear technology. From timeimmemorial, paper has played a key role in the evolution of civilization, and the importance of paper and paperproducts in modern life is so obvious that no other product possesses such diversity of use. The government ofIndia regards the paper industry as one of the 35 high priority industries of the country. Under capacityutilization, higher costs of production and financial mismanagement are some of the reasons for inefficiency ofthe paper mills. In this context, the researcher has made an attempt to have an insight into the profitability ofthe paper mills in Tamil Nadu. The researcher has suggested suitable measures to improve the profitabilityposition of the select paper mills.
Key words: Activity ratios, paper industry, operational efficiency, etc.
IntroductionFunds are invested in various assets in business
to earn profits. Better the management of assets,the larger will be the sales and the profits. Financialratios are useful indicators of a firm’s financialperformance. Financial ratios can be used toanalyze trends and compare the firm’s financialsto those of similar firms. Activity ratios indicate howefficiently the firm utilizes its assets. Theysometimes are referred to as efficiency ratios, assetutilization ratios, or asset management ratios. Theseratios are also called ‘turnover ratios’, because theyindicate the speed with which the assets are turnedover into sales.
Statement of the ProblemIndia has been constrained due to high cost of
production caused by inadequate availability andhigh cost of raw materials, power cost, etc. Thesharp rise of prices created a paper crisis in thecountry. Since then, the paper industry has beenengulfed in a crisis due to variety of reasons, led asub-optimal use of installed capacity. The financialperformance of the paper mills has been highlyunsatisfactory despite numerous facilities and fiscalconcessions being provided to them. As on today,
the paper industry is at the crossroads. A corporatefirm must maintain sufficient cash flow to meet itscurrent liabilities. If it fails to maintain adequatecash, it becomes a very serious financial conditioneven i f it generates good profits. Withoutmaintaining sufficient cash, the firm cannot takean independent decision. In this situation, the fateof the firm will be decided by unpaid creditors orfinancial institution whose loan is in default. Hencethe management loses its power; it leads tobankruptcy or forced reconstruction or aninvoluntary takeover. Finally, the owners have tolose their investment. Funds of owners andcreditors are invested in various assets to generatesales and profits. The better the management ofassets are, the larger the amount of sales.Evaluating the operating efficiency with which thefirm manages and utilizes its assets indicates thespeed with which assets are being converted orturned over into sales. A proper balance betweensales and assets generally reflects that assets aremanaged well.
Under capacity utilization, higher costs ofproduction and financial mismanagement are someof the reasons for inefficiency. In particular, papermanufacturing plants have been hit hard by the
Research ExplorerISSN : 2250 - 1940
Vol I : Issue. 2July - December 2012
Research Explorer July - December 2012
Vol . I : Issue. 2 ISSN:2250 - 1940
83
sharp increase of fuel prices. The steep increase infuel oil cost has greatly affected the operation costof the paper mills. The following questions areprobed by the researcher to take up this study: Doesthe corporate firm have adequate cash to pay itsshort term liabilities and also adequate capital tomeet its long term liabilities? Does the corporatefirm have appropriate use of its total assets toincrease sales? And does the corporate firm haveearned sufficient profit to provide dividend to theirshareholders? In this context, the researcher hasmade an attempt to have an insight into the activityparameters of the paper mills in Tamil Nadu.
Objectives of the StudyThe following are the broad objectives of the
study:
1. To study the origin and growth of the paperindustry in India in general and Tamil Nadu inparticular
2. To examine the activity parameters of the papermills in Tamil Nadu
3. To suggest suitable measures to improve theefficiency of the paper mills in Tamil Nadu
Testing of HypothesisThe study is based on the formulation of the
following null hypothesis.
Ho: There is no significant difference in theactivity ratios between the select paper millsin Tamil Nadu.
MethodologyThe study is analytical in nature with a focus
on assessing the activity parameters of the papermills. As on 31.03.2011, there are 8 paper mills inoperation in Tamil Nadu, of which there are onlytwo large-scale paper mills, namely, the Tamil NaduNewsprint and Papers Limited, and SeshasayeePaper and Boards Limited. The two large-scalepaper mills only were selected for the present study.The study is mainly based on secondary data. Thesecondary data were extracted from the publishedannual reports of the select paper mills for a periodof ten years. These reports are the financialstatements, books of accounts, minutes, auditreports, annual reports, and circulars. The datahave been analyzed with the help of differentaccounting and statistical techniques such asratios, student t test, co-efficient of variation andgrowth rates.
Findings
1. A significant difference is found in the stockturnover ratios between TNPL and SPB. Thestock turnover ratio of SPB is satisfactory whencompared with TNPL. There exists aconsistency in the stock turnover ratio in TNPL.SPB has the highest annual growth rate (1.82)followed by TNPL (1.15) over the study period.The linear annual and compound annualgrowth rates of TNPL are 1.31 and 1.32respectively. The SPB has registered negativelinear annual and compound annual growthrates.
2. A significant difference is found in the debtorsturnover ratios between TNPL and SPB. Thedebtors turnover ratio of SPB is satisfactorywhen compared with TNPL. There is asteadiness in the debtors turnover ratio in SPBover the study period. TNPL has registered thehighest annual, linear annual and compoundannual growth rates at 3.54, 3.33 and 3.31respectively. The annual, linear annual andcompound annual growth rates of SPB are 2.05,2.73 and 2.64 respectively.
3. There is a significant difference in the creditorsturnover ratios between TNPL and SPB. Thecreditors turnover ratio of TNPL shows itsefficiency in payable management. There existsa consistency in the creditors turnover ratio ofSPB. It has also registered the highest annual,linear annual and compound annual growthrates at 19.11, 2.57 and 4.62 respectively.Whereas TNPL has registered negative linearannual and compound annual growth ratesduring the study period.
4. No significant difference is found in the workingcapital turnover ratios between TNPL and SPB.The working capital turnover ratio of the SPBis satisfactory during the study period. Thereis stability in the working capital turnover ratioof the SPB. TNPL has registered highest annual,linear annual and compound annual growthrates at 11.86, 3.00 and 2.25 respectively. Onthe other hand, SPB has registered negativeannual, linear annual and compound annualgrowth rates during the study period.
5. There is a significant difference in the cashturnover ratios between TNPL and SPB. Theaverage cash turnover ratio of TNPL is
Research Explorer July - December 2012
Vol . I : Issue. 2 ISSN:2250 - 1940
84
satisfactory and it shows its efficiency in cashmanagement. There exists a consistency in thecash turnover ratio of TNPL. TNPL hasregistered the highest annual, liner average andcompound annual growth rates at 33.56, 13.29and 15.61 respectively. The annual, linerannual and compound annual growth rates ofSPB are 23.82, 2.81 and 0.70 respectively.
6. A significant difference is found in the averagecollection period between TNPL and SPB. Theaverage collection period of SPB reveals itsefficiency in receivable management. Thevariation in the average collection period isfound to be high in TNPL (20.63%) followed bySPB (14.18%). There exists a consistency in theaverage collection period of SPB. The annualgrowth rate of TNPL is high (1.38) followed bySPB (0.33). In case of linear annual andcompound annual growth rates both TNPL andSPB register negative growth rates.
7. There is no significant difference in the averagepayment period between TNPL and SPB. Thereis no vast difference found in the averagepayment period of the select paper mills. Thereexists steadiness in the average payment periodof SPB. TNPL has registered the highest annual,linear annual and compound annual growthrates at 98.85, 27.94 and 21.53 respectively.On the other hand, SPB has registered negativeannual, linear annual and compound annualgrowth rates at 5.66, 7.46 and 4.42 respectively.
8. A significant difference is found in the totalassets turnover ratio between TNPL and SPB.The average total assets turnover ratio is foundto be unsatisfactory in the select paper millsand it reveals idle capacity of the total assets.There is consistency in the total assets turnoverratio in TNPL. Both TNPL and SPB haveregistered negative annual, linear annual andcompound annual growth rates of total assetsturnover ratio.
9. There is a significant difference in the fixedassets turnover ratios between TNPL and SPB.The mean fixed assets turnover ratio of SPB issatisfactory when compared with TNPL. Thereis consistency in the fixed assets turnover ratioin TNPL. Both TNPL and SPB have registeredthe highest annual, l inear annual andcompound annual growth rates during thestudy period.
10. No significant difference is found in the capitalturnover ratios between TNPL and SPB. Theaverage capital turnover ratio of SPB is foundto be satisfactory when compared with TNPL.There is a consistency in the capital turnoverratio of SPB during the study period. Both TNPLand SPB have registered negative annual, linearannual and compound annual growth rates.
11. Debtors turnover ratio at 1% level and workingcapital turnover ratio at 5% leve l havesignificant correlation coefficients with stockturnover ratio in TNPL. Debtors turnover ratiowith working capital turnover ratio, and totalassets turnover ratio with fixed assets turnoverratio have significant correlation at 1% level.Cash turnover ratio of TNPL has significantnegative correlation with fixed assets turnoverratio at 5% level. Working capital turnover ratioand fixed assets turnover ratio have significantcorrelation coefficient with creditors turnoverratio at 5% level. There is a significantcorrelation between the creditors turnover ratioand total assets turnover ratio of TNPL at 1%significance.
12. The stock turnover ratio of SPB has significantcorrelation with cash turnover ratio at 5% levelof significance. Debtors turnover ratio hassignificant correlation coefficients with workingcapital turnover ratio, cash turnover ratio andtotal assets turnover ratio at 5% level ofsignificance. There is a significant correlationco-efficient between working capital turnoverratio and capital turnover ratio at 5% level ofsignificance. Total assets turnover ratio hassignificant correlation coefficients with fixedassets turnover ratio and capital turnover ratioat 1% level of significance. A significantcorrelation co-efficient is found between thefixed assets turnover ratio and capital turnoverratio of SPB at 1% level of significance.
Suggestions
1. Management of accounts payable is as muchimportant as management of accountsreceivable. The underlying objective in case ofaccounts rece ivable is to maximize theacceleration of the collection process, theobjective in case of accounts payable is to slowdown the payment process. It is surprising tonote that the mean of the average collection
Research Explorer July - December 2012
Vol . I : Issue. 2 ISSN:2250 - 1940
85
period of SPB is 39.05days whereas it takes117.99 days for payment to the creditors. Itimplies that SPB is delaying payment tocreditors. It will affect the reputation of SPB. Itis to suggest that SPB may take necessaryefforts to pay the creditors in-time.
2. The main objective of inventory management isto identify and achieve efficient production andavoidance of production stoppages. Theinvestment in inventory is influenced mainly bythe production policies and the inventory costs.Since the stock turnover ratio of TNPL is notsatisfactory, norms both for the consumptionand stocking of raw materials should be framedand the limits should never be exceeded.Reduction of overstocking of inventory,especially bagassee, requires organizational,procedural and structural improvements.Organizationally, TNPL has to maintain anintegrated and distinctive department formanagement of inventory and it can work inliaison with the finance department. As regardsthe procedural improvements, theadministrative delays and procurement leadtime in purchasing materials have to benecessarily curtailed. To this end, a committeeconsisting of production manager, storesmanager and financial manager has to beformed to purchase required raw materials.
3. The major goal of the cash management is toidentify the shortages and surpluses of cashbalances. Since the cash turnover ratio of SPBis not satisfactory, the widely used methods ofcontrolling cash, such as periodical review andreporting of cash available and cashrequirements, efforts for collection of receivablesand staggering payments, daily review of cashbalances, comparing the actual expenditurewith budgets, and maintaining cash balances.By virtue of cash credit arrangements withcommercial banks, SPB can rule out thepossibility of surplus and deficit situations.Further, SPB can prepare the cash flowstatements separately for “capital” and“revenue” operations. Capital expenditurebudgets can be prepared with reference to thedelivery dates/installments due againstpurchase of fixed assets. Revenue expenditurebudgets should be prepared with reference tothe annual plan of operations.
4. The inadequacy of working capital may bringthe entire business operation to a grinding halt,since it is the inability of enterprises to pay theoperational expenditure. Realizing theimportance of efficient management of workingcapital, the select paper mills, particularlyTNPL, can employ various control techniquesof working capital, namely, budgetary control,establishing norms for working capitalcomponents and use of operating cycle. Whenthe budgetary control technique is adopted,sales or production shall be the key factor. Thebudgetary standard is to be revised on aquarterly basis based on past performance andcurrent market price. The technique ofoperating cycle can also be given dueimportance. Effective use of operating cycleeliminates to a largest extent, unnecessaryblocking of funds in various current assets inthe select paper mills.
ConclusionAn attempt has been made in this study to
measure the activity position of the select papermills. A significant difference is found in the stockturnover ratio, debtors turnover ratio, creditorsturnover ratio, cash turnover ratio, averagecollection period and total assets turnover ratiobetween the select paper mills in Tamil Nadu. Onthe other hand, no significant relationship is foundin the working capital turnover ratio, averagepayment period, fixed assets turnover ratio andcapital turnover ratio between TNPL and SPB. Thereexists a consistency in the stock turnover ratio,cash turnover ratio, total assets turnover ratio andfixed assets turnover ratio of the TNPL over theyears. Consistency is found to be high in the debtorsturnover ratio, creditors turnover ratio, workingcapital turnover ratio, average collection period,average payment period and capital turnover ratioof the SPB during the study period.
References Agarwal, J.D (1991). Goal Programming Model for
Working Capital Management (Analysis & Cases) ,Jaipur: Research Development Association.
Alka Subramanian (1987). “Small is not Beautiful:A Study of Paper Industry”, Economic and PoliticalWeekly, Vol.XXII, No.35, August.
Banerjee Bhabathosh (1979). “Working Capital andTurnover Rat ios and Cash Management”, TheManagement Accountant, January.
Research Explorer July - December 2012
Vol . I : Issue. 2 ISSN:2250 - 1940
86
Khan, A. Q and Mohammed Tufail Khan (1990).“Paper Industry: An Appraisal”, Yojana , Vol.34,No.11, June.
Khetan, V.N (1979). “Shortage of Raw Material”,Commerce, Vol.139, No.3569, November.
Madhu Sehgal (1997). “Paper Industry”, PNBMonthly Review, June 1.
Parasuram (2004). “Working Capital Practices inLeading Pharmaceutical Companies: A View of theCredit Policy and Profitability”, The ManagementAccountant, Vol.39, No.12.
Paul Welter (1970). “How to Calculate SavingsPossible through Reduction of Working Capital”,Finance Executive, October.
Pesendorfer Martin (2003). “Horizontal Mergers inthe Paper Industry”, Journal of Economics, Vol.34,No.3.
Pushpalatha, M.M (1986). “Performance of PaperIndustry: A Micro Level Study of BhadrachalamPaper Board”, SEDME, Vol.XII, No.3.
Rao, K.V and Chinta Rao, N (1991). “EvaluatingEfficiency of Working Capital Management: Arethe Conventional Techniques Adequate”,Decision, Vol.18, No.2, April-June.
Sankar, T.L and Sai, S.S.T (1990). “Private andPublic Sector: A Comparative Study of theirFinancial Efficiency during 1986-87 and 1988-89”, Journal of Institute of Public Enterprises,Vol.13, No.4.
Santanu Ghosh and Santi Gopal Maji (2004).“Working Capital Management Efficiency: AStudy on the Indian Cement Industry”, TheManagement Accountant, Vol.37, No.5.
Sivaram Reddy, C and Mohan Reddy, P (1989).“Indian Paper Industry: Problems andProspects”, Indian Journal Marketing, Vol.XIX,Nos. 6 &7, February-March.
Sukamal Datta (1995). “Working CapitalManagement through Financial Statements:Analysis of Paper Industry in West Bengal”, TheManagement Accountant, November.
VIDYAA VIKAS COLLEGE OF ENGINEERING AND TECHNOLOGYTIRUCHENGODE – 637 214.
DEPARTMENT OF MANAGEMENT STUDIES&
INDIAN ACADEMIC RESEARCHERS ASSOCIATION(Unit of SELP TRUST)
SponsoredA NATIONAL CONFERENCE
ONOPPORTUNITIES AND CHALLENGES OF CONTEMPORARY MANAGEMENT
PRACTICES IN INDIAN ARENAon 29.09.2012
The main objective of the conference is to instillthe ideas of the participants about the opportunitiesand challenges of Contemporary managementpractices in Indian arena by focusing on the keyareas like Marketing, Finance, Human ResourceManagement and Information Technology, etc.
Academicians, Research Scholars, Students andinterested corporate persons may sent the paper tothe conference convener.
Papers should be 5-8 pages in 1.5 line space in12pt Times New Romen with 150-200 wordsabstract and 4-6 key words.
Selected papers may be published in the specialvolume of SELP JOURNAL OF SOCIAL SCIENCE(ISSN : 0975-9999) and International Journal onRESERACH EXPLORER (ISSN : 2250-1940).
Important DateLast Date for Abstract : 27.08.2012Last Date for Full Paper : 08.09.2012
CUSTOMER ACQUISITION FOR ONLINE SHOPSRev.Fr.Dr.D.Maria Antony Raj SDBVice-Principal & Controller of Examinations
Sacred Heart College (Autonomous)Tirupattur – 635601
ABSTRACT Online shops are grooming day by day with the help of fast paced technology. This has led to innovations
in acquiring the customers too. This study aims at perceptions of the consumers on online shopping and theirbehavior towards it. The study was conducted with the customers of online stores. The customers were testedfor their significance level based on various opinions. The study found that there is no significance betweenthe friends’ motivation and recommending the shops. The study used chi-square and correlation to explainthe findings.
Keywords: online shops, prospects, service, e-shop, internet, website, web store.
IntroductionOnline shopping is the process where by
consumers directly buy goods or services from aseller in real-time, without an intermediary service,over the Internet. It is a form of electroniccommerce. An online shop, e-shop, e-store, internetshop, web shop, web store, online store, or virtualstore evokes the physical analogy ofbuying products or services at a bricks-and-mortarretailer or in a shopping center. The process iscalled Business-to-Consumer (B2C) onlineshopping. When a business buys from anotherbusiness it is called Business-to-Business (B2B)online shopping (E Shops, 2012).
In recent years, online shopping has becomepopular; however, it still caters to the middle andupper class. In order to shop online, one must beable to have access to a computer, a bank accountand a debit card. Shopping has evolved with thegrowth of technology. According to research foundin the Journal of Electronic Commerce, if onefocuses on the demographic characteristics of thein-home shopper, in general, the higher the level ofeducation, income, and occupation of the head ofthe household, the more favorable the perceptionof non-store shopping (Patel). The Impact ofInternet User Shopping Patterns and Demographics
on Consumer Mobile Buying Behaviour. Journalof Electronic Commerce Research, An influentialfactor in consumer attitude towards non-storeshopping is exposure to technology, since it hasbeen demonstrated that increased exposure totechnology increases the probability of developingfavorable attitudes towards new shopping channels.
Consumers find a product of interest by visitingthe website of the retailer directly, or do a searchacross many different vendors using a shoppingsearch engine. Once a particular product has beenfound on the web site of the seller, most onlineretailers use shopping cart software to allow theconsumer to accumulate multiple items and toadjust quantities, by analogy with filling a physicalshopping cart or basket in a conventional store. Acheckout process follows in which payment anddelivery information is collected, if necessary.
Online shoppers commonly use credit card tomake payments, however some systems enableusers to create accounts and pay by alternativemeans, such as: Billing to mobile phones andlandlines, Cash on delivery (C.O.D., offered by veryfew online stores), Cheque, Debit card, Direct debitin some countries, Electronic money of varioustypes, Gift cards, Postal money order & Wiretransfer/delivery on payment.
Research ExplorerISSN : 2250 - 1940
Vol I : Issue. 2July - December 2012
Research Explorer July - December 2012
Vol . I : Issue. 2 ISSN:2250 - 1940
88
Some sites will not accept international creditcards, some require both the purchaser’s billingaddress and shipping address to be in the samecountry in which site does its business, and stillother sites allow customers from anywhere to sendgifts anywhere. The financial part of a transactionmight be processed in real time.
Once a payment has been accepted the goods orservices can be delivered in the following ways:Downloading, Drop shipping, In-store pickup,Printing out, Shipping, Will call, COBO (in Care OfBox Office), or “at the door” pickup
Objectives of The Study
To identify the online shopping problem andprospects.
To assess the level of consumer preferencetowards online shopping.
To assess the level of satisfaction of consumersin using the online shopping.
To know about the problems faced by consumersthrough online shopping.
Research MethodologyThe primary data is collected from the various
Respondents using Questionnaire, Direct Interviewmethods, Telephonic Interview and Through E-mail.The secondary data was Web sources, Journals andmagazines. The sample size was 75 consumersthose who purchased online. The analysis partincluded percentage analysis, chi square andcorrelation.
Data Analysis & InterpretationThe data was analysed by using the collected
data from 57 male and 18 female respondents. Therespondents were then classified as below 30 years,31 to 40 years, 41-60 years and above 61 years.Majority of the respondents were in the age groupof 31-40 years. 61% of the respondent hadqualified under graduation and interestingly 3% ofthem were illiterate.
Hypothesis:H01 : There is no significant relationship between
the quality of online shopping and recommend ourservice to friends.
H11: There is significant relationship betweenthe quality of online shopping and recommend theirservice to friends.
Chi – Square Test ValueLevel of Degrees Table Calculated
Significance Freedom Value Value
5% 16 26.3 18.695
Hence the null hypothesis is accepted and it isconcluded that there is no significant relationshipbetween the quality of online shopping andrecommend our service to friends.
H02: There is no significant relationship betweenthe utility of online shopping and buy productsthrough online shopping.
H12: There is significant relationship betweenthe utility of online shopping and buy productsthrough online shopping.
Level of Degrees Table CalculatedSignificance Freedom Value Value
5% 9 16.9 14.32Hence the null hypothesis is accepted and it is
concluded that there is no significant relationshipbetween the utility of the online shopping and buyproducts through online shopping.
Correlation Analysis
To compare the relationship between theUtility of the online shopping and Buyproducts through online average
Utility of theonline shopping (x) 29 13 16 17
Buy products throughonline average(y) 21 13 18 23
r = 0.55
Hence the positive correlation between utility ofthe online shopping and buy products throughonline an average.
Findings76% of the respondents are male. 42% of the
respondents belonged to 31-40 age category. 39%of the respondents’ educational qualification is onlyU.G. 48% of the respondents are business man.41% of the respondents monthly income are Rs10,001-20,000/- . 37% of the respondents’ residencein urban area. 39% of the respondents are usingonline shopping for save the time. 31% of therespondents are to know about through
Research Explorer July - December 2012
Vol . I : Issue. 2 ISSN:2250 - 1940
89
advertisement. 36% of the respondents arefrequently access to the internet through home.43% of the respondents are spending on online from11 to 15 hours. 36% of the respondents are usinginternet since 6 to 10 years. 40% of the respondentsare said access shopping websites is fairlyimportant. 72% of the respondents are purchaseor using online banking. The respondents are buyproducts through online once in two months.Majority of the respondents are using Debit cardto settle the payment for online Shopping. 37% ofrespondents are agree about all time shoppingaccessibility the factors influencing onlineshopping decision. 33% of the respondents areagreeing about promotion and advertisement thefactors influencing online shopping decision. 28%of the respondents are agreeing about variety ofglobally products the factors influencing onlineshopping decision. 43% of the respondents aredisagree about website provide sufficient productinformation and explanation. 40% of therespondents are very likely about to recommendservice to friend.
RecommendationsThe online sellers should focus on advertisement
as well as maintain good relation betweenconsumers. In the website, the company shouldshow the exact details of the products instead ofshowing the attractive picture. Company has tofocus on all levels of consumers. The companyshould try to achieve the market leadership byproviding quality service to the consumers. Thecompany should provide right service to rightconsumer at right time. The company shouldconvince the consumers to serve the service fromthem without any doubt. From the research study,it has been found that the Consumers are veryparticular about the Service.
ConclusionIt can be noted that most of the consumers are
dissatisfied by the service. Like; the companyshould maintain exact details of their company onwebsite, to attract more consumers by showingmore advertisements, to maintain more goodrelationship with the consumers, the companyshould resolve the problems of consumers to retainthem in future as well, the company shouldunderstand about their competitors and theirstrategy, Finally; as soon as possible to solve theproblem and prospects on on-line shopping in everyfield. The study concluded that the providingadequate services and various offers to attract moreconsumers to buy products through onlineshopping.
BibliographyND Vohra (2008)’Quantitative Technique in
Management-Third Edition, TATA McGraw – Hillpublishing company Ltd. New Delhi-PP-605-630
Richard L. Levin & David S. Rubin(2008)’Statistics for management’(Seventh Edition 2008),NEW DELHI Panchsheel park ch.14, PP-110-017
S.C.Gupta and V.K Kapoor (2001)’Elements ofMathematical Statistics-Third Edition, NEWDELHI; Sultan Chand Publication, ch.13, PP.334-350.
tapan kumar panda(2008) ’MarketingManagement-Seventh Edition, NEW DELHI-pp-684-554
E Shops. (n.d.). Retrieved August 24, 2012, fromPolaris Systems: http://www.polarisystems.com/?lang=en&p=eShops
Patel, M. (n.d.). Better Understanding Of OnlineSales. Retrieved 2012, from articlecity: http://www.articlecity.com/articles/online_business/article_6745.shtml
SELP PUBLICATION
SELP Trust established the publication division in the name of SELP Publicationdevoted to education and research with the ISBN and published 20 educationalbooks and propose to publish 50 books in a calendar year 2012.So, if you have aproposal or manuscript (Including edited volume) in your area of specialization, pleasecontact or write to us. we are happy to publish your books with ISBN.
Research Explorer July - December 2012
Vol . I : Issue. 2 ISSN:2250 - 1940
90
A STUDY OF THE IMPACT ON CUSTOMER SATISFACTION OF SERVICEQUALITY OF INDIAN OVERSEAS BANK IN TIRUCHIRAPALLI
Dr.E.Mubarak AliAssociate Professor
Dept. of Commerce, Jamal Mohamed College, Tiruchi -21
ABSTRACTCustomer satisfaction has emerged as an important goal to be pursued by all the business units throughout
the World. This has become an imperative need because of acute competition among the business firms. Eachfirm wants to make their customers to believe that the products or services offered by them to its customers areunique and different from ones of its competitors. Making the customers totally satisfied has thus becomeessential for business units including the commercial banks for their survival and growth. As the banks areproviders of services, a study of their service quality of the latter in the promotion of customer satisfaction hasbecome important to the banks to retain to its fold the existing customers and entice the newer ones.
Key words: Customer satisfaction, banking services, information technology
IntroductionBanking is the lifeline of the nation and its
people. Banking has helped in developing the vitalsectors of the economy and ushered in a new dawnof progress on the Indian horizon. In the initialstages, it was simply conventional functions whichwere in vogue: accepting of deposits, lending andoffering other allied services like remittances, safecustody, travelers’ cheques, issue of guarantees andletters of credit for business purposes. In this eraof mature and intense competitive pressures, it isimperative that banks maintain a loyal customerbase. In order to achieve this and improve theirmarket and profit positions, many banks aredirecting their strategies towards increasingcustomer satisfaction and loyalty through improvedservice quality.
Research objectivesThe objectives of the present study are to find
out the relationship between service qualityattributes and customer satisfaction in IndianOverseas Bank in Tiruchirapalli district.
1. To study the attitudinal behavior of employeestowards their customers.
2. To rank the levels of satisfaction obtained fromthree service quality dimensions employed inthe study.
3. To find out whether the bank employees havesufficient knowledge to help customers seekinginformation.
Service QualityThe dimensions of service quality propounded
by Parasuraman and his colleagues relate generallyto all types of service industries including banking,researchers on this subject in the banking industryhave spelt out certain dimensions applicablespecifically to banking industry. Manoj K.Trivediand Shirish Mishra classified the types of servicesinto two groups: high – tech, low-touch and low-tech, high touch. Another classificationspeaks of the quality of banking services havingtwo dimensions: Technical and Functional. Yetanother set of functional dimension propoundedin the context of banking industry is quantitativeand non-quantitative quality of services. Whatevermay be the jargon used by the writers on themeasurement of service quality, the fact remainsthat the survey research instrument called
Research ExplorerISSN : 2250 - 1940
Vol I : Issue. 2July - December 2012
Research Explorer July - December 2012
Vol . I : Issue. 2 ISSN:2250 - 1940
91
SERVQUAL developed by Parasuraman, Valerie,Zeithmal and Berry remains the source of variousdevelopments and ramifications in the literature ofthe measurement of service quality. An importantadvantage of the SERVQUAL instrument is that ithas been proved valid and reliable across a largenumber of service contexts. It has been suggestedthat for some services the SERVQUAL instrumentneeds considerable adaptation and that items usedto measure service quality should reflect the specificservice setting under investigation, and that it isnecessary in this regard to modify some of the itemsand add or delete items as required.
2.2 Customer Satisfaction in the BankingIndustry
Satisfaction with banking services is an area ofgrowing interest to researchers and managers. Thecommercial banking industry like many otherfinancial service industries is facing a rapidlychanging market, new technologies, economicuncertainties and fierce competition along with anunprecedented set of challenges. This studyinvestigates relationship dimensions and studiesthe perception of customers with respect to servicesprovided by the Indian Overseas Bank inTiruchirapalli.
The service industries are mostly customerdriven and their survival in competitive environmentlargely depends on quality of the service providedby them. In this context, quality of service furnishedby banking sector is very important and profitabilityof their business is closely connected to the qualityof service they render .Businesses seeking toimprove profitability are, thus, advised to monitorand make improvements to their service quality onan ongoing basis. Technology plays a vital role inimproving the quality of services provided by thebusiness units. Without any doubt, service qualityis gaining more importance in banking industry.Both the marketing and service managementliteratures suggest that there is strong theoreticalunderpinning among customer satisfaction,customer loyalty and profitability. Hence, customersatisfaction is composed of a wide variety ofdimensions. Thus, consumer satisfaction thusreveals the general evaluation of the actions carriedout by a given business in relation to expectationsaccumulated after various contact between theconsumer and business. If customers perceive thatthey are obtaining additional benefits from theirrelationship with establishment employees, their
satisfaction level with the service provider willincrease.
Quality Instruments used for the StudyThe present work depends mostly on
SERVQUAL instruments to assess the effect on thecustomer satisfaction of service quality at theIndian Overseas Bank at Tiruchirapalli District. Assuch the questionnaire has all the major items thatcome under each one of SERVQUAL dimensions.The number of questions administered on therespondents, besides the ones on their personalprofile, accordingly, comes to 16
Hypotheses developmentThe hypotheses designed for this paper is based
on the following assumptions:
H1: There is a positive association betweenConvenience and customer satisfaction.
H2: There is a positive association betweenCompetence and customer satisfaction
H3 : There is a positive association betweenResponsiveness and customer satisfaction
MethodologyAn IOB branch at the metropolitan area of
Tiruchy has been chosen for the purpose of study.A questionnaire was designed on the basis of thestudy of researchers such as who identified fivedimensions of service quality: tangible, reliability,responsiveness, assurance and empathy.Parasuraman et al., indicates that service qualityconsists of eleven dimensions: re liabil ity,competence, responsiveness, access, courtesy,communication, credibility, security, competence,tangibles, and understanding of customer.Reliability is considered as essential dimension ofservice quality. Stafford (1996), focused oncustomer services on seven dimensions, such asrelationships, bank atmosphere, rates and charges,ATM, available and convenient services, facilitiesof bank counter (tellers), and honesty/reliability ofbank personnel.
Descriptive statistics for each studyconstructs
It is seen from the Table Competence ranges from1 to 5 with the Mean of 2.02, and the StandardDeviation of 0.34. Convenience ranges from 1 to 5and the Mean and Standard Deviation is 4.59 and1.09, respectively. For Responsiveness, Mean andstandard Deviation is 3.12 and 0.32 respectively
Research Explorer July - December 2012
Vol . I : Issue. 2 ISSN:2250 - 1940
92
with the minimum and maximum value rangesfrom 1 to 4. It has been observed in the Table thatalmost all the Mean are similar. High standarddeviation indicates that the data is wide spread,which means that customer give a variety ofopinion, whereas, low standard deviation meansthat they express close opinion.
Table 1. Background of respondentsProfile Respondents PercentageGender Male 50%
Hypotheses testA correlation coefficient is a statistical tool used
to summaries the relationship between twovariables with a single number that falls between -1.00 and +1.00 (Welkowitz et al., 2006). Morgan etal. (2004) stated that: -1.0 indicates perfect negativecorrelation, 0.0 indicate no correlation, and + 1.00shows perfect positive correlation. The Pearsoncorrelation analysis obtained from the five intervalsscaled variables in the Table 3. The sample size(N) is 276 and the significant level is 0.01 (pd”0.01).
Hypothesis 1: CompetenceIn the Table 3, it can be seen that the correlation
(r) of competence is 0.245 and the significant levelis 0.01. It can be seen from Table 3 that the p-value is 0.000, which is less than 0.01. Therefore,we accept the null hypothesis, and concluded thatthere is moderate but positive (r = 0.245)relationship between competence and customersatisfaction.
Hypothesis 2: ConvenienceThe Table 3 shows that the correlation (r) is
0.343 for reliability and the p-value is 0.000, whichis less than the significant level 0.01. Hence, the
null hypothesis is accepted and concluded thatthere is large positive correlation betweenconvenience and customer satisfaction.
Hypothesis 3: ResponsivenessAccording to the Table 3, the strongest predictor
of customer satisfaction is responsiveness. Theresult indicates that the correlation (r) ofresponsiveness is 0. 765 and p-value is 0.000,which is less than 0.01. Therefore, the nullhypothesis is accepted and concluded that there isstrong positive correlation between responsivenessand customer.
Summary of the null hypotheses testH1 There is a positive association
between convenience and Acceptedcustomer satisfaction
H2 There is a positive associationbetween Competence and Acceptedcustomer satisfaction.
H3 There is a positive associationbetween responsiveness and Acceptedcustomer satisfaction
ConclusionThe above discussion indicates that customer
satisfaction vary according to the nature of service.In this case, the highest customer satisfaction isdemonstrated in the responsiveness area such aswillingness to help customer, friendly attitude ofstaff, followed by the reliability area such ascustomer guidance, customer support. On the otherhand, the moderate satisfactions are in theconvenience factor such as banks business timingand return on investment. Due to the wide variationof the responses the banks need to consider theweak areas in order to meet customer requirements.
References1. Apte Govind , Service Marketing : Oxford University Press2. Avkiran, N.K.(1999), “Quality customer service demands
human contact”, International Journal of Bank Marketing,17,2,61-71.
3. Berry, L.L (1981) ‘The employees as a customer’, Journal ofRetail Banking, Vol-3 No-1, pp-33-40
4. Bolton, R.N.and Drew, J.H.(1991),”A longitudinal analysisof the impact of service changes on customer attitudes”,Journal of Marketing, Vol.55, pp.1-9.
5. Clement Sudhahar .J and M.Selvam, “Service Quality ScaleDevelopment in Indian Retail Banking Sector: An EmpiricalInvestigation”, 2007 , Journal of Applied Sciences.
6. Kasper, H Van Helsdingen P and de Vries Jr W (1999) ‘Service Marketing Management’ Wiley, Chichester
7. Khader, S A (1997), “Total Quality Management and Beyond,Management and Productivity Enhancement-NewApproaches”, Asian Productivity Organization, Tokyo, pp.30-72.
Research Explorer July - December 2012
Vol . I : Issue. 2 ISSN:2250 - 1940
93
EFFICIENCY OF WORKING CAPITAL AND CORPORATE PROFITABILITYDr.C.RajendranAssistant Professor,
PG & Research Department of CommenceGovernment Arts College (Autonomous), Salem-7, Tamil Nadu
ABSTRACTEfficient management of working capital is, thus, an important indicator of sound health of an organization
which requires reduction of unnecessary blocking of capital in order to bring down the cost of financing. Itis therefore felt that there is a need to study the role of working capital in profit generating process. If acompany desires to take a greater risk for bigger profits, it reduces the size of its working capital in relationto its sales.
key words : working capital, liquidity , profitability, profitable venture
IntroductionFirms are expected to maintain a balance
between liquidity and profitability while conductingits day to day operations. Liquidity is a qualificationto ensure that firms are able to meet its short-termcommitment and its continued flow can beguaranteed from a profitable venture. Theimportance of working capital as an indicator ofcontinuing financial health should not be surprisingin view of its crucial role within the business. Thisrequires that business must be run both efficientlyand profitably. On the other hand, too much focuson liquidity will be at the expense of profitability.Thus, the manager of a business entity is in adilemma of achieving desired trade off betweenliquidity and profitability in order to maximize thevalue of a firm. In this perspective this article isdevoted to analyse the impact of working capitalon profitability of the two leading private sectorcement companies in Tamil Nadu viz., IndiaCements Ltd.,(ICL) and Madras Cements Ltd.,(MCL)during the period from 1996/97 to 2010/11. Assuch, the objective of this study is to identify therelationship between working capital variables andprofitability by using regression. The workingcapital variables explaining the variations inprofitability are selected on the basis of the existingtheories and relevant empirical works.
MethodologyThe methodology adopted in the present study
regarding selection of sample, period of study, datasources, analysis and interpretation of data hasbeen presented below.
Selection of samplesThere are 33 major cement companies in India.
Of these 22 cement companies have their plants inSouth India and among them two leading cementcompanies have their origin in Tamil Nadu. Theyare India Cements Ltd. and Madras Cements Ltd.The data related to these two companies have beencollected for the study on the impact of workingcapital on Profitability.
Period of studyThe present study covers a period of 15 years
from 1996/97 to 2010/11 in order to analyse theimpact of working capital on profitability of the twoselected companies. There is no significant reasonin selecting period except the availability of dataconsistently.Data source
The study is mainly based on secondary data.The data related to the working capital andprofitability of the selected cement companies havebeen obtained from CMIE (Centre for Monitoring
Research ExplorerISSN : 2250 - 1940
Vol I : Issue. 2July - December 2012
Research Explorer July - December 2012
Vol . I : Issue. 2 ISSN:2250 - 1940
94
Indian Economy), Mumbai, India for the period from1996/97 to 2010/11.
Data analysis
The impact of working capital on profitability ofthe selected cement companies have been analyzedby using regression. In order to estimate the degreeand extent of inter - relationship between adependent variable and the number of independentvariables, the multiple linear regression equationhas been used as under
y= a+b1 x1+b2 x2+b3+bnxn
Where y = dependent variable
x = independent variable
a = regression constant
b = regression co efficient value
The regression co efficient and the overallvariances are tested respectively by computingvalues and F-ratios. The goodness of the fit of theestimated equation is worked out with the help ofR square. The regression functions for thedeterminants of working capital are estimated forboth ICL and MCL individually. The regression co-efficient has been tested for their significance at 1per cent, 5 per cent and 10 per cent levelsrespectively.
The higher the ratio, the greater the efficiency offunds employed in Debtors and consequently lessinvestment in debtors is needed. The higher theratio, is the higher the WCTR and vice versa.
Empirical Analysis
To analyse the impact of working capital onprofitability of the two leading cement companiesin Tamil Nadu, the linear regression technique isused.
Hypothesis
The following research questions are raised toframe the hypothesis.
i) How does working capital turnover ratio affectprofitability?
ii) How do the liquidity ratios influence profitability?
iii) How do the inventory turnover ratio and debtors’turnover ratio affect Profitability?
Corresponding to the questions, the followinghypotheses are formulated :
i) Profitability is an increasing function of working
capital turnover ratio.
ii) Profitability is a decreasing function of liquidityratios such as current ratio and liquid ratio.
iii) Profitability increases with increase in inventoryturnover ratio and debtors’ turnover ratio.
Profitability functions:
Regarding the questions cited earlier, an attemptis made to answer by using the multiple regressionframeworks. The profitability function is estimatedon the basis of the ordinary least square methodas shown below
P= f (GWCTR/NWCTR, CR, LR, ITR, DTR)
Where P = profitability measures in terms ofROCE and ROTA
ROCE = Return on capital employed
ROTA = Return on total assets
GWCTR= Gross working capital turnover ratio
NWCTR=Net working capital turnover ratio
CR = Current ratio
LR = Liquid ratio
ITR = Inventory turnover ratio
DTR = Debtors turnover ratio
Specification of variables
a) The co-efficient of WCTR is expected to bepositive. It implies that the Increase in WCTRwould tend to increase the profitability.
b) As per the accepted theory as well as the previousstudies, the co-efficient of liquidity measuredin terms of current ratio and liquid ratio shouldbe negatively related to profitability. It indicatesthat the increase in liquidity ratio would tendto decrease the profitability.
c) The coefficient of inventory turnover ratio anddebtors’ turnover ratio should be positivelyrelated to profitability. It means that theincrease in inventory turnover ratio and debtors’turnover ratio would lead to increaseprofitability.
Results and discussion:
The regression functions for profitability in eachselected cement company are now estimated todetermine the variables explaining variations inprofitability in terms of ROCE and ROTA.
Research Explorer July - December 2012
Vol . I : Issue. 2 ISSN:2250 - 1940
95
Profitability model-1The profitability Model 1 has been constructed
by using the variable viz., NWCTR, CR, LR, ITRand DTR as under:
P = a + b1 NWCTR + b2 CR + b3LR + b4 ITR +b5
DTR – Model 1
P denotes profitability in terms of ROCE andROTA The estimated regression results of theprofitability Model 1 for the selected two cementcompanies during the period 1996/97 – 2010/11are summarised in Table 1.
Table 1 Regression Function forProfitability-Model 1 (1996 / 97 to 2010 /11 )P = f (a+b1 NCWTR +b2 CR+b3 LR +b4 ITR +b5 DTR )
Note: Figures in parenthesis are computed ‘t’ value.Significant level: * 1 percent * * 5 percent * * * 10 percent level.Source: Centre for Monitoring Indian Economy(CMIE), Mumbai,India.
It is clear from this Table that the estimatedregression function is found statistically good fitsince the explanatory power of the equationmeasured by R2 and F value appears to be good.The value of R2 stood at 0.84 in ICL and 0.81 inMCL under ROCE, whereas it stood at 0.84 in ICLand 0.86 in MCL under ROTA measure ofprofitability. Thus about 86 percent to 81 percentof variation in profitability is explained by thedependent variable in that equation.
Table 1 shows that the co efficient of NWCTR isfound to be of positive sign in ICL and MCL. Butthe co efficient of this variable is insignificant inboth the companies. It shows that any change inNWCTR does not affect the profitability of thecompanies. It does not confirm our hypothesis thatprofitability increases with WCTR. The currentratio, a traditional measure of liquidity, has anunexpected positive coefficient in ICL and MCL with
ROCE measure of profitability. Besides, it obtainsnegative coefficient with ROTA measure ofprofitability in MCL, whereas it has a positive signin ICL. Neither the positive coefficient, nor thenegative coefficient of CR is statistically significantwith profitability in both the firms. It implies thatthe current ratio does not influence the profitabilityof the firms under study. It does not confirm ourhypothesis that current ratio and profitability hasinverse relationship. The liquid ratio, a measure ofliquidity, has insignificant negative relationshipwith profitability (ROCE and ROTA) in ICL, whereasit has insignificant positive relationship withprofitability in MCL. It implies that the liquid ratiodoes not influence the profitability of the firmsunder study. It does not confirm our hypothesisthat liquid ratio and profitability has inverserelationship.
The co-efficient of DTR is positive and isstatistically significant with ROTA in ICL only. Itindicates that the increase in DTR increases theprofitability (ROTA) in the case of ICL during theperiod of study. However, the positive co-efficientof DTR with ROCE in ICL and the negative co-efficient of DTR with ROCE in MCL are notstatistically significant. Besides, the positive co-efficient of DTR with ROTA in MCL is not significant.It indicates that the DTR does not influence theROCE in both cement companies during the periodof study.
To sum up, out of the five independent variablesunder the profitability Model 1, only one variable,i.e. ITR significantly increases the profitability(ROCE and ROTA) in the case of ICL and MCLduring the period of study. Most of other variables,such as NWCTR, CR, LR do not influence theprofitability of both the firms under study. The DTRincreases the ROTA in ICL, whereas it does notinfluence the ROTA in MCL as well as the ROCE inboth the firms under study.
Profitability model 2The Profitability Model 2 has been turned by
using five variables namely viz., Gross workingcapital turnover ratio (GWCTR), current ratio(CR),liquidity ratio (LR), inventory turnover ratio (ITR)and debtors turnover ratio (DTR) as under:
P = a + b1 GWCTR + b2 CR + b3 LR + b4 ITR+ b5 DTR àModel 2
The estimated regression results of theprofitability model 2 for the selected current
Research Explorer July - December 2012
Vol . I : Issue. 2 ISSN:2250 - 1940
96
companies during the period 1996/97 –2010/11
are presented in Table 2
Table 2 Regression Function ForProfitability-Model 2 (1996 / 97 to 2010 /11 )P = f (a+b1 GWTR +b2 CR+b3 LR +b4 ITR +b5 DTR)
Note: Figures in parenthesis are computed ‘t’ value.Significant level: * 1 percent * * 5 percent * * * 10 percent level.Source: Centre for Monitoring Indian Economy(CMIE), Mumbai,
India.
It is clear from Table 2 that the estimatedregression function is found statistically good fitsince the explanatory power of the equationmeasured by R2 and F value appears to be good.The value of R2 stood at 0.84 in ICL and 0.83 inMCL under ROCE, whereas it stood at 0.83 in ICLand 0.87 in MCL under ROTA measure ofprofitability. Thus about 87 percent to 83 percentof variation in profitability is explained by theindependent variables in that equation.
It is evident from Table 2 that the regressionco-efficient of GWCTR is positive but insignificantwith ROCE as well as with ROTA in ICL. It isnegative but insignificant with ROCE as well as withROTA in the case of MCL. It implies that the GWCTRdid not influence the profitability (ROCE and ROTA)in both the cement companies under the study.Hence, the hypothesis that the profitability is anincreasing function of GWCTR has not been proved.The co-efficient of CR is positive (contrary to thetheoretical expectation) with profitability (ROCE andROTA) in the case of ICL, whereas in MCL, it ispositive with ROCE and negative with ROTA. Thenegative co-efficient of GWCTR with ROTA in MCLand the positive coefficient of GWCTR with ROCEin MCL as well as in ICL are statisticallyinsignificant. It means that the CR did not influencethe profitability in those cases. However, thesignificant positive relationship with ROTA in ICLimplies that the increase in CR, increases the ROTA
which is against the theoretical expectation. Hence,the hypothesis that profitability is a decreasingfunction of CR is not proved.
The co-efficient of LR is negative (expected) withROCE as well as with ROTA in the case of ICL. Onthe other hand, the coefficient of LR is positive(unexpected) with ROCE as well as with ROTA inthe case of MCL. Neither the negative coefficientnor the positive coefficient of LR with profitabilityis significant. Hence, the hypothesis thatprofitability is a decreasing function of LR is notproved.
The coefficient of ITR is positive (expected) aswell as significant with profitability (ROCE andROTA) in both the cement companies under thestudy. It indicates that the increase or decrease inITR will significantly affect th profitabili of the firms.Hence, the hypothesis that the profitability is anincreasing function of ITR has been tested andproved.
The coefficient of DTR is positive (expected) withprofitability (ROCE and ROTA) in both the firms(ICL and MCL) but significant only in ICL with ROCEmeasure of profitability. It means that the DTRinfluenced only the ROCE in ICL, whereas it doesnot influence the profitability in all other casesunder the study.
To sum up, the variables such as GWCTR, LRand CR do not influence the profitability at all.Though the DTR influences the ROCE in the caseof ICL it does not influence the profitability in othercases under the study. The only variable thatinfluenced the profitability of both firms under thestudy is ITR.
Conclusion:In this chapter, an attempt has been made
to examine the impact of working capital ratios andliquidity ratios (NWCTR, CR, LR, ITR and DTR) onthe profitability of (ROCE and ROTA) of the selectedcement companies using the regression technique.ITR is found to be statistically significant indetermining the profitability under ROTA and ROCEmeasure in both the firms under study. BesidesDebtors Turnover Ratio is found to be the significantof profitability in ICL (ROCE and ROTA).
Reference:1. Bierman H et. al., (1975) “Ruin Considerations
of Optimal working Capital Management” inmanagement of working capital. PP 409 – 422.
Research Explorer July - December 2012
Vol . I : Issue. 2 ISSN:2250 - 1940
97
2. Bums, R and Walker, J. 199 1. “A Survey ofWorking Capital Policy Among SmallManufacturing Firms”, The Journal of SmallBusiness Finance, 1 (1), pp.61-74
3. Carpenter M.D and K.H Johnson (1983), “TheAssociation between working capital policy andoperating Risk” The Financial Review 18 (3), PP106 – 116.
4. Chittenden, F., Poutziouris, P., Michaelas, N.1998. “Financial Management and WorkingCapital Practices in UK SMEs”, Manchester,Manchester Business School
5. Deloof, D. 2003. “Does Working CapitalManagement affect Profitability of BelgianFirms”? Journal of Business Finance andAccounting” Vol 30 No 3 & 4 pp. 573 - 587
6. Ghosh SK and Maji SG (2003) “Working CapitalManagement Efficiency – A study to the IndianCement Industry”, The Institute of Cost andWorks Accountants of India.
7. Grablowsky, B. J. 1984. “Financial Managementof Inventory”, Journal of SmallBusinessManagement,July, pp59-65
8. Howorth, C. and Westhead, P. 2003. “The focusof working capital management in UK smallfirms”, Management Accounting Research, Vol.14 No.2, pp. 94-111
9. Johnson CG (1970) “Ratio Analysis and theprediction of firm failure; comment”. Journal ofFinance 25 (5); 1166 – 1168.
10. Narasimhan, M. S. and Murty, L. S. 2001.
“Emerging Manufacturing Industry: A FinancialPerspective”, Management Review, June, pp.105-112
11. Peel, M.J. Wilson, N. 1996. “Working capitaland financial management practices in the smallfirm sector”, International Small Businessjournal 14(2), 52-68
12. Peel, M. J. Wilson, N. and Howorth, C. A. 2000.“Late payment and Credit management in thesmall firm sector: Some Empirical Evidence”,International Small Business journal 18(2), 52-68
13. Saravanan. P.(2001) “ A Study of working CapitalManagement in Non Banking FinanceCompanies”, Finance India, Vol. XVNO.3September, 2001 PP 987 – 994.
14. Shin, H.H and Soenen, L. 1998. “Efficiency ofworking capital and corporate profitability”,Financial Practice and Education, Vol 8 No 2,pp. 37-45
15. Smith, K. V. 1973. “State of the art of WorkingCapital Management” Financial Management,Autumn, pp. SO-55
16. Teruel PJG and PM Solana (2007 ) “Effects ofworking Capital Management on SMEprofitability.” working papers series, Dept oforganisation de economics Finanzas, Faculbad– de Economia Y Empresa, Universidad Murcia,Campus Espinardo,Spain.
Research Explorer July - December 2012
Vol . I : Issue. 2 ISSN:2250 - 1940
98
A STUDY ON AWARENESS OF CONSUMER RIGHTS AMONG THECOLLEGE STUDENTS IN ERODE TOWN
Dr. V.Pasupathi,Dean, Commerce & Management studies,
Maharaja College of Arts & Science, Perundurai -638052.
Miss .M. Rosi ,Assistant Professor,
Mr. R.Senthil Kumar,Assistant Professor,
Sri Kandhan College of Arts & Science, Erode - 638008.
ABSTRACTThis study covers most of the legal aspects of consumer protection which is kept as a course contents in
almost all the schools and colleges, the researcher has undertaken this study to analyze how for the legalaspects of consumer protection Act 1986 are understood and utilized by the consumers to protect their interest.
IntroductionIn the 21th century, world has become a global
village due to development of communication andinformation technology, development of new toolsresult in rapid increase of supply of consumer goodshere seller wants to get maximum profit atminimum expenses of price.
Amongst the various types of cheating donewith the consumer, food adulteration is the mostdangerous which some times, leads to the death ofhundreds of innocent people. The vast Indianmarket remain flooded with duplicates of allfamous brands of product like numbers in battery,perfumes, shampoo, soap, pen , tea, coffee powder,oil, electrical items, power and others many timesthe advertisement deliberately give only a half truthso as to give a different impression than is the actualfact. thus advertisement are composed orpurposefully presented in such a way as to mislead.Future genuine companies. Consumers andgovernments suffer huge losses due to fakeproducts.
Importance of Study“Consumers! Discharge your Responsibilities:
Assert your Rights”
key words : Consumer rights, Consumer protection, food adulteration,
Consumer is king of the market. Consumer mustknow about his rights, otherwise He will beexploited.
Objectives of Study
To know about the socio economic status of theconsumers.
To study the level of awareness of public aboutconsumer protection Act.
To analyses the role of consumers forums inexercising their rights.
To find out the problems of consumers inexercising their rights
Statement of ProblemProtect the interest of those consumers the
government of India has enacted several laws andas an important land mark in the history ofconsumer protection in consumer protection Act1986 was enacted. This Act facilitate betterprotection of the interest and for that purpose theAct makes provisions for the establishment ofconsumer council and consumer court and otherauthorities for the settlement of consumer disputeand for other matters connected there with.
Research ExplorerISSN : 2250 - 1940
Vol I : Issue. 2July - December 2012
Research Explorer July - December 2012
Vol . I : Issue. 2 ISSN:2250 - 1940
99
Still the consumers are not free from theirproblems. The level of awareness differs fromconsumer to consumer. This raises the followingquestions.
To what extend the consumers make use of theconsumer councils?
Do the really know about their rights?
Do the really know about their duties?
What factors influence awareness aboutconsumer rights, duties and consumer councils?
Since this study covers most of the legal aspectsof consumer protection which is kept as a coursecontents in almost all the schools and colleges, theresearcher has undertaken this study to analyzehow for the legal aspects of consumer protectionAct 1986 are understood and utilized by theconsumers to protect their interest.
MethodologyFor the purpose of the study 150 students
from various colleges and around Erode Town areselected and data were collected using thequestionnaire. For the purpose of selection ofconsumers convenient random sampling methodis used in the study. For the purpose of obtainedanalysis, the following statistical tools are used inthe study such as Percentage analysis ,Chi-Squareanalysis , ANOVA.
Out of the total respondents, 65.33% of themhave filing of complaints. But 34.67% they havenot filing complaints.
Majority of respondents answered that they havefiled the complied with the consumer forum.
Chi -Square Analysis(H0) : There is no significant relationship between
source of information about consumer rights andthe respondents aware the satisfied with thefunctioning of consumer court.
(H1) : There is significant relationship betweensource of information about consumer rights andthe respondents aware the satisfied with thefunctioning of consumer court.
Table 1 Filing of complaints by the respondents
Awareness Total no.of
Respondents Percentage
Yes 98 65.33
No 52 34.67
Total 150 100
Source of information and level of satisfactionwith the functioning of consumer court
Chi square TestCalculated c2 Value = 10.099Degree of freedom = 6Table value = 12.592Significant level = Significant at 5% level
It is observed above the table that thecalculated value is of chi-square is lesser than thetable value. Hence the null hypothesis is acceptedand it is concluded that there is no significantrelationship between source of information aboutconsumer rights and the respondents aware thesatisfied with the functioning of consumer court.
Variance Analysis(H0): There is no significant different between
the education qualification involvement factors.(H1): There is significant difference between the
education qualification involvement factors.Educational Qualification Wise Analysis Of VarianceIf the calculated value is less than the table value
at 5% level.The F values is smaller then the critical value of
F at 5% level. Hence we accepted the nullhypothesis and conclude that there is significantdifference between the education qualificationinvolvements factors.
FindingsMajority of respondents are known the
information about consumer court through friend.Majority of respondents are Aware of the period
a judgment has to be give by the court for thecomplaints.
Research Explorer July - December 2012
Vol . I : Issue. 2 ISSN:2250 - 1940
100
Majority of respondent responded that they arehighly satisfied with the functioning of consumercourt.
Majority of respondents feels that the consumermust be educated to gain knowledge aboutconsumer rights.
Majority of respondents have recommendedothers to get into the consumer court for solvingproblems.
SuggestionsThe government can choose they effective media
especially TV for creating awareness amongconsumers about exercising and protecting theirrights in a best way under various circumstances
Consumer clubs can be formed in everyeducational institution and the students can bemade to become the member of those clubs. Theachievers the awareness of consumer rights canbe conducted periodically in those clubs. Hencethis message can be taken to the students familyand social at large.
Suggested by the respondents that theconsumer forums be started in all the village andconsumer courts can be formed in Taluk level. Sothat the consumer disputes can be redressed fully.Moreover the consumers at the village are moreexploited by their lack of awareness.
The consumer protection councils functioningin Erode can take all possible efforts with the helpof the Government and the media to make thepeople aware about important of consumer rightsat least by verifying the bill, expiry data of theirconsumption, checking weights maintained etc.,Also, they education the people about the
procedure to approach the forum and get grievancesredressed.
ConclusionToday generations are the tomorrow’s rulers. In
this regard government associations andconsumers should come forward and try to improvethe concept of consumerism. The consumermovement should be strengthened in our countryso that the tendency to push up the prices couldbe curbed and the quality of product and servicescould be ensured. The consumers have to protectthemselves through powerful consumersmovement. As well as student must follow theconsumer rights in day today life. At the same timeshould create awareness to the society, otherwisewe can’t avoid the duplication of all famous brands,adulteration and malpractices. It lead the futurestrength of bright consumerism.
References
1. Avatar Singh P :Law of Consumer Protection,Principles and Practices Eastern bookcompany., 1999.
2. Gupta, C.B and Rajan Nair, N. MarketingManagement New Delhi, Sultan chand & Sons.,1998.
3. Kothari. C.R” Research Methodology:, wileyEastern Ltd., New Delhi 2 nd Edition 2002.
4. Consumer rights awareness and actions in smallcities, Indian journal of marketing vol. XXI,Dec1990.
5. Dr. Praveen S, Consumer Protection in Indiajournal of marketing , May – june 2009.
6. Raghir Sigh, Consumer education – Need theHour, Indian Management June-1989.