24
charteredabs.org RESEARCH INCOME FOR BUSINESS AND MANAGEMENT Analysis of HESA data 2011/12 to 2016/17 April 2018

charteredabs.org
RESEARCH INCOME FOR BUSINESS AND MANAGEMENTAnalysis of HESA data 2011/12 to 2016/17
April 2018

TABLE OF CONTENTS page
Introduction ..................................................................................................................... 03
Sources of research income ............................................................................................... 05
Comparison with other subject areas .................................................................................. 09
Total research income by regions ........................................................................................ 11
Business schools by research income ...................................................................................15
Research income by mission group ......................................................................................17
© Chartered Association of Business Schools April 2018
Source of data: The data used in this survey, unless otherwise stated, is from the Higher Education Statistics Agency, finance records 2011/12 to 2016/17, sourced via the Heidi Plus online analytics service. Copyright Higher Education Statistics Agency Limited. The analysis was undertaken by the Chartered Association of Business Schools in April 2018.
Advice on full comparability with prior years:From 1 January 2015 the financial reporting for universities changed in line with Financial Reporting Standards (FRS) 102. Due to these changes, absolute comparability with HESA finance records pre and post 2014/15 and 2015/16 may not be possible.
Disclaimers: Neither the Higher Education Statistics Agency Limited nor HESA Services Limited can accept responsibility for any inferences or conclusions derived by third parties from data or other information obtained from Heidi Plus.
While the Chartered ABS strives to make the information in this report as accurate as possible, the Chartered ABS makes no claims, or guarantees about the accuracy or completeness of the data obtained from HESA.
Chartered Association of Business Schools, April 2018 Page 2

INTRODUCTIONThis annual report provides analysis of research income in the field of Business and Management. This year’s report looks at the six-year period from 2011/12 to 2016/17, using data from the Higher Education Statistics Agency (HESA).
We have found a total decrease of 1% in research income for Business and Management research over the six-year period since 2011/12. In real terms, when inflation is considered, this equates to a decrease of 12%.
In contrast, total research income for higher education institutions as a whole has increased by nearly a third from £4.5 billion to £5.9 billion. Business and Management’s share of research income for the HEI sector has decreased from 1.5% to 1.2%, a proportional decrease of 24%.
A decline in funding from UK sources remains the long-term trendDespite an annual increase in the funding for Business and Management from the research councils (+6%) and UK industry (+7%), there is no sign of a reverse in the longer-term trend of declining contributions from UK sources. Over the six-year period of the analysis, funding from UK sources declined by 16%, or 25% in real terms. At £45.3m, research income for Business and Management from UK sources was £9m less in 2016/17 than in 2011/12. Allowing for inflation this is a reduction of £15m in real terms for business schools.
Funding from the UK central government was cut substantially during the years of 2012/13 and 2013/14 (-33%) and is not close to recovering to the levels seen previously. This is in addition to cuts in funding from the research councils (-10%) and UK industry (-20%) over the last six years. Meanwhile, from the same sources, HEIs as a whole saw increases of 24% from UK central government, 28% from research councils and 23% from UK industry since 2011/12.
Funding from international sources is plugging the gapIncome from EU and non-EU sources for Business and Management research have generally increased over the six-year period in question, with total increases of 36% and 155% respectively. The annual increase of £2.7m in funding from EU government bodies in 2016/17 largely accounts for the overall year-on-year increase of 7% in research funding for Business and Management. In fact, in three of the last four years, Business and Management received more research funding from EU government bodies than the UK central government, and in 2016/17 the EU was only marginally behind the research councils as the largest contributor.
Funding from international sources outside of the EU has grown for five consecutive years, but the total
contributions of £4.9m in 2016/17 represents only 7% of total Business and Management research income in the current year.
The increasing reliance of the Business and Management sector on research funding from the EU is particularly concerning in light of the UK’s imminent exit from the EU, and we have already seen evidence of impact on UK business schools. This shows the need for a settlement that keeps the UK in the European Research Area. Our own research undertaken in our 2017 Annual Membership Survey found that since the EU referendum 10% of business schools responding to the survey had already shelved planned bids for EU research funding and 6% had seen a loss of research funding from EU sources. Furthermore, 44% of business schools expected to lose research funding from EU sources in the next 12 months1.
Opportunities The government’s focus on boosting economic productivity through innovation, research and development offers significant scope for collaboration across multiple disciplines. The creation of UK Research and Innovation (UKRI) should help to ensure that the UK’s research output maximises the contributions from each individual field, including from Business and Management. UKRI can play a key role in facilitating interdisciplinary research between Business and Management and other fields, including through Innovate UK, which has the objective of identifying the commercial potential in new technologies and developing them into new products and services that will drive economic growth and increase productivity.
The UK government’s Industrial Strategy offers a further opportunity for more integrated thinking and collaboration between the Business and Management field and STEM subjects, as it is the intention that programmes delivered under this fund will be industry-led and powered by business-academic collaboration. Success in tackling the Industrial Strategy’s ‘Grand Challenges’ – including Artificial Intelligence and Data, Healthy Ageing and Clean Growth – will require support from the Business and Management academic community to ensure that discovery and invention are translated into innovation and commerciality.
We recognise the importance of research funding for STEM subjects as a means of generating the innovation needed to boost the UK’s economic productivity, but it is crucial that the Business and Management field is involved in this process from the outset so that the outputs originating from the STEM disciplines are developed into commercially viable products and services.
Attracting increased investment into Business and Management requires the sector to improve in demonstrating the impact and return on investment from its research output.
1. Chartered Association of Business Schools, Annual Membership Survey 2017, November 2017 https://charteredabs.org/wp-content/uploads/2017/11/Chartered-ABS-Annual-Membership-Survey-2017.pdf
Research Income for Business and Management Page 3

Highlights contained in this report1. Overall research income for Business and Management
is in a long-term downward trend, primarily due to reduced funding from UK sources. This is accentuated by the impact of inflation, resulting in a decline in real terms of 12% over the last six years.
2. Funding from international sources has grown during the period of analysis and funding from EU government bodies saw a substantial increase in 2016/17. Funding from international sources outside the EU are small but growing steadily.
3. STEM subjects received an average increase in research funding of 36% between 2011/12 and 2016/17, whereas Business and Management saw a fall of 1%. The increases in funding for STEM subjects were significantly above the rate of inflation over this period.
4. Business schools in London and the South-East receive the largest shares of research income on a regional basis. The South-East and West Midlands receive the highest concentrations of income relative to the number of business schools in those regions.
5. Research income continues to be split quite evenly between the Russell Group institutions and non-affiliated business schools, with the two categories combined accounting for nearly 90% of total Business and Management research income.
6. Funding is characterised by a degree of concentration in certain institutions, with the 10 highest earners accounting for nearly half of the total Business and Management research income, six of whom are Russell Group members.
INTRODUCTION (CONTINUED)
Chartered Association of Business Schools, April 2018 Page 4

SOURCES OF RESEARCH INCOMEIn 2016/17, total research income for the subject of Business and Management was £68.5m, a 7% increase on the £63.9m recorded in 2015/16. Total funding received in 2016/17 was 1% lower than the amount achieved six years previously in 2011/12. However, in real terms, adjusting for inflation, this represents a decline £9.1m.
Funding from BEIS Research Councils, The Royal Society, British Academy and The Royal Society of Edinburgh saw the first annual increase since 2013/14, with income from this source of £17.3m in 2016/17, an increase of 6%. This amount, however, is still down by 10% on the £19.3m received from the research councils in 2011/12.
Funding from UK industry, commerce and public corporations grew for the second consecutive year, which is potentially a sign of a positive change in trend. The total of £7.5m received is an increase of 7% compared to 2015/16 but remains 20% lower than the £9.4m contribution for research funding from this source in 2011/12.
Research income from the UK central government fell on a year-on-year basis by 5% to £14.1m. This amount is one-quarter less than the £18.8m received six years previously. Funding from the UK central government saw substantial cuts during 2012/13 and 2013/14 and, although there was a relatively modest increase in 2015/16, there is no indication of a return to the levels of funding seen in the years before 2012/13. Income from UK-based charities (from both open competitive processes and other sources) fell very slightly in the last year (3%), but remains in the region of £5m.
The overall annual increase in research funding in Business and Management of 7% has largely been driven by funding from EU government bodies, which increased by £2.7m between 2015/16 and 2016/17. The £16.1m received from EU government bodies in 2016/17 was the second largest of any source, only behind the £17.3m received from the research councils. Over the six year period in question, contributions from EU government bodies have grown by 38% and the amount received in 2016/17 was the largest to date.
Income from EU-based charities increased year-on-year by 125%, although the sums in absolute terms are quite small (£207,000). Research funding from EU industry, commerce and public corporations grew by a modest 3% in 2016/17 to £1.2m.
Contributions from non-EU industry, commerce and public corporations increased for the fifth year in a row, with the £2m received in 2016/17 representing a year-on-year increase of 77% and is three times the contribution received from this source in 2011/12. Funding from non-EU ‘other’ sources also increased for the fifth year in a row, and the allocation of £2.7m is an annual increase of 7%.
Research Income for Business and Management Page 5

Table 1Research income sources - Business and Management studies - 2011/12 to 2016/17 (£000s)
Source of Income 2011/12 2012/13 2013/14 2014/15 2015/16 2016/172011/12 to
2016/17 % change
BEIS Research Councils, The Royal Society, British Academy and The Royal Society of Edinburgh
19,308 18,236 19,127 17,699 16,377 17,304
-5.6% 4.9% -7.5% -7.5% 5.7% -10.4%
UK central government bodies/local authorities, health and hospital authorities
18,814 14,601 13,032 12,926 14,762 14,068
-22.4% -10.7% -0.8% 14.2% -4.7% -25.2%
UK central government tax credits for research and development expenditure
0 0 0 196 107 256
-45.4% 139.3%
UK industry, commerce and public corporations
9,426 8,884 6,369 6,248 7,054 7,514
-5.8% -28.3% -1.9% 12.9% 6.5% -20.3%
UK-based charities (open competitive process)
2,881 2,776 2,609 4,246 3,666 3,631
-3.6% -6.0% 62.7% -13.7% -1.0% 26.0%
UK-based charities (other)977 1,123 973 1,457 1,353 1,260
14.9% -13.4% 49.7% -7.1% -6.9% 29.0%
EU government bodies11,692 11,614 13,306 14,765 13,360 16,078
-0.7% 14.6% 11.0% -9.5% 20.3% 37.5%
EU-based charities (open competitive process)
30 14 105 38 92 207
-53.3% 650.0% -63.8% 142.1% 125.0% 590%
EU industry, commerce and public corporations
611 1,083 1,593 1,481 1,174 1,209
77.3% 47.1% -7.0% -20.7% 3.0% 97.9%
EU (excluding UK) other1,029 791 905 868 367 703
-23.1% 14.4% -4.1% -57.7% 91.6% -31.7%
Non-EU-based charities (open competitive process)
410 838 666 832 456 308
104.4% -20.5% 24.9% -45.2% -32.5% -24.9%
Non-EU industry, commerce and public corporations
649 724 744 963 1,112 1,971
11.6% 2.8% 29.4% 15.5% 77.2% 203.7%
Non-EU other 877 987 1,548 2,074 2,476 2,649
12.5% 56.8% 34.0% 19.4% 7.0% 202.1%
UK other sources2,429 3,137 2,757 1,506 1,591 1,310
29.1% -12.1% -45.4% 5.6% -17.7% -46.1%
Total69,133 64,808 63,734 65,299 63,947 68,468
-6.3% -1.7% 2.5% -2.1% 7.1% -1.0%
Chartered Association of Business Schools, April 2018 Page 6

Figure 1Source of income for the subject of Business and Management: comparison of percentage income increases/decreases: 2011/12 - 2016/17
% Increase/Decrease
Note: to avoid skewing the graph the 590% increase in funding from EU-based charities (open competitive process) has been excluded. In absolute terms the actual sums involved are small, hence the volatility from year to year.
Non-EU industry, commerce and public corporations
Non-EU other
EU industry, commerce and public corporations
EU government bodies
UK-based charities (other)
UK-based charities (open competitive process)
BEIS Research Councils, The Royal Society, British Academy and The Royal Society of Edinburgh
UK industry, commerce and public corporations
Non-EU based charities (open competitive process)
UK central government bodies/local authorities, health and hospital authorities
EU (excluding UK) other
UK other sources
==
-50% 0% 50% 100% 150% 200%
204%
202%
98%
38%
29%
26%
-10%
-20%
-25%
-25%
-32%
-46%
Research Income for Business and Management Page 7

Figure 2Research income 2011/12 to 2016/17 in (£000s)
UK other sources
Non-EU other
Non-EU industry, commerce and public corporations
Non-EU based charities (open competitive process)
EU (excluding UK) other
EU industry, commerce and public corporations
EU-based charities (open competitive process)
EU government bodies
UK-based charities (other)
UK-based charities (open competitive process)
UK industry, commerce and public corporations
UK central government tax credits for research and development expenditure
UK central bodies/local authorities, health and hospital authorities
BEIS Research Councils, The Royal Society, British Academy and The Royal Society of Edinburgh
2011/12 2012/13 2013/14 2014/15 2015/16 2016/17
70,000
60,000
50,000
40,000
30,000
20,000
10,000 19,308
18,814
9,426
11,692
18,236
14,601
8,884
11,614
19,127
13,032
6,369
13,306
17,699
12,926
6,248
14,765
16,377
14,762
7,054
13,360
17,304
14,068
7,514
16,078
Chartered Association of Business Schools, April 2018 Page 8

Figure 3Research income: Business and Management versus STEM subjects: percentage difference between 2011/12 and 2016/17.
Figure 4Research income: Business and Management versus STEM subjects: percentage difference between 2011/12 and 2016/17 (inflation adjusted).
COMPARISON WITH OTHER SUBJECT AREAS
Civil Engineering
Physics
IT, systems, science and computer software
Mathematics
Biosciences
All Subject Areas
Business and Management Studies
Civil Engineering
Physics
IT, systems, science and computer software
Mathematics
Biosciences
Business and Management Studies
All Subject Areas
Over the six year period of 2011/12 to 2016/17, research income for Business and Management Studies has significantly lagged behind other fields, with total funding largely static over this time frame, whereas the comparison STEM subjects all saw increases of at least 20%, including a 78% increase for Civil Engineering during this period.
Even if adjusting for inflation, every STEM subject has seen a general increase in research funding since 2011/12, whereas Business and Management has seen a real term decrease of 12%.
0% 10% 20% 30% 40% 50% 60% 70% 80%-10%
-10%-20% 0% 10% 20% 30% 40% 50% 60%
Research Income for Business and Management Page 9

Table 2Research income: Business and Management versus STEM subjects
Figure 5Business and Management versus STEM subjects: research income in 2016/17
Subject Area 2011/12 2012/13 2013/14 2014/15 2015/16 2016/17
% increase/decrease between
2011/12 and 2016/17
% increase/decrease between
2015/16 and 2016/17
Business and Management Studies
69,133 64,808 63,734 65,299 63,947 68,468 -1.0% 7%
IT, systems, science and computer software
125,602 134,541 150,535 156,617 154,793 160,622 27.9% 4%
Biosciences 563,073 574,995 645,251 706,433 655,308 682,349 21.2% 4%
Mathematics 83,927 88,019 96,650 97,056 98,503 102,531 22.2% 4%
Civil Engineering 51,099 54,778 56,989 64,731 59,232 91,093 78.3% 54%
Physics 267,783 279,854 285,189 333,806 356,495 347,451 29.8% -3%
All Subject Areas Total (£000,000)
4,510 4,769 5,084 5,912 5,886 5,861 30.0% 0%
Since 2015/16, Business and Management Studies has actually out-performed all but one of the STEM subjects in percentage terms, with the 7% increase in funding since 2015/16 being larger than the increases seen in subjects such as Mathematics, I.T and Biosciences. Research income for Physics experienced an annual decline of 3% having recorded consecutive increases each year since 2012/13. However, Business and Management still lags behind all of the STEM subjects in terms of actual value.
700,000
600,000
500,000
400,000
300,000
200,000
100,000
0Biosciences IT, systems,
science and computer software
Civil Engineering
Physics Mathematics Business and
Management Studies
682,349
347,451
160,622102,531
91,09368,468
Chartered Association of Business Schools, April 2018 Page 10

Table 3Research income for Business and Management by regions: 2011/12 to 2016/17 and percentage increase/decrease
Region (Number of business schools in the region in brackets)
2011/12 2012/13 2013/14 2014/15 2015/16 2016/17
% Difference 2011/12
and 2016/17
% Difference 2015/16
and 2016/17
East (8) 3,326 5,036 3,467 3,487 3,346 3,871 16.4% 15.7%
East Midlands (9) 3,009 2,219 1,891 2,328 2,145 2,222 -26.2% 3.6%
London (23) 15,230 13,831 14,906 13,779 14,047 14,204 -6.7% 1.1%
North-East (5) 1,040 741 866 1,031 1,029 969 -6.8% -5.8%
North-West (12) 10,381 8,537 6,863 6,150 6,513 7,101 -31.6% 9.0%
Northern Ireland (2) 1,655 1,357 1,075 1,083 1,349 1,246 -24.7% -7.6%
Scotland (15) 7,175 7,966 7,666 7,250 6,286 6,705 -6.6% 6.7%
South-East (15) 10,966 10,031 10,919 12,500 12,430 13,856 26.4% 11.5%
South-West (10) 3,159 2,961 2,858 3,117 3,602 4,112 30.2% 14.2%
Wales (9) 2,737 2,205 1,893 2,147 1,248 2,258 -17.5% 80.9%
West Midlands (11) 7,247 6,891 8,063 8,341 7,775 7,328 1.1% -5.7%
Yorkshire and Humberside (10) 3,178 3,033 3,267 4,068 4,177 4,596 44.6% 10.0%
TOTAL RESEARCH INCOME BY REGIONSOn a regional basis the trends over the six year period of 2011/12 to 2016/17 are mixed, with some regions reporting a decline in research income for Business and Management and others seeing an increase. The regions seeing the biggest falls in funding during this period are the North-West (-32%), East Midlands (-26%), Northern Ireland (-25%) and Wales (-18%). However, there were several regions in which business schools saw an increase in funds for research, most notably Yorkshire and Humberside (45%), the South-West (30%) and the South-East (26%).
It is common for research income on a regional basis to exhibit fluctuations from year to year, but Yorkshire and Humberside and the South-East stand out as having demonstrated more sustained growth in recent years. Business schools in both regions have seen their research income grow steadily since 2012/13. On an annual basis, Wales saw by far the largest percentage increase in research contributions, rising from £1.2m in 2015/16 to £2.3m in 2016/17, a proportional increase of 81%.
As shown by the graph in figure 6, institutions in London and the South-East receive the largest share of research funding in the Business and Management field, accounting for a combined total of £28.1m in 2016/17, representing 41% of the total income across all UK regions. The South-East and West Midlands receive the highest income based on the concentration of business schools in those regions.
Research Income for Business and Management Page 11

East
East Midlands
London
North-East
North-West
Northern Ireland
Scotland
South-East
South-West
Wales
West Midlands
Yorkshire and Humberside
Figure 6Overall share of total research income by regions: 2016/17
East6%
East Midlands3%
London21%
North-East1%North-West
10%
Northern Ireland2%
Scotland10%
South-East20%
South-West6%
Wales3%
West Midlands11%
Yorks and Humberside
7%
Chartered Association of Business Schools, April 2018 Page 12

Figure 7Research income for Business and Management by region: 2014/15 to 2016/17 (£000s)
16,00014,00012,00010,0008,0006,0004,0002,0000
East
East Midlands
London
North-East
North-West
Scotland
South-East
South-West
Wales
West Midlands
Yorkshire and Humberside
Northern Ireland
2014/2015 2015/2016 2016/2017
Research Income for Business and Management Page 13

£10m +
£7.5m to £10m
£2.5m to £5m
£1m to £2.5m
£5m to £7.5m
Numbers in brackets denote the number of business schools in the region
£10m +
£7.5m to £10m
£2.5m to £5m
£1m to £2.5m
£5m to £7.5m
Scotland (15)
Northern Ireland
(2)North-West (12)
North- East (5)
Yorkshire and
Humberside (10)
Wales (9)
West Midlands
(11)
East Midlands (9)
East of England (8)
South-West (10)
South-East (15)
London (23)
Figure 8Total amount of research income in Business and Management in 2016/17 by UK region
Chartered Association of Business Schools, April 2018 Page 14
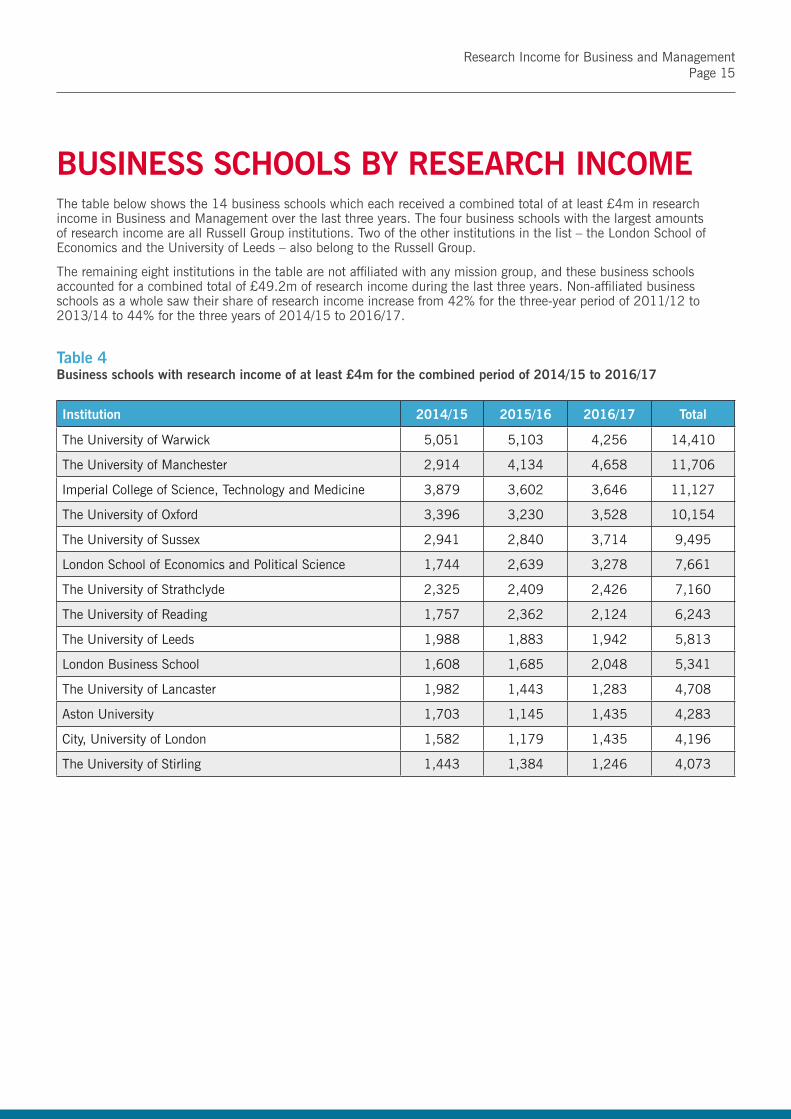
Table 4Business schools with research income of at least £4m for the combined period of 2014/15 to 2016/17
Institution 2014/15 2015/16 2016/17 Total
The University of Warwick 5,051 5,103 4,256 14,410
The University of Manchester 2,914 4,134 4,658 11,706
Imperial College of Science, Technology and Medicine 3,879 3,602 3,646 11,127
The University of Oxford 3,396 3,230 3,528 10,154
The University of Sussex 2,941 2,840 3,714 9,495
London School of Economics and Political Science 1,744 2,639 3,278 7,661
The University of Strathclyde 2,325 2,409 2,426 7,160
The University of Reading 1,757 2,362 2,124 6,243
The University of Leeds 1,988 1,883 1,942 5,813
London Business School 1,608 1,685 2,048 5,341
The University of Lancaster 1,982 1,443 1,283 4,708
Aston University 1,703 1,145 1,435 4,283
City, University of London 1,582 1,179 1,435 4,196
The University of Stirling 1,443 1,384 1,246 4,073
BUSINESS SCHOOLS BY RESEARCH INCOMEThe table below shows the 14 business schools which each received a combined total of at least £4m in research income in Business and Management over the last three years. The four business schools with the largest amounts of research income are all Russell Group institutions. Two of the other institutions in the list – the London School of Economics and the University of Leeds – also belong to the Russell Group.
The remaining eight institutions in the table are not affiliated with any mission group, and these business schools accounted for a combined total of £49.2m of research income during the last three years. Non-affiliated business schools as a whole saw their share of research income increase from 42% for the three-year period of 2011/12 to 2013/14 to 44% for the three years of 2014/15 to 2016/17.
Research Income for Business and Management Page 15

RESEARCH FUNDING CONCENTRATIONThe five highest earning business schools during the period of 2014/15 to 2016/17 secured a total of £57m in research funding, equal to 29% of the total for all business schools.
The ten highest earning business schools over the last three years secured £89m in research funding, constituting 45% of the total received by all UK business schools.
Figure 9Total research income for the period 2014/15 to 2016/17: 5 highest earning business schools
Figure 10Total research income for the period 2014/15 to 2016/17: 10 highest earning business schools
The 20 highest earning business schools received £126m in research funding over the period, which comprises 64% of the total research income for all UK business schools. This means over 100 institutions share the 36% of remaining income.
£197.7m
£56.9m (29%)
£197.7m
£89.1m (45%)
Research Income for five highest earning business schools
Total Research Income – all business schools
Research Income for ten highest earning business schools
Total Research Income – all business schools
Warwick, Manchester, Imperial, Oxford, Sussex, LSE, Strathclyde, Reading, Leeds, London Business
School
Warwick, Manchester, Imperial, Oxford, Sussex
Chartered Association of Business Schools, April 2018 Page 16

RESEARCH INCOME BY MISSION GROUPFor the six year period of analysis the Russell Group institutions maintain the largest share of research income in Business and Management. This is marginally greater than the share of the non-affiliated institutions.
As displayed in figure 12 on the following page, the Russell Group institutions have seen their share of the total research income in Business and Management studies fall from 49% in 2011/12 to 45% in 2016/17. Over the same period the non-affiliated institutions have increased their proportion of research income from 37% to 44%. In absolute values the business schools in the University Alliance mission group have grown their research income for four consecutive years, helped by the addition of new member institutions. However, this increase in income has made little difference to their overall share of the market for Business and Management research, which has stood at 9% for the last three years.
Figure 11Share of total research income by Mission Group: 2011/12 to 2016/17
Russell Group
University Alliance
MillionPlus
Non-Affiliated
Russell Group45%
Non-Affiliated43%
University Alliance
9%MillionPlus
3%
Research Income for Business and Management Page 17

Figure 12Annual trends in share of total research income by Mission Group: 2011/12 to 2016/17
100%
90%
80%
70%
60%
50%
40%
30%
20%
10%
0%
2011/12 2012/13 2013/14 2014/15 2015/16 2016/17
Russell Group University Alliance MillionPlus Non-Affiliated
Chartered Association of Business Schools, April 2018 Page 18

Table 5Russell Group: research income from Business and Management (£000s)
Institution 2011/12 2012/13 2013/14 2014/15 2015/16 2016/17 Sum 2011/12 to 2016/17
The University of Warwick 4,537 3,730 4,735 5,051 5,103 4,256 27,412
Imperial College of Science, Technology and Medicine 6,328 5,579 4,314 3,879 3,602 3,646 27,348
The University of Manchester 4,465 4,048 2,877 2,914 4,134 4,658 23,096
The University of Oxford 2,689 2,282 2,660 3,396 3,230 3,528 17,785
London School of Economics and Political Science 1,360 1,406 2,717 1,744 2,639 3,278 13,144
The University of Leeds 1,608 1,579 1,749 1,988 1,883 1,942 10,749
Cardiff University 2,106 1,412 1,110 1,279 826 882 7,615
The University of Cambridge 1,495 1,510 1,166 856 1,001 958 6,986
University of Nottingham 1,707 1,329 770 921 882 516 6,125
The University of Exeter 1,099 1,213 1,145 1,070 600 895 6,022
The University of Sheffield 610 479 902 924 987 1,416 5,318
The University of Birmingham 642 577 581 575 763 820 3,958
The University of Southampton 564 555 678 708 782 660 3,947
The University of Edinburgh 616 530 447 604 571 508 3,276
King's College London 1,710 345 372 247 161 253 3,088
The University of Glasgow 278 454 306 429 521 564 2,552
Newcastle University 358 154 322 495 512 474 2,315
The Queen's University of Belfast 589 352 270 270 363 407 2,251
University of Durham 401 375 420 344 310 345 2,195
The University of Liverpool 493 301 296 263 78 192 1,623
Queen Mary University of London 107 93 288 285 362 227 1,362
The University of York 26 -15 24 58 39 150 282
University College London 0 147 101 0 9 15 272
The University of Bristol 0 102 29 56 10 25 222
Total 33,788 28,537 28,279 28,356 29,368 30,615 178,943
RUSSELL GROUPRussell Group institutions received £179m in research funding between 2011/12 and 2016/17, constituting 45% of the total research income received by business schools over the period. In 2016/17 the research income received by the Russell Group institutions returned to the £30m region for the first time since 2011/12, but this is still down by 9% on the £33.8m received six years ago.
Research Income for Business and Management Page 19

UNIVERSITY ALLIANCEUniversity Alliance business schools received a total of £34.5m in research funding for Business and Management for the combined period of 2011/12 to 2016/17. Since 2012/13 their research income has increased by 31%, driven in part by the addition of three new member institutions. Despite the increase in recent years, the total income of £6.3m received in 2016/17 is 10% less than six years ago.
Table 6University Alliance: research income from Business and Management (£000s)
Note: Institutions denoted with an asterisk were not members of the University Alliance mission group for the entire period of analysis.
Institution 2011/12 2012/13 2013/14 2014/15 2015/16 2016/17 Sum 2011/12 to 2016/17
University of the West of England, Bristol 576 519 644 763 1,121 1,274 4,897
The Open University* 466 365 749 752 1,152 1,182 4,666
Coventry University 388 467 1,128 664 516 645 3,808
The University of Brighton* 734 637 282 692 558 583 3,486
The University of Greenwich 386 463 549 671 797 480 3,346
The Manchester Metropolitan University 369 445 143 653 517 759 2,886
The University of Salford 1,518 136 198 125 65 13 2,055
Kingston University 682 408 254 98 155 333 1,930
University of Hertfordshire 255 168 242 267 308 196 1,436
Oxford Brookes University 387 205 129 327 123 148 1,319
The University of Portsmouth 370 198 85 80 139 107 979
The Nottingham Trent University 357 80 85 126 127 193 968
The University of Huddersfield 17 192 65 104 187 269 834
The University of Central Lancashire* 152 188 102 78 184 43 747
Sheffield Hallam University 180 146 69 90 109 52 646
University of South Wales 86 152 94 105 -62 5 380
Liverpool John Moores University 28 20 4 4 1 8 65
Teesside University 49 6 0 0 0 8 63
Total 7,000 4,795 4,822 5,599 5,997 6,298 34,511
Chartered Association of Business Schools, April 2018 Page 20
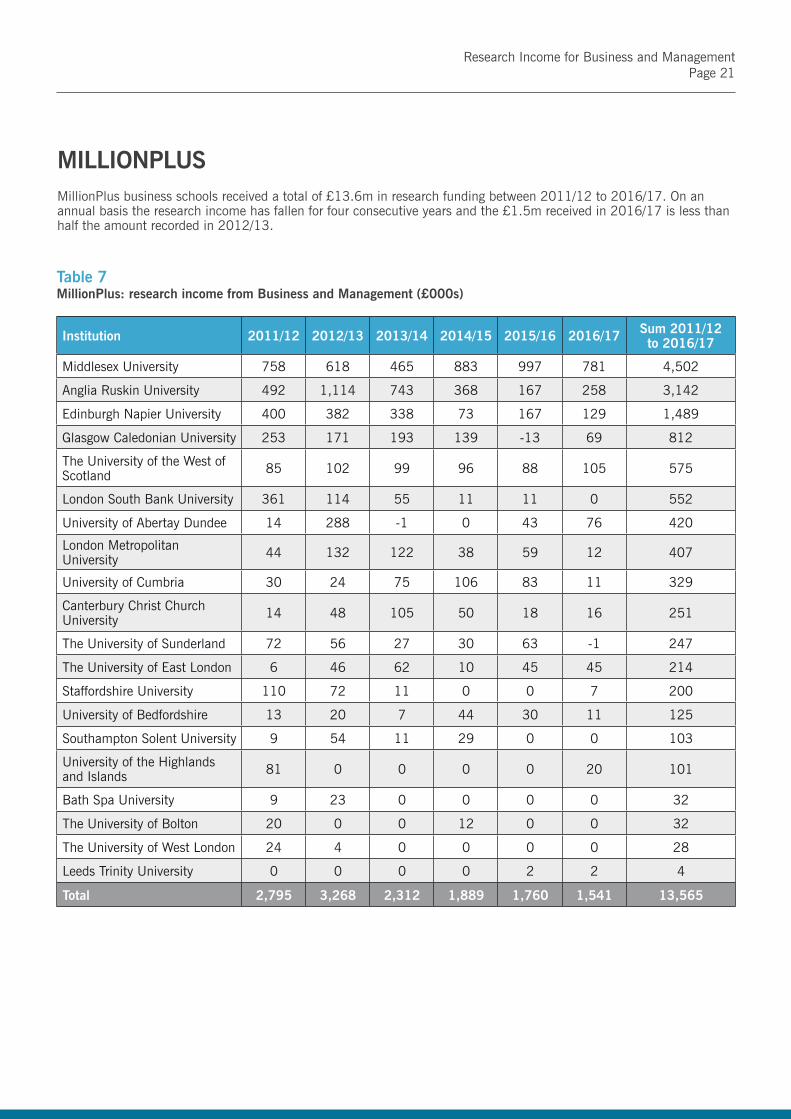
MILLIONPLUSMillionPlus business schools received a total of £13.6m in research funding between 2011/12 to 2016/17. On an annual basis the research income has fallen for four consecutive years and the £1.5m received in 2016/17 is less than half the amount recorded in 2012/13.
Table 7MillionPlus: research income from Business and Management (£000s)
Institution 2011/12 2012/13 2013/14 2014/15 2015/16 2016/17 Sum 2011/12 to 2016/17
Middlesex University 758 618 465 883 997 781 4,502
Anglia Ruskin University 492 1,114 743 368 167 258 3,142
Edinburgh Napier University 400 382 338 73 167 129 1,489
Glasgow Caledonian University 253 171 193 139 -13 69 812
The University of the West of Scotland 85 102 99 96 88 105 575
London South Bank University 361 114 55 11 11 0 552
University of Abertay Dundee 14 288 -1 0 43 76 420
London Metropolitan University 44 132 122 38 59 12 407
University of Cumbria 30 24 75 106 83 11 329
Canterbury Christ Church University 14 48 105 50 18 16 251
The University of Sunderland 72 56 27 30 63 -1 247
The University of East London 6 46 62 10 45 45 214
Staffordshire University 110 72 11 0 0 7 200
University of Bedfordshire 13 20 7 44 30 11 125
Southampton Solent University 9 54 11 29 0 0 103
University of the Highlands and Islands 81 0 0 0 0 20 101
Bath Spa University 9 23 0 0 0 0 32
The University of Bolton 20 0 0 12 0 0 32
The University of West London 24 4 0 0 0 0 28
Leeds Trinity University 0 0 0 0 2 2 4
Total 2,795 3,268 2,312 1,889 1,760 1,541 13,565
Research Income for Business and Management Page 21

NON-AFFILIATED BUSINESS SCHOOLSThe total research income for all non-affiliated business schools between 2011/12 and 2016/17 was £168.4m, representing 43% of the total research income for business schools over this time frame. The non-affiliated business schools have grown their research income from £25.6m in 2011/12 to £30m in 2016/17, a proportional increase of 17%.
Note: The table only includes those non-affiliated business schools that received at least some research income in Business and Management during the period of 2011/12 to 2016/17.
Institution 2011/12 2012/13 2013/14 2014/15 2015/16 2016/17Sum 2011/12 to 2016/17
The University of Lancaster 3,322 3,364 3,160 1,982 1,443 1,283 14,554
The University of Strathclyde 2,099 2,216 2,529 2,325 2,409 2,426 14,004
The University of Sussex 26 2,089 2,380 2,941 2,840 3,714 13,990
The University of Reading 2,113 2,219 2,211 1,757 2,362 2,124 12,786
London Business School 1,463 1,464 1,577 1,608 1,685 2,048 9,845
Cranfield University 2,896 1,892 1,000 1,205 1,003 1,443 9,439
The University of Stirling 1,437 1,469 1,664 1,443 1,384 1,246 8,643
Aston University 1,125 1,736 1,355 1,703 1,145 1,435 8,499
City, University of London 1,108 1,363 1,688 1,582 1,179 1,435 8,355
University of Ulster 1,066 1,005 805 813 986 839 5,514
The University of Surrey 283 664 765 1,249 631 1,185 4,777
Queen Margaret University, Edinburgh 934 1,143 900 771 8 61 3,817
SOAS University of London 0 660 959 991 808 336 3,754
Brunel University London 377 535 735 792 740 508 3,687
The University of Bath 764 406 282 262 812 1,155 3,681
Loughborough University 425 399 492 636 662 659 3,273
Heriot-Watt University 205 308 381 455 588 845 2,782
University of Plymouth 157 202 264 622 793 474 2,512
The University of Essex 71 101 114 468 663 900 2,317
Bournemouth University 554 475 488 332 229 237 2,315
The University of Hull 299 172 129 413 557 516 2,086
The University of St Andrews 385 454 451 382 180 170 2,022
The University of Westminster 317 306 381 319 359 295 1,977
The University of East Anglia 1,000 231 195 279 163 76 1,944
The University of Leicester 158 224 384 428 295 273 1,762
Swansea University 133 171 96 89 44 1,108 1,641
The University of Aberdeen 205 252 160 202 172 227 1,218
Aberystwyth University 167 107 189 389 259 75 1,186
Leeds Beckett University 83 148 157 279 223 207 1,097
The University of Kent 181 174 89 83 226 343 1,096
Royal Holloway and Bedford New College 77 55 244 311 230 136 1,053
Bangor University 176 294 332 166 28 54 1,050
Table 8Non-affiliated: research income from Business and Management (£000s)
Chartered Association of Business Schools, April 2018 Page 22

Institution 2011/12 2012/13 2013/14 2014/15 2015/16 2016/17Sum 2011/12 to 2016/17
Roehampton University 75 32 178 336 271 74 966
Buckinghamshire New University 55 373 366 6 31 115 946
University of Northumbria at Newcastle 160 150 97 162 144 143 856
De Montfort University 255 133 113 29 43 281 854
The University of Bradford 191 170 149 186 112 42 850
The University of Dundee 96 144 118 139 124 94 715
Birkbeck College 64 102 89 190 97 145 687
The University of Lincoln 164 162 23 106 106 126 687
The Robert Gordon University 87 53 81 192 44 165 622
The University of Wolverhampton 202 59 80 149 103 16 609
Birmingham City University 195 118 40 76 58 45 532
Keele University 24 126 130 114 54 80 528
The University of Chichester 98 79 112 53 9 0 351
Cardiff Metropolitan University 3 57 0 21 157 97 335
The University of Northampton 107 0 7 63 15 103 295
University of the Arts, London 7 0 0 80 47 152 286
Goldsmiths College 53 11 0 15 24 141 244
Glyndwr University 66 12 72 98 -4 0 244
University of Derby 0 54 40 19 15 71 199
The University of Winchester 4 34 53 66 16 0 173
Liverpool Hope University 14 9 0 2 0 107 132
York St John University 0 0 0 44 78 0 122
University of Gloucestershire 0 14 6 12 37 52 121
University of Worcester 24 6 3 9 33 24 99
The University of Buckingham 0 0 0 0 83 15 98
University of Suffolk 0 0 0 0 11 29 40
University of Wales Trinity Saint David 0 0 0 0 0 37 37
University of Chester 0 2 6 0 0 23 31
Edge Hill University 0 0 2 11 8 4 25
The University of Wales, Newport 7 10 0 0 0 0 17
Total 25,557 28,208 28,321 29,455 26,822 30,014 168,377
Research Income for Business and Management Page 23

40 Queen Street London
EC4R 1DD
Tel: 020 7236 7678 charteredabs.org


