72
© 2012 TRRA 1 http://www.trra.ca /RIjobs [email protected] om 1 Sponsored by 1 Research & Innovation Jobs In partnership with

© 2012 TRRA 1http://www.trra.ca/RIjobs [email protected]
Sponsored by
1
Research & Innovation Jobs
In partnership with

© 2012 TRRA 2http://www.trra.ca/RIjobs [email protected]
Agenda
1. Toronto Region Labour Market
• Strategic sectors
• Sectors and occupations
• Workforce supply/demand
2. International Scientific Production
• Patents
• Non-patent publications
• Resources and results
3. Conclusions

© 2012 TRRA 3http://www.trra.ca/RIjobs [email protected]
Agenda
1. Toronto Region Labour Market
• Strategic sectors
• Sectors and occupations
• Workforce supply/demand
2. International Scientific Production
• Patents
• Non-patent publications
• Resources and results
3. Conclusions

© 2012 TRRA 4http://www.trra.ca/RIjobs [email protected] 2, page 5 - Source: Statistics Canada 2010, 2011
Employment Location Quotient
Toronto Region Labour MarketStrategic Sectors
EstablishmentLocation Quotient

© 2012 TRRA 5http://www.trra.ca/RIjobs [email protected] 2, page 5 - Source: Statistics Canada 2010, 2011
Employment Location Quotient
Toronto Region Labour MarketStrategic Sectors
EstablishmentLocation Quotient
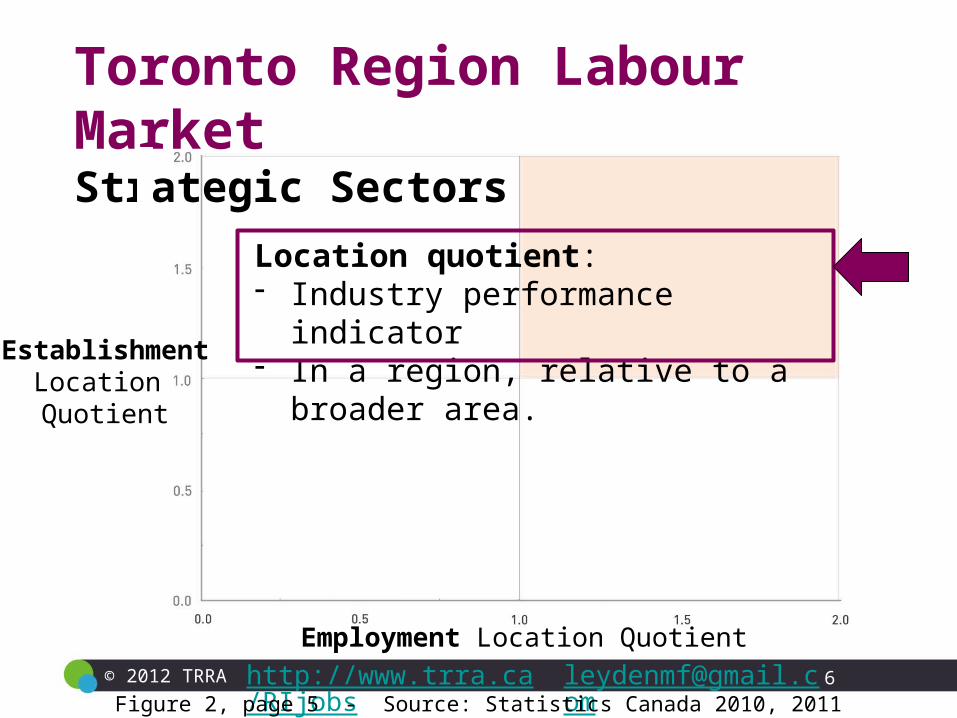
© 2012 TRRA 6http://www.trra.ca/RIjobs [email protected] 2, page 5 - Source: Statistics Canada 2010, 2011
Employment Location Quotient
Toronto Region Labour MarketStrategic Sectors
EstablishmentLocation Quotient
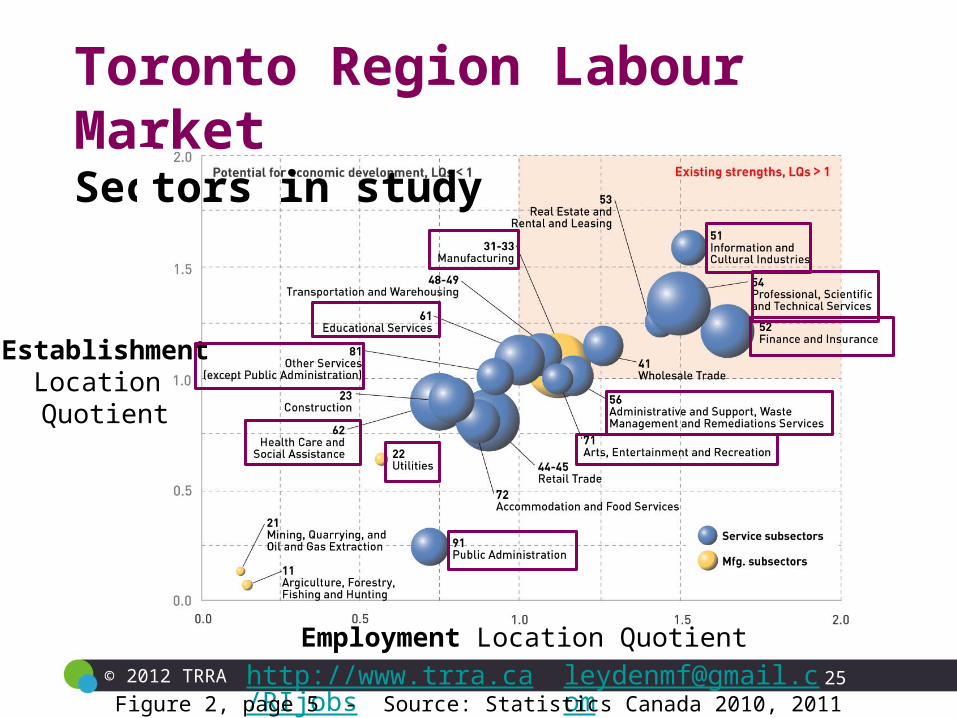
Location quotient: - Industry performance indicator - In a region, relative to a broader area.

© 2012 TRRA 7http://www.trra.ca/RIjobs [email protected] 2, page 5 - Source: Statistics Canada 2010, 2011
Employment Location Quotient
Toronto Region Labour MarketStrategic Sectors
EstablishmentLocation Quotient
Location quotient: - Industry performance indicator - In a region, relative to a broader area.
In this study: - Toronto Region, relative to Canada.

© 2012 TRRA 8http://www.trra.ca/RIjobs [email protected] 2, page 5 - Source: Statistics Canada 2010, 2011
Employment Location Quotient
Toronto Region Labour MarketStrategic Sectors
EstablishmentLocation Quotient
National average

© 2012 TRRA 9http://www.trra.ca/RIjobs [email protected] 2, page 5 - Source: Statistics Canada 2010, 2011
Employment Location Quotient
Toronto Region Labour MarketStrategic Sectors
EstablishmentLocation Quotient Below
national average in Employment
& Establishments
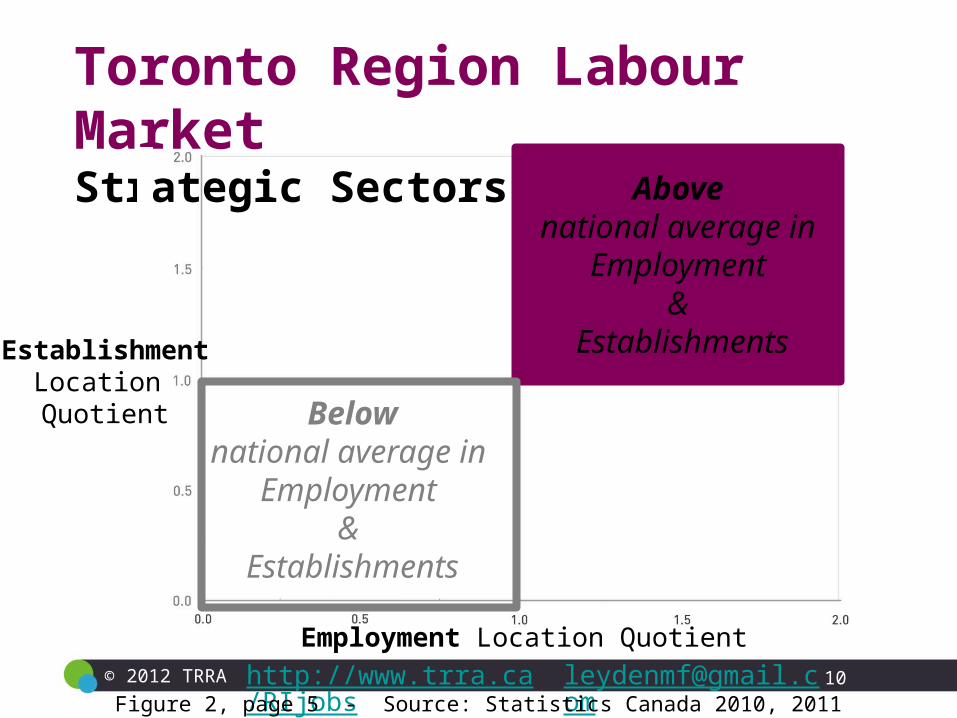
© 2012 TRRA 10http://www.trra.ca/RIjobs [email protected] 2, page 5 - Source: Statistics Canada 2010, 2011
Employment Location Quotient
Toronto Region Labour MarketStrategic Sectors
EstablishmentLocation Quotient
Above national average in
Employment &
Establishments
Belownational average in
Employment &
Establishments

© 2012 TRRA 11http://www.trra.ca/RIjobs [email protected] 2, page 5 - Source: Statistics Canada 2010, 2011
Employment Location Quotient
Toronto Region Labour MarketStrategic Sectors
EstablishmentLocation Quotient

© 2012 TRRA 12http://www.trra.ca/RIjobs [email protected] 2, page 5 - Source: Statistics Canada 2010, 2011
Employment Location Quotient
Toronto Region Labour MarketStrategic Sectors
EstablishmentLocation Quotient
NAICS code
NAICS code
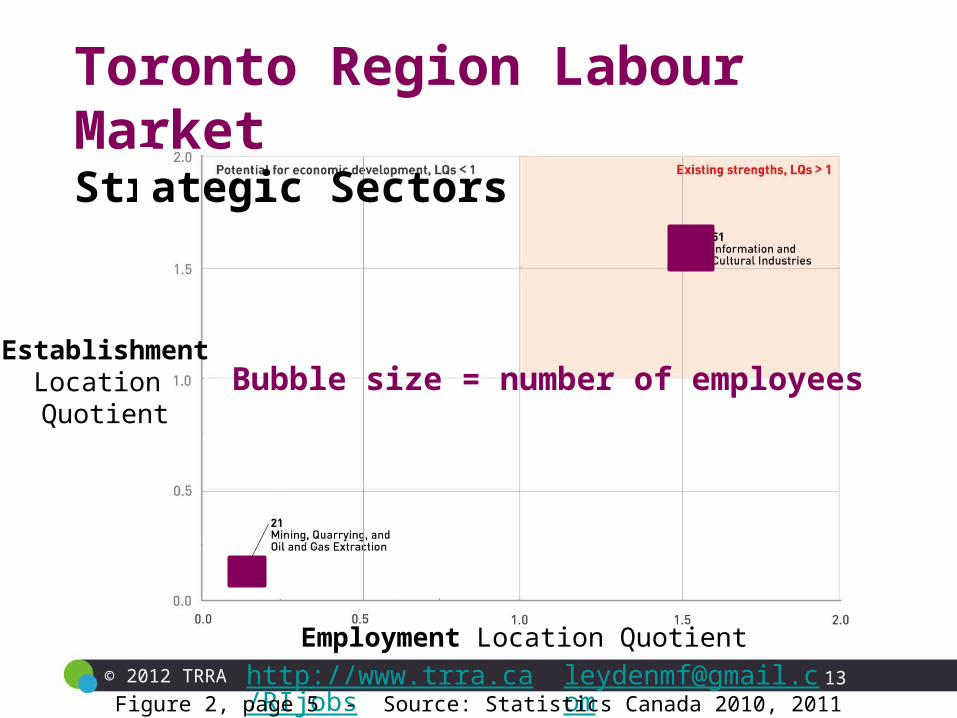
© 2012 TRRA 13http://www.trra.ca/RIjobs [email protected] 2, page 5 - Source: Statistics Canada 2010, 2011
Employment Location Quotient
Toronto Region Labour MarketStrategic Sectors
EstablishmentLocation Quotient
Bubble size = number of employees

© 2012 TRRA 14http://www.trra.ca/RIjobs [email protected]
Toronto Region Labour MarketStrategic Sectors
Figure 2, page 5 - Source: Statistics Canada 2010, 2011
EstablishmentLocation Quotient
Employment Location Quotient

© 2012 TRRA 15http://www.trra.ca/RIjobs [email protected]
Toronto Region Labour MarketStrategic Sectors
Figure 2, page 5 - Source: Statistics Canada 2010, 2011
EstablishmentLocation Quotient
Employment Location Quotient

© 2012 TRRA 16http://www.trra.ca/RIjobs [email protected]
Toronto Region Labour MarketStrategic Sectors
Figure 2, page 5 - Source: Statistics Canada 2010, 2011
EstablishmentLocation Quotient
Employment Location Quotient
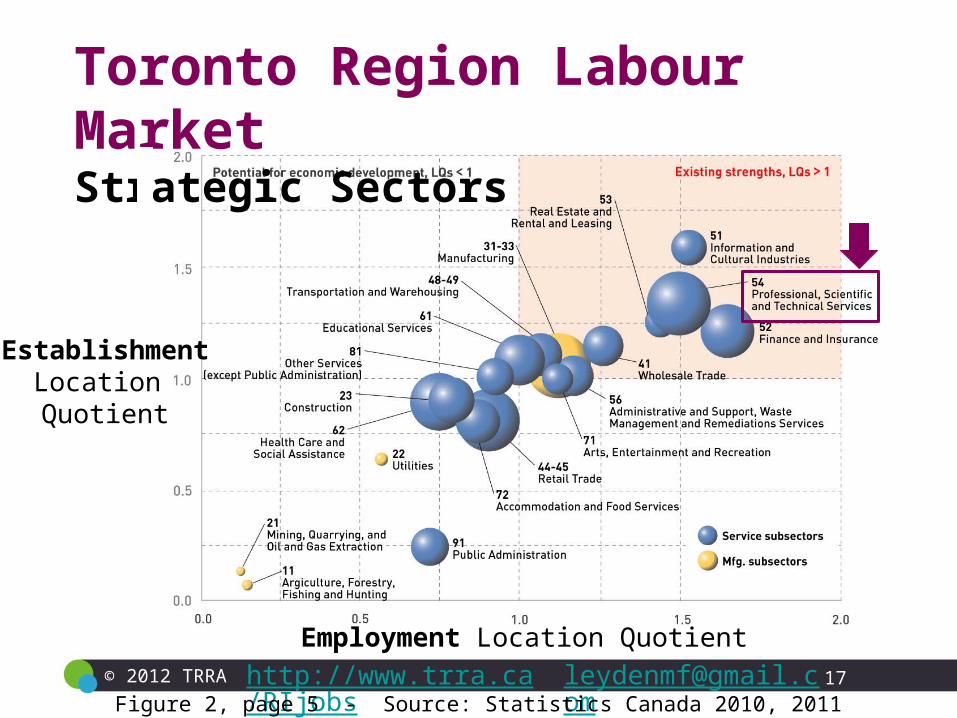
© 2012 TRRA 17http://www.trra.ca/RIjobs [email protected]
Toronto Region Labour MarketStrategic Sectors
Figure 2, page 5 - Source: Statistics Canada 2010, 2011
EstablishmentLocation Quotient
Employment Location Quotient
© 2012 TRRA 18http://www.trra.ca/RIjobs [email protected]
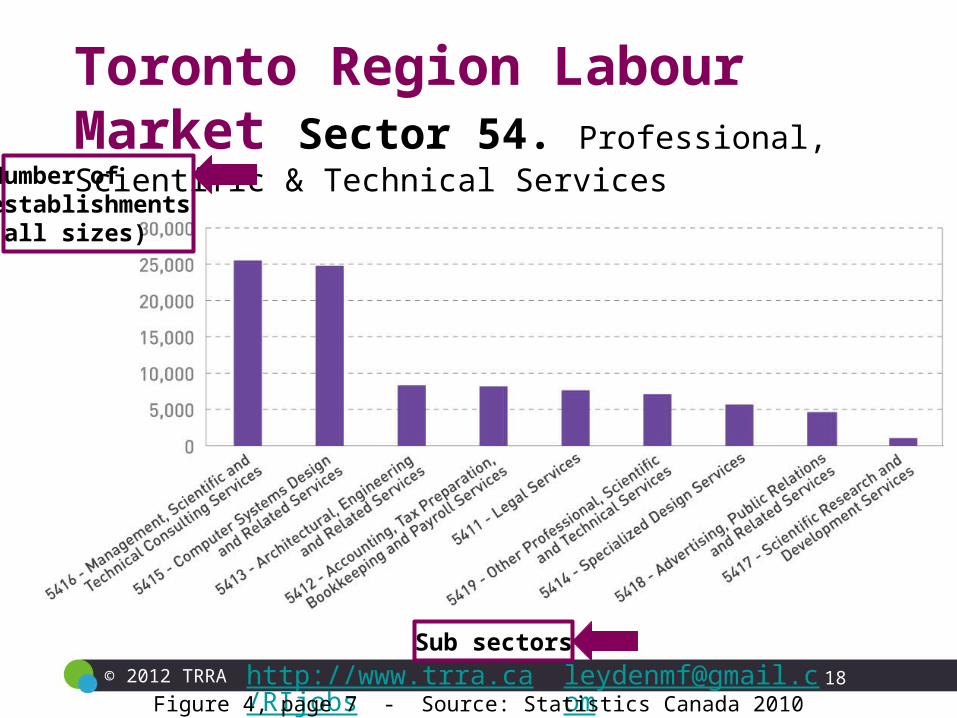
Toronto Region Labour Market Sector 54. Professional, Scientific & Technical Services
Figure 4, page 7 - Source: Statistics Canada 2010
Number of establishments (all sizes)
Sub sectors

© 2012 TRRA 19http://www.trra.ca/RIjobs [email protected]
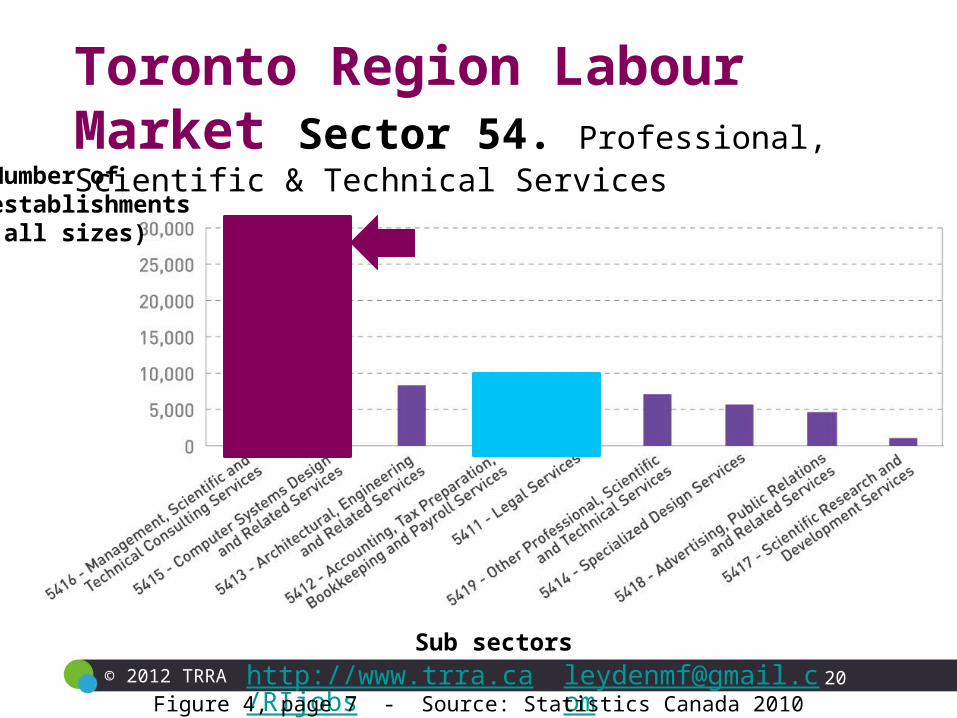
Toronto Region Labour Market Sector 54. Professional, Scientific & Technical Services
Figure 4, page 7 - Source: Statistics Canada 2010
Number of establishments (all sizes)
Sub sectors
© 2012 TRRA 20http://www.trra.ca/RIjobs [email protected]
Toronto Region Labour Market Sector 54. Professional, Scientific & Technical Services
Figure 4, page 7 - Source: Statistics Canada 2010
Number of establishments (all sizes)
Sub sectors

© 2012 TRRA 21http://www.trra.ca/RIjobs [email protected]
Agenda
1. Toronto Region Labour Market
• Strategic sectors
• Sectors and occupations
• Workforce supply/demand
2. International Scientific Production
• Patents
• Non-patent publications
• Resources and results
3. Conclusions
© 2012 TRRA 22http://www.trra.ca/RIjobs [email protected]
60+ occupations
Toronto Region Labour Market Occupations in study
Source: Statistics Canada 2006
© 2012 TRRA 23http://www.trra.ca/RIjobs [email protected]
60+ occupations in 6 occupational groups
Toronto Region Labour Market Occupations in study
Source: Statistics Canada 2006

© 2012 TRRA 24http://www.trra.ca/RIjobs [email protected]
60+ occupations in 6 occupational groups
Toronto Region Labour Market Occupations in study
Source: Statistics Canada 2006
12 % of the employed population (400,000+ jobs)
© 2012 TRRA 25http://www.trra.ca/RIjobs [email protected]
Toronto Region Labour MarketSectors in study
Figure 2, page 5 - Source: Statistics Canada 2010, 2011
EstablishmentLocation Quotient
Employment Location Quotient

© 2012 TRRA 26http://www.trra.ca/RIjobs [email protected]
Agenda
1. Toronto Region Labour Market
• Strategic sectors
• Sectors and occupations
• Workforce supply/demand
2. International Scientific Production
• Patents
• Non-patent publications
• Resources and results
3. Conclusions

© 2012 TRRA 27http://www.trra.ca/RIjobs [email protected]
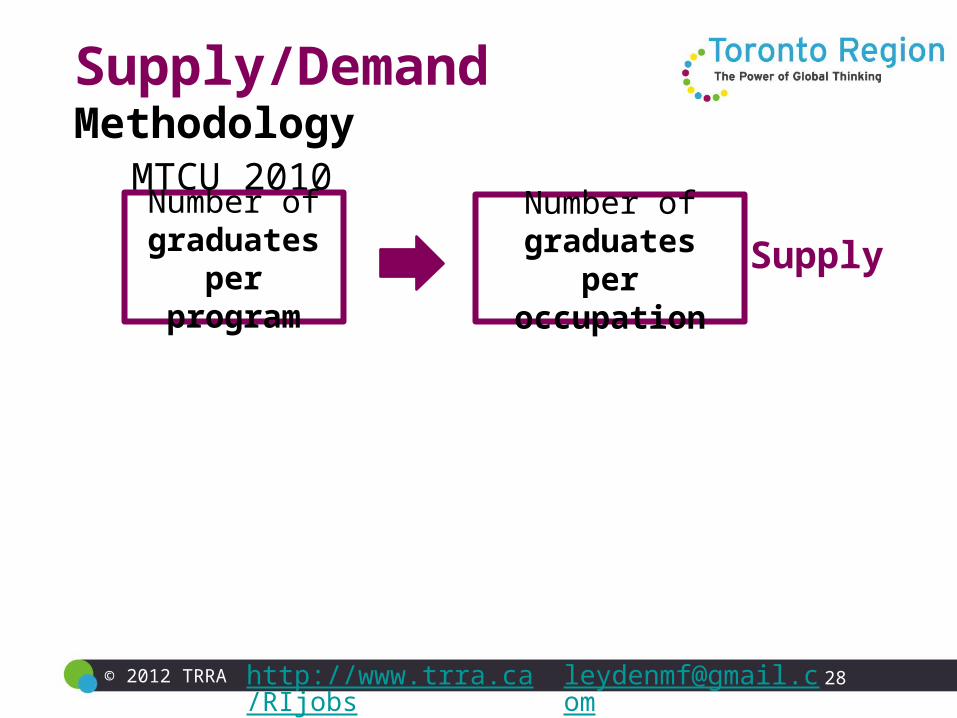
Number of graduates
per program
MTCU 2010
Supply/DemandMethodology
© 2012 TRRA 28http://www.trra.ca/RIjobs [email protected]
Number of graduates
per program
MTCU 2010
Supply/DemandMethodology
Number of graduates
per occupationSupply
© 2012 TRRA 29http://www.trra.ca/RIjobs [email protected]
Number of graduates
per program
MTCU 2010
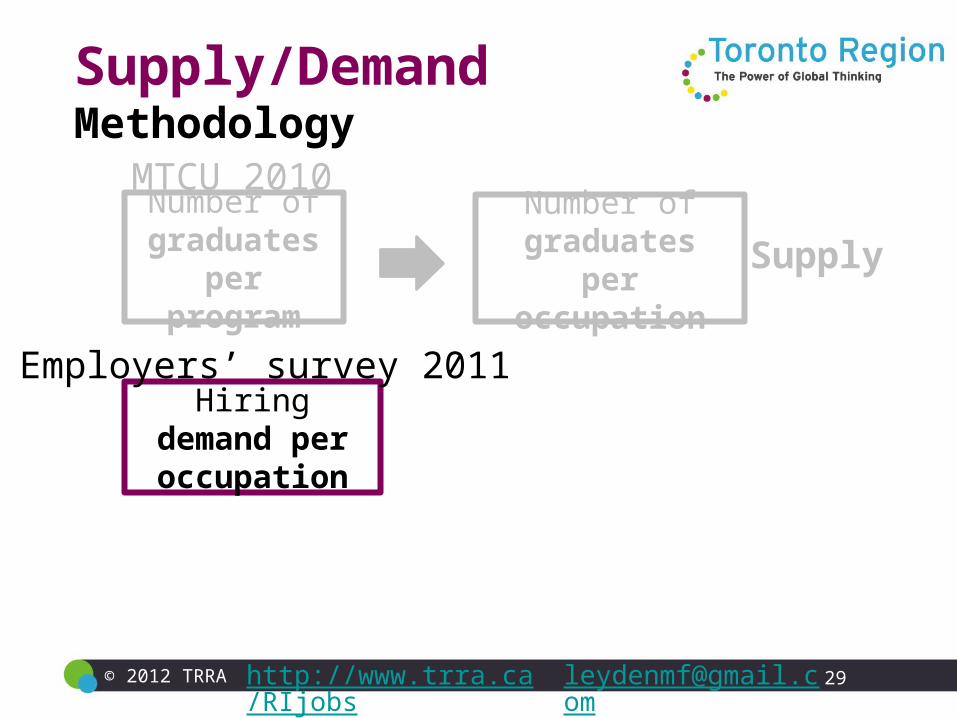
Supply/DemandMethodology
Number of graduates
per occupationSupply
Hiring demand per occupation
Employers’ survey 2011
© 2012 TRRA 30http://www.trra.ca/RIjobs [email protected]
Number of graduates
per program
MTCU 2010
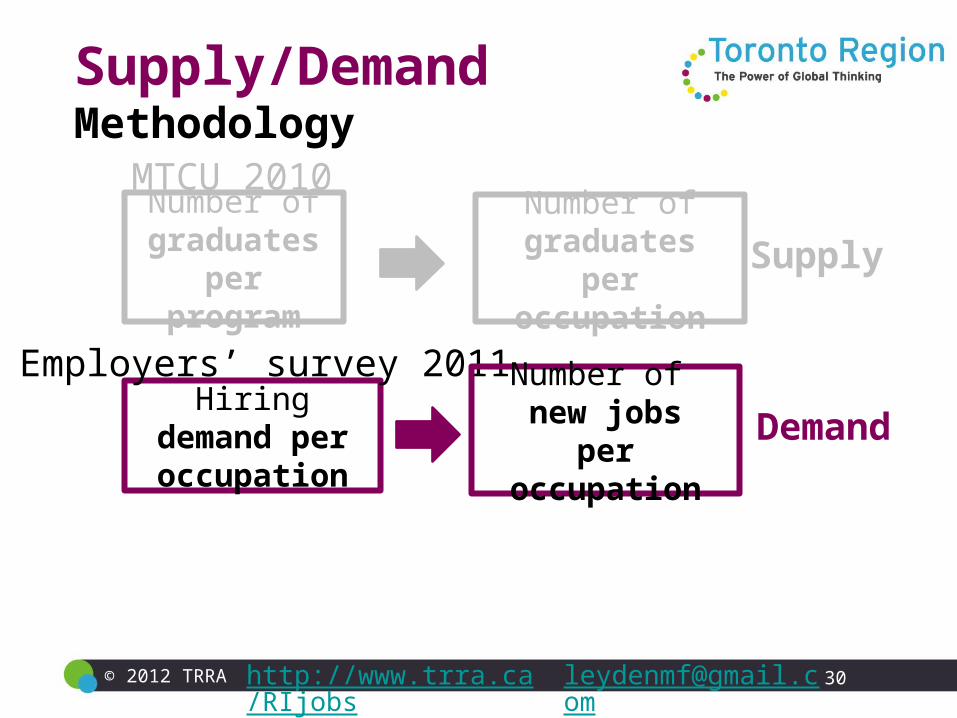
Supply/DemandMethodology
Number of graduates
per occupationSupply
Hiring demand per occupation
Employers’ survey 2011Number of new jobs
per occupationDemand
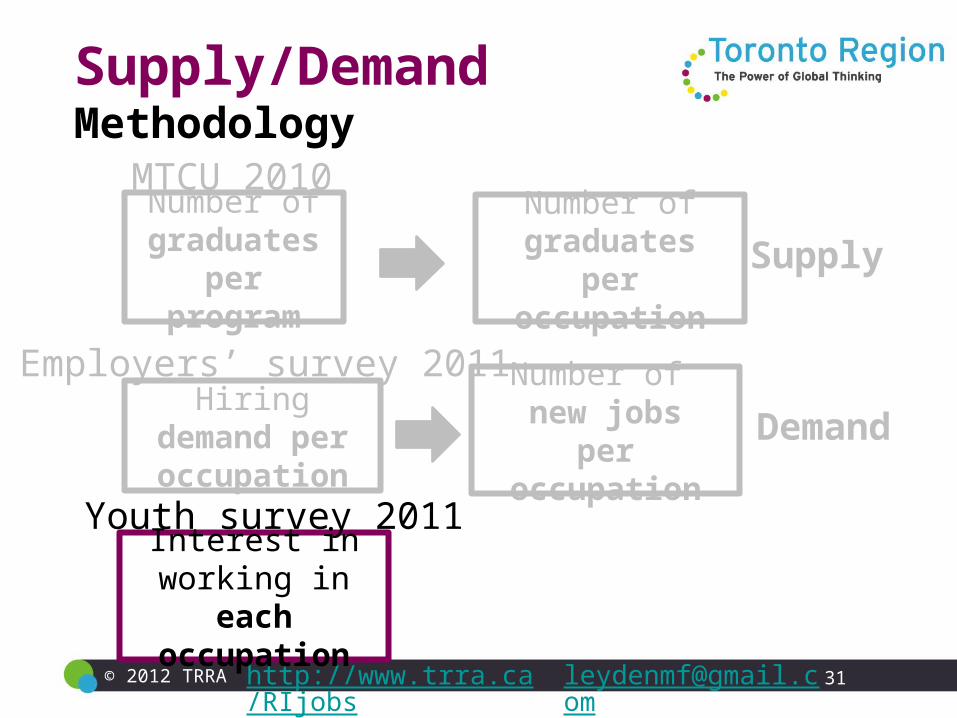
© 2012 TRRA 31http://www.trra.ca/RIjobs [email protected]
Number of graduates
per program
MTCU 2010
Supply/DemandMethodology
Number of graduates
per occupationSupply
Hiring demand per occupation
Employers’ survey 2011Number of new jobs
per occupationDemand
Interest in working in each
occupation
Youth survey 2011

© 2012 TRRA 32http://www.trra.ca/RIjobs [email protected]
Number of graduates
per program
MTCU 2010
Supply/DemandMethodology
Number of graduates
per occupationSupply
Hiring demand per occupation
Employers’ survey 2011Number of new jobs
per occupationDemand
Interest in working in each
occupation
Long-term supply
Youth survey 2011
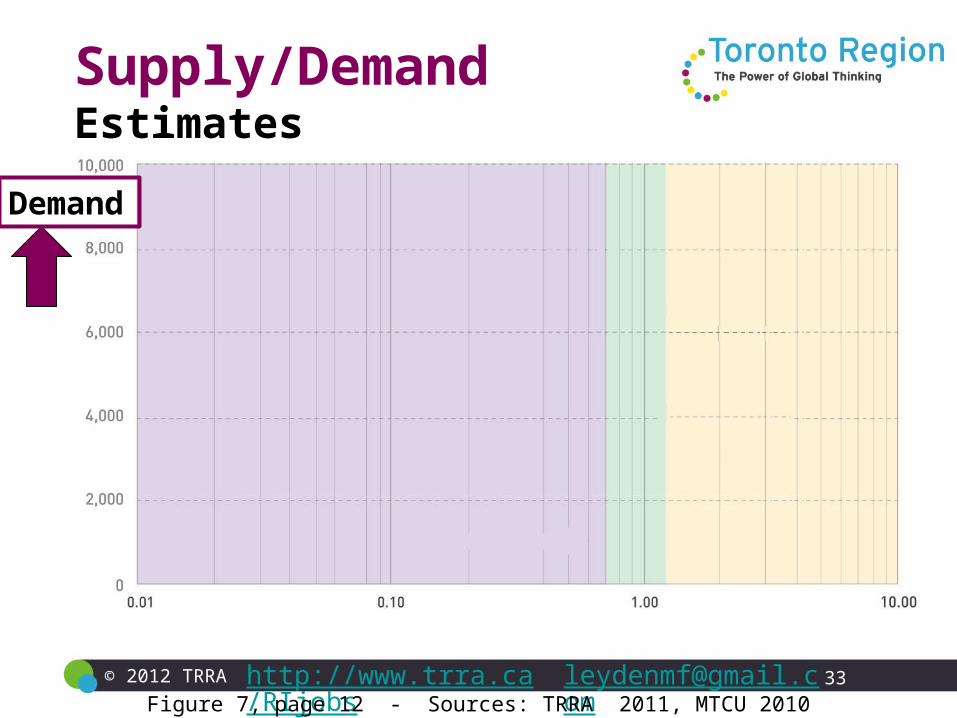
© 2012 TRRA 33http://www.trra.ca/RIjobs [email protected]
Supply/DemandEstimates
Figure 7, page 12 - Sources: TRRA 2011, MTCU 2010
Demand

© 2012 TRRA 34http://www.trra.ca/RIjobs [email protected]
Supply/DemandEstimates
Figure 7, page 12 - Sources: TRRA 2011, MTCU 2010
Demand High Demand
Low Demand

© 2012 TRRA 35http://www.trra.ca/RIjobs [email protected]
Supply/DemandEstimates
Figure 7, page 12 - Sources: TRRA 2011, MTCU 2010
Supply/Demand
Dem
and

© 2012 TRRA 36http://www.trra.ca/RIjobs [email protected]
Supply/DemandEstimates
Figure 7, page 12 - Sources: TRRA 2011, MTCU 2010
Supply/Demand
Supply < Demand
Dem
and
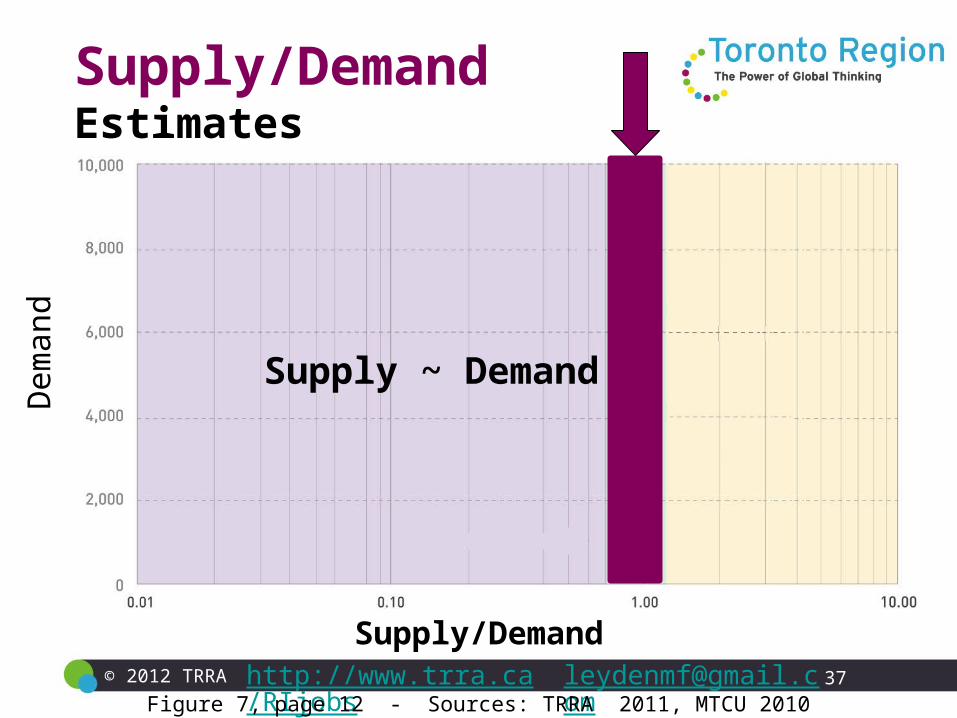
© 2012 TRRA 37http://www.trra.ca/RIjobs [email protected]
Supply/DemandEstimates
Figure 7, page 12 - Sources: TRRA 2011, MTCU 2010
Supply/Demand
Supply ~ Demand
Dem
and
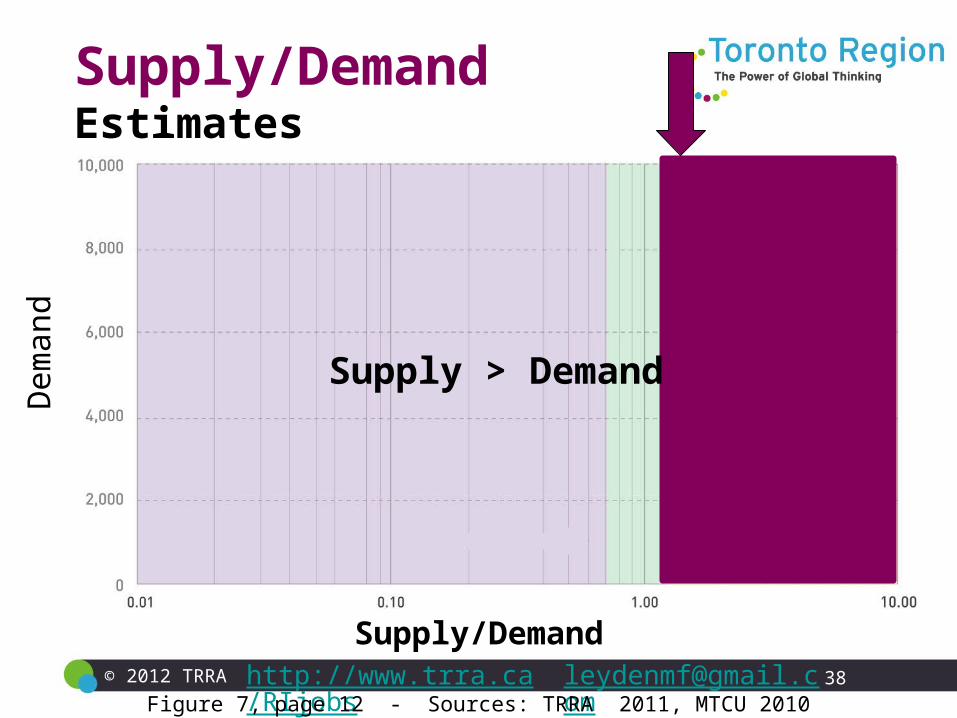
© 2012 TRRA 38http://www.trra.ca/RIjobs [email protected]
Supply/DemandEstimates
Figure 7, page 12 - Sources: TRRA 2011, MTCU 2010
Supply/Demand
Supply > Demand
Dem
and
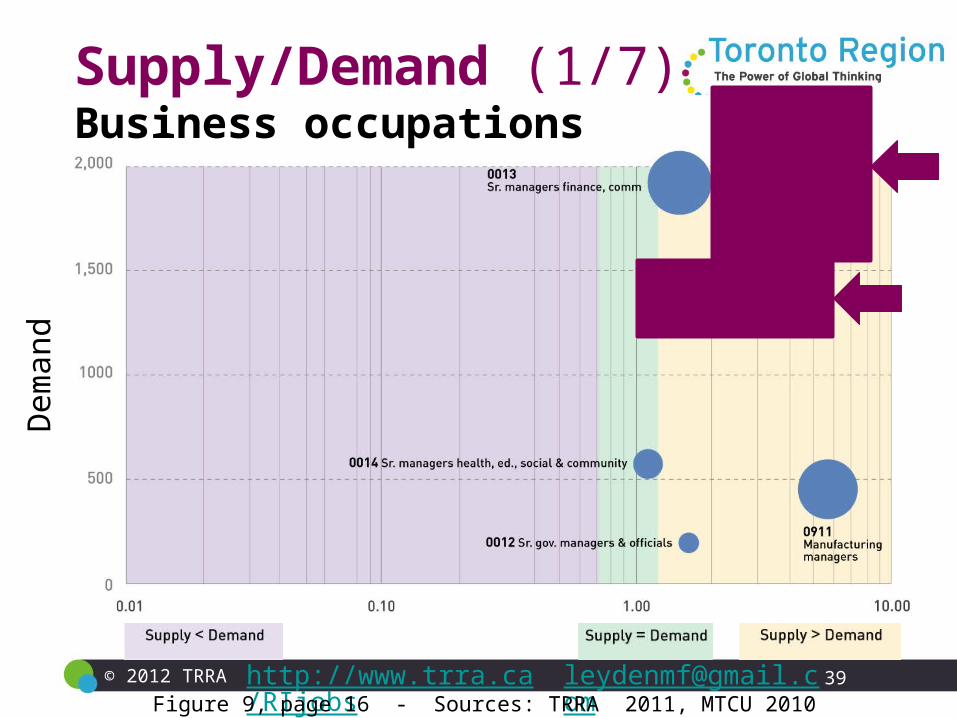
© 2012 TRRA 39http://www.trra.ca/RIjobs [email protected]
Supply/Demand (1/7)Business occupations
Figure 9, page 16 - Sources: TRRA 2011, MTCU 2010
Dem
and

© 2012 TRRA 40http://www.trra.ca/RIjobs [email protected] 11, page 18 - Sources: TRRA 2011, MTCU 2010
Dem
and
Supply/Demand (2/7)Occupations in Sciences
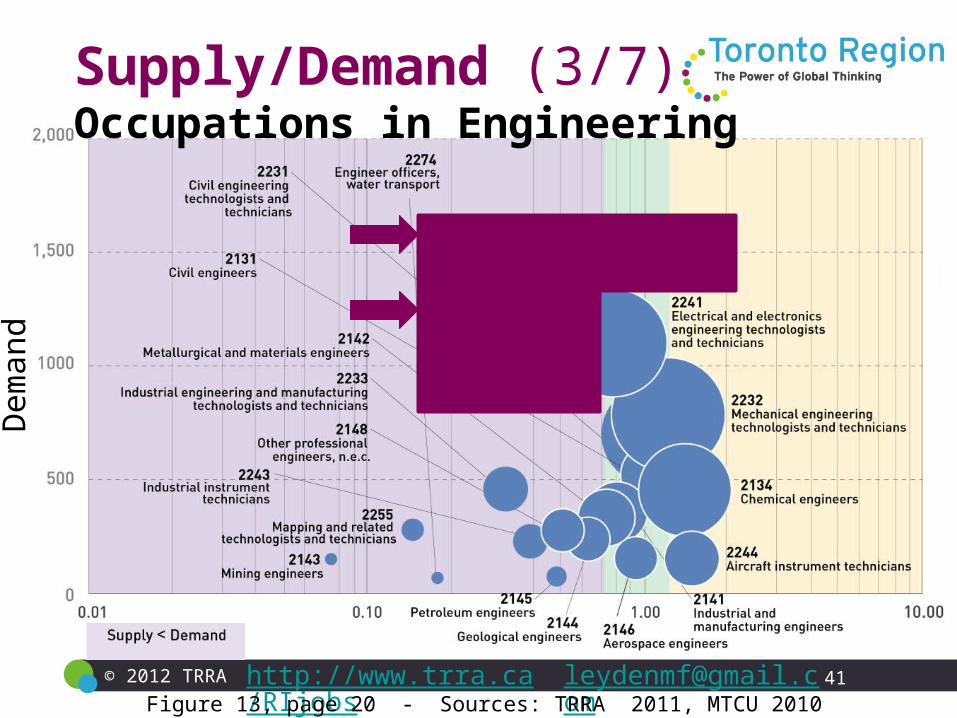
© 2012 TRRA 41http://www.trra.ca/RIjobs [email protected] 13, page 20 - Sources: TRRA 2011, MTCU 2010
Dem
and
Supply/Demand (3/7)Occupations in Engineering

© 2012 TRRA 42http://www.trra.ca/RIjobs [email protected]
Supply/Demand (4/7)IT occupations
Figure 15, page 22 - Sources: TRRA 2011, MTCU 2010
Dem
and

© 2012 TRRA 43http://www.trra.ca/RIjobs [email protected] 17, page 24 - Sources: TRRA 2011, MTCU 2010
Supply/Demand (5/7)Architecture & Design occupations
Dem
and

© 2012 TRRA 44http://www.trra.ca/RIjobs [email protected]
Supply/Demand (6/7)Occupations in Health
Figure 17, page 24 - Sources: TRRA 2011, MTCU 2010
Dem
and

© 2012 TRRA 45http://www.trra.ca/RIjobs [email protected]
Supply/Demand (7/7)Estimates per occupational group
Figure 7, page 12 - Sources: TRRA 2011, MTCU 2010
Dem
and

© 2012 TRRA 46http://www.trra.ca/RIjobs [email protected]
Supply/DemandYouth interest (Post-secondary students)
Figure 8, page 13 - Source: TRRA Youth Survey 2011

© 2012 TRRA 47http://www.trra.ca/RIjobs [email protected]
Supply/DemandYouth interest (Post-secondary students)
Figure 8, page 13 - Source: TRRA Youth Survey 2011

© 2012 TRRA 48http://www.trra.ca/RIjobs [email protected]
Supply/DemandYouth interest (Post-secondary students)
Figure 8, page 13 - Source: TRRA Youth Survey 2011

© 2012 TRRA 49http://www.trra.ca/RIjobs [email protected]
Agenda
1. Toronto Region Labour Market
• Strategic sectors
• Sectors and occupations
• Workforce supply/demand
2. International Scientific Production
• Patents
• Non-patent publications
• Resources and results
3. Conclusions

© 2012 TRRA 50http://www.trra.ca/RIjobs [email protected]
Scientific ProductionUS Patents (Granted in 2010-2011)

© 2012 TRRA 51http://www.trra.ca/RIjobs [email protected]
Scientific ProductionUS Patents (Granted in 2010-2011)
Table 16, page 34 - Source: Google Scholar 2012 (via Publish&Perish)

© 2012 TRRA 52http://www.trra.ca/RIjobs [email protected]
Scientific ProductionUS Patents (Granted in 2010-2011)
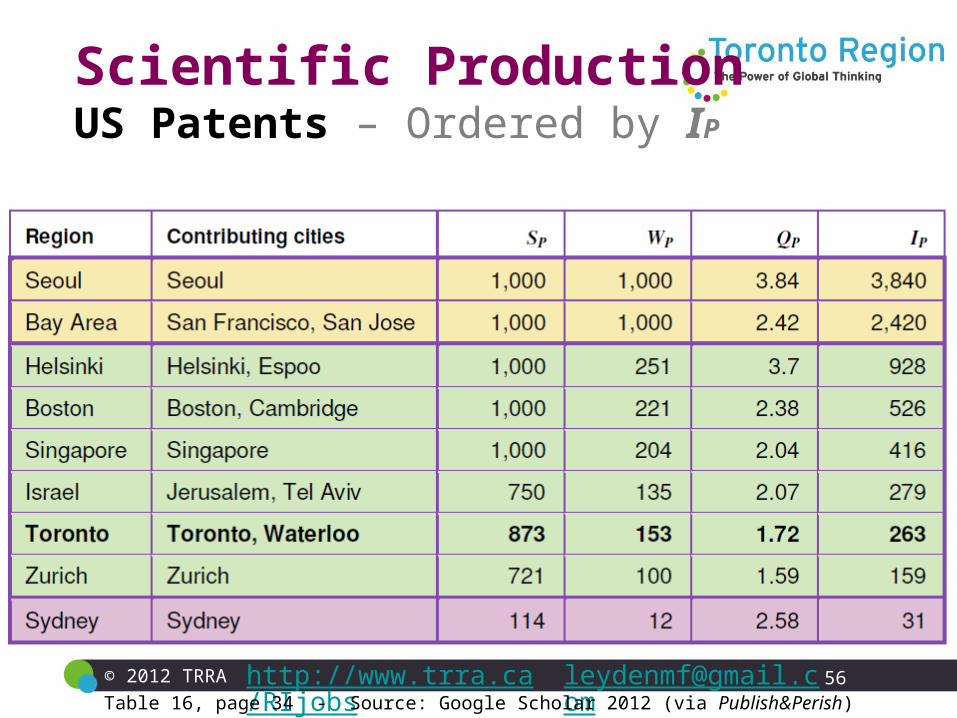
SPSize index
Sample of best patents, up to 1,000.
Table 16, page 34 - Source: Google Scholar 2012 (via Publish&Perish)
© 2012 TRRA 53http://www.trra.ca/RIjobs [email protected]
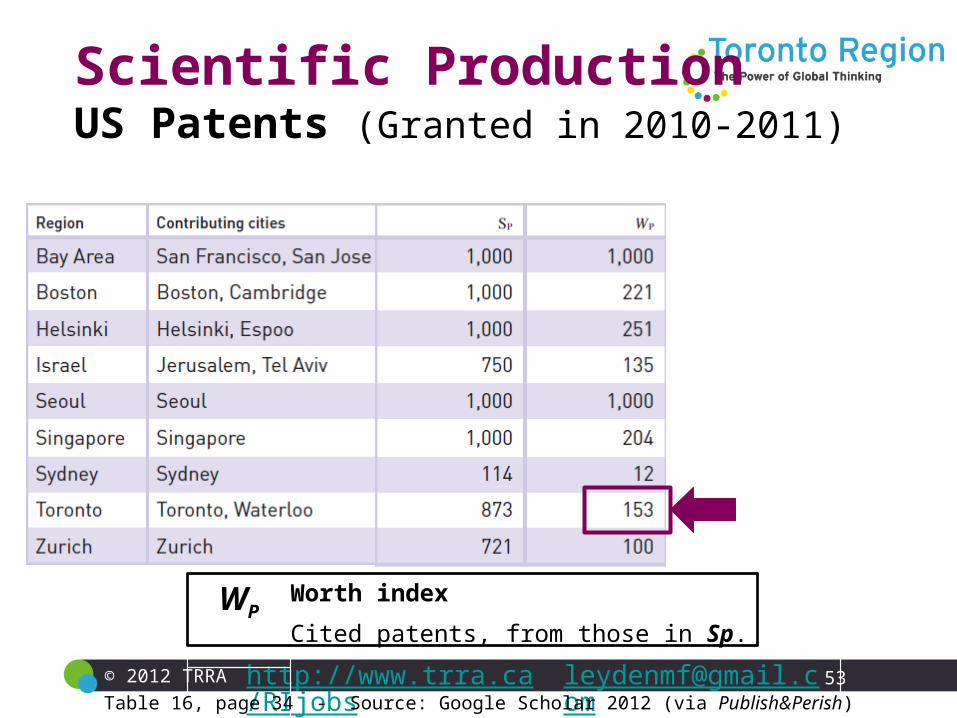
Scientific ProductionUS Patents (Granted in 2010-2011)
WPWorth index
Cited patents, from those in Sp.
Table 16, page 34 - Source: Google Scholar 2012 (via Publish&Perish)
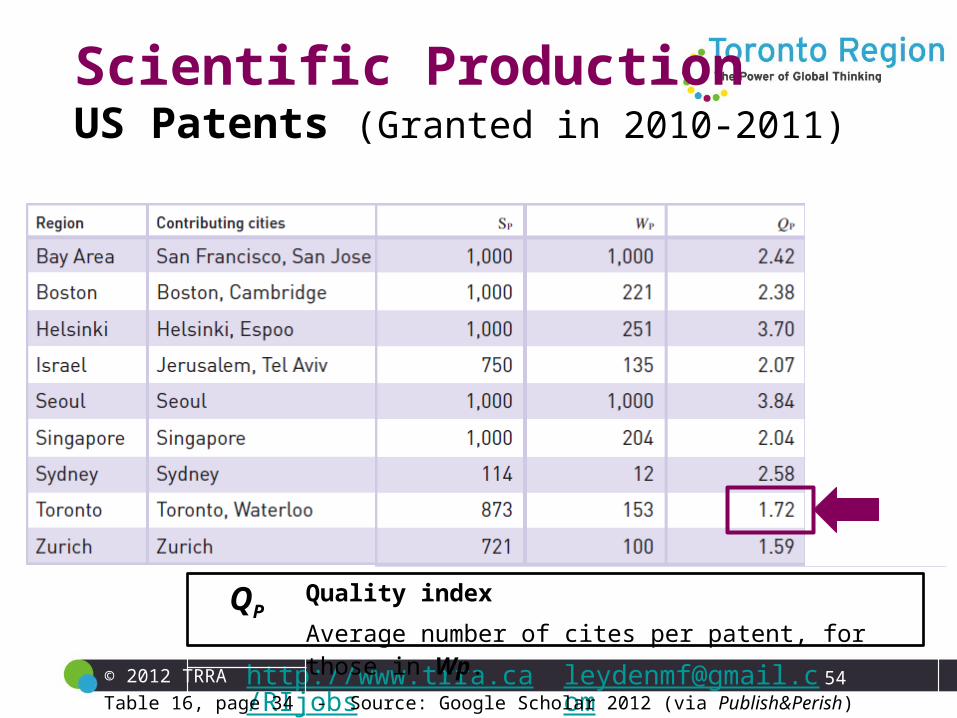
© 2012 TRRA 54http://www.trra.ca/RIjobs [email protected]
Scientific ProductionUS Patents (Granted in 2010-2011)
QPQuality index
Average number of cites per patent, for those in Wp.
Table 16, page 34 - Source: Google Scholar 2012 (via Publish&Perish)

© 2012 TRRA 55http://www.trra.ca/RIjobs [email protected]
Scientific ProductionUS Patents (Granted in 2010-2011)
IPIntegral index
Total number of cites for all patents in Wp.
Table 16, page 34 - Source: Google Scholar 2012 (via Publish&Perish)
© 2012 TRRA 56http://www.trra.ca/RIjobs [email protected]
Scientific ProductionUS Patents – Ordered by IP
Table 16, page 34 - Source: Google Scholar 2012 (via Publish&Perish)

© 2012 TRRA 57http://www.trra.ca/RIjobs [email protected]
Agenda
1. Toronto Region Labour Market
• Strategic sectors
• Sectors and occupations
• Workforce supply/demand
2. International Scientific Production
• Patents
• Non-patent publications
• Resources and results
3. Conclusions
© 2012 TRRA 58http://www.trra.ca/RIjobs [email protected]
Scientific ProductionNon-patent publications
Table 17, page 37 - Source: Google Scholar 2012 (via Publish&Perish)
… produced by the top three universities per region,each with a sample of up to 1,000 publications.
© 2012 TRRA 59http://www.trra.ca/RIjobs [email protected]
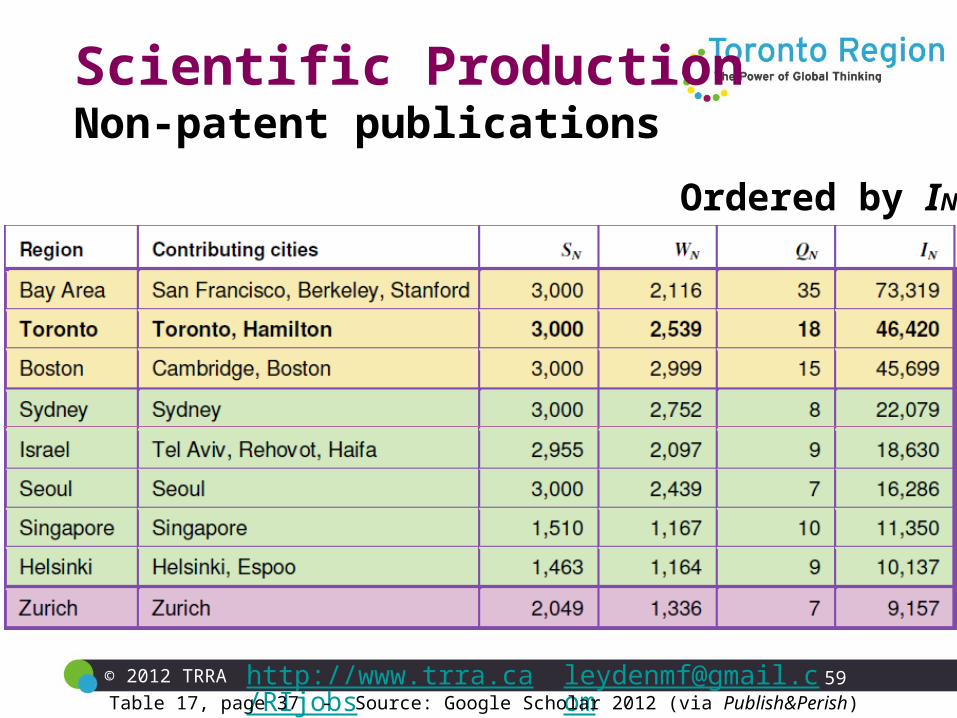
Ordered by IN
Scientific ProductionNon-patent publications
Table 17, page 37 - Source: Google Scholar 2012 (via Publish&Perish)

© 2012 TRRA 60http://www.trra.ca/RIjobs [email protected]
Agenda
1. Toronto Region Labour Market
• Strategic sectors
• Sectors and occupations
• Workforce supply/demand
2. International Scientific Production
• Patents
• Non-patent publications
• Resources and results
3. Conclusions

© 2012 TRRA 61http://www.trra.ca/RIjobs [email protected]
Scientific ProductionNon-patents vs. Financial Resources
Figure 22, page 39 - Sources: Google Scholar 2012, Websites of universities 2012
© 2012 TRRA 62http://www.trra.ca/RIjobs [email protected]
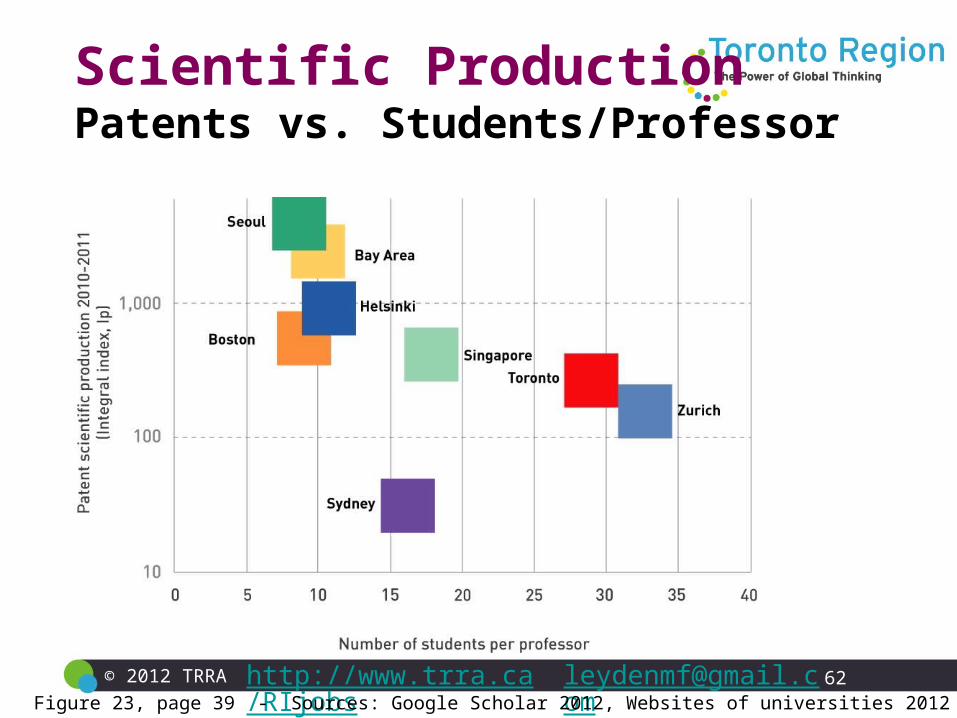
Scientific ProductionPatents vs. Students/Professor
Figure 23, page 39 - Sources: Google Scholar 2012, Websites of universities 2012

© 2012 TRRA 63http://www.trra.ca/RIjobs [email protected]
Agenda
1. Toronto Region Labour Market
• Strategic sectors
• Sectors and occupations
• Workforce supply/demand
2. International comparison
• Patents
• Non-patent publications
• Resources and results
3. Conclusions
© 2012 TRRA 64http://www.trra.ca/RIjobs [email protected]
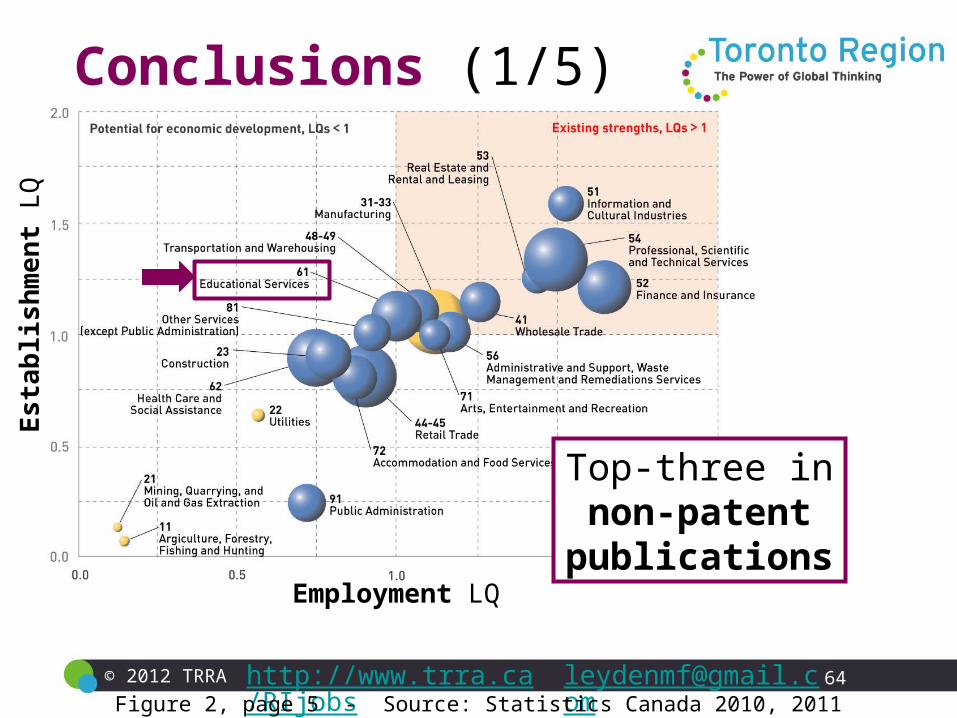
Conclusions (1/5)
Figure 2, page 5 - Source: Statistics Canada 2010, 2011
Es
tab
lish
men
t L
Q
Employment LQ
Top-three in non-patent
publications

© 2012 TRRA 65http://www.trra.ca/RIjobs [email protected]
Conclusions (2/5)
Figure 2, page 5 - Source: Statistics Canada 2010, 2011
Es
tab
lish
men
t L
Q
Employment LQ
Bottom-three in patents
IT and Engineering

© 2012 TRRA 66http://www.trra.ca/RIjobs [email protected]
Conclusions (3/5)
Figure 2, page 5 - Source: Statistics Canada 2010, 2011
Es
tab
lish
men
t L
Q
Employment LQ
High demandUndersupply
IT and Engineering

© 2012 TRRA 67http://www.trra.ca/RIjobs [email protected]
Conclusions (4/5)
Figure 2, page 5 - Source: Statistics Canada 2010, 2011
Es
tab
lish
men
t L
Q
Employment LQ
Oversupply
Sciences and Health
© 2012 TRRA 68http://www.trra.ca/RIjobs [email protected]
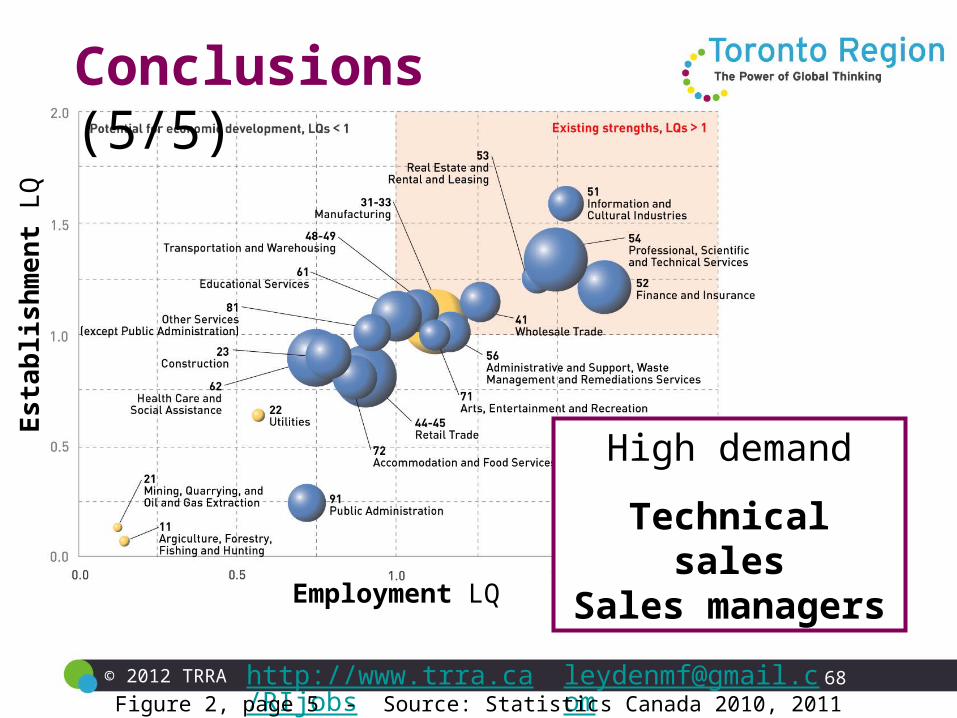
Conclusions (5/5)
Figure 2, page 5 - Source: Statistics Canada 2010, 2011
Es
tab
lish
men
t L
Q
Employment LQ
High demand
Technical salesSales managers

© 2012 TRRA 69http://www.trra.ca/RIjobs [email protected]
Conclusions1. Top-three in non-patent publications
2. Bottom-three in patents
3. High demand, undersupply for IT and Engineering
4. Oversupply in Sciences and Health
5. High demand in Technical sales, Sales manager
Leyden M. [email protected]
Questions?

© 2012 TRRA 70http://www.trra.ca/RIjobs [email protected]
Students’ panel
70
Moderator
Patrick Draper – Toronto Region Research Alliance

© 2012 TRRA 71http://www.trra.ca/RIjobs [email protected]
Experts’ panel
71
Darren Lawless – Sheridan College
David Ticoll – Canadian Coalition for Tomorrow’sICT Skills
Lesley Gouldie – studentawards.com
Kirk Patterson – Education at Work

© 2012 TRRA 72http://www.trra.ca/RIjobs [email protected]
Sponsored by
72
Research & Innovation Jobs
In partnership with


