29
RESEARCH METHODS CORRELATIONAL METHOD PSYCHOLOGICAL INVESTIGATIONS G541
| Date post: | 24-Dec-2015 |
| Category: |
Documents |
| Upload: | dwayne-chase |
| View: | 226 times |
| Download: | 3 times |

RESEARCH METHODS
CORRELATIONAL METHOD
PSYCHOLOGICAL INVESTIGATIONS G541

CHECKLIST: Correlation Describe the key features of the correlational method
Identify & describe what a positive, negative and zero correlation is.
Evaluation the correlational method
Be able to draw and label a scattergraph, showing the relationships between two variables.
Be able to interpret information shown on a scattergraph.
Identify the variables either as represented on a scattergraph or by drawing and labelling a scattergraph.
Discuss the reliability and validity of scattergraph.
Draw conclusions from scattergraph.

Worksheet 1: KEY WORDS
Complete the key terms related to this topic
You can use the resources and internet to help
Each definition should be at least two sentences long
You should use these terms where appropriate in your responses to exam questions
ACTIVITY 1


EXAMPLE ESQ: June 2012Psychologists conducted a study to investigate if there is a correlation between personality and length of mobile phone text messages. Twenty students aged 16-19 from one AS Psychology class attending a college In London were used. Personality was assessed by asking the participants to rate themselves using a scale of 1 (very Introvert - shy) to 10 (very extrovert - outgoing). The average number of words used in a text message over a period of one week was obtained from their phones.
1. Outline one strength and one weakness of the sample used in this study. (6)
2. Suggest an appropriate alternate hypothesis for this study. (4)3. Outline one strength and one weakness of the way personality was
measured in this study. (6)4. Explain what is meant by a negative correlation. (2)5. Describe how data was presented in a scatter graph. (2)
TOTAL: 20 MARKS
Worksheet 2: Summary of the Correlational Method
Outline key features of the correlational method Identify ethical issues related to the correlational method Outline 3 strengths of the correlational method Outline 3 weaknesses of the correlational method
ACTIVITY 2


KEY FEATURES: Correlation
Correlation is not a method of data collection but a data-analysistechnique. It is used in studies that are not experimental, i.e.cause and effect cannot be established. It enables relationshipsbetween variables to be established but not cause and effect.
Correlation is a data-analysis technique, not a method of data collection Correlations are relationships between variablesCorrelations can be positive or negative When a correlation is negative the values of one variable increases as the other decreases. When a correlation is positive the values of both variables increases or decrease together. Correlations are shown by drawing scattergraphs that show the relationship between participants‘ score/measurements on both variables.

Nature & Use Co-variables examined for positive, negative or zero association.
Advantages •Allows study of hypotheses that cannot be examined directly
•More data on more variables can be collected more quickly that in an experiment set-up
Disadvantages •Interpretation of results is difficult •Cause and effect cannot be established •Direction of causality is uncertain •Variables other than one of interest may be operating
Ethical Issues Misunderstanding of findings because causal relationship cannot be established
OVERVIEW: Correlation

RESOURCES: Correlation
• Internet• PowerPoint • Exam Style Questions (ESQ)


CORRELATION
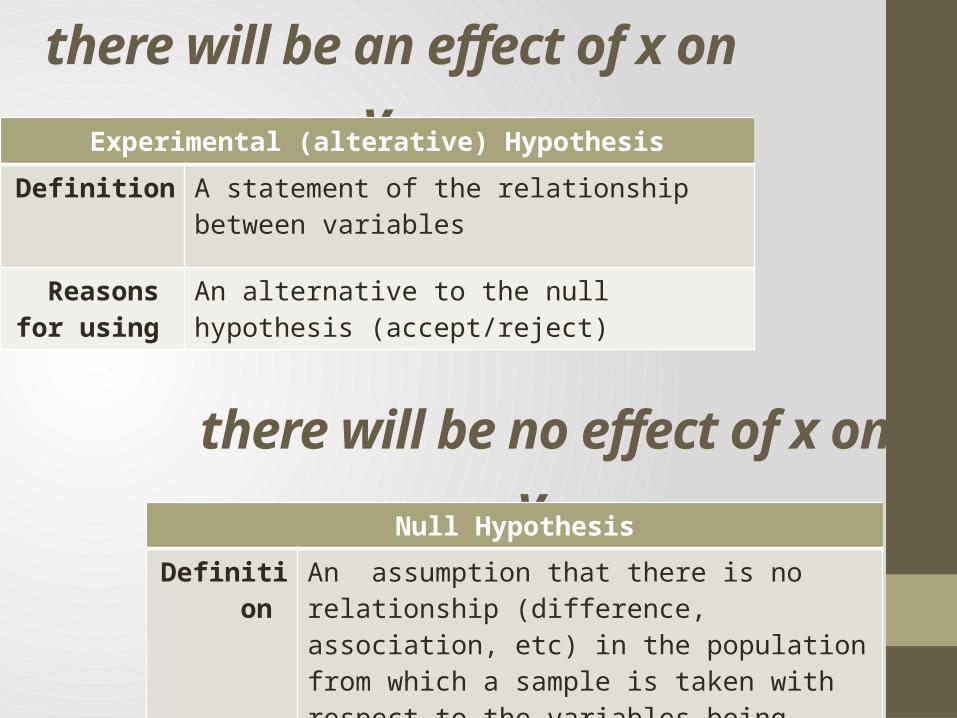
there will be an effect of x on yExperimental (alterative) Hypothesis
Definition A statement of the relationship between variables
Reasons for using
An alternative to the null hypothesis (accept/reject)
there will be no effect of x on yNull Hypothesis
Definition An assumption that there is no relationship (difference, association, etc) in the population from which a sample is taken with respect to the variables being studied.

Worksheet 3: Generate Hypothesis
ACTIVITY 1. Identify the independent variable (IV) and the dependent
variable (DV) from each hypothesis. 2. Identify whether your hypotheses are one tailed or two tailed
(remember one-tailed hypothesis predicts the direction of the effect of the IV on the DV, whereas a two-tailed hypothesis does not).
3. Write a null hypothesis for each of the experimental hypotheses.
ACTIVITY 3

Generate a hypothesis for each of the following:What are the effects of caffeine on attention
and concentration?What are the effects of stress on sleep?What are the effects of ....The relationship between aggressive
behaviour and watching aggressive TVThe relationship between car speed and
accidentsThe relationship between rainfall and
hosepipe bansThe relationship between hours of sunshine
and time spent on the beach
HYPOTHESIS: Correlation

DATA: Correlation Co-efficent
A correlation coefficient is a mathematical measure of thedegree of relationship between sets of data. Once caculated, itwill have a value between -1 and +1:• A PERFECT POSITIVE CORRELATION, indicated by +1, is where as
variable X increases, variable Y increases. • A PERFECT NEGATIVE CORRELATION, indicated by -1, is where as
variable X increases, variable Y decreases.
Analysing correlational data• Data can be plotted as points on a scattergraph. A line of best fit is
then drawn through the points to show the trend of the data. • If no line of best fit can be drawn, there is no correlation.
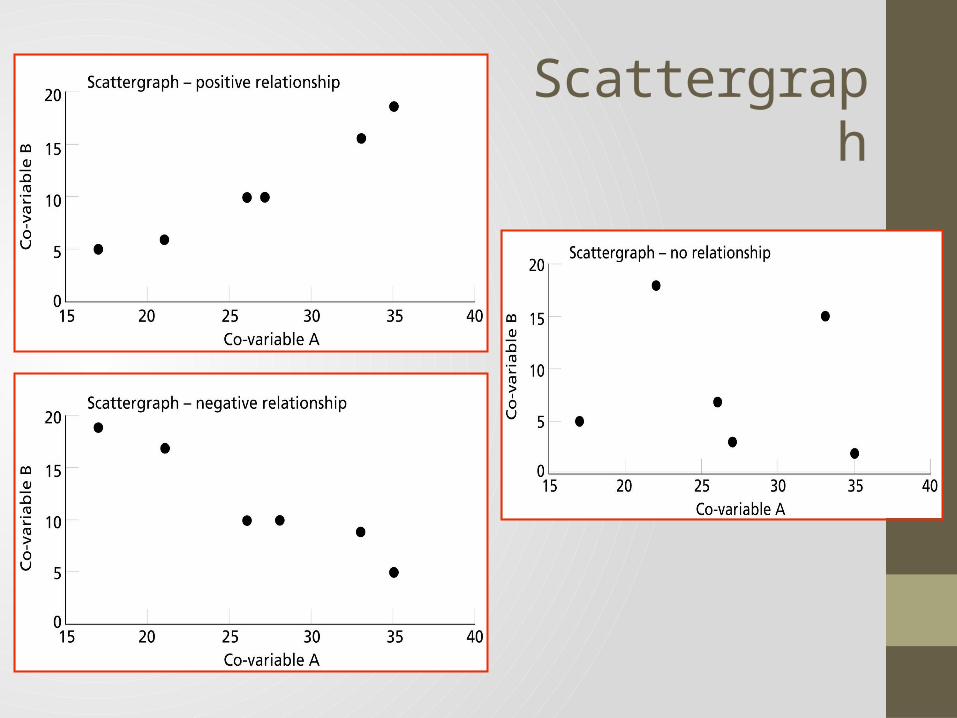
Scattergraph

Null Hypothesis
Definition An assumption that there is no relationship (difference, association, etc) in the population from which a sample is taken with respect to the variables being studied.
there will be no effect of x on y

Strengths Correlation is a useful tool in psychology as it allows use to measure the relationship between variables which it would be difficult or unethical to manipulate experimentally. For example we might be interested in investigating the relationship between reported stress and ill health. It would be impractical and unethical to manipulate stress or health. However, it is possible to correlate self-reported levels of stress with health data in order to establish whether there is a relationship between the two.
Weaknesses The major problem with correlational evidence is that correlation does not imply causation. In other words, just because two variables are correlated does not mean that one of the has cause the other to change.
EVALUATION: Correlation

PROCEDURE: Overview 5-7 marks 8-10 marks
Good description of procedure Good evaluation of procedure 2 strengths 2 weaknesses
In-depth description of procedure, including use of specialist terms
In-depth evaluation of procedure 3+ strengths 3+ weaknesses Good use of grammar and limited
spelling mistakes. Describe (4 marks) Evaluate (6 marks)
•Type•Timing (20 min)•Who•Location•When (time of day)•IV/DV
•Reliability•Validity•Ethics
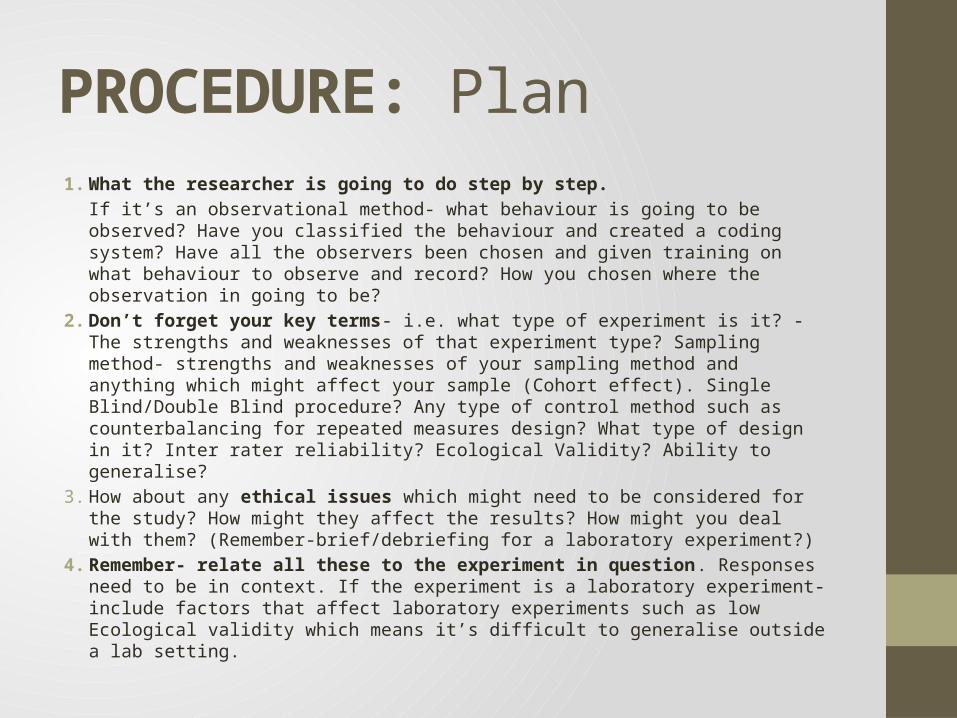
PROCEDURE: Plan1. What the researcher is going to do step by step.
If it’s an observational method- what behaviour is going to be observed? Have you classified the behaviour and created a coding system? Have all the observers been chosen and given training on what behaviour to observe and record? How you chosen where the observation in going to be?
2. Don’t forget your key terms- i.e. what type of experiment is it? - The strengths and weaknesses of that experiment type? Sampling method- strengths and weaknesses of your sampling method and anything which might affect your sample (Cohort effect). Single Blind/Double Blind procedure? Any type of control method such as counterbalancing for repeated measures design? What type of design in it? Inter rater reliability? Ecological Validity? Ability to generalise?
3. How about any ethical issues which might need to be considered for the study? How might they affect the results? How might you deal with them? (Remember-brief/debriefing for a laboratory experiment?)
4. Remember- relate all these to the experiment in question. Responses need to be in context. If the experiment is a laboratory experiment- include factors that affect laboratory experiments such as low Ecological validity which means it’s difficult to generalise outside a lab setting.
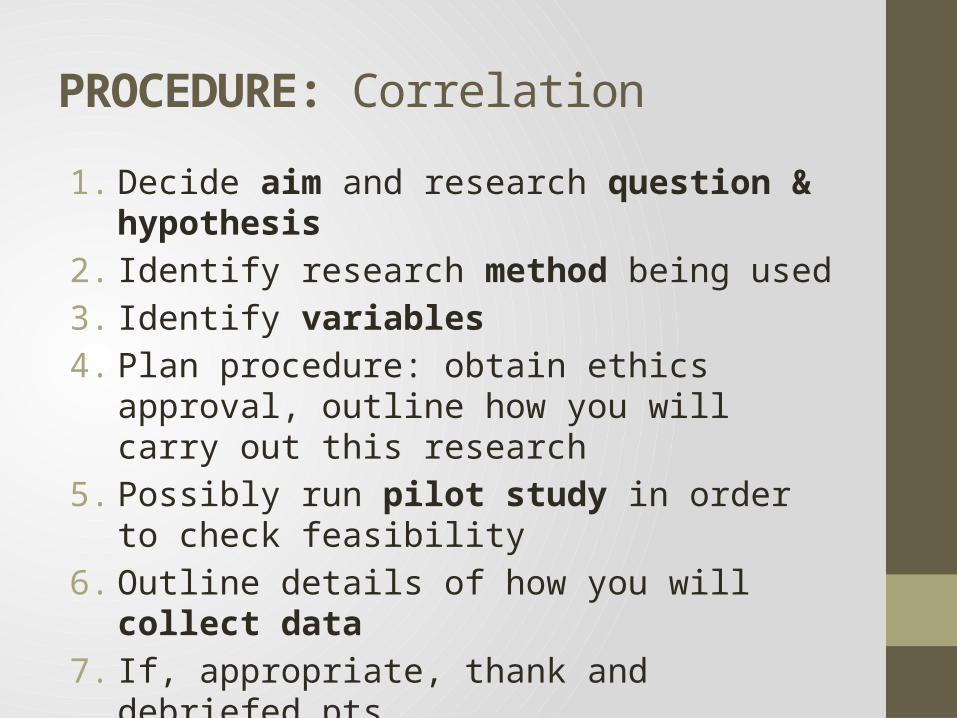
PROCEDURE: Correlation
1. Decide aim and research question & hypothesis2. Identify research method being used3. Identify variables4. Plan procedure: obtain ethics approval, outline how
you will carry out this research5. Possibly run pilot study in order to check feasibility 6. Outline details of how you will collect data 7. If, appropriate, thank and debriefed pts 8. Analyse data, produce findings and draw
conclusions 9. Write report of practical investigation

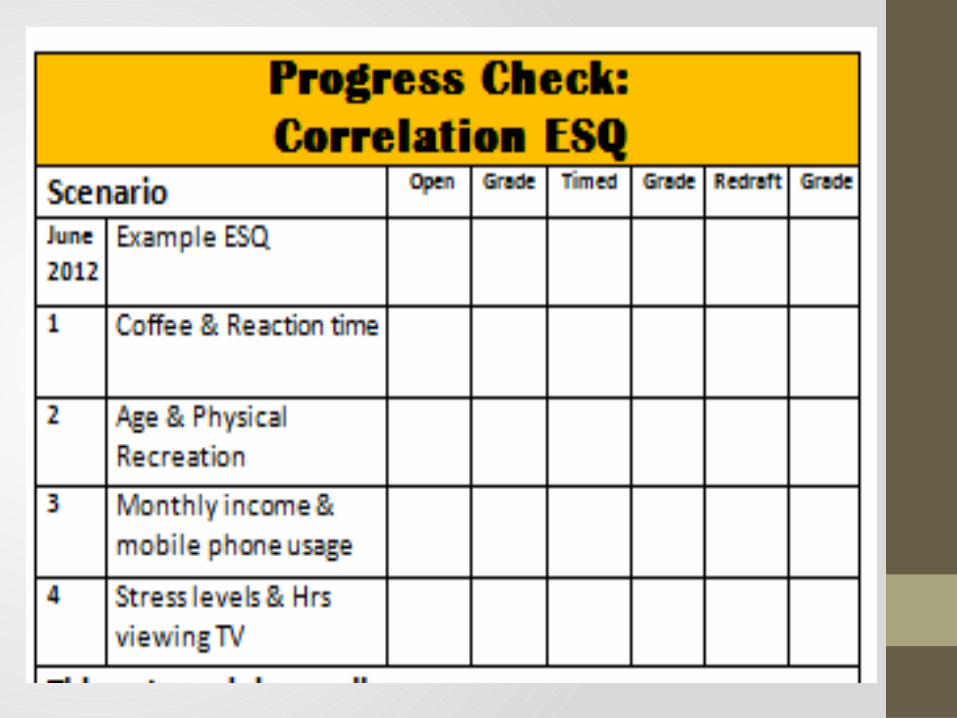
Worksheet 4: Exam Style Questions (ESQ)
Complete the following ESQ for correlationExample ESQ: June 2012 Scenario 1: Coffee & Reaction time Scenario 2: Age & Physical Recreation Scenario 3: Monthly income & mobile phone usageScenario 4: Stress levels & Hrs viewing TV
ACTIVITY 4

EXAMPLE ESQ: June 2012Psychologists conducted a study to investigate if there is a correlation between personality and length of mobile phone text messages. Twenty students aged 16-19 from one AS Psychology class attending a college In London were used. Personality was assessed by asking the participants to rate themselves using a scale of 1 (very Introvert - shy) to 10 (very extrovert - outgoing). The average number of words used in a text message over a period of one week was obtained from their phones.
1. Outline one strength and one weakness of the sample used in this study. (6)
2. Suggest an appropriate alternate hypothesis for this study. (4)3. Outline one strength and one weakness of the way personality was
measured in this study. (6)4. Explain what is meant by a negative correlation. (2)5. Describe how data was presented in a scatter graph. (2)
TOTAL: 20 MARKS

Exam Style Questions: Correlation
Scenario 1A researcher decided to investigate whether there is a relationship
between how much coffee people drink at breakfast and their reaction time. He anticipated that the findings would show a
negative correlation
1a. Describe the term ‘negative correlation’ in relation to this study (2) 1b. Formulate an appropriate alternative hypothesis for this investigation (2) 2a. Identify two extraneous variables that could influence the findings of this study (2) 2b. Outline how one extraneous variable could be controlled in this investigation (2) 3a. Describe an appropriate sampling technique that could be used to gather participants for this study (2) 4. Outline how the researchers could have conducted this study (8)
1

Scenario 2An occupational therapist wanted to
investigate whether there is a relationship between age and physical recreation. She therefore advertised in a local newspaper for participants between the ages of 18-80yrs to contact her, so she could send
them a lifestyle questionnaire to complete. A critical question in the
questionnaire measured the average time spent each week by the participant doing some form of physical activity, and there was a box at the top of the questionnaire
in which the participant was asked to state their age.
1a. Sketch a scattergraph to show the findings of this study (3)1b. Draw two conclusions from this scattergraph (4)2a. Describe the sampling technique used in this study (2) 2b. Suggest one strength of using this sampling technique in this study 3a. Describe one way in which time spent doing physical activity per week could have been measured in this study (3)3b. Describe one weakness of your suggested way of measuring participation in physical activity (2)4. Describe one practical problem the occupational therapist may have encountered with this study (4)
Age Range Mean time spent doing physical activity PW
18-25 120
26-35 100
36-45 30
46-55 90
55-65 75
66-75 60
76-80 40
2
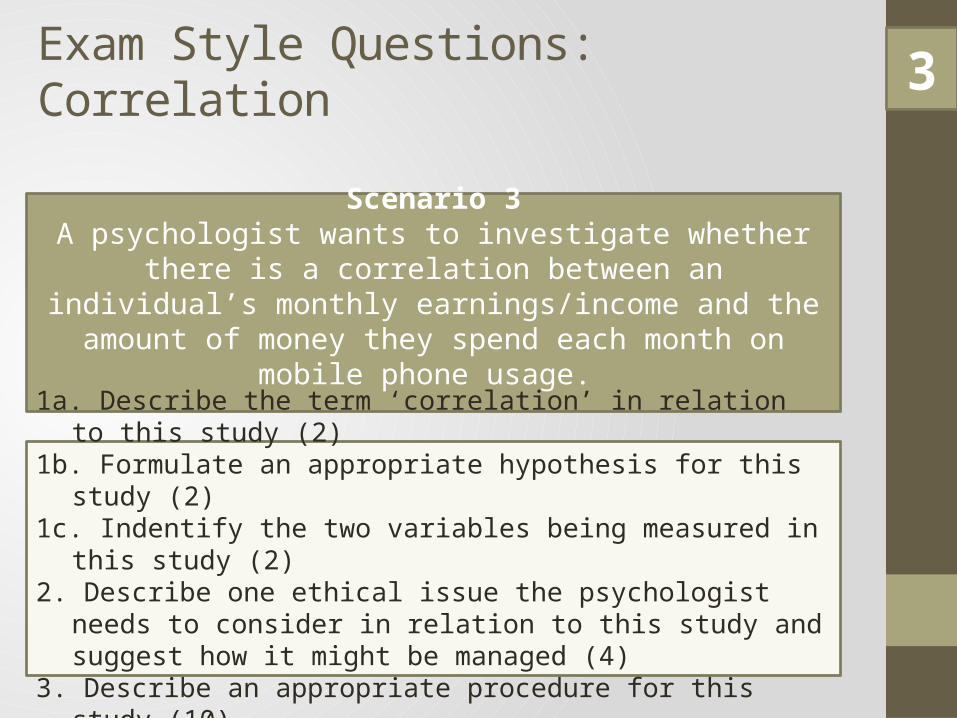
Scenario 3A psychologist wants to investigate whether there is a correlation
between an individual’s monthly earnings/income and the amount of money they spend each month on mobile phone usage.
1a. Describe the term ‘correlation’ in relation to this study (2)1b. Formulate an appropriate hypothesis for this study (2)1c. Indentify the two variables being measured in this study (2) 2. Describe one ethical issue the psychologist needs to consider in
relation to this study and suggest how it might be managed (4) 3. Describe an appropriate procedure for this study (10)
Exam Style Questions: Correlation 3

Scenario 4A researcher decided to investigate the relationship between perceived stress levels and the amount of time spent watching television. He first asked participants to complete a questionnaire to assess stress levels and then to estimate how many hours of television they watched each day.
1a. Describe one strengths of correlation (2) 1b. Describe one weakness of correlation (2)2a. Describe the correlation shown in the scattergraph (2) 2b. Suggest one conclusion that could be drawn from this scattergraph (2) 2c. Sketch an appropriate table, showing the findings from this investigation (4) 3a. Describe one disadvantage of using a questionnaire to measure stress levels (2) 3b. Suggest an alternative way stress levels could have been measured in this study (2)4. Briefly discuss the issue of validity in relation to this investigation (4)
0 2 4 6 8 10 120
20
40
60
80
100
120
140
Stress
Stress
4


![Correlational Research - Article[1]](https://static.documents.pub/doc/80x56/577d2ba41a28ab4e1eaaf991/correlational-research-article1.jpg)


