35
WRITING UP YOUR PROJECT 06.12.12 Research Methods
| Date post: | 25-Dec-2015 |
| Category: |
Documents |
| Upload: | joan-higgins |
| View: | 216 times |
| Download: | 0 times |

WRITING UP YOUR PROJECT
06.12.12
Research Methods

Research Projects
Background Literature Aims and Hypothesis Methods:
Study DesignData collection approachSample Size and PowerReliability and ValidityAnalysis strategy

Research Project
Results Discussion and Conclusion Limitations Acknowledgements
Disseminating your findings and getting published

Plan for the day
Results presentation and writing up Discussion Conclusion Getting published

RESULTS
Summary of your findings Consistent with your research method Use appropriate display of information
and analysis of data Relevant statistical techniques where
appropriate

RESULTS: How to present? How will you display your findings?
What are the options?

RESULTS
Aim – to present your information in a way that can be easily understood, yet includes relevant detail

Data analysis
Data cleaning: analyse mistakes/ illegible responses/ inconsistent results/ implausible numbersClarify which are accurate respondantsMay need to discard some data or go back
to check data

Data analysis
Missing data- identify if any missing data? Errors or omission

Data analysis
Re-coding To group variables in a form in which
you wish to analyse them
e.g. from continuous data to grouped sets
Eg age to age groups Should spot-check for errors Repeated by independent person –
compare and check results

Data analysis: Browsing data Central tendancy or characteristic of
dataMean- arithmetic averageMedian- middle valueMode- most common

Browsing Data
Variation in the data Range of values: Min – Max Standard Deviation – the average
distance of individual observation from the group mean

Data analysis
Differences within the data
Difference between means (t-test)
Differences between proportion (chi-squared)
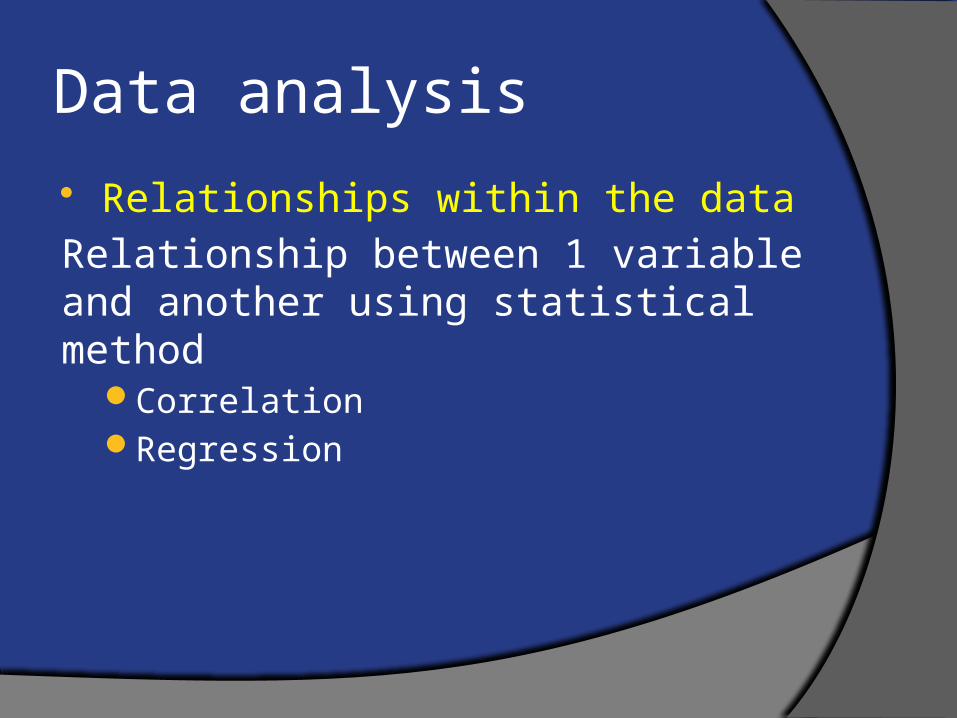
Data analysis
Relationships within the data
Relationship between 1 variable and another using statistical method
CorrelationRegression

Data analysis
Data transformations Transform variables:
Re-codeCountsScalingConditional transformations (transform 1
variable depending on another)

Types of data analysis
Univariate analysis: single variables Time series analysis- measuring
changes over time Bivariate analysis: pairs of data Multivariate analysis: >2 variables Cost effectiveness analysis Use effectiveness analysis

Comparing variables
Comparing variables – distribution between 2/+ groupsTesting difference between means (t-test)Comparing proportions: (Chi Squared)Comparing % in same sample at 2 different
points of time (McNemar test)Comparing > 2 means (ANOVA- analysis of
variance)

Results Section
Describe basic data – first things first! Text Table Graph Use of number, n and % Decimal points: general to 2 decimal 1.25
E.g. Number of patients included, excluded
Demographic data

Results
Describing dataRangeMean/Mode/MedianAny basic trendsConfidence Intervals and p-values
Progress into more detailed statistical analysis as appropriate

Results
Ensure use of tables/ graphs/charts is appropriate and to scale
Title, label and provide a key if needed
Pie charts- percentages Bar charts- comparison of different data Line graphs- change over time Histograms- continuous charted data

Results: tables
Should be concise Make sure it makes sense to read on its
own May need more than one table if it is
becoming large and unwieldy If complex data, a graph may be better

Presenting results
Takes more thought and practice than you might imagine
Exercise: Plan how you would present the findings of your research – what graphs, tables etc. would you use and why?
Draft some examples – dummy tables

Conclusion & Dicussion
Summarise your findings – key points Relate findings back to the literature
base and your own aims and objectives Discuss benefits of your study Discuss limitations

Getting published!
A significant achievement – personally, for cv and career
But cannot be taken for granted Consider the requirements of journals
and their reviewers

Preparing a publication
Why do you want it to be published? What does your research have to
contribute to the field? Is it timely, relevant and of interest? Consider WHO is audience? WHICH JOURNAL to publish in?

Preparing a publication
Consider which Journal might be willing to publish your researchArea of interestAudienceType of research/ articleImpact factor
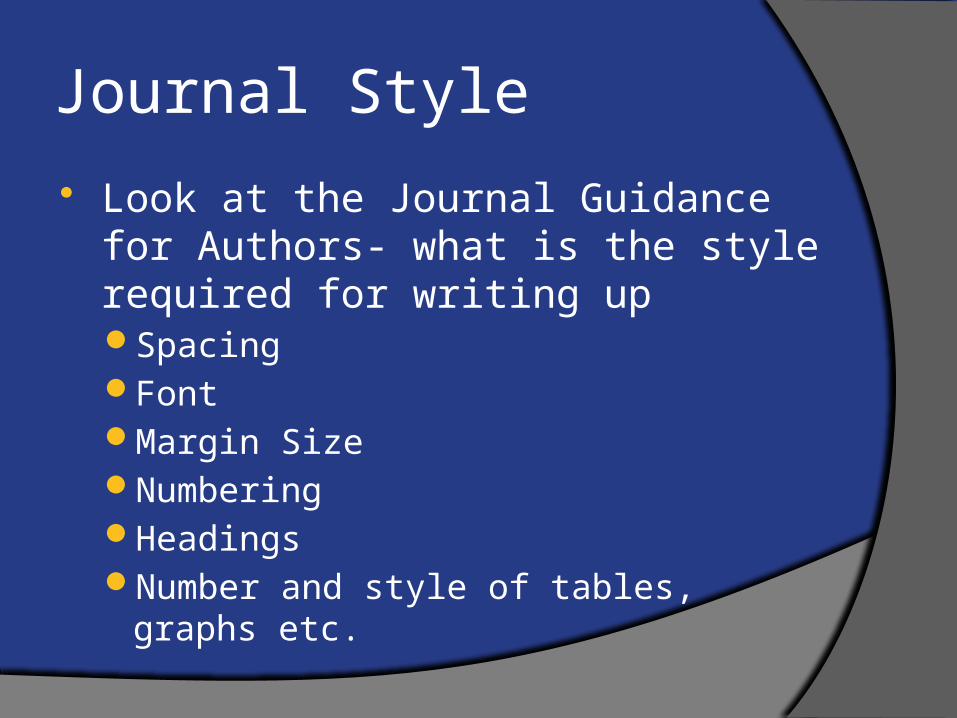
Journal Style
Look at the Journal Guidance for Authors- what is the style required for writing upSpacingFontMargin SizeNumberingHeadingsNumber and style of tables, graphs etc.

Journal Style
Abstract style Authorship Conflicts of interest
Word Count, Which type of paper your research meets – case report/ review/ original research/ commentary etc..

Journal Style
ReferencingNumber of referencesReference style – Vancouver, Harvard etc.

Writing up for publication What is key finding?
Structure article in way that will take the reader with you and engage them with the relevance of your findings

Writing up for publicationWrite a draft
Revise
Revise
Revise again!
Don’t get too disheartened..
Get feedback from others..

Writing up for publication Submit article – online log-in often May need to suggest reviewers Ensure you get submission deadline and
provide correct contact details Agree who is lead author on paper and
corresponding author Wait for feedback… and keep waiting..
Until hopefully you get a positive result!!

BARRIERS TO RESEARCH
INTERNAL- Previous experiences (good/bad)- Knowledge, skills and confidence- Own beliefs about research value- Prioritisation of time for research
In 5 minutes jot down your positive and negative internal influences on your research

BARRIERS TO RESEARCH
EXTERNAL Other commitments- practical/ work/
personal Technology issues Research supervision Support from others
Spend 5 minutes identifying external barriers to your research

Overcoming Barriers
Spend 5-10 minutes identifying an action plan for your research protocol- think about targets being: Specific Measurable Achievable Realistic Timely


