Derivatives Market Analysis: Interest Rate Derivatives December 2016 Research Note Twice a year, the International Swaps and Derivatives Association (ISDA) analyzes interest rate derivatives (IRD) notional outstanding data reported by the Bank for International Settlements (BIS) in order to illuminate market trends. The bank’s most recent analysis was released in November 2016. This publicly reported data does not describe several notable aspects of the derivatives market. For example, risk metrics associated with derivatives (such as the amount of risk being transferred, the payments that are exchanged between parties, or the maximum loss that would be incurred should every derivatives contract be closed out) cannot be conveyed through notional figures 1 . Additionally, the effects of clearing and compression skew BIS totals. Clearing acts to increase reported notional outstanding, as a single bilateral transaction is counted as two cleared trades once novated to a central counterparty (CCP). In contrast, compression reduces notional outstanding, which can make it seem like fewer trades are taking place. This report addresses the effects of clearing and compression on interest rate derivatives by adjusting reported notionals in order to provide a clearer estimate of derivative market trends. 1 Risk metrics fall outside the scope of this report. The BIS semiannual survey publishes statistics describing gross credit exposure, which is a measure of exposure to counterparty credit risk. The BIS asserts participants can reduce their exposure to this risk through netting agreements and collateral. BIS Semiannual Survey, June 2016, page 8, footnote 5
Twice a year, the International Swaps and Derivatives Association (ISDA) analyzes interest rate derivatives (IRD) notional outstanding data reported by the Bank for International Settlements (BIS) in order to illuminate market trends. The bank’s most recent analysis was released in November 2016.
This publicly reported data does not describe several notable aspects of the derivatives market. For example, risk metrics associated with derivatives (such as the amount of risk being transferred, the payments that are exchanged between parties, or the maximum loss that would be incurred should every derivatives contract be closed out) cannot be conveyed through notional figures1.
Additionally, the effects of clearing and compression skew BIS totals. Clearing acts to increase reported notional outstanding, as a single bilateral transaction is counted as two cleared trades once novated to a central counterparty (CCP). In contrast, compression reduces notional outstanding, which can make it seem like fewer trades are taking place.
This report addresses the effects of clearing and compression on interest rate derivatives by adjusting reported notionals in order to provide a clearer estimate of derivative market trends.
1 Risk metrics fall outside the scope of this report. The BIS semiannual survey publishes statistics describing gross credit exposure, which is a measure of exposure to counterparty credit risk. The BIS asserts participants can reduce their exposure to this risk through netting agreements and collateral. BIS Semiannual Survey, June 2016, page 8, footnote 5
ISDA Research NoteDerivatives Market Analysis: Interest Rate Derivatives - December 2016
2
2 ISDA used data from the BIS, LCH.Clearnet’s SwapClear, CME Group, Japan Securities Clearing Corporation (JSCC) and TriOptima. Other CCPs also clear IRD, but are excluded from this analysis, including the Australian Securities Exchange, Eurex, Nasdaq OMX, OTC Clearing Hong Kong, Singapore Exchange, Shanghai Clearing House and Korea Exchange
SUMMARY
The BIS publishes derivatives notional outstanding data on a semiannual basis. Its most recent survey report combines end-June 2016 results from semiannual as well as a triannual surveys, which results in data points from a broader universe of dealers. Although these statistics can provide fairly granular information on swap market trends, our report brings to light the impact of two countervailing factors: clearing and compression.
Clearing increases notional outstanding, as a single bilateral trade is reported as two separate transactions within the BIS statistics (one between party A and the clearing house and one between party B and the clearing house). The BIS semiannual notional outstanding data is not amended for this double counting of cleared transactions.
This research adjusts for this effect to provide an estimate of the proportion of total IRD notional outstanding that is currently cleared, as well as the proportion of clearable IRD notional outstanding that is cleared.
In contrast, compression has the opposite effect by acting to reduce notional outstanding through the cancelling or ‘netting’ of offsetting trades. In recent years, as balance sheet real estate has become scarcer, more of the swaps market has been compressed. The BIS figures are reported after compression has occurred, which makes it difficult to draw any conclusion about underlying derivatives market activity2.
HIGHLIGHTS
• Clearing and compression are together having an important impact on IRD notional outstanding figures. After adjusting for the double counting of cleared trades in BIS statistics, ISDA estimates that 71.5% of IRD notional outstanding was cleared at the end of the first half of 2016.
• ISDA estimates that roughly 98% of IRD notional outstanding that can be cleared is being cleared. This takes into account IRD instruments that are not yet accepted for clearing, as well as the volume transacted by counterparties that are exempt from mandatory clearing.
• The BIS reported an increase of 8.9% in IRD notional outstanding in the six months to June 30, 2016, from $384.0 trillion to $418.1 trillion. The increase was attributed to a faster pace in clearing activity combined with slower growth in the volume of compressed trades.
• Overall IRD notional has been reduced by roughly 67% as a result of portfolio compression.
• After adjusting for the effects of clearing and compression, underlying IRD notional outstanding increased by 5.5% over the six-month period to June 30, 2016, from $697.5 trillion to $736.2 trillion.
ISDA Research NoteDerivatives Market Analysis: Interest Rate Derivatives - December 2016
3
MARKET SNAPSHOT AT JUNE 30, 2016
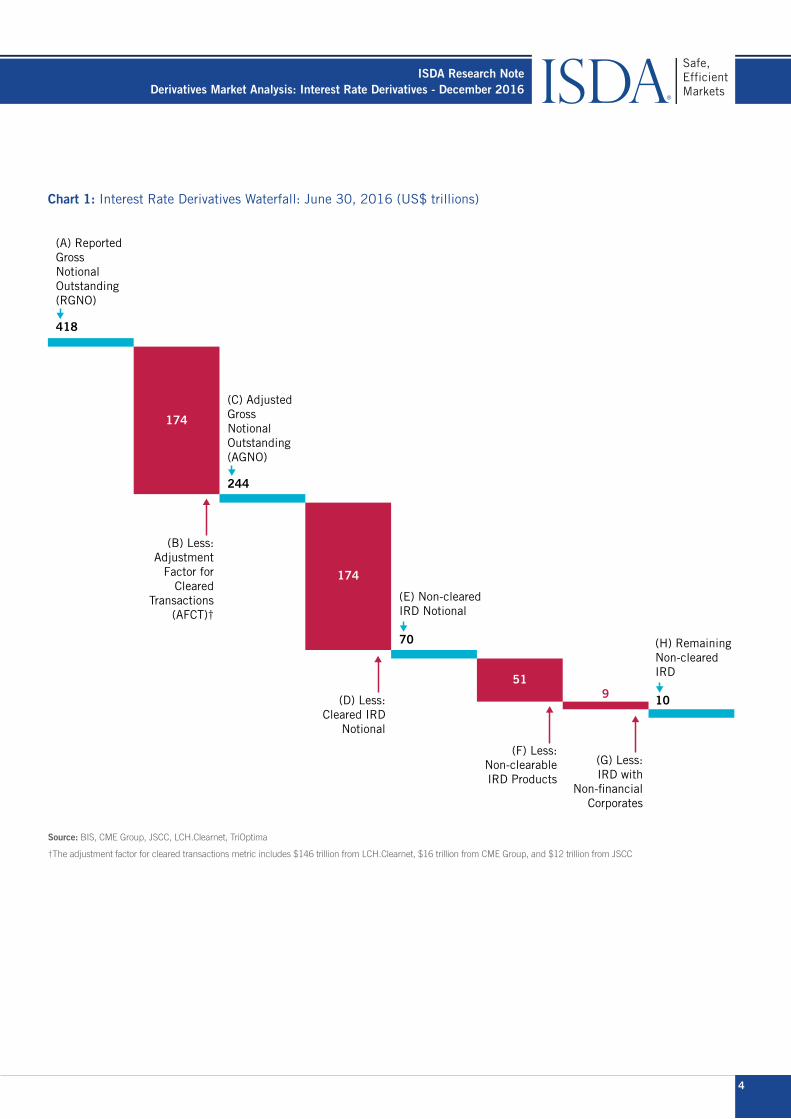
The first section of this report breaks down the proportion of the IRD market that is cleared. By making an adjustment for the double counting of cleared trades in publicly reported data, we can compare these transactions to bilaterally risk-managed swaps. This is illustrated in the waterfall analysis in Chart 1.
The analysis begins with the BIS notional outstanding headline figure on June 30, 2016 (column A). This figure is $418 trillion3.
The second leg of the waterfall adjusts the headline for the double counting of cleared trades. This is achieved by subtracting total cleared volume – estimated at $174 trillion at the end of the first half of 2016 (column B) – from reported gross notional outstanding. The difference of $244 trillion is the adjusted gross notional outstanding figure (column C).
The proportion of cleared IRD notional outstanding can then be calculated. Dividing total cleared volume ($174 trillion) by the adjusted notional outstanding figure ($244 trillion) shows that approximately 71.5% of IRD notional outstanding is currently cleared. This figure has increased from 67.5% at the end of 2015, which we will discuss in further detail later in the report.
The rest of the waterfall analysis focuses on the remainder of the IRD market. Subtracting total cleared volume from the adjusted notional outstanding figure gives the total size of the non-cleared segment. This totaled $70 trillion at the end of June 2016 (column E).
Of the $70 trillion, approximately $51 trillion (column F) comprises products that were not accepted for clearing mid-2016. These include many non-US dollar denominated swaptions4, cross-currency swaps5 and options6.
A certain proportion of trading activity is conducted with entities that qualify for an exemption to the clearing mandate – for instance, non-financial counterparties. ISDA estimates this portion to be approximately $9 trillion at the end of June 2016 (column G)7. It should be noted that this figure has declined over time as more voluntary clearing takes place.
Subtracting non-clearable products and trades with exempted counterparties from the non-cleared IRD total results in the amount of potentially clearable IRD notional outstanding that is not yet cleared: about $10 trillion (column H).
ISDA therefore estimates that approximately 98% of the clearable IRD market is currently cleared.
Nearly 98% of what can be cleared in the IRD market is now being cleared
3 All figures are rounded to whole numbers for the purposes of the waterfall analysis4 CME Group launched a clearing service for swaptions in April 2016, initially for certain US dollar-denominated interest rate swaptions with European-style exercise
5 HKEx’s OTC Clear began offering a limited cross-currency clearing service for offshore CNY/USD in August 2016, but HKEx clearing data is not included in this research
6 The $51 trillion figure consists of swaptions ($24.0 trillion), cross-currency swaps ($15.3 trillion), options including callable swaps ($9.2 trillion), and ‘other’ derivatives ($2.6 trillion)
7 According to BIS mid-2016 data, the notional value of IRD with non-financial corporates was $11.1 trillion. We estimate roughly 15% of the total exempt trades are non-clearable, which are already accounted for in the waterfall analysis (column f). The remaining amount – $9 trillion – is attributed to clearable IRD that remain non-cleared due to the exemption (column G)
ISDA Research NoteDerivatives Market Analysis: Interest Rate Derivatives - December 2016
†The adjustment factor for cleared transactions metric includes $146 trillion from LCH.Clearnet, $16 trillion from CME Group, and $12 trillion from JSCC
(A) Reported Gross Notional Outstanding (RGNO)
418
(C) Adjusted Gross Notional Outstanding (AGNO)
244
(E) Non-clearedIRD Notional
70 (H) Remaining Non-cleared IRD
10
174
174
519
(F) Less: Non-clearable IRD Products
(G) Less: IRD with
Non-financial Corporates
(B) Less: Adjustment
Factor for Cleared
Transactions (AFCT)†
(D) Less: Cleared IRD
Notional
ISDA Research NoteDerivatives Market Analysis: Interest Rate Derivatives - December 2016
5
IS THE IRD MARKET DECLINING AT A SLIGHTLY SLOWER PACE?
The BIS regularly reports derivatives gross notional outstanding volume as part of its semiannual statistical release8. These figures represent the gross volume of all derivatives transactions that are concluded and not yet settled by the reporting date. The metric is intended to provide a measure of market size and a reference from which contractual payments are determined in derivatives markets.
In its last semiannual analysis, the BIS reported an uptick in the overall size of the derivatives market – the first increase since the end of 2013. Total notional outstanding rose by 8.9%, from $384 trillion to $418.1 trillion in the six months to June 30, 2016.
The increase in the overall market was driven by growth in both interest rate swaps and forward rate agreements (FRAs). The former category grew 7.9% (from $288.6 trillion to $311.5 trillion). FRA volume increased 23.2% (from $58.3 trillion to $71.8 trillion) during this time.
Although useful, these notional outstanding figures are not adjusted for the effects of clearing and compression9,10. Clearing overstates the size of the market because cleared trades are reported twice in the BIS data. Conversely, compression understates market activity, as offsetting positions are cancelled out.
The next section of the report analyzes how these two opposing forces affect the IRD market in order to arrive at an estimate of underlying market size before clearing and compression occur.
THE EFFECT OF CLEARING
Since mandatory clearing came into force for a broad group of IRD products in some jurisdictions, the uptick in mandatory as well as voluntary clearing has been evident. Over the past three years, cleared volumes of two of the three CCPs presented in Table 1 has increased markedly. As a result, nearly three-quarters of the market is centrally cleared.
As mentioned previously, clearing acts to increase publicly reported notional outstanding figures, as each bilateral trade is counted as two transactions once novated to a CCP. To eliminate the double counting, an ‘adjustment factor’ – which is based on the outstanding figures of the three CCPs included in the report – is required.
This measure – which we refer to as the adjustment factor for cleared transactions (AFCT) – has recently increased from $154.7 trillion to $174.3 trillion during the six months to end-June 2016. Looking at a longer history reveals that this aggregated measure has fallen over the past two years – since end-June 2014.
8 For more information: www.bis.org 9 According to the BIS, when a derivatives contract between two reporting dealers is cleared by a CCP, this contract is replaced, in an operation called a novation, by two new contracts: one between counterparty A and the CCP, and a second between the CCP and counterparty B. For more information on clearing methodology: BIS Semiannual Survey, June 2016, page 6, footnote 4
10 Compression bundles derivatives contracts with similar risks or cash flows into fewer trades. It is a process for tearing up trades that allows economically redundant derivatives trades to be terminated early without changing each participant’s net position. BIS Semiannual Survey, June 2016, page 5, footnotes 2-3
Combined changes in clearing and compression effects distort trends in publicly reported derivatives volume
Cleared notional increased from 67.5% to 71.5% in the six months leading up to June 2016
ISDA Research NoteDerivatives Market Analysis: Interest Rate Derivatives - December 2016
6
The adjustment factor for cleared transactions (AFCT) is subtracted from the BIS reported gross notional outstanding figure (RGNO) to arrive at an adjusted gross notional outstanding number (AGNO) – essentially, a notional outstanding metric that is modified to remove the double counting.
Adjusting for the effects of double counting reduces the size of IRD notional outstanding by 42%. Roughly 2% more outstanding volume has been reduced versus six months ago. The most recent AGNO stood at $243.8 trillion, compared to $229.3 trillion at the end of 2015. The BIS-reported figures (RGNOs) increased from $384 trillion to $418.1 trillion at this time.
ISDA Research NoteDerivatives Market Analysis: Interest Rate Derivatives - December 2016
7
Chart 2, which compares the BIS figures (RGNO) and the adjusted notional outstanding numbers (AGNO), shows an interesting pattern. From December 2013 to December 2015, both measures have trended lower. Most recently, there has been an uptick as notional cleared and headline figures (blue line) increased, leading to a larger AGNO (red line).
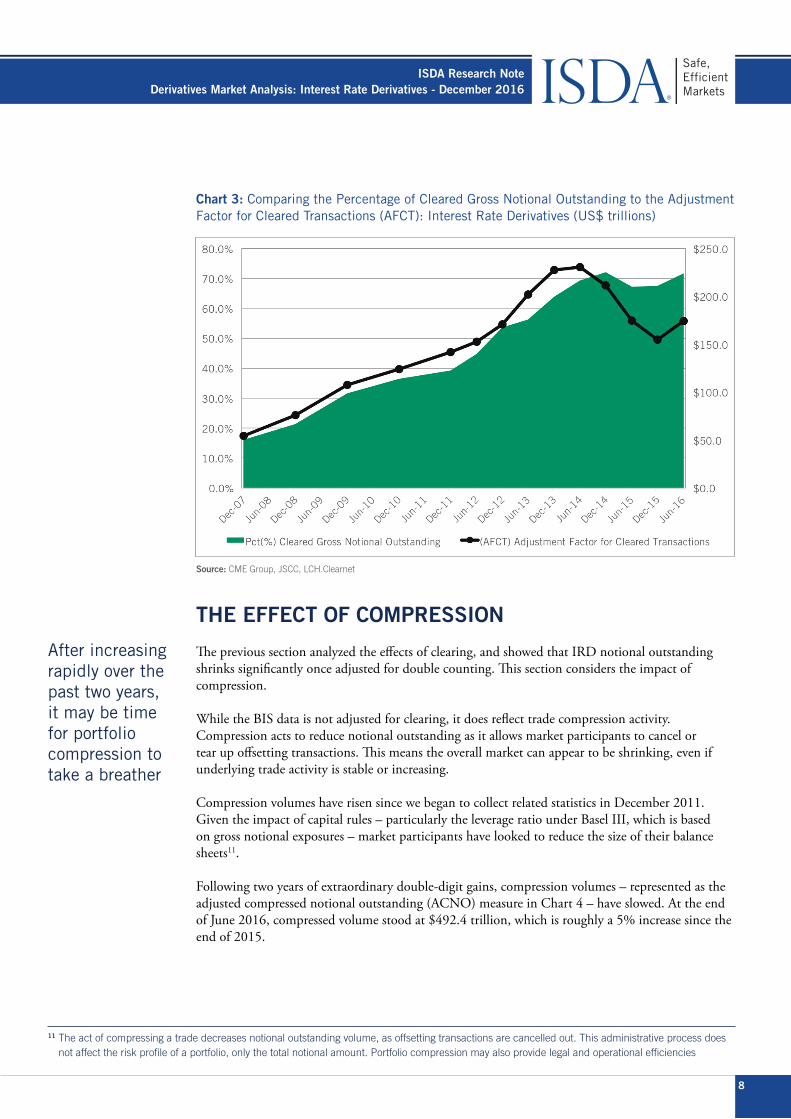
The increased volume of cleared trades over this period is illustrated by Chart 3 (green area). After leveling off during 2015, the chart shows an uptick in cleared notional outstanding to 71.5% at mid-year 2016.
Chart 3 also shows how the adjustment factor (ie, the total amount of cleared volume) has changed over time (AFCT – black line). After climbing steadily to reach a high of $230.5 trillion at the end of June 2014, clearing volumes have mostly fallen. The recent increase to $174.3 trillion mainly reflects increased outstanding volume at one CCP.
Declines in the AFCT metric typically reflect increases in portfolio compression activity, which reduces both cleared notional outstanding within CCPs and the overall size of the market. (This is discussed in the next section.) Whether the increase in the AFCT represents a pause in the speed and breadth of portfolio compression remains to be seen.
ISDA Research NoteDerivatives Market Analysis: Interest Rate Derivatives - December 2016
8
Chart 3: Comparing the Percentage of Cleared Gross Notional Outstanding to the Adjustment Factor for Cleared Transactions (AFCT): Interest Rate Derivatives (US$ trillions)
Source: CME Group, JSCC, LCH.Clearnet
THE EFFECT OF COMPRESSION
The previous section analyzed the effects of clearing, and showed that IRD notional outstanding shrinks significantly once adjusted for double counting. This section considers the impact of compression.
While the BIS data is not adjusted for clearing, it does reflect trade compression activity. Compression acts to reduce notional outstanding as it allows market participants to cancel or tear up offsetting transactions. This means the overall market can appear to be shrinking, even if underlying trade activity is stable or increasing.
Compression volumes have risen since we began to collect related statistics in December 2011. Given the impact of capital rules – particularly the leverage ratio under Basel III, which is based on gross notional exposures – market participants have looked to reduce the size of their balance sheets11.
Following two years of extraordinary double-digit gains, compression volumes – represented as the adjusted compressed notional outstanding (ACNO) measure in Chart 4 – have slowed. At the end of June 2016, compressed volume stood at $492.4 trillion, which is roughly a 5% increase since the end of 2015.
After increasing rapidly over the past two years, it may be time for portfolio compression to take a breather
11 The act of compressing a trade decreases notional outstanding volume, as offsetting transactions are cancelled out. This administrative process does not affect the risk profile of a portfolio, only the total notional amount. Portfolio compression may also provide legal and operational efficiencies
ISDA Research NoteDerivatives Market Analysis: Interest Rate Derivatives - December 2016
9
In order to better understand underlying IRD market activity, compression volumes must be added back to the adjusted notional outstanding (AGNO) figure calculated in the last section12.
The ACNO is calculated using data from TriOptima’s triReduce service13. Chart 4 depicts how this metric has changed over time. Since the beginning of the series, compressed volume has increased about 261%, from $136.4 trillion to $492.4 trillion (black line).
The adjusted compressed notional outstanding figure comprises solo and triReduce multilateral compression activity. Solo compression was estimated at $227.3 trillion by mid-2016 (dotted line), while triReduce’s figures stood at $265.1 trillion (dashed line).
Overall, IRD notional has been reduced by roughly 67% as a result of portfolio compression.
Chart 4: Adjusted Compressed Notional Outstanding (ACNO) Volume (US$ trillions) and Percentage of Market Compressed: Interest Rate Derivatives
Source: TriOptima
12 See adjusted compressed notional outstanding methodology in the Appendix13 For more information: www.trioptima.com
• The size of the market assuming no clearing activity, but including portfolio compression (red line).
• Market size after factoring out the impact of clearing and compression, which we refer to as the derived gross notional outstanding, or DGNO (orange line).
In comparing the DGNO (orange line) to the BIS numbers (blue line), several trends become clear:
• While the BIS reported an 8.9% increase in IRD gross notional outstanding figures in the six months to June 30, 2016, (from $384 trillion to $418.1 trillion) notional outstanding grew less after factoring out the effects of clearing and compression.
• Adjusted gross notional outstanding increased by 5.5% at this time, from $697.5 trillion to $736.2 trillion.
• Therefore, the ‘breather’ in portfolio compression (which has still grown, just at a slower pace) has taken less outstanding volume from the market than in recent periods. When combined with the increase in clearing (which has typically increased, just by a bit more recently), the underlying number is smaller than the headline, because less volume is ‘added back’ to figures adjusted for the effects of clearing.
While publicly reported figures grew 8.9% over the six months to June 2016, underlying IRD notional outstanding increased 5.5%
ISDA Research NoteDerivatives Market Analysis: Interest Rate Derivatives - December 2016
11
Table 2 adjusts the BIS reported figures for the effects of clearing and compression over the past five years. The first row describes what the market would look like had portfolio compression never occurred. At the end of June 2016, IRD gross notional outstanding would have been more than double the BIS figures, at $910.5 trillion.
However, the goal of this report is to adjust the BIS data for both compression and the double counting of cleared trades. To achieve that, compressed notional volume (ACNO) needs to be added to the notional outstanding metric adjusted for double counting (AGNO). The result is a derived gross notional outstanding figure (DGNO), which represents the underlying IRD market before compression and clearing occurs.
Since December 2011, the DGNO has increased by about 48%. As of June 30, 2016, the metric stood at $736.2 trillion, a 5.5% increase over the second half of 2016.
Table 2: Tying it all Together: The Derived Gross Notional Outstanding Measure (DGNO) of Market Size: Interest Rate Derivatives (US$ trillions)
CONCLUSION
The effects of clearing and compression skew publicly reported derivatives notional outstanding data. Clearing acts to increase reported notional outstanding, as a single bilateral transaction is counted as two cleared trades once novated to a central counterparty. In contrast, compression reduces notional outstanding, which can make it seem like fewer trades are taking place.
Recently, publicly reported figures reflected an 8.9% increase in outstanding volume during the six months to June 30, 2016 – the first increase in two and a half years. At this time, we estimate the underlying market before clearing and compression increased at a slower pace of 5.5%.
Lower growth in the estimated figure was the result of a faster pace in clearing combined with a slower pace in portfolio compression. While both measures increased over the six months to end-June 2016, it remains to be seen whether the pace of clearing will continue to accelerate quickly as compression takes a breather.
Underlying IRD notional outstanding grew 5.5% in the six months to mid-2016
ISDA Research NoteDerivatives Market Analysis: Interest Rate Derivatives - December 2016
12
GLOSSARY
Reported Gross Notional Outstanding (RGNO)This refers to BIS statistics describing the notional value of all deals concluded and not yet settled on the reporting date as part of its semiannual statistical release.
Derived Gross Notional Outstanding (DGNO) This reflects interest rate derivatives notional outstanding before clearing and compression effects. The DGNO is calculated by adding the AGNO and ACNO figures.
Adjustment Factor for Cleared Transactions (AFCT) Clearing house data is aggregated to determine the level of interest rate derivatives outstanding that has been cleared. This aggregation produces a metric that adjusts for the double counting of cleared notional outstanding volume reported by the BIS.
Adjusted Gross Notional Outstanding (AGNO) The AGNO metric reflects the difference between the RGNO and AFTC metrics. The AGNO represents the state of the market before clearing occurs.
Adjusted Compressed Notional Outstanding (ACNO) TriOptima triReduce statistics (which represent multilateral compression) and a proxy of CCP solo compression are used to evaluate the level of IRD outstanding compression volume. These figures have been adjusted for trades otherwise maturing.
Pct (%) Cleared Gross Notional Outstanding: This metric is defined as the AGNO, or the state of the market before clearing occurs, divided by the AFCT, or the level of IRD outstanding that has been cleared.
APPENDIX
ACNO MethodologyTriOptima’s triReduce data is used as a proxy to evaluate the level of IRD portfolio compression. CCP compressed figures have been adjusted for double counting and are combined with non-CCP compressions.
Two types of compression are typically used to reduce gross notional volumes: solo and multilateral. TriOptima’s triReduce CCP data represents only multilateral compression volume conducted within a clearing house. In the absence of solo compression data, CCP triReduce volumes have been doubled to account for both types of compression. The resulting figure is used to arrive at an adjusted compressed notional outstanding (ACNO) estimate14.
Growth of compressed volume stems from cleared positions, which account for roughly 86% of the triReduce total. Non-CCP compression accounts for a smaller portion, and has been declining since December 2012.
14 TriOptima triReduce outstanding compressed volume statistics are adjusted for trades otherwise maturing in order to arrive at an ACNO metric that can be compared to the AGNO statistic. Similarly adjusted CCP data was not available for this study
ISDA has published other recent research papers:
• Trends in IRD Clearing and SEF Trading, December 2016 http://www2.isda.org/attachment/OTAzMA==/Trends%20in%20IRD%20Clearing%20and%20SEF%20Trading1.pdf
• Key Trends in Clearing for Small Derivatives Users, October 2016 http://www2.isda.org/attachment/ODc5Mw==/Key%20Trends%20in%20Clearing%20for%20Small%20Derivatives%20Users%20FINAL.pdf
• SwapsInfo Second Quarter 2016 Review, August 2016 http://www2.isda.org/attachment/ODY0Nw==/Swaps%20review%20August%202016%20FINAL.pdf
ABOUT ISDA
Since 1985, ISDA has worked to make the global derivatives markets safer and more efficient. Today, ISDA has over 850 member institutions from 66 countries. These members comprise a broad range of derivatives market participants, including corporations, investment managers,
government and supranational entities, insurance companies, energy and commodities firms, and international and regional banks. In addition to market participants, members also include key components of the derivatives market infrastructure, such as exchanges, clearing houses and
repositories, as well as law firms, accounting firms and other service providers. Information about ISDA and its activities is available on the Association’s website: www.isda.org.
ISDA® is a registered trademark of the International Swaps and Derivatives Association, Inc.
For more on ISDA Research, please contact:Audrey Costabile Blater, PhDDirector of Research, [email protected]
www.isda.orgNEW YORK | LONDON | HONG KONG | TOKYO | WASHINGTON | BRUSSELS | SINGAPORE


![[Derivatives Consulting Group] Introduction to Equity Derivatives](https://static.documents.pub/doc/80x56/5525eed15503467c6f8b4b12/derivatives-consulting-group-introduction-to-equity-derivatives.jpg)
