1 Div. of Applied Thermodynamics and Refrigeration, Dept. of Energy Technology, Royal Institute of Technology Research on CO 2 Heat Pumps and Other CO 2 Novel Systems at The Energy Department of KTH Yang Chen (KTH) Per Lundqvist (KTH)
Transcript
1Div. of Applied Thermodynamics and Refrigeration, Dept. of Energy Technology, Royal Institute of Technology
Research on CO2 Heat Pumps and Other CO2 Novel Systems at The Energy
Department of KTH
Yang Chen (KTH)
Per Lundqvist (KTH)
2Div. of Applied Thermodynamics and Refrigeration, Dept. of Energy Technology, Royal Institute of Technology
Content
Research on CO2 heat pump systems (Effsys 2 project)
Thermal properties of Supercritical CO2 and theirinfluences on heat exchanger performance
Research on other CO2 novel systems
3Div. of Applied Thermodynamics and Refrigeration, Dept. of Energy Technology, Royal Institute of Technology
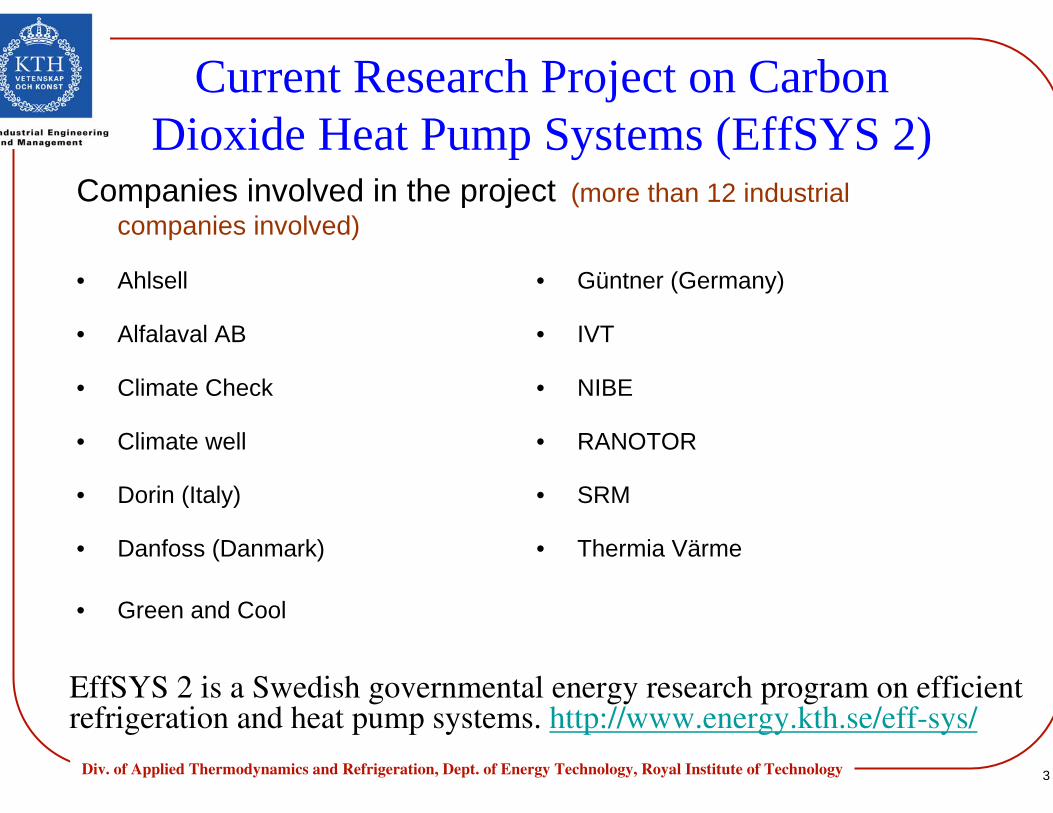
Current Research Project on Carbon Dioxide Heat Pump Systems (EffSYS 2)
EffSYS 2 is a Swedish governmental energy research program on efficient refrigeration and heat pump systems. http://www.energy.kth.se/eff-sys/
• Green and Cool
• Thermia Värme • Danfoss (Danmark)
• SRM • Dorin (Italy)
• RANOTOR • Climate well
• NIBE • Climate Check
• IVT • Alfalaval AB
• Güntner (Germany) • Ahlsell
Companies involved in the project (more than 12 industrial companies involved)
4Div. of Applied Thermodynamics and Refrigeration, Dept. of Energy Technology, Royal Institute of Technology
Research Contents of Current Effsys 2 project
Testing the performance of a commercial CO2 heat pump sold in Sweden (Sanyo. Eco-cute)
Building up a permanent testing center at the Energy Department of KTH for CO2 heat pump system research
Heat exchanger design (temperature profile) System performance (optimization) Control strategyComponent testing
5Div. of Applied Thermodynamics and Refrigeration, Dept. of Energy Technology, Royal Institute of Technology
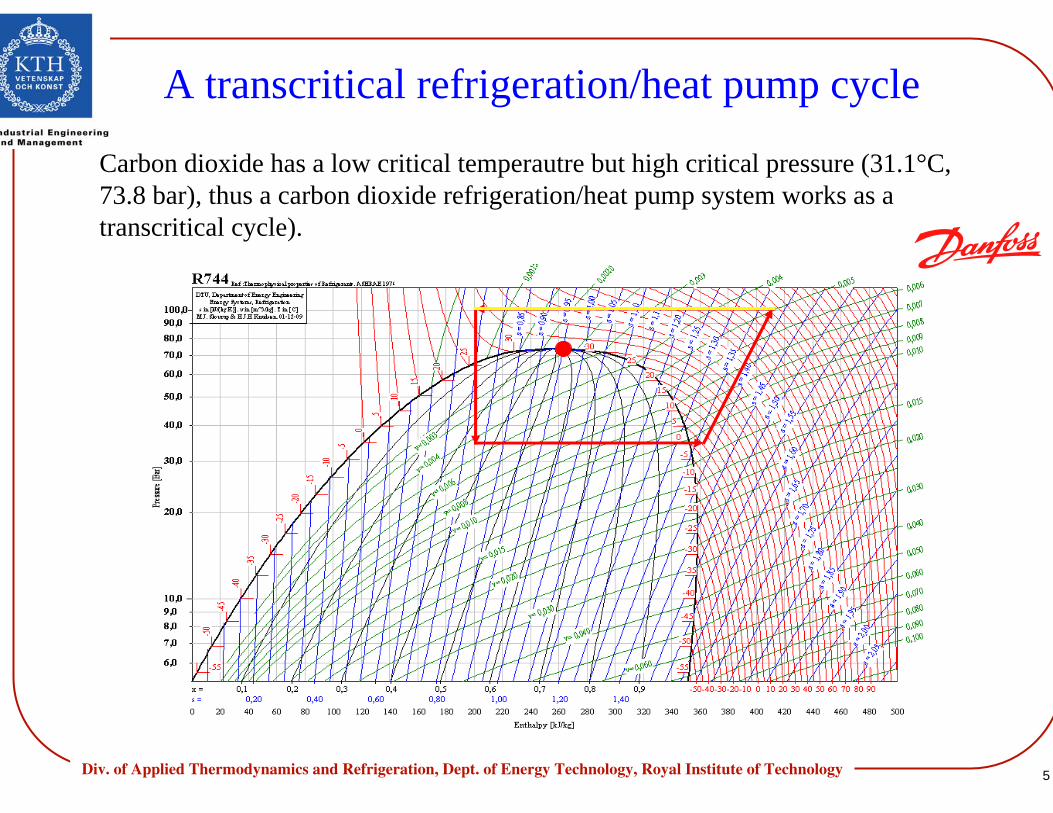
A transcritical refrigeration/heat pump cycle
Carbon dioxide has a low critical temperautre but high critical pressure (31.1°C, 73.8 bar), thus a carbon dioxide refrigeration/heat pump system works as a transcritical cycle).
6Div. of Applied Thermodynamics and Refrigeration, Dept. of Energy Technology, Royal Institute of Technology
Problems with Heat Exchanger Design in Supercritical Region
Thermophysical properties of CO2have rapid changes near the critical point, which create many new phenomena for heat exchanger design.
Supercritical carbondioxideLow pressure side carbondioxide in IHXGas cooler cooling air
IHX GC
c
d
e
a bhg
CO2 transcritical refrigeration cycle integrated heat exchanger's T — ∆h chart
0
10
20
30
40
50
60
70
80
0 0.1 0.2 0.3 0.4 0.5 0.6 0.7 0.8 0.9 1
∆H (KJ/kg•K)
Tem
pera
ture
(ºC
)
Low pressure side carbon dioxide in IHX
Gas cooler's cooling air
Supercritical carbon dioxide
IHX GC
c
de
a
b
h
g
CP of Supercritical Carbon Dioxide
0
5
10
15
20
25
30
35
10 20 30 40 50 60 70
Temperature (ºC)
CP (
KJ/
kg•K
)
P=8.0 Mpa
P=9.0 Mpa
P=10.0 Mpa
P=11.0 Mpa
P=12.0 Mpa
7Div. of Applied Thermodynamics and Refrigeration, Dept. of Energy Technology, Royal Institute of Technology
Research on other CO2 novel system
System researchCO2 power system in low-grade heat source utilizationCO2 double loop system
Dynamic simulationEmploying EES+TRNSYS to develop a dynamic system model for yearly performance simulation
8Div. of Applied Thermodynamics and Refrigeration, Dept. of Energy Technology, Royal Institute of Technology
The advantages of CO2 power system in utilizing low-grade heat source
Supercritical CO2’s temperature profile can match better to the heat source than other working fluids (organic working fluid, fluid mixtures, etc.)
Schematic illustration of the heat transfer between the low-grade heat source and the working fluid in a counter flow heat exchanger. (1a) pure fluid; (1b) zeotropic fluid
mixtures; (1c) carbon dioxide
9Div. of Applied Thermodynamics and Refrigeration, Dept. of Energy Technology, Royal Institute of Technology
Reverse CO2 Refrigeration Cycle for Power Production
-1.75 -1.50 -1.25 -1.00 -0.75 -0.50
0
20
40
60
80
100
120
140
160
s [kJ/kg-K]
T [°
C]
340 bar
280 bar 220 bar
160 bar
100 bar
40 bar
0.4 0.6 0.8
0.0
017
0.0
057
0.0
1
0.0
19m
3/kg
Carbon Dioxide Transcritical Power Cycle
a
bc
d
e
f
60 bar
0.2
-1.50 -1.25 -1.00 -0.75 -0.50
0
40
80
120
160
200
s [kJ/kg-K]
T [°
C]
350 bar 300 bar
250 bar 200 bar
150 bar
100 bar
0,2 0,4 0,6 0,8
0,0
017
0,0
057
0,0
1 0
,034
0,0
63 m
3/kg
Carbon Dioxide Brayton Cycle
a
b
c
d
e
f
A bottoming cycle with carbon dioxide as a working media
Approx.12% efficiency with 150°C expansion inlet temp.
10Div. of Applied Thermodynamics and Refrigeration, Dept. of Energy Technology, Royal Institute of Technology
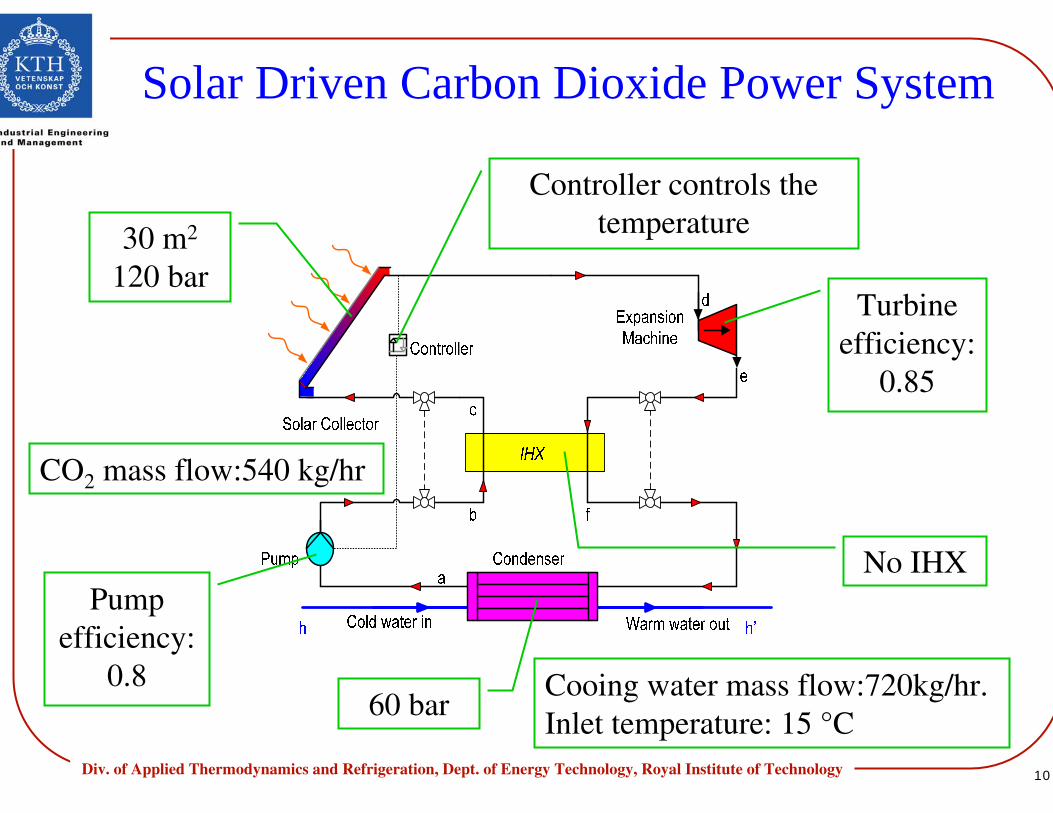
Solar Driven Carbon Dioxide Power System
CO2 mass flow:540 kg/hr
Turbine efficiency:
0.85
Pump efficiency:
0.860 bar
30 m2
120 bar
No IHX
Controller controls the temperature
Cooing water mass flow:720kg/hr. Inlet temperature: 15 °C
11Div. of Applied Thermodynamics and Refrigeration, Dept. of Energy Technology, Royal Institute of Technology
Simulation Methodology
Type66c
Collectors
Weather data
TRNSYS
Ees.lnk
Collectors
12Div. of Applied Thermodynamics and Refrigeration, Dept. of Energy Technology, Royal Institute of Technology
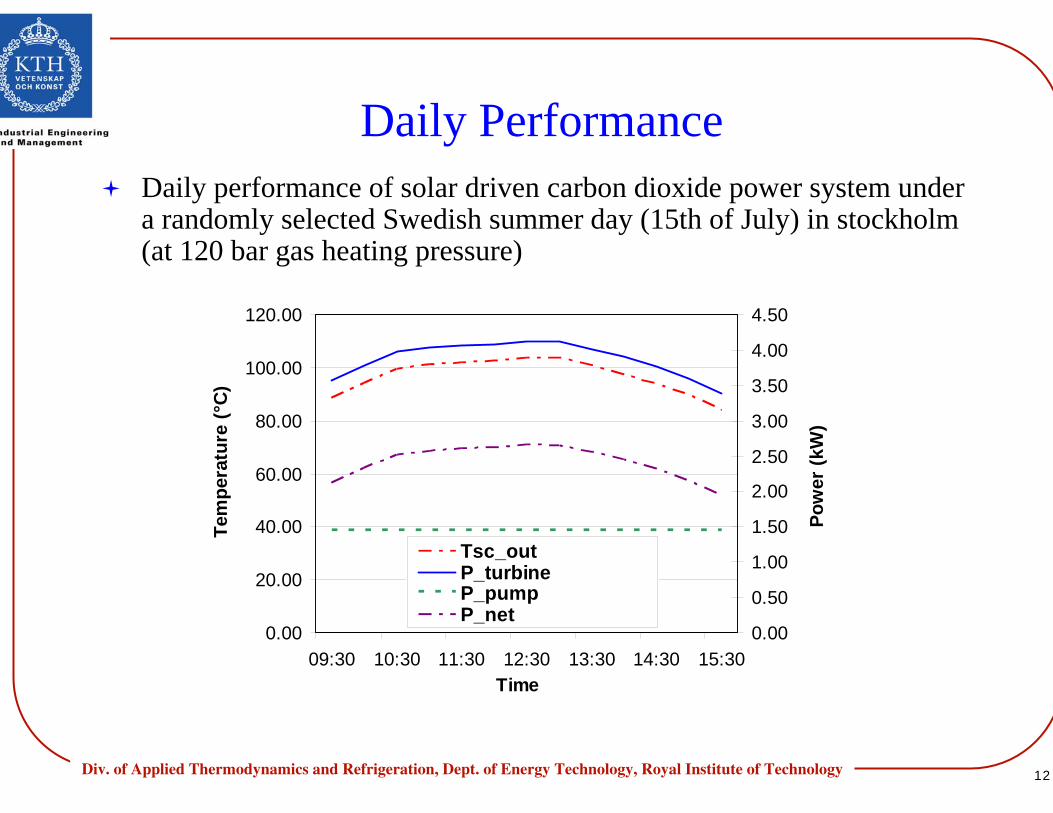
Daily PerformanceDaily performance of solar driven carbon dioxide power system under a randomly selected Swedish summer day (15th of July) in stockholm(at 120 bar gas heating pressure)
0.00
20.00
40.00
60.00
80.00
100.00
120.00
09:30 10:30 11:30 12:30 13:30 14:30 15:30Time
Tem
pera
ture
(°C
)
0.00
0.50
1.00
1.50
2.00
2.50
3.00
3.50
4.00
4.50
Pow
er (k
W)
Tsc_out P_turbine P_pump P_net
13Div. of Applied Thermodynamics and Refrigeration, Dept. of Energy Technology, Royal Institute of Technology
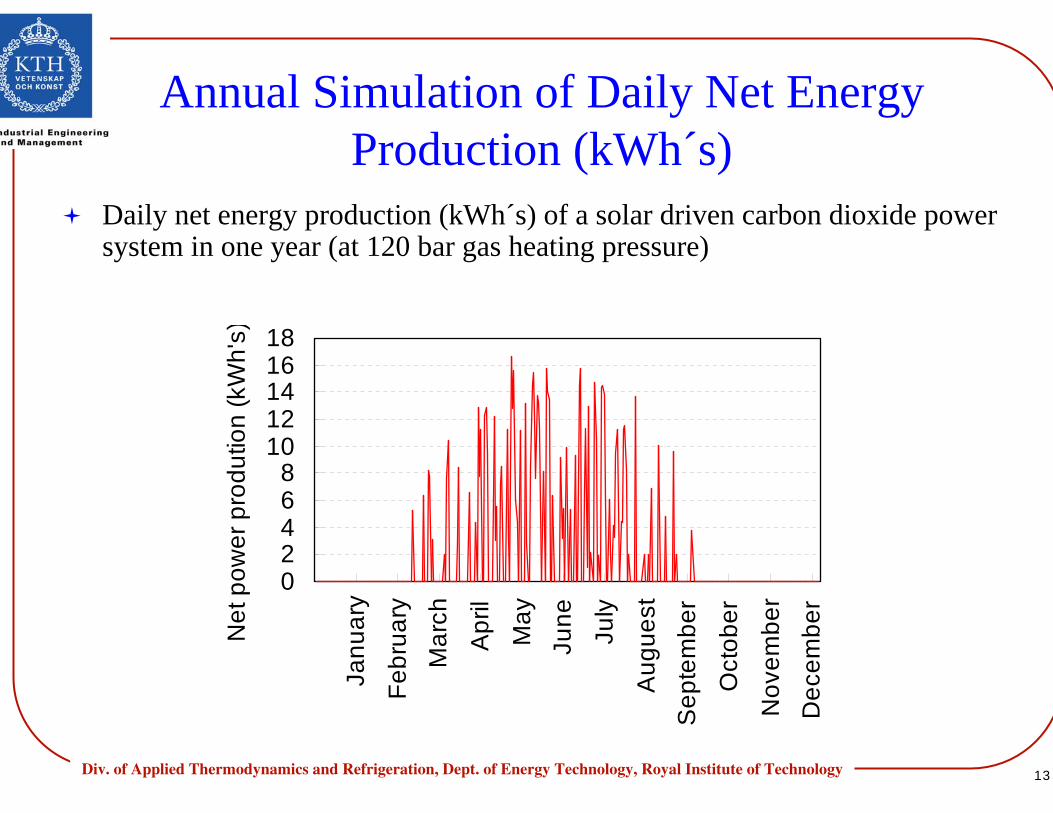
Annual Simulation of Daily Net Energy Production (kWh´s)
02468
1012141618
Janu
ary
Febr
uary
Mar
ch
Apr
il
May
June
July
Aug
uest
Sep
tem
ber
Oct
ober
Nov
embe
rD
ecem
ber
Net
pow
er p
rodu
tion
(kW
h's)
Daily net energy production (kWh´s) of a solar driven carbon dioxide power system in one year (at 120 bar gas heating pressure)
14Div. of Applied Thermodynamics and Refrigeration, Dept. of Energy Technology, Royal Institute of Technology
Annual Simulation of Monthly Net Power Production (kWh´s)
Monthly net power production (kWh´s) of a solar-driven carbon dioxide power system in one year (at 120 bar gas heating pressure)
020406080
100120140160180200
Janu
ary
Febr
uary
Mar
ch
Apr
il
May
June
July
Aug
uest
Sep
tem
ber
Oct
ober
Nov
embe
r
Dec
embe
r
Net
pow
er p
rodu
ctio
n (k
Wh'
s)
15Div. of Applied Thermodynamics and Refrigeration, Dept. of Energy Technology, Royal Institute of Technology
CO2 Double Loop System
The system has two sub-systems running in parallel: one carbon dioxide power sub-system and one carbon dioxide transcritical refrigeration/heat pump sub-system. It is also possible to take advantage of temperature glide of the both sub-systems.The system will to provide cooling (and heating) in a more efficient way.
M
Heat Source
Internal Heat Exchanger
Gas heater
PumpGas Cooler
a
b
c
c d
e
f
f
hg
Expansion machine
Internal Heat Exchanger
Compressor
Expansion valve
Evaporator
a’ b’
c´
d´e’
f ’
g’h’
16Div. of Applied Thermodynamics and Refrigeration, Dept. of Energy Technology, Royal Institute of Technology
Corresponding Cycles
-1.60 -1.35 -1.10 -0.85 -0.60
0
25
50
75
100
125
150
s [kJ/kg-K]
T [°
C]
40 bar
60 bar
80 bar
100 bar
120 bar
140 bar
0.2 0.4 0.6 0.8
0.0
017
0.0
057
0.0
1
0.0
19 0
.034
m3/
kg
Carbon Dioxide Double Loop Cycle
-1.75 -1.50 -1.25 -1.00 -0.75 -0.50
0
25
50
75
100
125
150
s [kJ/kg-K]
T [°C
] 40 bar
60 bar
80 bar
100 bar
120 bar
140 bar
0.2 0.4 0.6 0.8
0.0
017
0.0
057
0.0
1 0
.019
0
.063
m3/
kg
Carbon Dioxide Double Loop Cycle
Supercritical power cycle double loop
Transcritical power cycle double loop
17Div. of Applied Thermodynamics and Refrigeration, Dept. of Energy Technology, Royal Institute of Technology
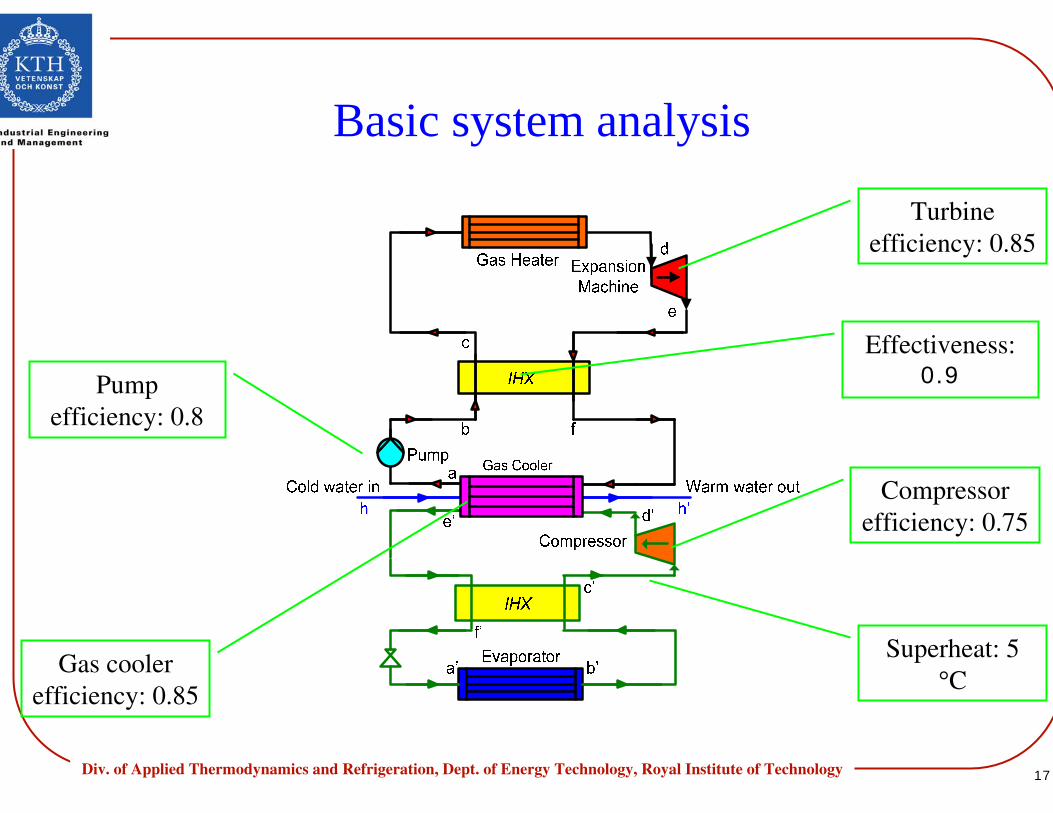
Basic system analysis
Pump efficiency: 0.8
Turbine efficiency: 0.85
Compressor efficiency: 0.75
Superheat: 5 °C
Effectiveness: 0.9
Gas cooler efficiency: 0.85
18Div. of Applied Thermodynamics and Refrigeration, Dept. of Energy Technology, Royal Institute of Technology
Basic system analysis
Gas cooler pressure: 83 bar
Evaporator pressure: 40 bar
Gas heater pressure: 120 bar
Refrig. Mass flow: 290 kg/h
C.W. mass flow rate: 540 kg/h
GC outlet temp.:35 °C
C.W. inlet temp.: 15 °C
Expan. Inlet temp.: 120 °C
(2000) al. et Liao tttp eceopt )34.9381.0()0157.0778.2( −+−=
19Div. of Applied Thermodynamics and Refrigeration, Dept. of Energy Technology, Royal Institute of Technology
Simulation results
kW25.1Power of hot water production
kW9.76System cooling capacity
°C60.8Water outlet temperature
-4.13Double loop system COP double
-3.09Basic refrigeration system COP
-7.48%Double loop power part thermal efficiency (with IHX)
-4.77%Double loop power part thermal efficiency (without IHX)
UnitValuePerformance Parameters
20Div. of Applied Thermodynamics and Refrigeration, Dept. of Energy Technology, Royal Institute of Technology
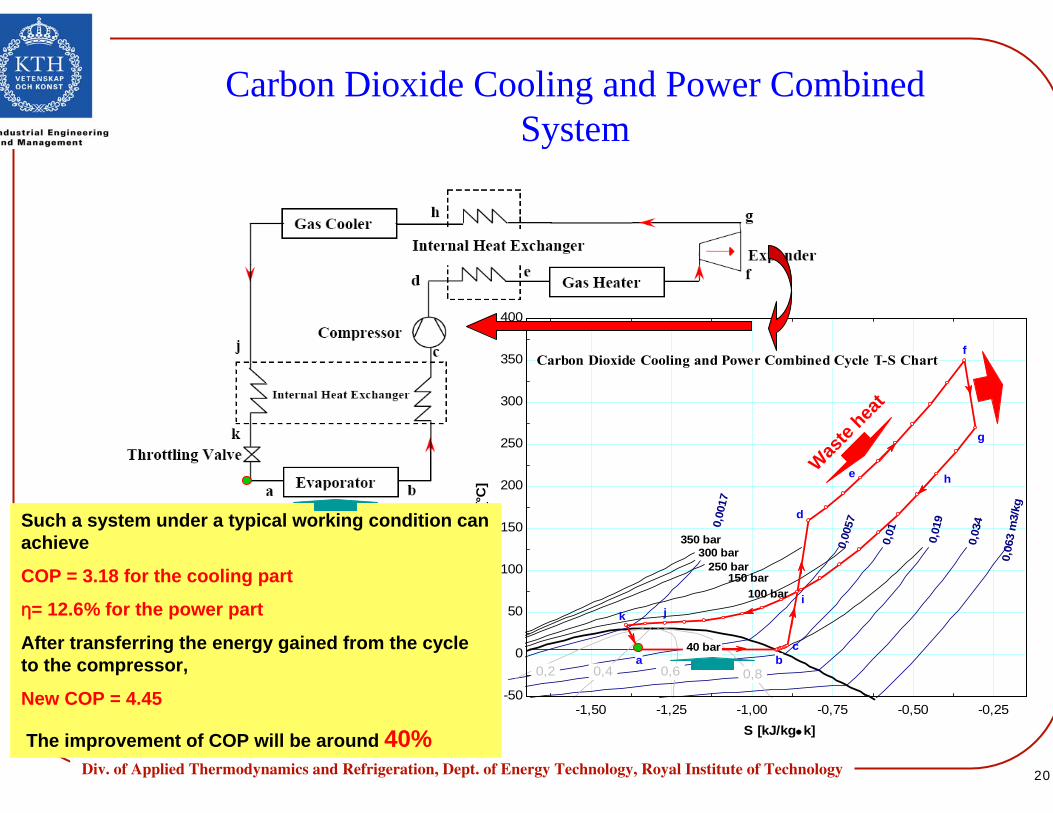
Carbon Dioxide Cooling and Power Combined System
-1,50 -1,25 -1,00 -0,75 -0,50 -0,25-50
0
50
100
150
200
250
300
350
400
S [kJ/kg•k]
T [°C
]
350 bar 300 bar
250 bar 150 bar
100 bar
40 bar
0,2 0,4 0,6 0,8
0,0
017
0,0
057
0,0
1
0,0
19
0,0
34
0,0
63 m
3/kg
Carbon Dioxide Cooling and Power Combined Cycle T-S Chart
a b
d
e
f
c
j
g
k
h
i
Such a system under a typical working condition can achieve
COP = 3.18 for the cooling part
η= 12.6% for the power part
After transferring the energy gained from the cycle to the compressor,
New COP = 4.45
The improvement of COP will be around 40%
Waste
heat
21Div. of Applied Thermodynamics and Refrigeration, Dept. of Energy Technology, Royal Institute of Technology