Sabde et al. Reproductive Health 2014, 11:57http://www.reproductive-health-journal.com/content/11/1/57
RESEARCH Open Access
A spatial analysis to study access to emergencyobstetric transport services under the publicprivate “Janani Express Yojana” program in twodistricts of Madhya Pradesh, IndiaYogesh Sabde1, Ayesha De Costa2,3 and Vishal Diwan2,3,4*
Abstract
Background: The government in Madhya Pradesh (MP), India in 2006, launched “Janani Express Yojana” (JE), adecentralized, 24X7, free emergency transport service for all pregnant women under a public-private partnership.JE supports India’s large conditional cash transfer program, the “Janani Suraksha Yojana” (JSY) in the province andtransports on average 60,000 parturients to hospital every month. The model is a relatively low cost one thatpotentially could be adopted in other parts of India and South Asia. This paper describes the uptake, time takenand geographic equity in access to the service to transport women to a facility in two districts of MP.
Methods: This was a facility based cross sectional study. We interviewed parturients (n = 468) who delivered during afive day study period at facilities with >10 deliveries/month (n = 61) in two study districts. The women were askeddetails of transportation used to arrive at the facility, time taken and their residential addresses. These details wereplotted onto a Geographic Information System (GIS) to estimate travelled distances and identify statistically significantclusters of mothers (hot spots) reporting delays >2 hours.
Results: JE vehicles were well dispersed across the districts and used by 236 (50.03%) mothers of which 111(47.03%)took >2 hours to reach a facility. Inability of JE vehicle to reach a mother in time was the main reason for delays. Therewas no correlation between the duration of delay and distance travelled. Maps of the travel paths and travel durationof the women are presented. The study identified hot spots of mothers with delays >2 hours and explored the possiblereasons for longer delays.
Conclusions: The JE service was accessible in all parts of the districts. Relatively high utilization rates of JEindicate that it ably supported JSY program to draw more women for institutional deliveries. However, half of the JEusers experienced long (>2 hour) delays. The delayed mothers clustered in difficult terrains of the districts. Additionalsupport particularly for the identified hot spots, enhanced monitoring by state agencies and GIS tools can facilitatebetter effectiveness of the JE program.
Keywords: Geographic information system, Spatial analysis, Access to health care, Equity in access, Emergencyobstetric transport, India
* Correspondence: [email protected] Center for Health Research, R.D. Gardi Medical College, Ujjain,Madhya Pradesh, India3Department of Public Health Sciences, Karolinska Institutet, Stockholm,SwedenFull list of author information is available at the end of the article
Sabde et al. Reproductive Health 2014, 11:57 Page 2 of 14http://www.reproductive-health-journal.com/content/11/1/57
Background“Janani Suraksha Yojana” (JSY) or safe motherhood schemeIn order to improve population coverage of maternalhealth services, reduce inequity in access and movetowards achievement of millennium development goal(MDG) 5 (reduction in maternal mortality), governmentsin South Asia have implemented innovative demand sidefinancing initiatives over the last decade [1]. The mostwell-known of these is India’s large conditional cashtransfer program, the “Janani Suraksha Yojana” (JSY) orSafe Motherhood Scheme [2,3], to reduce maternal mor-tality by promoting in-facility delivery. The Indian JSY isthe largest conditional cash transfer in the world, withover 70 million beneficiaries since inception in 2005 [4].The program, funded by the Government of India, payswomen a fixed sum when they give birth in a facility.The cash transfer under the JSY attempts to reducefinancial access barriers to accessing hospital delivery.The financial access barrier is closely linked to geo-graphical access barriers to care, so that providing eitherfunds for transport or providing transport itself reducesboth financial and geographic barriers to access. There-fore, addressing the geographical access barrier and tak-ing steps to address it, acts in synergy with the cashtransfer like JSY to increase utilization of facilities forinstitutional birth.
The importance of transport in the reduction ofmaternal mortalityComplications such as hemorrhage, hypertensive disor-ders, infections and unsafe abortions account for morethan 50% of maternal deaths globally. Timely access tohealthcare can prevent most of these fatal pregnancycomplications [5-7]. The World Bank in its report (2008)suggests that 75% of maternal deaths could be preventedby timely access to emergency obstetric care (EmOC) [8].Thaddeus and Maine has described three delays in accessto obstetric care services viz. (1) delay the decisionto seek care; (2) delay arrival at a health facility; and(3) delay the provision of adequate care. The delay inarriving at a facility after the decision has been made toseek care was referred to as the ‘second delay’ [9]. Lack ofreliable transport is a major element contributing to thissecond delay [10]. A second delay of greater than 2 hourshas been reported to be significantly associated with in-hospital maternal mortality [11-13]. It has been recom-mended that basic and comprehensive EmOC facilitiesshould be available within two to three hours of travel formost women [14]. Given that the JSY runs in a low &middle income country (LMIC), and is strongly focusedon poorer Indian provinces with high maternal mortality,the challenges to securing transport for delivery are manyand include the absence of a reliable public transportsystem, particularly connecting the rural areas, poor road
infrastructure, difficulty in arranging emergency trans-port at short notice, the lack of transportation alterna-tives to choose from and the extremely high cost oforganizing such transport. Similar difficulties have beenreported from other LMIC settings [15-17]. Thereforedifferent innovative interventions to ensure an effectiveemergency transport have been investigated in these set-tings. In Mali and Sierra Leone, radios were provided tosummon vehicles during obstetric emergencies [6,18]. Anon-governmental organization, Transaid, works to im-prove management and maintenance of transport systems(including emergency obstetric transport systems) inLMICs in sub Sahran Africa, Sri Lanka and Afghanistan.They utilize professional transport operation experts toimplement interventions such as professional training ofthe drivers, community managed transport and advocacy[19]. In Kenya, the transport costs were incorporated intothe benefit package of a community insurance scheme[20]. In Malaysia and Sri Lanka, the health departmentengaged with the private sector to provide transport atsubsidized rates for sending emergencies to hospitals[21]. In all these reports there was an improvementin the utilization rates and health outcomes (including ob-stetric outcomes) following provision of a better emergencytransport system.
“Janani Express Yojana” (JE) or maternal express programTo support access to institutional delivery under the JSYprogram, the department of health in the large centralIndian province of Madhya Pradesh (MP) launched “JananiExpress Yojana” (JE or maternal express program) in 2006that covered the entire province by 2009. The JE wasintended to make available emergency transport, so thatmothers could travel to hospital for delivery. This innova-tive, decentralized, public-private partnership (PPP) was a24×7 free emergency transport service available to all preg-nant women in the province. Under the JE, the state,through its peripheral district health offices entered intoagreements with local private transport operators to pro-vide, when requisitioned emergency transport for pregnantwomen from their residence to obstetric care (OC) facil-ities for delivery. In this partnership, the service is paid forby the state, while private operators are responsible for ve-hicle procurment, maintenance and upkeep. A total of 893vehicles operate under the JE in MP and the reports fromthe health department indicate that it has been used by300,000 women to travel to the hospital to deliver since itsinception. Currently, on average, the service transports60,000 women in the province to hospital for delivery everymonth [22,23].The JE service has been well utilized by the rural, tri-
bal, and uneducated women. The high utilization of JEby all women including those from vulnerable groupssuggests that the PPP has been able to provide a service
Sabde et al. Reproductive Health 2014, 11:57 Page 3 of 14http://www.reproductive-health-journal.com/content/11/1/57
where it is needed. However, available literature suggeststhat there is a need to study the effectiveness of the JEservice from a geographic equity perspective i.e. whetherwomen who reside in remote areas equally benefit fromthe scheme and to look at its efficiency in terms of timeto transport JSY program beneficiaries [24]. Geographicinformation system (GIS) tools lend themselves to beused in such a study where distance and geographic lo-cation are key variables. The objectives of this paper areto study (i) the proportion of mothers delivering in facil-ity who utilized the JE emergency transport service intwo districts of MP, ii) the effectiveness of the JE servicein terms of geographic equity in access using spatial ana-lysis tools and iii) the efficiency of the service in termsof time i.e. time between the mother’s decision to go tohospital and reaching the hospital by the JE vehicle. ThePPP model to provide transport to pregnant mothers tohospital for delivery is one that potentially could beadopted in other LMICs to improve access to EmOC.The results from this study are important both for theprovince that implements the program, other provincesin the Indian union and other similar settings lookingfor innovative alternatives to solve the problem of trans-portation for delivery.
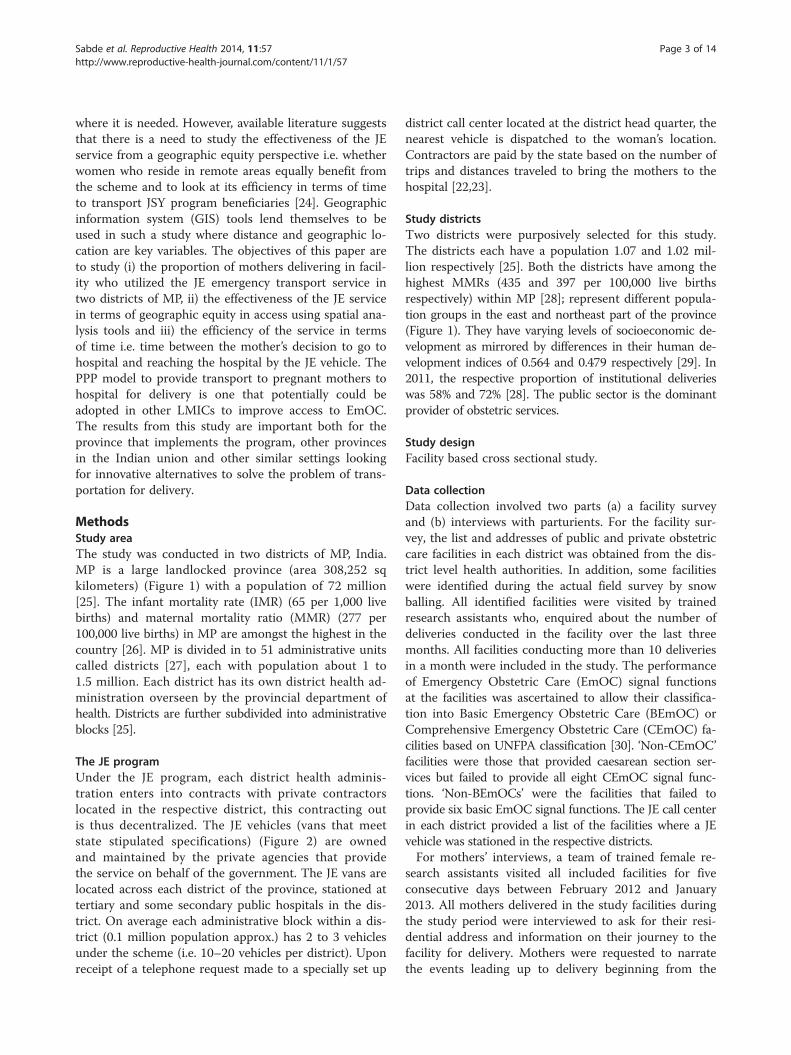
MethodsStudy areaThe study was conducted in two districts of MP, India.MP is a large landlocked province (area 308,252 sqkilometers) (Figure 1) with a population of 72 million[25]. The infant mortality rate (IMR) (65 per 1,000 livebirths) and maternal mortality ratio (MMR) (277 per100,000 live births) in MP are amongst the highest in thecountry [26]. MP is divided in to 51 administrative unitscalled districts [27], each with population about 1 to1.5 million. Each district has its own district health ad-ministration overseen by the provincial department ofhealth. Districts are further subdivided into administrativeblocks [25].
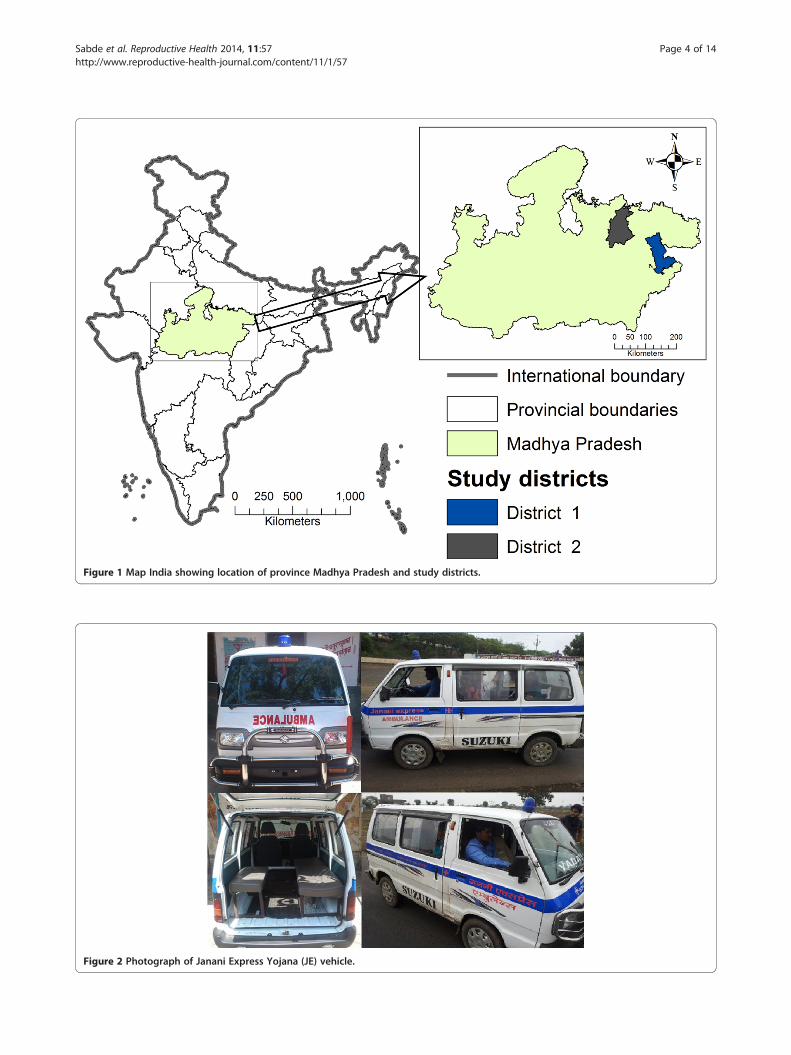
The JE programUnder the JE program, each district health adminis-tration enters into contracts with private contractorslocated in the respective district, this contracting outis thus decentralized. The JE vehicles (vans that meetstate stipulated specifications) (Figure 2) are ownedand maintained by the private agencies that providethe service on behalf of the government. The JE vans arelocated across each district of the province, stationed attertiary and some secondary public hospitals in the dis-trict. On average each administrative block within a dis-trict (0.1 million population approx.) has 2 to 3 vehiclesunder the scheme (i.e. 10–20 vehicles per district). Uponreceipt of a telephone request made to a specially set up
district call center located at the district head quarter, thenearest vehicle is dispatched to the woman’s location.Contractors are paid by the state based on the number oftrips and distances traveled to bring the mothers to thehospital [22,23].
Study districtsTwo districts were purposively selected for this study.The districts each have a population 1.07 and 1.02 mil-lion respectively [25]. Both the districts have among thehighest MMRs (435 and 397 per 100,000 live birthsrespectively) within MP [28]; represent different popula-tion groups in the east and northeast part of the province(Figure 1). They have varying levels of socioeconomic de-velopment as mirrored by differences in their human de-velopment indices of 0.564 and 0.479 respectively [29]. In2011, the respective proportion of institutional deliverieswas 58% and 72% [28]. The public sector is the dominantprovider of obstetric services.
Study designFacility based cross sectional study.
Data collectionData collection involved two parts (a) a facility surveyand (b) interviews with parturients. For the facility sur-vey, the list and addresses of public and private obstetriccare facilities in each district was obtained from the dis-trict level health authorities. In addition, some facilitieswere identified during the actual field survey by snowballing. All identified facilities were visited by trainedresearch assistants who, enquired about the number ofdeliveries conducted in the facility over the last threemonths. All facilities conducting more than 10 deliveriesin a month were included in the study. The performanceof Emergency Obstetric Care (EmOC) signal functionsat the facilities was ascertained to allow their classifica-tion into Basic Emergency Obstetric Care (BEmOC) orComprehensive Emergency Obstetric Care (CEmOC) fa-cilities based on UNFPA classification [30]. ‘Non-CEmOC’facilities were those that provided caesarean section ser-vices but failed to provide all eight CEmOC signal func-tions. ‘Non-BEmOCs’ were the facilities that failed toprovide six basic EmOC signal functions. The JE call centerin each district provided a list of the facilities where a JEvehicle was stationed in the respective districts.For mothers’ interviews, a team of trained female re-
search assistants visited all included facilities for fiveconsecutive days between February 2012 and January2013. All mothers delivered in the study facilities duringthe study period were interviewed to ask for their resi-dential address and information on their journey to thefacility for delivery. Mothers were requested to narratethe events leading up to delivery beginning from the
Figure 2 Photograph of Janani Express Yojana (JE) vehicle.
Figure 1 Map India showing location of province Madhya Pradesh and study districts.
Sabde et al. Reproductive Health 2014, 11:57 Page 4 of 14http://www.reproductive-health-journal.com/content/11/1/57
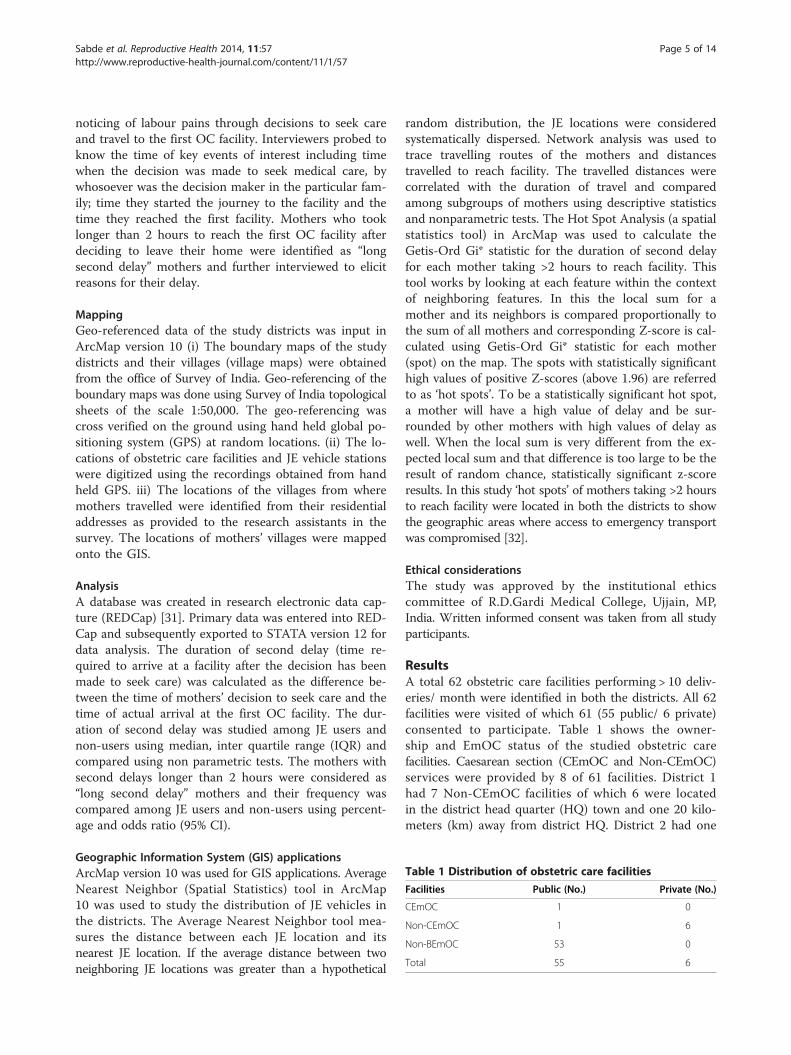
Table 1 Distribution of obstetric care facilities
Facilities Public (No.) Private (No.)
CEmOC 1 0
Non-CEmOC 1 6
Non-BEmOC 53 0
Total 55 6
Sabde et al. Reproductive Health 2014, 11:57 Page 5 of 14http://www.reproductive-health-journal.com/content/11/1/57
noticing of labour pains through decisions to seek careand travel to the first OC facility. Interviewers probed toknow the time of key events of interest including timewhen the decision was made to seek medical care, bywhosoever was the decision maker in the particular fam-ily; time they started the journey to the facility and thetime they reached the first facility. Mothers who tooklonger than 2 hours to reach the first OC facility afterdeciding to leave their home were identified as “longsecond delay” mothers and further interviewed to elicitreasons for their delay.
MappingGeo-referenced data of the study districts was input inArcMap version 10 (i) The boundary maps of the studydistricts and their villages (village maps) were obtainedfrom the office of Survey of India. Geo-referencing of theboundary maps was done using Survey of India topologicalsheets of the scale 1:50,000. The geo-referencing wascross verified on the ground using hand held global po-sitioning system (GPS) at random locations. (ii) The lo-cations of obstetric care facilities and JE vehicle stationswere digitized using the recordings obtained from handheld GPS. iii) The locations of the villages from wheremothers travelled were identified from their residentialaddresses as provided to the research assistants in thesurvey. The locations of mothers’ villages were mappedonto the GIS.
AnalysisA database was created in research electronic data cap-ture (REDCap) [31]. Primary data was entered into RED-Cap and subsequently exported to STATA version 12 fordata analysis. The duration of second delay (time re-quired to arrive at a facility after the decision has beenmade to seek care) was calculated as the difference be-tween the time of mothers’ decision to seek care and thetime of actual arrival at the first OC facility. The dur-ation of second delay was studied among JE users andnon-users using median, inter quartile range (IQR) andcompared using non parametric tests. The mothers withsecond delays longer than 2 hours were considered as“long second delay” mothers and their frequency wascompared among JE users and non-users using percent-age and odds ratio (95% CI).
Geographic Information System (GIS) applicationsArcMap version 10 was used for GIS applications. AverageNearest Neighbor (Spatial Statistics) tool in ArcMap10 was used to study the distribution of JE vehicles inthe districts. The Average Nearest Neighbor tool mea-sures the distance between each JE location and itsnearest JE location. If the average distance between twoneighboring JE locations was greater than a hypothetical
random distribution, the JE locations were consideredsystematically dispersed. Network analysis was used totrace travelling routes of the mothers and distancestravelled to reach facility. The travelled distances werecorrelated with the duration of travel and comparedamong subgroups of mothers using descriptive statisticsand nonparametric tests. The Hot Spot Analysis (a spatialstatistics tool) in ArcMap was used to calculate theGetis-Ord Gi* statistic for the duration of second delayfor each mother taking >2 hours to reach facility. Thistool works by looking at each feature within the contextof neighboring features. In this the local sum for amother and its neighbors is compared proportionally tothe sum of all mothers and corresponding Z-score is cal-culated using Getis-Ord Gi* statistic for each mother(spot) on the map. The spots with statistically significanthigh values of positive Z-scores (above 1.96) are referredto as ‘hot spots’. To be a statistically significant hot spot,a mother will have a high value of delay and be sur-rounded by other mothers with high values of delay aswell. When the local sum is very different from the ex-pected local sum and that difference is too large to be theresult of random chance, statistically significant z-scoreresults. In this study ‘hot spots’ of mothers taking >2 hoursto reach facility were located in both the districts to showthe geographic areas where access to emergency transportwas compromised [32].
Ethical considerationsThe study was approved by the institutional ethicscommittee of R.D.Gardi Medical College, Ujjain, MP,India. Written informed consent was taken from all studyparticipants.
ResultsA total 62 obstetric care facilities performing > 10 deliv-eries/ month were identified in both the districts. All 62facilities were visited of which 61 (55 public/ 6 private)consented to participate. Table 1 shows the owner-ship and EmOC status of the studied obstetric carefacilities. Caesarean section (CEmOC and Non-CEmOC)services were provided by 8 of 61 facilities. District 1had 7 Non-CEmOC facilities of which 6 were locatedin the district head quarter (HQ) town and one 20 kilo-meters (km) away from district HQ. District 2 had one
Sabde et al. Reproductive Health 2014, 11:57 Page 6 of 14http://www.reproductive-health-journal.com/content/11/1/57
CEmOC facility located at district HQ. There were noBEmOC facilities. The remaining 53 facilities were non-BEmOCs (27 and 26 in district 1 and 2 respectively).Most commonly missing signal functions were assistedvaginal delivery and manual removal of placenta. All thenon-BEmOC facilities were in the public sector. Therewere a total of 32 JE vehicles in these two districts (13 indistrict 1 and 19 in district 2). They were stationed at30 facilities.Figure 3 shows the participation of mothers in the
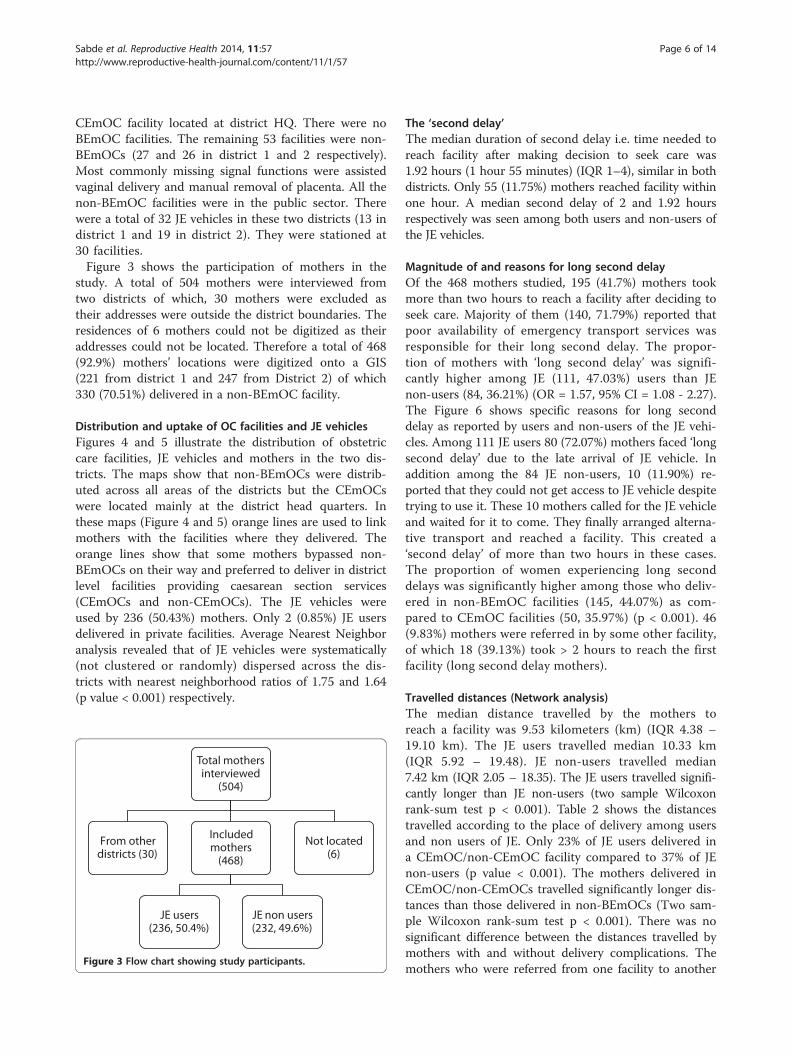
study. A total of 504 mothers were interviewed fromtwo districts of which, 30 mothers were excluded astheir addresses were outside the district boundaries. Theresidences of 6 mothers could not be digitized as theiraddresses could not be located. Therefore a total of 468(92.9%) mothers’ locations were digitized onto a GIS(221 from district 1 and 247 from District 2) of which330 (70.51%) delivered in a non-BEmOC facility.
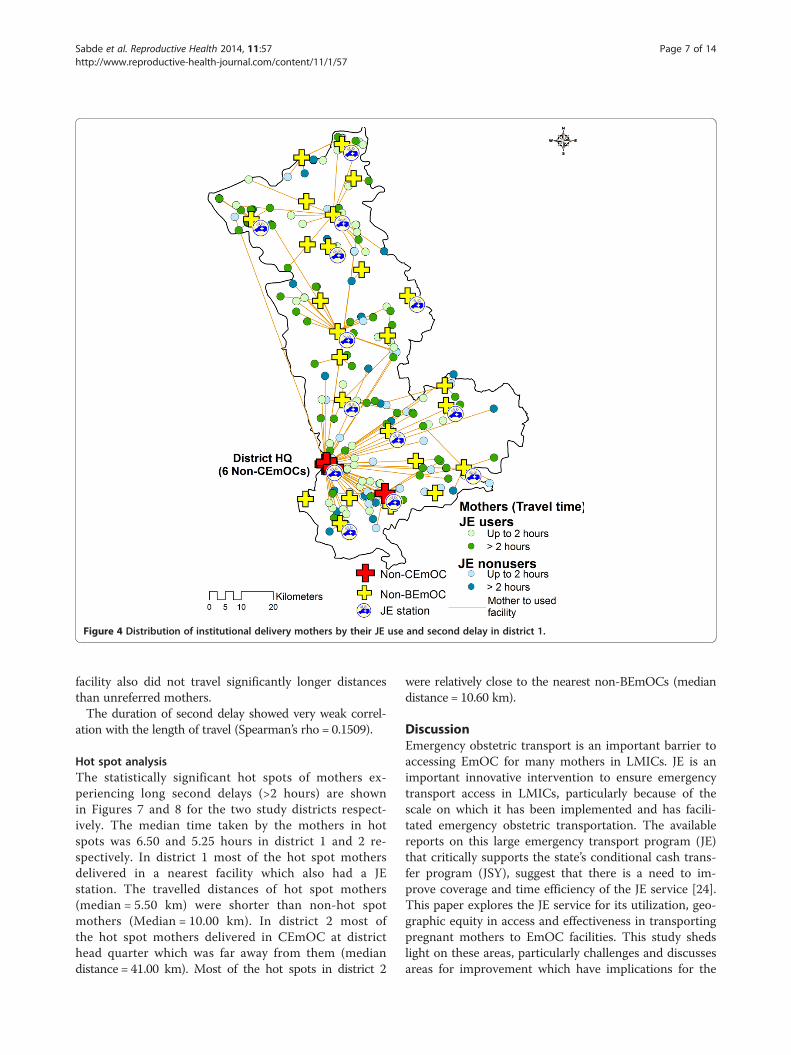
Distribution and uptake of OC facilities and JE vehiclesFigures 4 and 5 illustrate the distribution of obstetriccare facilities, JE vehicles and mothers in the two dis-tricts. The maps show that non-BEmOCs were distrib-uted across all areas of the districts but the CEmOCswere located mainly at the district head quarters. Inthese maps (Figure 4 and 5) orange lines are used to linkmothers with the facilities where they delivered. Theorange lines show that some mothers bypassed non-BEmOCs on their way and preferred to deliver in districtlevel facilities providing caesarean section services(CEmOCs and non-CEmOCs). The JE vehicles wereused by 236 (50.43%) mothers. Only 2 (0.85%) JE usersdelivered in private facilities. Average Nearest Neighboranalysis revealed that of JE vehicles were systematically(not clustered or randomly) dispersed across the dis-tricts with nearest neighborhood ratios of 1.75 and 1.64(p value < 0.001) respectively.
Total mothers interviewed
(504)
From other districts (30)
Included mothers
(468)
JE users (236, 50.4%)
JE non users (232, 49.6%)
Not located (6)
Figure 3 Flow chart showing study participants.
The ‘second delay’The median duration of second delay i.e. time needed toreach facility after making decision to seek care was1.92 hours (1 hour 55 minutes) (IQR 1–4), similar in bothdistricts. Only 55 (11.75%) mothers reached facility withinone hour. A median second delay of 2 and 1.92 hoursrespectively was seen among both users and non-users ofthe JE vehicles.
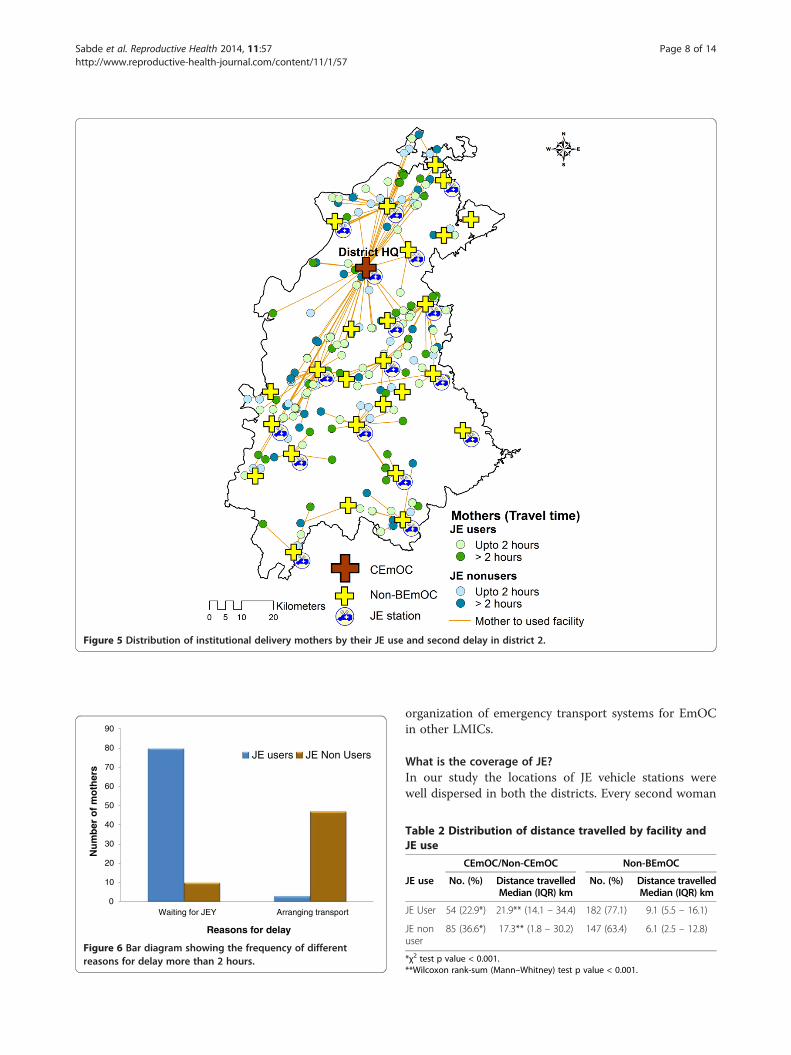
Magnitude of and reasons for long second delayOf the 468 mothers studied, 195 (41.7%) mothers tookmore than two hours to reach a facility after deciding toseek care. Majority of them (140, 71.79%) reported thatpoor availability of emergency transport services wasresponsible for their long second delay. The propor-tion of mothers with ‘long second delay’ was signifi-cantly higher among JE (111, 47.03%) users than JEnon-users (84, 36.21%) (OR = 1.57, 95% CI = 1.08 - 2.27).The Figure 6 shows specific reasons for long seconddelay as reported by users and non-users of the JE vehi-cles. Among 111 JE users 80 (72.07%) mothers faced ‘longsecond delay’ due to the late arrival of JE vehicle. Inaddition among the 84 JE non-users, 10 (11.90%) re-ported that they could not get access to JE vehicle despitetrying to use it. These 10 mothers called for the JE vehicleand waited for it to come. They finally arranged alterna-tive transport and reached a facility. This created a‘second delay’ of more than two hours in these cases.The proportion of women experiencing long seconddelays was significantly higher among those who deliv-ered in non-BEmOC facilities (145, 44.07%) as com-pared to CEmOC facilities (50, 35.97%) (p < 0.001). 46(9.83%) mothers were referred in by some other facility,of which 18 (39.13%) took > 2 hours to reach the firstfacility (long second delay mothers).
Travelled distances (Network analysis)The median distance travelled by the mothers toreach a facility was 9.53 kilometers (km) (IQR 4.38 –19.10 km). The JE users travelled median 10.33 km(IQR 5.92 – 19.48). JE non-users travelled median7.42 km (IQR 2.05 – 18.35). The JE users travelled signifi-cantly longer than JE non-users (two sample Wilcoxonrank-sum test p < 0.001). Table 2 shows the distancestravelled according to the place of delivery among usersand non users of JE. Only 23% of JE users delivered ina CEmOC/non-CEmOC facility compared to 37% of JEnon-users (p value < 0.001). The mothers delivered inCEmOC/non-CEmOCs travelled significantly longer dis-tances than those delivered in non-BEmOCs (Two sam-ple Wilcoxon rank-sum test p < 0.001). There was nosignificant difference between the distances travelled bymothers with and without delivery complications. Themothers who were referred from one facility to another
Figure 4 Distribution of institutional delivery mothers by their JE use and second delay in district 1.
Sabde et al. Reproductive Health 2014, 11:57 Page 7 of 14http://www.reproductive-health-journal.com/content/11/1/57
facility also did not travel significantly longer distancesthan unreferred mothers.The duration of second delay showed very weak correl-
ation with the length of travel (Spearman’s rho = 0.1509).
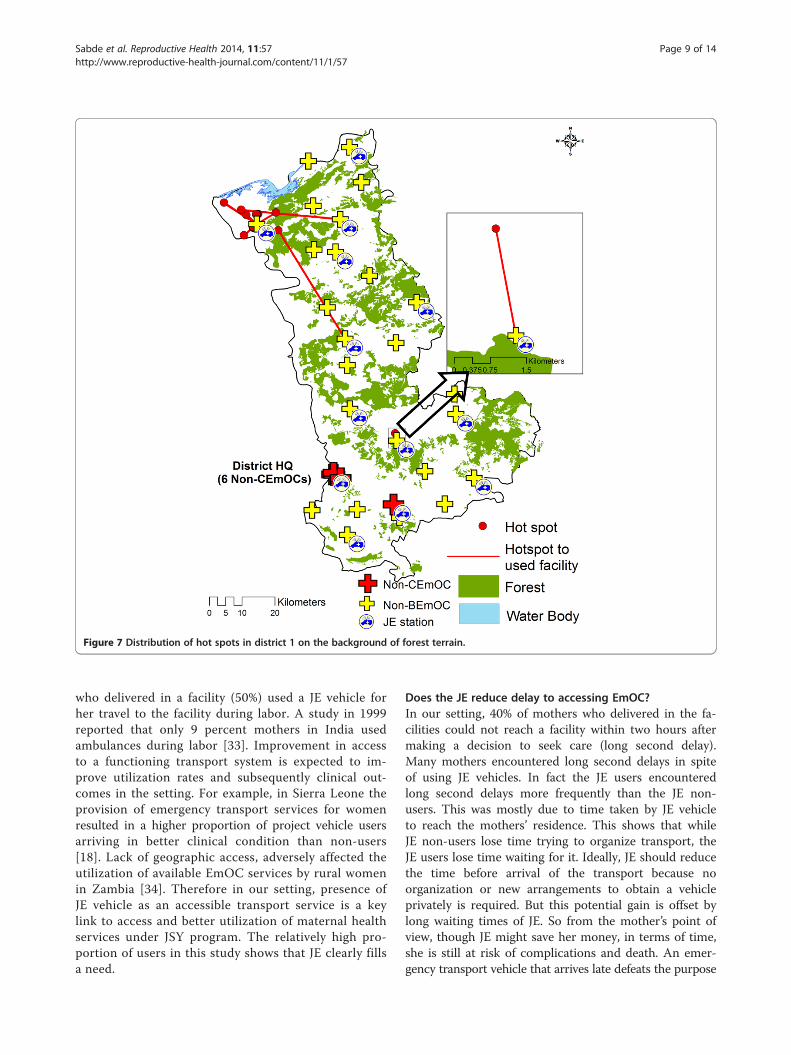
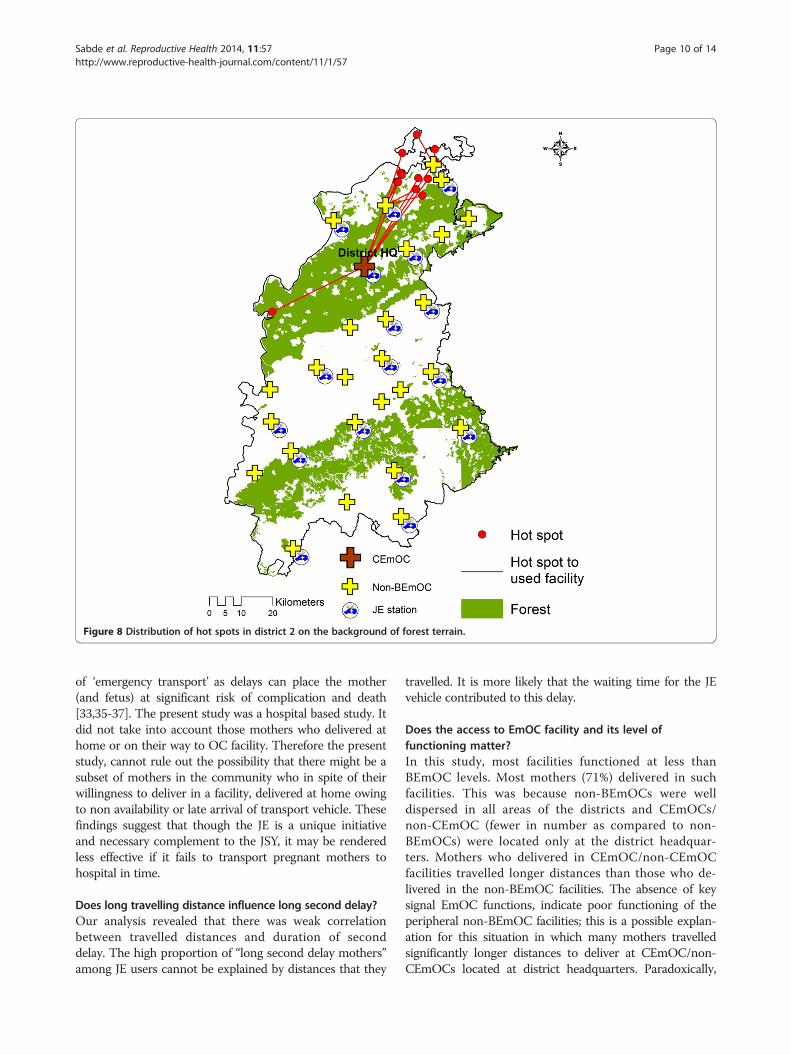
Hot spot analysisThe statistically significant hot spots of mothers ex-periencing long second delays (>2 hours) are shownin Figures 7 and 8 for the two study districts respect-ively. The median time taken by the mothers in hotspots was 6.50 and 5.25 hours in district 1 and 2 re-spectively. In district 1 most of the hot spot mothersdelivered in a nearest facility which also had a JEstation. The travelled distances of hot spot mothers(median = 5.50 km) were shorter than non-hot spotmothers (Median = 10.00 km). In district 2 most ofthe hot spot mothers delivered in CEmOC at districthead quarter which was far away from them (mediandistance = 41.00 km). Most of the hot spots in district 2
were relatively close to the nearest non-BEmOCs (mediandistance = 10.60 km).
DiscussionEmergency obstetric transport is an important barrier toaccessing EmOC for many mothers in LMICs. JE is animportant innovative intervention to ensure emergencytransport access in LMICs, particularly because of thescale on which it has been implemented and has facili-tated emergency obstetric transportation. The availablereports on this large emergency transport program (JE)that critically supports the state’s conditional cash trans-fer program (JSY), suggest that there is a need to im-prove coverage and time efficiency of the JE service [24].This paper explores the JE service for its utilization, geo-graphic equity in access and effectiveness in transportingpregnant mothers to EmOC facilities. This study shedslight on these areas, particularly challenges and discussesareas for improvement which have implications for the
Figure 5 Distribution of institutional delivery mothers by their JE use and second delay in district 2.
0
10
20
30
40
50
60
70
80
90
Waiting for JEY Arranging transport
Nu
mb
er o
f m
oth
ers
Reasons for delay
JE users JE Non Users
Figure 6 Bar diagram showing the frequency of differentreasons for delay more than 2 hours.
Sabde et al. Reproductive Health 2014, 11:57 Page 8 of 14http://www.reproductive-health-journal.com/content/11/1/57
organization of emergency transport systems for EmOCin other LMICs.
What is the coverage of JE?In our study the locations of JE vehicle stations werewell dispersed in both the districts. Every second woman
Table 2 Distribution of distance travelled by facility andJE use
CEmOC/Non-CEmOC Non-BEmOC
JE use No. (%) Distance travelledMedian (IQR) km
No. (%) Distance travelledMedian (IQR) km
JE User 54 (22.9*) 21.9** (14.1 – 34.4) 182 (77.1) 9.1 (5.5 – 16.1)
*χ2 test p value < 0.001.**Wilcoxon rank-sum (Mann–Whitney) test p value < 0.001.
Figure 7 Distribution of hot spots in district 1 on the background of forest terrain.
Sabde et al. Reproductive Health 2014, 11:57 Page 9 of 14http://www.reproductive-health-journal.com/content/11/1/57
who delivered in a facility (50%) used a JE vehicle forher travel to the facility during labor. A study in 1999reported that only 9 percent mothers in India usedambulances during labor [33]. Improvement in accessto a functioning transport system is expected to im-prove utilization rates and subsequently clinical out-comes in the setting. For example, in Sierra Leone theprovision of emergency transport services for womenresulted in a higher proportion of project vehicle usersarriving in better clinical condition than non-users[18]. Lack of geographic access, adversely affected theutilization of available EmOC services by rural womenin Zambia [34]. Therefore in our setting, presence ofJE vehicle as an accessible transport service is a keylink to access and better utilization of maternal healthservices under JSY program. The relatively high pro-portion of users in this study shows that JE clearly fillsa need.
Does the JE reduce delay to accessing EmOC?In our setting, 40% of mothers who delivered in the fa-cilities could not reach a facility within two hours aftermaking a decision to seek care (long second delay).Many mothers encountered long second delays in spiteof using JE vehicles. In fact the JE users encounteredlong second delays more frequently than the JE non-users. This was mostly due to time taken by JE vehicleto reach the mothers’ residence. This shows that whileJE non-users lose time trying to organize transport, theJE users lose time waiting for it. Ideally, JE should reducethe time before arrival of the transport because noorganization or new arrangements to obtain a vehicleprivately is required. But this potential gain is offset bylong waiting times of JE. So from the mother’s point ofview, though JE might save her money, in terms of time,she is still at risk of complications and death. An emer-gency transport vehicle that arrives late defeats the purpose
Figure 8 Distribution of hot spots in district 2 on the background of forest terrain.
Sabde et al. Reproductive Health 2014, 11:57 Page 10 of 14http://www.reproductive-health-journal.com/content/11/1/57
of ‘emergency transport’ as delays can place the mother(and fetus) at significant risk of complication and death[33,35-37]. The present study was a hospital based study. Itdid not take into account those mothers who delivered athome or on their way to OC facility. Therefore the presentstudy, cannot rule out the possibility that there might be asubset of mothers in the community who in spite of theirwillingness to deliver in a facility, delivered at home owingto non availability or late arrival of transport vehicle. Thesefindings suggest that though the JE is a unique initiativeand necessary complement to the JSY, it may be renderedless effective if it fails to transport pregnant mothers tohospital in time.
Does long travelling distance influence long second delay?Our analysis revealed that there was weak correlationbetween travelled distances and duration of seconddelay. The high proportion of “long second delay mothers”among JE users cannot be explained by distances that they
travelled. It is more likely that the waiting time for the JEvehicle contributed to this delay.
Does the access to EmOC facility and its level offunctioning matter?In this study, most facilities functioned at less thanBEmOC levels. Most mothers (71%) delivered in suchfacilities. This was because non-BEmOCs were welldispersed in all areas of the districts and CEmOCs/non-CEmOC (fewer in number as compared to non-BEmOCs) were located only at the district headquar-ters. Mothers who delivered in CEmOC/non-CEmOCfacilities travelled longer distances than those who de-livered in the non-BEmOC facilities. The absence of keysignal EmOC functions, indicate poor functioning of theperipheral non-BEmOC facilities; this is a possible explan-ation for this situation in which many mothers travelledsignificantly longer distances to deliver at CEmOC/non-CEmOCs located at district headquarters. Paradoxically,
Sabde et al. Reproductive Health 2014, 11:57 Page 11 of 14http://www.reproductive-health-journal.com/content/11/1/57
mothers who delivered at CEmOC/non-CEmOCs wereless likely to experience long second delays. Ideally,CEmOC/non-CEmOC facilities are expected to be utilizedby mothers with delivery complication who are referred byBEmOC facilities. But in our setting, there is no formalgatekeeping between different facility levels. Therefore aCEmOC/non-CEmOC facility can receive a large numberof uncomplicated parturients who arrive directly fromhome (the majority), some parturients with complicationswho come directly from home or are referred from alower level or private facility. Also there was no differencebetween the distances travelled by mothers with deliverycomplications and referred mothers. Given these obser-vations, it is unlikely that mothers reached CEmOC/non-CEmOC facilities quicker because they were prioritizedbased on triage. It is possible that wealthier motherswho had the resources to organize non JE transport(hired or own) for themselves, bypassed dysfunctionallower level facilities (non-BEmOCs) and traveled directlyto higher facilities (CEmOC/non-CEmOCs) at districthead quarter taking lesser time, despite farther dis-tances, than those delivered in non-BEmOCs. It is alsolikely that road networks are better leading upto CEmOC/non-CEmOC facilities (usually in the big towns) than lowerlevel facilities which tend to be more remotely located.In this study the 46 (9.83%) mothers were referred, of
which 18(39.13%) took more than 2 hours to reach thefirst facility. Another study conducted in same settingreported that the average inter facility transfer time was1.25 hours for referred cases [38]. The efficiency ofemergency obstetric transport system is meaningful onlyif it can take pregnant mother to a facility where EmOCis available. In the given setting most of obstetric care fa-cilities were not equipped with basic EmOC functions(non-BEmOCs). These facilities can possibly at the besthandle completely uncomplicated deliveries but theyneed to refer any other deliveries to higher centers. Inthese cases the referral transport consumes vital timeand adds to the delay in access to facility with EmOCservices. Therefore unless peripheral facilities are madeEmOC functional, transportation by itself has little mean-ing [6,39]. These findings indicate the need to strengthennon-BEmOC facilities in addition to improvement in refer-ral and transport system in the given settings.
Does the road condition contribute to the second delay?Few decades ago the road density (road length per 100square km of land area) in MP at 8.6 km/ 100 squarekm was lowest in India [40]. In 2000 a rural road devel-opment program was introduced in MP with the objectiveof building a strong infrastructure that would provideall-weather road access to every village/habitation with apopulation greater than 500. Since this initiative, over-all road conditions have improved, however accessibility
remains a problem for the more rural and remote villages[41]. The actual contribution of road conditions in the sec-ond delay was not explored in this study.
What were the factors influencing hot spots?Though women with long second delays were reportedfrom all areas of both the districts, identified hot spotsindicate that they clustered significantly in certain geo-graphic areas. In the given setting there were many pos-sible explanations for the long second delay among JEusers as well as non-users. Available studies in similarsettings report that the delay can be a result of long trav-elling distances, logistic factors like poor operationalmanagement system (communication, compliance by con-cerned personnel, availability and readiness of vehicles),inadequate vehicles and poor road infrastructure, thatwere investigated further for hot spots in each district[9,22,42,43]. In district 1, forest area covered 33.7% of thetotal district area (Figure 7). The geographic terrain of thehot spot was surrounded by forest on southern side andwater bodies on northern side. The mothers rather thancrossing this difficult terrain tended to deliver in the near-est facility which was a non-BEmOC equipped with JEvehicle. In this district, the mothers encountered longsecond delays in spite of using the nearest facility. Thereason for this is possibly the difficult terrain, whichthe conventional two wheel drive van type vehicles op-erating under the JE find difficult to navigate despiteshort distances. These remote mothers can possibly bene-fit by having vehicles more able to travel across difficultterrain, in facilities close to such areas. The JE programalso has a provision to establish linkages for the difficultareas [44]. In district 2, forests covered 52.4% of the totaldistrict area (Figure 8). Most of the hot spot mothers indistrict 2 acted differently in that they travelled longer dis-tances through the forest areas to access the CEmOC lo-cated in the district head quarter. The majority of womenwill not require to deliver in a Comprehensive EmOC fa-cility, but the alternative to not delivering in a CEmOCfacility in this setting is nearly equivalent to delivering in adysfunctional facility, as none of the other facilities pro-vide complete Basic EmOC which is life saving. Thereforepromotion of BEmOC deliveries must be preceded byimproving the quality of care at the peripheral facil-ities not capable of providing BEmOC services at the timeof study.
Why did mothers bypass non-BEmOC facilities?Figures 4 and 5 revealed that some mothers bypassednon functional BEmOCs (Non-BEmOCs) to seek care inhigher (district level) facilities offering caesarean sectionservices (CEmOCs and Non-CEmOCs). Bypassing pri-mary care facilities to seek care in higher level facilitieshas been reported from other developing countries. This
Sabde et al. Reproductive Health 2014, 11:57 Page 12 of 14http://www.reproductive-health-journal.com/content/11/1/57
bypassing is costly and inefficient for pregnant mothersand the health system as it delays access to EmOC ser-vices, particularly for those residing in distant locations.Perceived poor quality of care is an important determin-ant for bypassing behavior [45-47].
How can GIS tools support improvement in emergencyobstetric transportation services?The appropriate placement of adequate numbers of ve-hicles and monitoring of these vehicles is crucial tomaximize the overall efficiency of the service, to improveaccessibility for all pregnant women and minimizethe second delay [42,43]. The JE program also has aprovision to install GPS (global positioning systems)in the program vehicles, which can be harnessed for bet-ter monitoring of the vehicles [44]. However, inter-ventions to improve emergency transportation demandrational use of resources particularly in LMIC settingslike India. GIS has been effectively used to identify appro-priate locations for new health centers, and emergencycare services [48-51]. Studies also document the use ofGIS in exploring and improving the access to obstetriccare services [34,52,53]. But this is the first study inwhich GIS tools were used to identify potential areas forfurther interventions to increase the effectiveness of theemergency obstetric transport system.
Methodological considerationsThis study only includes women who ultimately gainedaccess to transport as they were recruited after deliver-ing in health facility. Additional ‘hot spots’ may exist forwomen who could not avail transport to a facility for de-livery. To address this issue we plan to undertake furtherresearch at community level to explore the transport is-sues with mothers who delivered at home. We recordedthe second delay as time from the when the decision togo to a facility for delivery to the time of arrival at thefirst facility. This time variable could not be split intotime spent waiting for the vehicle to arrive and the ac-tual time spent travelling on the road. All times were selfreported by the mothers interviewed in the hospital, andtherefore may have some biases related to the mothersperception of the time. The contribution of various nonJE modes of transport and actual road conditions in thesecond delay was not explored in this study.
ConclusionsThe study reported relatively high utilization rates of JE,indicating that the JE program ably supported the JSYprogram in the province to draw more women into insti-tutions for delivery. The JE service was accessible in allparts of the districts but users faced delays in reachingfacilities. Failure of JE vehicles to reach in time at themothers’ residence was one of the major contributors in
this barrier, as there was no relationship between thedistance from facility and the duration of the seconddelay. The poor performance of EmOC functions at theperipheral facilities was an important concern in oursetting. There was significant clustering of the delayedmothers in certain areas (hot spots) of the districts. Thefindings of the study can assist in implementing targetedemergency transport interventions for better impact. De-tailed regular review and assessment of JE in view ofaccess, contact, promptness in response and patient satis-faction is a must. The state needs to play a strong role inmonitoring the performance of the PPP – not just interms of the number of women utilizing the service, butalso in terms of quality of the service in terms of time ef-ficiency. This may be supported with information tech-nology and GIS. The identified hot spots should be givensupport by using additional resources and activities in-corporated into JE to make it more efficient.
Competing interestsThe authors declare that they have no competing interests.
Authors’ contributionsAll the authors YS, ADC and VD contributed equally in conceptualization andplanning of the study. YS and VD planned and executed data collection. YSmanaged the data entry, GIS mapping and GIS analysis. All authors reviewedand gave critical comments on the manuscript. All authors read andapproved the final manuscript.
AcknowledgementsAuthors extend sincere thanks to the study participants. Acknowledgementsare due to National Rural Health Mission, Government of Madhya Pradesh.We also acknowledge the support of Kristi Sidney, Sarika Chaturvedi, BharatRandive and research team for data collection and management. Weacknowledge support of Zia Ur Rehman, Vivek Parashar and Ashish Uapdhyayin GIS development. The study was financially supported by a grant under theEUFP7 MATIND project.
Author details1Department of Community Medicine, R.D. Gardi Medical College, Ujjain,Madhya Pradesh, India. 2International Center for Health Research, R.D. GardiMedical College, Ujjain, Madhya Pradesh, India. 3Department of Public HealthSciences, Karolinska Institutet, Stockholm, Sweden. 4Department of PublicHealth and Environment, R.D. Gardi Medical College, Ujjain, Madhya Pradesh,India.
Received: 12 November 2013 Accepted: 9 July 2014Published: 22 July 2014
References1. Jehan K, Sidney K, Smith H, De Costa A: Improving access to maternity
services: an overview of cash transfer and voucher schemes in SouthAsia. Reprod Health Matters 2012, 20(39):141–154.
2. Mission Document, National Rural Health Mission Government of India, 2005–2012.2012. http://www.nird.org.in/Brgf/doc/Rural%20HealthMission_Document.pdf.
3. Lim S, Dandona L, Hoisington J, James SL, Hogan MC, Gakidou E: India’sJanani Suraksha Yojana, a conditional cash transfer programme toincrease births in health facilities: an impact evaluation. Lancet 2010,375:2009–2023.
4. Ministry of Health and Family Welfare, Government of India: Executive Summaryof NRHM programme, 2012. 2012. http://mohfw.nic.in/WriteReadData/l892s/4%20Executive%20Summary-20688879.pdf.
5. World health organization. Media center, maternal mortality, 2012. 2012.http://www.who.int/mediacentre/factsheets/fs348/en/.
6. Fournier P, Dumont A, Tourigny C, Dunkleyc G, Dramé S: Improved accessto comprehensive emergency obstetric care and its effect on
Sabde et al. Reproductive Health 2014, 11:57 Page 13 of 14http://www.reproductive-health-journal.com/content/11/1/57
institutional maternal mortality in rural Mali. Bull World Health Organ2009, 87:30–38.
7. Say L, Chou D, Gemmill A, Tunçalp Ö, Moller A, Daniels J, Gülmezoglu AM,Temmerman M, Alkema L: Global causes of maternal death: a WHOsystematic analysis. Lancet Glob Health 2014, 2:e323–e333.
8. Safe, Clean, and Affordable…Transport for Development. Washington, DC20433: The International Bank for Reconstruction and Development / TheWorld Bank; 2008. http://siteresources.worldbank.org/INTTRANSPORT/Resources/336291-1211381200616/Transport_Business_Strategy_web.pdf.
9. Thaddeus S, Maine D: Too far to walk: maternal mortality in context. SocSci Med 1994, 38(8):1091–1110.
10. Stekelenburg J, Kyanamina S, Mukelabai M, Wolffers I, Van Roosmalen J:Waiting too long: low use of maternal health services in Kalabo, Zambia.Trop Med Int Health 2004, 9(3):390–398.
11. Pirkle CM, Fournier P, Tourigny C, Sangaré K, Haddad S: Emergencyobstetrical complications in a rural African setting (Kayes, Mali): the linkbetween travel time and in-hospital maternal mortality. Matern ChildHealth J 2011, 15(7):1081–1087.
12. Shrestha B, Workman R: The effects of restricted access on maternal healthin remote and mountainous areas of rural Nepal. 2008, http://www.mobilityandhealth.org/case/MobilityandHealth_finalreport_NepalDRSP.pdf.
13. Wilson A, Hillman S, Rosato M, Skelton J, Costello A, Hussain J, MacArthur C,Coomarasamy A: A systematic review and thematic synthesis ofqualitative studies on maternal emergency transport in low- andmiddle-income countries. Int J Gynecol Obstet 2013, 122:192–201.
14. Monitoring emergency obstetric care: a handbook. Geneva, Switzerland: WHOpress World Health Organization; 2009. http://www.unfpa.org/webdav/site/global/shared/documents/publications/2009/obstetric_monitoring.pdf.
15. Jammeh A, Sundby J, Vangen S: Barriers to Emergency Obstetric Care Servicesin Perinatal Deaths in Rural Gambia: A Qualitative In-Depth Interview Study.ISRN Obstet Gynecol 2011, 1–10. http://dx.doi.org/10.5402/2011/981096.
16. Sikder SS, Larique AB, Ullah B, Ali H, Rashid M, Mehra S, Jahan N, ShamimAA, West KP, Christian P: Accounts of severe acute obstetric complicationsin Rural Bangladesh. BMC Pregnancy Childbirth 2011, 11:76.
17. Essendi H, Mills S, Fotso JC: Barriers to Formal Emergency Obstetric CareServices’ Utilization. J Urban Health Bull New York Acad Med 2010, 88(2):56–369.
18. Samai O, Sengeh P: Facilitating emergency obstetric care throughtransportation and communication, Bo. Sierra Leone Int J Gynecol Obstet1997, 59(2):S157–S164.
19. Transaid: What we do. http://www.transaid.org/what-we-do/.20. Macintyre K, Hotchkiss D: Referral revisited: community financing
schemes and emergency transport. Soc Sci Med 1999, 49(19):1473–1487.21. Pathmanathan I, Liljestrand J, Martins JM, Rajapaksa LC, Lissner C, De Silva A,
Selvaraju S, Singh P: Human development network health, nutrition andpopulation series, Investing in Maternal Health: Learning from Malaysia andSri Lanka. Washington, D.C.: The international bank for reconstructionand development/The World Bank; 2003 [http://www-wds.worldbank.org/external/default/WDSContentServer/IW3P/IB/2007/08/28/000020439_20070828164038/Rendered/PDF/259010REPLACEM10082135362401PUBLIC1.pdf]
22. Kedia S, Vincent A: Janani Express Yojana: Health Referral Transport Facility.Government of India, Bhopal: 2012. http://www.indiagovernance.gov.in/files/gkc_oneworld_janani_express_yojana.pdf.
23. Janani Express Report Jan - March 2013. National Rural Health Mission 2013.2013, http://www.health.mp.gov.in/nrhm/Janani%20Express-Report-13.pdf
24. Sidney K, Ryan K, Diwan V, De Costa A: Utilization of a State Run PublicPrivate Emergency Transportation Service Exclusively for Childbirth: TheJanani (Maternal) Express Program in Madhya Pradesh, India. PLoS ONE2014, 9(5):e96287. doi:10.1371/journal.pone.0096287.
25. Madhya Pradesh Population Census data 2011. 2011, http://www.census2011.co.in/census/state/madhya+pradesh.html.
26. Chandramouli C: Annual Health Survey Bulletin 2011–12: Madhya Pradesh.New Delhi: Office of Registrar General and Census Commissioner India;2012. http://www.censusindia.gov.in/vital_statistics/AHSBulletins/files2012/Madhya%20Pradesh_Bulletin%202011-12.pdf.
27. Department of public relation, Madhya Pradesh. 2013, http://mpinfo.org/MPinfoStatic/English/election_commission_2013/041113c.asp.
28. Annual Health Survey 2010–2011 Fact Sheet. In Madhya Pradesh. NewDelhi: Office of Registrar General and Census Commissioner India; http://www.censusindia.gov.in/vital_statistics/AHSBulletins/AHS_Baseline_Factsheets/M_P.pdf.
29. HDI Madhya Pradesh Human Development Report. Bhopal: 2007. http://www.undp.org/content/dam/india/docs/human_development_report_madhya_pradesh_2007_full_report.pdf.
30. Guidelines for Monitoring the Availability and Use of Obstetric Services. NewYork, USA: United Nations Children's Fund. 1997. http://www.childinfo.org/files/maternal_mortality_finalgui.pdf.
31. Harris PA, Taylor R, Thielke R, Payne J, Gonzalez N, Conde JG: ResearchElectronic Data Capture (REDCap) - A metadata-driven methodology andworkflow process for providing translational research informatics support.J Biomed Inform 2009, 42:377–381. doi:10.1016/j.jbi.2008.08.010.
32. ArcGIS resource center, ArcGIS help library.http://help.arcgis.com/en/arcgisdesktop/10.0/help/index.html#/Welcome_to_the_ArcGIS_Help_Library/.
33. Pendse V: Maternal deaths in an Indian hospital: A decadeof (no)change? In Sundari Ravindran TK (eds). Safe motherhood initiatives: Criticalissues. Edited by Berer M. London: Blackwell (Reproductive Health Matters;1999:119–126.
34. Gabrysch S, Cousens S, Cox J, Campbell OM: The influence of distanceand level of care on delivery place in rural Zambia: a study oflinked national data in a geographic information system. PLoS Med2011, 8(1):e1000394.
35. Shehu D, Ikeh AD, Kuna MJ: Mobilizing transport for obstetricemergencies in northwestern Nigeria. Int J Gynecol Obstet 1997,59(Suppl 2):S173–S180.
36. Biego G: Survey on Adult and Childhood Mortality, Tanzania 1995. In-DepthStudy on Estimating Adult and Childhood Mortality in Settings of High AdultMortality. Calverton, Maryland, USA: Macro International inc; 1997. http://measuredhs.com/pubs/pdf/FR76/FR76.pdf.
37. Sodemann M, Jakobsen MS, Molbak K, Alvarenga IC, Aaby P: Highmortality despite good care-seeking behavior: a community studyof childhood deaths in Guinea-Bissau. Bull World Health Organ 1997,75:205–212.
38. Chaturvedi S, Randive B, Diwan V, De Costa A: Quality of Obstetric ReferralServices in India’s JSY Cash Transfer Programme for Institutional Births:AStudy from Madhya Pradesh Province. PLoS One 2014, 9(5):e96773.doi:10.1371/journal.pone.0096773.
39. Pitchforth EL, Van Teijlingen ER, Graham WJ, Dixon-Woods M, ChowdhuryM: Getting women to hospital is not enough: a qualitative study ofaccess to emergency obstetric care in Bangladesh. Q Safety Health care2006, 15:214–219.
40. Prime Minister rural road scheme (PMGSY): Ministry of rural developmentGovernment of India. http://www.pmgsy.nic.in/.
41. Objective: Madhya Pradesh Rural Road Development Authority.http://www.mprrda.com/Citizen/objective.htm.
42. Babinard J, Roberts P: Maternal and Child Mortality Development Goals: WhatCan the Transport Sector Do?. Washington DC: The World Bank GroupTransport publications; 2006 [http://siteresources.worldbank.org/INTTSR/Resources/tp12_main_text_maternal_health.pdf]
43. Fiagbe P, Asamoah D, Oduro FT: Assessing the Role of Transport in theAchievement of Maternal Mortality Reduction in Ghana. Int J BusinessManage 2012, 7(5):256–268. doi:10.5539/ijbm.v7n5p256.
44. National Rural Health Mission. Guidelines Janani-Shishu Suraksha karyakram(JSSK). New Delhi: Maternal health division, Ministry of health and familywelfare, Government of India; 2011. http://nrhm.gov.in/nrhm-components/rmnch-a/maternal-health/janani-shishu-suraksha-karyakram/background.html.
45. Kruk ME, Mbaruku G, McCord CW, Moran M, Rockers PC, Galea S: Bypassingprimary care facilities for childbirth: a population-based study in ruralTanzania. Health Policy Plann 2009, 24:279–288.
46. Parkhurst JO, Ssengooba F: Assessing access barriers to maternal healthcare: measuring bypassing to identify health centre needs in ruralUganda. Health Policy Plann 2009, 24:377–384.
47. Ameh C, Msuya S, Hofman J, Raven J, Mathai M, Broek NVD: Status ofEmergency Obstetric Care in Six Developing Countries Five Yearsbefore the MDG Targets for Maternal and Newborn Health. PLoS One2012, 7(12):e49938. doi:10.1371/journal.pone.0049938.
48. Schuurman N, Fiedler RS, Grzybowski SC, Grund D: Defining rationalhospital catchments for non-urban areas based on travel-time. Int JHealth Geogr 2006, 5(43):1–11. doi:10.1186/1476-072X-5-43.
49. Schuurman N, Bell NJ, L'Heureux R, Hameed SM: Modelling optimallocation for pre-hospital helicopter emergency medical services. BMCEmerg Med 2009, 9(6):1–7. doi:10.1186/1471-227X-9-6.
Sabde et al. Reproductive Health 2014, 11:57 Page 14 of 14http://www.reproductive-health-journal.com/content/11/1/57
50. Tanser F: Methodology for optimising location of new primary healthcare facilities in rural communities: a case study in KwaZulu-Natal, SouthAfrica. J Epidemiol Commun Health 2006, 60(10):846–850.
51. Bailey PE, Keyes EB, Parker C, Abdullah M, Kebede H, Freedman L: Using aGIS to model interventions to strengthen the emergency referral systemfor maternal and newborn health in Ethiopia. Int J Gynecol Obstet 2011,115(3):300–309.
52. Simões PP, Almeida RMVR: Geographic accessibility to obstetric care andmaternal mortality in a large metropolitan area of Brazil. Int J GynecolObstet 2011, 112(1):25–29.
53. Sudhof L, Amoroso C, Barebwanuwe P, Munyaneza F, Karamaga A, Zambotti G,Drobac P, Hirschhorn LR: Local use of geographic information systems toimprove data utilisation and health services: mapping caesarean sectioncoverage in rural Rwanda. Trop Med Int Health 2013, 18(1):18–26.
doi:10.1186/1742-4755-11-57Cite this article as: Sabde et al.: A spatial analysis to study access toemergency obstetric transport services under the public private “JananiExpress Yojana” program in two districts of Madhya Pradesh, India.Reproductive Health 2014 11:57.
Submit your next manuscript to BioMed Centraland take full advantage of:
• Convenient online submission
• Thorough peer review
• No space constraints or color figure charges
• Immediate publication on acceptance
• Inclusion in PubMed, CAS, Scopus and Google Scholar
• Research which is freely available for redistribution
Submit your manuscript at www.biomedcentral.com/submit