Shi et al. EURASIP Journal on Wireless Communications and Networking 2014, 2014:119http://jwcn.eurasipjournals.com/content/2014/1/119
RESEARCH Open Access
A training sequence parallel detection technologybased on timeslot sliding windowJian Shi1, Jianfeng Huang2* and Kaihua Liu1
Abstract
The Global System for Mobile communication (GSM) radio network's latest development status and its prominentinterference problems were discussed. The limitations of the cellular radio network analysis using the traditionaldrive test and frequency scanning technology were discussed, which led to the inaccurate interference locationand inefficient interference optimization. A new training sequence parallel detection technology base on timeslotsliding window was proposed. The timeslot sliding window mechanism and the training sequence parallelcorrelative detection algorithms were discussed in detail, and the advantage of these technologies was discussedthough comparative analysis. With the successful application cases of the engineering practice in Zhejiang Provinceof China, the important value of the new technology proposed in this paper in the radio network planning andoptimization engineering applications was proved.
Keywords: Timeslot sliding window; Training sequence; Parallel detection; Cellular radio network
1 IntroductionWith high growth of mobile communication business,the load of Global System for Mobile communication(GSM) radio network increases daily. The frequencybands of GSM900, DCS1800, and EGSM have beenmassively implemented. The number of sites with highcarrier configuration and density of frequency reuseincrease constantly while the distance between base sta-tions of cellular networks is decreasing. At present, theGSM radio network of China Mobile CommunicationsCorporation has widespread problems of excessive over-lapping coverage, severe cross-boundary coverage, andrapidly increasing probability of co-channel interference(CCI) and adjacent channel interference (ACI), whichled to radio signal quality's degrading, the mobile sta-tions' (MS) reception (Rx)-Quality level 5 to 7 (receivedsignal quality, range from level 0 to 7, level 0 to 4 indi-cates good radio signal quality and level 5 to 7 indicatespoor radio signal quality) proportion's significant in-creasing, and user perception's obvious declining [1].Analytical methods [2-4] of traditional regular hexa-
gon cell clusters for interference and coverage cannot
* Correspondence: [email protected] of Telecommunications Engineering, Beijing University of Posts andTelecommunications, Beijing 100876, ChinaFull list of author information is available at the end of the article
meet the requirement of increasing complexity of radionetwork analysis. Moreover, traditional regular testingmethods including drive test and frequency scanning testcannot locate specific interfered frequency, interferencelevels of serving cell, and the location of interferencesource cell, which becomes a technical bottleneck forfurther detailed optimization of current radio network.Traditional Broadcast Channel (BCCH) frequency scan-
ning data is common measuring data source of present in-tegral network structure assessment including coverageand interference [1], which can accurately reflect the radiosignal coverage status of BCCH frequency [5]. There areresearches on the traditional BCCH carrier frequency scan-ning technique, such as the literature [6,7]. However, trad-itional frequency scanning devices can only measure anddecode BCCH channel without effectively distinguishingand measuring received power of the same traffic channel(TCH) carrier frequency coming from different cells.Under normal circumstances, BCCH carrier frequency
is full-power transmitted in normal working condition ofeach cell while the transmitting power of TCH frequencyis influenced by factors of frequency hopping, discontinu-ous transmission (DTX), power control, etc.; in addition,BCCH frequency and TCH frequency have different reusedensities, so there is a large difference between the systemnoise floor levels of two types of carrier frequency. In
pen Access article distributed under the terms of the Creative Commonsg/licenses/by/2.0), which permits unrestricted use, distribution, and reproductionroperly credited.
Shi et al. EURASIP Journal on Wireless Communications and Networking 2014, 2014:119 Page 2 of 14http://jwcn.eurasipjournals.com/content/2014/1/119
different regions (grids) of cells, the received power, carrierinterference ratio (C/I), and noise floor level of BCCH andTCH carrier frequency certainly have differences.Hence, improving accurate frequency scanning meas-
urement for TCH frequency besides BCCH frequencyscanning measurement no doubt has significant engin-eering application value for radio network problems'analysis and optimization.It is very important for exploring the new measuring
technical means and corresponding analysis methods totap the radio network performance potential fundamen-tally. First, new measuring technology should be researchedto measure the radio network more efficiently and suffi-ciently; second, new measurement data analysis methodshould be researched to analyze the massive measurementdata more scientifically and accurately. Thus, more preciseproblem location and optimization solution could be got-ten to improve and upgrade the overall performance of theradio network sufficiently.A kind of new whole-band and high-accuracy traffic
timeslot scanning technology is proposed in this paper - atraining sequence parallel detection technology base ontimeslot sliding window. According to the distribution ofdifferent training sequence codes that are obtained fromeach cell of radio network, it can distinguish and measurereceived power, C/I, and noise floor of co-channel fre-quency coming from different co-channel cells in radio net-worksa. It supplies new frequency scanning measurementand scientific analysis methods for accurate positioning andoptimization solution of radio network interference andcoverage problemsb.The research on training sequence detection in the
industry mostly focuses on the channel estimation,synchronization maintenance, and power measurementinner mobile communication system, as reflected in theliterature [8-10]. The frequency scanning measurementbased on the training sequence detection and its corre-sponding analysis techniques outside the system, as a newapplication direction, has little relevant research literature.
2 Timeslot measuring frequency scanning technology2.1 Necessity of timeslot measurementThe high-precision timeslot measuring frequency scanningproposed in this paper can perform accurate measurementof each traffic timeslot signal power for each frequency inwhole-band in period of full-frame for both BCCH andTCH carrier frequency, which is an innovative radio net-work measuring technique method in the present industry.In different test areas, it can accurately measure the re-ceived power level and C/I in different timeslots of eachcarrier frequency from different overlapping coverage co-channel cells associated with the training sequence code(TSC) allocation for each cell in the radio network. So, thisnew measuring technique method can be supplied for the
depth profiling of cellular radio network coverage andinterference.Scanning per timeslot for each carrier frequency can
effectively distinguish each timeslot's idle state and traf-fic state: in the idle state of timeslot, the correspondingcorrelative power of all training sequence code C/I isless than 0 (C/I < 0) where the timeslot power reflectsthe noise floor of radio networks, so the measuring inthe idle state of timeslot supplies more fine grid's accur-ate measuring data source and new analysis methods formore precise estimation of noise floor; in the traffic stateof timeslot, the corresponding correlative power of alltraining sequence code C/I is larger than 0 (C/I > 0)under normal conditions, so whether the carrier powercomes from serving cells or interference cells can be de-cided according to training sequence allocation. It offersthe most scientifically objective accurate measuring datafor carrier coverage and interference problems analysis.
2.2 Principle of timeslot measuring techniqueThe time slot is a time interval of 576.9 μs (15/26 ms), thatis 156.25 bit durations, and its physical content is called aburst. Four different types of bursts exist in the system.Structure of these bursts appears in Figure 1 [11].The most traffic in GSM is carried by normal burst
(NB). NB is used to carry information on traffic and con-trol channels, except for Random Access Channel (RACH).It contains 116 encrypted bits and includes a guard time of8.25 bit durations (30.46 μs).GSM defines nine groups of training sequence code
(TSC) [12] for NB; eight groups of which are used forthe cell traffic channel. The remaining group is used fortransmitting signal power filling of BCCH carrier fre-quency dummy burst, which is shown in Expression (1).
ð1ÞThe three least significant bits of the Base Station
Identification Code (BSIC) indicate which of the eighttraining sequences is used in the bursts sent on thedownlink common channels of the cell [13]. The trainingsequence known as reference signal is used for the chan-nel equalization in time domain when receiving signals foreach cell, so that it can improve the anti-interference abil-ity of GSM mobile communication system.
Figure 1 GSM time frames, time slots, and bursts structure.
Shi et al. EURASIP Journal on Wireless Communications and Networking 2014, 2014:119 Page 3 of 14http://jwcn.eurasipjournals.com/content/2014/1/119
The downlink timeslot signal of different cells using thesame carrier frequency can use different training sequencesto make the distinction. This supplies an effective technicalmethod for the distinguishing of interference signal powerbetween different cells.High-accuracy traffic timeslot scanning measurement
provides accurate measurement for carrier timeslot sequen-ce's power and C/I in the time dimension besides measuresall carriers in frequency dimension.The core of high-accuracy timeslot measuring technique
is to perform signal sampling over one frame period (eighttimeslots) for every carrier frequency. Taking into accountthe lack of orthogonal property between nine training se-quence codes, training sequence parallel detection tech-nology base on timeslot sliding window proposed in thispaper is used for every timeslot sampled signal detection,and performing the correlative power detection of ninetraining sequence codes can accurately measure the max-imum correlative power and C/I and detect correspondingTSC of training sequence code block for each timeslot.
3 Timeslot sliding window parallel detectiontechnology3.1 Timeslot sliding window parallel detectionIn consideration of GSM as an asynchronous system,downlink signals between each base station do not
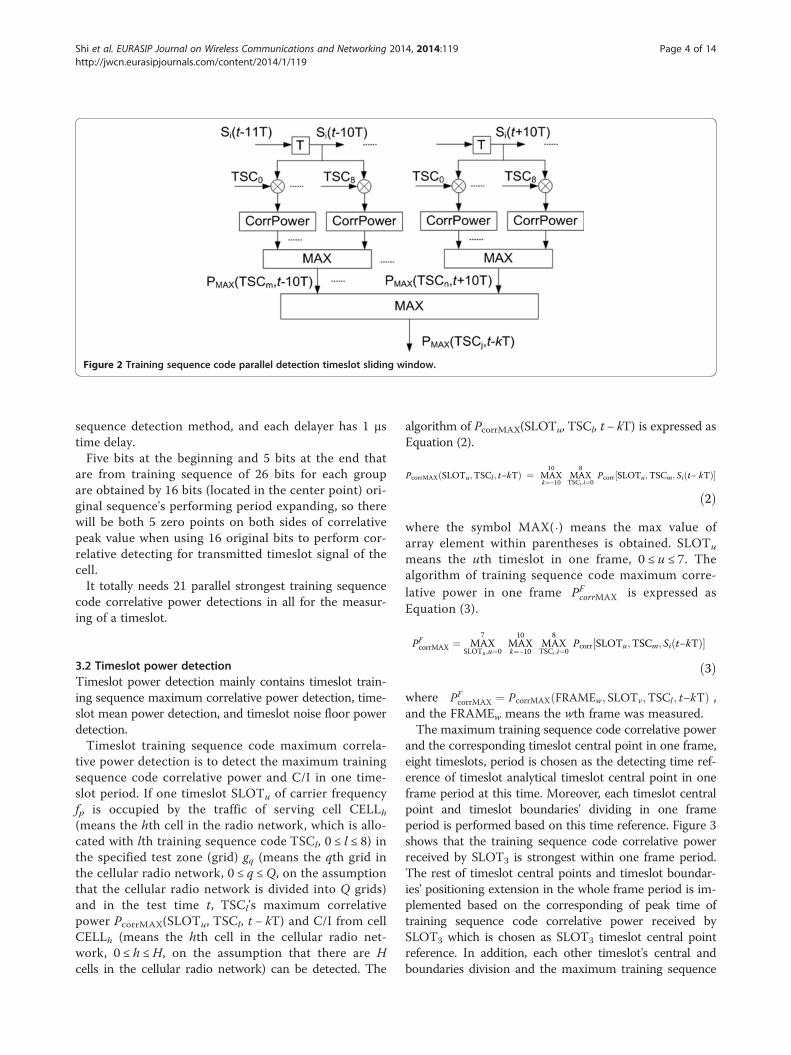
perform timeslot synchronization. The boundary of eachtimeslot would not coincide in one physical frame periodin the received sampled signal of the same carrier com-ing from different cells. Hence, the detection for everytimeslot power must perform sliding widow detection ina burst over one timeslot period. Moreover, parallel de-tecting using nine groups of training sequence code forevery time-delay signal is to detect whether this timeslotexists in traffic occupancy and also to detect the corre-sponding training sequence code of maximum correla-tive power signal when timeslot is existing in trafficoccupancy. Figure 1 shows the parallel sliding windowtime slot detection technology method.The parallel detection sliding window that Figure 2
shows consists of 21 delayers. Time delay period of everydelayer T is 1 μs (T = 1 μs). The whole length of slidingwindow that is extended for 10 μs to both sides fromcentral point is totally 21 μs. The sampled signal delayedevery time is performed parallel correlative detectionwith nine groups of training sequence codes.The GSM training sequence codes have a duration of
26 Gaussian minimum shift keying (GMSK) symbols,which is equal to (26/156.25) × 577 = 96 μs; experienceshows that 20% of signal duration used in sliding win-dow could ensure the effective signal detection. So,there are a total of 21 delayers in the proposed training
Figure 2 Training sequence code parallel detection timeslot sliding window.
Shi et al. EURASIP Journal on Wireless Communications and Networking 2014, 2014:119 Page 4 of 14http://jwcn.eurasipjournals.com/content/2014/1/119
sequence detection method, and each delayer has 1 μstime delay.Five bits at the beginning and 5 bits at the end that
are from training sequence of 26 bits for each groupare obtained by 16 bits (located in the center point) ori-ginal sequence's performing period expanding, so therewill be both 5 zero points on both sides of correlativepeak value when using 16 original bits to perform cor-relative detecting for transmitted timeslot signal of thecell.It totally needs 21 parallel strongest training sequence
code correlative power detections in all for the measur-ing of a timeslot.
3.2 Timeslot power detectionTimeslot power detection mainly contains timeslot train-ing sequence maximum correlative power detection, time-slot mean power detection, and timeslot noise floor powerdetection.Timeslot training sequence code maximum correla-
tive power detection is to detect the maximum trainingsequence code correlative power and C/I in one time-slot period. If one timeslot SLOTu of carrier frequencyfp is occupied by the traffic of serving cell CELLh(means the hth cell in the radio network, which is allo-cated with lth training sequence code TSCl, 0 ≤ l ≤ 8) inthe specified test zone (grid) gq (means the qth grid inthe cellular radio network, 0 ≤ q ≤Q, on the assumptionthat the cellular radio network is divided into Q grids)and in the test time t, TSCl's maximum correlativepower PcorrMAX(SLOTu, TSCl, t − kT) and C/I from cellCELLh (means the hth cell in the cellular radio net-work, 0 ≤ h ≤H, on the assumption that there are Hcells in the cellular radio network) can be detected. The
algorithm of PcorrMAX(SLOTu, TSCl, t − kT) is expressed asEquation (2).
PcorrMAX SLOTu;TSCl; t−kTð Þ ¼ MAX10
k¼−10MAX
8
TSCi;i¼0Pcorr SLOTu;TSCm; Si t− kTð Þ½ �
ð2Þ
where the symbol MAX(⋅) means the max value ofarray element within parentheses is obtained. SLOTu
means the uth timeslot in one frame, 0 ≤ u ≤ 7. Thealgorithm of training sequence code maximum corre-lative power in one frame PF
corrMAX is expressed asEquation (3).
PFcorrMAX ¼ MAX
7
SLOTu;u¼0MAX
10
k¼−10MAX
8
TSCi ;i¼0Pcorr SLOTu;TSCm; Si t−kTð Þ½ �
ð3Þ
where PFcorrMAX ¼ PcorrMAX FRAMEw; SLOTv;TSCl; t−kTð Þ ,
and the FRAMEw means the wth frame was measured.The maximum training sequence code correlative power
and the corresponding timeslot central point in one frame,eight timeslots, period is chosen as the detecting time ref-erence of timeslot analytical timeslot central point in oneframe period at this time. Moreover, each timeslot centralpoint and timeslot boundaries' dividing in one frameperiod is performed based on this time reference. Figure 3shows that the training sequence code correlative powerreceived by SLOT3 is strongest within one frame period.The rest of timeslot central points and timeslot boundar-ies' positioning extension in the whole frame period is im-plemented based on the corresponding of peak time oftraining sequence code correlative power received bySLOT3 which is chosen as SLOT3 timeslot central pointreference. In addition, each other timeslot's central andboundaries division and the maximum training sequence
Figure 3 Positioning of timeslot central point.
Shi et al. EURASIP Journal on Wireless Communications and Networking 2014, 2014:119 Page 5 of 14http://jwcn.eurasipjournals.com/content/2014/1/119
code correlative peak power detection in one whole frameperiod are performed on this basis.The algorithm of traffic occupancy timeslot SLOTv's
timeslot mean received power �P SLOTv; t−kTð Þ isexpressed as Equation (4).
�P SLOTv; t −kTð Þ ¼ 1N
XN−1
n¼0
IS SLOTv; n; t−kTð Þj j2�
þ QS SLOTv; n; t−kTð Þj j2Þð4Þ
where IS(SLOTv, t − kT) and QS(SLOTv, t − kT), respect-ively, are timeslot SLOTv time periods' I and Q two-waybase band complex signal of received sampled signal -GSM modulating signal symbol series. N is a SN modulat-ing symbolic number in a timeslot period. And also IS(SLOTv, t − kT) and QS(SLOTv, t − kT) are given by
IS SLOTv; t−kTð Þ ¼ IS SLOTv; n; t−kTð Þ; n ¼ 0; 1; 2;…;N−1f gð5Þ
3.3 Timeslot C/I detectionThe signal-to-noise ratio (SNR) CtoI(SLOTv, t − kT) oftimeslot occupied by traffic can be calculated based onthe measurement of PMAX(SLOTv, TSCl, t − kT) and �PSLOTv; t � kTð Þ, the algorithm of which is expressed asEquation (7).
CtoI SLOTv; t−kTð Þ ¼ 10 lgPcorrMAX SLOTv;TSð
�P SLOTv; t−kTð Þ−PcorrMAX SLð
3.4 Timeslot noise floor detectionFor the vacant timeslot SLOTv not occupied by traffic, thecorresponding C/I of detected training sequence codemaximum correlative power is less than 0 (C/I < 0), wherethe timeslot detecting power is the noise floor of fp fre-quency's radio network. All the noise floor statistic of va-cant timeslot in the specified test grid is mean noise floor
of this carrier frequency �N floor f p; t−kT� �
, the algorithm
of which is expressed as Equation (8).
�N floor f p; t−kT� �
¼ 1count v;CtoI SLOTv; t−kTð Þ < 0½ �
�X7
v¼0;CtoI SLOTv;t−kTð Þ <0
�P SLOTv; t−kTð Þ
ð8Þwhere count[v, CtoI(SLOTv, t − kT) < 0] is the timeslot
number of CtoI < 0 in Equation (8). �N floor f p; t−kT� �
is
mean noise floor in one frame period. In the practical ap-plication, the statistical averaging of noise floor for severalframe periods of several test loops from the same carrierfrequency in specified test grid can be performed. It canincrease effective signal's sampling quantity of the vacanttimeslot to eliminate the effect brought by signal rapidfading, so that the mean value of noise floor can reflectthe real situation of radio networks more accurately.
3.5 The advantage of the timeslot measurementAt present, the industry of traditional frequency scannercan only measure the BCCH frequency and the ReceivedSignal Strength Indication (RSSI) of TCH carrier frequencyand cannot distinguish and measure the co-channel TCH
Cl; t−kTÞOTv;TSCl; t−kTÞ ð7Þ
Shi et al. EURASIP Journal on Wireless Communications and Networking 2014, 2014:119 Page 6 of 14http://jwcn.eurasipjournals.com/content/2014/1/119
carrier signal from different overlaying coverage cells,which has great limitation to effectively analyze and accur-ately locate wireless network problems. The literature [1]describes the algorithm theory and its application for wire-less network analysis based on the presumption that trad-itional BCCH carrier frequency measurement equivalentto TCH carrier frequency measurement in one cell. Itsshortcomings are mainly in the following two aspects:first, it cannot accurately reflect the transmission powerdifferences between BCCH and TCH the carrier TRX inradio network, which may come from the power controlor RF hardware performance difference; and second, itcannot reflect the TCH carrier frequency traffic correl-ation between the different overlaying coverage cells. Allthese become the root causes that the interference sourcecannot be accurately located in current cellular wirelessnetwork optimization engineering.Assuming that the analyzed GSM radio network area
is in a dense traffic urban area, which has N overlayingcoverage cells, M carrier frequencies could be reused,each cell has L carrier frequency TRXs on average.When N × L >M + k, k ≥ 2, then there must be at least kco-channel interference cell pairs according to the trad-itional analysis presumption that TCH carrier frequencypower level measurement results are equaled to BCCHcarrier frequency scanning measurement results. Withtraditional frequency scanning measurement technology,it cannot distinguish and measure the co-channel TCHcarrier signal from different overlaying coverage cells ina specific observation period; it also cannot measure theTCH traffic correlation between them, so it cannot lo-cate whether co-channel interference happens amongco-channel cell pair, in which co-channel cell pair the co-channel pair co-channel interference happen, whichco-channel cell pair has the most severe co-channelinterference, and also could not choose the best carrierfrequency to the adjustment and optimization of the in-terfered carrier frequencies.In the case of traffic occupation, such as in the GSM
radio network's busy traffic time, the TCH carrier fre-quencies' co-channel power from different overlayingcoverage cells could be distinguished and measured dir-ectly with the training sequence parallel detection tech-nology base on timeslot sliding window proposed in thispaper, by which it could locate the co-channel interfer-ence among overlaying coverage cells precisely. Further-more, though all-band frequency scanning measurementparallelly detects all the training sequences' power levelin each timeslot in the measurement frame period, thecarrier frequencies with low reuse density, low traffic,and low noise floor could be chosen to the adjustmentand optimization of the interfered carrier frequencies. Inthese ways, the performance of the radio network couldbe fully enhanced.
The advantage of the training sequence parallel detec-tion technology base on timeslot sliding window proposedin this paper is proved through the above comparative ana-lysis, which could fundamentally overcome the problemsinduced by traditional frequency scanning measurementand its interference analysis presumption - TCH carrierfrequency power level equaled to BCCH carrier frequencypower level. The GSM cellular radio network's coverage,interference, network structure, and frequency plan couldbe analyzed, evaluated, and optimized more efficiently, ob-jectively, and precisely based on this new technology. Thetraining sequence parallel detection technology could be a‘perspective instrument’ for GSM cellular radio network.
3.6 Timeslot measurement used in 3/4G networkThe training sequence parallel detection technology baseon timeslot sliding window proposed in this paper could beexpanded and used in the channels timeslot measurementof 3/4G cellular radio network. The Time Division Syn-chronous Code Division Multiple Access (TD-SCDMA)time frames, time slots, and bursts structure appear inFigure 4 [14], where Tc = 12.5/16 μs denotes the chipduration; cyclic prefix (CP) denotes the chip length;chips denote the number of the chips.The training sequence in TD-SCDMA burst structure
is also called midamble code, which is used in channelestimation, synchronization maintaining, power meas-urement, etc.The midamble codes have a length of 144 chips, which
are generated by basic midamble codes though cycle ex-tension. The basic midamble codes have a length of 128chips in TD-SCDMA system. TD-SCDMA system has128 basic midamble codes, which are divided into 32groups of four. Each cell is allocated basic midamblecodes in a group. The midamble codes used by differentusers in a timeslot are generated by the cell's basic mid-amble codes though cyclic shift in a serving cell [15].TD-SCDMA system is a uplink and downlink synchro-
nization system [16]. For the normal timeslot, the paralleldetection of the traffic channelization codes' burst midam-ble could be realized based on sliding timeslot window. Amidamble codes parallel detection technology based onsliding timeslot window is shown in Figure 5.There is one to one corresponding relationship be-
tween the downlink pilot codes and the basic midamblecodes group in TD-SCDMA system. For one specificnormal timeslot in one carrier frequency, the number ofusers is equal to the cyclic shift phase number of basicmidamble codes. The midamble codes in one burst haveno spreading and scrambling process, so the midamblecodes are a definite signal. And the midamble codes andthe data symbols have the same transmission power inone traffic burst [17]. On this basis, the signal powerand C/I of the different phase shifts of different basic
Figure 4 TD-SCDMA time frames, time slots, and bursts structure.
Shi et al. EURASIP Journal on Wireless Communications and Networking 2014, 2014:119 Page 7 of 14http://jwcn.eurasipjournals.com/content/2014/1/119
midamble codes, which may be from different co-channel cells, could be measured using the midamblecodes parallel detection technology based on timeslotsliding window proposed in this paper. These measure-ment data could be used to analyze the coverage andinterference condition between co-channel cells pre-cisely, which could provide scientific basis to the high ef-ficient optimization of the TD-SCDMA cellular radionetwork.For the 4G Long Term Evolution (LTE) network, its
physical layer is based on orthogonal frequency divisionmultiplexing (OFDM) with a cyclic prefix (CP) in thedownlink [18]. Cell-specific reference signals (CRS) areequivalent to training sequence in 2/3G network. CRS aretransmitted in all downlink subframes in a cell supporting
Physical Downlink Shared Channel (PDSCH) transmission[19], which have a fixed position in time domain and fre-quency domain. Therefore, the reference symbol (RS) re-ceived power (RSRP) and signal to interference plus noiseratio (SINR) of the co-channel signals from different cellscould be distinguished and measured by parallel detectionof the CRS based on timeslot, which provides a scientificand efficient measurement means for the interference andcoverage analysis and their optimization in LTE cellularradio network.
4 Application of timeslot measurement4.1 Timeslot measurement dataThe training sequence parallel detection technology baseon timeslot sliding window proposed in this paper has
Shi et al. EURASIP Journal on Wireless Communications and Networking 2014, 2014:119 Page 8 of 14http://jwcn.eurasipjournals.com/content/2014/1/119
already been developed and realized in the frequencyscanner. Also, this kind of timeslot measurement is calledas the high accurate traffic channel timeslot scanning.The high accurate traffic channel timeslot scanning data
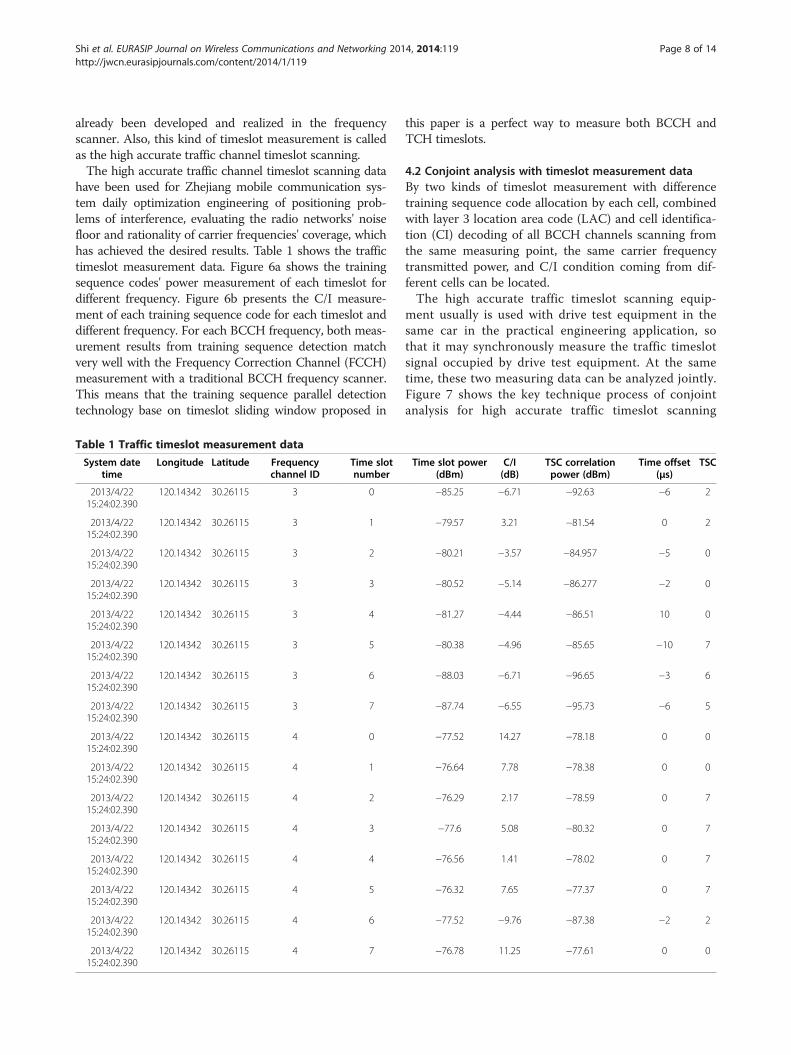
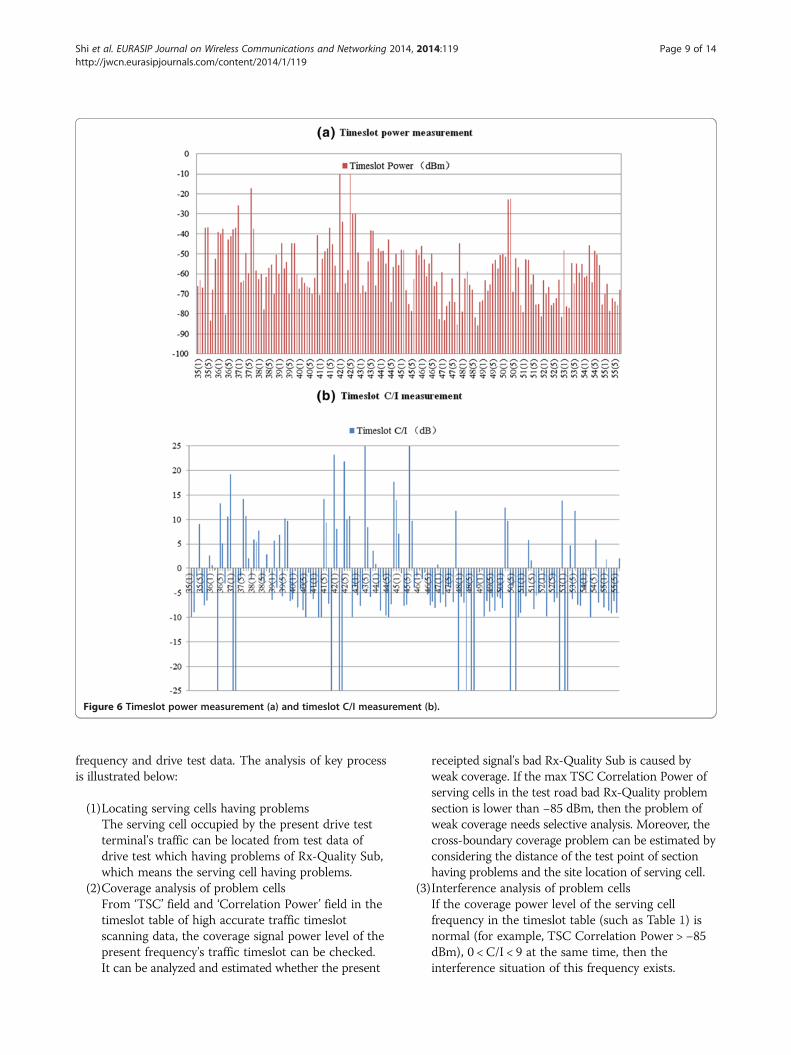
have been used for Zhejiang mobile communication sys-tem daily optimization engineering of positioning prob-lems of interference, evaluating the radio networks' noisefloor and rationality of carrier frequencies' coverage, whichhas achieved the desired results. Table 1 shows the traffictimeslot measurement data. Figure 6a shows the trainingsequence codes' power measurement of each timeslot fordifferent frequency. Figure 6b presents the C/I measure-ment of each training sequence code for each timeslot anddifferent frequency. For each BCCH frequency, both meas-urement results from training sequence detection matchvery well with the Frequency Correction Channel (FCCH)measurement with a traditional BCCH frequency scanner.This means that the training sequence parallel detectiontechnology base on timeslot sliding window proposed in
Table 1 Traffic timeslot measurement data
System datetime
Longitude Latitude Frequencychannel ID
Time slotnumber
2013/4/2215:24:02.390
120.14342 30.26115 3 0
2013/4/2215:24:02.390
120.14342 30.26115 3 1
2013/4/2215:24:02.390
120.14342 30.26115 3 2
2013/4/2215:24:02.390
120.14342 30.26115 3 3
2013/4/2215:24:02.390
120.14342 30.26115 3 4
2013/4/2215:24:02.390
120.14342 30.26115 3 5
2013/4/2215:24:02.390
120.14342 30.26115 3 6
2013/4/2215:24:02.390
120.14342 30.26115 3 7
2013/4/2215:24:02.390
120.14342 30.26115 4 0
2013/4/2215:24:02.390
120.14342 30.26115 4 1
2013/4/2215:24:02.390
120.14342 30.26115 4 2
2013/4/2215:24:02.390
120.14342 30.26115 4 3
2013/4/2215:24:02.390
120.14342 30.26115 4 4
2013/4/2215:24:02.390
120.14342 30.26115 4 5
2013/4/2215:24:02.390
120.14342 30.26115 4 6
2013/4/2215:24:02.390
120.14342 30.26115 4 7
this paper is a perfect way to measure both BCCH andTCH timeslots.
4.2 Conjoint analysis with timeslot measurement dataBy two kinds of timeslot measurement with differencetraining sequence code allocation by each cell, combinedwith layer 3 location area code (LAC) and cell identifica-tion (CI) decoding of all BCCH channels scanning fromthe same measuring point, the same carrier frequencytransmitted power, and C/I condition coming from dif-ferent cells can be located.The high accurate traffic timeslot scanning equip-
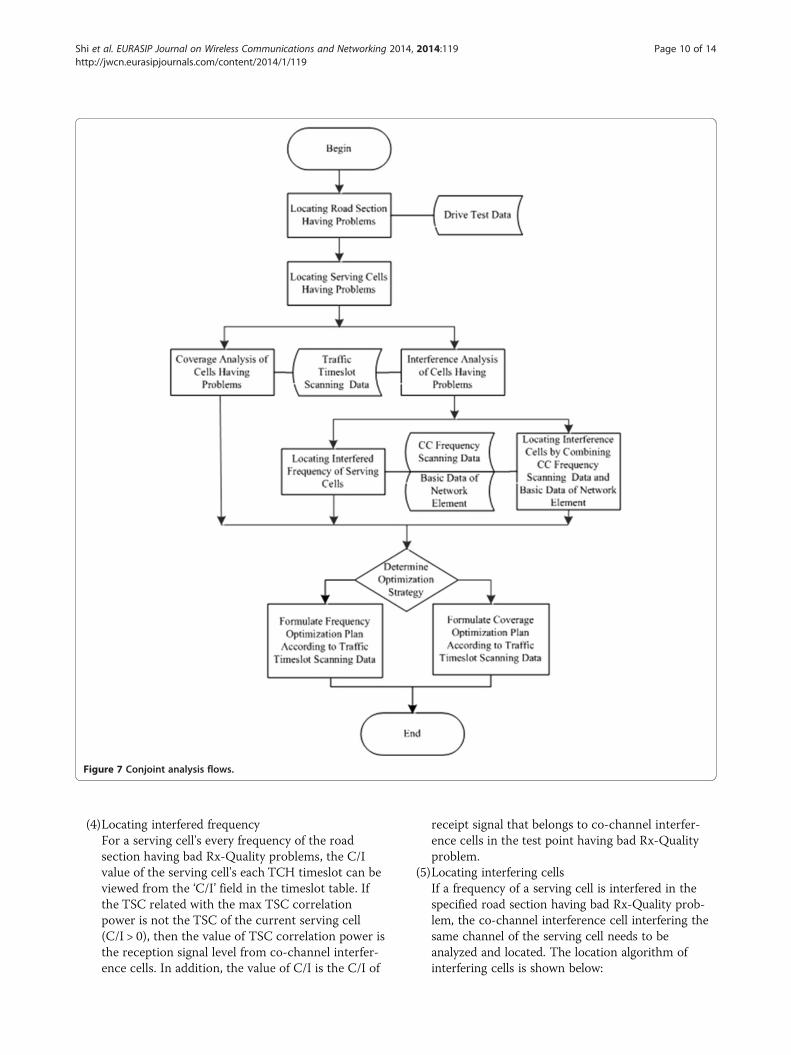
ment usually is used with drive test equipment in thesame car in the practical engineering application, sothat it may synchronously measure the traffic timeslotsignal occupied by drive test equipment. At the sametime, these two measuring data can be analyzed jointly.Figure 7 shows the key technique process of conjointanalysis for high accurate traffic timeslot scanning
Time slot power(dBm)
C/I(dB)
TSC correlationpower (dBm)
Time offset(μs)
TSC
−85.25 −6.71 −92.63 −6 2
−79.57 3.21 −81.54 0 2
−80.21 −3.57 −84.957 −5 0
−80.52 −5.14 −86.277 −2 0
−81.27 −4.44 −86.51 10 0
−80.38 −4.96 −85.65 −10 7
−88.03 −6.71 −96.65 −3 6
−87.74 −6.55 −95.73 −6 5
−77.52 14.27 −78.18 0 0
−76.64 7.78 −78.38 0 0
−76.29 2.17 −78.59 0 7
−77.6 5.08 −80.32 0 7
−76.56 1.41 −78.02 0 7
−76.32 7.65 −77.37 0 7
−77.52 −9.76 −87.38 −2 2
−76.78 11.25 −77.61 0 0
Figure 6 Timeslot power measurement (a) and timeslot C/I measurement (b).
Shi et al. EURASIP Journal on Wireless Communications and Networking 2014, 2014:119 Page 9 of 14http://jwcn.eurasipjournals.com/content/2014/1/119
frequency and drive test data. The analysis of key processis illustrated below:
(1)Locating serving cells having problems
The serving cell occupied by the present drive testterminal's traffic can be located from test data ofdrive test which having problems of Rx-Quality Sub,which means the serving cell having problems.
(2)Coverage analysis of problem cellsFrom ‘TSC’ field and ‘Correlation Power’ field in thetimeslot table of high accurate traffic timeslotscanning data, the coverage signal power level of thepresent frequency's traffic timeslot can be checked.It can be analyzed and estimated whether the present
receipted signal's bad Rx-Quality Sub is caused byweak coverage. If the max TSC Correlation Power ofserving cells in the test road bad Rx-Quality problemsection is lower than −85 dBm, then the problem ofweak coverage needs selective analysis. Moreover, thecross-boundary coverage problem can be estimated byconsidering the distance of the test point of sectionhaving problems and the site location of serving cell.
(3)Interference analysis of problem cellsIf the coverage power level of the serving cellfrequency in the timeslot table (such as Table 1) isnormal (for example, TSC Correlation Power > −85dBm), 0 < C/I < 9 at the same time, then theinterference situation of this frequency exists.
Figure 7 Conjoint analysis flows.
Shi et al. EURASIP Journal on Wireless Communications and Networking 2014, 2014:119 Page 10 of 14http://jwcn.eurasipjournals.com/content/2014/1/119
(4)Locating interfered frequencyFor a serving cell's every frequency of the roadsection having bad Rx-Quality problems, the C/Ivalue of the serving cell's each TCH timeslot can beviewed from the ‘C/I’ field in the timeslot table. Ifthe TSC related with the max TSC correlationpower is not the TSC of the current serving cell(C/I > 0), then the value of TSC correlation power isthe reception signal level from co-channel interfer-ence cells. In addition, the value of C/I is the C/I of
receipt signal that belongs to co-channel interfer-ence cells in the test point having bad Rx-Qualityproblem.
(5)Locating interfering cellsIf a frequency of a serving cell is interfered in thespecified road section having bad Rx-Quality prob-lem, the co-channel interference cell interfering thesame channel of the serving cell needs to beanalyzed and located. The location algorithm ofinterfering cells is shown below:
Shi et al. EURASIP Journal on Wireless Communications and Networking 2014, 2014:119 Page 11 of 14http://jwcn.eurasipjournals.com/content/2014/1/119
First, consider the traditional BCCH frequencyscanning data of this road section (scanning datatable of BCCH frequency) to ensure the cells setB, coverage overlap cells set in this problem region.Second, for the specified interfered carrier frequency ofthe serving cell in the problem road section, analyzethe timeslot table to seek the co-channel interferencecells whose TSC belongs to other cells. Check the cellsset A having co-channel but different TSC withincoverage overlap cells set B. The cells set A containsinterference cells interfering the problem serving cell.For the attention, the probability of existing cellshaving the co-channel and the same TSC in the cellsset B is very small. If it really happens, accuratelocation of the real interference cell can beperformed according to the azimuth angle of cellsand distances between cells and the test point ofroad section having bad Rx-Quality problems.
(6)Locating reason of road section having problemsAccording to high accurate traffic timeslot scanningmeasurement data, the situation of received signallevel and C/I for each cell's each carrier frequency'seach timeslot of the road section having badRx-Quality problems can be checked from theanalysis above. Whether the coverage of cells isreasonable can be analyzed with a map. If thereceived signal level by the drive test equipment in theroad section having bad Rx-Quality problems from a
farther cell is very strong, then it means the coverageof this cell is not reasonable. The antenna of thiscell needs to adjust to control the problem of cross-boundary coverage. If the road section having bad Rx-Quality problems is strongly interfered by the nearbycell, then it explains that the frequency assignment isnot reasonable. It needs frequency optimization.
The conjoint analysis technology of high accuratetraffic timeslot scanning measurement and drive testhas been applied in the pilot program of China MobileLtd in Zhejiang Province. The Beishan Road near theWest Lake in Hangzhou that existed bad Rx-QualitySub problems for a long term was conjointly analyzedby the synchronization test of traffic timeslot scanningmeasurement data and drive test data. Plenty of prob-lems of coverage and interference were accurately located,which means the remarkable engineering application iseffective.As shown Figure 8, the no. 54 frequency of no. 30984
cell located by timeslot scanning data analysis in the badquality section of Beishan Road in Hangzhou is severelyinterfered by several the same frequency cells with no.54 frequency around it, so the statistic C/I of no. 54 fre-quency in no. 30984 cell is only 5.47. In addition, ac-cording to the analysis of timeslot scanning data for thissection, the received power of no. 68 frequency is rela-tively small. It means its multiplexing density in this
Shi et al. EURASIP Journal on Wireless Communications and Networking 2014, 2014:119 Page 12 of 14http://jwcn.eurasipjournals.com/content/2014/1/119
section is relatively low, so it is suited to replace the no.54 frequency of no. 30984 cell, to improve the signalquality for this measurement point.Timeslot measurement supplies direct measuring techno-
logical means for frequency coverage condition analysis,noise floor analysis, interference condition and locatingof interference source analysis, radio network structureanalysis, etc. Timeslot measurement offers the most im-portant radio measuring technological means for preciseoptimization and the improvement of radio networks'performance.
4.3 Network structure analysisUsing the high accurate traffic channel timeslot scanningmeasurement data to evaluate radio network structuremainly can perform assessments such as frequency num-ber of road overlapping coverage, TRX (carrier frequencytransceiver) number of road overlapping coverage, fre-quency complexity of roads, and frequency reuse densityof roads. Among these assessments, the same frequencyis reused for n different cells means existing n TRX of co-channel interference in the overlapping coverage region.The theoretical available frequency number of radio net-work is set as M.Definition. Frequency number of road overlapping
coverage NF_overlap(gq) is the (BCCH + TCH) frequencysum of all cells measured by the high accurate trafficchannel timeslot scanning equipment in the specifiedtesting road grid gq when it is lower than the strongestsignal RPmax = 35 dB or higher than the received powerPlow = −85 dBm.
NF overlap gq� �
¼ count i; < f i; gq >h i
ð9Þ
The function count [•] denotes counting differentelements conforming to the condition < • > in brackets.Definition. Frequency complexity of road FCR(gq) is the
result of frequency number of roads overlapping coverageNF_overlap(gq) divided by theoretical available frequencynumber M and multiplied by 100%.
FCR gq� �
¼ NF overlap gq� �
=M� 100% ð10Þ
Definition. TRX number of road overlapping coverageNTRX_overlap is the combinatorial number (frequency +TSC) measured by the high accurate traffic channel time-slot scanning equipment in the specified testing road gridgq when it is lower than the strongest signal level RPmax =35 dB or higher than the received power Plow = −80 dBm.
NTRX overlap gq� �
¼ count C i; jð Þ < f i TSCj� �
; gq >h i
ð11Þ
Definition. Frequency reuse density of roads ρF(gq)equals TRX number of road overlapping coverage divided
by frequency number of road's overlapping coverage mea-sured by the high accurate traffic channel timeslot scan-ning equipment.
ρF gq� �
¼ NTRX overlap gq� �
=NF overlap gq� �
ð12Þ
Definition. Single frequency reuse density ρF(fi, gq) isthe TRX number of road overlapping coverage of thesame carrier frequency fi having different TSC measuredby the high accurate traffic channel timeslot scanningequipment in the specified testing road grid gq. It is equalto co-channel cells number of fi existing correlative traffic.
ρF f i; gq� �
¼ count v; < f i TSCvð Þ; gq >h i
ð13Þ
Single frequency reuse density index can be used toscreen the corresponding frequency set whose frequencyreuse density is too high in interference road sectionhaving problems. Moreover, it is used to perform fre-quency optimization adjustment by screening lower re-use density frequencies.The performance of radio network structure could be
evaluated objectively and accurately, by using five de-fined network structure indices above, such as perform-ing alerting when frequency complexity of road (FCR)(gq) is larger than 75%, and optimization adjustment isneeded when FCR (gq) is larger than 100%; performingalerting when frequency reuse density of road is largerthan 1.5, and optimization adjustment is needed whenfrequency reuse density of roads is larger than 2.The correlation analysis index of network structure pro-
posed in this paper was performed analysis validation inHangzhou, Zhejiang. The result shows that the analysis isefficient and precise. In the interference road section hav-ing level 6 and level 7 Rx-Quality Sub of Beishan RoadWest Lakeside Hangzhou shown in Figure 9 (the sectionof rad circles pointed by arrows and the blue triangles andcircles in Figure 9 marks the sites of GSM at 900 MHzoutdoor cells and indoor cells, respectively; the green tri-angles and circles in Figure 9 mark the sites of Digital Cel-lular System at 1,800 MHz outdoor cells and indoor cells,respectively), the corresponding FCR is larger than 90%.In addition, frequency reuse density of roads is larger than2 (shown in Figure 10). The radio network structure iscomplex, which induces the obvious frequency interfer-ence problems in the system.According to the contrastive analysis of Figures 6 and 7,
the traffic testing bad Rx-Quality Sub road section, highinterference road section, and the road section of complexnetwork structure present good correlation. In addition,the key cell and key carrier frequency causing problemsof network structure can be accurately located by carrierclass timeslot measuring of high accurate traffic timeslotscanning, which supplies objectives and accurate basis for
Figure 9 Rx-Quality Sub of Beishan Road, Hangzhou, and interference problem points.
Shi et al. EURASIP Journal on Wireless Communications and Networking 2014, 2014:119 Page 13 of 14http://jwcn.eurasipjournals.com/content/2014/1/119
targeted efficient optimization of structure problems. Itsurmounts the subjectivity, inaccuracy, and uncertaintyanalysis based on traditional BCCH frequency scanningmeasuring being equivalent to TCH frequency measuring.It also makes the network structure assessment turn intoaccurate actual measurement phase from traditional in-accurate estimation phase.
Figure 10 Structure analysis of bad Rx-Quality Sub road section.
On the basis of performing objective analysis fornetwork structure, combining the coverage analysisand interference analysis based on high accurate trafficchannel timeslot scanning to perform exquisite andintegrated optimization for radio network can furthestexcavate and improve the potential performance ofradio network.
Shi et al. EURASIP Journal on Wireless Communications and Networking 2014, 2014:119 Page 14 of 14http://jwcn.eurasipjournals.com/content/2014/1/119
5 ConclusionsThe training sequence parallel detection technologybase on timeslot sliding window proposed in this paperis a significant innovation of frequency scanning tech-nology. Moreover, its idea could also be applied to theradio networks measurement of 3G and 4G cellular mo-bile communication systems, which has indispensable corevalue of application for planning and optimizing engineer-ing's accurate analysis of radio network problems andprovision of high efficient solution.
EndnotesaIt should be noted that our training sequence parallel
detection technology based on timeslot sliding windowis used for downlink power level and C/I measuring,which could distinguish co-channel signal from differentoverlay coverage cells.
bThe research on the training sequence detection in thispaper is aimed at TCH timeslot measuring, and the meas-urement data would be used to analyze and optimize theperformance of cellular radio network.
AbbreviationsACI: adjacent channel interference; BCCH: Broadcast Channel; CC: color code;CCI: co-channel interference; CDMA: Code Division Multiple Access; CI: cellidentification; CRS: cell-specific reference signal; CP: cyclic prefix; C/I: carrierinterference ratio; DTX: discontinuous transmission; DwPTS: downlink pilottime slot; FCCH: Frequency Correction Channel; GMSK: Gaussian filteredminimum shift keying; GP: guard period; GSM: Global System for Mobilecommunication; LTE: Long Term Evolution; OFDM: orthogonal frequencydivision multiplexing; PDSCH: Physical Downlink Shared Channel;RACH: Random Access Channel; RS: reference signal; RSRP: RS receivedpower; Rx: reception; SNR: signal-to-noise ratio; TCH: traffic channel;TDMA: time division multiple access; TD-SCDMA: Time Division SynchronousCDMA; TRX: transmission and reception; TSC: training sequence code;UpPTS: uplink pilot time slot.
Competing interestsThe authors declare that they have no competing interests.
AcknowledgementsThe research project base on network structure evaluating technology offrequency scanning from this paper was highly valued and stronglysupported by leaders and staff of China Mobile Communications Corporationand China mobile Zhejiang branch. Thanks to them for the smoothestablishment of and good results obtained from this research project!
Author details1School of Electronic Information Engineering, Tianjin University, Tianjin300072, China. 2School of Telecommunications Engineering, BeijingUniversity of Posts and Telecommunications, Beijing 100876, China.
Received: 7 January 2014 Accepted: 30 June 2014Published: 16 July 2014
References1. H Zheng, F Chen, A radio network structure evaluating technology base on
frequency scanning. Telecommun Technol J 8, 74–79 (2013)2. KH William, Frequency assignment: theory and applications. Proc. IEEE
68, 1497–1514 (1980)3. KN Sivarajan, M Celiece RJ, JW Ketchun, Channel assignment in cellular
radio network. Proc. IEEE 39th VTC, 846–850 (1989)4. R Mathar, J Mattfeldt, Channel assignment in cellular radio networks. IEEE
Trans Veh Technol 42(4), 647–656 (1993)
5. N Mijatovic, I Kostanic, G Evans, Use of scanning receivers for RF coverageanalysis and propagation model optimization in GSM networks, in EuropeanWireless Conference, 2008, pp. 1–6
6. N Mijatovic, I Kostanic, S Dickey, Comparison of receive signal levelmeasurement techniques in GSM cellular networks, in IEEE CCNC, 2008,pp. 738–743
7. ZH Jiang, W Hong, L Tian, Design of a triple-band scanner for TD-SCDMAnetwork planning and optimization, in International Conference onCommunication Technologie, 2010, pp. 1220–1223
8. H Zhao, C Song, S Zhang, Implementation and performance analysis ofchannel estimation in TD-SCDMA. Mod Electron Tech J 5, 86–96 (2005)
9. S Qinfang, DC Cox, A Lozano, HC Huang, Training-based channel estimationfor continuous flat fading BLAST, in IEEE International Conference on, Volumel,28 April-2 May 2002, 2002, pp. 25–329
10. M-H Hsieh, C-H Wei, Channel estimation for OFDM systems based oncomb-type pilot arrangement in frequency selective fading channels. IEEETrans Comsumer Electron 44(1), 217–255 (1998)
11. GSM Technical specifications 05.01, Physical layer on the radio path. Version7.0.1 release, ETSI, phase 2+, 1998.
12. GSM Technical specifications 05.02, Multiplexing and multiple access on theradio path. Version 7.1.0 release, ETSI, phase 2+, 1998.
doi:10.1186/1687-1499-2014-119Cite this article as: Shi et al.: A training sequence parallel detectiontechnology based on timeslot sliding window. EURASIP Journal onWireless Communications and Networking 2014 2014:119.
Submit your manuscript to a journal and benefi t from: