Obsomer et al. Parasites & Vectors 2013, 6:136http://www.parasitesandvectors.com/content/6/1/136
RESEARCH Open Access
Anopheles species associations in Southeast Asia:indicator species and environmental influencesValérie Obsomer1,2*, Marc Dufrene3, Pierre Defourny2 and Marc Coosemans1
Abstract
Background: Southeast Asia presents a high diversity of Anopheles. Environmental requirements differ for eachspecies and should be clarified because of their influence on malaria transmission potential. Monitoring projectscollect vast quantities of entomological data over the whole region and could bring valuable information to malariacontrol staff but collections are not always standardized and are thus difficult to analyze. In this context studyingspecies associations and their relation to the environment offer some opportunities as they are less subject tosampling error than individual species.
Methods: Using asymmetrical similarity coefficients, indirect clustering and the search of indicator species, thispaper identified species associations. Environmental influences were then analysed through canonical anddiscriminant analysis using climatic and topographic data, land cover in a 3 km buffer around villages andvegetation indices.
Results: Six groups of sites characterized the structure of the species assemblage. Temperature, rainfall andvegetation factors all play a role. Four out of the six groups of sites based on species similarities could bediscriminated using environmental information only.
Conclusions: Vegetation indices derived from satellite imagery proved very valuable with one variable explainingmore variance of the species dataset than any other variable. The analysis could be improved by integratingseasonality in the sampling and collecting at least 4 consecutive days.
BackgroundSoutheast Asia presents a high diversity of Anopheles in-cluding more than 30 Anopheles species present in the do-mestic environment [1]. The major vectors, Anophelesdirus sensu lato, An. minimus s.l., An. epiroticus, are re-sponsible for most malaria cases in the region but second-ary vectors might play a sporadic role [2]. Environmentalrequirements differ for each species and should be cla-rified because of their influence on malaria transmissionpotential. Various research studies [3,4] try to relateAnopheles species and environmental drivers in the regionbut are often restricted to small areas and a few speciesdue to the logistic effort necessary to obtain optimal sam-pling. On the other hand, monitoring projects can
* Correspondence: [email protected] of Parasitology, Prince Leopold Institute of Tropical Medicine,Nationalestraat 155, Antwerp 2000, Belgium2Earth and Life Institute, Environmental Sciences, Université Catholique deLouvain, Croix du Sud 2/16, Louvain-la-Neuve B-1348, BelgiumFull list of author information is available at the end of the article
generate vast quantities of data on a wider scale, but sam-pling design is often not optimal for exploring biodiversityissues. This is the case of the MALVECASIA project [5],which operated a major collection effort throughout Laos,Cambodia and Vietnam capturing Anopheles between2003 and 2005 in more than a hundred sites to monitorinsecticide resistance. For logistic reasons, surveys werenot concurrent. In this context studying species associa-tions and their relation to the environment offer some op-portunities. Associations are less subject to sampling errorthan individual species. Moreover, some species such asAn. dirus s.l. are difficult to collect and abundance variesgreatly according to the rain history of the previous days[6]. Occurrence of such elusive species could be revealedby the presence of associated species.Several concept of species association have been devel-
oped [7] but Fager and McGowan [8] simply refer to arecurrent group of co-occurring species. Cole [9] designeda first coefficient measuring the degree of associationbetween pairs of species which was used to identify
al Ltd. This is an Open Access article distributed under the terms of the Creativeommons.org/licenses/by/2.0), which permits unrestricted use, distribution, andiginal work is properly cited.
Obsomer et al. Parasites & Vectors 2013, 6:136 Page 2 of 14http://www.parasitesandvectors.com/content/6/1/136
association between larvae [10-12]. The index was furthercorrected by Hurlbert [13] to account for species frequen-cies bias and used for analysis of mosquito association[14-19]. Other indices target species dominance [20-22].Southwood [23] also developed an index that takes thenumber of individuals collected into consideration [24].However, only pairs of mosquito species were investigatedand mostly using a count of common breeding sites at lar-val stages [25].Studying associations between more than two species
and particularly Anopheles species adults associations canbe a challenge: (1) abundance data may not reflect the trueproportion of species because some species are more eas-ily captured than others, (2) correlation coefficients can’tbe used as they associate co-occurring species only if theirabundances vary linearly, (3) double absences should bediscarded as they do not mean association, and (4) falseabsence are common in particular when studying a greatnumber of species with different seasonality, behavior andresponse to sampling [26]. Nevertheless, this paper pro-poses a method to tackle each of the above mentioned is-sues and apply an ecological concept based on indicativespecies to identify species association.In this context, this paper aims to (1) define species
assemblages and identify indicator species for those as-semblages, and (2) search environmental determinantswhich could explain or help delineate those assemblages.
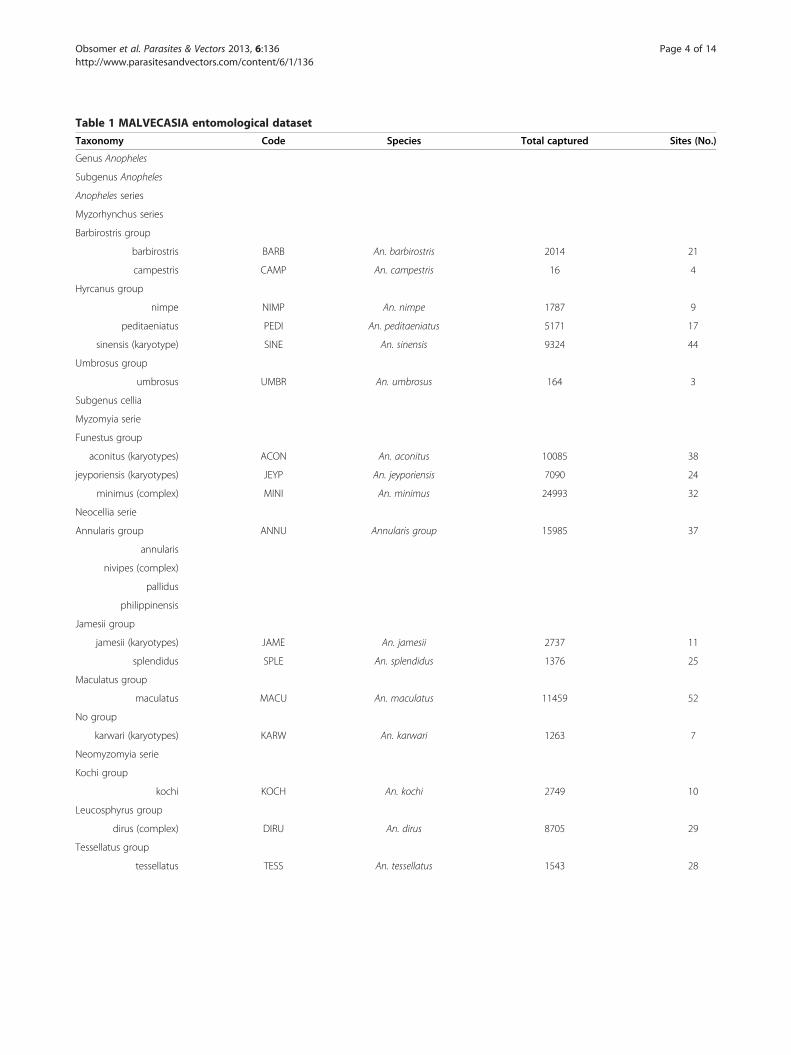
MethodsEntomological dataThe MALVECASIA dataset described in Van Bortel [5] in-vestigated approximately two sites per province in Laos,Cambodia and Vietnam from 2003 and 2005 (Figure 1)(can be obtained from the author M. Coosemans). Thepresent study concentrates on adult Anopheles capturedby human baits indoors and outdoors, which correspondto Anopheles of interest for public health. All sites weresurveyed during two to twenty one nights just before orafter the rainy season. Sites with less than 3 nights of col-lection were discarded as well as sites with no mosquitorecorded. Species were defined on their morphologicalcharacteristics and sibling species of the An. dirus, An.minimus and An. maculatus complex were not consideredseparately. Similarly species members of the Annularisgroup were mixed together. An. pampanai is also presentin the region but was misidentified to be An. minimus in acouple of sites and thus discarded. Species occurring inless than 4 sites were also discarded. This includes An.argyropus, An. baileyi, An. crawfordi, An. indefinitus, An.lesteri, An. lindesayi, An. pseudojamesi and An. varuna(Table 1). The abundance values were weighted per mannights and recorded using the transformation (log (Abun-dance+1)) [27,28] in order to give less weight to the fewvery abundant species.
Environmental dataFour groups of variables were investigated: (1) XY: Spatialgeographical coordinates of latitude and longitude andtheir second polynomial combinations to evaluate thesignificance of spatial autocorrelation, (2) CT: abiotic fac-tors such as climatic trends and topography from theWorldclim dataset [29] and the CRU CL2.0 dataset [30] aswell as elevation, slope, flow direction, flow accumulationand compound topographic index available from theUSGS digital elevation model, (3) GC: variables derivedfrom land cover GLOBCOVER at a resolution of 300 mderived from Meris satellite annual composite image foryear 2005 and which provides harmonized classes over thethree countries [31], (4) ND: vegetation indices includingthe annual greenness of vegetation (NDVI) as well as wet-ness index for vegetation (NDWI) derived from spotVEGETATION satellite yearly composite images for 2005at 1 km resolution. NDVI and NDWI layers were calcu-lated using software ENVI 4.4 and are based on annualcomposites of daily spot VEGETATION images based onthe mean compositing method [32]. The environmentalvalues were extracted at each site. The minimum, max-imum, mean and standard deviation value over a bufferarea of 3 km around each site was extracted for vegetationindices (ND) using Arcgis 9.3. The proportion of eachland cover classes was also estimated in a buffer or 3 kmaround each site. Landscape indices including fragmenta-tion were extracted using the software FRAGSTATS[4,33]. The GLOBCOVER dataset has some well knownmisidentification of forest zones in the south of Vietnam.The layer was corrected using a mask based on NDVI(<0.5) and NDWI (<0.3) value of spot vegetation annualcomposite for year 2005.
Analytical strategySpecies associations are analyzed using indirect clusteringof species through three major steps: calculation of simi-larities between pair of sites according to species, directclustering of the sites based on those similarities, thenanalysis of the Indicator Value for each species at eachclustering level. Environmental influences are then investi-gated. The general scheme of the analysis is presented inFigure 2.Similarities between pair of sites according to species
are calculated in R software [34] based on Anophelesabundance aggregated per sites using Steinhaus asymmet-ric coefficient [35]. Those similarities are then used forhierarchical clustering of sites with Ward’s minimum vari-ance method [36]. To confirm presence of hierarchicalstructure in the data, we followed suggestion of Dufrêneand Legendre [28] by using the k-means method [37] onthe sites coordinates on the 20 first axis of a Principal Co-ordinates Analysis ordination (PCoA) [38] based on thesimilarity matrix.
Figure 1 Map of the survey sites. Each site has a 4 digit codes corresponding to description in Van Bortel et al. (2008). Background is based onGlobcover (Defourny et al., 2009).
Obsomer et al. Parasites & Vectors 2013, 6:136 Page 3 of 14http://www.parasitesandvectors.com/content/6/1/136
Once sites are classified in clusters, indicator speciescorresponding to the various clusters of the site typologyare identified using the IndVal method [28] (Additionalfile 1). The most representative species is identified foreach cluster of sites and at each level of the cluster tree.The indicator value is calculated independently for eachspecies, thus dealing with differential response to sam-pling. Indicator species are defined as the most character-istic species of each group, found mostly in a single group
and present in the majority of the sites belonging to thatgroup. This index is maximum (= 100%) when all speci-mens of a species are found in a single group of samplesand when the species occurs in all samples of that group.The basic idea is to measure the species indicator valuefor all the levels of a hierarchical typology. The IndValindex allows also identifying species typical for the inter-mediate level of the clustering history. The statistical sig-nificance of the species indicator values is evaluated using
Table 1 MALVECASIA entomological dataset
Taxonomy Code Species Total captured Sites (No.)
Genus Anopheles
Subgenus Anopheles
Anopheles series
Myzorhynchus series
Barbirostris group
barbirostris BARB An. barbirostris 2014 21
campestris CAMP An. campestris 16 4
Hyrcanus group
nimpe NIMP An. nimpe 1787 9
peditaeniatus PEDI An. peditaeniatus 5171 17
sinensis (karyotype) SINE An. sinensis 9324 44
Umbrosus group
umbrosus UMBR An. umbrosus 164 3
Subgenus cellia
Myzomyia serie
Funestus group
aconitus (karyotypes) ACON An. aconitus 10085 38
jeyporiensis (karyotypes) JEYP An. jeyporiensis 7090 24
minimus (complex) MINI An. minimus 24993 32
Neocellia serie
Annularis group ANNU Annularis group 15985 37
annularis
nivipes (complex)
pallidus
philippinensis
Jamesii group
jamesii (karyotypes) JAME An. jamesii 2737 11
splendidus SPLE An. splendidus 1376 25
Maculatus group
maculatus MACU An. maculatus 11459 52
No group
karwari (karyotypes) KARW An. karwari 1263 7
Neomyzomyia serie
Kochi group
kochi KOCH An. kochi 2749 10
Leucosphyrus group
dirus (complex) DIRU An. dirus 8705 29
Tessellatus group
tessellatus TESS An. tessellatus 1543 28
Obsomer et al. Parasites & Vectors 2013, 6:136 Page 4 of 14http://www.parasitesandvectors.com/content/6/1/136
Taxonomic level and mosquito collection information.
Obsomer et al. Parasites & Vectors 2013, 6:136 Page 5 of 14http://www.parasitesandvectors.com/content/6/1/136
a randomization procedure [28]. Associated species arespecies which are indicators of the same cluster of sites.
Environmental influencesSelect useful environmental dataCanonical Correspondence Analysis (CCA) available inthe software canoco 4.5 for windows [39] quantifies anddescribes the relationship of a particular set of variableswith species assemblages [40,41]. CCA has the advantageof being less influenced by noise in species abundance andby inter-correlated environmental variables than othermethods. Relevant variables were then selected using aMonte-Carlo randomization test with 499 steps in an
Figure 2 General scheme of analysis.
initial CCA with all variables and the ones that proved notto be active (p>0.05) were removed from the analysis [40].
Canonical analysis per groups of environmental variablesand variance partitioningThe four groups of variables are analyzed separately toperform variance partitioning [40] and identify whichgroup of factors has an overall influence on the distribu-tion. For each group of variables XY, CT, GC, ND the var-iables were integrated in a stepwise manner into acanonical analysis. The process was continued till a max-imum of 5 variables were integrated and using only signifi-cant variables (Monte Carlo test). The best performingvariables were plotted against the species sample in order
Figure 3 (See legend on next page.)
Obsomer et al. Parasites & Vectors 2013, 6:136 Page 6 of 14http://www.parasitesandvectors.com/content/6/1/136
(See figure on previous page.)Figure 3 Indirect cluster and indicator species. Indirect clustering and indicator species for 6 main groups based on sites similarities in termsof abundance of species. For each group, species showing a significant association (only An. tesselatus in node 1 is not significant) characterizedby an indicator value >20% (in brackets) are listed. The species are displayed in red font when they present the highest indicator value obtainedby that particular species during the analysis. A small map is presented at each node showing distribution of the two separating clusters. A piepresents the proportion of the various land cover calculated as the mean over the sites of the group. The sites included in the group are listedunder the groups (starting with V: Vietnam, C: Cambodia, L: Laos) as well as the season of collection.
Obsomer et al. Parasites & Vectors 2013, 6:136 Page 7 of 14http://www.parasitesandvectors.com/content/6/1/136
to analyze the influence of variables on the occurrence ofthe species.
Environmental justification to clustering of sites basedon speciesThe best performing environmental variables are used toperform a multivariate discriminant canonical analysis insoftware SAS 8.2. This process analyzes which groups canbe differentiated by linear combinations of environmentalvariables. The process identifies the best explanatory vari-ables and a discriminant analysis using those variablesgives an idea of the rate of omission and commission er-rors if sites classification were only based on specific linearcombination of environmental variables.
ResultsIndirect species assemblageFigure 3 presents the clustering of sites using the Wardmethod and subsequent indirect clustering of species.The cluster of sites is first built based on site similaritiesin terms of abundance of species. At each level of separ-ation between groups, the indicator value is calculatedfor each species. Species presenting an indicator valuesignificant and higher than 20% are associated to thegroup of sites (Figure 3). A small map is presented ateach node of a cluster to see spatial distribution of thetwo separating clusters. A pie presents the proportion ofthe various land cover calculated as the mean divided bythe sites of the group.Six groups of sites can be defined with high indicator
value for at least one species. The most ubiquitous speciesseems to be An. tesselatus. This species is indicative of theroot node being associated with no site in particular, butthe result is non significant. The most different group ofsites is Group 6 (first node) with 19 sites characterized bybrackish water including mangrove or shrimp farms inSouth Vietnam and Cambodia. An. epiroticus is very indi-cative of this group (100%) as to a lesser extend An. nimpe(47%) and An. subpictus (21%). Those three species arethus associated. An. subpictus was mostly found in thesites investigated in the first part of the year (season 1).An. maculatus and An. splendidus are indicator species
for the sites not included in Group 6. These species areubiquitous and can thus be found if all subsequentgroups. It is however important to keep in mind thatAn. maculatus is a complex of species and this ubiquity
might be linked to the occurrence of several sibling spe-cies with different environmental requirements. Thisgroup of sites further divides into one group with nospecific species and another group represented by An.sinensis. The An. sinensis branch separates in Group 5characterised by An. sinensis and mostly found inVietnam, and Group 4 with many sites but only foursites which further associate with An. vagus and An.barbirostris. The land cover class post flooding or irri-gated cropland which includes shrimp farms is clearlypresent in Group 6 of An. epiroticus but can be found inGroup 5 of An. sinensis.The rest of the sites which separated at node 2 provide
Group 3 with only An. dirus as indicator species, sug-gesting no species association. An. dirus is also an indicatorfor higher hierarchical level (node 2) but reach its max-imum for the group 3, which seems to be thus the typicaltype of sites for the species, at least in the second part ofthe year (season 2). A larger proportion of closed evergreenand closed to open deciduous evergreen forest characterizethese sites located in Central Vietnam. An. minimus pre-sents the highest indicator value for the rest of the sites.Those sites further separate in Group 1 characterized bythe presence of An. jamesi and Group 2 where a largegroup of species are indicators. Those species include An.peditaeniatus, An. annularis, An. aconitus, An. kochi, An.jeyporiensis and An. umbrosus. No particular land covercould be associated with those species.
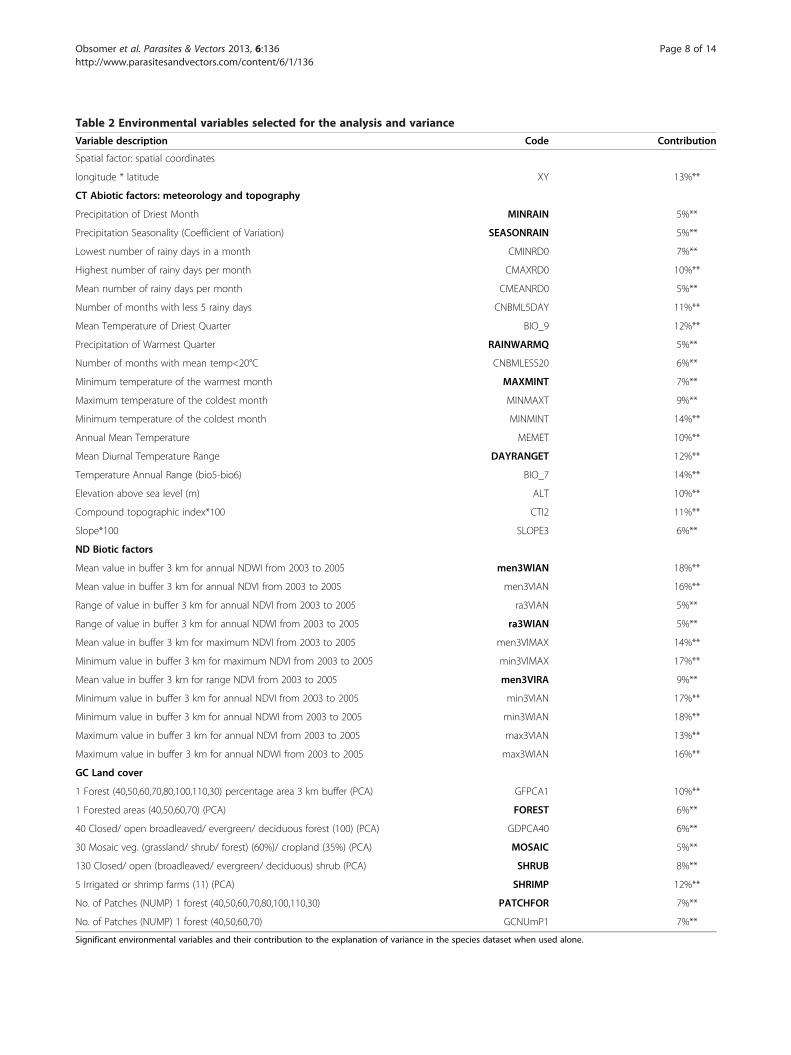
Environmental influenceSpecies and environmental variablesHighly significant variables (Monte Carlo permutationtest) explaining 5% or more of the variance are presentedin Table 2. The ND greenness indices and GC land covergroups of variables perform well by explaining more than45% of the variance each alone but with only 3 variablesfor the ND group against 5 variables for the GC group.The interaction between the two groups of variables isaround 24%. The best performing variables were used tobuild a final graph (Figure 4). An. epiroticus, An. nimpeand An. subpictus seemed to be characterised by thepresence of a shrimp farm (SHRIMP) and fragmentedlandscape (ra3WIAN). There is a clear opposition withAn. dirus characterized by high dense forest (FOREST)and a high level of vegetation wetness index (men3WIAN). Mosaic vegetation and crop (MOSAIC) explain
Table 2 Environmental variables selected for the analysis and variance
Variable description Code Contribution
Spatial factor: spatial coordinates
longitude * latitude XY 13%**
CT Abiotic factors: meteorology and topography
Precipitation of Driest Month MINRAIN 5%**
Precipitation Seasonality (Coefficient of Variation) SEASONRAIN 5%**
Lowest number of rainy days in a month CMINRD0 7%**
Highest number of rainy days per month CMAXRD0 10%**
Mean number of rainy days per month CMEANRD0 5%**
Number of months with less 5 rainy days CNBML5DAY 11%**
Mean Temperature of Driest Quarter BIO_9 12%**
Precipitation of Warmest Quarter RAINWARMQ 5%**
Number of months with mean temp<20°C CNBMLESS20 6%**
Minimum temperature of the warmest month MAXMINT 7%**
Maximum temperature of the coldest month MINMAXT 9%**
Minimum temperature of the coldest month MINMINT 14%**
Annual Mean Temperature MEMET 10%**
Mean Diurnal Temperature Range DAYRANGET 12%**
Temperature Annual Range (bio5-bio6) BIO_7 14%**
Elevation above sea level (m) ALT 10%**
Compound topographic index*100 CTI2 11%**
Slope*100 SLOPE3 6%**
ND Biotic factors
Mean value in buffer 3 km for annual NDWI from 2003 to 2005 men3WIAN 18%**
Mean value in buffer 3 km for annual NDVI from 2003 to 2005 men3VIAN 16%**
Range of value in buffer 3 km for annual NDVI from 2003 to 2005 ra3VIAN 5%**
Range of value in buffer 3 km for annual NDWI from 2003 to 2005 ra3WIAN 5%**
Mean value in buffer 3 km for maximum NDVI from 2003 to 2005 men3VIMAX 14%**
Minimum value in buffer 3 km for maximum NDVI from 2003 to 2005 min3VIMAX 17%**
Mean value in buffer 3 km for range NDVI from 2003 to 2005 men3VIRA 9%**
Minimum value in buffer 3 km for annual NDVI from 2003 to 2005 min3VIAN 17%**
Minimum value in buffer 3 km for annual NDWI from 2003 to 2005 min3WIAN 18%**
Maximum value in buffer 3 km for annual NDVI from 2003 to 2005 max3VIAN 13%**
Maximum value in buffer 3 km for annual NDWI from 2003 to 2005 max3WIAN 16%**
GC Land cover
1 Forest (40,50,60,70,80,100,110,30) percentage area 3 km buffer (PCA) GFPCA1 10%**
130 Closed/ open (broadleaved/ evergreen/ deciduous) shrub (PCA) SHRUB 8%**
5 Irrigated or shrimp farms (11) (PCA) SHRIMP 12%**
No. of Patches (NUMP) 1 forest (40,50,60,70,80,100,110,30) PATCHFOR 7%**
No. of Patches (NUMP) 1 forest (40,50,60,70) GCNUmP1 7%**
Significant environmental variables and their contribution to the explanation of variance in the species dataset when used alone.
Obsomer et al. Parasites & Vectors 2013, 6:136 Page 8 of 14http://www.parasitesandvectors.com/content/6/1/136
Figure 4 Canonical analysis. Bi plot based on canonical analysis for selected environmental variables. Mosquito species are presented in uppercases code of 4 letters with ACON: An. aconitus, ANNU: An. annularis, BARB: An. barbirostris, CAMP: An. campestris, DIRU: An. dirus s.l., EPIR: An.epiroticus, JAME: An. jamesi, JEYP: An. jeyporiensis, KARW: An. karwari, KOCH: An. kochi, MACU: An. maculatus, MINI: An. minimus s.l., PEDI: An.peditaeniatus, SPLE: An. splendidus, TESS:An. tesselatus, SINE: An. sinensis, SUBP: An. subpictus, UMBR: An. umbrosus, VAGU: An. vagus. Environmentalvariables are surrounded by rectangles and abbreviations are as follow: MOSAIC: Mosaic vegetation and crop, FOREST: Dense forest, ra3WIAN:Range of variation of wetness index in 3-km buffer, SHRIMP: Shrimp farms, DAYRANGET: Temperature range, men3WIAN: Mean annual wetnessindex in 3-km buffer, men3VIRA: Yearly vegetation greenness variation (season).
Obsomer et al. Parasites & Vectors 2013, 6:136 Page 9 of 14http://www.parasitesandvectors.com/content/6/1/136
another dimension and seems more associated with An.minimus and An. jamesi.
Environmental justification to clustering of sites based onspeciesThe best explanatory variables were filtered in a stepwiseprocedure. A discriminant canonical analysis then usedlinear combinations of the original environmental varia-bles standardised to predict belonging to the six groups ofsites previously defined by indirect clustering and indica-tor species (Table 3). Four groups out of 6 are well charac-terized by environmental factors with more than 80% ofthe sites attributed to the correct group.The An. peditaeniatus group 2 is reasonably well classi-
fied (85%). Numerous species are indicative of this group.A high value of wetness index (mean3wian) and tem-perature range (DAYRANGET) characterize this group aswell as negative correlation with dense forest (FOREST)and forest mosaic (SHRUB). The An. dirus group 3 is wellcharacterized (91%) with positive correlation with meanannual wetness vegetation index (men3WIAN), number offorest patch (PATCHFOR) and presence of dense forest
(FOREST) and negative correlation with most of theother factors. Group 5 is characterized by An. sinensisand correlated with a high value of rainfall in the warmquarter (RAINWARMQ) and low temperature range(DAYRANGET). An. epiroticus group 6 show a strongnegative correlation with annual wetness index (men3wian)but the expected correlation with percentage of shrimpfarm surface (SHRIMP) is quite low while still being higherthan for other groups. Quantitative parameter derived fromremote sensing vegetation index such as the annual wet-ness index seem to provide the best tools for discrimin-ation between the well characterized groups.
DiscussionSix species assemblages could be defined in this study outof which four could also be significantly characterized by adifferent environment. Comparison between indirect anddirect clustering method, shows that indirect analysisbetter handled widespread species like An. tessalatus andAn. splendidus (Figure 5). An. maculatus is found in 52sites out of 88 sites and can be considered as a widespreadspecies. It is important however to keep in mind that
Table 3 Environmental influence for species clusters
Wellclassifiedsites Misclassified sites
Linear discriminant function for proposed cluster of sites
Indicatorspecies and
groups definedusing clustering &
indval Group 1 Group 2 Group 3 Group 4 Group 5 Group 6
Group 2 An. peditaeniatus 4.15 -1.28 0.34 -2.35 -2.58 0.16 0.10 0.20
Group 3 An. dirus 5.52 -1.56 -0.75 1.02 0.47 -1.76 1.85 -0.08
Group 4 An. vagus 5.09 -0.40 -0.77 -0.75 -0.66 -1.03 0.70 -0.19
Group 5 An. sinensis 0.61 0.72 -0.03 0.06 0.69 0.24 -0.55 -0.25
Group 6 An. epiroticus -13.75 2.13 1.92 1.52 0.51 1.83 -2.10 0.48
For each of the six group defined by species/sites indirect clustering, the most indicative species is indicated under the group. The percentage (number of sites) correctly classified by the environmental analysis isprovided as well as the number and name of misclassified sites and groups in which they were placed. The coefficients of the linear discriminant function are provided for each environmental factor and each group.
Obsom
eret
al.Parasites&Vectors
2013,6:136Page
10of
14http://w
ww.parasitesandvectors.com
/content/6/1/136
epiroticus
maculatus
aconitus
minimus
tesselatussinensis
peditaeniatus
barbirostris
dirusjamesiumbrusus
subpictuscampestris vagus
kochijeyporiensis
splendidus
epiroticus
maculatus
aconitus
minimus
tesselatus
sinensis
peditaeniatus
barbirostris
dirus
jamesi
karwariumbrusus
vagus
kochijeyporiensis
splendidus
annularis
annularis
nimpe
nimpesubpictus
Direct
Indirect
Figure 5 Comparing direct and indirect species assemblage based on Ward clustering method. Both methods are based on asymmetricalsimilarity coefficient. Indirect method is based on ward clustering of sites according to species and analysis of indicative value for each species ateach node (see Figure 3). Direct clustering groups species according to log abundance in sites.
Obsomer et al. Parasites & Vectors 2013, 6:136 Page 11 of 14http://www.parasitesandvectors.com/content/6/1/136
An. maculatus is a complex of sibling species. If the ana-lysis brings some light in the association between species,the main vector An. dirus s.s. is unfortunately not associ-ated with any species and presence of another species can-not be used as an indication of potential presence of thiselusive species. Unfortunately, An. minimus is also notstrongly associated to other species and An. sundaicus isthe most indicative species of a group of sites. This lastspecies can be associated to An. nimpe and An. subpictus.However the habitat of An. sundaicus is already wellcharacterised and there is no need for an additional indi-cator of presence for this species. The results are thus notoptimal for operational use.The methodology developed here addresses the major is-
sues linked to analysis of adult Anopheles species associa-tions. First, abundance is log transformed to smooth thedifferences in abundances potentially linked to differentialresponse to sampling while avoiding losing too much infor-mation. Second, asymmetrical similarity coefficients areused to give less weight to absence and discard double ab-sence [27]. Third, the indirect cluster analysis methodIndVal [28] deals elegantly with widespread species, whichare generally difficult to identify in direct clustering ana-lysis and generally placed with one or another specializedgroup or considered as outliers. Indval seems to be a good
alternative to the more widely used Twinspan method [42],which compares relative abundance between species andmight thus produce misleading results. Here species areevaluated independently from each other. While seldomused in the field of mosquito related research the Indvalindex is increasingly used in the field of ecology and manytools are available freely online for the user (R project li-brary labdsv). In the field of vegetation sciences, a similarindex is used called the phi coefficient of association andderived from the Pearson correlation [43,44]. Recently DeCaceres and colleague [45] compared IndVal with the phicoefficient and conclude that the correlation coefficient ismore suited to determine species ecological preferencesamongst groups of sites but indicator values are the mostadapted to determine species assemblages.Four groups could be discriminated using environmental
information, including groups associated with An. dirus,An. pediaeniatus, An. sinensis and An. epiroticus. Anoph-eles of the region are very diverse and have different bio-nomics [46], some of which are directly influenced by theenvironment. Vegetation indices derived from satellite im-agery seem to pick up some of these influences and thismight offer the opportunity to work with more accurate in-formation in time. Indeed, preliminary analysis (not shownhere) used three detailed national land cover dataset (one
Obsomer et al. Parasites & Vectors 2013, 6:136 Page 12 of 14http://www.parasitesandvectors.com/content/6/1/136
per country) but information was not available for thesame year or with the same legend for all the countriesmaking regional analysis difficult and the analysis did notshow significant results. The GLOBCOVER product [47]with a 300 m resolution used in this analysis seems to besufficient to bring the necessary information for the ana-lysis and has the advantage of being consistent over thethree countries. While potential for regular updates willprobably provide up to date information in the future [48],currently, only vegetation indices can give timely informa-tion. The greenness indices performed remarkably well inthe analysis with the wetness index (NDWI) and the green-ness index (NDVI) explaining alone 18% and 16% of thevariance (Table 2). Those indices are increasingly availablefreely and on a regular basis for every square kilometre oreven finer scale over the globe. The fact that they can ex-plain a larger part of the variance than land cover based in-dices is of interest because contrarily to greenness indices,land cover layers are time consuming to produce and inte-grate errors due to the classification of numerical reflect-ance values into classes of land cover. The final user hashowever to keep in mind that quality of those indicesmight vary according to the source imagery or the process-ing chain [49]. Using greenness indices might thus be agood option for operational surveillance of environmentalchanges.
Seasonal influence and sampling strategiesThe sampling design adapted for monitoring purposes isnot optimal for exploring biodiversity issues, but is, how-ever, the only type of data available on a wide region as itwould be impossible to survey all these villages in thesame time. This is of importance because the compositionof a mosquito population can vary greatly from one weekto another according to the rain history. Sites were se-lected according to two criteria: location in area of malariatransmission and abundance of known or suspected vec-tors. Indeed, in the dry season, very few mosquitoes areencountered, and in the middle of the rainy season, it isoften impossible to reach villages, particularly in forestedzones. The assessment of the sampling exhaustivity of thedataset is difficult to estimate in such a wide region andtargeting so many species. Indeed the number of speciespresent depends of the type of ecosystem. In some placessampling during three weeks would gather only onespecies and in other places this would depend of the rainoccurrence two weeks before. Surveys were more numer-ous in Vietnam which have greater technical capabilities,more teams and experience and which routinely carry outfield surveys.
ConclusionsIn an attempt to reconcile research and application thisarticle presents a different approach: using the abundant
entomological data made available through monitoringprograms and available environmental information to ex-tract valuable knowledge for malaria control staff in thefield. To compensate for the lack of standardization in theentomological dataset, the study characterized not onlyfew species but species association and their relation tothe environment.The study managed to get around the imperfection inher-
ent to the entomological dataset by using an adaptedmethod based on association and freely available up-to-dateproducts derived from remote sensing techniques. Slightmodification in the collection of monitoring data couldgreatly improve the analysis. The results are limited by howrepresentative the sampling design has been but it is diffi-cult to decide a minimum number of necessary collectiondays to capture the whole diversity when working with verydiverse collection sites [50]. If transversal study could bringthe best information on seasonal variation, surveying eachsite once before and once after the rainy season could helpto have a first idea of influence of the season. The indicatorvalue presented in this study could bring information ofinterest to the entomologist. Building the same method-ology on a more standardized dataset collected accordingto the season could help characterize sites and season asso-ciated to vector species and better focus malaria control ef-fort on specific habitat. The results have predictive poweronly for sites with a habitat similar to those used to find theindicator species [51]. In our case, only suspected malariousareas were surveyed and no information is thus available inother regions of the country. In a region with such a fast-changing environment it would be useful to investigate atleast a few sites in each ecological habitat.Identified indicator species should be further investi-
gated using independent dataset for confirmation of indi-cator species such as developed in Mc Geoch [52]. Whilethe use of indicator value is here useful to investigate asso-ciations between mosquito species, adult mosquitoes suchas studied here are probably not the best bio-indicatorsfor particular sites or to predict environmental changes,and this is particularly because of the difficulties linked tosampling and micro-variation in population due to rainhistory in the previous days.
Additional file
Additional file 1: Technical summary of IndVal method. Shortdescription and equations for calculation of IndVal indicator value.
AbbreviationsAn: Anopheles; CCA: Canonical Correspondence Analysis; CRU: ClimateResearch Unit; CT: Abiotic factors (climatic trends and topography);DAYRANGET: Temperature range; DEM: Digital elevation model;DYNMAP: Dynamic Mapping project; FOREST: Dense forest; GC: Variablesderived from land cover GLOBCOVER; GIS: Geographical Information System;INDVAL: Indicator Value method; MALVECASIA: Malaria vector insecticideresistance project SEA; Maxmint: Highest minimal monthly temperature;
Obsomer et al. Parasites & Vectors 2013, 6:136 Page 13 of 14http://www.parasitesandvectors.com/content/6/1/136
men3VIRA: Yearly vegetation greenness variation (season); men3WIAN: Meanannual wetness index in 3-km buffer; MERIS: Medium Resolution ImagingSpectrometer; MINRAIN: Minimum rain; MOSAIC: Mosaic vegetation and crop;ND: Vegetation indices; NDVI: Normalized Difference Vegetation Index;NDWI: Normalized Difference Water Index; PATCHFOR: Number of forestpatches; PCoA: Principal Coordinates Analysis ordination; ra3WIAN: Range ofvariation of wetness index in 3-km buffer; RAINWARMQ: Precipitation of thewarmest quarter; s.l.: sensu lato; s.s.: sensu stricto; SEAGIS: Pilot GIS for malariain SEA; SEASONRAIN: Rainfall pattern; SHRIMP: Shrimp farms; SHRUB: Mosaicshrub land evergreen; SPOT: Systeme Probatoire pour l’Observation de laTerre; UPGMA: Unweighted Pair Group Method Arithmetic Mean; USGS: USGeological Survey; XY: Spatial geographical coordinates.
Competing interestsThe authors declare that they have no competing interests.
Authors’ contributionsVO conceived the study, performed the statistical analysis and drafted themanuscript, MD made substantial contributions to conception and design ofthe methodology as well as results interpretation, PD participated in thedesign of the study and results interpretation, MC participated in the designof the study, analysis and interpretation of the results and supervised thework at all stage. All authors revised, read and approved the final manuscript
AcknowledgementsThe authors thank the staff of the malaria national control program andparticularly the members of the MALVECASIA network which provided freshinformation on the distribution of Anopheles in the Southeast Asian region.Those include Dr Trung and Dr Thuan from the National Institute ofMalariology, Parasitology and Entomology of Vietnam (NIMPE), Dr Tho andDr Socheat from the National Centre for Malaria Control, Parasitology andEntomology of Cambodia (CNM), Dr Kalounna, Dr Bouasy and Dr Samlanefrom the Centre of Malariology, Parasitology and Entomology of Laos (IMPE)and Dr Visut Baimai from the Mahidol University (MU) of Thailand and RalphHarbach and Yvonne Linton from the Natural History Museum of London(NHM). This work was funded by the Belgian Sciences Policy Office (BELSPO)through the DYNMAP project and by the European Union through theMALVECASIA project (IC4-CT-2002-10041) in the framework of the INCODEVprogram (ERBIC18.CT.970211). The funders had no role in study design, datacollection and analysis, decision to publish, or preparation of the manuscript.
Author details1Department of Parasitology, Prince Leopold Institute of Tropical Medicine,Nationalestraat 155, Antwerp 2000, Belgium. 2Earth and Life Institute,Environmental Sciences, Université Catholique de Louvain, Croix du Sud 2/16, Louvain-la-Neuve B-1348, Belgium. 3Biodiversity and landscapedepartment, Gembloux Agro-BioTech, University of Liège, passage desdéportés, 2, Gembloux B-5030, Belgium.
Received: 22 January 2013 Accepted: 1 May 2013Published: 4 May 2013
References1. Trung HD, Van Bortel W, Sochantha T, Keokenchanh K, Briet O, Coosemans
M: Behavioural heterogeneity of Anopheles species in ecologicallydifferent localities in South Asia: a challenge for vector control. Trop MedInt Health 2005, 10:251–262.
2. Trung HD, Van Bortel W, Sochantha T, Keokenchanh K, Quang N, Cong L,Coosemans M: Malaria transmission and major malaria vectors indifferent geographical areas of Southeast Asia. Trop Med Int Health 2004,9:230–237.
3. Vanwambeke SO, Somboon P, Harbach RH, Isenstadt M, Lambin EF, WaltonC, Butlin RK: Landscape and land cover factors influence the presence ofAedes and Anopheles larvae. J Med Entomol 2007, 144:133–144.
4. Overgaard H, Ekbom B, Suwonkerd W, Takagi M: Effect of landscapestructure on anopheline mosquito density and diversity in northernThailand: Implications for malaria transmission and control. LandscapeEcol 2003, 18(6):605–619.
Obsomer V, Coosemans M: The insecticide resistance status of malariavectors in the Mekong region. Malar J 2008, l:7.
6. Rosenberg R, Maheswary N: Forest malaria in Bangladesh. II. Transmissionby Anopheles dirus. A J Trop Med Hyg 1982, 31:183–191.
7. Whittaker R: Classification of natural communities. Bot Rev 1962, 28:1–239.8. Fager E, McGowan J: Zooplankton species groups in north pacific.
Sciences 1963, 140:453–460.9. Cole LC: Measurement of interspecific association. Ecology 1949, 30:411–424.10. Service MW: The taxonomy and biology of two sympatric sibling species
of Culex, C.pipiens and C. torrentium (Diptera: Culicidae). J Zool Lond 1968,156:313–323.
11. Yadav RS, Sharma VP, Chand SK: Mosquito breeding and resting in tree-holes in a forest ecosystem in Orissa. Indian J Malariol 1997, 34:8–16.
12. Reisen WK, Siddiqui TF, Aslamkhan M, Malik GM: Larval interspecificassociations and physico-chemical relationships of ground-waterbreeding mosquitoes of Lahore. Pak J Sci Res 1981, 3:1–23.
13. Hurlbert SH: A coefficient of interspecific association. Ecology 1969, 50:1–9.14. Lounibos LP: Habitat segregation among African treehole mosquitoes.
Ecol Entomol 1981, 6:129–154.15. Suwonkerd W, Tsuda Y, Takagi M, Wada Y: Seasonal occurrence of Aedes
aegypti and Aedes albopictus in used tires in 1992–1994, Chiangmai.Thailand. Trop Med (Nagasaki) 1996, 38:101–105.
16. Bhatt RN, Sharma RC, Srivastava HC, Gautam AS, Gupta DK: Interspecificassociations among anophelines in different breeding habitats of Khebadistrict Gujarat: part II – non-canal area. Indian J Malariol 1993, 30:91–100.
17. Kant R, Pandsey SD, Sharma SK, Sharma VP: Species diversity andinterspecific associations among mosquitoes in rice agro-ecosystem ofKheda district, Gujarat. Indian J Malariol 1998, 35:22–30.
18. Kant R, Pandey SD: Breeeding preferences of Anopheles culicifacies in therice agro-ecosystem in Kheda District, Gujarat. Indian J Malariol 1999,365:53–60.
19. Bradshaw WE, Holzapfel CM: Predator-mediated, non-equilibrium co-existence of tree-hole mosquitoes on southeastern North America.Oecologia (Berl.) 1983, 57:239–256.
20. May RM: Patterns of species abundance and diversity. In Ecology andEvolution of Communities. Edited by Cody ML, Diamond JM. Cambridge,Massachusetts: Belknap Press of Harvard University Press; 1975:81–120.
21. McNaughton SJ: Relationship among functional properties of Californiagrassland. Nature 1967, 216:168–169.
22. Lee D-K: Effect of two rice culture methods on the seasonal occurrenceof mosquito larvae and other aquatic animals in rice fields ofsouthwestern Korea. J Vector Ecol 1998, 23:161–170.
23. Southwood TRE: Ecological Methods with particular reference to the study ofinsect populations. London: Chapman & Hall; 1978.
24. Campos RE, Fernandez LA, Sy VE: Study of the insects associated with thefloodwater mosquito Ochlerotatus albifasciatus (Diptera: Culicidae) andtheir possible predators in Buenos Aires Province, Argentina.Hydrobiologia 2004, 524:91–102.
25. Rattanarithikul R, Green C, Panyim S, Noigamol C, Chanaimongkol S,Mahapibu P: Larval habitats of malaria vectors and other Anophelesmosquitoes around a transmission focus in north-western Thailand.JAMA 1995, 11:428–433.
27. Legendre P, Legendre L: Numerical Ecology. Developments in EnvironmentalModelling, 2.0. Second edition. Amsterdam: Elsevier; 1998.
28. Dufrêne M, Legendre P: Species assemblages and indicator species: theneed for a flexible asymmetrical approach. Ecol Monogr 1997, 67:345–366.
29. Hijmans R, Cameron S, Parra J, Jones J, Jarvis A: Very high resolutioninterpolated climate surfaces for global land areas. Int J Climatol 2005,25:1965–1978.
30. New M, Lister D, Hulme M, Makin I: A high-resolution data set of surfaceclimate over global land areas. Clim Res 2002, 21:1–25.
31. Bicheron P, Leroy M, Brockmann C, Krämer U, Miras B, Huc M, Ninõ F,Defourny P, Vancutsem C, Arino O, Ranéra F, Petit D, Amberg V, Berthelot B,Gross D: GLOBCOVER: a 300m global land cover product for 2005 usingENVISAT/MERIS time series. In Proceedings of the Recent Advances inQuantitative Remote Sensing Symposium: 25–29 September 2006. Valencia.Edited by Sobrino JA. Valencia: Universitat de Valencia; 2006:538–542.
32. Vancutsem C, Pekel JF, Bogaert P, Defourny P: Mean Compositing, analternative strategy for producing temporal syntheses. Concepts and
Obsomer et al. Parasites & Vectors 2013, 6:136 Page 14 of 14http://www.parasitesandvectors.com/content/6/1/136
performance assessment for SPOT VEGETATION time series. Int J RemoteSens 2008, 28(22):5123–5141.
33. McGarigal K, Marks B: FRAGSTATS: Spatial pattern analysis for quantifyinglandscape structure. General Technical Report PNW-GTR-351. US Departmentof Agriculture Forest Service: Portland; 1995.
34. R Development Core Team: R: A Language and Environment for StatisticalComputing, Manual from the R Foundation for Statistical Computing. Vienna:R Foundation for Statistical Computing; 2009.
35. Motyka J: O zadaniach I metodach badan geobotanicznych. Sur les buts et lesméthodes des recherches géobotaniques. Lublin: Nakladem universytftu MariiCurie-Sklodowskiej; 1947.
36. Ward JH: Hierarchical grouping to optimize an objective function. J AmerStat Assoc 1963, 58:236–244.
37. Jain A, Dubes R: Algorithms for clustering data. Englewood Cliffs: PrenticeHall PTR; 1988.
38. Gower J: Some distance properties of latent root and vector methodsused in multivariate analysis. Biometrika 1966, 53:325–338.
39. Ter Braak C: CANOCO. A FORTRAN program for canonical correspondenceanalysis and detrended correspondence analysis. Innovatie WetenschappelijkeInformatievoorziening IWI-TNO: Wageningen; 1985.
40. Du Bus de Warnaffe G, Dufrêne M: To what extent can managementvariables explain species assemblages? A study of carabid beetles inforests. Ecography 2004, 27:701–714.
41. Titeux N: Modelling species distribution when habitat occupancy departs fromsuitability – Application to birds in a landscape context. Louvain-la-Neuve,Belgium: PhD thesis. Université catholique de Louvain, Earth and LifeInstitute; 2006.
42. Hill MO: TWINSPAN - a FORTRAN program for arranging multivariate data inan ordered two-way table by classification of the individuals and attributes.New York: Section of Ecology and Systematics in Cornell University; 1979.
43. Bruelheide H: A new measure of fidelity and its application to definingspecies groups. J V Sci 2000, 11:167–178.
44. Tichy L, Chytry M: Statistical determination of diagnostic species for sitegroups of unequal size. J V Sci 2006, 17:809–818.
45. De Cáceres M, Legendre P: Associations between species and groups ofsites: indices and statistical inference. Ecology 2009, 90(12):3566–3574.
46. Sinka ME, Bangs MJ, Manguin S, Chareonviriyaphap T, Patil AP, TemperleyWH, Gething PW, Elyazar IRF, Kabaria CW, Harbach RE, Hay SI: Thedominant Anopheles vectors of human malaria in the Asia-Pacificregion: occurrence data, distribution maps and bionomic précis.Parasit Vectors 2011, 4:89.
47. Defourny P, Mayaux P, Herold M, Bontemps S: Global Land-Cover MapValidation Experiences : Toward the Characterization of QuantitativeUncertainty. In Remote Sensing of Land Use and Land Cover: Principles andApplications. Edited by Giri CP. Sioux Falls: CRC Press; 2012:207–223.
48. Bontemps S, Arino O, Bicheron P, Carsten B, Leroy M, Vancutsem C,Defourny P: Operational Service Demonstration for Global Land-CoverMapping: The GlobCover and GlobCorine Experiences for 2005 and2009. In Remote Sensing of Land Use and Land Cover: Principles andApplications. Edited by Giri CP. Sioux Falls: CRC Press; 2012:243–264.
49. Zhang Z, Ward M, Gao J, Wang Z, Yao B, Zhang T, Jiang Q: Remote sensingand diseases control in China: past, present and future. Parasit Vectors2013, 6:11.
50. Hill DA, Fasham M, Tucker G, Shewry M, Shaw P: Handbook of BiodiversityMethods - Survey, Evaluation and Monitoring. Cambridge: CambridgeUniversity Press; 2005.
51. MacKenzie DI, Nichols JD, Royle JA, Pollock KH, Hines JE, Bailey LL:Occupancy estimation and modeling: inferring patterns and dynamics ofspecies occurrence. San Diego: Elsevier; 2005.
52. Mc Geoch MA, Van Rensburg BJ, Botes A: The verification and applicationof bioindicators: a case study of dung beetles in a savanna ecosystem.J Appl Ecol 2002, 39:661–672.
doi:10.1186/1756-3305-6-136Cite this article as: Obsomer et al.: Anopheles species associations inSoutheast Asia: indicator species and environmental influences. Parasites& Vectors 2013 6:136.
Submit your next manuscript to BioMed Centraland take full advantage of:
• Convenient online submission
• Thorough peer review
• No space constraints or color figure charges
• Immediate publication on acceptance
• Inclusion in PubMed, CAS, Scopus and Google Scholar
• Research which is freely available for redistribution
Submit your manuscript at www.biomedcentral.com/submit


![Anopheles (Diptera: Culicidae), forest malaria vectors, in ... · complex [19] with Anopheles leucosphyrus Dönitz, 1901, Anopheles latens Sallum and Peyton, 2005, and Anopheles introlatus](https://static.documents.pub/doc/80x56/5d52cc0d88c993073e8b8565/anopheles-diptera-culicidae-forest-malaria-vectors-in-complex-19.jpg)


