On the dosimetric impact of inhomogeneitymanagement in the Acuros XB algorithm forbreast treatmentAntonella Fogliata*, Giorgia Nicolini, Alessandro Clivio, Eugenio Vanetti and Luca Cozzi
Abstract
Background: A new algorithm for photon dose calculation, Acuros XB, has been recently introduced in theEclipse, Varian treatment planning system, allowing, similarly to the classic Monte Carlo methods, for accuratemodelling of dose deposition in media. Aim of the present study was the assessment of its behaviour in clinicalcases.
Methods: Datasets from ten breast patients scanned under different breathing conditions (free breathing anddeep inspiration) were used to calculate dose plans using the simple two tangential field setting, with Acuros XB(in its versions 10 and 11) and the Anisotropic Analytical Algorithm (AAA) for a 6MV beam. Acuros XB calculationswere performed as dose-to-medium distributions. This feature was investigated to appraise the capability of thealgorithm to distinguish between different elemental compositions in the human body: lobular vs. adipose tissuein the breast, lower (deep inspiration condition) vs. higher (free breathing condition) densities in the lung.
Results: The analysis of the two breast structures presenting densities compatible with muscle and with adiposetissue showed an average difference in dose calculation between Acuros XB and AAA of 1.6%, with AAA predictinghigher dose than Acuros XB, for the muscle tissue (the lobular breast); while the difference for adipose tissue wasnegligible. From histograms of the dose difference plans between AAA and Acuros XB (version 10), the dose of thelung portion inside the tangential fields presented an average difference of 0.5% in the free breathing conditions,increasing to 1.5% for the deep inspiration cases, with AAA predicting higher doses than Acuros XB. In lung tissuesignificant differences are found also between Acuros XB version 10 and 11 for lower density lung.
Conclusions: Acuros XB, differently from AAA, is capable to distinguish between the different elementalcompositions of the body, and suggests the possibility to further improve the accuracy of the dose planscomputed for actual treatment of patients.
Keywords: Acuros, AAA, breast, inhomogeneity correction, tissue density
BackgroundRadiotherapy in the management of early stage breastcancer after surgery contributes to a fundamental reduc-tion of the risk of local relapse. From the dosimetricpoint of view, the task of generating treatment plans ofhigh quality is challenged by the complex anatomy ofthe thoracic district due to the neighbourhood of tissuesof highly different density, composition and homogene-ity, especially the lungs with a density much lower than
the surrounding soft tissues. Taking benefit from geo-metrical features, it has been proven [1,2] that for breasttreatment, the usage of specific respiratory gatingphases, namely deep inspiration, might be dosimetricallybeneficial. This because of the increased separationbetween the heart and the chest wall which is maxi-mized in that respiratory phase [1]. A second benefitderived from the remarkable reduction of the density ofthe lung parenchyma, a fact that correlates to additionaldose reduction [3,4]. To assess the benefit from the sec-ond feature, it is necessary to perform dose calculationswith accurate algorithms, capable to properly model
* Correspondence: [email protected] Institute of Southern Switzerland, Medical Physics Unit, Bellinzona,Switzerland
Fogliata et al. Radiation Oncology 2011, 6:103http://www.ro-journal.com/content/6/1/103
radiation transport in all media. It is nevertheless a factthat most of the photon dose calculation engines have amore or less limited accuracy in predicting dose in lowdensity media than in higher density tissues [5-7], espe-cially those algorithms that use heavy approximations inmodelling the lateral electron transport (e.g. convolu-tion/superposition methods).To improve dose calculation in heterogeneous tissues,
some algorithms implement the possibility to accountfor the specific elemental composition of the humanbody. This is typically realised by associating the Houns-field Units from the CT scans to a mass density andmaterial derived from customised and simplified conver-sion tables where, for predefined density ranges, specificelemental composition are assigned. In general the com-position is taken from data repositories based on generalconsensus as, for example, the ICRP Report 23 [8].Algorithms capable to incorporate tissue composition inthe dose calculation mechanisms have an increasedaccuracy in determining the dose to each specific organ[9,10]. In the case of breast treatments, beside the needof properly modelling the lung tissue (with complexcomposition and very low density at the same timewhen deep inspiration breathing is considered), alsoinhomogeneities in the region of the target volumeshould be carefully modelled since the mammary glandhas a quite complex structure as well.Aim of the present study is the assessment of the
dosimetric impact of a new dose calculation algorithmon datasets from a cohort of real patients where a vari-ety of different breast tissue densities and lung air fillingare in place.The new algorithm under investigation is the Acuros®
XB Advanced Dose Calculation (Acuros XB) as it isimplemented in the Eclipse treatment planning system(Varian Medical Systems, Palo Alto, USA). This algo-rithm belongs to the class of the Linear BoltzmannTransport Equation (LBTE) solvers, allowing, similarlyto the classic Monte Carlo methods, for accurate model-ling of dose deposition in heterogeneous media [11-13].In the study, calculations performed with Acuros XB areevaluated against the well known and validated Aniso-tropic Analytical Algorithm (AAA) similarly implemen-ted in the Eclipse planning system [14-16].
MethodsA. Patient selection and planning techniquesCT data from 10 patients presenting left side breast car-cinoma were selected for the study. For all patients twoscanning acquisition sets were available: the first leavingthe patient to normally breath (free breathing, FB), thesecond obtained by scanning patients under maximuminhale and breath hold condition during the whole CTacquisition (deep inspiration breath hold, DIBH). Gating
and breath tracking during scanning were determinedby means of the Respiratory Gating RPM system (VarianMedical System, Palo Alto, CA); adjacent slices with 5mm thickness were acquired on a 16 slices scanner withan acquisition time of the entire thorax region of about8 seconds.Both CT datasets were contoured, for each patient,
with planning target volume (PTV), left and right lungs,heart, and contra lateral breast. PTV on the two CTswere carefully drawn considering anatomical landmarks;each pair of PTV volumes differed less than 5%.Dose plans were computed for conventional conformal
techniques based on two tangential fields (average fieldsize of 18.9 ± 0.8 cm in the longitudinal direction and11.1 ± 1.6 cm in the transversal direction) using 6MVbeams from a Varian Clinac equipped with a standard80-leaf MLC; dynamic wedges (EDW) were used when-ever needed. As a common strategy, a first plan, forwardoptimized with trial and error procedure, was obtainedfor the DIBH cases, and a second plan with the samebeam characteristics of gantry angles and wedges wascomputed for each corresponding FB CT (adjustingMLC shapes and beam weights if needed).Dose prescription was set to 50 Gy at 2 Gy/fraction,
to the mean target dose.
B. Dose calculation algorithmsAll plans (in number of two plans per each patient, forFB and DIBH CT acquisitions respectively) were com-puted with the following dose calculation algorithms, allimplemented in the platform version 10 of the Eclipsetreatment planning system (Varian Medical System):
- Acuros XB: Acuros® XB Advanced Dose Calcula-tion, version 10.0.28, the first version released forclinical use.- Acuros XB: Acuros® XB Advanced Dose Calcula-tion, version 11.0.02, a pre-clinical engineeringrelease.- AAA: Anisotropic Analytical Algorithm, clinicalversion 10.0.28.
Calculation grid was set to 2.5 mm in all cases. AllAAA and Acuros XB plans were calculated for the samenumber of MU.Acuros XB algorithm solves numerically the Linear
Boltzmann Transport Equation (LBTE) which describesthe macroscopic behaviour of radiation particles as theytravel through and interact with matter. It allows, simi-larly to the classic Monte Carlo methods, for accuratemodelling of dose deposition in heterogeneous media.The original Acuros algorithm for external beams ispublished by Vassiliev et al [13]. Its implementation inEclipse is briefly described in Fogliata et al [17].
Fogliata et al. Radiation Oncology 2011, 6:103http://www.ro-journal.com/content/6/1/103
Page 2 of 11
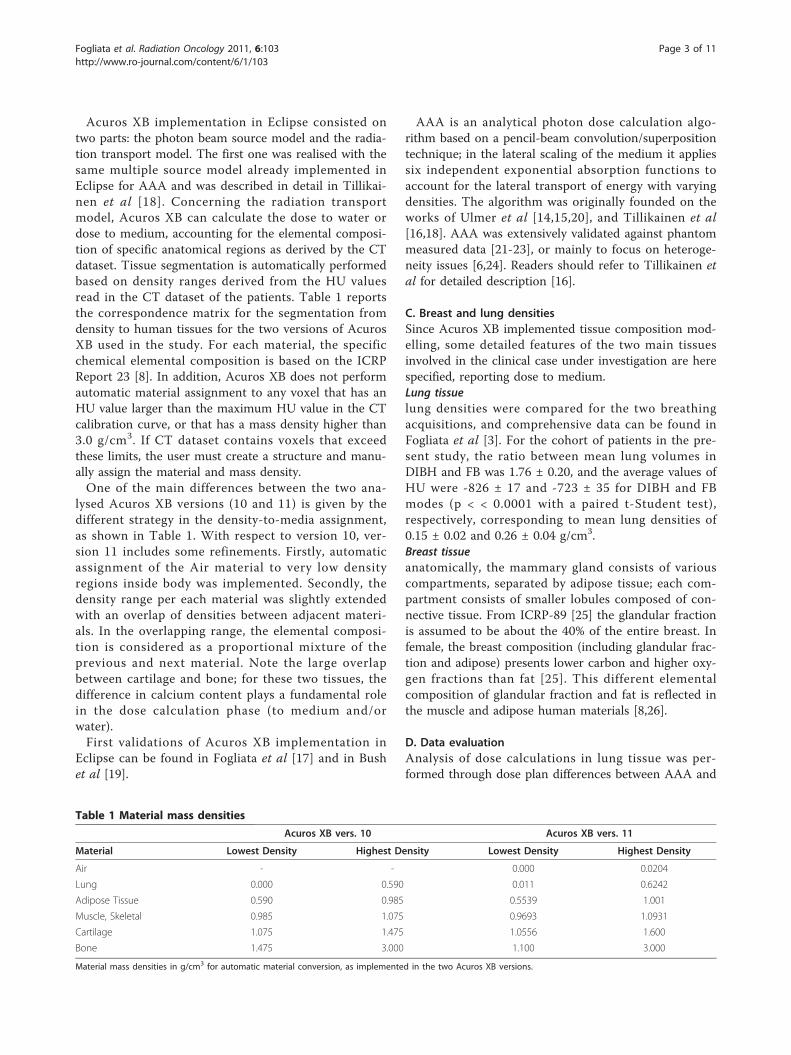
Acuros XB implementation in Eclipse consisted ontwo parts: the photon beam source model and the radia-tion transport model. The first one was realised with thesame multiple source model already implemented inEclipse for AAA and was described in detail in Tillikai-nen et al [18]. Concerning the radiation transportmodel, Acuros XB can calculate the dose to water ordose to medium, accounting for the elemental composi-tion of specific anatomical regions as derived by the CTdataset. Tissue segmentation is automatically performedbased on density ranges derived from the HU valuesread in the CT dataset of the patients. Table 1 reportsthe correspondence matrix for the segmentation fromdensity to human tissues for the two versions of AcurosXB used in the study. For each material, the specificchemical elemental composition is based on the ICRPReport 23 [8]. In addition, Acuros XB does not performautomatic material assignment to any voxel that has anHU value larger than the maximum HU value in the CTcalibration curve, or that has a mass density higher than3.0 g/cm3. If CT dataset contains voxels that exceedthese limits, the user must create a structure and manu-ally assign the material and mass density.One of the main differences between the two ana-
lysed Acuros XB versions (10 and 11) is given by thedifferent strategy in the density-to-media assignment,as shown in Table 1. With respect to version 10, ver-sion 11 includes some refinements. Firstly, automaticassignment of the Air material to very low densityregions inside body was implemented. Secondly, thedensity range per each material was slightly extendedwith an overlap of densities between adjacent materi-als. In the overlapping range, the elemental composi-tion is considered as a proportional mixture of theprevious and next material. Note the large overlapbetween cartilage and bone; for these two tissues, thedifference in calcium content plays a fundamental rolein the dose calculation phase (to medium and/orwater).First validations of Acuros XB implementation in
Eclipse can be found in Fogliata et al [17] and in Bushet al [19].
AAA is an analytical photon dose calculation algo-rithm based on a pencil-beam convolution/superpositiontechnique; in the lateral scaling of the medium it appliessix independent exponential absorption functions toaccount for the lateral transport of energy with varyingdensities. The algorithm was originally founded on theworks of Ulmer et al [14,15,20], and Tillikainen et al[16,18]. AAA was extensively validated against phantommeasured data [21-23], or mainly to focus on heteroge-neity issues [6,24]. Readers should refer to Tillikainen etal for detailed description [16].
C. Breast and lung densitiesSince Acuros XB implemented tissue composition mod-elling, some detailed features of the two main tissuesinvolved in the clinical case under investigation are herespecified, reporting dose to medium.Lung tissuelung densities were compared for the two breathingacquisitions, and comprehensive data can be found inFogliata et al [3]. For the cohort of patients in the pre-sent study, the ratio between mean lung volumes inDIBH and FB was 1.76 ± 0.20, and the average values ofHU were -826 ± 17 and -723 ± 35 for DIBH and FBmodes (p < < 0.0001 with a paired t-Student test),respectively, corresponding to mean lung densities of0.15 ± 0.02 and 0.26 ± 0.04 g/cm3.Breast tissueanatomically, the mammary gland consists of variouscompartments, separated by adipose tissue; each com-partment consists of smaller lobules composed of con-nective tissue. From ICRP-89 [25] the glandular fractionis assumed to be about the 40% of the entire breast. Infemale, the breast composition (including glandular frac-tion and adipose) presents lower carbon and higher oxy-gen fractions than fat [25]. This different elementalcomposition of glandular fraction and fat is reflected inthe muscle and adipose human materials [8,26].
D. Data evaluationAnalysis of dose calculations in lung tissue was per-formed through dose plan differences between AAA and
Table 1 Material mass densities
Acuros XB vers. 10 Acuros XB vers. 11
Material Lowest Density Highest Density Lowest Density Highest Density
Air - - 0.000 0.0204
Lung 0.000 0.590 0.011 0.6242
Adipose Tissue 0.590 0.985 0.5539 1.001
Muscle, Skeletal 0.985 1.075 0.9693 1.0931
Cartilage 1.075 1.475 1.0556 1.600
Bone 1.475 3.000 1.100 3.000
Material mass densities in g/cm3 for automatic material conversion, as implemented in the two Acuros XB versions.
Fogliata et al. Radiation Oncology 2011, 6:103http://www.ro-journal.com/content/6/1/103
Page 3 of 11
the two Acuros XB versions, as well as differencebetween the two Acuros XB versions, for both DIBHand FB. In this context two lung sub-structures wereconsidered: Lung_IN and Lung_OUT (being Lung theentire lung structure, that is also the union of Lung_INand Lung_OUT). Lung_IN is the lung portion fallinggeometrically inside the projection of the edges of thetwo tangential radiation fields. Lung_OUT is its comple-ment, i.e. the portion of lung outside the field edges. Itis thus possible to analyse the behaviour of the algo-rithms when primary radiation transport dominates orwhere mostly scattering shall be the dominant compo-nent to dose deposition. Numerically, mean and stan-dard deviations were recorded for Lung_IN, Lung_OUTand Lung from dose difference plans for each patient inDIBH and FB and then averaged over the whole patientcohort. To better visualize the global pattern of differ-ences, the average differential histograms relative todose difference plans for each structure were plotted inthe various conditions.For target breast soft tissue, the analysis was con-
ducted aiming to appraise the difference in dose calcula-tions in the two breast components, the one composedby lobular breast tissue (segmented as Muscle tissue forcalculations), and the one composed by fat (Adipose tis-sue for calculations). To achieve this aim, two PTV sub-structures were defined: PTV_musc and PTV_adip, thefirst having density higher than 0.985 g/cm3, the secondlower than this value.Numerical analysis of Dose Volume Histograms DVH
was performed for all difference plans couples: AAA -Acuros XB version 10, AAA - Acuros XB version 11,and Acuros XB version 10 - Acuros XB version 11. Thelast couple aimed to demonstrate the impact of a moresophisticated management of density to tissueconversion.To assess how different dose calculations for specific
lung density related to different air filling, or differentsoft tissue composition is detectable in terms of clinicalappraisal using a different algorithm, comparisons wereperformed through mean dose and Vx values fromDVH, with × = 5, 10, 20, 40, 45 Gy. Some data compari-son between DIBH and FB for the three lung structures,and between PTV_musc and PTV_adip for PTV volumewere reported.In the present paper the comparison between the two
algorithms would evidentiate both the differences arisingby the algorithm per se, and the usage in clinical casesof the dose to medium (with the consideration of theelemental composition as with Acuros XB), or dose towater (indeed rescaled to water as with AAA). A faircomparison between the two algorithms in the sameframe of dose calculation rescaled to water has beenpublished in Fogliata et al [27].
ResultsFigure 1 shows an example of an axial view of a patientwith beam arrangement and contoured sub-structures ispresented, together with dose difference patterns.
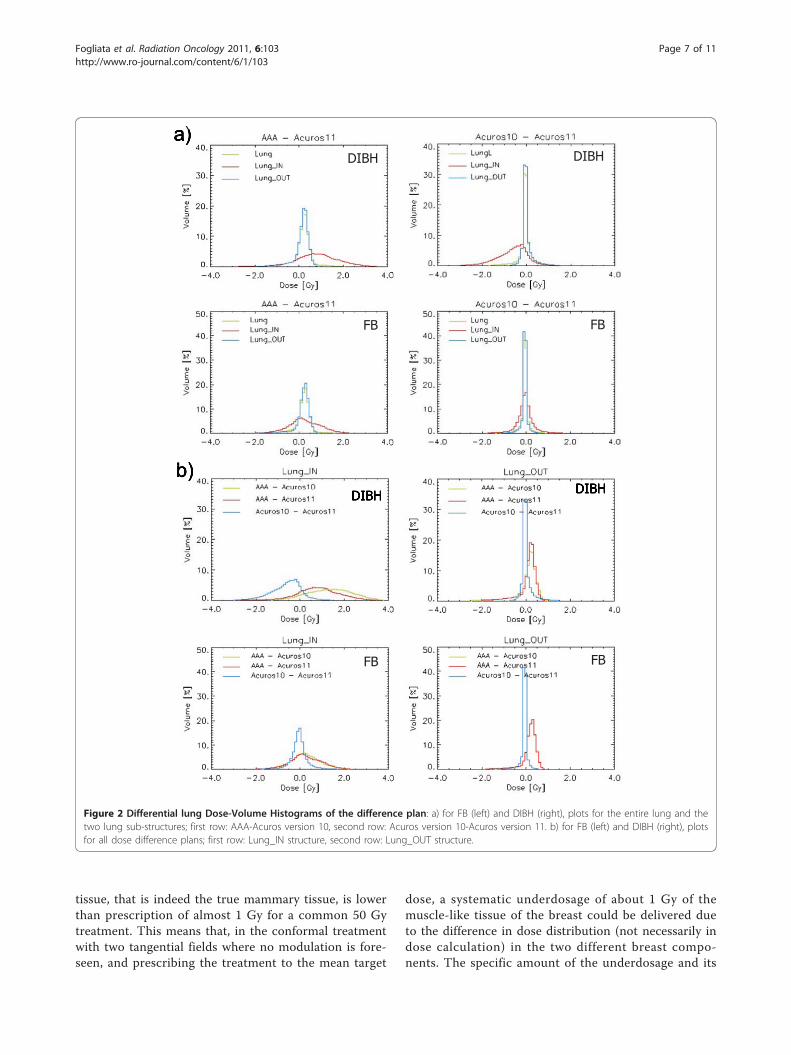
A. Lung tissueResults of the dose calculations for different lung densityin the two different lung regions are summarised in Table2 and in Figure 2. Table 2 reports, for lung tissues, thevalues of the mean and the standard deviation (average ±SD and range over all the ten patients) of the histogramsof the dose difference plans between two calculations algo-rithms, in particular AAA-Acuros11 and Acuros10-Acuros11. Lung_IN and Lung_OUT structures were con-sidered separately for the two air filling conditions of thelung, i.e. FB and DIBH, not having the possibility to regis-ter with a deformable algorithm structures and doses. Fig-ure 2 reports the histograms averaged over all the patients,for the two lung portions as well as for the entire lung, forall the difference plans. Data shows a significant dose dif-ference inside the field (Lung_IN) between AAA andAcuros XB in the two air filling, being the average varia-tion of 0.5% in the FB case (p < 10-4 with a t-Student test),value that increases to 1.5% in the DIBH case (p < 10-4
with a t-Student test). AAA calculations predicts higherdose than Acuros XB. Looking at the two Acuros XB ver-sions, negligible difference of 0.2% is shown in the FB case,while an average of 1.3% (p < 10-4 with a t-Student test) isobtained for the lower density case of lung, resulting inhigher dose computed by version 11. The difference arisesfrom the inclusion, in the list of materials, of the air forvery low density pixels (being pure air up to 0.011 g/cm3,and a mixture of air and lung tissues from 0.011 to 0.0204g/cm3), together with a more accurate calculation for verylow density lung, implemented in version 11 of AcurosXB. On the contrary, the difference in dose calculationsoutside the field (due to scattering) is negligible among allalgorithms and lung densities.In Figure 2 the distribution of the dose differences is
shown also for the entire lung tissue. Due to the rathersmall portion of lung volume included in the fields(Lung_IN is 11 ± 3% for DIBH and 15 ± 4% for FB ofthe whole lung volume averaged over the ten analysedpatients), the systematic difference of the dose calcula-tions would have been hidden if the entire volume wasused. From Figure 2 and Table 2 it is visible also therather large spread (standard deviation of the histo-grams) of the difference between AAA and Acuros XBin Lung_IN. This spread decreases between the twoAcuros XB versions, but only in the FB cases.
B. Soft tissueThe results of the analysis of the target volume and itsstratification in the two sub-structures PTV_musc and
Fogliata et al. Radiation Oncology 2011, 6:103http://www.ro-journal.com/content/6/1/103
Page 4 of 11
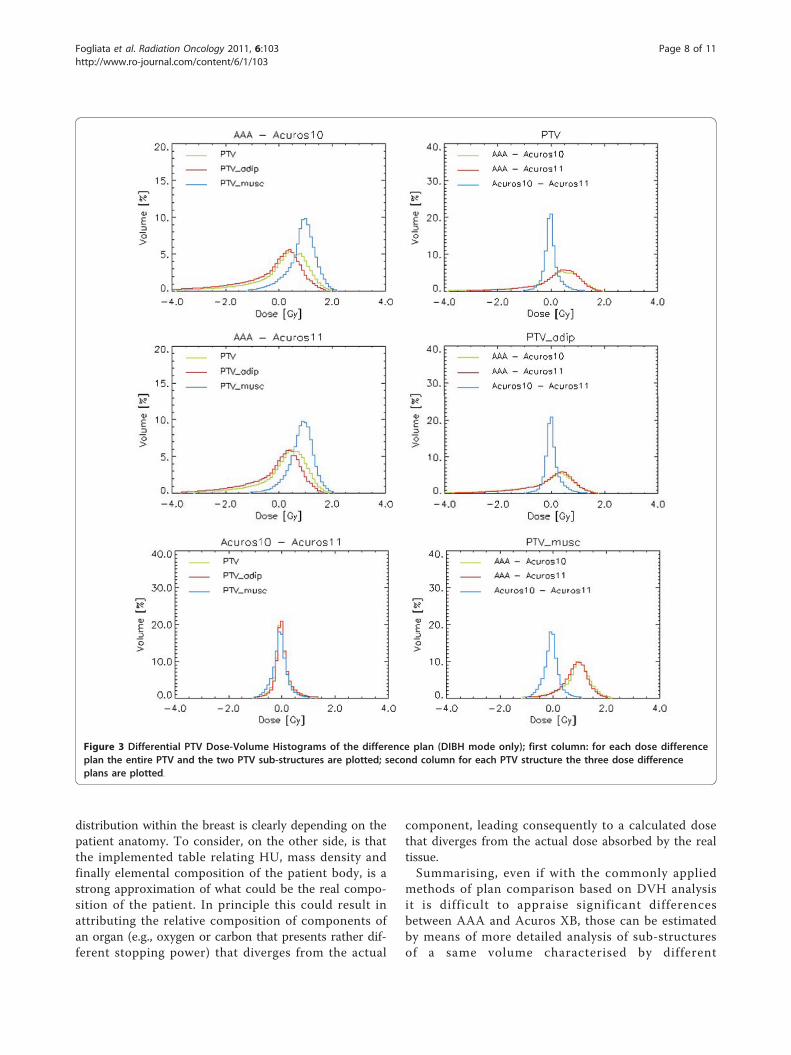
PTV_adip are reported in Table 2 and Figure 3, fromdose difference plan calculations. The PTV analysis isreported only for DIBH cases. The FB cases were ana-lysed as well, and the results were similar. From Table 2the difference in dose calculation between AAA andAcuros XB in muscle tissue is in average 1.6%, withAAA predicting higher dose than Acuros XB. The samemetric for adipose tissue gives negligible differences(0.2%). Between the two Acuros XB versions, almost nodifference is found (being in average within 0.2% for thetwo tissue materials). This last absence of difference wasexpected, because the mean densities of PTV_musc andPTV_adip, of 1.013 and 0.954 g/cm3 respectively, liewell within the range of the corresponding material, andalmost no mixed tissue is considered in version 11.From the histograms plotted in Figure 3, it is clear
that the systematic difference in dose calculation in themuscle tissue of the breast would have been hidden ifonly the PTV was analysed, as the adipose tissue com-posing the breast is in average, over the analysedpatients, 74% (ranging from 42 to 89%) of the wholetarget.
C. Clinical appraisal from global DVHResults for the statistical parameters from DVH aresummarised in Table 3 (as mean values and standarddeviations over all patients) for PTV and its two compo-nents, PTV_musc and PTV_adip, and for Lung and itstwo components, Lung_IN and Lung_OUT. Plots of theaverage cumulative histograms for DIBH cases are pre-sented in Figure 4. If plans are compared only for theentire lung and PTV, as generally done in clinical prac-tice, AAA and Acuros XB would show minor differ-ences. When the two subcomponents of the two mainstructures are, analysed, the differences become relevantalso in terms of cumulative DVH. For example the shiftof DVH toward high doses is clear for PTV_musc andLung_IN. From statistics differences are visible for Lun-g_IN calculations, where also the difference between thetwo Acuros XB versions is evident for DIBH cases forthe V40Gy parameter. Regarding PTV, a significant differ-ence between AAA and Acuros XB calculations is visi-ble only in the two PTV sub-structures, where V95%shows, for Acuros XB calculations, higher values in theadipose tissue, and lower values in the muscle tissue.
a) b)
c) d)
Figure 1 Axial view of an example case: a) Lung_IN (light blue) and Lung_OUT (yellow) contours for lung; PTV_musc (pink) and PTV_adip(red) contours for target breast; b) treatment technique of two tangential fields; c) dose distribution for Acuros XB version 10 calculations; d)dose distribution for the plan difference AAA-Acuros10.
Fogliata et al. Radiation Oncology 2011, 6:103http://www.ro-journal.com/content/6/1/103
Page 5 of 11
DiscussionThe present study aimed to investigate the performance,for a given clinical model, of the new Acuros XB algo-rithm for photon dose calculations recently implemen-ted in the Eclipse planning system, in comparison withthe commonly used AAA algorithm. Focus was put ontwo main general criticalities. The first is the behaviourof the algorithm in lungs when different air filling anddensity has to be considered due to different respiratoryconditions, i.e. FB and DIBH. The second is the capabil-ity of the dose calculation engine to distinguish betweendifferent types of soft tissues characterised by signifi-cantly different chemical composition but anatomicallystrongly interlaced: the lobular gland (muscle) and adi-pose tissue, having different elemental composition interms of carbon and oxygen proportions.The two photon dose calculation algorithms here ana-
lysed, implement totally different approaches, and, forthe subject of the study, the main point is focussed tothe capability, for Acuros XB, to manage elementalcompositions of some predefined human tissues, andtherefore to calculate the dose to proper medium.Those characteristics are not available in AAA, wherethe calculation accounts only for the different densitiesof the materials, but the dose is computed as dose todensity rescaled water. From Acuros XB validation in
water and in heterogeneous media [17,19,27], bench-marked respectively against measurements and MonteCarlo calculations, it has been shown that differencesbetween AAA and Acuros XB calculations can be inter-preted as an improvement in accuracy when using thenewer algorithm.Considering the lung dose calculations, the difference
between algorithms was found in the region within thetwo tangential fields. The greatest differences, asexpected, were found in the DIBH cases, presenting thelowest lung densities (0.15 g/cm3 with respect to 0.26 g/cm3 in the same FB cases). In this region the AAA doseoverestimation is in average of 1.5% (with a maximumvalue of 3.3% in the patient cohort). Presenting, on thecontrary, very negligible differences in the region out ofthe field between the two algorithms, the offset heremeasured is generally not visible in the common prac-tice of inspecting DVH. The same effect is the differenceof dose calculated in the muscle tissue of the breast, andagain not visible in common DVH analysis being themuscle tissue only one fourth of the entire target breastvolume. In this last case the 1.6% average overestimation(maximum value 2.1%) of AAA calculation should beread with a different approach: the mean dose to theadipose tissue of the entire breast is very near to theprescription dose, while the mean dose to the muscle
Mean and Standard Deviations parameters (in percentage) of the differential DVH for AAA-Acuros11 and Acuros10-Acuros11 difference plans. Both parametersare recorded as Mean ± SD and range for lung, PTV and their sub-structures. For lung contours, both DIBH and FB modes are reported, while for PTV contoursonly DIBH is shown.
Fogliata et al. Radiation Oncology 2011, 6:103http://www.ro-journal.com/content/6/1/103
Page 6 of 11
tissue, that is indeed the true mammary tissue, is lowerthan prescription of almost 1 Gy for a common 50 Gytreatment. This means that, in the conformal treatmentwith two tangential fields where no modulation is fore-seen, and prescribing the treatment to the mean target
dose, a systematic underdosage of about 1 Gy of themuscle-like tissue of the breast could be delivered dueto the difference in dose distribution (not necessarily indose calculation) in the two different breast compo-nents. The specific amount of the underdosage and its
a)
b)
FB FB
DIBH DIBH
FB FB
DIBH DIBH
Figure 2 Differential lung Dose-Volume Histograms of the difference plan: a) for FB (left) and DIBH (right), plots for the entire lung and thetwo lung sub-structures; first row: AAA-Acuros version 10, second row: Acuros version 10-Acuros version 11. b) for FB (left) and DIBH (right), plotsfor all dose difference plans; first row: Lung_IN structure, second row: Lung_OUT structure.
Fogliata et al. Radiation Oncology 2011, 6:103http://www.ro-journal.com/content/6/1/103
Page 7 of 11
distribution within the breast is clearly depending on thepatient anatomy. To consider, on the other side, is thatthe implemented table relating HU, mass density andfinally elemental composition of the patient body, is astrong approximation of what could be the real compo-sition of the patient. In principle this could result inattributing the relative composition of components ofan organ (e.g., oxygen or carbon that presents rather dif-ferent stopping power) that diverges from the actual
component, leading consequently to a calculated dosethat diverges from the actual dose absorbed by the realtissue.Summarising, even if with the commonly applied
methods of plan comparison based on DVH analysisit is difficult to appraise significant differencesbetween AAA and Acuros XB, those can be estimatedby means of more detailed analysis of sub-structuresof a same volume characterised by different
Figure 3 Differential PTV Dose-Volume Histograms of the difference plan (DIBH mode only); first column: for each dose differenceplan the entire PTV and the two PTV sub-structures are plotted; second column for each PTV structure the three dose differenceplans are plotted.
Fogliata et al. Radiation Oncology 2011, 6:103http://www.ro-journal.com/content/6/1/103
Page 8 of 11
compositions or dose intensity delivery. Once definedthe possible source of differences between dose calcu-lation algorithms, it is possible to appreciate themerit of using a highly sophisticated algorithms in theclinical practice. The availability of commercial algo-rithms capable to discriminate among different tissuesand chemical composition (although using pre-defined and simplified segmentation methods) is ofprimary importance in order to better understand thedose that can actually be delivered to patients in ana-tomical sites known to be inaccurately managed byolder algorithms.
ConclusionsImprovements in dose calculations with the usage ofsophisticated algorithms, and the possibility to account
for proper elemental compositions of the various tissuesof the human body allows a better knowledge of theactual dose distribution inside the patient, which in thefuture could better describe the clinical outcome in par-ticular situations. In particular, the possibility to bettercompute the dose delivered to parts of specific organs,as in the breast example where the dose to the lobularof fat tissues is systematically different due to their ele-mental compositions, might make better understandingof toxicities or treatment outcome arising from suchdifferences.The availability of accurate algorithms give to the
community an improvement in the consistency betweenactual and calculated treatment doses, a fact that canhave a clinical impact on the consistency of data in clin-ical trials.
Statistics for lung and PTV structures in DIBH and FB modes, from all three analysed algorithms and versions.
Fogliata et al. Radiation Oncology 2011, 6:103http://www.ro-journal.com/content/6/1/103
Page 9 of 11
AcknowledgementsThe present work was partially supported by a Grant from Varian MedicalSystems, Palo Alto, CA, USA.The authors thank the whole Varian Medical System group in Helsinki,Finland, especially Stephen Thompson, Pekka Uusitalo, Tuomas Torsti, LauraKorhonen, Viljo Petaja for the fruitful discussions during the evaluation phaseof the Acuros XB algorithm.
Authors’ contributionsAF: study coordination, data analysis, manuscript preparation. GN, EV, AC:data analysis. LC: study coordination, manuscript preparation. All authorsread and approved the final manuscript.
Competing interestsDr. L. Cozzi acts as Scientific Advisor to Varian Medical Systems and is Headof Research and Technological Development to Oncology Institute ofSouthern Switzerland, IOSI, Bellinzona.No special competing interest exists for any other author.
Received: 5 July 2011 Accepted: 26 August 2011Published: 26 August 2011
gating with the breath-hold technique. Radiother Oncol 2005,76:311-318.
2. Pedersen AN, Korreman S, Nyström H, Specht L: Breathing adaptedradiotherapy of breast cancer: reduction of cardiac and pulmonarydoses using voluntary inspiration breath-hold. Radiother Oncol 2004,72:53-60.
3. Fogliata A, Nicolini G, Vanetti E, Clivio A, Winkler P, Cozzi L: The impact ofphoton dose calculation algorithms on expected dose distributions inlungs under different respiratory phases. Phys Med Biol 2008,53:2375-2390.
4. Yorke ED, Wang L, Rosenzweig KE, Mah D, Paoli JB, Chui CS: Evaluation ofdeep inspiration breath-hold lung treatment plans with Monte Carlodose calculation. Int J Radiat Oncol Biol Phys 2002, 53:1058-1070.
5. Aspradakis MM, Morrison RH, Richmond ND, Steele A: Experimentalverification of convolution/superposition photon dose calculations forradiotherapy treatment planning. Phys Med Biol 2003, 48:2873-2893.
6. Fogliata A, Vanetti E, Albers D, Brink C, Clivio A, Knöös T, Nicolini G, Cozzi L:On the dosimetric behaviour of photon dose calculation algorithms inthe presence of siimple geometric heterogeneities: comparison withMonte Carlo calculations. Phys Med Biol 2007, 52:1363-1385.
7. Knöös T, Wieslander E, Cozzi L, Brink C, Fogliata A, Albers D, Nyström H,Lassen S: Comparison of dose calculation algorithms for treatmentplanning in external photon beam therapy for clinical situations. PhysMed Biol 2006, 51:5785-5807.
8. International Commission on Radiological Protection: InternationalCommission on Radiological Protection: Reference Man: Anatomical,Physiological and Metabolic Characteristics. Elsevier; 1975, 512.
9. Dogan N, Siebers JV, Keall PJ: Clinical comparison of head and neck andprostate IMRT plans using absorbed dose to medium and absorbeddose to water. Phys Med Biol 2006, 51:4967-4980.
10. Siebers JV, Keall PJ, Nahum AE, Mohan R: Converting absorbed dose tomedium to absorbed dose to water for Monte Carlo based photonbeam dose calculations. Phys Med Biol 2000, 45:983-995.
11. Wareing TA, McGhee GM, Morel JE, Pautz SD: Discontinuous FiniteElement SnMethods on Three-Dimensional Unstructured Grids. Nucl SciEngr 2001, 138:256-268.
12. Vassiliev O, Wareing T, Davis I, McGhee J, Barnett D, Horton J, Gifford K,Failla G, Titt U, Mourtada F: Feasibility of a multigroup deterministicsolution method for three-dimensional radiotherapy dose calculations.Int J Radiat Oncol Biol Phys 2008, 72:220-227.
13. Vassiliev O, Wareing T, McGhee J, Failla G, Salehpour M, Mourtada F:Validation of a new grid based Blotzmann equation solver for dosecalculation in radiotherapy with photon beams. Phys Med Biol 2010,55:581-598.
14. Ulmer W, Harder D: A triple gaussian pencil beam model for photonbeam treatment planning. Z Med Phys 1995, 5:25-30.
15. Ulmer W, Harder D: Applications of a triple gaussian pencil beam modelfor photon beam treatment planning. Z Med Phys 1996, 6:68-74.
16. Tillikainen L, Helminen H, Torsti T, Siljamäki S, Alakuijala J, Pyyry J, Ulmer W:A 3D pencil-beam-based superposition algorithm for photon dosecalculation in heterogeneous media. Phys Med Biol 2008, 53:3821-3839.
17. Fogliata A, Nicolini G, Clivio A, Vanetti E, Mancosu P, Cozzi L: Dosimetricvalidation of Acuros XB Advanced Dose Calculation algorithm:fundamental characterization in water. Phys Med Biol 2011, 56:1879-1904.
18. Tillikainen L, Siljamäki S, Helminen H, Alakuijala J, Pyyry J: Determination ofparameters for a multiple-source model of megavoltage photon beamsusing optimization methods. Phys Med Biol 2007, 52:1441-1467.
19. Bush K, Gagne IM, Zavgorodni S, Ansbacher W, Beckham W: Dosimetricvalidation of Acuros XB with Monte Carlo methods for photon dosecalculations. Med Phys 2011, 38:2208-2221.
20. Ulmer W, Kaissl W: The inverse problem of a gaussian convolution andits application to the finite size of the measurement chambers/detectorsin photon and proton dosimetry. Phys Med Biol 2003, 48:707-727.
21. Fogliata A, Nicolini G, Vanetti E, Clivio A, Cozzi L: Dosimetric validation ofthe anisotropic analytical algorithm for photon dose calculation:fundamental characterization in water. Phys Med Biol 2006, 51:1421-1438.
22. Bragg CM, Conway J: Dosimetric verification of the anisotropic analyticalalgorithm for radiotherapy treatment planning. Radiother Oncol 2006,81:315-323.
23. van Esch A, Tillikainen L, Pyykkonen J, Tenhunen M, Helminen H,Siljamäki S, Alakuijala J, Paiusco M, Iori M, Huyskens DP: Testing of the
analytical anisotropic algorithms for photon dose calculation. Med Phys2006, 33:4130-4148.
24. Aarup LR, Nahum AE, Zacharatou C, Juhler-Nøttrup T, Knöös T, Nyström H,Specht L, Wieslander E, Korreman SS: The effect of different lung densitieson the accuracy of various radiotherapy dose calculation methods:implications for tumour coverage. Radiother Oncol 2009, 91:405-414.
25. International Commission on Radiological Protection: ICRP Publication 89,Basic anatomical and physiological data for use in radiological protectionreference values New York; 2002.
26. Schneider U, Pedroni E, Lomax A: The calibration of CT Hounsfield unitsfor radiotherapy treatment planning. Phys Med Biol 1996, 41:111-124.
27. Fogliata A, Nicolini G, Clivio A, Vanetti E, Cozzi L: Dosimetric evaluation ofAcuros XB Advanced Dose Calculation algorithm in heterogeneousmedia. Radiat Oncol 2011, 6:82.
doi:10.1186/1748-717X-6-103Cite this article as: Fogliata et al.: On the dosimetric impact ofinhomogeneity management in the Acuros XB algorithm for breasttreatment. Radiation Oncology 2011 6:103.
Submit your next manuscript to BioMed Centraland take full advantage of:
• Convenient online submission
• Thorough peer review
• No space constraints or color figure charges
• Immediate publication on acceptance
• Inclusion in PubMed, CAS, Scopus and Google Scholar
• Research which is freely available for redistribution
Submit your manuscript at www.biomedcentral.com/submit
Fogliata et al. Radiation Oncology 2011, 6:103http://www.ro-journal.com/content/6/1/103