Research Paper on
A Study of Indian Railways and Indian Aviation
Industry: In Context of Complimenting to each other
Submitted By
Vipin Dwivedi
Research Associate
IIM - Lucknow
Mentor
Mr. Ravij Seth
IRAS
Financial Advisor & Sr. Professor
(Finance & P.P.P)
Administrative support by
Sri Kishore Mehta
CMI/IRITM/Lucknow
© Indian Railways Institute of Transport Management, Lucknow (Uttar Pradesh)
Acknowledgment
I would like to sincerely thank our mentor Mr. Ravij Seth for
giving his guidance throughout the project. His constant
support, encouragement and readiness to answer all the
questions just go on to show his willingness to help us in
achieving my goals. I would also like to thank all the people
who supported in writing research paper, for their valuable
time and support during the project.
AN OVERVIEW OF THE INDIAN RAILWAYS
1. Introduction:
The Indian Railways is a principal service provider in the
transport sector in the country. It has already crossed 150
years of its existence. The first train was introduced in India
on 16th April, 1853 between Boribandar (Mumbai V.T.) and
Thane. The Indian Railways has successfully adapted itself to
the changing needs of travel and transport in the country. It
has also absorbed various advancements in the field of
railway technology and kept itself equipped continually to
meet the growing requirements of passenger and freight
traffic. Evaluation of Railways in last 60 years is mentioned
below:
Parameters Unit FY1951 FY2011
Net Revenues INR billion 0.5 63.5
Passenger
Traffic
Billion 1.3 7.8
Freight Traffic Million metric
tones
73.2 926.4
Stations Nos. 5,976 9,241
Running
Track
Km 59,315 87,114
1.1 Network:
India’s rail network is the largest in asia and the second
largest in the world. The Indian railway operates 12,700
passengers’ trains daily, transporting approx. 2.65 MMT of
freight and 23 million passengers across the country.
1.2 Functions:
The management and formulation of policy are entrusted
with the Railway Board comprising the Chairman, Financial
Commissioner and five other functional Members who look
after the individual departments, namely Electrical,
Mechanical, Engineering, Traffic and Personnel. The Board is
vested with wide managerial and financial powers to
supervise, maintain and control effectively the railway assets
and operations through the various zonal and divisional
organizations.
1.3 Work Force:
The Indian Railways is having a mammoth work force of 15.5
lakhs employees. A disturbing factor has been that the
average emoluments drawn by per employee per year have
increased from Rs. 1,253 in the year 1951 to Rs. 1, 33,967
now. About 55 to 60% of the total expenditure of the Indian
Railways is spent in arranging payments for the working
employees as well as retired employees. There is an urgent
need to reduce the expenditure on man power. This can be
achieved only when the staff strength is reduced and the
staff are motivated enough to improve their productivity and
efficiency.
1.4 Economic Growth:
Due to globalization and opening of Indian economy, at
present, in India 6 to 7% economic growth is being achieved.
This economic growth will put an additional burden on the
Indian Railways to move large volumes of freight and
passengers traffic with lesser staff.
2. Major trends in Indian Railways:
There is a rapid increase in demand for urban mass
transportation systems in the country. Several metro rail
projects are in progress to improve connectivity within cities;
the Delhi Metro has emerged as an internationally acclaimed
venture.
2. Indian Railways (IR) launched mobile ticketing services in
August 2011 to make the ticket issuing process more
efficient. Users can directly buy a ticket from their mobiles
that would be delivered to them through a non-transferable
SMS.
3. IR has attracted increasing investments from overseas
through strategic alliances with various countries over the
last few years. Subsidiaries of foreign companies are being
set up to cater to the huge demand offered by IR.
4. IR is planning to build seven high-speed rail corridors to
provide faster rail connectivity across the country. The trains
will be capable of running at a speed up to 300 kilometres
per hour.
2.1 Traffic
Passenger Traffic went up because of rising income,
urbanization driving passenger traffic growth. Urban
population in India has increased from 17.3 per cent of the
total population in 1951 to 31.2 per cent in 2011; this has led
to increase in traffic between urban and rural areas in the
country. Improvement of urban-rural connectivity by rail has
been another major contributor to passenger growth.
Further, passenger traffic continues to enjoy significant
priority over rail freight. In addition to first right of
movement, passenger rates are highly subsidized by freight
operations utilizing up to 72.3% of network capacity but
contributing only 30% to revenue, while passenger segment
accounts only for 27.7%.
3. Modernisation of Indian Railways
To modernize Indian Railways, the focus is on two
fundamental drivers - Safety and Growth and along a five-
pronged strategy
1. Modernize core assets - They are key revenue
generating assets.
2. Explore new revenue models - To meet the funding
needs for modernization and growth.
3. Review projects - To ensure financial viability, social
benefits, and timely implementation.
4. Focus on enablers - For a holistic and long term
approach to modernisation and execution.
5. Mobilize resources - To capitalize on an opportunity.
3.1 Infrastructure Capacity Creation
The Eleventh Plan attempted a paradigm shift from the
earlier incremental approaches to one of significant
infrastructure capacity addition to handle the quantum
increase in traffic levels and to sustain mobility on the
network by setting ambitious targets as compared to the
performance during the Tenth Plan. The targets in respect of
new lines and electrification have been exceeded.
The expanding requirements of the economy will need much
faster expansion of the freight network along with its ability
to carry larger freight per wagon, improve efficiency of the
Rail system to deliver it faster and expand the network.
There will also be need to improve the share of the Railways
in the overall national freight market. With increasing
incomes, passenger traffic will increase but plan for
expansion must factor in the fact that demand will be for
better quality services for which passengers will be willing to
pay.
4.1 Indian Aviation
• 9th largest civil aviation market in the world.
• India is ranked 4th in domestic passenger volumes (45.3
million).
• India’s civil aviation market is set to become the world’s
3rd largest by 2020.
• India has 136 airports, 128 of which are owned by AAI.
• The air transport industry has committed to improve fuel
efficiency by 1.5% per year to 2020
Aviation is the fastest means of transport and has expanded
rapidly with the opening up of domestic skies to the private
carriers in the second half of the 10th plan via public private
partnership investment in the airport infrastructure. The air
transport on long distance routes handles substantial traffic.
This sector also enhances the productivity and efficiency in
the movement of goods and services. It also has an
important role to play on routes which involve difficult
territory.
Aviation sector contributes significantly in development by
generating employment opportunities. As per estimation, the total
manpower requirement (including numbers of pilots, cabin crew,
aircraft engineers and technicians, ground handling staff, cargo
handling staff, administrative and sales staff) of airlines will rise
from 62000 in 2011 to 117000 by 2017.
Aviation to India becomes strategically important in the absence of
widespread waterways network and the delayed development of
infrastructure projects related to other modes of transportation.
Evaluation of Indian aviation in last 12 years is mentioned below:
Parameters Unit FY2000 FY2012
Scheduled Airlines
distance flown
Mn km 199 762
Non-scheduled airlines in
operation
No. 39 136
No. of Aircraft No. 225 1188
Passenger handling
capacity at airports
million 66 233
No. of operational
airports
No. 50 125
Indian Domestic carriers-Market Share July 2012
There are total 136 airports are in India, in which 128 are
managed by AAI and rest of them are by non-AAI. There are
also some achievements of the Indian aviation sector which
they achieved during 2000-2012. The no. of operational
airports are increased from 50 in the year 2000 to 125 in the
year 2012. There is also increase in the aircraft from 225 in
the year 2000 to 1188 in the year 2012. And result of these
two causes the expansion of passenger handling capacity at
airports from 66 million to 233 million in between 2000
2012.
The growth in total passenger traffic has been robust recent
years with a passenger traffic record of 162.6 million in 2012
along with growth rate of 13.4%. During the 2012 domestic
passenger traffic grew 15.7 per cent while international
passenger traffic expanded 7.2 per cent.
Market Share July 2012
There are total 136 airports are in India, in which 128 are
AAI. There are
achievements of the Indian aviation sector which
of operational
airports are increased from 50 in the year 2000 to 125 in the
year 2012. There is also increase in the aircraft from 225 in
year 2012. And result of these
two causes the expansion of passenger handling capacity at
airports from 66 million to 233 million in between 2000-
The growth in total passenger traffic has been robust recent
162.6 million in 2012
During the 2012 domestic
passenger traffic grew 15.7 per cent while international
Major Trends of the Airport Sector
During this growth period, this industry has been witness of
several changes and trends, such as policy initiatives taken by
government to increase private sector participation. At
present movement there are 6 major private sector player
linked with it. There is rise in per capita income, more
disposable income and growing middle in comparison to
previous years, hence more and more people are travelling
by air. There is also hike in user development fees by airport
developers and operators. The another important trend is
the focus on non-aeronautical revenue like increase the
beverages and food retail segment at airports due to absence
of complementary meals in low – cost airlines.
Air Passenger Traffic:
Traffic 2011(in No.) 2012 (in No.) Domestic
Passenger
108 million 106 million
International
Passenger
36.20 million 37.8 million
During year 2012, AI’s passenger load factor was 70.9 % and
yield at Rs. 4.31 per revenue passenger kilometer and it is
expected that company will achieve positive EBITDA
(earnings before income, taxes, depreciation and
Amortization) in the results for the Financial Year 2012-13.
The aim of 11th plan was to provide world class
infrastructure for safe, reliable and affordable air services,
hence increase the passenger growth and cargo traffic and
air connectivity to remote and inaccessible areas. Now as per
12th plan, GOI aims to propel India among the top five civil
aviation markets in the world with the base of the 11th plan.
Rail Business in context of Passenger capacity
enhancement
Passenger Traffic Projection for Twelfth Five year plan:
Indian Railways
Passenger traffic is expected to grow at a rate of 5 to 5.5
percent. The projections for passenger traffic are given in the
table below. The Plan will focus on reducing the cost of
operations, developing attractive service packages and
adoption of competitive pricing to safeguard share of upper
class travel vis-à-vis airlines.
Year Projected
Passenger(suburban)
(Figures in millions)
Ratio Projected
Passenger
Non-suburban
( Figures in
millions)
Ratio
2012-13 4545 51.25 4323 48.75
2013-14 4855 51.07 4651 48.93
2014-15 5186 50.89 5005 49.11
2015-16 5540 50.71 5385 49.29
2016-17 5917 50.53 5793 49.47 Source: data.gov.in
To cater to the projected growth of non-suburban traffic at 8-
9% p.a., it would be necessary to expand supply by increase
in train services and augmentation of seating capacity of
trains. Most of the popular trains would be augmented to 24-
26 coaches. Initially, 26 coach trains would be introduced on
selective routes where additional investment is low.
Passenger Business
Low cost airlines are giving stiff competition to upper class
segments of the passenger business. Other segments,
particularly the short and medium distance passenger
business, are facing intense competition from the vastly
improved road services. The Eleventh Plan strategy is to
consolidate the rail share in passenger business, particularly,
in long distance and medium distance segment by increasing
the commercial speed of passenger trains, and introduction
of fast services between metropolitan cities with speed up to
150 kmph. Development of High Speed Corridors on selected
routes is seen as another key strategy for inter-city transport
and is also an environmental friendly solution.
Indian Railways is a commonly used mode of public
transportation in the country. During 2011-12, it carried
8,224 million passengers as against 7,651 million in 2010-11
thus registering a volume growth of 7.49%. Passenger
kilometres, which is calculated by multiplying the number of
journeys by mean kilometric distance was 1047 billion, up by
6.95% from 979 billion in the previous year. Passenger
earnings also increased by ` 2,453.80 crore (9.51%) in
comparison with 2010-11.The profile of passenger traffic in
2011-12 is outlined below:
Suburban Non-Suburban
2010-11 2011-12 2010-11 2011-12 Passenger
originating(millions) 4061 4377 3590 3847
Passenger
kilometres(millions) 137127 144057 841381 902465
Earnings(Rs in Crore) 1752.29 1925.65 23953.64 26320.78 Average rate per
passenger Km 12.8 13.4 28.5 29.2
Source: indianrailways.gov.in
Passenger Revenue
Passenger revenue has been steadily increasing, though it
formed only about 27% of the total earnings of the Railways
in 2011-12.
Passenger Revenues (Rs. In millions)
Year Suburban Non-
Suburban
Total
1980-81 905.2 7369.5 8274.7
1990-91 3569.8 27877.4 31447.2
2000-01 10911.4 93920.2 104831.6
2010-11 17862.8 239193.6 257056
2011-12 19256 263207 282464
Source: indianrailways.gov.in
AC-I & AC-II Class Earnings and Refund of Passengers
(Apr’2012 to Mar’2013)
Class No. of
ticket
booked
Total no.
of
passenge
r
Total
earning
(fig in
crores)
No. of
ticket
cancelle
d
No. of
pass
cancelle
d
Actual
refund(fi
g in
crores)
Actual
No. of
pass.
travelled
Net
earnin
gs(fig
in
crores)
I -AC 5.74 L 9.40 L 185 2 L 3.5 L 52 5.9L 133
II- AC 8.21 L 153 L 1874 237 L 44.5 L 361 109L 1512
Total 879 L 163 L 2059 239 L 48 L 413 115L 1645
Source: indianrailways.gov.in
• As per above figure shows total no. of cancellation of
total passenger travelled (1058 Lakhs) of all class is
45%.
• 48 Lakhs Passenger has got cancelled their tickets
due to non-availability of berth at a particular time.
• Total loss recorded in the period of 2012-13 is 413
crores in AC I and AC II due to non-availability of
berths or cancellation.
• Approx 48 Lakhs of AC I & AC II passengers are not
getting availability and repositioning business to
other transport mode.
Passenger Capacity Challenge
The main challenge that Indian Railway face today is related
to capacity building. It is essential to build a network of
capacities across the country. At present Indian Railway has a
network of 62,000 km. Indian Railways runs around 12,700
trains everyday, of which 12,000 are passenger trains.
Golden quadrilateral which connects five important metro
cities of India constitutes 60 percent of country’s traffic. The
scale of operations is very huge. People need to be trained in
the usage of new Information Technology systems, so that
these can be seamlessly implemented. Then there are also
the infrastructure related challenges. One major concern
is related to the concept of passenger and freight lines
management. There are separate lines for passenger and
freight in most of the advanced railway systems in the world.
But in India, we have to manage both the traffics in one
single line. There is a need to develop dedicated lines
separately for passengers and freight movement as they both
runs on different speed and excel load.
The Railways are facing severe capacity constraints.
All the country’s high-density rail corridors face severe
capacity constraints. Also, freight transportation costs by rail
are much higher than in most countries as freight tariffs
in India have been kept high to subsidize passenger traffic.
Fare comparison: Indian Railways Vs Indian Airlines
S/No.
Train
Class(A/C) From To IR Fare Flight Fare
1
I
Newdelhi Howrah
3300
4200 II 2400
III 1730
2
I
Newdelhi Mumbai
3540
4273 II 2480
III 1790
3
I
Newdelhi Chennai
4410
5060 II 2970
III 2105
4
I
Mumbai Kolkata
4180
4818 II 2848
III 2025
5
I
Chennai Kolkata
3730
3745 II 2585
III 1860
6
I
Newdelhi Hyderabad
3770
4273 II 2605
III 1870
7
I
Newdelhi Bangalore
4620
4231 II 3200
III 2180
8
I
Mumbai Bangalore
2990
3800 II 2180
III 1505
As per above fare details it seems, there is not much variation of
fares between AC-I Class fares and Domestic air lines for metro
cities. If, we see the flight route of Chennai to Kolkata and
Newdelhi to Bangalore, fare prices are slightly cheaper than AC-I
class fares. Fare structure is based on planned journey of three
months from the date of ticket.
Domestic flights are showing 70-75 percent PLF (Passenger
Load Factor) where 20 millions seats noted vacant in 2011-
12.That much of passenger capacity gap we can trap through
converting High Class Rail passenger into LCC (Low cost
carrier) flights by negotiating bulk prices.
• Low cost carrier flights are showing PLF data against
vacant seat during 2011-12.
• Passenger Traffic is overall 253 Lakhs.
• Average PLF (Passenger Load Factor) noted 75% for all
low cost carrier flight.
• Jet Lite shown the highest PLF (77.9%) among other
domestic players.
• Overall 64.85 Lakhs seats recorded vacant during 2011-
12.
Domestic Airline PLF Analysis -2011-12
Flights
Carried Pass. (in
lakhs) PLF (in %)
No. of pass
travelled(in
Lakhs)
Final Seat(In
Lakhs)
Air India 78 72 56.16 21.84
Spice Jet 92 74.4 68.08 23.92
Go Air 37 77.3 28.49 8.51
Jet Lite 46 77.9 35.42 10.58
253 64.85
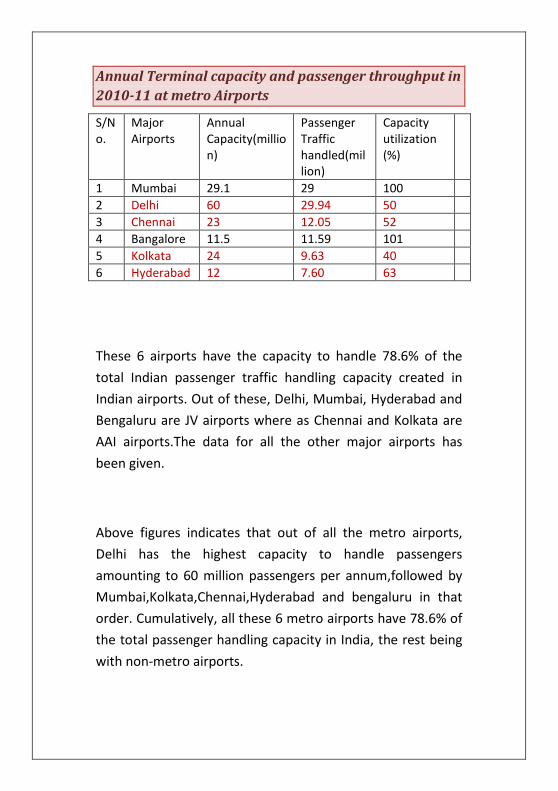
Annual Terminal capacity and passenger throughput in
2010-11 at metro Airports
S/N
o.
Major
Airports
Annual
Capacity(millio
n)
Passenger
Traffic
handled(mil
lion)
Capacity
utilization
(%)
1 Mumbai 29.1 29 100
2 Delhi 60 29.94 50
3 Chennai 23 12.05 52
4 Bangalore 11.5 11.59 101
5 Kolkata 24 9.63 40
6 Hyderabad 12 7.60 63
These 6 airports have the capacity to handle 78.6% of the
total Indian passenger traffic handling capacity created in
Indian airports. Out of these, Delhi, Mumbai, Hyderabad and
Bengaluru are JV airports where as Chennai and Kolkata are
AAI airports.The data for all the other major airports has
been given.
Above figures indicates that out of all the metro airports,
Delhi has the highest capacity to handle passengers
amounting to 60 million passengers per annum,followed by
Mumbai,Kolkata,Chennai,Hyderabad and bengaluru in that
order. Cumulatively, all these 6 metro airports have 78.6% of
the total passenger handling capacity in India, the rest being
with non-metro airports.
Above graph indicates that out of all the metro airports, Delhi has
the highest capacity to handle passengers per annum, followed by
Mumbai, Kolkata, Chennai, Hyderabad and Bengaluru in that order.
0102030405060
Annual capacity(in million)
Annual capacity(in
million)
05
1015202530
Passenger Traffic(in million)2010-11
Above graph indicates that out of all the metro airports, Delhi has
the highest capacity to handle passengers per annum, followed by
Mumbai, Kolkata, Chennai, Hyderabad and Bengaluru in that order.
Annual capacity(in million)
Annual capacity(in
The actual passenger handled at metro airports in 2010-11 can be
seen in above chart. The graph shows that the passengers handled
are the highest at Delhi airport followed by rest of the metro
cities.This amounts to 70% of the total passenger handled at Indian
airports. Also amongst Metro Airports, bulk of the passenger
traffic is on the Delhi-Mumbai route i.e approximately 41% of the
total passenger traffic across all Indian airports & 59% of the total
metro airports traffic.
Terminal Capacity Utilization at Metro Airports
Terminal capacity utilization which has been calculated by
dividing the passenger handled in a year by the capacity of
the particular report.
Capacity utilization at Mumbai and bengaluru airport is 100%
and 101% respectively, which means that the existing
capacity is under tremendous stress and the passenger traffic
to be handled is much beyond its capacity.
Terminal capacity utilization for all metro airports stood at
62.5% and for all Indian airports at 70.4% reflecting that
there is still potential for passenger traffic growth at the non-
metro airports for effective capacity utilization.
South Asia Top 10 Airlines Seat Capacity
Ranking Carrier Name Seats
1 Indigo 500580
2 Air India 442828
3 Jet Airways 413303
4 Spice Jet 375833
5 Pakistan Airlines 132880
6 Go Air 129240
7 Jet Lite 114448
8 Srilankan Airlines 95606
9 Air India Express 83538
10 Biman Bangladesh
Airlines
34032
020406080
100120
Capacity Utilisation(%)
Capacity Utilisation
Capacity Utilisation
South Asia Top 10 Reports
Ranking Carrier Name Seats
1 Delhi IGI Airport 919165
2 Mumbai Airport 831365
3 Chennai Airport 352124
4 Bangalore International Airport 332111
5 Dubai International Airport 309142
6 Kolkata Netaji Subhas Chandra Airport 278652
7 Hyderabad RGI Airport 252504
8 Colombo International Airport 187126
9 Kochi Airport 140679
10 Karachi International Airport 133442
Air India Business Overview:
Air India: The time has come to stop procrastinating and act. The final scene is near Air India has delivered a significant improvement in its
operational and financial performance in FY2013, partly due
to improved market dynamics following Kingfisher’s exit, but
also as a result of a serious and committed approach by the
management of Air India, new marketing initiatives and
measures adopted to rationalize its network.
But India's ageing flag carrier is still soaking up over a billion
dollars of India's precious budget each year – with no
prospect of a serious turnaround for the airline in its present
form.
Pricing discipline has been the most significant contributor to
the improved performance. And over the last 12 months Air
India’s domestic market share has increased from
approximately 14% to 20%. The carrier may even report a
small operating profit for the current financial year ending
31-Mar-2013 subject to the impact of the B787 grounding
and market conditions in 4QFY2013. However, the net result
will remain significantly in the red.
Domestic Air Traffic of last seven years ------ Specifically
Delhi & Mumbai
Domestic
Traffic Year
Passengers(Figures
in millions)
Share of Mumbai & Delhi in
traffic(in Percentage)
2006-07 70.62 40.6
2007-08 87.06 39.6
2008-09 77.30 39.3
2009-10 89.39 39.4
2010-11 105.52 38.5
2011-12 121.51 38
2012-13 116.27 37
Indian airports handle 14.1 million passengers in
August 2013------
Passenger traffic up 17.9% y-o-y
Indian airports witnessed a strong growth in
passenger traffic in August 2013. As per the data released by
Airports Authority of India (AAI), air passenger traffic rose by
17.9 per cent from 12 million in August 2012 to 14.1 million
in August 2013. This is the sharpest y-o-y growth recorded in
passenger traffic since July 2011.
In August 2013, domestic passenger traffic (which
accounts for 70-75 per cent of total air passenger traffic) rose
to 10.3 million from 8.7 million in August 2012. This
translates into a smart 19.2 per cent rise. All the six major
airports in India (Mumbai, Delhi, Chennai, Bangalore,
Kolkata and Hyderabad) reported a y-o-y increase in
domestic passenger traffic. Domestic passenger traffic at
Delhi airport, the busiest airport in India, grew by 19.7 per
cent to almost two million. Mumbai airport handled 1.9
million domestic passengers, 27 per cent higher than that in
the year-ago month. Domestic passenger traffic at Chennai,
Bangalore, Kolkata and Hyderabad airports increased in the
range of 12-21 per cent during the month.
Growth Projection for the 12th Five year Plan
Passengers/Freight 2011 2016-17 Average
Annual Rate
of Growth
Passenger(millions)
Domestic 106 209 12%
International 38 60 8%
Source: 12th
Five year Plan
Air-Rail Services in Foreign Countries
Brussels Airlines and Jet Airways join forces with Thalys to link
their networks to the centre of Paris, via Brussels Airport
This partnership marks a new stage in air-rail intermodality
for long-haul trips
.
As from 30 October 2011, passengers departing from Paris
will be able to travel with Thalys to Brussels Airport, the city’s
international flight hub; from there they will be able to
choose from numerous destinations offered by the two
partner airlines, Brussels Airlines and Jet Airways. A new
stage in air-rail intermodality has just been completed. It is
based on a completely new distribution system which makes
air and rail data compatible. It is now possible to book a
combined Thalys + Flight ticket between Paris and Kinshasa
with Brussels Airlines or Paris to Delhi with Jet Airways from
travel agencies or on the airlines’ websites.
Jet airways, India’s premier international airline has entered
into an arrangement with thalys high-speed rail service
between Brussels and Paris, for our first intermodal
codeshare.
Under codeshare, Jet airways will place its marketing code on
the thalys operated direct train service between the train
station at Brussels airport and Paris nord.
LufthansaAirRail: the perfect combination of train and Plane
Travel Connectivity from the centre of cologne, Dusseldorf or
Stuttgart on the ICE (Intercity Express) to Frankfurt Airport,
or in the opposite direction, and enjoy the comprehensive
benefits of Lufthansa Air Rail services. The perfectly timed
coordination of the trains with Lufthansa flights means that
transfer times between train and plane are minimal.
Departing from Dusseldorf central station you can arrive in
Frankfurt in only 72 minutes and form there take off to
anywhere in the world.
China Eastern Air-Rail Service: From Air to Ground
Travel conveniently from Shanghai Hongqiao International
Airport (SHA) to the centre of Hangzhou, Wuxi with CRH, and
enjoy the comprehensive benefits of China Eastern Air-Rail
service! The perfectly timed coordination of China’s high-
speed rail means that transfer times between train and plane
areminimal.
When you start your journey with China Eastern Air-Rail
Service, you check in for flight and railway journey
separately. At the International Arrivals of Hongqiao airport,
China Eastern team will be waiting to greet you and guide
you through the entire procedure to get on train. Please
don’t forget to bring your travelling license such as Passport,
ID card and related Exit-Entrance Permits.
AIR-RAIL Combined Time Table
Route Flight No. Train
No.
Departure
Time
Arrival
Time
Schedule
Shanghai-
Hangzhou
MU6201 G7317 1500 1545 Daily
Shanghai-
Wuxi
MU6101 G7156 1827 1915 Daily
China Eastern Airlines was one of the first airway companies
who have developed Air-Rail service and initiated more
than three routes from Korea and Japan to the Yangtze River
Delta territory of China.
The Yangtze River Delta, also called Chang Jiang Delta,
generally comprises the triangular-shaped territory of Wu-
speaking Shanghai, southern Jiangsu province and northern
Zhejiang province of China. The area lies at the heart of the
region traditionally called Jiangnan (literally, "south of the
Yangtze River"). The Yangtze River drains into the East China
Sea. The urban build-up in the area has given rise what may
be the largest concentration of adjacent metropolitan areas
in the world.
CONCLUSION
Indian Railways has monopoly in medium long distance
travelling passengers in India. But, when we take whole
transport industry, it faces stiff competition.
After travelling customer compares the experience with his
expectations & is either satisfied or dissatisfied .He shares his
experience with friends & family member that affect their
decision to travel with railway in future. His future decision
will be based on his experience in both pre-purchase stage as
well as service encounter stage. Word of mouth marketing
comes out after having experience of the service which is
considered as very effective marketing.
Air travel has become more affordable but airline service is
limited to metro cities in India. It is frequently used for long
distance travelling & in cases of limited time of travel. At
present there are 125 airports, including 11 international
airport.
Multi Modal Connectivity
Whoever travelled by Air, can easily understand the pain of
the reaching airport, whether you are talking about New
Delhi or Bangalore traveller facing the same issue. As the,
major airports in India are mostly located in the outskirts of
the city. This issue adversely affects the comparative
advantage in terms of saving times and also causing
inconvenience to the passengers. The Airports should be
connected by metros, expressways to the cities to get the full
advantage of air transportation by reducing the total travel
time, take example of New Delhi metro airport express.
Efficient mobility of people is one of the key factors for the
progress and prosperity of a society and a nation. Public
Transport services play a major role in reducing the poverty
and keeping deprivation at check in rural areas. Apart from
offering the rural population a viable and convenient way to
market their agricultural produce, It also enables them to
access other sources of income such as engagement in
informal services in nearby urban nodes and formal
employment in manufacturing, food processing, transport
and other industries.
The transport sector of India is facing several challenges
which can be taken as opportunities to overcome from them
and make India leader of this sector in the group of
developing countries. The challenges are,
• Congested and inefficient ports,
• Serve capacity constraints facing by railways,
• Airport infrastructure is strained,
• Hinterland connectivity by different modes of
transport
Way forward
• Expanding construction capacity- construction
industry already overstretched quality , price
affected
• Improving Contract Management – on average
publicly financed road construction contracts
suffering 35% cost overruns.
• Poor quality of designs and site investigations
• Land acquisition
• Tariff / Pricing policy
• Multi modal Connectivity – It’s very important, as it
work as backbone for the all major transportation
modes. It reduces total journey time, reduce
congestions.
• Based on research view, Railways should be more
emphasized on balancing traffic through the multi-
modal connectivity concept, which would be mutual
interest of Indian aviation and Indian Railways.
BIBLIOGRAPHY
Reports
Policy Paper on Civil Aviation: Department of Economic Affairs
Airports Authority of India & Ministry of Civil Aviation Report
Airport Privatization in India
Annual Reports
Airport Authority of India Annual Report
Ministry Civil Aviation(2007-09)
GMR Annual Report (2007-09)
Website Links
Delhi International Airport website.
Government of India Portal
MoCA(Ministry of Civil Aviation)
News Papers
Indian Express
http://www.indianexpress.com/
Economic Times
http://economictimes.indiatimes.com/
Business standard
http://business-standard.com
USEFUL LINKS
www.google.com
www.centreforaviation.com
www.pib.nic.in
www.aai.aero.com
www.apaoindia.com
www.ibef.org/industry/indian-aviation
www.fiaindia.in
www.dgca.nic.in/reports
www.railsafety.co.in
www.chinatourguide.net
www.civilaviation.gov.in
www.indianrailways.gov.in
www.airindia.com