Journal of Immunological Methods 317 (2006) 90–99www.elsevier.com/locate/jim
Research paper
Quantitative analysis of protein co-localization on B cellsopsonized with rituximab and complement using theImageStream multispectral imaging flow cytometer
Paul V. Beum a, Margaret A. Lindorfer a, Brian E. Hall b, Thaddeus C. George b,Keith Frost b, Philip J. Morrissey b, Ronald P. Taylor a,⁎
a Department of Biochemistry and Molecular Genetics, University of Virginia School of Medicine, Charlottesville, VA 22908, USAb Amnis Corporation, Seattle, WA 98121, USA
Received 7 June 2006; received in revised form 15 August 2006; accepted 11 September 2006Available online 10 October 2006
Abbreviations: AF, Alexa fluor; TDI, time delay integration;SBDS, similarity bright detail score; NHS, normal human serum;RTX, Rituximab; C3, complement component 3; CCD, charge-coupled device; PE, R-phycoerythrin.⁎ Corresponding author. Department of Biochemistry and Molecular
Genetics, University of Virginia Health Sciences Center, P.O. Box800733, Charlottesville, VA 22908-0733, USA. Tel.: +1 434 9242664; fax: +1 434 924 5069.
RTX is a chimeric human/mouse anti-CD20 mAbapproved by the FDA for the treatment of non-Hodgkin's lymphoma and rheumatoid arthritis(McLaughlin et al., 1998; Maloney, 1999; Edwardset al., 2004; Cohen et al., 2005). In vitro investigationsand analysis of blood samples from RTX-treated patientshave demonstrated that binding of RTX to CD20+ cellsin the presence of complement results in activation of the
91P.V. Beum et al. / Journal of Immunological Methods 317 (2006) 90–99
complement cascade, leading to covalent deposition offragments of complement component C3 on the cells(Walport, 2001; Kennedy et al., 2003). Fluorescencemicroscopy studies suggest that the deposited C3fragments (C3b, iC3b) are very closely associated withcell-bound RTX (Kennedy et al., 2003, 2004).
In order to study the C3 fragment-RTX interaction ingreater detail, Raji cells opsonized with fluorescently-labeledRTX in normal human serum (NHS) as a source ofcomplement were probed with fluorescently-labeledmAbs specific for RTX and C3b/iC3b, and then analyzedby digital imaging with the ImageStream imaging flowcytometer (George et al., 2004). The ImageStream issimilar to a standard flow cytometer in that thousands ofcells per sample that have been stained in suspension arehydrodynamically focused within a flow cuvette andtrans-illuminated along the collection axis by a bright fieldlight source and from the side by a 488-nm laser. How-ever, in the ImageStream, fluorescence, dark field scatter,and transmitted light are collected by an objective lens andrelayed to a spectral decomposition element, which di-vides the image into six spectral bands located side-by-side across a charge-coupled device (CCD) detector witha resolution of 0.25 μm2 per pixel. High sensitivity isachieved by operating the CCD in time delay integration(TDI) mode. TDI imaging is a method of electronicallypanning the detector to track objectmotion. TDI operationresults in signal collection times in the range of mil-liseconds, orders of magnitude longer than conventionalflow cytometry. The ImageStream has a fluorescencesensitivity comparable to that obtainable using a conven-tional flow cytometer (Ortyn et al., 2006). Moreover,because thousands of cells are analyzed in suspension,uncertainties and artifacts associated with fluorescencemicroscopy are avoided, and quantitative, statisticallysignificant results can be obtained.
In the present study, images acquired with theImageStream technology have been analyzed by anovel algorithm, the similarity bright detail score(SBDS), which is designed to quantitate the degree ofco-localization of two cell surface proteins. The resultsof this study strengthen and extend our earlier findings(Kennedy et al., 2003, 2004) of co-localization of RTXand C3 fragments and demonstrate the quantitativepower of imaging large numbers of cells in flow.
2. Materials and methods
2.1. Cell culture and reagents
Raji cells (American Type Culture Collection,Manasass, VA) were maintained as described (Kennedy
et al., 2003). RTX was purchased at the University ofVirginia hospital pharmacy. MAb 7C12, specific forC3b/iC3b, and mAb HB43, specific for the Fc region ofhuman IgG, have been described (Tosic et al., 1989;Kennedy et al., 2003, 2004). RTX was labeled withAlexafluor (AF) 488 (Molecular Probes, Eugene, OR)and mAbs HB43 and 7C12 were labeled with AF647 orR-phycoerythrin (PE, Prozyme, San Leandro, CA)according to the manufacturer's instructions. PE andbiotinylated anti-CD45 were obtained from Caltag(Burlingame, CA). AF488 maleimide and AF546streptavidin were obtained from Molecular Probes.
2.2. Opsonization, maleimide labeling, and probing
Raji cells (5×10⁷ cells/ml) were opsonized with10 μg/ml AF488 RTX or unlabeled RTX for 15 min at37 °C in either media, 25% normal human serum(NHS), NHS+10 mM EDTA, or in heat inactivated (HI)NHS (prepared by heating NHS at 56 °C for 30 min).The cells were washed three times with PBS, and thenprobed, in the presence of 2 mg/ml mouse IgG, witheither 10 μg/ml PE anti-CD45, PE mAb 7C12, AF647mAb 7C12 or PE mAb HB43 for 30 min at roomtemperature. Cells were washed twice more with PBSand fixed by resuspension in 1% paraformaldehyde. Insome experiments, cells were labeled with AF488maleimide after the opsonization and wash steps, beforeprobing. Labeling was performed using 10 μg/mlAF488 maleimide (prepared by dissolving 1 mgAF488 maleimide in 1 ml dimethylformamide, thendiluting 1/10 into PBS, and then diluting 1/10 into thelabeling reaction) for 15 min on ice. Cells were thenwashed three times with PBS and probed as describedabove.
2.3. Image acquisition and data compensation
Images were acquired on the Imagestream® imagingcytometer (Amnis Corp., Seattle, WA). At least 10,000images were collected for each sample. Debris waseliminated from the data set by setting a minimumobject area in channel 1 (laser scatter channel) of150 pixels, and approximately 50 mw of laser powerwas used to excite the fluorophores. The CCD camerawas set to 32 stages for scatter and 512 stages for theremaining 5 channels and run at a clock rate of 44 kHz.Cells were collected with the laser scatter image inchannel 1, the AF488 image in channel 3 (green), the PEimage in channel 4 (orange), and the bright field imagein channel 5 (white). In order to create data files for usein spectral compensation, images of unstained cells and
92 P.V. Beum et al. / Journal of Immunological Methods 317 (2006) 90–99
of cells stained with a single antibody/fluorophorecombination were acquired without brightfield illumi-nation. Post-acquisition spectral compensation and dataanalysis was performed using IDEAS® image analysissoftware package (Amnis Corp.).
The compensation process utilized single colorfluorophore control image files. The amount of spectralcrosstalk into adjacent channels was determined byplotting intensity for the specific signal channel and thecrosstalk channel and then a best-fit line was used todetermine the amount of spectral overlap from eachfluorescent marker into each channel. The values in thecompensation matrix were then applied to each pixel inthe image to create a data set that has each signal se-questered into its intended spectral channel. This processis performed transparently by the IDEAS software pack-age. The compensated imagerywas validated by verifyingthat the median fluorescent intensity of the unlabeled cellsin the crosstalk channel was similar to the median fluo-rescent intensity of the single color positive control in thesame crosstalk channel.
Aliquots of samples were also analyzed by fluores-cence microscopy, flow cytometry and scanning confo-cal microscopy. Fluorescence microscopy wasperformed under oil at high magnification (100×)using a BX40 fluorescent microscope (Olympus,Melville, NY). Images were captured with a digitalcamera and visualized with Magnafire analysis soft-ware. Flow cytometry was performed using a FACSca-libur cytometer (BD Biosciences, San Jose, CA) andCellQuest software (BD Biosciences). Mean fluores-cence intensities were converted to molecules ofequivalent soluble fluorochrome (MESF) using standardfluorescent beads (Spherotech, Libertyville, IL). Con-focal microscopy analysis was performed using a ZeissLSM 5 PASCAL laser scanning confocal microscope.
3. Results
3.1. Flow cytometry and fluorescence microscopyanalyses of co-localization
We have previously reported that in NHS, binding ofRTX to CD20 on B cells activates the complementcascade, resulting in covalent deposition of C3b/iC3b onthe cell surface, and we have used fluorescence mi-croscopy to demonstrate an apparent high degree of co-localization of cell-bound RTX and the deposited C3
fragments (Kennedy et al., 2003, 2004). We have nowinvestigated this co-localization in more detail with anovel quantitative methodology for assessing the co-localization of molecules, in this case, RTX, specific forCD20, and the deposited C3b/iC3b. This method, digitalimaging in a flow environment with the ImageStream,captures high resolution images much like a fluores-cence microscope or confocal microscope, but, as inflow cytometry, thousands of cells can be analyzed veryrapidly post-acquisition, thus providing for high statis-tical significance in the resulting data.
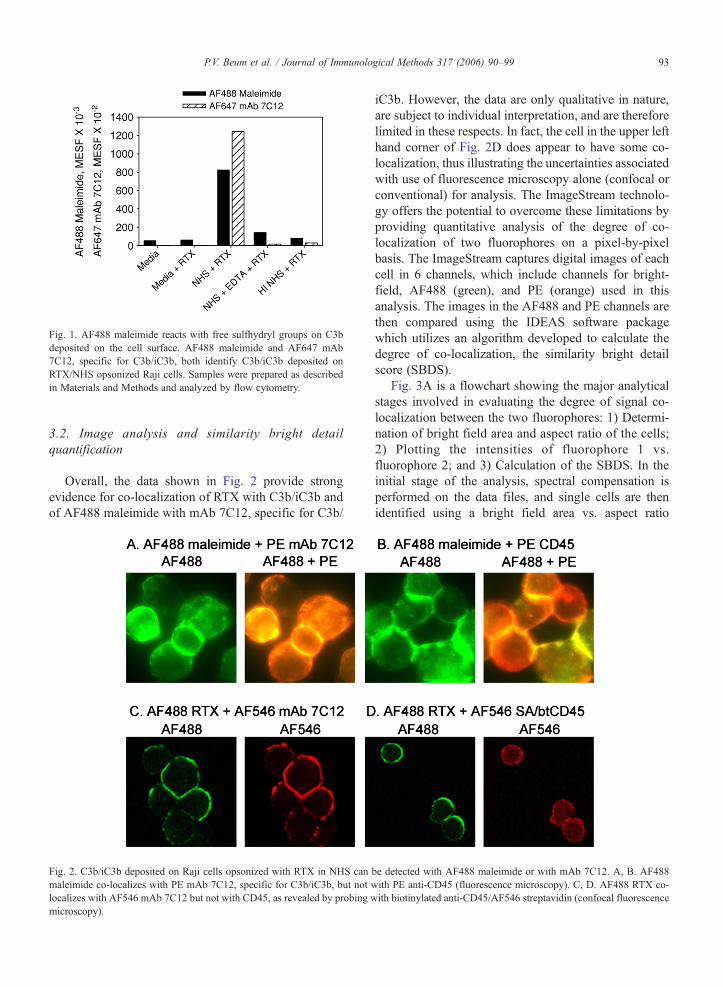
We first opsonized Raji cells with RTX (unlabeled orAF488-labeled) under conditions which either lead toC3 fragment deposition (NHS) or which preclude suchdeposition (media, NHS+EDTA, heat-inactivatedNHS). Covalent deposition of C3b introduces a freesulfhydryl group onto the cell surface (Shohet et al.,1991, 1993) which should react with maleimide. Wethen compared the ability of AF488 maleimide andAF647 mAb 7C12 to detect deposited C3b/iC3b. Afteropsonization, the cells were labeled with AF488maleimide and subsequently probed with AF647 mAb7C12, specific for C3b/iC3b. We have previouslydemonstrated that mAb 7C12 is a reliable marker forC3 fragment deposition (Tosic et al., 1989). The resultsin Fig. 1 demonstrate that cells opsonized with RTX+NHS have fluorescent intensities (AF647 mAb 7C12and AF488 maleimide) many times greater than cellsopsonized under conditions that do not allow forcomplement activation and subsequent C3b deposition.This finding validates AF488 maleimide as a reliableprobe for C3b deposition.
We next performed co-localization analysis on Rajicells using fluorescent microscopy and scanningconfocal microscopy, in order to provide a basis forevaluating the capabilities of the ImageStream. Weopsonized Raji cells with unlabeled RTX+NHS, thenreacted the cells with AF488 maleimide (to identifydeposited C3b/iC3b) and probed with PE mAb 7C12 (orwith PE anti-CD45 as a negative control). Alternatively,we opsonized with AF488 RTX+NHS and probed withPE mAb 7C12. Fluorescent micrographs in Fig. 2A, Bshow that AF488 maleimide co-localizes with PE mAb7C12, but does not co-localize with PE anti-CD45. Thisresult again validates the use of AF488 maleimide as analternative reagent to identify cell-bound C3b/iC3b.Fig. 2C, D show scanning confocal microscopy Zsections of cells opsonized with AF488 RTX+NHS andthen probed with AF546 mAb 7C12 or biotinylated anti-CD45/AF546 streptavidin. There is a high degree of co-localization of RTX with the anti-C3b/iC3b mAb butmuch less for RTX with anti-CD45.
Fig. 1. AF488 maleimide reacts with free sulfhydryl groups on C3bdeposited on the cell surface. AF488 maleimide and AF647 mAb7C12, specific for C3b/iC3b, both identify C3b/iC3b deposited onRTX/NHS opsonized Raji cells. Samples were prepared as describedin Materials and Methods and analyzed by flow cytometry.
93P.V. Beum et al. / Journal of Immunological Methods 317 (2006) 90–99
3.2. Image analysis and similarity bright detailquantification
Overall, the data shown in Fig. 2 provide strongevidence for co-localization of RTX with C3b/iC3b andof AF488 maleimide with mAb 7C12, specific for C3b/
Fig. 2. C3b/iC3b deposited on Raji cells opsonized with RTX in NHS canmaleimide co-localizes with PE mAb 7C12, specific for C3b/iC3b, but not wlocalizes with AF546 mAb 7C12 but not with CD45, as revealed by probing wmicroscopy).
iC3b. However, the data are only qualitative in nature,are subject to individual interpretation, and are thereforelimited in these respects. In fact, the cell in the upper lefthand corner of Fig. 2D does appear to have some co-localization, thus illustrating the uncertainties associatedwith use of fluorescence microscopy alone (confocal orconventional) for analysis. The ImageStream technolo-gy offers the potential to overcome these limitations byproviding quantitative analysis of the degree of co-localization of two fluorophores on a pixel-by-pixelbasis. The ImageStream captures digital images of eachcell in 6 channels, which include channels for bright-field, AF488 (green), and PE (orange) used in thisanalysis. The images in the AF488 and PE channels arethen compared using the IDEAS software packagewhich utilizes an algorithm developed to calculate thedegree of co-localization, the similarity bright detailscore (SBDS).
Fig. 3A is a flowchart showing the major analyticalstages involved in evaluating the degree of signal co-localization between the two fluorophores: 1) Determi-nation of bright field area and aspect ratio of the cells;2) Plotting the intensities of fluorophore 1 vs.fluorophore 2; and 3) Calculation of the SBDS. In theinitial stage of the analysis, spectral compensation isperformed on the data files, and single cells are thenidentified using a bright field area vs. aspect ratio
be detected with AF488 maleimide or with mAb 7C12. A, B. AF488ith PE anti-CD45 (fluorescence microscopy). C, D. AF488 RTX co-ith biotinylated anti-CD45/AF546 streptavidin (confocal fluorescence
Fig. 3. A. Flow chart showing the steps involved in calculation of Similarity Bright Detail Score, SBDS. B. Identification of single cell population.C. Dot plot of AF488 intensity versus PE intensity for the single cell population.
94 P.V. Beum et al. / Journal of Immunological Methods 317 (2006) 90–99
bivariate plot (Fig. 3B). Single Raji cells are then easilyidentified because their shape tends to be round, yield-ing aspect ratios approaching unity. Cells within thesingle cell region gate are displayed on a logarithmicplot of AF488 intensity vs. PE intensity (Fig. 3C), anddouble positive cells are identified and analyzed usingthe similarity bright detail analysis algorithm describedbelow. Similarity bright detail quantifies the degree ofsimilarity between any two channel images on a pixel-by-pixel and cell-by-cell basis. The SBDS is calculatedin a three-step process: 1) determination of the openingresidue image for each channel image; 2) calculation ofa non-mean normalized Pearson's correlation coeffi-cient; 3) log transformation of the correlation coefficientto give roughly Gaussian distributions, the mean ofwhich is the SBDS. Poorly co-localized events will haveSBDS of 1–2 (see below) and well co-localized eventswill have SBDS values of 3 or greater.
In most cases the vast majority of cells had intensitiesthat fit well within the dynamic range of the instrument.However, in order to insure that evaluation of saturatedpixels did not lead to artifacts, peak intensity featureswere set to exclude cells during analysis if individualpixels had intensities of 1024 or greater, which cor-respond to saturation at 10 bit resolution.
This process of analysis is illustrated in detail inFig. 4, which uses sample data obtained during a typicalco-localization analysis experiment. In order to enhancebright detail an image processing step (opening residue)is performed on the imagery first. An opening residueconsists of three image processing steps (Fig. 4A). Thefirst step is an erosion, the second is a dilation, and the
third, a subtraction. The erosion step replaces each greyscale pixel value in an image by the lowest grey scaleintensity value from among its neighboring pixels,which are defined as a region around the pixel of interesthaving a width of seven 0.5 μm pixels. The effect of theerosion is to completely erase any bright features in theimage which are narrower than 7 pixels in width, but toleave intact any bright feature with a width greater than7 pixels. These wider bright features are restored in thedilation step, which replaces the grey scale levels fromthe encoded image with the brightest value from thesame neighborhood of the eroded image. An erosionfollowed by the complementary dilation is referred to asan opening (Serra, 1982). The opened image is thensubtracted from the original image to generate theopening residue, which is an image containing only thebright detail features narrower than seven 0.5 μm pixels.This opening residue image is created for the twochannels to be compared, in this instance, channel 3(e.g. AF488, green) and channel 4 (e.g. PE, orange). Theeffects of these image processing steps are shown in anexample of cell imagery (Fig. 4A). A scatter plot of theactual pixel intensity values of the two images found inFig. 4A is shown in Fig. 4B. After the opening residuehas been applied, the correlation coefficient, r, is cal-culated using Eq. (1) which is a non-mean normalizedversion of the Pearson's correlation coefficient;
r ¼X
X � Y=MX
X 2 �X
Y 2 ð1Þ
where X and Y are the opening residue pixel intensityvalues of images in the two channels of interest (in this
95P.V. Beum et al. / Journal of Immunological Methods 317 (2006) 90–99
case, channel 3 is AF488 imagery, and channel 4 is PEimagery) and the sums are taken over pixels for whicheither X or Y (or both) is greater than a threshold chosento exclude background noise. The Pearson's correlationcoefficient, r, is subjected to a logarithmic transforma-tion to increase the dynamic range of the function. Thelog transformation to derive the SBDS values is given inEq. (2);
SBDS ¼ ln½ð1þ rÞ=ð1−rÞ� ð2Þ
The SBDS is calculated for each of ∼10,000 cellsper data file and averaged, thus allowing for a rigorousand statistically significant analysis of each cell popu-lation. Fig. 4C shows examples of SBDS distributionsfor cell populations with low, high or intermediatesimilarity.
3.3. SBDS calibration
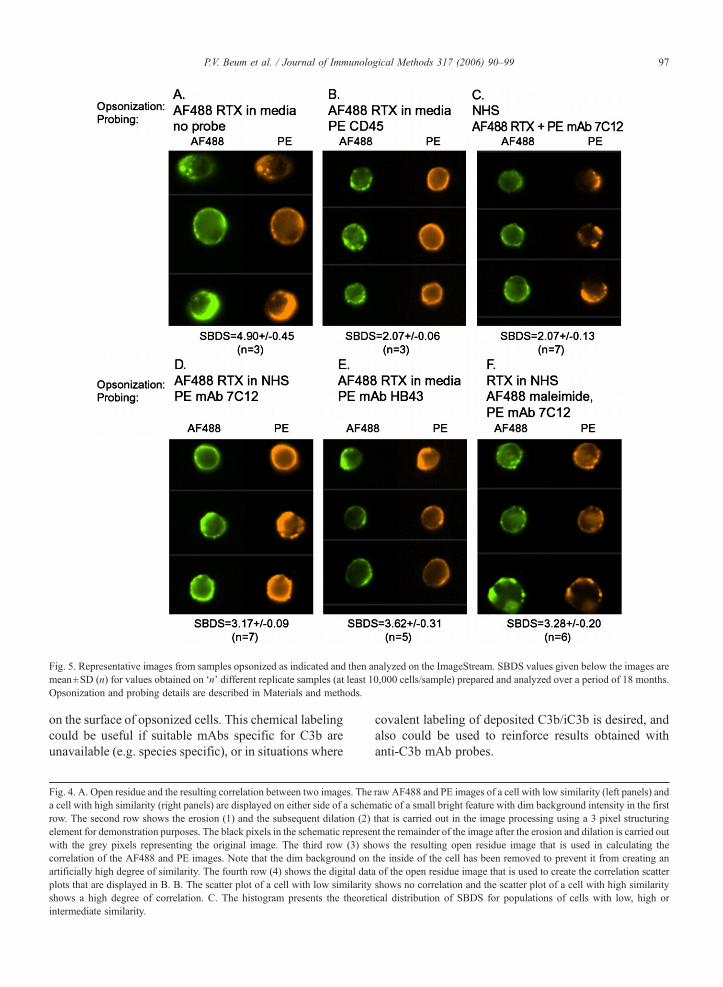
As a first step in applying the SBDS algorithm toexperimental data, we explored the potential range ofvalues for the SBDS in different data sets. To assess thelower limit, Raji cells were opsonized with AF488RTX, and the SBDS for the AF488 channel image(channel 3) and the laser scatter channel image (channel1) was calculated. Here the AF488 signal results fromthe cell surface staining and the scatter image arisesfrom cytoplasmic and nuclear texture and granularity.This comparison gave a SBDS of 1.39±0.08 (n=4experiments), and is considered an approximate lowerlimit defined by the algorithm. To determine an upperlimit, images that were identical between the AF488channel and the PE channel were generated. For thispurpose, uncompensated single color control files wereevaluated. With no spectral compensation applied tocells labeled with only AF488 RTX, the image in thePE channel (channel 4) would be identical to the AF488channel (channel 3) because it results from only theAF488 spillover into the PE channel. This gave a SBDSof 4.90±0.45 (n=3 experiments) (Fig. 5A) and is con-sidered the upper limit attainable. It should be notedthat the SBDS values are natural logarithms, and thusthe difference between SBDS values of 1 and 5 re-presents greater than a 50-fold difference betweenpoorly co-localized samples and highly co-localizedsamples.
3.4. Application of SBDS to RTX and C3b co-localization
We examined Raji cells probed with AF488 RTXand PE anti-CD45 as an example of two signals
expected to have nonspecific overlap (Fig. 5B). Theseimages allow for a qualitative inspection of the relativedegree of co-localization of the AF488 and PEfluorophores and suggest that the two probes are notco-localized in this sample. Indeed, use of the SBDSalgorithm in three separate experiments (N10,000 cellsper experiment) yielded an SBDS of 2.07±0.06,consistent with nonspecific overlap. The SBDS valuespresented in Fig. 5 represent the means of replicatesamples from 3–7 individual experiments, and thus thestandard deviations account for day-to-day variabilityin experimental results. For example, Raji cellsincubated with NHS alone and, after a wash, probedwith AF488 RTX and PE mAb 7C12 gave an SBDS of2.07±0.13 (Fig. 5C). This result is consistent with ourprevious observation that opsonization of cells withNHS prior to reaction with RTX leads to very little co-localization of RTX and C3b/iC3b (Kennedy et al.,2003). In contrast, opsonization of Raji cells withAF488 RTX in NHS, followed by probing with PEmAb 7C12, yielded a SBDS value of 3.17±0.09 (n=7experiments), representing a high degree of co-localization of the two fluorophores (Fig. 5D), consis-tent with deposition of C3b on or very near to cell-bound RTX.
In a positive control for co-localization, we foundthat opsonization of Raji cells with AF488 RTX inmedia, followed by probing with PE mAb HB43,specific for the Fc region of human IgG, yielded aSBDS value of 3.62±0.31 which was the highestSBDS among the samples analyzed (Fig. 5E). Thisfinding is not unexpected, since mAb HB43 binds toRTX and thus close juxtaposition is to be expected forthe AF488 and PE fluorophores in this sample.Opsonization of Raji cells with AF488 RTX in NHSinstead of in media, followed by probing with PE mAbHB43, yielded a slightly lower SBDS value of 3.36±0.38, n=6 experiments (not shown). This slightdecrease may be explained based on the ability of mAbHB43 to detect the small amounts of serum IgG whichbind nonspecifically to the Raji cells duringopsonization.
Finally, we performed the SBDS analysis on Rajicells which were opsonized with NHS and unlabeledRTX, reacted with AF488 maleimide, and then probedwith PE mAb 7C12 to determine the ability ofmaleimide to act as an alternative, independent meansof visualizing C3b/iC3b on the cell surface. Raji cellstreated in this manner yielded a SBDS value of 3.28±0.20, showing strong co-localization of the twofluorophores (Fig. 5F). By comparison, a SBDS valueof 2.05±0.16 (n=6) was obtained for Raji cells
96 P.V. Beum et al. / Journal of Immunological Methods 317 (2006) 90–99
opsonized with unlabeled RTX in NHS, reacted withAF488 maleimide, and then probed with PE anti-CD45(not shown). These quantitative analyses of the degree
of co-localization, which were qualitatively examined inFig. 2A, establish that fluorescently-labeled maleimidecan be used as a covalent marker to localize C3b/iC3b
Fig. 5. Representative images from samples opsonized as indicated and then analyzed on the ImageStream. SBDS values given below the images aremean±SD (n) for values obtained on ‘n’ different replicate samples (at least 10,000 cells/sample) prepared and analyzed over a period of 18 months.Opsonization and probing details are described in Materials and methods.
97P.V. Beum et al. / Journal of Immunological Methods 317 (2006) 90–99
on the surface of opsonized cells. This chemical labelingcould be useful if suitable mAbs specific for C3b areunavailable (e.g. species specific), or in situations where
Fig. 4. A. Open residue and the resulting correlation between two images. Thea cell with high similarity (right panels) are displayed on either side of a schemrow. The second row shows the erosion (1) and the subsequent dilation (2)element for demonstration purposes. The black pixels in the schematic represewith the grey pixels representing the original image. The third row (3) shcorrelation of the AF488 and PE images. Note that the dim background onartificially high degree of similarity. The fourth row (4) shows the digital datplots that are displayed in B. B. The scatter plot of a cell with low similarityshows a high degree of correlation. C. The histogram presents the theoretintermediate similarity.
covalent labeling of deposited C3b/iC3b is desired, andalso could be used to reinforce results obtained withanti-C3b mAb probes.
raw AF488 and PE images of a cell with low similarity (left panels) andatic of a small bright feature with dim background intensity in the firstthat is carried out in the image processing using a 3 pixel structuringnt the remainder of the image after the erosion and dilation is carried outows the resulting open residue image that is used in calculating thethe inside of the cell has been removed to prevent it from creating ana of the open residue image that is used to create the correlation scattershows no correlation and the scatter plot of a cell with high similarityical distribution of SBDS for populations of cells with low, high or
98 P.V. Beum et al. / Journal of Immunological Methods 317 (2006) 90–99
4. Discussion
A method is described for quantitation of protein co-localization in cells using the ImageStream imagingflow cytometer. This method takes advantage of the factthat in the six optical channels of the CCD camera in theImageStream, the pixels are in spatial registry whichallows pixel intensities to be compared betweenchannels with the confidence that they represent theidentical area of the cellular image. Here we utilized thisfeature to investigate the co-localization of proteins oncells. The experimental system chosen was the estab-lished system of complement fixation by RTX bound toCD20 on the cell surface of Raji cells. Imagery wasgenerated via conventional means (fluorescence andconfocal microscopy, Fig. 2) that indicated a co-localization phenomenon, but that methodology suffersfrom low throughput and difficulty in quantifying trendsin large populations of cells. With the ImageStreamimaging cytometer, images of 10,000 cells can beacquired in a few minutes which overcomes thetraditional limitations of manual microscopy. The resultsshown in Fig. 5 demonstrate the utility of the Image-Stream technology in concert with SBDS for quantita-tive analysis of co-localizing signals in a complexbiological system.
In order to analyze the cellular imagery acquired bythe ImageStream, an image processing step (Figs. 3, 4)was incorporated in order to enhance the small brightdetail of the cells which is characteristic of a plasmamembrane co-localization event. Preliminary workwithout incorporating this image processing stepresulted in insignificant differences due to the stainingbackground of the cell (not shown). The opening residuestep and subsequent subtraction that was developedutilizes an orthogonal 7-pixel structuring element. Thisresults in the elimination of bright staining of an areagreater than 7 pixels (3.5 μm) and also eliminates dimbackground staining. The pixel intensities for the twochannels for each cell image are then correlated usingthe non-mean normalized Pearson's correlation coeffi-cient (Eq. (1)). The calculated correlation coefficient isthen log transformed (Eq. (2)) to provide the SBDS foreach cell. These values can be averaged and statisticalanalysis performed between experimental groups toprovide a quantitative statistical assessment of differ-ences between groups. The use of this analyticalmethodology in the experimental groups describedherein results in a distribution of resultant values thatcorrelate well with the expected co-localization. In fact,this methodology allows the determination that mal-eimide specifically co-localizes to C3b covalently
attached to RTX, and justifies the use of maleimide asa unique chemical marker for C3b in this system(Figs. 1, 2, and 3). Also of interest is the observation thatthe SBDS can reflect situations where experimentalconditions decrease specific co-localization. For in-stance, AF488 RTX labeled Raji cells incubated with orwithout NHS and then probed with PE anti-huIgG mAbyield SBDS of 3.36±0.38 and 3.62±0.31, respectively.This likely indicates that weak/non-specific binding ofserum IgG to the cell membrane is not insignificant andcan be demonstrated with this method.
The ImageStream captures up to four fluorescentimages from each cell (in addition to bright field imageryand dark field scatter), so additional markers could beused to provide fluorescent imagery in all four channelsto allow amore complex set of analyses than is presentedhere. This analytical method may find additional appli-cations for analyses of proteins co-localized in lipid rafts,caps or immunological synapses, and may also be usedto determine sub-cellular co-localization of proteins inendosomes, lysosomes or other cellular organelles. Amodified version of the SBDS has been used inquantitation of NF-kB translocation from the cytoplasmto the nucleus and could be used for any translocationevent where a signal sequestered in one compartment ofthe cell translocates to any other fluorescently labeledelement or structure (Arechiga et al., 2005; George et al.,2006). Quantification of co-localization may also findmany applications in the determination of the mecha-nism of action of immunotherapeutic mAbs, either ap-proved for use or under investigation.
Acknowledgements
PVB was supported in part with a postdoctoralfellowship from the University of Virginia NIH TrainingGrant in Immunology. We gratefully acknowledgesupport from the University of Virginia Cancer CenterSupport Grant. Development of ImageStream® tech-nology was partially supported by NIH grants 9 R44CA01798-02 and 1 R43 GM58956-01.
Cohen, S.B., Greenwald, M., Dougados, M.R., Emery, P., Furie, R.,Shaw, T.M., Totoritis, M.C., 2005. Efficacy and safety ofRituximab in active RA patients who experienced an inadequateresponse to one or more anti-TNFα therapies (REFLEX study).Arthritis Rheum. 52, S677.
99P.V. Beum et al. / Journal of Immunological Methods 317 (2006) 90–99
Edwards, J.C.W., Szczepanski, L., Szechinski, J., Filipowicz-Sosnowska, A., Emery, P., Close, D.R., Stevens, R.M., Shaw, T.,2004. Efficacy of B-cell-targeted therapy with Rituximab inpatients with rheumatoid arthritis. N. Engl. J. Med. 350, 2572.
George, T.C., Basiji, D.A., Hall, B.E., Lynch, D.H., Ortyn, W.E.,Perry, D.J., Seo, M.J., Zimmerman, C.A., Morrissey, P.J., 2004.Distinguishing modes of cell death using the ImageStreammultispectral imaging flow cytometer. Cytometry 59A, 237.
George, T.C., Fanning, S.L., Fitzgeral-Bocarsly, P., Medeiros, R.B.,Highfill, S., Shimizu, Y., Hall, B.E., Frost, K., Basiji, D., Ortyn,W.E., Morrissey, P.J., Lynch, D.H., 2006. Quantitative measurementof nuclear translocation events using similarity analysis of multispec-tral cellular images obtained in flow. J. Immunol. Methods 311, 117.
Kennedy,A.D., Solga,M.D., Schuman, T.A., Chi, A.W., Lindorfer,M.A.,Sutherland, W.M., Foley, P.L., Taylor, R.P., 2003. An anti-C3b(i)mAb enhances complement activation, C3b(i) deposition, and killingof CD20+ cells by Rituximab. Blood 101, 1071.
Kennedy, A.D., Beum, P.V., Solga, M.D., DiLillo, D.J., Lindorfer, M.A.,Hess, C.E., Densmore, J.J., Williams, M.E., Taylor, R.P., 2004.Rituximab infusion promotes rapid complement depletion and acuteCD20 loss in chronic lymphocytic leukemia. J. Immunol. 172, 3280.
Maloney, D.G., 1999. Preclinical and phase I and II trials of Rituximab.Semin. Oncol. 26, 74.
McLaughlin, P., Grillo-Lopez, A.J., Link, B.K., Levy, R., Czuczman,M.S., Williams, M.E., Heyman, M.R., Bence-Bruckler, I., White,C.A., Cabanillas, F., Jain, V., Ho, A.D., Lister, J., Wey, K., Shen,D., Dallaire, B.K., 1998. Rituximab chimeric anti-CD20 mono-clonal antibody therapy for relapsed indolent lymphoma: half ofpatients respond to a four-dose treatment program. J. Clin. Oncol.16, 2825.
Ortyn, W.E., Hall, B.E., George, T.C., Frost, K., Basiji, D.A., Perry, D.J.,Zimmerman, C.A., Coder, D., Morrissey, P.J., 2006. Sensitivitymeasurement and compensation in spectral imaging. Cytometry, PartA 69A, 852.
Serra, J., 1982. Image Analysis and Mathematical Morphology.Academic Press, London, p. 34.
Shohet, J., Bergamaschini, L., Davis, A., Caroll, M., 1991.Localization of the human complement C3 binding site on theIgG heavy chain. J. Biol. Chem. 266, 18520.
Shohet, J.M., Pemberton, P., Carroll, M.C., 1993. Identification of amajor binding site for complement C3 on the IgG1 heavy chain.J. Biol. Chem. 268, 5866.
Tosic, L., Sutherland, W.M., Kurek, J., Edberg, J.C., Taylor, R.P.,1989. Preparation of monoclonal antibodies to C3b by immuni-zation with C3b(i)-sepharose. J. Immunol. Methods 120, 241.
Walport, M.J., 2001. Complement. N. Engl. J. Med. 344, 1058.