27
M E T A L S Research and Consulting MetalsPlus Sample Research Project Slides
M E T A L SResearch and Consulting
MetalsPlus
Sample Research Project Slides
M E T A L SResearch and Consulting
Database Profile of Major Metals Users
M E T A L SResearch and Consulting
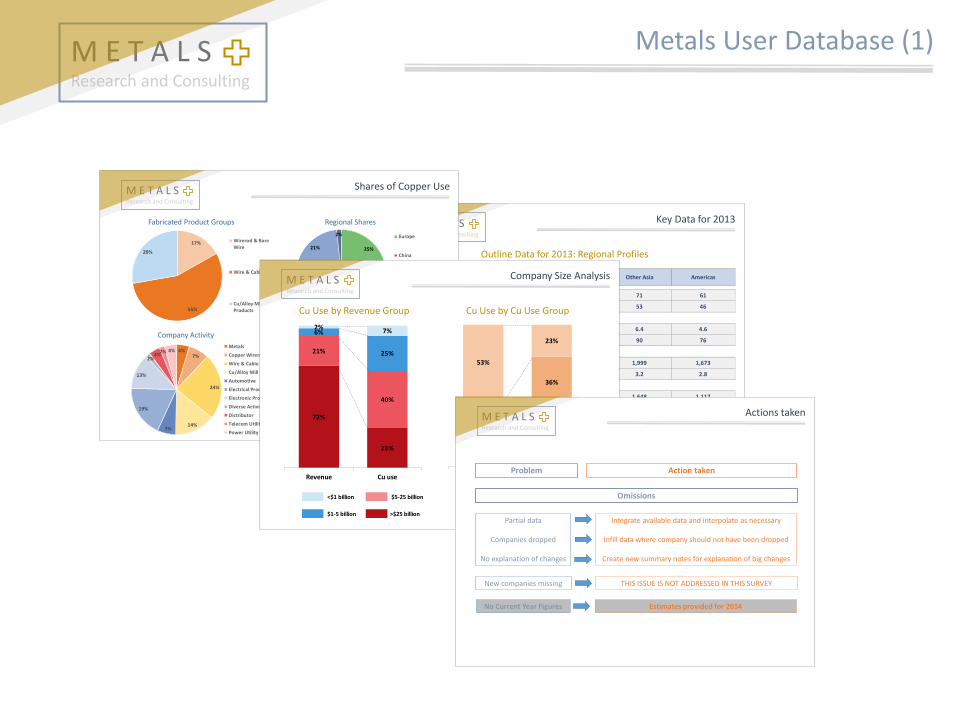
Metals User Database (1)
M E T A L SResearch and Consulting
Key Data for 2013
Outline Data for 2013: Regional Profiles
Europe & Africa China Other Asia Americas
Number of Companies 51 36 71 61
Companies with Financials 38 18 53 46
Copper Use (Mt) 5.2 6.6 6.4 4.6
Average Cu Use (kt) 103 185 90 76
Net Sales ($ billion) 1,771 141 1,999 1,673
Cu kg per $ million 3.0 47.2 3.2 2.8
Cost of Sales 1,413 123 1,648 1,117
Cu % of Cost of Sales 2.7% 39.5% 2.8% 3.0%
Operating Profit 114 7 127 228
Ratio Cu Value / Op. Profit 33.6% 738.8% 37.0% 14.8%
M E T A L SResearch and Consulting
17%
55%
28%
Wirerod & BareWire
Wire & Cable
Cu/Alloy MillProducts
25%
32%
20%
21%
2% Europe
China
Other Asia
North America
Latin America
4%7%
24%
14%7%
19%
13%
2%4%
2% 4%Metals
Copper Wirerod
Wire & Cable
Cu/Alloy Mill
Automotive
Electrical Products
Electronic Products
Diverse Activity
Distributor
Telecom Utility
Power Utility
23%
36%
32%
9% <75 kt Cu
75-200 kt Cu
200-500 kt Cu
Over 500 kt Cu
Shares of Copper Use
Fabricated Product Groups Regional Shares
Company Activity Company Copper Use
M E T A L SResearch and Consulting
Company Size Analysis
Cu Use by Revenue Group Cu Use by Cu Use Group
<$1 billion $5-25 billion
$1-5 billion >$25 billion
<75 kt 200-500 kt
75-200 kt >500 kt
72%
28%
21%
40%
6%
25%
2%7%
0%
10%
20%
30%
40%
50%
60%
70%
80%
90%
100%
Revenue Cu use
0%9%3%
32%44%
36%
53%
23%
0%
10%
20%
30%
40%
50%
60%
70%
80%
90%
100%
Revenue Cu use
M E T A L SResearch and Consulting
Actions taken
Problem Action taken
Partial data
Companies dropped
No explanation of changes
Integrate available data and interpolate as necessary
Infill data where company should not have been dropped
Create new summary notes for explanation of big changes
Omissions
New companies missing THIS ISSUE IS NOT ADDRESSED IN THIS SURVEY
No Current Year Figures Estimates provided for 2014
M E T A L SResearch and Consulting
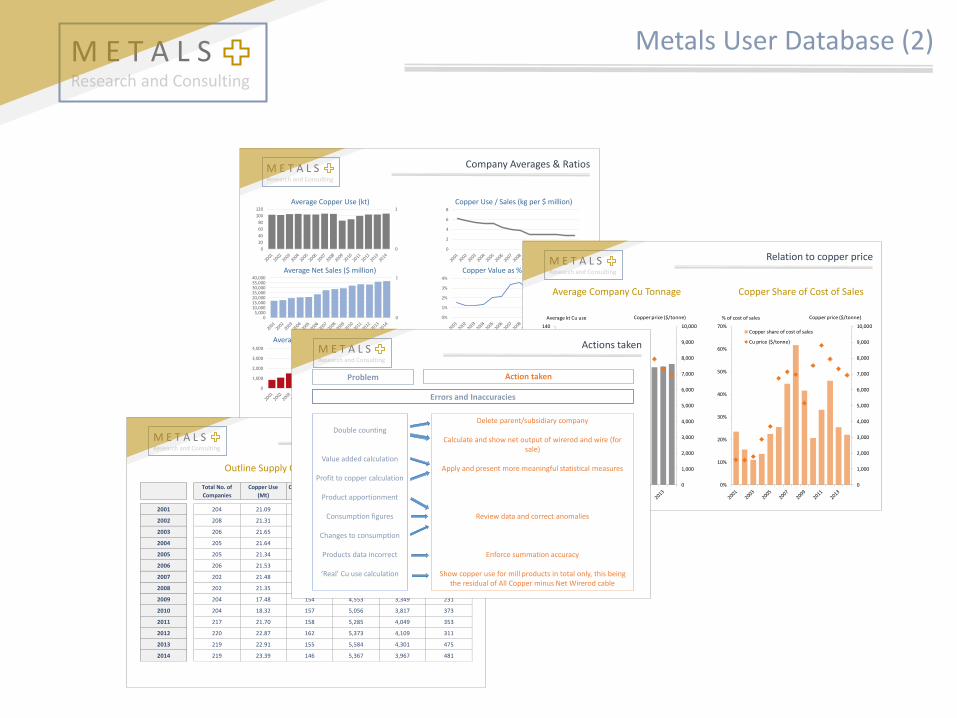
Metals User Database (2)
M E T A L SResearch and Consulting
Key data: All companies
Outline Supply Chain Database Figures
Total No. of
Companies
Copper Use
(Mt)
Companies with
Financials
Net Sales
($ bn)
Cost of Sales
($ bn)
Operating Profit
($ bn)
2001 204 21.09 179 3,044 2,260 147
2002 208 21.31 181 3,198 2,343 188
2003 206 21.65 177 3,482 2,510 264
2004 205 21.64 187 3,812 2,805 261
2005 205 21.34 185 3,798 2,759 249
2006 206 21.53 177 4,165 3,109 262
2007 202 21.48 172 4,742 3,750 278
2008 202 21.35 173 4,949 3,678 212
2009 204 17.48 154 4,553 3,349 231
2010 204 18.32 157 5,056 3,817 373
2011 217 21.70 158 5,285 4,049 353
2012 220 22.87 162 5,373 4,109 311
2013 219 22.91 155 5,584 4,301 475
2014 219 23.39 146 5,367 3,967 481
M E T A L SResearch and Consulting
0
1
0
20
40
60
80
100
120
0
1
05,000
10,00015,00020,00025,00030,00035,00040,000
0
1
0
1,000
2,000
3,000
4,000
0
2
4
6
8
0%
1%
2%
3%
4%
0%
20%
40%
60%
80%
Company Averages & Ratios
Copper Use / Sales (kg per $ million)
Copper Value as % Cost of Sales
Ratio Copper Value / Operating Profit
Average Copper Use (kt)
Average Net Sales ($ million)
Average Operating Profit ($ million)
M E T A L SResearch and Consulting
Relation to copper price
Average Company Cu Tonnage Copper Share of Cost of Sales
0
1,000
2,000
3,000
4,000
5,000
6,000
7,000
8,000
9,000
10,000
0%
10%
20%
30%
40%
50%
60%
70%Copper share of cost of sales
Cu price ($/tonne)
Copper price ($/tonne)% of cost of sales
0
1,000
2,000
3,000
4,000
5,000
6,000
7,000
8,000
9,000
10,000
0
20
40
60
80
100
120
140Average kt Cu use
Cu price ($/tonne)
Copper price ($/tonne)Average kt Cu use
M E T A L SResearch and Consulting
Actions taken
Problem Action taken
Errors and Inaccuracies
Double counting
Value added calculation
Profit to copper calculation
Product apportionment
Consumption figures
Changes to consumption
Products data incorrect
‘Real’ Cu use calculation
Delete parent/subsidiary company
Calculate and show net output of wirerod and wire (for sale)
Apply and present more meaningful statistical measures
Review data and correct anomalies
Enforce summation accuracy
Show copper use for mill products in total only, this being the residual of All Copper minus Net Wirerod cable
M E T A L SResearch and Consulting
Transformers
M E T A L SResearch and Consulting
Transformers (1)
M E T A L SResearch and Consulting
Global Market for Transformers
Market Size in 2014 by Power, Number of Units and Value
Note: Market value estimates are based on manufacturers’ selling prices
0.25
0.40
0.80
1.60
10
40
150
600
Total 0.283 2,532 100.00% 8,940 13.3 33,558
Distribution 0.117 1,039 99.03% 8,878 18.4 19,077
Power 24.149 1,493 0.97% 62 9.7 14,481
Average
$/kVA
Value
Small Distribution 0.005 0.20 0.05 0.02 135 72.4% 6,476 28.5 3,846
Total
GVAUnits %
Units
('000)
Rating (MVA) Units Sales
($ mn)
Medium Distribution 0.20 0.63 0.29 600 22.9%
Min Max 'Typical' Average
Large Distribution 0.63 2.50 0.85 304
2,047 18.3 10,981
4.0% 355 14.0 4,250
0.04% 4Large Power 60 1,200 141 500
58Medium Power 2.5 60 17.0 993 0.7% 10.2 10,132
8.7 4,349
M E T A L SResearch and Consulting
Transformer Market in 2014
Share of GVA Share by Number of Units
5 - 200 kVA 200 - 630 kVA 630 - 2,500 kVA
2.5 - 60 MVA 60 - 1,200 MVA
M E T A L SResearch and Consulting
Types & Applications Trend
Network and Industrial Applications Shares Transformer Type Trend
Type and Appplication Groupings (GVA)
04-14
Network Power 725 823 922 1,042 1,151 1,056 1,157 1,267 1,306 1,334 1,390 6.3%
Network Distribution 452 453 503 548 583 559 603 651 653 669 702 4.0%
Industrial Power 59 64 71 80 87 81 87 95 97 99 103 5.3%
Industrial Distribution 226 227 250 273 291 277 292 313 312 321 337 3.6%
Total 1,463 1,568 1,746 1,942 2,112 1,973 2,139 2,326 2,368 2,423 2,532 5.2%
Liquid Filled Power 777 880 984 1,112 1,228 1,127 1,234 1,351 1,392 1,421 1,481 6.2%
Liquid Filled Distribution 607 607 676 739 786 755 817 880 880 903 945 4.0%
Dry Type Power 7 8 9 10 11 10 10 11 11 12 12 4.5%
Dry Type Distribution 72 73 77 81 88 81 78 84 85 88 93 2.0%
2004 2005 2006 2007 2008 2009 2010 2011 2012 2013 2014CAGR
M E T A L SResearch and Consulting
A Market Data Sheet
Transformer Market 2004 to 2014 By Descriptive Parameter
CAGR CAGR
04-14 04-14
Volume (GVA) 1,463 1,973 2,532 5.2% By Application
Network 1,177 1,615 2,091 5.5%
By Region Industrial 286 358 440 3.9%
Europe 337 465 631 6.4%
Asia 691 1,009 1,436 7.0%
North America 373 416 359 -1.0% No of Units ('000) 6,838 8,142 8,940 2.3%
Latin America 61 82 106 4.8%
By Type
By Power Rating Power 37 47 62 5.0%
5 - 200 kVA 96 115 135 2.9% Distribution 6,802 8,095 8,878 2.3%
200 - 630 kVA 382 478 600 4.1%
630 kVA - 2.5 MVA 200 243 304 3.8%
2.5 - 60 MVA 532 745 993 5.9% Value (US$ Bn) 17,508 26,435 33,558 6.4%
60-1,200 MVA 252 391 500 6.8%
By Type
By Design Power 6,554 11,000 14,481 7.9%
Liquid Filled 1,384 1,882 2,426 5.3% Distribution 10,953 15,435 19,077 5.3%
Dry Type 79 91 105 2.3%
20142004 2009 2014 2004 2009
M E T A L SResearch and Consulting
Transformers in the Electricity Grid
Voltage steps to consumer each require a transformer
Source: UK National Grid
M E T A L SResearch and Consulting
…. and Where is the Copper?
Part Cross Section of a Very Large Transformer: Copper is in the Windings
A transformer can contain a very few kilograms to around 100 tonnes of copper in its windings
Source: Siemens
M E T A L SResearch and Consulting
Transformers (2)
M E T A L SResearch and Consulting
Generator to Electricity Consumer
How much transformer capacity is needed, and used?
Electricity Generation and Consumption Average Transformer Links Generator to Customer (3)
Electricity Consumption (TWh) 20,743 Total Transformer Links 4.25
Generating Capacity (GVA) 5,764 Power Transformers 2.50
Notional Generating Capacity (TWh) (1) 50,489 Distribution Transformers 1.75
Electricity Generated (TWh) 22,679
Calculated Loading % (2) 44.9% Notional TWh Passing Through Transformers and Capacity (1)
All Transformers (TWh) 96,385
Stock of Transformers in Place (GVA) Power Transformers (TWh) 56,697
Total GVA 40,371 Distriibution Transformers (TWh) 39,688
Power Transformers GVA 25,729
Distribution Transformers GVA 14,643 Notional Transformer Capacity (TWh) 353,653
Power Transformers (TWh) 225,384
Stock of Transformers in Place ('000 Units) Distribution Transformers (TWh) 128,269
Total Units ('000) 100,515
Power Transformers ('000) 1,054 Power Transformer Load Adjustor (4) 98.0%
Distribution Transformers ('000) 99,461 Distribution Transformer Adjustor (4) 96.0%
Average Transformer Size Notional Transformer Loading (2)
Average Power Rating (MVA) 0.40 Transformer Average 27.3%
Average Power Transformer (MVA) 19.40 Power Transformers 24.7%
Average Distribbution Transformer (MVA) 0.14 Distribution Transformers 29.1%
Global Requirement for Transformers and Match to the Transformer Fleet in 2014
Notes: (1) Generator and transformer notional capacity is calculated assuming full loading constantly throughout the year, not taking into account Power Factor, Harmonic or other effects limiting real-world throughput, (2) Generator and transformer loading is calculated dividing throughput by notional capacity, (3) The average number of transformer links between generator and electricity customer is estimated, and intended to represent global averages, (4) Transformer load adjustors reflect a reduction in throughput resulting from losses in the network before the transformer is reached.
Conclusion: Calculated loadings of transformers of 24.7% for power and 29.1% for distribution transformers match industry estimates.
M E T A L SResearch and Consulting
Alternative Energy Scenarios
“Jazz” and “Symphony” paths of the World Energy Council
The World Energy Council has looked at two verydifferent energy scenarios to 2050, which it labels“Jazz” and “Symphony”, with the main assumptions asfollows
Jazz: A world where there is a consumer focus onachieving energy access, affordability, and quality ofsupply with the use of best available energy sources
Symphony: A world where there is a voter consensuson driving environmental sustainability and energysecurity through corresponding practices and policies
Jazz is the higher wealth scenario, but one where thepolicy drive to create a sustainable energy future iscomparatively weak
Interestingly, while the lower wealth “Symphony”scenario shows smaller electricity increments it shows arise in its share of total energy, with an electricityinfrastructure very different from that we see today
“Jazz” & “Symphony”: Two Energy Scenarios to 2050 (WEC)
Source: “World Energy Scenarios: Composing Energy Futures to 2050”, World Energy Council 2013
M E T A L SResearch and Consulting
The Smart Grid
Means different things to different people
Source: Utility Products .Com
A Smart Grid Schematic Whatever the future energy scenario, it isagreed that the electricity network willbecome both larger and smarter
The ‘Smart Grid’, has no precisedefinition, but it is likely to:
• integrate sources of distributedgeneration, based on renewables
• link regional and national grids
• allow two-way flow of electricity
• improve overall network efficiency
• increase system security, avoidpremature equipment ageing andcatastrophic failure
All of this places specific demands ontransformer construction (reviewed inthe next Section), especially if there isstill no effective means of energy storage
It also means more information flowwithin the network, where transformerswill become more critical nodes
In the past transformers were items ofpassive equipment. In the future they willplay an active role in network control
M E T A L SResearch and Consulting
Aspirations for Yet Higher Standards
Aspirational standards could become future regulation
SEAD Defines a Tier 5 Above Current Regulation
Note: Based on 3-phase liquid filled transformers
Source: “SEAD Distribution Transformer Report Part 3: electrical Efficiency Class Definitions”, December 2013
Some countries define efficiency standardsfor transformers above that required inlaw. These include Australia, India andKorea
Others have higher standards intended forfuture implementation, notably Europe’sTier 2 rulings for 2021
For the United States, the DOE has definedthe “MaxTech” standard, indicating whatcan be achieved technically
In reviewing and attempting to co-ordinateinternational programmes SEAD (Super-efficient Equipment and ApplianceDeployment) has developed 4 Tiers basedon current standards, and a Tier 5indicating what it considers can beachieved in the future
Similar Tiers apply to other types oftransformer, not just 3-phase liquid filled
There is resistance to moving efficiencystandards yet higher, as small incrementsto efficiency at the top end of the rangemean large increments to material use andto cost
M E T A L SResearch and Consulting
‘Medium’ Power Transformers
A Medium Power Transformer
Source: Siemens
Manufacturers define a group of power transformers rated between ‘small’ (variously described as up to 40 MVA to 60 MVA) and ‘large’. The group is also defined by minimum voltage: Siemens specifies 72.5 kV
Forming part of the transmission network, often as step up transformers, these transformers also are used in sub-transmission and to serve industry, where a number of special types exist
These transformers are similar to large power transformers, but specifications are less demanding and there are standard production runs, not just unique one-off builds
Tap changers are normal, but unlike large power transformers the change may be done offline
Cooling is achieved as heat is absorbed via cooling liquid and given off to the surrounding air by radiators, which may or may not be fan cooled
As well as the standard specification criteria issues including noise requirement, the need for special insulation fluid and meeting space constraints become relevant
Serving sub-transmission as well as transmission business
M E T A L SResearch and Consulting
Dry Types Compared
VPI, VPE, Cast Resin and Resibloc
Good dry type transformers have windings fully impregnated with insulating material making them mechanically strong without air voids. Options today are VPI, VPE, Cast Resin and Resibloc
Still some ‘open wound’ units are made with a ‘dip-and-bake construction’ method. This involves preheating coils and then dipping them in varnish, then baking to cure the varnish
VPI ( Vacuum Pressure Impregnation), an improvement, is a process involving placing pre-heated windings in a vacuum, flooding with resin, applying pressure then letting surplus fluid drain
Comparing Cast Resin and VPI Transformers
Cast Rsin VPI Comment
Resin Impregnation No fluid allowed to drain
Mechanical strength More resin in C.R.
Chance of Short Circuit More resin in C.R.
Maintenance C. R. need less maintenance
Tolerance to Conditions Relates to dust, moisture etc.
Price Simpler process, less material
Weight Less resin in VPI
Hot spot temperature C.R. limited to 180oC epoxy
Overload capacity Opinions vary
Ease of repair C. R. cannot be repaired
Flexibility in design C. R. mostly standard units
Note: While there are clear arguments in favour of VPI, Cast Resin is generally
considered the better option and is favoured by most major manufacturers
VPE (Vacuum Pressure Encapsulated) process is enhanced VPI with additional resin stages. It is less common, but is used with silicon coatings for salt laden environments for example
Cast Resin transformers have windings hermetically sealed in epoxy. The casting process is similar to VPI but is done within a tight mould and cured under heat. No fluid is allowed to drain, The transformer is up to 50% more in price than a VPI / VPE product
Resibloc coils are insulated with epoxy and reinforced with roving glass fibre. Relatively uncommon but highly resistant to short circuit forces, severe climate and cycling loads.

M E T A L SResearch and Consulting
Transformers (3)
M E T A L SResearch and Consulting
Efficiency Standards Also Matter (3)
… materials use may change in ways not entirely expected
Comparing S9, S11 and S13 Standard Transformers in China
Comparing Stacked and 3-D Core Designs Electrical Steel / Copper Ratios (Stacked Core)
Source: Data based on feedback to a Chinese transformer equipment making manufacturer
Note: Example shows material saving by alternative core design and a relative decrease of Cu use between S11 and S13
M E T A L SResearch and Consulting
North America (1)
Market Shares (MVA)
Conductor (Cu Equiv.)
200 - 630 kVA
5 - 200 kVA
200 - 630 kVA
630 - 2,500 kVA
2.5 - 60 MVA
60 - 1,200 MVA
North America Market Profile
CAGR
04-14
Electriciity Generation and Use (TWh)
Generation 4,774 4,794 5,093 0.4%
Use 4,436 4,453 4,731 0.4%
Transformer Market (GVA)
5 - 200 kVA 38 40 36 -1.5%
200 - 630 kVA 95 96 86 -1.8%
630 kVA - 2.5 MVA 32 32 29 -2.0%
2.5 - 60 MVA 140 162 139 -0.6%
60-1,200 MVA 68 87 70 -0.1%
Total 373 416 359 -1.0%
Sources of Demand (GVA)
Incremental 185 227 133 -4.4%
Replacement 188 189 227 1.5%
Network 296 335 287 -0.9%
Industry 77 82 72 -1.4%
Liquid Filled 330 373 320 -0.9%
Dry Type 43 44 40 -1.7%
Material Use (kt)
Electrical Steel 283 329 324 0.6%
Copper 107 92 76 -3.9%
Aluminium 90 116 122 2.1%
Note: Aluminium in Cu equivalent
2004 2009 2014
M E T A L SResearch and Consulting
Forecasts (3)
Long Term Transformer Development
90-00 00-10 10-20 20-30 30-40 40-50
Fleet of Transformers ('000 GVA)
Europe & Africa 7.96 9.96 11.49 13.97 16.81 20.25 24.29 2.3% 1.4% 2.0% 1.9% 1.9% 1.8%
Asia & Ocenaia 3.59 6.70 13.23 25.86 34.67 45.76 59.21 6.4% 7.0% 6.9% 3.0% 2.8% 2.6%
Anericas 4.98 6.81 9.38 11.47 14.38 17.38 19.73 3.2% 3.3% 2.0% 2.3% 1.9% 1.3%
Total 16.53 23.47 34.10 51.31 65.86 83.39 103.23 3.6% 3.8% 4.2% 2.5% 2.4% 2.2%
Installation of Transformers (GVA)
Europe & Africa 361 409 530 585 744 1,074 1,217 1.3% 2.6% 1.0% 2.4% 3.7% 1.3%
Asia & Ocenaia 274 439 1,109 1,472 1,392 2,604 2,710 4.8% 9.7% 2.9% -0.6% 6.5% 0.4%
Anericas 274 386 373 538 693 860 838 3.5% -0.3% 3.7% 2.6% 2.2% -0.3%
Total 909 1,234 2,013 2,595 2,828 4,539 4,765 3.1% 5.0% 2.6% 0.9% 4.8% 0.5%
% Increment 68.8% 65.7% 68.1% 66.1% 50.2% 43.2% 41.6% -0.5% 0.4% -0.3% -2.7% -1.5% -0.4%
2050CAGR
20402020 20301990 2000 2010
Long term trends in transformers
Long Term Transformer Fleet Trend ….. Annual Market
M E T A L SResearch and Consulting
Efficiency Standards Also Matter (1)
Early expectations of huge impact on materials content
Materials Content of Alternative 400 kVA Oil Filled Transformers – Absolute and Relative Values
Data taken from Targosz, R., Fassbinder, S. and Baggini, A. (2012) “Power Transformers”
Transformer Codes: The transformer codes are based current voluntary European classifications. The first part in each (“Do” to Ao”) indicates no load losses, “Ao” being the lowest. The latter (“Ck” to Ak”) show load losses, “Ak” being most efficient
Inferences: 1) Materials content differentials are high, with a maximum difference of 64% between highest and lowest. Content differences are greatest at the top of the range. 2) Price (not shown) also varies, in this case estimated at 42% maximum differential. 3) All major materials are affected, but the highest rated product is shown to have a higher rise in copper than other materials. For copper, the maximum range variation is 107%. While the proportionate value rise in steel is less, grade is higher in the more efficient transformers.
M E T A L SResearch and Consulting
Types of Winding
Alternative techniques are employed
Layer Winding
Disc Winding Close Up Showing Coolant Ducts
A Made Up Power Transformer Winding
Alternative winding techniques have been developed to ensure low manufacturing cost, high density of winding, good mechanical strength, good overload capacity, freedom from hot spots and low stray losses. The latter is achieved in higher quality transformers by transposing wires to achieve a low contact length between adjacent wires
The simplest technique is layer winding, often used with strip or foil. Layer winding can be used with made up CTC, lowering production cost
Disc winding is preferred for higher capacity transformers (over 25 kV). Here single or multiple strands are wound in discs, connected at cross-over points
M E T A L SResearch and Consulting
Alternative Core Types: 3-D
The triangular transformer
Source: ABB
A Close Up of the Cores
A Triangular (or 3-D) Core Dry Type Distribution Transformer
Source: ABB
An alternative core form for dry type distribution transformers is the ‘3-D’ or triangular type. It is another wound core design
The 3-D core was developed in its current form in the 1990s, but has recently been gaining ground in China. ABB offers this type in China and elsewhere under the ‘”Tri-Dry” brand, up to 2.5 MVA
The triangular core configuration restores symmetry to three-phase AC systems. Phases have a circular arrangement rather than being arranged side by side. This eliminates differences between middle and outer phases and as a result there is better utilisation of core material
Chinese equipment supplier Midworld claims a 20% saving in silicon steel and a 3% saving in conductor material compared with laminated cores, making the transformers cheap to produce
It also claims very low no load losses and also low noise transformers
M E T A L SResearch and Consulting
Nickel Company Strategies

M E T A L SResearch and Consulting
Nickel Strategies (1)
M E T A L SResearch and Consulting
Leaders’ share eroded by growing presence of NPI
Company BaseOutput 2011 (kt
Ni)Share 2011
Rank
2011Share 2007
Rank
2007
Norilsk Nickel Russia 283 17.4% 1 20.2% 1
Vale Brazil 242 14.9% 2 18.7% 2
Jinchuan China 127 7.8% 3 8.0% 4
Xstrata Switerland 106 6.5% 4 8.8% 3
BHP Billiton UK/Ausralia 85 5.2% 5 7.3% 5
Sumitomo Japan 62 3.8% 6 4.3% 6
Eramet France 54 3.3% 7 4.2% 7
Anglo American United Kingdom 49 3.0% 8 3.4% 8
QNI Australia 35 2.2% 9 2.2% 12
Sherritt Canada 35 2.1% 10 2.4% 11
Minera (Glencore) Switerland 30 1.9% 11 2.1% 13
Cubaniquel Cuba 30 1.8% 12 3.2% 9
Cunico Macedonia 29 1.8% 13 1.1% 15
Pacific Metals Co Ltd Japan 28 1.7% 14 2.5% 10
Votorantim Brazil 21 1.3% 15 1.6% 14
Other Refined Ni & FeNi Producers 100 6.1% 11.8%
Nickel Pig Iron Producers 260 16.0% 0.6%
Total 1575 100.0% 100.0%
The Finished Nickel Producers
Quite stable in the recent past
M E T A L SResearch and Consulting
Who are the nickel companies?
What is their strategy towards nickel?
How does nickel fit within an overall business profile?
How does nickel fit within companies’ minerals business profile?
What groups of companies apply to nickel?
….. and what can we say about them?
How is the nickel company profile evolving?
Can we spot winners and losers looking forward?
This presentation is intended to help answer:
Outline
M E T A L SResearch and Consulting
Strategic Positioning of the Major Players
Bubble sizes indicate output of finished Ni in 2011. “Focus on Ni” indicates share of revenue accounted for. “Diversity in Ni” reflects product, market and geographical range of the company
Nickel companies vary in their approach to the business
M E T A L SResearch and Consulting
Anglo American
Revenues and Net Profit Revenues by Segment H1 2012
Although nickel represents a small part of its revenues, the size of the company makes it important in the global market, set to become more so with output from Barro Alto
Business associated with steel, base metals and precious metals & diamonds each from a big portion of Anglo’s overall business portfolio
0%
10%
20%
30%
40%
50%
0
5,000
10,000
15,000
20,000
25,000
30,000
35,000
40,000
2007 2008 2009 2010 2011 H1 2012
Revenues / Sales
Net Profit
Net Profit Margin
% Margin
Anglo American Revenues and Net Profit
US$ million
Iron Ore etc. Met Coal Thermal Coal
Copper Nickel Platinum
Diamonds Other
Anglo Revenue in H1 2011
US$16.4 billion
M E T A L SResearch and Consulting
Nickel company business profiles (2)
Business in Minerals
-10.0%
0.0 %
10. 0%
20. 0%
30. 0%
40. 0%
50. 0%
60. 0%
70. 0%
Energy & Other
Steel RM
Base MetalsPrecious Metals
Other
Radar chart
M E T A L SResearch and Consulting
Nickel Strategies (2)
M E T A L SResearch and Consulting
Nickel company business profiles (3)
Business in Nickel
-10.0%
0.0 %
10. 0%
20. 0%
30. 0%
40. 0%
50. 0%
60. 0%
70. 0%
Mining
Intermediates /Trade
Refined MetalSpecial Products
FeNi / NPI
Radar chart
M E T A L SResearch and Consulting
Mine & finished Ni product companies
Mined Nickel Finished Nickel
Norilsk Nickel
Vale
BHP Billiton
PT Antam
Xstrata
Eramet
Jinchuan
Anglo American
Nickel Asia
Votorantim
Others
Shares of Nickel Mine Output in 2011
Norilsk Nickel
Vale
Jinchuan
Xstrata
BHP Billiton
Sumitomo
Eramet
Anglo American
QNI
Sherritt
Others Processed
Chinese NPI
Shares of Finished Nickel Output in 2011
Largely the same, some key diffeences
M E T A L SResearch and Consulting
Vale
Revenues and Net Profit Revenues by Segment H1 2012
Iron ore giant Vale is the world’s second biggest nickel producer, having acquired a big stake in the industry with the purchase of Inco in 2005
Its revenue from nickel account for 10% of its total sales, where ferrous minerals account for 80%
Developing rapidly in the business, current projects include Onça Puma in Brazil and VNC (Goro) in New Caladonia
Ferrous Minerals Nickel
Copper Aluminium /Oth NF
Logistics etc.
Vale Revenues H1 2012
Total US$23.5 Billion
0%
5%
10%
15%
20%
25%
30%
35%
40%
45%
50%
0
5,000
10,000
15,000
20,000
25,000
30,000
35,000
40,000
45,000
50,000
55,000
60,000
65,000
2007 2008 2009 2010 2011 H1 2012
Revenue/Sales
Net Result
Net Margin
% Margin
Vale Revenues and Net Profit
US$ million
M E T A L SResearch and Consulting
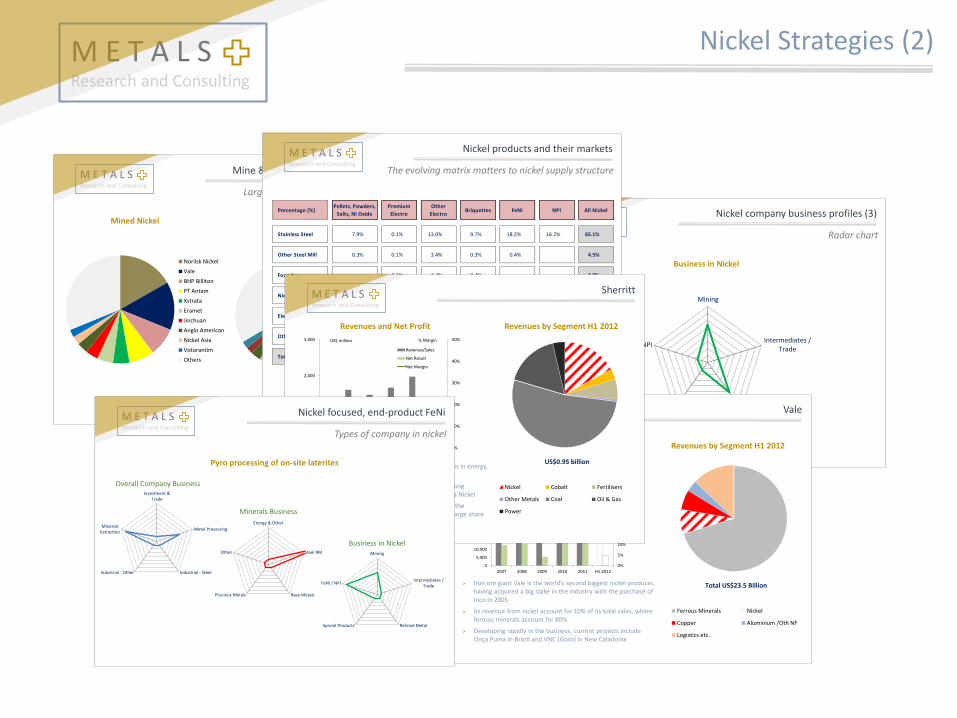
Nickel products and their markets
Percentage (%)Pellets, Powders,
Salts, Ni Oxide
Premium
Electro
Other
ElectroBriquettes FeNi NPI All Nickel
Stainless Steel 7.9% 0.1% 13.0% 9.7% 18.2% 16.2% 65.1%
Other Steel Mill 0.3% 0.1% 3.4% 0.3% 0.4% 4.5%
Foundry 0.1% 3.4% 0.4% 3.9%
Nickel Alloy 2.8% 4.5% 2.5% 9.8%
Electoplating 2.5% 4.1% 3.3% 9.9%
Other Uses 2.1% 2.0% 2.7% 6.8%
Total 15.6% 10.9% 28.3% 10.4% 18.6% 16.2% 100.0%
The evolving matrix matters to nickel supply structure
M E T A L SResearch and Consulting
Sherritt
Revenues and Net Profit Revenues by Segment H1 2012
A relatively small company, Sherritt’s main business is in energy, mostly at the extraction stage
Sherritt’s presence in nickel and cobalt is tied to its long association with State interests in Cuba through Moa Nickel
The company is transforming itself in nickel through the Ambatovy project in Madagascar. It also acquired a large share in the Sulawesi project in Indonesia. From Rio Tinto
0%
10%
20%
30%
40%
50%
0
1,000
2,000
3,000
2007 2008 2009 2010 2011 H1 2012
Revenue/Sales
Net Result
Net Margin
% Margin
Sherritt Revenues and Net Profit
US$ million
Nickel Cobalt Fertilisers
Other Metals Coal Oil & Gas
Power
Sherritt Revenue in H1 2012
US$0.95 billion
M E T A L SResearch and Consulting
Nickel focused, end-product FeNi
Pyro processing of on-site laterites
Overall Company Business
Minerals Business
Business in Nickel-10.0%
0.0 %
10. 0%
20. 0%
30. 0%
40. 0%
50. 0%
60. 0%
70. 0%
Investment &Trade
Metal Processing
Industrial - SteelIndustrial - Other
MineralsExtraction
-10.0%
0.0 %
10. 0%
20. 0%
30. 0%
40. 0%
50. 0%
60. 0%
70. 0%
Energy & Other
Steel RM
Base MetalsPrecious Metals
Other
-10.0%
0.0 %
10. 0%
20. 0%
30. 0%
40. 0%
50. 0%
60. 0%
70. 0%
Mining
Intermediates /Trade
Refined MetalSpecial Products
FeNi / NPI
Types of company in nickel
M E T A L SResearch and Consulting
Copper Substitution & Miniaturisation
M E T A L SResearch and Consulting
Copper Substitution (1)
M E T A L SResearch and Consulting
Allocation by product group in 2014, net figures
Materials Substitution in 2014 (1)
KEY
LV Energy Cable
Power Cable
Telecom/Data Cable
Winding & Bare Wire
Cu Tube / Other Extrusions
Plate, Sheet, Strip & Foil
Other Alloy Products
M E T A L SResearch and Consulting
LV Energy Cable (1)
Product Share of All Losses in 2014
Regional Allocation of All Losses in 2014
2013 2014 2014 05-14
Market Size
Europe & Africa 1,303 1,315 1.0% 19%
China 2,017 2,170 7.6% 240%
Other Asia & Oceania 1,665 1,714 2.9% 125%
North America 678 700 3.2% -37%
Latin America 453 457 0.8% 32%
Total 6,116 6,356 3.9% 39%
Net Materials Substitution
Europe & Africa -2 -3 -0.2% -1%
China -7 -6 -0.3% -2%
Other Asia & Oceania -4 -4 -0.3% -2%
North America -18 -16 -2.3% -19%
Latin America -1 -1 -0.1% -1%
Total -32 -29 -0.5% -4%
Miniaturisation
Europe & Africa -7 -7 -0.5% -5%
China -7 -7 -0.3% -2%
Other Asia & Oceania -8 -7 -0.4% -4%
North America -3 -2 -0.3% -5%
Latin America -1 -1 -0.3% -3%
Total -26 -24 -0.4% -4%
Net Materials Substitution & Miniaturisation
Europe & Africa -10 -9 -0.7% -7%
China -14 -12 -0.6% -4%
Other Asia & Oceania -12 -11 -0.7% -6%
North America -21 -18 -2.6% -24%
Latin America -2 -2 -0.4% -4%
Total -58 -53 -0.8% -7%
% Loss / GainData
M E T A L SResearch and Consulting
Cu Price vs Key Substitute - Aluminium
Copper and Aluminium Prices Price Ratio
0
1,000
2,000
3,000
4,000
5,000
6,000
7,000
8,000
9,000
10,000
Copper Aluminium
$/tonne
Price Difference
Price difference falling since 2011, ratio drop more recent
M E T A L SResearch and Consulting
Total net losses fall well below 500 kt in 2014
Substitution & Miniaturisation Trend
Annual Net Substitution and Miniaturisation Losses (kt Cu)
2005 2006 2007 2008 2009 2010 2011 2012 2013 2014
Substitution Loss -315 -450 -479 -433 -522 -423 -512 -421 -400 -357
Substitution Gain 15 24 29 25 32 34 32 32 29 48
Miniaturisation -134 -135 -137 -140 -123 -137 -138 -141 -143 -135
Total Net Loss -434 -561 -587 -549 -612 -525 -618 -530 -513 -444
M E T A L SResearch and Consulting
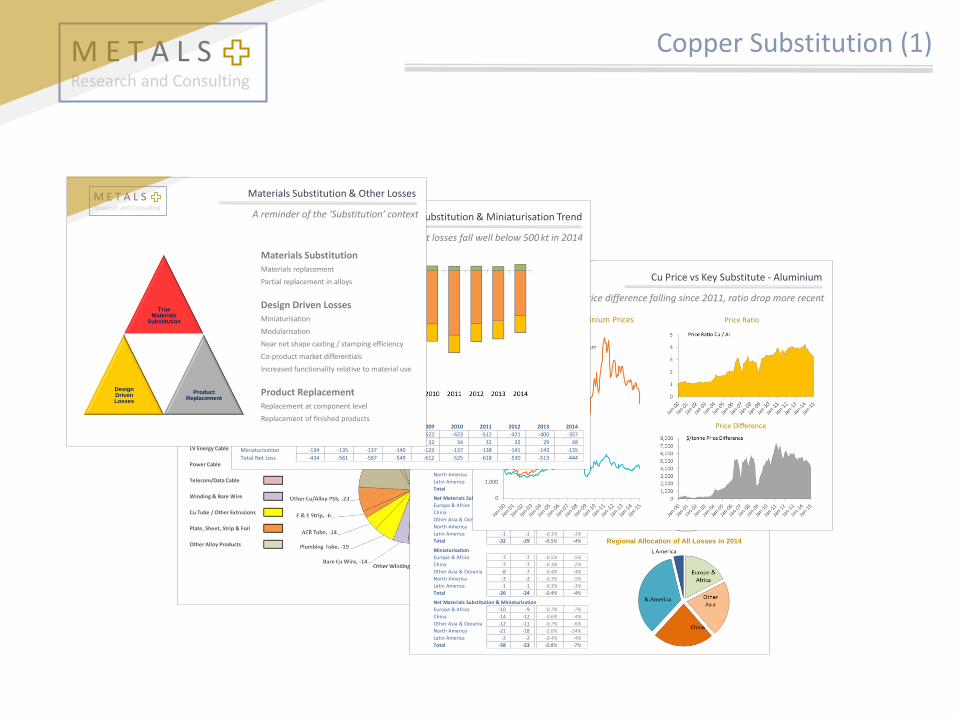
A reminder of the ‘Substitution’ context
Materials Substitution & Other Losses
True Materials
Substitution
Design Driven Losses
Product Replacement
Materials SubstitutionMaterials replacement
Partial replacement in alloys
Design Driven LossesMiniaturisation
Modularisation
Near net shape casting / stamping efficiency
Co-product market differentials
Increased functionality relative to material use
Product ReplacementReplacement at component level
Replacement of finished products
M E T A L SResearch and Consulting
Copper Substitution (2)
M E T A L SResearch and Consulting
LV Energy Cable (1)
Product Share of All Losses in 2014
Regional Allocation of All Losses in 2014
2013 2014 2014 05-14
Market Size
Europe & Africa 1,303 1,315 1.0% 19%
China 2,017 2,170 7.6% 240%
Other Asia & Oceania 1,665 1,714 2.9% 125%
North America 678 700 3.2% -37%
Latin America 453 457 0.8% 32%
Total 6,116 6,356 3.9% 39%
Net Materials Substitution
Europe & Africa -2 -3 -0.2% -1%
China -7 -6 -0.3% -2%
Other Asia & Oceania -4 -4 -0.3% -2%
North America -18 -16 -2.3% -19%
Latin America -1 -1 -0.1% -1%
Total -32 -29 -0.5% -4%
Miniaturisation
Europe & Africa -7 -7 -0.5% -5%
China -7 -7 -0.3% -2%
Other Asia & Oceania -8 -7 -0.4% -4%
North America -3 -2 -0.3% -5%
Latin America -1 -1 -0.3% -3%
Total -26 -24 -0.4% -4%
Net Materials Substitution & Miniaturisation
Europe & Africa -10 -9 -0.7% -7%
China -14 -12 -0.6% -4%
Other Asia & Oceania -12 -11 -0.7% -6%
North America -21 -18 -2.6% -24%
Latin America -2 -2 -0.4% -4%
Total -58 -53 -0.8% -7%
% Loss / GainData
M E T A L SResearch and Consulting
Materials substitution net losses by product
Forecasts to 2019 (1)
Net Materials Substitution by Product
2010 2011 2012 2013 2014 2015 2016 2017 2018 2019
LV Energy Cable -11 -35 -36 -32 -29 -27 -27 -34 -40 -40
Power Cable -89 -71 -73 -64 -60 -61 -65 -74 -83 -85
Other Wire & Cable -137 -150 -118 -106 -83 -75 -69 -69 -72 -69
Cu Tube & C/Alloy PSSF -108 -139 -93 -96 -62 -54 -50 -57 -62 -59
Other Products -44 -84 -70 -74 -75 -72 -68 -73 -78 -66
M E T A L SResearch and Consulting
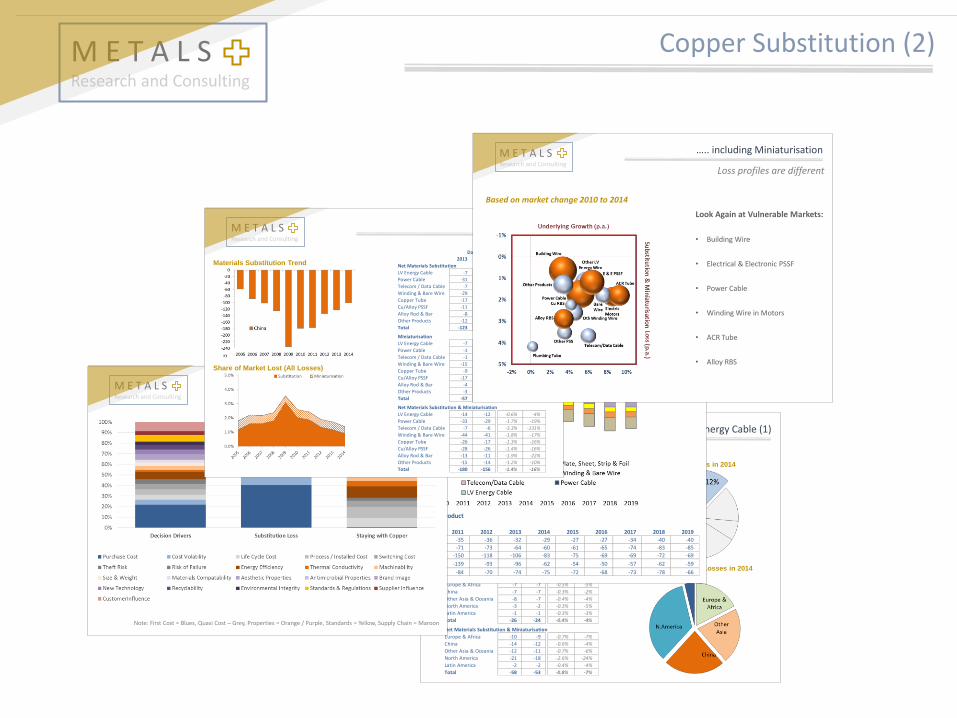
Match reasons for staying with Cu & buyer priorities?
Drivers and Substitution Illustrated
Note: First Cost = Blues, Quasi Cost – Grey, Properties = Orange / Purple, Standards = Yellow, Supply Chain = Maroon
M E T A L SResearch and Consulting
China (1)
Materials Substitution Trend
Share of Market Lost (All Losses)
2013 2014 2014 05-14
Net Materials Substitution
LV Energy Cable -7 -6 -0.3% -2%
Power Cable -31 -28 -1.6% -18%
Telecom / Data Cable -7 -5 -2.9% -128%
Winding & Bare Wire -29 -27 -1.2% -11%
Copper Tube -17 -7 -0.6% -13%
Cu/Alloy PSSF -11 -10 -0.5% -8%
Alloy Rod & Bar -8 -7 -1.2% -14%
Other Products -12 -11 -1.0% -8%
Total -123 -101 -0.9% -12%
Miniaturisation
LV Energy Cable -7 -7 -0.3% -2%
Power Cable -1 -2 -0.1% -1%
Telecom / Data Cable -1 -1 -0.4% -3%
Winding & Bare Wire -15 -15 -0.7% -5%
Copper Tube -9 -9 -0.7% -3%
Cu/Alloy PSSF -17 -16 -0.8% -8%
Alloy Rod & Bar -4 -4 -0.7% -8%
Other Products -3 -3 -0.2% -2%
Total -57 -55 -0.5% -4%
Net Materials Substitution & Miniaturisation
LV Energy Cable -14 -12 -0.6% -4%
Power Cable -33 -29 -1.7% -19%
Telecom / Data Cable -7 -6 -3.3% -131%
Winding & Bare Wire -44 -41 -1.8% -17%
Copper Tube -26 -17 -1.3% -16%
Cu/Alloy PSSF -28 -26 -1.4% -16%
Alloy Rod & Bar -13 -11 -1.9% -22%
Other Products -15 -14 -1.2% -10%
Total -180 -156 -1.4% -16%
% LossData
M E T A L SResearch and Consulting
Loss profiles are different
….. including Miniaturisation
Look Again at Vulnerable Markets:
• Building Wire
• Electrical & Electronic PSSF
• Power Cable
• Winding Wire in Motors
• ACR Tube
• Alloy RBS
Based on market change 2010 to 2014
M E T A L SResearch and Consulting
Electrical Steel & Copper
M E T A L SResearch and Consulting
Electrical Steel & Copper (1)
M E T A L SResearch and Consulting
The two types of electrical steel
GOES (Grain-oriented)
Static machines like transformers, powerreactors and hydro-generators require thegreatest magnetic properties in one favoureddirection (anisotropy).
NOES (Non-oriented)
Rotary and electrostatic machines need goodmagnetic properties in every given direction(isotropy).
NOES is mainly used for motors, generators,small transformers and other electromagneticapplications.
M E T A L SResearch and Consulting
World demand - Generic product types
Total Market = 13.13 MtNOES79%
GOES21%
Non grain oriented products (NOES) account for nearly 80% of the global market by volume
Electrical Steel Demand by Main Product Type (2013)
M E T A L SResearch and Consulting
Electricity losses in the global economy
From the point of electricity generation, losses in transmission and distribution amount to around 17% and motor driven systems around 16%. In each the copper and electrical steel containing component (transformers and motors) play an important and identifiable role but, in each case, account for less than 30% of the loss recorded.
Major Areas of
Loss – Motors and
Transformers
Easily Identified
M E T A L SResearch and Consulting
Motors and transformers market trends
0
500
1,000
1,500
2,000
2,500
3,000
Distribution Transmission & Other
MVA
0
500
1,000
1,500
2,000
2,500
Up to 0.75 kW 0.75 - 75 kW
75 - 375 kW Over 375 kW
GWTransformer Market Growth Motor Market Growth
2004 2005 2006 2007 2008 2009 2010 2011 2012 2013 2014 2015 2016 2017
TRANSFORMERS (MVA)
Europe 257 273 351 371 409 352 441 490 491 475 482 495 514 536
Asia 575 562 686 789 854 848 971 1,060 1,091 1,148 1,219 1,291 1,381 1,474
Americas 319 424 371 399 426 381 306 322 328 335 360 383 408 413
World 1,151 1,259 1,409 1,559 1,689 1,581 1,718 1,872 1,910 1,959 2,062 2,169 2,303 2,422
Growth 0.0% 9.4% 11.9% 10.7% 8.3% -6.4% 8.7% 9.0% 2.0% 2.5% 5.3% 5.2% 6.2% 5.2%
MOTORS (GW)
Europe 162 166 194 202 208 165 184 200 193 193 198 205 212 215
Asia 639 722 802 944 1,058 1,031 1,154 1,248 1,322 1,386 1,496 1,611 1,723 1,836
Americas 161 167 174 167 183 151 127 153 159 164 175 186 196 196
World 962 1,055 1,170 1,313 1,449 1,347 1,466 1,601 1,674 1,743 1,869 2,002 2,131 2,247
Growth 0.0% 9.6% 10.8% 12.2% 10.3% -7.0% 8.9% 9.2% 4.6% 4.1% 7.2% 7.1% 6.4% 5.5%
M E T A L SResearch and Consulting
The price issue
The relative price of copper has increased greatly since 2009. Saving on the amount of copper or usingaluminium for a given equipment efficiency by using better electrical steel can make economic sense.
0
1,000
2,000
3,000
4,000
5,000
6,000
7,000
8,000
9,000
2002 2003 2004 2005 2006 2007 2008 2009 2010 2011 2012 2013
HR Coil SteelNOES 1NOES 2NOES 3GOES 1GOES 2GOES 3GOES 4SA1 (Amorphous)COPPER
$/tonne
Note: Prices based on the following EN grades: GOES 1 -M 165 35 S , GOES 2 - M 140 23 S, GOES 3 - M 120 23 S, GOES 4 - M 100 20 S, NOES 1 -M 400 50 A , NOES 2 - M 330 50 A , NOES 3 -M250 35 A .
M E T A L SResearch and Consulting
GOES and NOES under the microscope
ISOTROPIC MAGNETIC PROPERTIES ANISOTROPIC MAGNETIC PROPERTIES
Source: TKES

M E T A L SResearch and Consulting
Electrical Steel & Copper (2)
M E T A L SResearch and Consulting
World electrical steel demand - charts
0
2,000
4,000
6,000
8,000
10,000
12,000
14,000
2004 2005 2006 2007 2008 2009 2010 2011 2012 2013
Europe & Africa China
Other Asia & Oceania North America
Latin America
kt
0
500
1,000
1,500
2,000
2,500
3,000
2004 2005 2006 2007 2008 2009 2010 2011 2012 2013
Europe & Africa China
Other Asia & Oceania North America
Latin America
kt
0
2,000
4,000
6,000
8,000
10,000
12,000
2004 2005 2006 2007 2008 2009 2010 2011 2012 2013
Europe & Africa China
Other Asia & Oceania North America
Latin America
kt
All Electrical Steel GOES
NOES
M E T A L SResearch and Consulting
Alternative types of transformer core
C or U cores, with windings put on one or
both legs
Toroidal cores, with the coil wound
through the hole in the torus and
around the outside.
Stacked/laminated cores made out by thin sheets of metal sealed together.
The lamination reduces the eddy current losses. “EI” cores are the most common
laminated cores.
M E T A L SResearch and Consulting
73
GOES grade development over time
0%
10%
20%
30%
40%
50%
60%
70%
80%
90%
100%
2004 2005 2006 2007 2008 2009 2010 2011 2012 2013
Amorphous Mat. High Permeability Moderate Grade Low Grade / NOES
Share
High Permeability rated at Max 100 Watt/kg loss for 0.20 mm material at 1.7 Tesla and 50 Hz.Low Grade rated at Min 130 Watt/kg loss for 0.30 mm material at 1.7 Tesla and 50 Hz. It includes NOES used in transformers.Moderate grade is in between these ratings..
2004 2005 2006 2007 2008 2009 2010 2011 2012 2013 2014
Amorphous Mat. 14 19 29 38 51 56 75 86 91 98 106
High Permeability 221 250 306 375 445 418 521 610 678 749 860
Moderate Grade 475 572 657 771 911 843 988 1,152 1,263 1,368 1,445
Low Grade / NOES 1,179 1,192 1,230 1,293 1,371 1,126 1,104 1,063 953 828 804
World 1,889 2,033 2,222 2,477 2,778 2,442 2,688 2,911 2,985 3,043 3,215
Growth 7.6% 9.3% 11.5% 12.1% -12.1% 10.1% 8.3% 2.6% 1.9% 5.7%
Amorphous Mat. 0.8% 0.9% 1.3% 1.5% 1.8% 2.3% 2.8% 2.9% 3.0% 3.2% 3.3%
High Permeability 11.7% 12.3% 13.8% 15.1% 16.0% 17.1% 19.4% 21.0% 22.7% 24.6% 26.8%
Moderate Grade 25.1% 28.1% 29.6% 31.1% 32.8% 34.5% 36.8% 39.6% 42.3% 45.0% 44.9%
Low Grade / NOES 62.4% 58.6% 55.4% 52.2% 49.4% 46.1% 41.1% 36.5% 31.9% 27.2% 25.0%
M E T A L SResearch and Consulting
Motor driven system loss gets more focus
Legislators are now looking more at motor driven systems as a whole. Motor function always forms part of a larger process, often complex in industrial applications.
Motor loss in itself may form a small
part of overall energy loss in motor
driven system. The share of loss is falling
with stiffer motor standards.
M E T A L SResearch and Consulting
Global Market Profile
Region Shares E. Steel
Transformer & Motor MarketsCopper in Relevant MarketsGOES & NOES Use
Ratios Between Copper and Electrical Steel Use
-50
150
350
550
750
950
1,150
1,350
1,550
1,750
0
500
1,000
1,500
2,000
2,500
3,000
3,500
Transformer Market (MVA)
Motors Market (GW)
Transformer MVA Motor GW
-1,000
1,000
3,000
5,000
7,000
9,000
11,000
13,000
15,000
Grain Oriented
Non Grain Oriented
Electrical Steel kt
0
500
1,000
1,500
2,000
2,500
3,000
Transformers Motors & Generators
kt Cu
0
1
2
3
4
5
6
7
8
9
10
NOES (t) / Cu in Motors etc. (t) GOES (t) / Cu in Transformers(t)
Electrical Steel / Copper Tonnage
Europe & Africa17%
China58%
Other Asia &
Oceania18%
North America
3%
Latin America
4%
Total = 13.13 MT
M E T A L SResearch and Consulting
Electrical Steel & Copper (3)
M E T A L SResearch and Consulting
Net trade in 2012 - Geography
-800 -600 -400 -200 0 200 400 600 800
L.America
N.America
Other Asia
S. Korea
Japan
China
India
Africa
FSU
EU28
Net Trade in GOES
Import Export
-800 -600 -400 -200 0 200 400 600 800
L.America
N.America
Other Asia
S. Korea
Japan
China
India
Africa
FSU
EU28
Net Trade in NOES
ExportImport
kt kt
Japan, Korea and the FSU the big exporters, while China, India and Latin America are the main importers of all material. EU28 is a big importer of NOES
M E T A L SResearch and Consulting
GOES main suppliers
GOES Output by Supplier (2012)
WISCO16%
Baosteel Group Corporation
5%
NSSC11%
POSCO11%
NLMK Group9%
Thyssen Krupp8%
AK Steel9%
JFE Steel7%
Stalprodukt S.A.3%
Cogent 3%
Aperam2%
ATI3%
ArcelorMittal 2%
Others9%
13 big GOES suppliers with combined output of 2.75 Mt in 2012
Chinese fabricators account for more than 30% of world’s output
M E T A L SResearch and Consulting
New investments India
Company Area Project Status
POSCO Maharashtra state 300ktpy NOES plantFull-capacity expected to be reached within FY2014 (end. March 2015)
POSCO Maharashtra state
300ktpy GOES plant. JV with the Public sector Steel Authority of India (SAIL)
Project currently on the rocks over the ownership share
China Steel Corp (CSC)Dahej-2 Industrial Area, Bharuch, Gujarat
200ktpy NOES plant Operations starting in June 2014
JSW Steel (JSW Group)Vijayanagar steel complex, Bellary district
200ktpy NOES plant in collaboration with JFE Steel
To be completed within FY 2015
Rashtriya Ispat Nigam Ltd (Indian state-owned company)
Andhra Pradesh State200/400ktpy GOES plant in technological cooperation with NLMK
Under evaluation
Bhushan Steel Ltd. (BSL) Odisha 350ktoy NOES plant Under evaluation
M E T A L SResearch and Consulting
Forecasts to 2017 - GOES
The underlying transformer market is expected tocontinue to grow rapidly at a compound rate of5.5% p.a. between 2013 and 2017, with bigcontributions both from new network spending andthe revival of older networks.
The rate of growth in GOES should be even faster(6.6% p.a.). Although the use of better grade highpermeability steel makes smaller cores possible,this is more than outweighed by the need forhigher efficiency units which require greatermaterial use.
Copper use in transformers should perform lesswell than either transformer MVA or GOES (5.0%p.a.). While on a like for like basis the ratio toelectrical steel should stay similar, a growingpenetration of aluminium should dampen demandgrowth for copper.
The share of high permeability grades of GOESshould continue to rise quickly, from 25% in 2013 to33% in 2017.
Profile: Transformers & GOES
2013 2015 2017 CAGR
Transformer Market (MVA) 1,959 2,169 2,422 5.5%
Distribution 862 966 1,088 6.0%
Transmission & Other 1,097 1,203 1,334 5.0%
GOES Use (kt) 2,791 3,148 3,599 6.6%
Europe 517 536 571 2.5%
China 1,126 1,281 1,482 7.1%
Other Asia 758 873 1,029 8.0%
North America 217 252 270 5.6%
Latin America 173 206 246 9.2%
Copper Use (kt) 1,000 1,092 1,217 5.0%
Europe 156 156 164 1.3%
China 487 542 603 5.5%
Other Asia 261 285 328 5.9%
North America 53 59 62 3.8%
Latin America 44 50 60 8.3%
Key Ratios
GOES (t)/ MVA 1.43 1.45 1.49 1.0%
Transformer Cu (t) / MVA 0.51 0.50 0.50 -0.4%
GOES (t) / Cu in Transformers(t) 2.79 2.88 2.96 1.5%
M E T A L SResearch and Consulting
Main suppliers: Europe
KEY NUMBERS:
10 fabricators
15 main plants, of which
6 for GOES
8 for NOES
1 for both
(Novopolipetsk, NLMK)
Total production: about 2
million tonnes in 2012, of
which
35% GOES
65% NOES
Acroni SloveniaErdemir Romania
U. S. Steel Kosice
Cogent Group (Tata Steel)
Erdemir RomaniaArcelor Mittal
C.D. Wälzholz KG
Stalprodukt S.A.
Voestalpine Stahl
ThyssenKrupp Electrical Steel
Novolipetsk Steel (NLMK Group)
GOES plant
NOES plant
M E T A L SResearch and Consulting
Building Wire

M E T A L SResearch and Consulting
Building Wire (1)
M E T A L SResearch and Consulting
Building Wire Market Trend
Building Wire Market Development 1999-2014
Building Wire Market Development (kt Cu Equivalent)
99-14
Copper Wire 2,370 2,377 2,395 2,400 2,569 2,780 2,856 2,930 3,069 3,113 3,044 3,111 3,211 3,389 3,476 3,625 2.9%
Aluminium Wire 71 74 79 88 102 122 157 192 195 195 182 194 204 228 244 260 9.0%
Total Cu Equivalent 2,441 2,451 2,474 2,488 2,671 2,902 3,013 3,122 3,264 3,308 3,227 3,305 3,415 3,616 3,719 3,885 3.1%
1999 2000 2001 2002 2003 2004 2005 2006 2007 2008 2009 2010 2011 2012 2013 2014
Note: All aluminium figures in this report are quoted as copper equivalents, calculated at 2.077 to 1
M E T A L SResearch and Consulting
Regional Trends in Building Wire
2014 Regional Shares ….. Trend 1999-2014
European Union 490 489 476 468 -0.3%
Other Europe & FSU 53 74 81 93 3.8%
Africa 65 75 90 112 3.7%
India 54 72 109 144 6.7%
Middle East / Other S. Asia 130 151 169 228 3.8%
China 268 457 892 1,310 11.2%
Japan 160 160 160 148 -0.5%
ASEAN 95 120 131 204 5.2%
Other Asia & Oceania 173 202 183 206 1.2%
North America 740 881 685 682 -0.5%
Latin America 214 222 251 291 2.1%
Total Cu Equivalent 2,441 2,902 3,227 3,885 3.1%
CAGR
99-1420141999 2004 2009
M E T A L SResearch and Consulting
The Four Market Segments
856 kt
24.0%
Other Asia & Oceania North America Latin America
China
Europe & AfricaGlobal Market Apportionment
304 kt
35.3%
216 kt
25.2%
145 kt
16.9%
194 kt
22.6%
1,051 kt
29.5%
653 kt
18.3%
53 kt
20.4%
51 kt
19.5%
117 kt
18.1%
166 kt
25.6%
147 kt
22.7%
217 kt
33.6%
413 kt
34.9%
437 kt
37.0%
127 kt
10.8%
205 kt
17.3%
79 kt
30.4%
77 kt
29.8%
139 kt
22.4%
109 kt
17.6%
182 kt
29.3%
190 kt
30.7%
1,005 kt
28.2%
Global Market Apportionment
Cu Equiv. Tonnage and Percent Share(excluding losses)
Residential
Newbuild
Non-residential
Newbuild
Residential
Refurbishment
Non-residential
Refurbishment
M E T A L SResearch and Consulting
Copper Market Interfaces
3.6 Mt Cu of building wire is part of a 6.3 Mt market
Building Wire
Other Low Voltage Wire
Power Cable
Bare Wire
Data Cable
Copper Rod, Bar & Section
Other Mill Products
Building Wire and All Electrical / Data Copper Installation in Buildings in 2014
European Union 20 364 6 35 36 31 493 479 49%
Other Europe & Africa 5 148 2 10 12 7 184 181 50%
China 39 674 15 43 70 42 883 1,245 58%
Other Asia & Oceania 26 589 6 61 59 29 770 906 54%
North America 6 110 6 50 27 9 208 540 72%
Latin America 3 111 2 6 3 0 125 274 69%
Segment Total 100 1,996 36 206 207 118 2,663 3,625 58%
L. V.
Wire
Power
Cable
Bare
Wire
Data
Cable
Cu
RBS
Other
Mill
All Non
Build Wire
Building
Wire
%
Share
M E T A L SResearch and Consulting
Service Entrance Cable
The service entrance often sees aluminium conductor cable
Copper XLPE Insulation
Service Entrance Wire Types
SEU
SER
USE-2
The service entrance is a special location within residential buildings as the cables are larger and there may be additional requirements in terms of moisture, abrasion and cut through resistance
The economics of larger cable sizes and allowance in the codes means that the service entrance is the prime source of aluminium conductor use in the residential sector
SEU usually has two type XHHW insulated conductors with an overall PVC jacket. The cable is rated for 90 C in dry, 75 C in wet locations. It is used above-ground from the service drop to the meter base, and from the meter base to the distribution panel board
SER is of similar in construction and use to SEU but is round, and has more than two conductors
For underground service entrances, alternative conductor types are used. USE-2 is quite common
SEU and SER may be used in branch circuits for major appliances, while USE-2 has wide application in demanding non-residential environments
M E T A L SResearch and Consulting
IEC and NEC Based Wiring Standards
NEC
IEC
IEC & NEC
IEC - International Electricity Standards is the dominant code for low voltage installations. The safety principles of IEC 60364 series, IEC 61140, 60479 series and IEC 61201 are the fundamentals of most electrical standards in the world
NEC – National Electrical Code also contains installation rules for electrical products, primarily for North American markets
The dual adaptation of IEC and NEC standards is not widespread
Source: Legrand, International electrical standards & regulations

M E T A L SResearch and Consulting
Building Wire (2)
M E T A L SResearch and Consulting
Copper vs Aluminium Conductors (3)
Aluminium’s role in practice
Aluminium’s main foothold is in North America, where it has nearly 20% share on a copper equivalent basis
Elsewhere, the share is low. While growth may have been substantial in percentage, in volume it remains quite small
Installation in the US is exclusively 8000 series product, whereas elsewhere 1000 series alloys are still used in some locations
Up to eight major suppliers are thought to be selling 8000 series cables in China, and standards are being developed. Most product sold is power cable rather than building wire
In the United States, the main penetration of aluminium is in non-residential markets, although it is installed in the residential market in the service entrance and in the core of high rise multi-family dwellings
Cable economics determine that aluminium is most used in larger sized single core cables, where the additional cost of insulation (and jacketing) is proportionately less
In the US, as elsewhere, it is generally believed that there is little advantage installing aluminium building wires of less than 10 mm2 (8 AWG)
In practice, there is little used less than 16 mm2 (6 AWG), most cables being considerably larger. This effectively bars aluminium use in residential branch circuit wiring
99-14
Europe & Africa 11 9 11 12 0.7%
China 9 14 40 65 14.5%
Other Asia & Oceania 6 8 16 24 9.3%
North America 41 81 104 142 8.6%
Latin America 4 9 12 17 10.1%
Total 71 122 182 260 9.0%
% Aluminium 2.9% 4.2% 5.6% 6.7% 5.7%
2014200920041999CAGR
Aluminium Building Wire Trend
M E T A L SResearch and Consulting
The Building Wire Market and Wealth
A clear relationship, but China use looks high
Bubble sizes indicate the size od the building wire market. GDP shown on a 2010 Purchasing Power Parity (PPP) adjusted basis
Building Wire Use and GDP per Head by Region in 2014
M E T A L SResearch and Consulting
The Stock, Newbuild & Economic Stage
Newbuild focus emerging markets, existing stock mature
The Existing Stock and GDP per Head in 2014 ….. Newbuild
Bubble sizes indicate floorspace in place and installed. GDP shown on a 2010 Purchasing Power Parity (PPP) adjusted basis
M E T A L SResearch and Consulting
Floorspace in Place & Refurb. Wire
Wire in refurbishment is growing quickly in non-residential
Buildings in Place and Refurbishment Wire ….. Region Profiles 1999
….. Region Profiles 2014
Floorspace = x10 billion sq. m, Building Wire = Mt Cu equivalent
M E T A L SResearch and Consulting
Wire Use in New & Existing Buildings
Refurbishment share for wire more than for all construction
Building Wire Shares by End Use in 2014 ….. Trend 1999-2014
The Building Wire Market (kt Cu equiv.)
99-14
Residential Newbuild 694 692 706 727 776 865 898 934 927 893 845 883 922 984 1,009 1,053 2.8%
Residential Refurbishment 479 474 470 467 511 574 594 585 594 592 601 599 602 612 634 655 2.1%
Non-residential Newbuild 557 562 555 531 590 639 663 719 806 866 836 851 877 940 961 1,006 4.0%
Non-residential Refurbishment 535 542 561 578 598 607 632 642 683 699 694 714 745 788 814 859 3.2%
Building Wire Losses 176 181 182 186 197 216 226 242 254 257 251 258 270 293 301 312 3.9%
All Building Wire 2,441 2,451 2,474 2,488 2,671 2,902 3,013 3,122 3,264 3,308 3,227 3,305 3,415 3,616 3,719 3,885 3.1%
Copper 2,370 2,377 2,395 2,400 2,569 2,780 2,856 2,930 3,069 3,113 3,044 3,111 3,211 3,389 3,476 3,625 2.9%
Aluminium 71 74 79 88 102 122 157 192 195 195 182 194 204 228 244 260 9.0%
CAGR1999 2000 2001 2002 2003 2004 2005 2006 2007 2008 2009 2010 2011 2012 2013 2014
M E T A L SResearch and Consulting
A simplified cable sizing procedure is as follows:
1. Take the total load in the circuit(s) concerned in Watts
2. Add 20% for future proofing
3. Multiply by Voltage to give Amps
4. LOOKUP next highest cable size for this Amp rating
5. LOOKUP ambient temperature factor and apply
6. LOOKUP method of installation factors and apply
7. STILL OK, go to 8); NOT OK, choose next cable size up
8. LOOKUP Voltage Drop factor and apply
9. STILL OK, correct sizing, NOT OK, choose next size up
Tables give de-rating factors for each cable type and each parameter
Voltage drop calculations are based on circuit length, the longer the circuit the higher than voltage drop
Voltage drop per unit length is as much as 8 times higher for a 120v system as for a 230v system
The IEC recommends a voltage drop maximum of 3% for lighting systems and 5% for other circuits in most cases
Where the consumer supply through its own MV/LV transformer, 6% and 8% voltage drop is permissible
In the US, the NEC only recommends 5% max drop in normal consumer supply. 8-10% drop is considered dangerous
The Calculation of Cable Sizing
WHY THIS MATTERS
Choice of cable type affects conductor size
Choice of installation method can make (big) differences to allowable
conductor size
As voltage drop relates to circuit length, the length of circuit also
affects conductor size
If the number of circuits is increased to reduce voltage drop, the length of cable rather than conductor size
is increased
Meaning Higher Cu Use If…..
Low cable type ratings
Low installation method ratings
Length or number of circuits increased
…. and implications for copper

M E T A L SResearch and Consulting
Building Wire (3)
M E T A L SResearch and Consulting
Conclusions
Building wire is essentially a low value commodity product, where metal cost matters
Copper use in building wire in 2014 was 3.62 Mt, part of a 6.29 Mt market for copper in fixed wiring systems in which power cable and busbar (using Cu RBS) also feature
Between 1999 and 2014 the building wire market grew at 3.1% p.a., less than GDP but more than the addition to floorspace through construction, indicating a marginal rise in use intensity
Copper use growth, at 2.9% p.a. was less, reflecting a 9.0% p.a. growth in aluminium use
Aluminium’s share is still modest (6.7%), and is focussed on non-residential and North America
By use, the market is split between residential (47.8%) and non-residential (52.2%)
It is also split between new build (57.7%) and refurbishment (42.3%), the latter being biased towards non-residential and towards mature markets
China growth has driven the building wire market, with strong new building and a growing wire density. Its share in 2014 was 34%
Intensity of use is very high in North America. This reflects 120v consumer supply of electricity, high floorspace rates, high electricity consumption and also the classification of an unusually high proportion of fixed wiring as building wire rather than power cable
IEC and NEC guidelines set the basis for most electrical regulation and installation practice
Wiring is most often carried out at or near the minimum standard required
Interest in enhanced safety, the potential for energy saving and comfort offer room for improvement in wiring practice. This should benefit both cable sizes and cable length
M E T A L SResearch and Consulting
Recommendations (2)
Ensure Compliance with Electrical Installation Codes (continued)
Support a tougher stance on the inspection of electrical work in refurbishment
Support more regular and thorough inspection of existing electrical installations
Address Sub-Optimal and Illegal Installation Practice
Address substandard installation in new buildings where illegal through enforcement
Address substandard installation in new buildings where not illegal by education / publicity
Address substandard installation in refurbishment as above, through appropriate channels
Address the manufacture, import and sale of products specified below their labelling
Promote Higher Amp Rating of Electrical Supply
Ensure that new buildings have an electrical supply suitably future proofed without cost penalty
Ensure that supply to existing buildings can be upgraded without a cost penalty
Apply ‘Green’ Arguments Where There is an Advantage for Copper
Larger cable sizes are more energy efficient and safer – thus ’green’
If advantageous, support moves to limit or ban harmful materials in insulating / jacketing
Assess cable de-rating values and consider a) changes to PVC composition, b) limits to PVC use altogether, c) wider application of LSZF, d) requiring both LSZF and better flame retardants
Active involvement in regulatory / standard initiatives on overall energy performance of buildings
Deal With Manufacturer / Consumer Concerns Over Metal Market Dynamics
Deep concerns exist over copper price volatility: Can pricing mechanisms ameliorate this?
Make more of harmful differentials in aluminium price (with premia / rod charge) and also differences in metal quality and specification (8000 series alloys?)
…. continued
M E T A L SResearch and Consulting
Building Stock and Wire Balances
Each year stock is added, raising future refurbishment
Global Building Stock and Wire Balances in 2014
Residential StockHousing Units
(million)
Floor Space
(bn. sq. m.)Non-residential Stock
Floor Space
(bn. sq. m.)
Stock in 2013 2,022.5 146.1 Stock in 2013 70.5
New Building 39.9 3.6 New Building 1.9
Addition in Refurbishment 0.0 0.3 Addition in Refurbishment 0.2
Demolition & Abandonment -10.2 -0.9 Demolition & Abandonment -0.4
Stock in 2014 2,052.2 149.1 Stock in 2014 72.1
Residential Wirekt Cu
equivalent
kt Cu equiv.
per 100 sq.m.Non-residential Wire
kt Cu
equivalent
kt Cu equiv.
per 100 sq.m.
Newbuilds 1,053 29.3 Newbuilds 1,006 52.9
Refurb. Space Addition 82 29.3 Refurb. Space Addition 108 52.9
Other Refurbishment 573 Other Refurbishment 751
Total Wire Added 1,709 Total Wire Added 1,865
Wire Removed in Refurbishment -390 Wire Removed in Refurbishment -470
Demolition & Abandonment -220 24.8 Demolition & Abandonment -171 40.1
Net Wire Added 1,099 Net Wire Added 1,223
Floorspace addition in the building stock comes from extension in refurbishment as well as newbuilds
Losses to the building stock result from demolition and abandonment. This is typically less than 1% of the building stock, but more where there is active urban renewal
Active wiring stock additions reflect floorspace addition and loss, with wire intensity per unit space typically higher in the new installation than that preceding it
M E T A L SResearch and Consulting
China (1)
Region charts
Wire Installed & GDP Per Head Building Construction in 2014 Floorspace Development
Construction Value & Wire Market Wire End Market Trends Wire End Markets in 2014

M E T A L SResearch and Consulting
Winding Wire

M E T A L SResearch and Consulting
Winding Wire (1)
M E T A L SResearch and Consulting
Types of winding wire
CLASS
Temperature Rating 155 / 180 155 / 180 155 / 180 180 180 180 180
Base Coat Polyurethane Polyurethane Polyurethane Polyester Polyester Polyesterimide Polyesterimide
Overcoat Polyurethane Polyamide Polyamide Polyamide
Bonding Coat
CLASS GENERAL
Temperature Rating 105 / 120 130 155 180 180 180 210 / 220
Base Coat Polyvinyl Acetal Polyurethane Polyurethane Polyamideimide Mod. Polyesterimide Polyester Mod. Polyesterimide
Overcoat Polyamideimide Polyamideimide
Bonding Coat Polyvinyl Polyamide Polyamide Polyamide Polyamide Polyamide
CLASS HIGH TEMP
Temperature Rating 220 / 240 180 / 220 180 / 220 180 / 220 180 / 220 n/a n/a
Base Coat Polyamide Modified Polyester Modified Polyester Mod. Polyesterimide Mod. Polyesterimide
Overcoat Polyamide Polyamide
Bonding Coat Epoxy
HIGH TEMPERATURE / FLAT WIRE COVERED FLAT WIRE
Special PapersMica / Glass Tape or
Yarn
SOLDERABLE
BONDABLE
Groups of winding wire products
Insulating material helps to determine temperature rating and solderability
Other key characteristics include abrasion and stress resistance, resistance to solvents and transformer oil
Characteristics and performance can be enhanced by the application of an overcoat
An additional coat is applied if the coating is to bond, either at low temperature or with chemicals
Special covered constructions apply to large flat wires used mainly in transformers
These special constructions can include the use of paper (kraft, crepe, aramide) or glass (mica, fibreglass)
M E T A L SResearch and Consulting
Cu winding wire – basic segmentation
344
9044
301
1,380
133
117
299
173126
EU Oth. Europe / FSU Africa
India China Japan
S. Korea Other Asia Pacific North America
Latin America
880
1,525
121
481
Transformers Motors
Generators Other Applications
Allocation by end market group - 2013 Geographical splits - 2013
COPPER WINDING WIRE USE BY APPLICATION (KT)
2004 2005 2006 2007 2008 2009 2010 2011 2012 2013 2014 04-13
Transformers 555 573 619 689 777 742 813 869 858 880 915 5.3%
Motors 992 1,069 1,123 1,196 1,225 1,160 1,275 1,375 1,452 1,525 1,647 4.9%
Generators 111 128 141 136 127 137 144 147 129 121 121 1.0%
Other Applications 597 637 643 614 529 453 521 506 483 481 496 -2.4%
Total 2,255 2,407 2,524 2,635 2,658 2,493 2,753 2,897 2,922 3,007 3,180 3.3%
M E T A L SResearch and Consulting
An overview of winding wire types
WINDING WIRE MAY BE DEFINED BY:
Conductor material• Copper
• Aluminium
Shape• Round
• Flat (or shaped)
Temperature rating (degrees centigrade)• Ranges from 105 degrees to 240 degrees plus
• Most product is 155 or 180 degree rating
Diameter (or dimensions for flat wire)• Fine wire range 0.01 to 0.2 mm
• Mainstream market 0.2 – 2.0 mm
• Large sizes 2.0 to 6.0 mm
Insulating material (see next slide)
Special characteristics
• Solderability
• Self bonding capability
• Resistance to mechanical or chemical stress
M E T A L SResearch and Consulting
Cu winding wire, substitutes & co-products
Auminium
Other
Permanent
Magnets
ELECTRICAL STEELELECTRICAL STEEL IMPACTS ON THE
ROTOR AND STATOR MARKETS
Copper
Strip
Copper
Winding
Copper
Other
Aluminium
Winding
Aluminium
Strip
Transformers
Transformers
Other Applications
Motors & Generators
Motors & Generators
M E T A L SResearch and Consulting
Brief overview of transformer market
The power and distribution transformer market is a huge consumer of winding material, copper having the largest share
Power transformers are used in the utility transmission network, distribution transformers in the utility distribution network and by industry
In total, we estimate that in 2013 the transformer market took 880 kt of copper winding wire, and an additional 176 kt of copper strip
Aluminium is a significant contender in this market
In 2013, we estimate that aluminium use in transformers amounted to 447 kt on a copper equivalent basis
In transformers, it is appropriate to consider winding wire alongside strip
Not only is strip a large part of the copper winding market, it is an even segment of the aluminium business
Energy losses in the transmission and distribution network have been of prime concern for many years, with onerous standards due to come up to 2020
This is generally good for copper, but also spurs alternative technology development
M E T A L SResearch and Consulting
Winding Wire (2)
M E T A L SResearch and Consulting
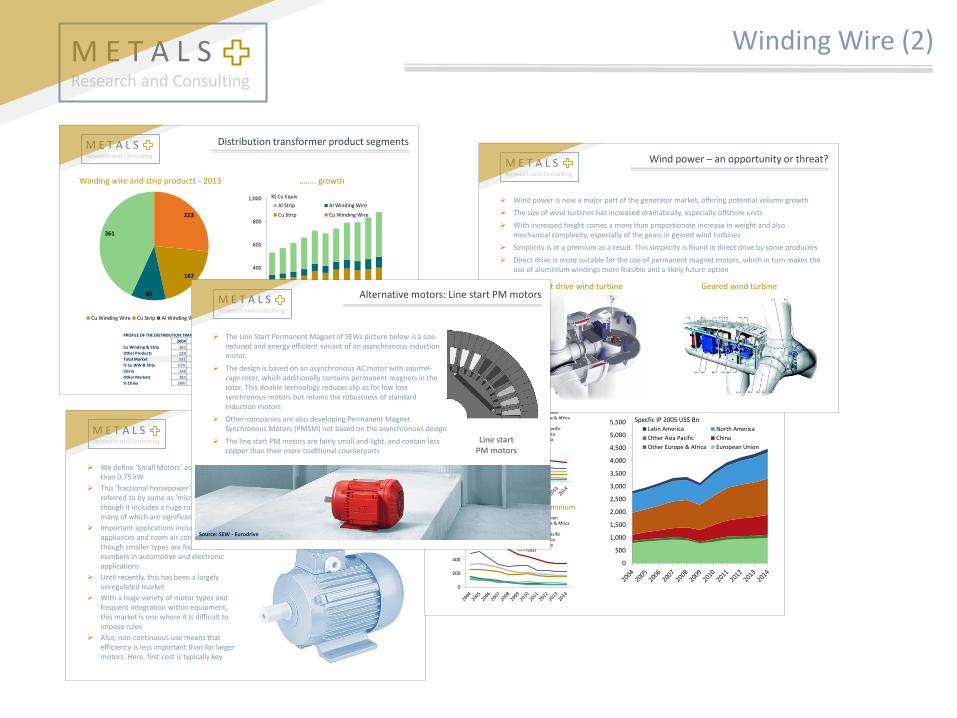
Distribution transformer product segments
223
167
87
361
Cu Winding Wire Cu Strip Al Winding Wire Al Strip0
200
400
600
800
1,000Al Strip Al Winding Wire
Cu Strip Cu Winding Wire
Kt Cu Equiv
PROFILE OF THE DISTRIBUTION TRANSFORMER MARKET (KT CU EQUIV.)
2004 2005 2006 2007 2008 2009 2010 2011 2012 2013 2014 04-13
Cu Winding & Strip 303 311 318 331 372 357 388 397 381 393 405 2.9%
Other Products 228 261 298 330 351 343 358 398 418 447 481 7.8%
Total Market 531 572 616 661 723 700 746 795 799 840 886 5.2%
% Cu WW & Strip 57% 54% 52% 50% 51% 51% 52% 50% 48% 47% 46%
China 148 150 169 200 246 248 277 298 300 323 338 9.0%
Other Markets 383 421 446 461 478 452 468 497 500 517 548 3.4%
% China 28% 26% 27% 30% 34% 35% 37% 37% 38% 38% 38%
Winding wire and strip products - 2013 …….. growth
M E T A L SResearch and Consulting
Small motor market basics
We define ‘Small Motors’ as those of less than 0.75 kW
This ‘fractional horsepower’ category is referred to by some as ‘micro-motors’, though it includes a huge range of motors many of which are significant in size
Important applications include home appliances and room air conditioners, though smaller types are found in vast numbers in automotive and electronic applications
Until recently, this has been a largely unregulated market
With a huge variety of motor types and frequent integration within equipment, this market is one where it is difficult to impose rules
Also, non-continuous use means that efficiency is less important than for larger motors. Here, first cost is typically key
Permanent magnets have gained a large slice of the rotor section of this market, as rotor material
Penetration of PMs would be greater but for uncertainty over price and availability of rare earth materials used in them
Aluminium has gained against copper in stators
M E T A L SResearch and Consulting
Cu share & intensity of use in small markets
0
500
1,000
1,500
2,000
2,500
3,000
3,500
4,000
4,500
5,000
5,500Latin America North America
Other Asia Pacific China
Other Europe & Africa European Union
Specfic IP 2005 US$ Bn
0
200
400
600
800
1,000 European UnionOther Europe & AfricaChinaOther Asia PacificNorth AmericaLatin AmericaTotal
T Cu per $ bn IP
0
200
400
600
800
1,000 European UnionOther Europe & AfricaChinaOther Asia PacificNorth AmericaLatin AmericaTotal
T Cu Equiv. per $ bn IP
Market driver: Electrical & machinery IPIntensity of use: Copper
Intensity of use: Copper & Aluminium
M E T A L SResearch and Consulting
Wind power – an opportunity or threat?
Wind power is now a major part of the generator market, offering potential volume growth
The size of wind turbines has increased dramatically, especially offshore units
With increased height comes a more than proportionate increase in weight and also mechanical complexity, especially of the gears in geared wind turbines
Simplicity is at a premium as a result. This simplicity is found in direct drive by some producers
Direct drive is more suitable for the use of permanent magnet motors, which in turn makes the use of aluminium windings more feasible and a likely future option
Direct drive wind turbine Geared wind turbine
M E T A L SResearch and Consulting
Alternative motors: Line start PM motors
57
The Line Start Permanent Magnet of SEWs picture below is a size-reduced and energy efficient variant of an asynchronous induction motor.
The design is based on an asynchronous AC motor with squirrel-cage rotor, which additionally contains permanent magnets in the rotor. This double technology reduces slip as for low loss synchronous motors but retains the robustness of standard induction motors
Other companies are also developing Permanent Magnet Synchronous Motors (PMSM) not based on the asynchronous design
The line start PM motors are fairly small and light, and contain less copper than their more traditional counterparts
Line startPM motors
Source: SEW - Eurodrive
M E T A L SResearch and Consulting
Winding Wire (3)
M E T A L SResearch and Consulting
Permanent magnets in motors
34%
6%
6%4%
3%
14%
7%
11%
3%
12%
Motors & Generators Drives, Clutches & BrakingTransducers Relays, Sensore & SwitchesWaveguides HDD, CD & DVDEnergy Prodn. & Storage TransportationAppliances Other
0
50
100
150
200
250
300
350
Latin America North America
Other Asia China
Europe & Africa
Kt Magnet Weight
PERMANENT MAGNETS IN MOTORS BY LOCATION (KT)
2004 2005 2006 2007 2008 2009 2010 2011 2012 2013 2014 2015 2016 2017
China 96 127 150 172 135 121 135 140 149 159 170 182 199 210
Other 60 65 74 80 66 59 63 67 69 72 74 76 79 82
World 157 192 224 252 201 179 199 207 218 231 244 258 279 292
Applications for permanent magnets …….. geographical splits
M E T A L SResearch and Consulting
Global market profile
Cu Winding Wire Uses
Share of Copper by MarketCu Winding & Other MaterialsIntensity of Use of Copper
Motors & Transformer MarketsTotal Cu Winding Wire Use
0
500
1,000
1,500
2,000
2,500
0
1,000
2,000
3,000
4,000
5,000
Transformer Market (MVA)
Motors & Generators (GW)
Transformer MVA M & G GW
0.0
0.5
1.0
1.5
2.0
2.5
Power Transformers Distrib. TransformersMotors to 0.75 kW Motors 0.75-37.5 kWLarge Mot. & Gen.
Kt Cu per GW or MVA
0500
1,0001,5002,0002,5003,0003,5004,0004,5005,0005,500
Permanent Magnets Other AluminiumAl Strip Al Winding WireOther Copper Cu StripCu Winding Wire
Kt Cu Equiv
0%
10%
20%
30%
40%
50%
60%
70%
80%
90%
100%
110%
Power Transformers Distrib. Transformers
Motors to 0.75 kW Motors 0.75-37.5 kW
Large Mot. & Gen.
Copper Share
19%
10%
13%33%
5%4%
16%
Power Transformers Distrib. Transformers
Small Motors Medium Motors
Large Motors Generators
Other Uses
12%4%
46%
28%
6% 4%
EU Other Europe
China Other Asia
North America Latin America
Cu Winding Wire 2013 Total = 3,007 kt M E T A L SResearch and Consulting
Market forecast to 2017
-5%
-4%
-3%
-2%
-1%
0%
1%
2%
3%
4%
Power Transformers Distrib. Transformers
Motors to 0.75 kW Motors 0.75-37.5 kW
Large Mot. & Gen.
% Change in Inensity of Use (3 Yr Moving Average)
M E T A L SResearch and Consulting
The motor repair & rewinding market
Motors above a certain size are likely to be rewound during their life cycle. Large generators and transformers are also rewound
In developed countries, motors above 100 HP will typically be rewound. In emerging markets the cut off is lower
For those motors that are repaired, around 2.5 times more motors are repaired compared to the new ones bought
Motors are repaired on average every 5-7 years
That means that a motor is repaired on average 4-6 times in its life before being permanently discarded
Rewinds may be partial or complete
Rewinding is most common in developing countries
Relatively low labour costs and the high price of a new motor favour rewinding and repair
For motors with aluminium winding, manufacturers
recommend to use copper when rewinding to raise efficiency
M E T A L SResearch and Consulting
Solenoid coils
Typical applications: Door bells, switches, circuit breakers, electric brakes for heavy vehicles, electric and directional valves, electric hammers
Biggest application is solenoid valves
Solenoids and coils are used to convert electrical energy to the mechanical force used to shift valve components to control flow or pressure.
Solenoid valves consist of a coil and a valve body. The copper coil is fitted on an armature tube
In 2010 global solenoid valve market transactions amounted to US$14 billion
Solenoid valve market is expected to exceed US$ 18.2 billion in 2014
Regulations in developed markets are promoting the use of energy efficient solenoid valves.
As of September 2012, the EU started the gradual withdrawal of incandescent solenoid valves and their substitution with LED integrated solenoid valves
Coils for solenoid valves will remain an application for copper winding wire

M E T A L SResearch and Consulting
For further information please contact Paul Dewison at:


![36 Stretch Crescent, 034 981 3710 info@pitbullequipment.co ......contents accessories [pe-100 series] pitbulltm utility crane page 1 [pe-300 series] pitbulltm utility crane page 5](https://static.documents.pub/doc/80x56/5e7afdaea1326305034be2ab/36-stretch-crescent-034-981-3710-info-contents-accessories-pe-100-series.jpg)


