Research Publications Repository Survey Report 2017 Published December 2017 Authors Simon Huggard, Deputy Director, Research and Collections, Latrobe University Kay Steel, Manager, Research and Strategic Projects, Federation University Australia Alexander Sussman, Library Manager, Southern Cross University, Coffs Harbour Contact information PO Box 8169 Australian National University ACT 0200 [email protected]www.caul.edu.au Phone +61 2 6125 2990
Transcript
Research Publications Repository Survey Report 2017
Published December 2017
Authors Simon Huggard, Deputy Director, Research and Collections, Latrobe University Kay Steel, Manager, Research and Strategic Projects, Federation University Australia Alexander Sussman, Library Manager, Southern Cross University, Coffs Harbour
Contact information
PO Box 8169 Australian National University ACT 0200
Figure 1: Proportion of institutions with a repository other than a research publications repository .. 6 Figure 2: Proportion of institutions that mandate full text deposit of research publications in repositories ............................................................................................................................................. 7 Figure 3: The number of staff responsible for RPRs reported by each institution ................................. 7 Figure 4: Proportion of institutions which reported using a certain software package ......................... 8 Figure 5: Proportion of institutions which reported using a certain research management system ..... 9 Figure 6: The proportion of institutions which reported using a certain data management system .. 10 Figure 7: The reported sources of APC funds ....................................................................................... 11 Figure 8: The proportion of methods/tools used for gathering feedback by responding institutions. 11 Figure 9: The proportion of institutions which reported RPR discoverability with certain search engines and portals ............................................................................................................................... 12
RPR Survey Report Updated 20/12/2017
4
Introduction
CAUL has conducted an annual survey of research publication repositories (RPR) since 2009. The results of these surveys provide a valuable picture of repository development and management over time and increasingly the information is of interest not only to CAUL members but to other organisations including government departments and research granting agencies such as the Australian Research Council.
For a variety of reasons, the RPR survey was not conducted in 2015 and 2016. This current survey was conducted between 12 May and 9 June 2017.
Responses were received from all eight New Zealand university libraries. Of the Australian university libraries, 3 did not respond and 2 provided more than one response, giving a total of 47 responses to the survey.
Key Findings
Questions from the 2014 survey were reviewed and updated to reflect current interests and changes in the repository landscape. Most questions remained substantially the same.
Some of the key issues from the survey, particularly in relation to changes since 2014 were:
● Mandatory open access (OA) policies are still an area which needs more work. There remain
only 36% of institutions with such a policy. This figure hasn’t changed in 4 years.
● Only 6 institutions have tagged records linked to ARC & NHMRC open access policies. With
the emphasis on open access in the 2018 Excellence in Research for Australia (ERA)
reporting, this is a big issue for repository managers and institutions.
● Staffing is rather fluid, but 43% had increases since 2014. Repository work is becoming much
more diverse, with 71% of institutions reporting that they have repositories other than
publication repositories.
● Software used in traditional publication repositories and emerging research data
management areas is very diverse, and will continue to change over time. DSpace still
dominates the former and RedBox the latter, but development of strong vendor products
which can support flexible workflows, variance in content types and the ability to transfer
data between systems would be attractive to institutions.
● Automated data flows are increasing (between Research Management systems and
Repository systems). Self-deposit is decreasing in response to more automated workflows.
● ORCID integration could increase. Only 37% of repositories use ORCIDs.
● Annual publication collection (previously HERDC – 46%) and ERA (84%) exercises are strong
drivers of engagement or use of repositories internally and this is consistent with the 2014
response.
● Issues relating to Article Processing Charges are interesting, with libraries contributing
advice as well as funding (27%). This is likely to be an area of focus over the next few years.
● Discovery has improved enormously, the result of better software, more effort regarding the
importance of this, and more awareness of work required to optimise repository discovery.
RPR Survey Report Updated 20/12/2017
5
Challenges
A number of challenges have emerged from the survey which libraries, repository managers and CAUL will need to address in the near future:
1. Lack of awareness and value of repository functions. Many institutions are still not aware of
work required to ensure repositories are high performing and provide value to institutions
and researchers.
2. Time poor researchers. Engagement with repositories by time poor researchers is an issue. If
repository software is poor and doesn’t allow easy integration, upload, bulk ingest,
engagement or value, then libraries will continue to bear the burden of a lot of work without
much support from key stakeholders (researchers and research offices).
3. ERA workload is an issue. Libraries are heavily invested in ERA work, in addition to regular
repository work.
4. Distrust of open access remains a problem. Predatory publishing, article processing fees and
value of open access deposit into repositories continue to be issues which must be
addressed.
5. The role of libraries in payment of APCs is an important corollary to the OA issue identified
above. The ways in which libraries mediate assistance for APCs, whether by direct funding
(total or partial) or through membership of publisher schemes, is of increasing interest.
Opportunities
In relation to the challenges mentioned above, a number of opportunities for libraries to raise the profile of the RPR and ensure that activities of its staff are aligned with University research/OA directions can be identified from the survey:
1. Increasing the awareness of advantages to both the researcher and the University of Green
OA publishing through deposit of research publication outputs into RPRs. Studies of citation
advantage enable a strong case to be made.
2. Targeted provision of statistical information available from RPRs relating to downloads,
citation and altmetrics as an adjunct to formal research assessment exercises by institutions.
This can be made available on an individual researcher, department, or discipline basis to
increase awareness of both the RPR and OA.
3. Contribute to ORCID implementation initiatives to maximise return on membership of the
local ORCID consortium as well as benefits to researchers and institutions.
4. Investigate proactive tagging of mandated OA deposited publications to highlight continued
importance of the RPR to ERA and similar exercises.
5. Differentiate effectively to users between RPRs and research data and other repositories
6. Proactive facilitation of automated data flows between enterprise systems including RMS,
RPRs, ORCID and research data and other repositories to streamline research data
management and related processes.
RPR Survey Report Updated 20/12/2017
6
Detailed findings
This section presents more detailed information about the survey’s results, as well as comparisons with data from previous RPR surveys.
Different repository types
71% of institutions have repositories other than research publication repositories.
Do we need to widen the scope of our repository work to include other systems? Many libraries are now supporting these systems and integration is a key to success, with good workflows a strong requirement. Clarifying the roles of RPRs and research data and other repositories is also important when multiple repository options are provided to researchers.
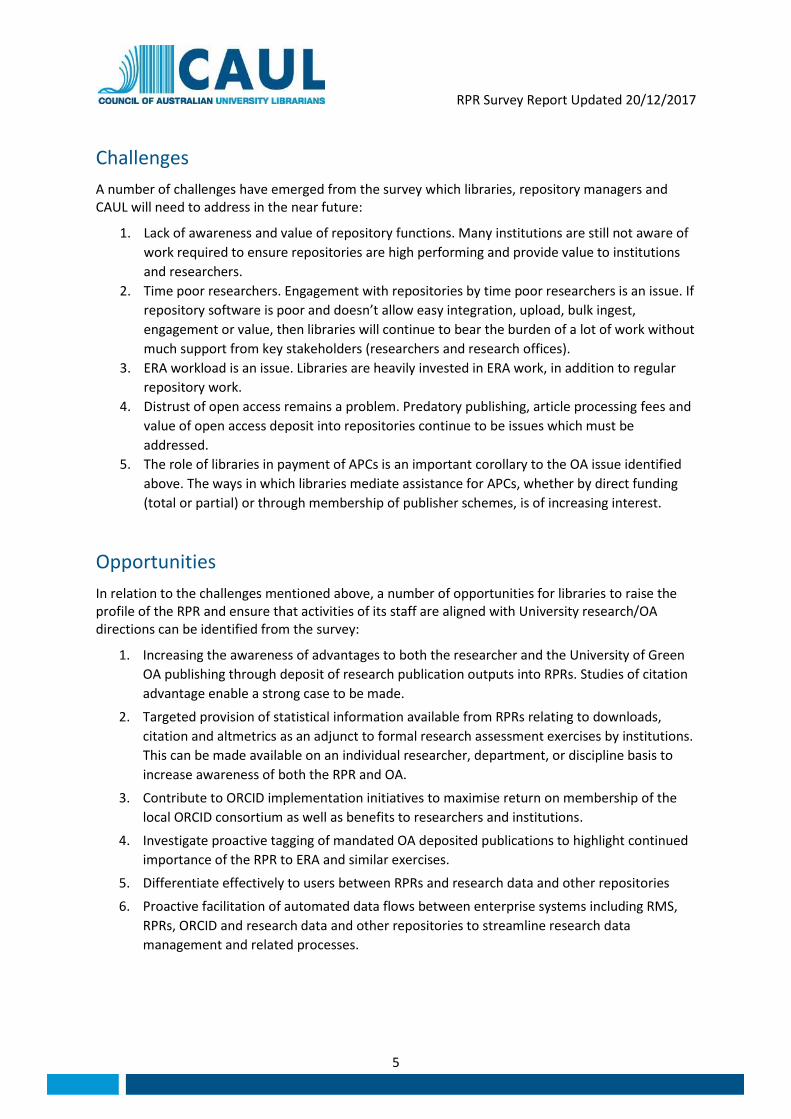
Figure 1: Proportion of institutions with a repository other than a research publications repository
Mandatory open access policies
Only 36% of universities mandate full text deposit of research publications into repositories, consistent with the 2014 figure of 37%. However, for ERA publications institutional mandates increase to 45% (but of course we can’t use these outputs for open access).
We’ve still got a long way to go, but this provides an opportunity for libraries to commence (or continue) discussions around how and whether such a mandate would provide value to the institution.
Theses play a big part in repositories and are very successful. Over 75% of repositories have undertaken retrospective submission of older theses (down from 80% in 2014). 44% obtained permission from authors before doing so, whilst 47% did not (but relied on take-down notices).
Yes72%
No28%
RPR Survey Report Updated 20/12/2017
7
Figure 2: Proportion of institutions that mandate full text deposit of research publications in repositories
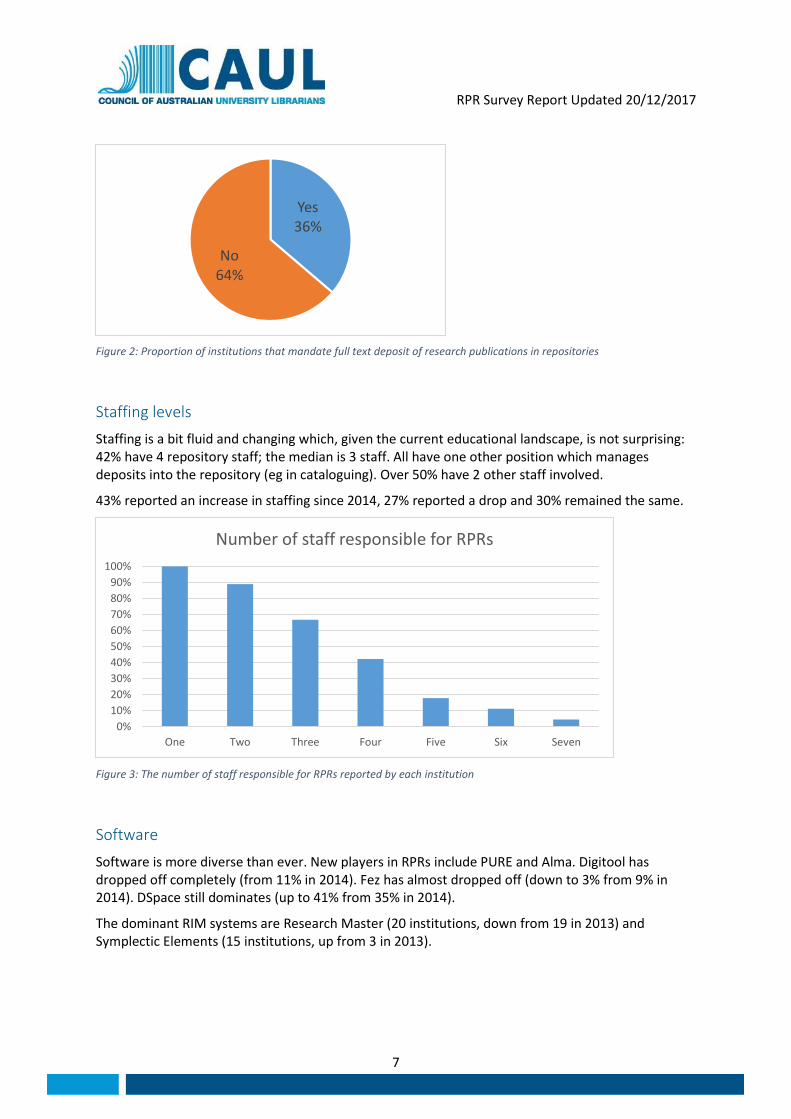
Staffing levels
Staffing is a bit fluid and changing which, given the current educational landscape, is not surprising: 42% have 4 repository staff; the median is 3 staff. All have one other position which manages deposits into the repository (eg in cataloguing). Over 50% have 2 other staff involved.
43% reported an increase in staffing since 2014, 27% reported a drop and 30% remained the same.
Figure 3: The number of staff responsible for RPRs reported by each institution
Software
Software is more diverse than ever. New players in RPRs include PURE and Alma. Digitool has dropped off completely (from 11% in 2014). Fez has almost dropped off (down to 3% from 9% in 2014). DSpace still dominates (up to 41% from 35% in 2014).
The dominant RIM systems are Research Master (20 institutions, down from 19 in 2013) and Symplectic Elements (15 institutions, up from 3 in 2013).
Yes36%
No64%
0%
10%
20%
30%
40%
50%
60%
70%
80%
90%
100%
One Two Three Four Five Six Seven
Number of staff responsible for RPRs
RPR Survey Report Updated 20/12/2017
8
Figure 4: Proportion of institutions which reported using a certain software package
Statistics
Altmetrics continue to grow (60% display altmetrics in their public view). Display of citation metrics is growing (58%) and private views of citations/metrics is relatively high (providing a more tailored view to academics).
Workflows
These are moving to much more automated mechanisms.
Self-deposit and mediated deposit of full text is reducing (down to about 44% from about 65% in 2014) to being more automated (metadata pushed to repository by Symplectic or other software 44%). Collecting of material by repository staff independently is reducing as well (down from 55% to 48%).
In order to support this an increased number, but still only 30% of systems (both RIM and RPRs), display Sherpa/Romeo information to users.
Identifiers & metadata
ORCID integration is reasonable (37%) but could improve, given that about 68% of institutions have integrated ORCID into their publication harvesting or research management systems (this figure comes from the ORCID consortium).
Dublin Core remains the principle metadata standard for almost 90% of institutions, consistent with the 2014 response.
Content management
Annual publication collection (previously HERDC) (46%) and ERA (84%) exercises are strong drivers of engagement or use of repositories internally and this is consistent with the 2014 response.
0%
5%
10%
15%
20%
25%
30%
35%
40%
45%
Dspace Vital Eprints DigitalCommons -
BePress
Pure AlmaDigital/Primo
EquellaFez
Software
RPR Survey Report Updated 20/12/2017
9
The number of integrations with RIM systems is the same (63%) but automated workflows into repositories has increased from 53% in 2013 to 60%. The use of a single entry point for publications (eg. Symplectic) which feeds into RIM systems and repositories has remained stable since 2014 at about 10%.
Repositories are strengthening their role in the RIM space, with 68% of systems technically capable of tagging mandated deposit of open access material, compared with 57% in 2013.
Only 6 institutions (Wollongong, Flinders, University of Melbourne, WSU, University of Tasmania, QUT) reported 100% of records are tagged in this way.
Figure 5: Proportion of institutions which reported using a certain research management system
Copyright management
Almost all repositories are used to record copyright information and licensing (over 93%).
The number of take-down notices is still very small with most having none, and the rest 1-6 in the previous year, with only 1 reporting a take-down notice being received from publishers.
In terms of copyright advice, 95% of repository staff answer copyright questions with advice from University copyright officers (80%), as well as some involvement from liaison librarians (42%) and others.
Data management
There is greater use of research data management systems. 35% of institutions had no system in 2014, reducing to 32% in 2017. However, the diversity of systems is growing and there is no clear preference, although RedBox (at 32%) and CloudStor (at 18%) are presently the most used systems.
0%
10%
20%
30%
40%
50%
ResearchMaster
SymplecticElements
Other IRMA Pure InfoED Peoplesoft Callista Unsure
Research management system used
RPR Survey Report Updated 20/12/2017
10
Figure 6: The proportion of institutions which reported using a certain data management system
Use of RedBox is much the same, from 13 in 2014, to 14 in 2017 (32%). Figshare (5, or 11%) and CloudStor (8, or 18%) have emerged, but “other” (45% up from 15% in 2014) indicates a growing diversity of research data management platforms.
Whilst the diversity of research data management systems probably reflects diversity of disciplinary solutions and needs (and is therefore more complex for library staff to engage with), there is still a lot of manual work in adding data to repositories (58% are adding data) and another 22% intend to add data to their repositories in future. This is a big increase from 2013 when most were not doing this (but 45% were planning to do so).
53% responded that they were providing a research data deposit/storage service with another 26% planning to do so in future.
Other services provided via repositories
The number of institutions providing personal services to researchers has changed little since 2014 and remains at about 40%. The most popular services involve the generation of information likely to be of direct value to authors. These include publications lists (40%), externally facing profile pages (27%), and internally facing profile pages (9%).
Profile pages are also being planned by another 24% of respondents.
Future services which are being planned for the RPR include a range of publishing initiatives, ORCID integration, digital preservation capability, improved citation management and DOI minting of grey literature.
Article Processing Charges
Responses to questions regarding APCs were informative as this continues to be an area of interest within the sector.
22% responded that their institution provides financial assistance for payment of APCs, a slight increase since 2014. A further 25% provide other assistance towards APCs, such as discounts and publisher memberships.
0%
10%
20%
30%
40%
50%
Other RedBox None Cloudstor Figshare VIVO / VITRO MyTardis Unsure
Research data management systems used
RPR Survey Report Updated 20/12/2017
11
Figure 7: The reported sources of APC funds
Promotion/feedback
Most repository managers receive direct feedback via departments or faculties and meetings; few undertook surveys or sought feedback through focus groups. Almost one-third of respondents did not gather user feedback about the RPR.
Figure 8: The proportion of methods/tools used for gathering feedback by responding institutions
Discovery
Almost all systems are discoverable via Google and Google Scholar. Numbers for other systems such as OAI Search, OAISter, ROAR and library systems were all generally consistent with the 2014 survey, reflecting the continuing sustained effort into finding and implementing solutions to promote repositories, which is very pleasing to see (and software is probably just getting better anyway).
27%
23%41%
27%
Sources of APC funds
Library
Research Office
Dept. or Faculty
Other
0%
5%
10%
15%
20%
25%
30%
35%
40%
45%
50%
Other Department orFaculty
No tools Regular meetings Surveys Focus Groups
Methods/tools used for gathering feedback
RPR Survey Report Updated 20/12/2017
12
Figure 9: The proportion of institutions which reported RPR discoverability with certain search engines and portals