HSE Health & Safety Executive Assessment of benefits of fire compartmentation in chemical warehouses Prepared by WS Atkins Consultants Ltd for the Health and Safety Executive 2003 RESEARCH REPORT 152
Transcript
HSE Health & Safety
Executive
Assessment of benefits of fire compartmentation in chemical warehouses
Prepared by WS Atkins Consultants Ltd for the Health and Safety Executive 2003
RESEARCH REPORT 152
HSE Health & Safety
Executive
Assessment of benefits of fire compartmentation in chemical warehouses
RC Houlding, PJ Rew WS Atkins Consultants Ltd
Woodcote Grove Ashley Road
Epsom Surrey
KT18 5BW
Currently, specific advice for the design of fire protection in chemical warehouses is lacking particularly with regard to the limitation of off-site hazards. This report considers the benefit of various compartment wall options in mitigating against fire hazards and their cost-effectiveness in relation to other fire protection measures.
A model has been developed for assessing the risk reduction derived from, and costs associated with, the installation of fire protection measures in chemical warehouses. The model considers the relative benefit of fire protection measures in limiting fire spread through output of a damage area-fire frequency product. The damage area is considered to correlate well with the severity of offsite effects such as the production of smoke plumes and fire water run-off. The model is essentially probabilistic but includes simple deterministic assessment of fire growth, fire spread across separation and withstand duration for fire compartment components. In the development and testing of the model, various model uncertainties and weaknesses were identified, many of which could be rectified through further development of the model. Potential key areas for model improvement are listed in the report.
In addition to the development of the risk model, a detailed deterministic assessment was undertaken of missile and blast effects on compartmentation from the sudden failure of metal drums containing liquid fuels. The report provides the results of this assessment for a reinforced concrete wall, a blockwork wall and a plasterboard stud partition.
This report and the work it describes were funded by the Health and Safety Executive (HSE). Its contents, including any opinions and/or conclusions expressed, are those of the authors alone and do not necessarily reflect HSE policy.
ISBN 0 7176 2744 6All rights reserved. No part of this publication may bereproduced, stored in a retrieval system, or transmitted inany form or by any means (electronic, mechanical,photocopying, recording or otherwise) without the priorwritten permission of the copyright owner.
Applications for reproduction should be made in writing to: Licensing Division, Her Majesty's Stationery Office, St Clements House, 2-16 Colegate, Norwich NR3 1BQ or by e-mail to [email protected]
1.1 Background ................................................................................................................................ 21.2 Objectives .................................................................................................................................. 21.3 Scope of work ............................................................................................................................ 2
2. REVIEW OF CURRENT LEGISLATION AND GUIDANCE .................................................... 42.1 General....................................................................................................................................... 42.2 UK guidance .............................................................................................................................. 4
2.2.1 Building Codes..................................................................................................................42.2.2 LPC Design Guide for the Fire Protection of Buildings ................................................... 52.2.3 Health and Safety Executive guidance.............................................................................. 6
2.3 US guidance ............................................................................................................................... 62.3.1 NFPA Codes......................................................................................................................62.3.2 Occupational Safety and Health Administration............................................................... 8
2.4 Australian guidance ................................................................................................................... 92.5 New Zealand guidance............................................................................................................... 92.6 European Guidance.................................................................................................................. 10
2.6.1 Recommendations for Fire Protection of Stores Containing Hazardous Substances ...... 102.6.2 Technical rules for dangerous goods TRGS 515 (Germany) .......................................... 112.6.3 Toxic Storage Facilities TRGS 514 (Germany) .............................................................. 122.6.4 Guidelines for retention of fire water run-off (Germany) ............................................... 13
3. MODEL FRAMEWORK............................................................................................................. 153.1 Model background ................................................................................................................... 153.2 Model structure ........................................................................................................................ 153.3 Fire source and storage configuration...................................................................................... 173.4 Compartment wall options ....................................................................................................... 193.5 Fire initiation............................................................................................................................ 193.6 Fire withstand of compartment walls....................................................................................... 203.7 Fire segregation and separation ............................................................................................... 213.8 Impact of sudden failure of containers..................................................................................... 22
4. PROBABILITY DATA FOR FIRE PROTECTION MEASURES ............................................. 244.1 General..................................................................................................................................... 244.2 Detection .................................................................................................................................. 244.3 Automatic fire suppression ......................................................................................................27 4.4 Manual fire-fighting................................................................................................................. 294.5 Early failure of fire compartmentation..................................................................................... 294.6 Fire compartment withstand and Fire Brigade intervention .................................................... 33
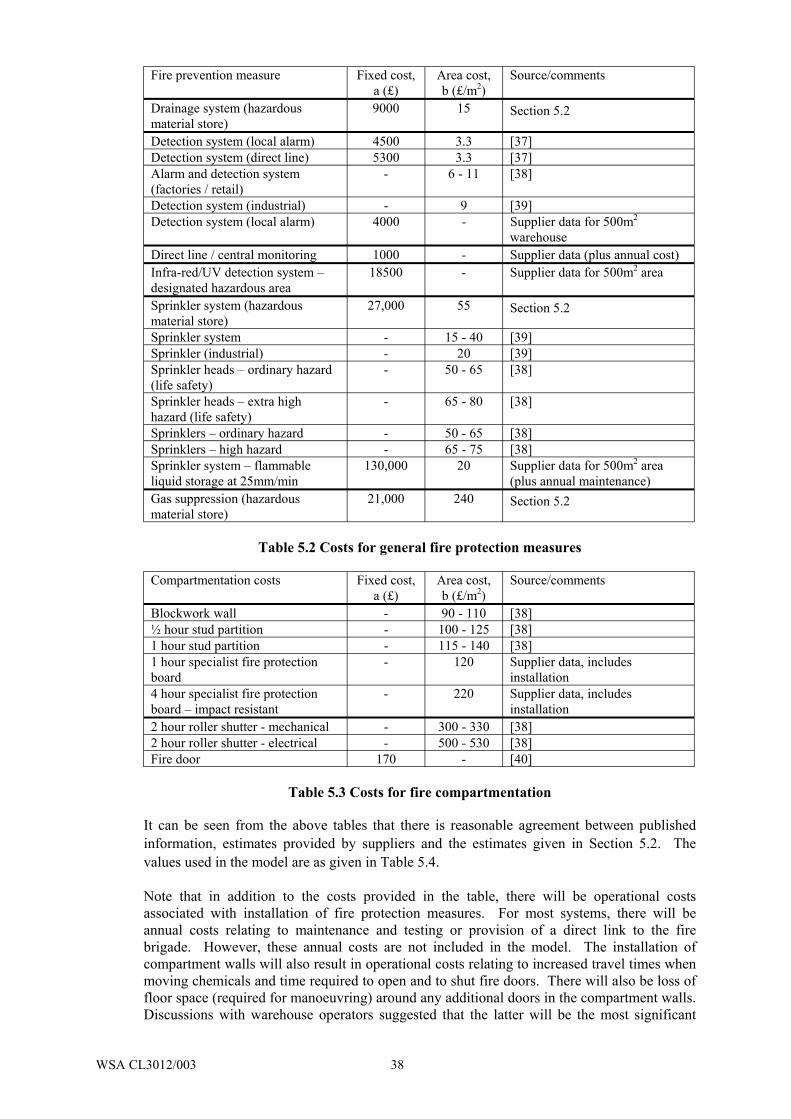
5. COSTS ASSOCIATED WITH FIRE PREVENTION MEASURES .......................................... 365.1 Assumptions made in defining costs........................................................................................ 365.2 Cost options for highly inflammable/hazardous liquid storage facility ................................... 365.3 Cost estimates used in model ................................................................................................... 37
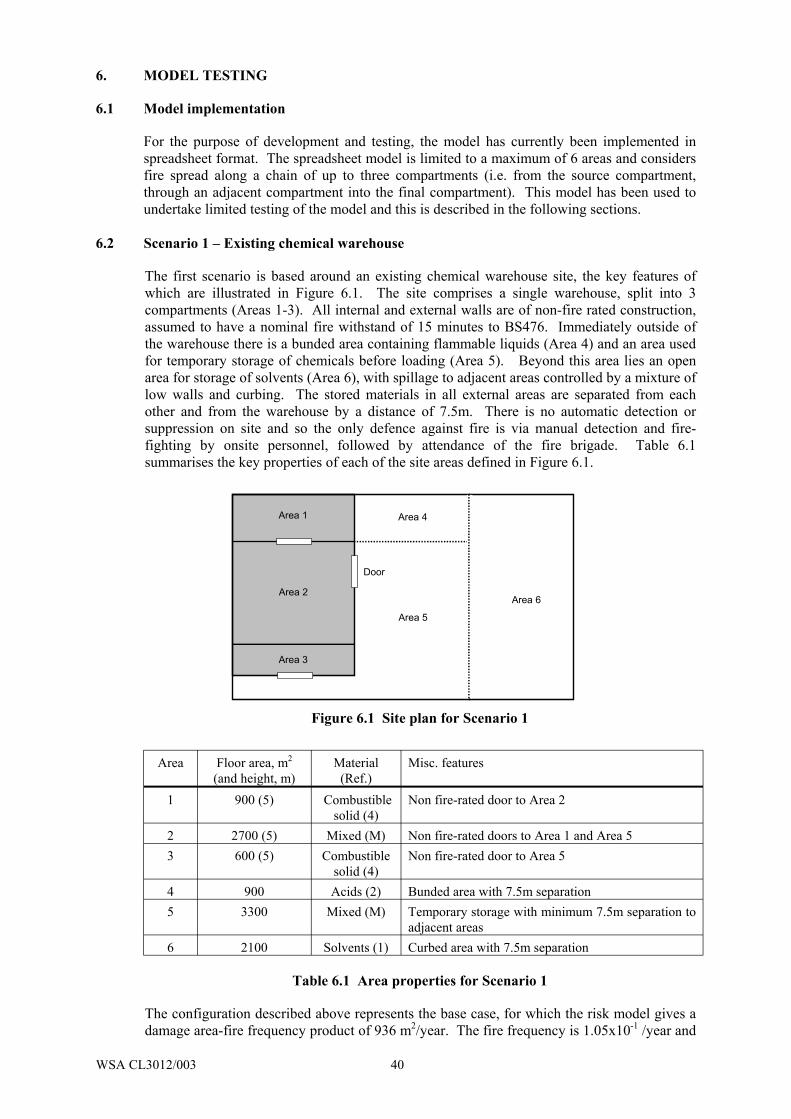
6. MODEL TESTING ...................................................................................................................... 406.1 Model implementation ............................................................................................................. 406.2 Scenario 1 – Existing chemical warehouse.............................................................................. 406.3 Scenario 2 – Modern warehouse.............................................................................................. 416.4 Sensitivity of model results to choice of probabilities for sudden burst of containers ............ 44
7. CONCLUSIONS .......................................................................................................................... 467.1 Review of current legislation and guidance ............................................................................. 467.2 Model development ................................................................................................................. 467.3 Model testing ........................................................................................................................... 477.4 Modelling uncertainties and further development ................................................................... 47
APPENDIX A – Impact of Sudden Failure of Container on Compartment Wall
WSA CL3012/003 1
1. INTRODUCTION
1.1 Background
This study concerns the fire protection measures that can be applied to chemical warehouse storage. As discussed by Tyldesley [1], fire hazards from pesticide warehouses have been the topic of much research, because they are subject to major hazard legislation in Europe. However, while experience has shown that fires in non-pesticide chemical warehouses are also a concern, specific advice for the design of such warehouses is lacking, particularly with regard to the minimisation of off-site hazards, such as the effects of dispersion of smoke.
This report discusses the benefit of various compartment wall options in mitigating fire hazards. It then describes the development of a model for comparing the risk reduction resulting from the installation of different fire protection measures within a chemical warehouse site.
1.2 Objectives
The following summarises the objectives defined for this study:
1) To review current legislation and guidance on the design of warehouses for storage of dangerous goods, with particular attention to compartmentation requirements, in respect of the storage of different types of materials, and overall size limitations of compartments.
2) To assess the costs associated with compartmentation, and to compare these with alternative risk reduction measures that could be usefully applied for dangerous goods stores.
3) To assess the ability of different types of compartment wall of a 1 hour standard to withstand impact by small containers or the pressure pulse associated with the sudden failure of small containers in a fire situation. Construction methods considered are reinforced concrete, brickwork/blockwork, plaster or mineral insulation board on a suitable metal or timber frame.
4) To assess the benefits arising from compartmentation and alternative risk reduction measures, in terms of maximum size of likely fire, numbers of people at risk, probability of fire spread to adjacent outdoor storage, chemical process plant or off-site.
5) To produce a risk assessment model drawing together relationships between costs and benefits, and providing a means by which an informed selection between types of fire protection for the design of a new warehouse may be made.
6) To apply the model to selected scenarios, as a check on its practicality, consistency and usefulness.
1.3 Scope of work
The review of current legislation and guidance covers building regulations and guidance in the UK (England and Wales and Scotland), and 4 other countries drawn from Europe/North America/Australia/New Zealand.
The types of hazardous incidents considered in the risk assessment model include a fire starting inside a warehouse and a fire starting in open air chemical storage close to the warehouse. Buildings considered have a large range of sizes and cover typical heights, with racked or free standing storage. The model considers 5 representative chemicals: heptane; acetic acid; aniline, lead oxide and nitric acid.
The risk assessment model allows for:
WSA CL3012/003 2
� the influence of separation (or lack of it) between different types of chemicals to be taken into consideration;
� the different relative rates of fire growth for different types of chemicals to be taken into consideration;
� different assumptions to be made about the influence of fire fighting by fire brigade staff in the course of a fire.
The model incorporates available data on the reliability of different types of fire mitigation measures.
WSA CL3012/003 3
2. REVIEW OF CURRENT LEGISLATION AND GUIDANCE
2.1 General
This section of the report gives an overview of the legislation and guidance that applies to the design of warehouses for the storage of dangerous goods. This has been carried out with particular attention to the requirements for compartmentation for storage of different types of materials as well as the overall size limitations. Requirements and recommendations concerning other fire mitigation measures have also been noted.
In order to reflect the design of dangerous goods warehouses on an international basis, with particular attention to countries where performance-based design codes are used, the following countries have been considered:
Specific design guidance is generally contained within national standards rather than in general building codes. This applies for all the countries considered. Fire safety, as considered by most building codes, is generally with respect to life safety rather than property protection and mitigation of effects on the environment. More specific information is often contained within guidelines produced by organisations representing the insurance industry and government or industry bodies with a particular interest, e.g. Health and Safety Executive. This overview considers guidance contained in:
� Building Codes; � National Standards; � Health and Safety Recommendations; � Insurance Industry Recommendations; � Industries’ own guidance.
It should also be noted that the provision of a particular fire safety measure may in itself have an influence on the design of a dangerous goods warehouse. This is particularly the case with sprinklers since their performance is based on empirical data and therefore only particular proven configurations of packaging materials and storage arrangements may be considered for a specified material.
2.2 UK guidance
2.2.1 Building Codes
The UK is covered by separate general building codes for England and Wales, Scotland and Northern Ireland. They contain general guidance, which is intended to ensure adequate standards of life safety. However, within that scope there are specific recommendations of relevance to compartmentation in chemical warehouses. In England and Wales Approved Document B and in Scotland the Technical Standards give guidance or requirements on how to meet the objectives of the Building Regulations 1991 and the Building Standards (Scotland) Regulations 1990 respectively.
WSA CL3012/003 4
England and Wales
Size In England and Wales dangerous goods storage is classified within the ‘Storage’ purpose group. As such the maximum allowable compartment volume would be 20,000m3, if the storey height is less than 18m and the building is not sprinklered.
Fire Control Measures In both England and Wales, where a sprinkler system is installed, the allowed compartment volume is doubled.
Fire Resistance For single-storey buildings the fire resistance period would be 60 minutes unsprinklered and 30 minutes with sprinklers. Compartment walls separating buildings should have a fire resistance of at least 60 minutes.
Automatic Fire Detection Automatic fire detection systems are not normally needed unless the area is not regularly visited.
Scotland
Size In Scotland the classification of dangerous goods storage is more specific and would be included within the ‘High Hazard Storage’ purpose group. The maximum compartment floor area would be 1,000m2, with an unlimited volume.
Fire Control Measures In Scotland where a sprinkler, CO2, foam or powder system is installed, the allowed compartment area is doubled.
Fire Resistance In Scotland fire resistance is related not only to purpose group, but also to the area or volume of the compartment. For chemical storage only area is applicable, such that, for compartments under 100m2; 60 minutes fire resistance is required, under 500m2; 180 minutes fire resistance is required and under 1,000m2; 240 minutes fire resistance is required.
If a suitable fire control system in provided, then the fire resistance period may be reduced by 30 minutes.
Automatic Fire Detection There is no requirement for automatic fire detection in storage occupancies.
2.2.2 LPC Design Guide for the Fire Protection of Buildings
This guidance published by the Loss Prevention Council (LPC) is intended to address property protection issues. It is designed to complement the life safety recommendations of Approved Document B and the Technical Standards.
Size The maximum recommended compartment area is 4000m2. However it is recommended that, where highly combustible substances or flammable liquids are stored, a risk assessment is carried out to determine the need for further subdivision.
Fire Control Measures If the building is equipped with a sprinkler system, the allowed compartment floor area is doubled. The sprinkler system should be linked to a remote monitoring service.
WSA CL3012/003 5
Fire Resistance The recommended fire resistance is 240 minutes; however in a sprinklered compartment this may be reduced to 120 minutes.
Automatic Fire Detection Automatic fire detection should be considered.
2.2.3 Health and Safety Executive guidance
The Health and Safety Executive publishes a number of guides in this field, the most pertinent of which are HSG71, ‘Chemical Warehousing, the storage of dangerous substances’ and HSG51, ‘The storage of flammable liquids in containers’.
HSG71, ‘Chemical Warehousing, the storage of dangerous substances’
The fire resistance of compartmentation will depend on a variety of factors including the anticipated fire load and duration, and the arrival time of the fire brigade. Automatic fire detection is recommended. Suppression systems should be considered and foam should be added to sprinkler systems which protect flammable liquid stores.
HSG51, ‘The storage of flammable liquids in containers’
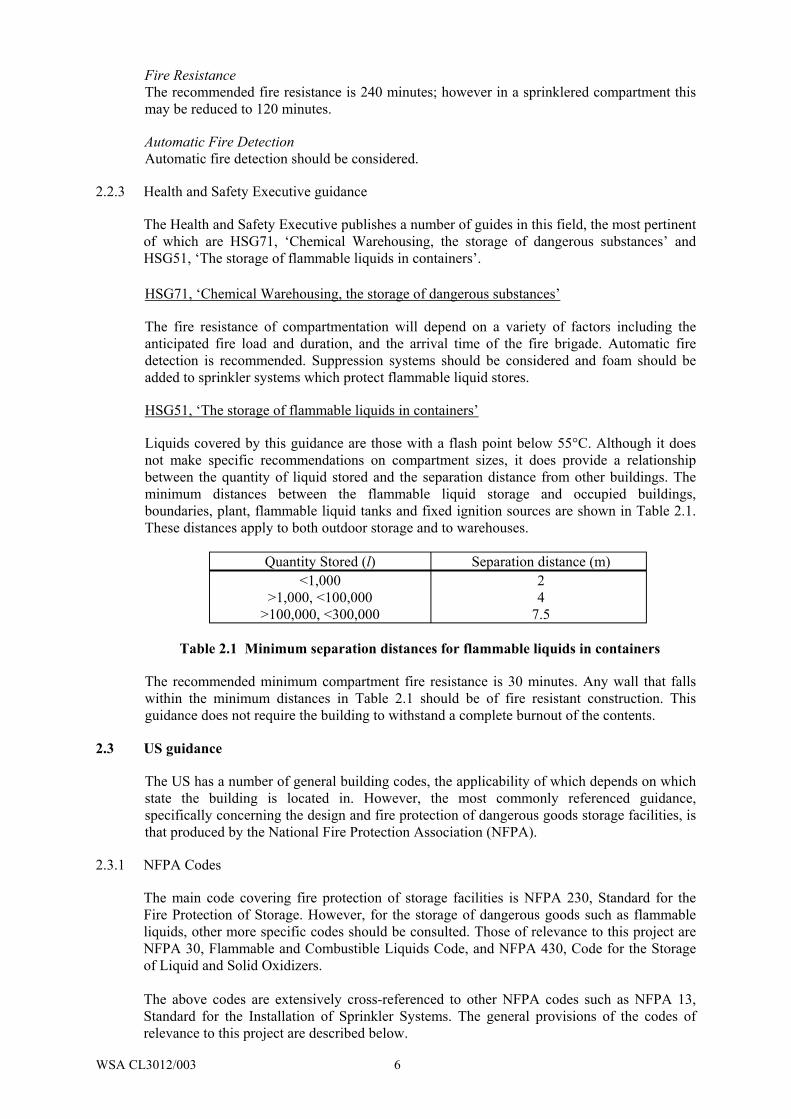
Liquids covered by this guidance are those with a flash point below 55°C. Although it does not make specific recommendations on compartment sizes, it does provide a relationship between the quantity of liquid stored and the separation distance from other buildings. The minimum distances between the flammable liquid storage and occupied buildings, boundaries, plant, flammable liquid tanks and fixed ignition sources are shown in Table 2.1. These distances apply to both outdoor storage and to warehouses.
Table 2.1 Minimum separation distances for flammable liquids in containers
The recommended minimum compartment fire resistance is 30 minutes. Any wall that falls within the minimum distances in Table 2.1 should be of fire resistant construction. This guidance does not require the building to withstand a complete burnout of the contents.
2.3 US guidance
The US has a number of general building codes, the applicability of which depends on which state the building is located in. However, the most commonly referenced guidance, specifically concerning the design and fire protection of dangerous goods storage facilities, is that produced by the National Fire Protection Association (NFPA).
2.3.1 NFPA Codes
The main code covering fire protection of storage facilities is NFPA 230, Standard for the Fire Protection of Storage. However, for the storage of dangerous goods such as flammable liquids, other more specific codes should be consulted. Those of relevance to this project are NFPA 30, Flammable and Combustible Liquids Code, and NFPA 430, Code for the Storage of Liquid and Solid Oxidizers.
The above codes are extensively cross-referenced to other NFPA codes such as NFPA 13, Standard for the Installation of Sprinkler Systems. The general provisions of the codes of relevance to this project are described below.
WSA CL3012/003 6
NFPA 230, Standard for the Fire Protection of Storage
This code recommends sprinkler protection for most types of storage. The provisions contained within the code are of a very general nature.
NFPA 30, Flammable and Combustible Liquids Code
General This code uses a series of decision trees to determine the appropriate fire protection strategyfor a particular set of storage circumstances. These decision trees take account of the following factors:
� Container material, i.e. metal, plastic, fibreboard or glass; � Water miscibility; � Class of liquid; � Viscosity; and � Storage method, i.e. racks, pallets or shelves.
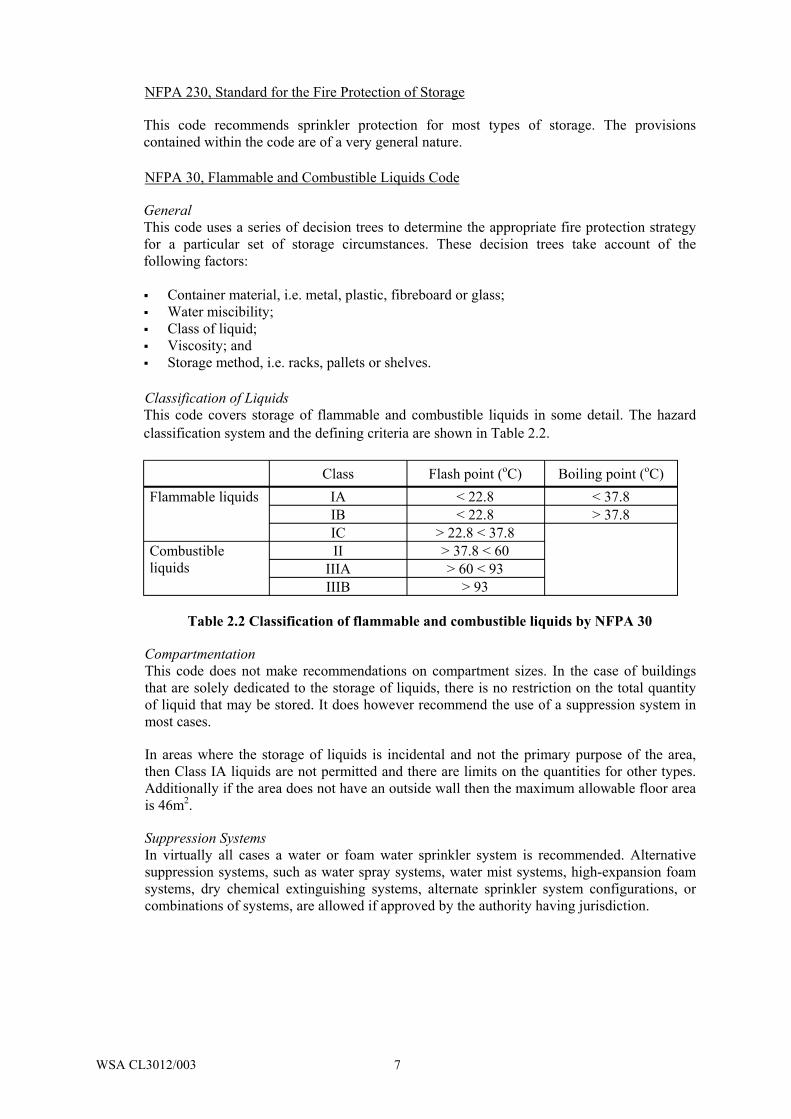
Classification of Liquids This code covers storage of flammable and combustible liquids in some detail. The hazard classification system and the defining criteria are shown in Table 2.2.
Class Flash point (oC) Boiling point (oC) Flammable liquids IA < 22.8 < 37.8
IB < 22.8 > 37.8 IC > 22.8 < 37.8
Combustible II > 37.8 < 60 liquids IIIA > 60 < 93
IIIB > 93
Table 2.2 Classification of flammable and combustible liquids by NFPA 30
Compartmentation This code does not make recommendations on compartment sizes. In the case of buildings that are solely dedicated to the storage of liquids, there is no restriction on the total quantity of liquid that may be stored. It does however recommend the use of a suppression system in most cases.
In areas where the storage of liquids is incidental and not the primary purpose of the area, then Class IA liquids are not permitted and there are limits on the quantities for other types. Additionally if the area does not have an outside wall then the maximum allowable floor area is 46m2.
Suppression Systems In virtually all cases a water or foam water sprinkler system is recommended. Alternative suppression systems, such as water spray systems, water mist systems, high-expansion foam systems, dry chemical extinguishing systems, alternate sprinkler system configurations, or combinations of systems, are allowed if approved by the authority having jurisdiction.
WSA CL3012/003 7
Fire Resistance The interior walls, ceilings and floors of warehouse buildings should have a fire resistance of 240 minutes. In the case of buildings fitted with water or foam water sprinkler systems, this may be reduced to 120 minutes. This also applies to buildings where Class IIIB liquids are stored without sprinkler protection.
Drainage Curbs or suitable drainage should be provided to prevent the flow of liquids into adjacent buildings. This is not necessary with storage of liquids in Class IIIB.
NFPA 430, Code for the Storage of Liquid and Solid Oxidizers
Classification The code classifies oxidisers according to their behaviour characteristics as outlined in Table 2.3.
Behaviour Class 1 Class 2 Class 3 Class 4
Increase in burning rate of Does not Moderate Severe Severe combustible materials with moderately which oxidiser is in contact increase
When contaminated or None None Vigorous self- Explosive exposed to thermal or sustained reaction physical shock decomposition
Table 2.3 Classification of oxidisers according to NFPA 430
Compartmentation The code does not give maximum compartment sizes; instead it gives maximum allowable quantities of oxidiser per building. These vary depending upon whether the storage is in a:
� segregated part of another building (by distance from incompatible materials); � fire-separated part of another building; � fully detached building.
The maximum allowable quantities may be increased if sprinklers are installed. Furthermore, the maximum allowable sprinklered storage quantities may be increased by factors of either 2 or 4 (depending on the class of oxidiser), if the following criteria are met:
� storage is in separated or detached building; � non-retail occupancy; and � oxidiser is in non-combustible containers; or � building is constructed of non-combustible materials.
Fire Resistance Compartment walls should have a fire resistance of between 60 minutes and 120 minutes depending upon the oxidiser class.
Fire Suppression Water sprinkler systems are recommended.
2.3.2 Occupational Safety and Health Administration
The organisation, which is part of the US Department of Labor, has produced the following guidance of storage of flammable and combustible liquids:
Construction Safety and Health Outreach Program, Fire Protection and Prevention, Flammable and Combustible Liquids, Subpart §1926.152
WSA CL3012/003 8
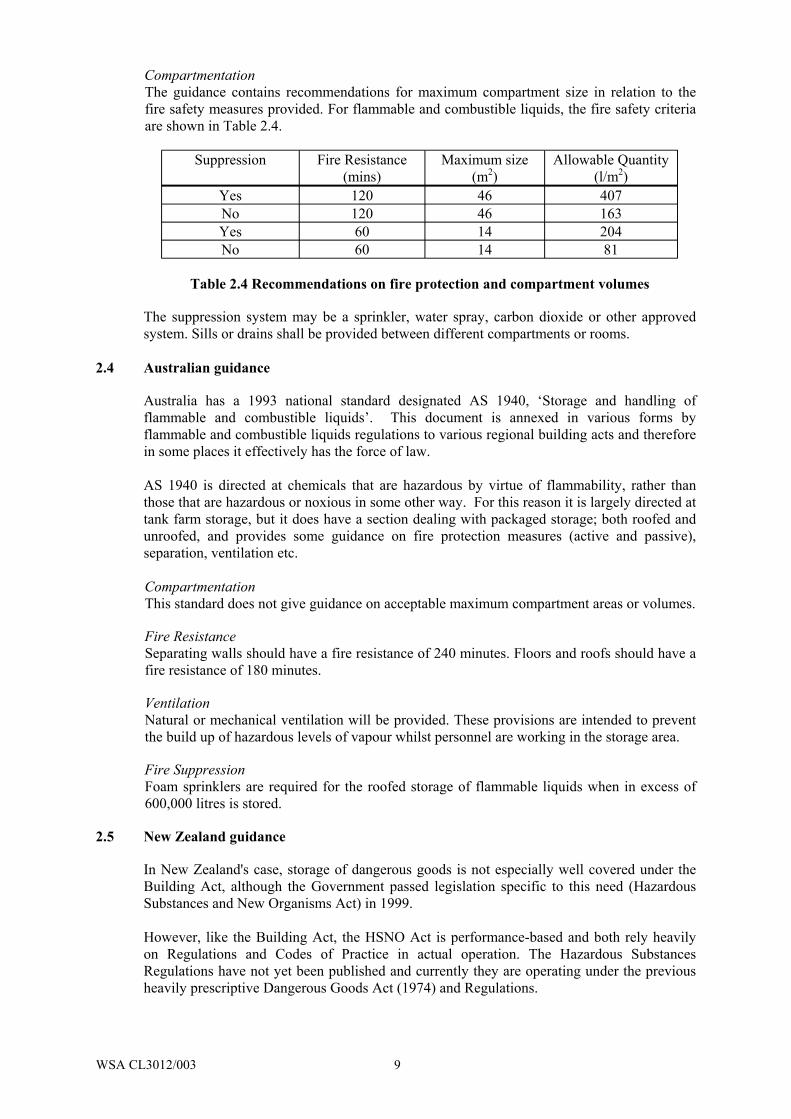
Compartmentation The guidance contains recommendations for maximum compartment size in relation to the fire safety measures provided. For flammable and combustible liquids, the fire safety criteria are shown in Table 2.4.
Suppression Fire Resistance (mins)
Maximum size (m2)
Allowable Quantity (l/m2)
Yes 120 46 407 No 120 46 163 Yes 60 14 204 No 60 14 81
Table 2.4 Recommendations on fire protection and compartment volumes
The suppression system may be a sprinkler, water spray, carbon dioxide or other approved system. Sills or drains shall be provided between different compartments or rooms.
2.4 Australian guidance
Australia has a 1993 national standard designated AS 1940, ‘Storage and handling of flammable and combustible liquids’. This document is annexed in various forms by flammable and combustible liquids regulations to various regional building acts and therefore in some places it effectively has the force of law.
AS 1940 is directed at chemicals that are hazardous by virtue of flammability, rather than those that are hazardous or noxious in some other way. For this reason it is largely directed at tank farm storage, but it does have a section dealing with packaged storage; both roofed and unroofed, and provides some guidance on fire protection measures (active and passive), separation, ventilation etc.
Compartmentation This standard does not give guidance on acceptable maximum compartment areas or volumes.
Fire Resistance Separating walls should have a fire resistance of 240 minutes. Floors and roofs should have a fire resistance of 180 minutes.
Ventilation Natural or mechanical ventilation will be provided. These provisions are intended to prevent the build up of hazardous levels of vapour whilst personnel are working in the storage area.
Fire Suppression Foam sprinklers are required for the roofed storage of flammable liquids when in excess of 600,000 litres is stored.
2.5 New Zealand guidance
In New Zealand's case, storage of dangerous goods is not especially well covered under the Building Act, although the Government passed legislation specific to this need (Hazardous Substances and New Organisms Act) in 1999.
However, like the Building Act, the HSNO Act is performance-based and both rely heavily on Regulations and Codes of Practice in actual operation. The Hazardous Substances Regulations have not yet been published and currently they are operating under the previous heavily prescriptive Dangerous Goods Act (1974) and Regulations.
WSA CL3012/003 9
2.6 European Guidance
2.6.1 Recommendations for Fire Protection of Stores Containing Hazardous Substances
This guidance, which is published by the Comité Européen des Assurances (CEA) and LPC, has been drawn up by the insurance industries of Belgium, Germany, France, UK, Netherlands, Austria and Switzerland. It is therefore an example of current European best practice. The guide should be used in conjunction another CEA/LPC guide, ‘Classification of Materials and Goods’. Having classified the material under consideration, the guide then gives recommendations on fire mitigation measures and compartment sizes. The guidance takes into consideration not only the fire hazard, but also the resulting consequences of a fire involving toxic and ecotoxic substances.
Classification of Materials
The CEA/LPC guide, ‘Classification of Materials and Goods’ identifies hazardous properties of materials and classifies them according to the relative risk. Table 2.5 summarises the classification system with reference to the selection of materials considered in this report (see Section 3.3).
Hazard category
GRADE OF HAZARD 1 2 3 4 5 6
Solid F Ignites very Ignites and Readily Moderately Combustible Nonmaterials easily and burns rapidly combustible combustible only with combustible
burns very supporting rapidly fire
Liquids F Flash point <21oC
Flash point 21-55oC
Flash point 55-100oC
Flash point >100oC
Only burns with
Noncombustible
supporting fire
Oxidising O Very strong Strong Weak agents oxidising oxidising oxidising
agent agent agent
Table 2.5 Classification system
Fire Mitigation Measures
The guide gives five categories of fire protection as follows:
K1 Structural � Small compartment
K2 Surveillance � Fire compartments � Automatic fire detection with link to public fire brigade
K3 Surveillance with company fire brigade � Fire compartments � Automatic fire detection with link to company fire brigade
K4 Extinguishing system � Fire compartments � Suppression system � Automatic fire detection with link to public fire brigade
K5 Extinguishing system with company fire brigade � Fire compartments � Suppression system � Automatic fire detection with link to company fire brigade
WSA CL3012/003 10
Sprinkler systems for liquids in categories F1 or F2 should either be enhanced with a foam additive (AFFF) to prevent a fire spreading along the ground or a floor foam pouring system should be installed. If neither of these is provided, the drainage should be designed to ensure that spilled burning material remains in the fire compartment. A natural or mechanical ventilation system, capable of 5 air changes per hour, together with a vapour warning system, should also be installed for liquids in these categories.
Fire compartments with an area greater than 1,000m2 and with high-rack storage should be provided with smoke and heat outlets.
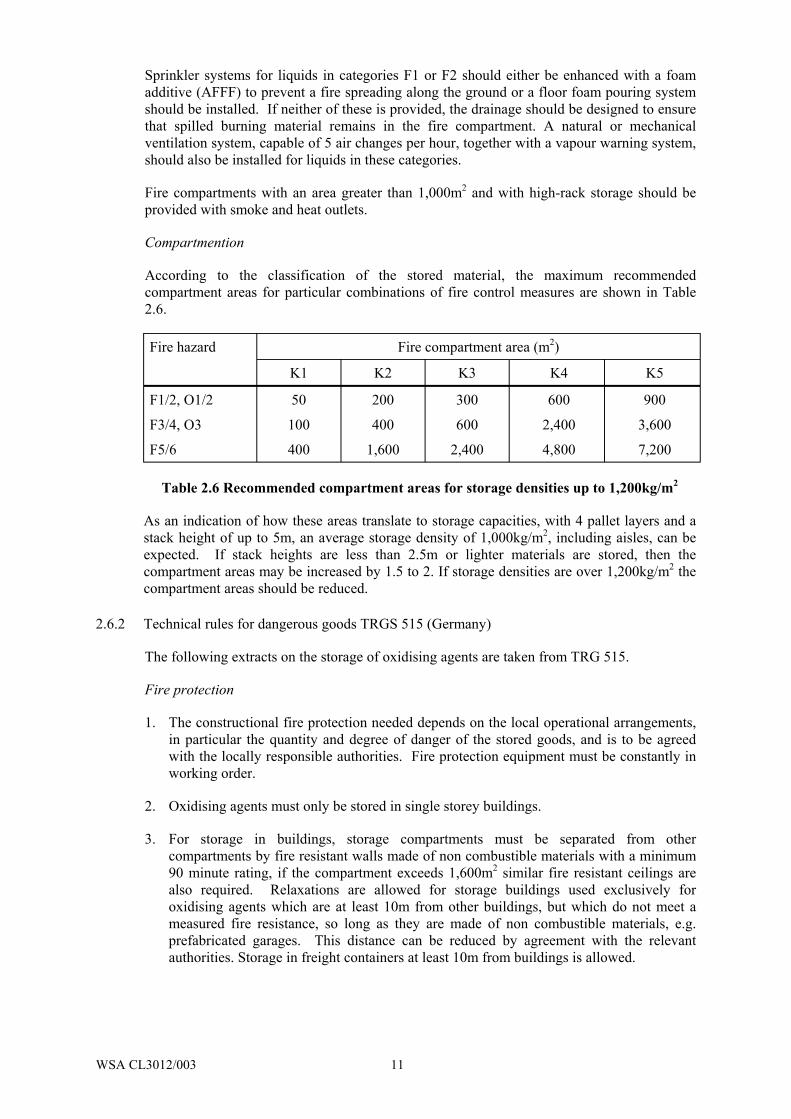
Compartmention
According to the classification of the stored material, the maximum recommended compartment areas for particular combinations of fire control measures are shown in Table 2.6.
Fire hazard Fire compartment area (m2)
K1 K2 K3 K4 K5
F1/2, O1/2 50 200 300 600 900
F3/4, O3 100 400 600 2,400 3,600
F5/6 400 1,600 2,400 4,800 7,200
Table 2.6 Recommended compartment areas for storage densities up to 1,200kg/m2
As an indication of how these areas translate to storage capacities, with 4 pallet layers and a stack height of up to 5m, an average storage density of 1,000kg/m2, including aisles, can be expected. If stack heights are less than 2.5m or lighter materials are stored, then the compartment areas may be increased by 1.5 to 2. If storage densities are over 1,200kg/m2 the compartment areas should be reduced.
2.6.2 Technical rules for dangerous goods TRGS 515 (Germany)
The following extracts on the storage of oxidising agents are taken from TRG 515.
Fire protection
1. The constructional fire protection needed depends on the local operational arrangements, in particular the quantity and degree of danger of the stored goods, and is to be agreed with the locally responsible authorities. Fire protection equipment must be constantly in working order.
2. Oxidising agents must only be stored in single storey buildings.
3. For storage in buildings, storage compartments must be separated from other compartments by fire resistant walls made of non combustible materials with a minimum 90 minute rating, if the compartment exceeds 1,600m2 similar fire resistant ceilings are also required. Relaxations are allowed for storage buildings used exclusively for oxidising agents which are at least 10m from other buildings, but which do not meet a measured fire resistance, so long as they are made of non combustible materials, e.g. prefabricated garages. This distance can be reduced by agreement with the relevant authorities. Storage in freight containers at least 10m from buildings is allowed.
WSA CL3012/003 11
4. External storage in stacks
� For storage in the open air, stacks must be separated from each other, or from buildings, by non combustible fires walls (90 minutes fire resistance) or by sufficient separation distance, according to bullet 3 above.
� Fire walls must be at least 1m taller than the stack, and 0.5m wider on an open side. � Where fire walls are not used, a minimum 5m separation is needed between goods of
groups 1 and 2, and other stacks.
5. Fire fighting
� A sufficient number of extinguishers, and a sufficient quantity of fire water must be available.
� Hydrants should be outside any building, readily accessible and useable, and protected from frost.
� Sufficient fire water implies for each 100m2 of storage area, a flow rate of 200 litres/minute at a minimum of 3bar pressure. Where the supply does not come from the public mains, the supply must be sufficient for at least 2 hours.
� Where high racked storage is fitted with sprinklers, care must be taken that the water spray can reach the products directly.
� Fire equipment must be protected from damage during storage/removal of pallets.
2.6.3 Toxic Storage Facilities TRGS 514 (Germany)
The following basic requirements for fire protection of stores containing toxic materials are taken from TRGS 514.
Constructional fire protection measures must take account of local and operational details, in particular the quantity and degree of danger of the stored materials, as agreed with the locally responsible authorities.
1. Storage in buildings
� Storage compartments should be separated from other rooms by non combustible fire resistant walls (90 minutes fire resistance), for compartments exceeding 1,600m2, fire resistant ceilings are required as well.
� Smoke and heat extraction plant to a calculated design should be provided. The top of the roof should be sufficiently resistant to flying brands and radiant heat.
2. Storage in open air
� Stacks should be separated from adjacent stacks by a fire wall (90 minutes fire resistance) or sufficient distance.
� The wall should be 1m higher than the stack. � If no fire wall is provided, the separation distance should be as follows, or as
calculated by other technical rules; 5m between stacks of flammable or nonflammable material in non flammable containers of size at least 200 litres and a maximum stack height of 4m; 5m between stacks where there is an automatic fire alarm system and a works fire brigade; 10m between stacks in other cases.
3. Automatic fire alarm systems
� Stores in buildings of more than 20 tonnes per compartment must be equipped with an automatic fire alarm system.
� Automatic alarm systems may also be required for compartments of 10-20 tonnes in particular circumstances, e.g. nearby dwellings.
� Open air stores with more than 20 tonnes per compartment require an hourly check by someone with a phone/radio or other means of reporting problems, or a suitable automatic fire detection system.
WSA CL3012/003 12
4. Extinguishers
� Fire extinguishers are needed to tackle incipient fires. � Two 12kg powder extinguishers are needed for the first 50m2, and one further
extinguisher for each extra 100m2.
5. Fire fighting equipment
� For fighting a fire with water suitable equipment must be provided, and a suitable quantity of water
� Suitable equipment means a wall hose reel with a 50mm diameter hose. � Sufficient fire water implies for each 100m2 of storage area , a flow rate of 200
litre/minute at a minimum of 3bar pressure. Where the supply does not come from the public mains, the supply must be sufficient for at least 2 hours.
� Where high racked storage is fitted with sprinklers, care must be taken that the water spray can reach the products directly.
� Fire equipment must be protected from damage during storage/removal of pallets.
2.6.4 Guidelines for retention of fire water run-off (Germany)
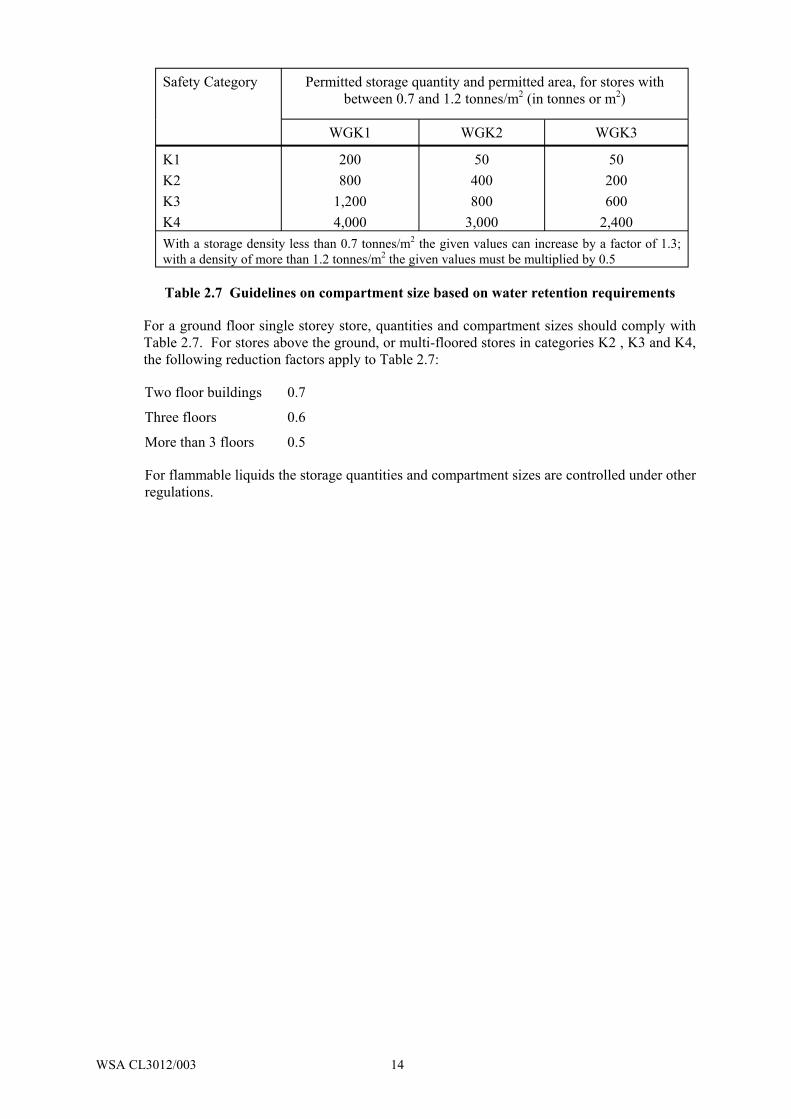
Table 2.7 is taken from German guidelines on the calculation of retention needs for fire water run off associated with storage of goods dangerous to water courses. The table provides compartment size limits based on the safety category of the site and the substance stored.
Safety categories
K1 public fire brigade, no special requirement for fire alarm
K2 public fire brigade, special need for fire alarm
K3 works fire brigade, special need for fire alarm
K4 public or works fire brigade, automatic extinguishing system, including automatic raising of the alarm
A works fire brigade here implies a fire fighting force capable of reaching the fire in 5 minutes, in numbers of at least 1 pump strength.
Substances dangerous to water courses
These may be solids liquids or gases capable of contaminating water in a damaging way. They are grouped into 4 categories:
WGK0 in general non dangerous to water
WGK1 weakly endangering
WGK2 moderately endangering
WGK3 strongly endangering to water
WSA CL3012/003 13
Safety Category Permitted storage quantity and permitted area, for stores with between 0.7 and 1.2 tonnes/m2 (in tonnes or m2)
WGK1 WGK2 WGK3
K1 K2 K3 K4
200 800
1,200 4,000
50 400 800
3,000
50 200 600
2,400 With a storage density less than 0.7 tonnes/m2 the given values can increase by a factor of 1.3; with a density of more than 1.2 tonnes/m2 the given values must be multiplied by 0.5
Table 2.7 Guidelines on compartment size based on water retention requirements
For a ground floor single storey store, quantities and compartment sizes should comply with Table 2.7. For stores above the ground, or multi-floored stores in categories K2 , K3 and K4, the following reduction factors apply to Table 2.7:
Two floor buildings 0.7
Three floors 0.6
More than 3 floors 0.5
For flammable liquids the storage quantities and compartment sizes are controlled under other regulations.
WSA CL3012/003 14
3. MODEL FRAMEWORK
3.1 Model background
Tyldesley [1] identifies the key offsite hazards of concern to HSE with regard to chemical warehouses as being:
� the risk from the plume of smoke, which may cause health effects to neighbouring populations and damage to the environment;
� the risk to the environment of chemicals which flow or are washed into the water;
� the risk of explosive failure of drums and other containers.
Assessment of the offsite consequences of a plume of smoke is complex and is dependent on a wide range of factors, including the toxicity of the smoke, the structure of the warehouse roof, the provision and operation of vents in the roof and the magnitude of the fire hazard in terms of mass of material being burnt. Detailed consideration is being given to the potential offsite consequences of the five representative materials listed in Table 3.1 of Section 3.3 in a separate study [2]. In particular, one aim of the separate study is to identify circumstances in which it is preferable either to try to contain a fire by upgrading the fire resistance of the building, or when it is preferable that the fire should vent through the roof at an early stage.
The offsite consequences of a plume of smoke are not specifically modelled in this report, rather the model determines the magnitude of the fire hazard in terms of the mass of material burnt. The mass of material burnt will be proportional to the floor area damaged by the fire and the model outputs the product of the floor area damaged and the frequency of that damage.
The quantity of fire water required to extinguish a fire is proportional to the fire area [3]. Thus it is reasonable to assume that the potential for risk to the environment of chemicals which flow or are washed offsite also correlates well with the floor area damaged.
The model does not address the offsite effects of sudden failure of containers, but does consider the spread of fire between storage areas due to such failures (see Sections 3.8 and 4.5).
The purpose of the model is to compare the risk reductions associated with the introduction of different types of compartmentation in chemical warehouses, with the risk reductions resulting from introduction of other fire protection measures including automatic detection, automatic fire suppression, spillage control and provision of a direct link to the fire brigade. The model structure is defined in the following section.
3.2 Model structure
The model is probabilistic but is supported as necessary by simple deterministic analysis, for example in the assessment of fire withstand of compartment walls (see Section 3.6) and the benefit provided by separation between combustibles (see Section 3.7).
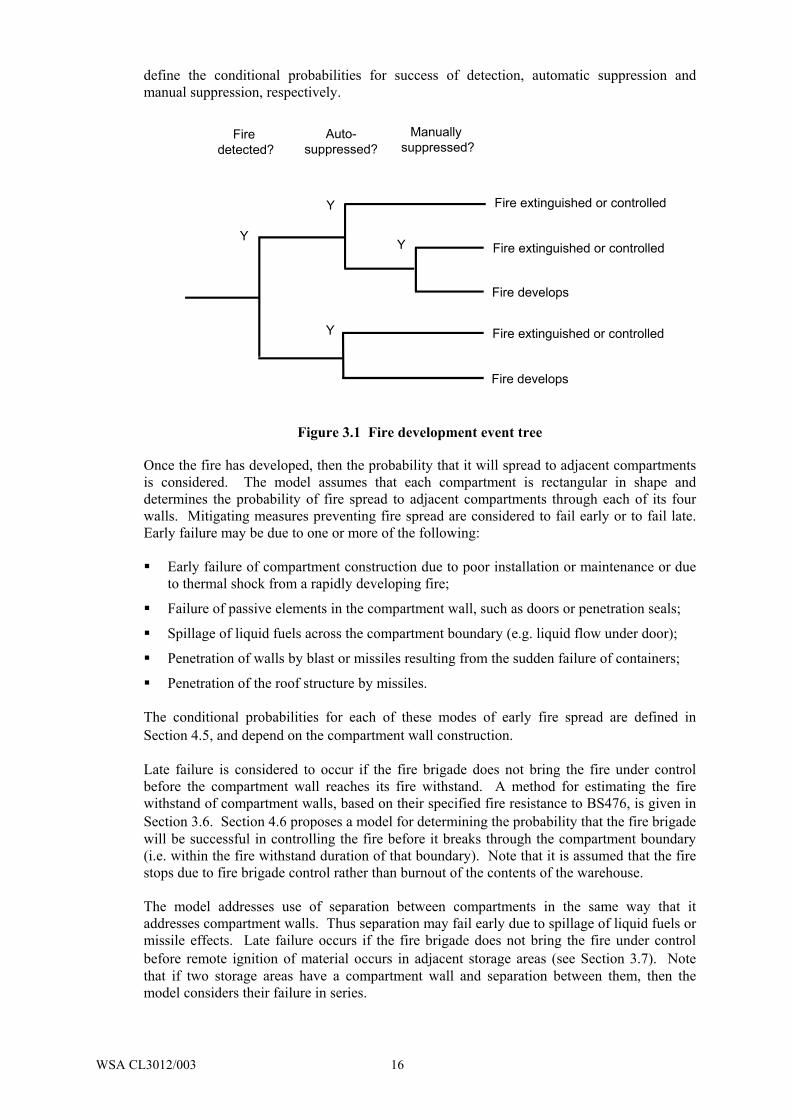
The model first calculates the frequency of a developed fire within a compartment or site area. This calculation is based on the event tree given in Figure 3.1. Thus once a fire is initiated, it may be prevented from developing by automatic or manual suppression, the latter being dependent on early detection (which comprises both automatic fire detection and manual detection). Section 3.5 considers the initiation of the fire, noting that the scope of the model is not to consider the adequacy of fire prevention measures on the site, but rather uses a generic value for the initiating frequency of a fire in a warehouse. Sections 4.2, 4.3 and 4.4
WSA CL3012/003 15
define the conditional probabilities for success of detection, automatic suppression and manual suppression, respectively.
Fire Auto- Manuallydetected? suppressed? suppressed?
Fire extinguished or controlledY
Y Y Fire extinguished or controlled
Fire develops
Y Fire extinguished or controlled
Fire develops
Figure 3.1 Fire development event tree
Once the fire has developed, then the probability that it will spread to adjacent compartments is considered. The model assumes that each compartment is rectangular in shape and determines the probability of fire spread to adjacent compartments through each of its four walls. Mitigating measures preventing fire spread are considered to fail early or to fail late. Early failure may be due to one or more of the following:
� Early failure of compartment construction due to poor installation or maintenance or due to thermal shock from a rapidly developing fire;
� Failure of passive elements in the compartment wall, such as doors or penetration seals;
� Spillage of liquid fuels across the compartment boundary (e.g. liquid flow under door);
� Penetration of walls by blast or missiles resulting from the sudden failure of containers;
� Penetration of the roof structure by missiles.
The conditional probabilities for each of these modes of early fire spread are defined in Section 4.5, and depend on the compartment wall construction.
Late failure is considered to occur if the fire brigade does not bring the fire under control before the compartment wall reaches its fire withstand. A method for estimating the fire withstand of compartment walls, based on their specified fire resistance to BS476, is given in Section 3.6. Section 4.6 proposes a model for determining the probability that the fire brigade will be successful in controlling the fire before it breaks through the compartment boundary (i.e. within the fire withstand duration of that boundary). Note that it is assumed that the fire stops due to fire brigade control rather than burnout of the contents of the warehouse.
The model addresses use of separation between compartments in the same way that it addresses compartment walls. Thus separation may fail early due to spillage of liquid fuels or missile effects. Late failure occurs if the fire brigade does not bring the fire under control before remote ignition of material occurs in adjacent storage areas (see Section 3.7). Note that if two storage areas have a compartment wall and separation between them, then the model considers their failure in series.
WSA CL3012/003 16
Note that the model does not distinguish between compartments within a warehouse and external storage areas. In both cases the mode of fire spread is assumed to be similar (as no account is taken of roof structures which are assumed to fail early in a fire). Thus the probability of fire spread from a warehouse to an outside storage area (and vice-versa) will depend on the wall type and separation distance between them. Nominal credit is taken for non fire-rated but robust wall constructions such as might be used for the outer skin of a warehouse.
Based on the above calculations, the model output is given as the product of damage area with frequency, i.e. in terms of m2 of floor area damaged per year. The model can then be used to compare the risk reduction associated with different fire protection measures. The model also outputs the costs of installing these measures. The cost model is described in Section 5.
The model considers the effect on fire spread of storage of five different material types and considers three different compartment wall options. The material types and compartment wall options are defined in Sections 3.3 and 3.4, respectively.
3.3 Fire source and storage configuration
The representative materials considered in the development of this model are:
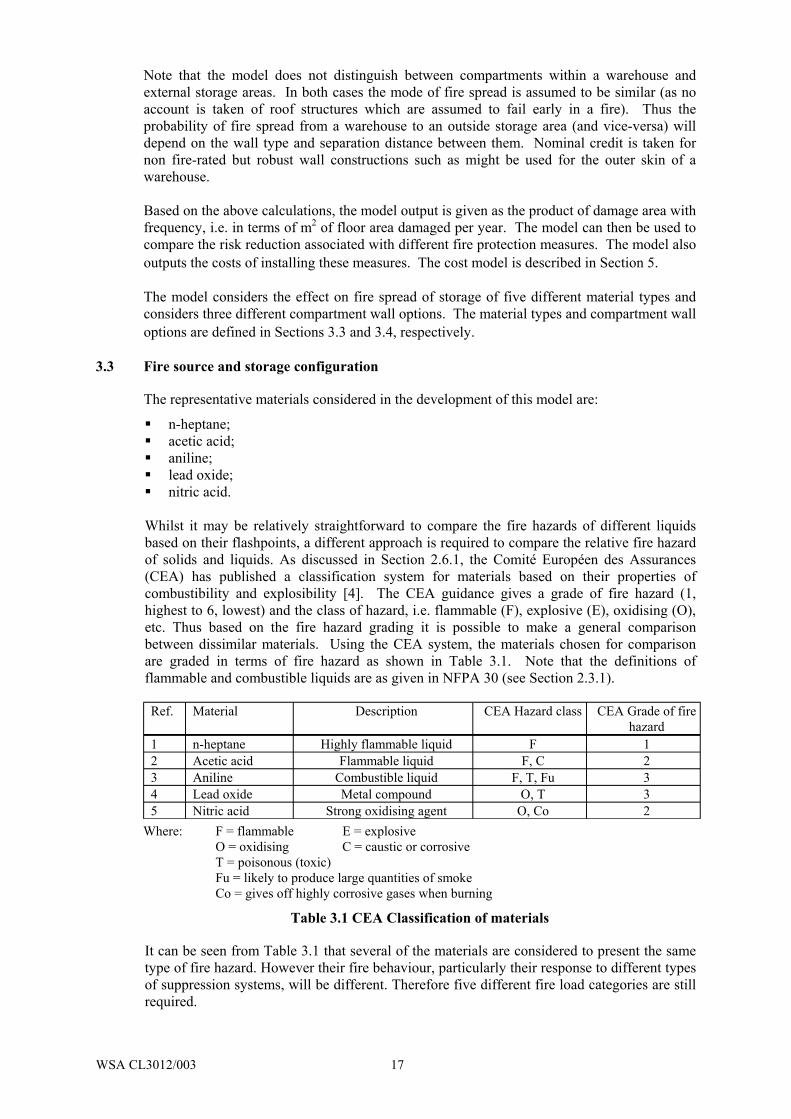
Whilst it may be relatively straightforward to compare the fire hazards of different liquids based on their flashpoints, a different approach is required to compare the relative fire hazard of solids and liquids. As discussed in Section 2.6.1, the Comité Européen des Assurances (CEA) has published a classification system for materials based on their properties of combustibility and explosibility [4]. The CEA guidance gives a grade of fire hazard (1, highest to 6, lowest) and the class of hazard, i.e. flammable (F), explosive (E), oxidising (O), etc. Thus based on the fire hazard grading it is possible to make a general comparison between dissimilar materials. Using the CEA system, the materials chosen for comparison are graded in terms of fire hazard as shown in Table 3.1. Note that the definitions of flammable and combustible liquids are as given in NFPA 30 (see Section 2.3.1).
Ref. Material Description CEA Hazard class CEA Grade of fire hazard
1 n-heptane Highly flammable liquid F 1 2 Acetic acid Flammable liquid F, C 2 3 Aniline Combustible liquid F, T, Fu 3 4 Lead oxide Metal compound O, T 3 5 Nitric acid Strong oxidising agent O, Co 2
Where: F = flammable E = explosive O = oxidising C = caustic or corrosive T = poisonous (toxic) Fu = likely to produce large quantities of smoke Co = gives off highly corrosive gases when burning
Table 3.1 CEA Classification of materials
It can be seen from Table 3.1 that several of the materials are considered to present the same type of fire hazard. However their fire behaviour, particularly their response to different types of suppression systems, will be different. Therefore five different fire load categories are still required.
WSA CL3012/003 17
Table 3.2 shows the fire growth rates and relative fire loads for the chosen materials. The fire growth rates are assumed to conform to a ‘t-squared’ curve as follows:
2Q =α t -(t ) (3.1)i
where Q is the fire power (kW) and (t-ti) is the time from ignition (s).
Ref. Material Description Fire growth rate α (kJ/s3) Fire load 1 n-heptane Highly flammable liquid Ultra fast 0.188 High 2 Acetic acid Flammable liquid Fast 0.047 High 3 Aniline Combustible liquid Medium 0.012 High 4 Lead oxide Metal compound Medium 0.012 Low 5 Nitric acid Strong oxidising agent Fast 0.047 Low
Table 3.2 Fire growth rate and relative fire loads
The implications of an ultra-fast fire growth rate are rapid fire spread, intense thermal shock to the building structure and a relatively short fire duration in the compartment of origin. Early failure of structural and separating elements is more likely than with a medium rate of growth. In this case slower fire spread and a more gradual heating of the building structure are likely to lead to a greater probability of the fire remaining in the compartment of origin. The fire duration may be longer, but the heating regime will be more similar to the standard cellulosic fire resistance time-temperature curve (BS476 [10]), whereas the heating regime for the flammable liquids with ultra-fast and fast growth rates may be closer to a hydrocarbon fire time-temperature curve. A good performance by fire resisting elements can be expected for medium growth rates.
The low fire load scenarios in this instance are associated with the storage of oxidisers, which in themselves do not contribute to the fire load. The fire load will predominantly comprise packaging materials, debris, other stored goods and possibly elements of building structure. Intense, difficult to suppress fires of short duration can be expected.
The development of a fire within the warehouse will be strongly dependent upon the type of material stored, but will also depend on the following:
Each of these issues separately represents an extremely complex area of discussion. However, in a warehouse fire scenario there will be a degree of interaction between all of them. Therefore for the purposes of this project a certain degree of simplification is required.
Storage configuration A typical storage scenario has been assumed. This comprises 205 litre drums, placed on pallets which are stacked three high or in racks.
Packaging materials It is assumed that best practice has been followed and the materials are stored in steel drums. The pallets will be wooden.
Storage of dissimilar substances If dissimilar materials are stored they should be separated, segregated or isolated in accordance with the recommendations of HSG71 (see Section 2.2.3). If two different materials are stored within the same fire compartment, then the conditional probabilities for the substance posing the greatest fire hazard should be used.
WSA CL3012/003 18
3.4 Compartment wall options
Three compartment wall options are considered in this study; a reinforced concrete wall, a lightweight blockwork wall and a stud partition. The following descriptions provide the typical properties of such walls for use in this study, and, in particular, for assessment of integrity to blast and missile effects (see Section 3.8). All wall options described below will have a minimum fire resistance of 60 minutes. However, the fire risk model also considers the benefit of increasing the specified fire resistance of the walls beyond 60 minutes. Note that the warehouse building would be single storey and would not have a fire resistant roof.
General The wall will span between columns positioned at 9m centres and will be 7.5m high. It will be built into the web of the I-section columns.
Reinforced Concrete Wall This wall would be 200mm thick and constructed from dense aggregate with 0.4% reinforcement. The wall would be restrained at the sides and along the top at 1m centres.
Lightweight Blockwork Wall This wall will be 215mm thick and be constructed from aerated concrete blocks. These blocks will be 225mm high x 450mm long, with a compressive strength of 4.0N/mm2 and a density of 620kg/m3. The blockwork will be restrained at each side and along the top at 1m centres.
Stud Partition This partition would be constructed using ‘jumbo’ metal C-studs, 35mm x 146mm. These are cold rolled channels formed from 0.5 mm-thick steel. They would be positioned in top and bottom tracks at 600mm centres. In order to achieve 60 minutes fire resistance two layers of 12.5mm-thick standard wallboard (plasterboard which is not specifically designed to be fire resistant, i.e. less glass fibre reinforcement) would have to be applied to each face. The boards would be overlapped and fixed to the metal studs with self-tapping screws at 300mm centres.
3.5 Fire initiation
Fowler and Tyldesley [5] quote the results of a research report into the probability of fire in warehouses and storage premises [7] which suggests that the frequency of a reportable fire in any given warehouse is 0.01/year. They note that fires in warehouses storing hazardous goods may be expected to be less frequent, but that there is little available data to demonstrate this. Further estimates of fire frequency in warehouses are given in Table 3.3 and it can be seen that there is general agreement between the values presented. Note that all frequencies given are assumed to relate to ‘viable’ fire starts, i.e. for fires which will not self-extinguish due to lack of adjacent fuel or which are not immediately extinguished by people present at ignition.
Source By unit (/year) By floor area (/m2 year) Hymes and Flynn [6] 10x10-3 -Hockey and O’Donovan [8] 7-13x10-3 11-21x10-6
Rahikainen and Keski-Rahkonen [7], Finland 6x10⁻³ 8x10⁻⁶
BS DD240 [9], storage premises 13x10-3 33x10-6
Table 3.3 Fire frequency estimates for warehouses
Rahikainen and Keski-Rahkonen [7] show that the frequency per floor area reduces with total floor area at a site. However they suggest that for large buildings (>100m2) the frequency is proportional to floor area. A value of 8.1x10⁻⁶/m2 year is given for warehouses, which is again similar to, although slightly lower than, other available frequencies by floor area.
The model uses a fixed fire frequency per floor area of 1x10⁻⁵/m2 year. It is recognised that this value may not be directly applicable to chemical warehouses and does not take into
WSA CL3012/003 19
account the effectiveness of fire prevention measures at a particular site. However, the aim of the model reported here is to compare the risk reduction associated with different fire protection measures rather than to produce an absolute prediction of risk associated with a warehouse.
3.6 Fire withstand of compartment walls
As further discussed in Section 4.6, the withstand time of the compartment walls is required for comparison with the time available for the fire brigade to control the fire, and hence to determine whether fire spread will occur across the wall.
The compartment wall will have a specified withstand defined in relation to a standard timetemperature test curve, e.g. BS476 [10]. However, the actual withstand duration in a fire may be greater or less than the specified withstand for two reasons. The first reason is that the initial rate of growth of the fire may be vastly different to the rate of growth in the standard test. If the actual rate of growth is significantly higher, then failure of the compartmentation may result from ‘thermal shock’. For example, wall components may have different rates of expansion, the effect of which is accentuated at high rates of temperature rise. In this model, this ‘thermal shock’ is considered to result in early failure of the compartment wall and is included in the probability of success of wall components in Section 4.5.
The second reason for variation from the specified withstand is that the cumulative heat transfer to a compartment wall may differ significantly from that experienced in a standard time-temperature test. Depending on the fuel type, configuration and available ventilation, some actual fires attain temperatures in excess of those of the BS476 standard timetemperature curve. This is particularly true for liquid hydrocarbon fuels. Much work has been undertaken to define the equivalency of heat transfer in an actual fire to that of a standard test, for example, one of the better known methods is that proposed by Law [11]. However, all such methods relate to the case of a developed fire in an enclosed but ventilated compartment. They are not applicable to a warehouse fire during its development, where the available ventilation is low with respect to the volume of the compartment. Nor are they applicable to the later stages of the fire, when the roof (which would not generally be fire resistant) will have at least partially failed, allowing the majority of the heat generated by the fire to escape to the atmosphere. Therefore a different approach is required here which is still simple enough for implementation in the risk model. Melia et al [12] propose the use of a curve which relates the cumulative heat transfer per unit area of wall to the equivalent duration to the BS476 time-temperature curve. Although Melia et al developed this curve for tunnel wall constructions, it is conservative with respect to the time equivalent method of Ingberg [13]. The model uses the following fit to the curve:
E = t 0.0435 S2 t 1.5528 + S (3.2)
where E is the cumulative heat transfer per unit area of wall (MJ/m2) and tS is the specified fire resistance to BS476 (minutes). It is noted that DD240 [9] recommends in general, that to take account of the high standard of workmanship that is employed in fire test specimens, the mean value of fire resistance should be assumed to be 13% less than that achieved in the test. However, this difference is unlikely to be significant with respect to the uncertainties in use of the cumulative heat transfer relation given above, and this reduction in fire withstand is not included in the model.
The cumulative heat transfer is calculated by assuming that flame impingement to the wall occurs in a fully developed fire, and that impingement continues after failure of the roof. For highly flammable and flammable liquids, a combined convective and radiative heat flux of 220 kW/m2 is used for all liquid fuels [14], reducing to 120 kW/m2 for solid combustibles. (Note that these values are generic and can readily be altered in the model to suit specific fuels). The equivalent duration of fire withstand of the wall, tW, is then calculated as follows:
WSA CL3012/003 20
= q E (3.3)tW W
where qW is the combined heat flux to the wall (kW/m2).
3.7 Fire segregation and separation
In many chemical warehouses, different types of materials are stored in distinct areas within a compartment, either separated by distance from other storage, or segregated by non fire-rated partition walls. Such segregation and separation may be of benefit in preventing or delaying fire spread until arrival of the fire brigade.
In order for segregation/separation to be effective, liquid spills must be contained within the immediate area of the fire. This can be accomplished using floors which are sloped towards drainage / sumps (retaining walls or bunding will only be used around fixed storage tanks). If such containment is not provided then the model assumes that segregation is not effective for liquid fuels.
During the early stages of a fire in a large compartment, fire spread between segregated areas will be due to direct radiation from the fire source (rather than from the hot smoke layer) and remote ignition, rather than heat transfer from hot combustion products. Remote ignition can be modelled using the correlation provided by Lawson and Simms [15] for piloted ignition of white wood, which is representative of the most easily ignited items in a warehouse (e.g. pallets, packaging etc.). Thus for a radiative heat flux, qI, incident at the target of greater than 14.7 kW/m2, the time to ignition and thus spread across the separation, tS, in minutes, is calculated as follows:
14.7) -(q 21.5 2 3 tS = (3.4)I
The model calculates the incident heat flux as follows:
q = q VF. (3.5)I R
where VF is the viewfactor from the target combustible material to the flame surface of the burning items and qR is the surface emissive power of the burning items. The radiation viewfactor, VF, is calculated using analytical expressions for radiation from a plane surface, as presented by van Wingerden et al [20]. The value of VF is dependent on the separation distance. It is calculated by assuming that the flame surface of the burning combustibles is planar, with a height equal to the compartment height and a width equal to the compartment width. The surface emissive power of the burning items is taken to be 130 kW/m2 for all liquid fuels [16], reducing to 70 kW/m2 for solid combustibles (noting that these values are lower than those quoted in Section 3.6 which relate to impinging flames and so include convective as well as radiative heat transfer).
Similar calculations are conducted for fire spread to adjacent buildings or storage areas. If the separating wall has failed then it is assumed that the flame area is equal to the area of the failed wall. If the wall is intact then radiation will occur via open or failed doors or through failed penetrations (assumed to be equal to 10% of the wall area) and the flame area is assumed to be equal to the door area. Note that in both cases, the projection of flames beyond the door or wall space is neglected. It is considered that, for the purpose of the model, any increase in flame area will be balanced by over-conservatism of the radiation calculation, which assumes a clean burning fire rather than a smoke-obscured fire.
In the current model, only fire spread to adjacent combustibles is considered. However, one scenario for which the use of Lawson and Simms [15] correlation for piloted ignition is not valid is fire spread to metal containers in external storage. Here fire spread is likely to result from failure of a single drum or gas cylinder, not necessarily violently, followed by fire
WSA CL3012/003 21
impinging on adjacent containers. Failure of the initial drum or cylinder will occur due to incident radiation heating the contents of the container, thus increasing its internal pressure, while also heating the walls of the container and reducing its strength. At a temperature of 550oC, the strength of steel is reduced to approximately 50% of its room temperature strength. Thus 550oC is often used as an indicative failure temperature for structural steel based on an assumed safety factor of 2 between design strength and maximum load at normal temperatures. A continuous incident heat flux of minimum 25kW/m2 is required to bring the external temperature of a drum to 550oC. (In practice the flux will need to be higher than 25kW/m2 as this value assumes no heat loss to the drum contents or to the surrounding air.) However, as the drum pressurises, the produced load will exceed the design load. Thus failure may occur at lower temperatures and lower incident heat fluxes. Fire spread by heating and subsequent failure of drums requires further consideration and is listed as an area for model development in Section 7.4.
3.8 Impact of sudden failure of containers
Appendix A details the analysis undertaken on the impact of sudden failures of containers within a warehouse fire. The objective of the analysis was to assess the ability of different types of compartment wall to withstand:
� Impact by a projected container in a fire situation;
� Pressure pulse associated with the sudden failure of a container in a fire situation.
The building scenario chosen for the analysis is shown below. The height of the building is 7.5m with a flat roof. A compartment wall divides the building in two. The envelope of the building is of corrugated steel sheet. The wall types considered are as given in Section 3.4.
9m
9m
18m
Figure 3.2 Plan view of compartment chosen for assessment of failure containers
The projectile/container chosen for analysis is a tight head steel drum of 205 litre capacity. This would have a wall thickness of 1mm and would weigh 17.5kg when empty. The bursting pressure is 300kPa. The worst case blast effects and missile velocities occur for a drum which is completely full of vapour and this is the case analysed in Appendix A.
The conclusions of the analysis can be summarised as follows:
a) The reinforced concrete wall will not be penetrated by any blast or missile effects from a worst case failure of a drum.
b) The blockwork wall will fail due to blast effects from the worst case failure of a drum if this occurs within 5m of the wall. It will be penetrated by a missile if the missile impacts at angle of greater than 22 degrees from the wall surface. Local failure of the wall due to
WSA CL3012/003 22
blocks being knocked out will also occur if the drum impacts the wall over the area of one or two blocks, since the shear strength of the mortar is limited.
c) The plasterboard stud partition will not withstand blast or missile effects from the worst case failure of a drum at any location within the warehouse. Such a wall is likely to fail for less severe drum failures (i.e. drums not containing 100% vapour).
WSA CL3012/003 23
4. PROBABILITY DATA FOR FIRE PROTECTION MEASURES
4.1 General
The probabilities used in the model event trees are derived from a variety of sources. It should be noted that most of the available probability data are based on fire incidents within a range of building types and are generally for ordinary fire loads. In general there is little available data relating to the effectiveness of fire prevention measures for different severities of fire hazard. Thus there is much uncertainty in the derivation of the model probabilities.
As discussed in Section 3.3, the fire hazards of the fuels considered in the model are characterised with respect to the CEA classification system and a fire growth rate and fire load assigned. The probabilities for the combustible liquid (Fuel Type 3 in Section 3.1) are generally taken to be similar to those for ordinary fire loads, i.e. the general case. Judgement was then used in deriving conditional probabilities for fire loads which are not ordinary, based on the available generic data for ordinary fire loads. In most cases, the probability associated with each fire protection measure was assumed to be independent of other measures, with the exception of manual fire-fighting and fire brigade action, which were assumed to be dependent on detection.
It is noted that the probabilities are derived from historical data, much of which relates to systems or practices in place 10 years or more ago. Thus it may be argued that the probabilities used are pessimistic for modern fire prevention systems and practices. However, no published evidence was identified that could be used to substantiate any dramatic improvements in operational reliability or effectiveness of systems over the past decade. Even if improvement was demonstrated, the intention of the model is to compare the risk associated with fire prevention measures, and it is considered that the probabilities for all measures would contain a similar degree of conservatism.
The sections below summarise the conditional probabilities used in the model for each fuel type and indicate the key assumptions made in their derivation. For compartments containing mixtures of fuel type, the model uses the lowest probability of success for those fuel types contained in that compartment.
4.2 Detection
Probabilities are required for a fire being detected at an early enough stage in its development to allow control of the fire by other measures. Available data on the reliability of automatic fire detection systems are considered below.
A recent review of data by Bukowski et al [17] provides estimates of the reliability of fire protection systems, where reliability comprises two components; ‘operational’ reliability and ‘performance’ reliability. Operational reliability is the probability that a fire protection system will operate as designed. It reflects the reliability of system components and the effectiveness of the maintenance and testing of components and systems once installed, to verify operability. Performance reliability is the probability that the system as designed will successfully perform its function under specific fire conditions, given that it operates. Much of the data presented by Bukowski et al [17] is said to relate to operational reliability alone, although it is acknowledged that is not always possible to discriminate fully between operational and performance reliability when interpreting incident data. Estimates of smoke detection system reliability relevant to this study are listed in Table 4.1.
BS DD240 [9] provides probabilities for fire detection systems failing to operate as designed based on work published in 1973 by the Fire Research Station [18]. They are used as values applicable to all building types and occupations and are given as operational reliabilities in Table 4.2.
WSA CL3012/003 24
Detector type Occupancy / fire type Operational reliability Smoke detector Commercial - general 0.721
Commercial – storage 0.682
Commercial – industry/manufacturing 0.802
Institutional – general 0.841
Heat Smoldering fire 03
Flaming fire 0.893
Smoke Smoldering fire 0.863
Flaming fire 0.903
Beam smoke SMOLDERING FIRE 0.863
Flaming fire 0.883
Aspirated smoke Smoldering fire 0.863
1. Derived from ten years (1983-1992) of NFPA data provided by [19] 2. Taken directly from [19] 3. Taken from Warrington Delphi study [21]
Table 4.1 Estimates of detection system operational reliability [17]
Detector type Operational reliability Heat and smoke 0.90 Flame 0.76
Table 4.2 Estimates of detection system operational reliability [9]
Guymer and Parry [22] provide point estimate unavailabilities per demand for fire protection features (assumed to be system unavailabilities). These are derived from data collected from US nuclear power plants in the 1970’s and 1980’s. They are given as operational reliabilities in Table 4.3.
Detector type Operational reliability Heat 0.91 Smoke 0.87 Flame 0.76
Table 4.3 Estimates of detection system operational reliability [22]
Data from OREDA [23] suggest that availability values for single IR and smoke detector heads is as high as 99.5-99.9%. The difference between these values and the system values given in the tables relates to the reliability of other system components such as the control panel (availability of 96.5% [23]) and its power supply. The range of values given for system availabilities may reflect differences in methods of analysing data, differences in occupancies and environments, differences in maintenance, and differences in the time period over which data are collated.
For the purpose of this study, it is assumed that a fire detection system installed in a new warehouse will be appropriately specified for the commodity to be stored in the warehouse. Thus, rather than specifying availabilities for different types of detection system, a single availability value is defined for automatic fire detection (AFD) for each of the fuel types identified in Section 3.3. The relative performance of an automatic fire detection system is not expected to vary with fire hazards of these kinds. All will lead to relatively rapid fire growth, but since the fire should have been detected towards the start of the growth stage, fire growth rate will have little effect on the probability of detector operation. In the case of aspirating detectors and flammable liquid storage, the system could be calibrated for vapour rather than smoke. In the former instance an incident could be detected before ignition. It is not considered that this will affect the overall probability of detection success.
Based on the data in the above tables, an availability of 0.80 is taken to be representative of an AFD system installed in a warehouse. This value is lower than most of those given for
WSA CL3012/003 25
smoke and heat detection systems, although it is higher than the latest values provided by the NFPA [19]. The chosen value of 0.80 allows for the performance reliability of the AFD being less than 100%. Flame detection is considered separately in the model due to significant differences in cost compared with smoke and heat systems (see Section 5.2). As discussed by Hall [24], although incident data on flame detection suggest that it has a lower operational reliability than other detection systems, if appropriately specified, this is countered by a higher performance reliability. Thus the model uses the same availability for flame detection as for general AFD, i.e. 0.80, which is slightly higher than the values given for flame detection in the tables above (0.76).
Whether or not AFD is installed, a fire will eventually be detected by people, whether onsite or offsite. (The model assumes that all fires will be detected within 20 minutes as discussed in Section 4.6.) Here we are concerned only with early detection and thus detection by personnel working in the vicinity. Although it is also possible that a fire is detected by personnel undertaking security rounds, it is assumed in such a case that the fire will have grown to beyond the stage where it can be easily controlled and limited to the original fire site. For the purpose of the model a notional fire size of 1,000 kW is used as an upper limit for fires amenable to first-aid fire-fighting. The model takes no credit for manual detection beyond this fire size and the success probabilities for manual fire-fighting relate to fires of this size or smaller. In practice many sites will not have the capability to fight fires of 1,000kW as hoses and trolley-mounted powder units are likely to be required. This is reflected in the low success probabilities assigned to manual fire-fighting in Section 4.4.
For a normal working day the occupancy of a storage area is taken to be approximately 8 out of 24 hours, even if limited to movement of items in and out of the warehouse. No published data have been identified for the probability that personnel will detect a fire in its early stages. However, it is reasonable to assume that the probability of manual detection is high for ordinary combustibles or combustible liquids and a value of 0.9 is used. This is consistent with Matthews et al [25] which suggests a probability of 0.9 for people in a room detecting a fire within 5 minutes. Note also that aniline, the example used for fuel type 3 in this study, produces large quantities of smoke and so is likely to be detected quickly. Thus the probability of manual detection adopted in this study for ordinary combustible liquids (Fuel Type 3) is 8/24 x 0.9 = 0.3. In Section 3.1, ordinary combustible liquids and metal compound (Fuel Type 4) fires have been assigned a medium fire growth rate which gives a fire size of 1,000 kW after 5 minutes. Such a fire size is reached in 2½ minutes for a fast growth rate (fuel types 2 and 5) and in 1¼ minutes for ultra-fast fire growth rate (fuel type 1). The probability of manual detection is reduced to 0.2 and 0.1 for fast and ultra-fast fires, respectively.
Table 4.4 summarises the detection probabilities used in the model for manual detection alone and a combination of manual and AFD. Where there is both manual detection and AFD, these are assumed to operate independently. Thus the probability of detection, pD, is calculated as follows, where pAFD and pM are the probabilities of automatic fire detection and early manual detection, respectively:
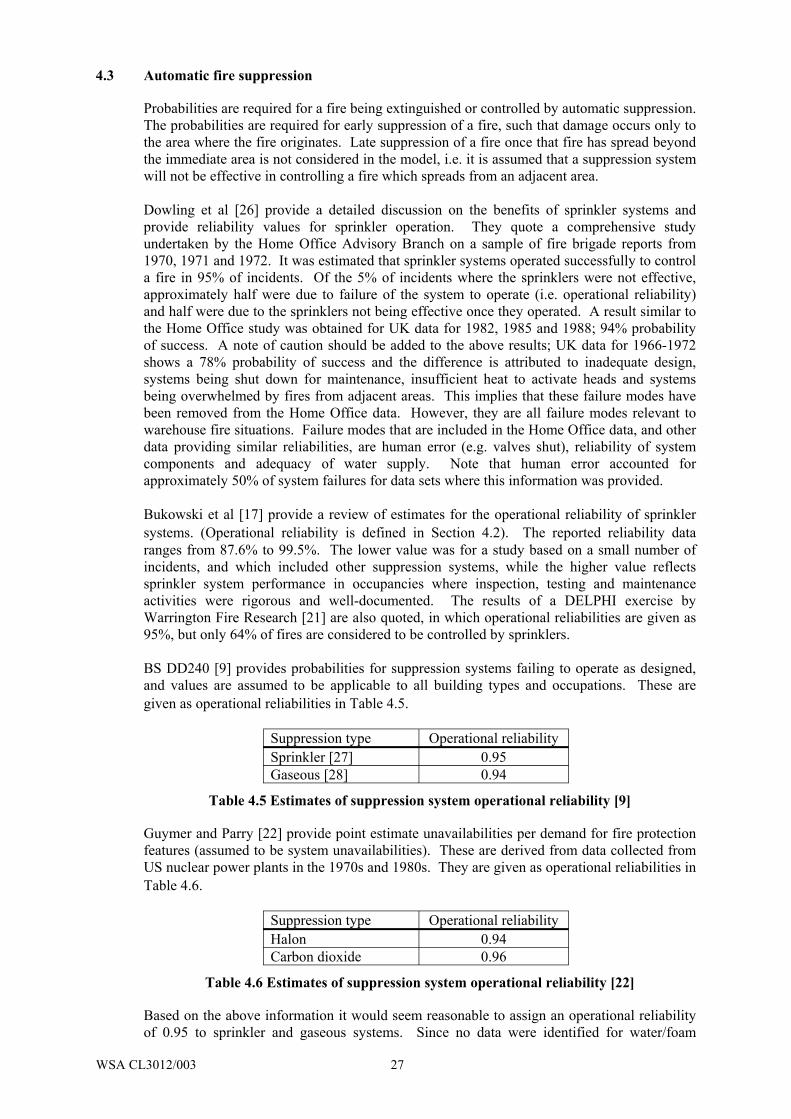
Probabilities are required for a fire being extinguished or controlled by automatic suppression. The probabilities are required for early suppression of a fire, such that damage occurs only to the area where the fire originates. Late suppression of a fire once that fire has spread beyond the immediate area is not considered in the model, i.e. it is assumed that a suppression system will not be effective in controlling a fire which spreads from an adjacent area.
Dowling et al [26] provide a detailed discussion on the benefits of sprinkler systems and provide reliability values for sprinkler operation. They quote a comprehensive study undertaken by the Home Office Advisory Branch on a sample of fire brigade reports from 1970, 1971 and 1972. It was estimated that sprinkler systems operated successfully to control a fire in 95% of incidents. Of the 5% of incidents where the sprinklers were not effective, approximately half were due to failure of the system to operate (i.e. operational reliability) and half were due to the sprinklers not being effective once they operated. A result similar to the Home Office study was obtained for UK data for 1982, 1985 and 1988; 94% probability of success. A note of caution should be added to the above results; UK data for 1966-1972 shows a 78% probability of success and the difference is attributed to inadequate design, systems being shut down for maintenance, insufficient heat to activate heads and systems being overwhelmed by fires from adjacent areas. This implies that these failure modes have been removed from the Home Office data. However, they are all failure modes relevant to warehouse fire situations. Failure modes that are included in the Home Office data, and other data providing similar reliabilities, are human error (e.g. valves shut), reliability of system components and adequacy of water supply. Note that human error accounted for approximately 50% of system failures for data sets where this information was provided.
Bukowski et al [17] provide a review of estimates for the operational reliability of sprinkler systems. (Operational reliability is defined in Section 4.2). The reported reliability data ranges from 87.6% to 99.5%. The lower value was for a study based on a small number of incidents, and which included other suppression systems, while the higher value reflects sprinkler system performance in occupancies where inspection, testing and maintenance activities were rigorous and well-documented. The results of a DELPHI exercise by Warrington Fire Research [21] are also quoted, in which operational reliabilities are given as 95%, but only 64% of fires are considered to be controlled by sprinklers.
BS DD240 [9] provides probabilities for suppression systems failing to operate as designed, and values are assumed to be applicable to all building types and occupations. These are given as operational reliabilities in Table 4.5.
Suppression type Operational reliability Sprinkler [27] 0.95 Gaseous [28] 0.94
Table 4.5 Estimates of suppression system operational reliability [9]
Guymer and Parry [22] provide point estimate unavailabilities per demand for fire protection features (assumed to be system unavailabilities). These are derived from data collected from US nuclear power plants in the 1970s and 1980s. They are given as operational reliabilities in Table 4.6.
Suppression type Operational reliability Halon 0.94 Carbon dioxide 0.96
Table 4.6 Estimates of suppression system operational reliability [22]
Based on the above information it would seem reasonable to assign an operational reliability of 0.95 to sprinkler and gaseous systems. Since no data were identified for water/foam
WSA CL3012/003 27
sprinkler systems, the probability of water sprinkler system operation is adopted for the model, noting that a large proportion of failures result from human error rather than the reliability of the system components.
The probability of 0.95 is considered to represent operation of the suppression system. It does not include successful control or extinguishment of the fire. For normal combustible materials and configurations it can be assumed that modern systems are properly designed and therefore control close to 100% of fires when they operate. However, for the more challenging fire hazards that are considered here, the probability of controlling the fire will be less than the operational reliability, even with a properly designed system. Fires involving flammable liquids, particularly those in combustible containers, may not be controllable by suppression systems designed in accordance with national codes. This has been demonstrated in several cases [29, 30, 31], although if materials are stored in metal containers this is much less of an issue.
Additional challenges to successful control of fires involving these hazards involve:
• Liquid flow across and between compartments and buildings; • Explosions and resulting projectiles; • Oxidiser fires not being able to be extinguished by stopping oxygen supply.
Liquid flow and the resulting running fires present a severe challenge to water sprinkler systems, especially since the water may exacerbate the liquid flow. Water sprinklers with aqueous film forming foam (AFFF) additives are a well-proven method of improving the control of such fires.
It has also been shown [31] that fires involving the storage of flammable liquids may be easier to control than fires involving combustible liquids, since flammable liquids tend to pool less than combustible liquids in a fire situation. (Note that the definitions of a 'flammable liquid' and a 'combustible liquid' used in [31] relate to NFPA 30 and are consistent with the definitions used in this study, as discussed in Section 3.3). However, the potential challenge of a running combustible liquid fire may be counteracted by the faster fire growth associated with a highly flammable liquid.
Gaseous suppression systems are not effective on fires involving oxidisers since, with exception of Halon, their main extinguishing function is the removal of oxygen. Water is a far better suppression medium in such cases since it also has a cooling action.
Table 4.7 summarises the probabilities adopted for the model.
Table 4.7 Probability of fire suppression system success
Note that the probabilities given in Table 4.7 relate to materials stored in metal containers. The conclusions of a test programme undertaken by the Health and Safety Laboratory [29] were that flammable pesticides in plastic bottles should be regarded as special ‘oil or flammable liquid’ hazards and that sprinkler protection may not be effective if stored. For the purpose of this study, any flammable liquids stored in plastic containers should be treated as highly flammable liquids, i.e. Fuel Type 1.
WSA CL3012/003 28
4.4 Manual fire-fighting
Probabilities are required for a fire being extinguished or controlled by manual fire-fighting, noting that it is assumed that manual fire-fighting is only effective in the early stages of a fire. Thus the model only takes credit for manual fire-fighting when the fire has been detected at an early stage, either by AFD or by on-site personnel.
No data on the probability of success of manual fire-fighting have been identified which are directly applicable to warehouses. However, Melinek [32] suggests that 25% of fires in nondomestic premises which are fought before the arrival of the fire brigade are out on arrival. Matthews et al [25] suggest a success rate of 75% for emergency teams putting out ordinary combustible fires within 3-8 minutes of detection. Guymer and Parry [22] reference work undertaken for the US nuclear industry relating probability of manual suppression to time available to suppress a fire. The model presented appears to be for a generic fire hazard and is not related to a particular fire growth rate. However, the majority of fire loads in the nuclear industry tend to be of slow to medium fire growth, although liquid fuels are found in nuclear plants and fires involving these materials will be of fast or ultra-fast growth. In Section 4.2 it was postulated that a fire would need to be detected before it reached a power of 1000kW (i.e. 5 minutes for medium fire growth) if manual suppression were to be attempted. Assuming that manual suppression would need to be undertaken within 3 minutes of detection if the fire is not to grow to an unmanageable size, then the model presented by Guymer and Parry gives a 0.4 probability of the fire being extinguished. In the absence of other data, this value is used in the model for success of manual suppression of medium fire growth materials. The probability of success is reduced to 0.2 for fast fire growth, and 0.1 for ultrafast fire growth materials, for which success of manual fire-fighting is unlikely.
Table 4.8 summarises the probabilities of success for manual fire-fighting. These probabilities relate to sites where there is some level of manning at all times, i.e. that there are personnel available to fight the fire. These personnel would either be those who detected the fire or those responding to AFD (which is assumed to occur early enough in the fire development such that the fire size is still amenable to manual fire-fighting when personnel arrive at the fire site).
Fuel Type 1 2 3 4 5
Manual suppression 0.1 0.2 0.4 0.4 0.2
Table 4.8 Probability of success of manual suppression
4.5 Early failure of fire compartmentation
Probabilities are required for the fire compartmentation performing its desired function, which is to prevent the spread of fire for a specified duration. As discussed in Section 3.4, it is assumed that, for an intact compartment boundary, fire spread will occur only if the duration of the fire is greater than the withstand duration of the boundary. The fire duration will be a function of the fire brigade response, and this is considered further in Section 4.6. However, there are a variety of reasons for a compartment boundary not being intact and failing earlier than its withstand duration. There may be penetrations in the boundary which are fixed open (e.g. fire doors jammed open or failure of auto-closers, failure of fire dampers and service penetrations etc.) or there may be failures in installation or manufacture of the compartment wall itself. There may also be insufficient protection against spillage of flammable liquids across the boundary. In a chemical warehouse, sudden failure of metal containers may breach a compartment wall due to blast and/or missile effects.
Fire spread via the warehouse roof is only considered in the model for missiles. The roof will not be required to be fire resistant if constructed to the Building Regulations. The likelihood
WSA CL3012/003 29
of the roof collapsing is therefore high, although this will not necessarily lead to fire spread to adjacent compartments or other buildings.
Installation and manufacture of compartment walls
Bukowski et al [17] quote the results of the Warrington Delphi study [21] for reliabilities of masonry constructions or partitions and these are given in Table 4.9.
Wall type Operational reliability1
Masonry construction 0.81 Gypsum partition 0.69 1. Probability that wall will have no penetrations which are fixed open
Table 4.9 Estimates of fire compartmentation operational reliability [17]
The Warrington Delphi probabilities reflect the sensitivity of the different constructions to onsite workmanship. Typically masonry walls are robust constructions whose stated fire resistance is far below what would actually be achieved in a specific fire resistance test. On the other hand generic fire resistance is not a concept applied to plasterboard partitions. The test results are often achieved to the minute, so there is little chance of the partition, as installed on site, being able to match the fire performance of a carefully constructed laboratory sample. This is compounded by a general lack of robustness in a dynamic fire situation; since boards shrink and crack and even minor disturbances are likely to lead to boards falling away and subsequent loss of fire integrity.
Reinforced concrete construction was not considered in the Warrington Delphi study. However, it can be assumed to have a fire performance that is only limited by there being perforations before the fire start. The probability of this occurring has been set to 0.05 based on DD240 [9], giving a probability of success of 0.95 for this type of construction (see Table 4.11).
Table 4.10 summarises the probabilities adopted in the model for wall constructions being successful in preventing fire spread. In this table the probabilities have been reduced for masonry and plasterboard partitions to reflect the poorer performance of wall constructions when subjected to fires of increasing fire growth rate. This is particularly true for plasterboard partitions, which will not perform well in conditions which are representative of liquid hydrocarbon fire exposures. The rapid fire growth and resultant thermal shock will cause excessive bowing towards the fire due to the temperature gradient through the thickness of the construction. This will lead to disruption of the boarding and premature failure (before arrival of the fire brigade).
Table 4.10 Probability of success of wall constructions
Passive systems in compartment walls.
The probabilities mentioned above are only applicable to walls without doors. Further probabilities are provided in the literature for passive systems within compartment boundaries failing to operate as designed. BS DD240 [9] provides probabilities of passive fire protection features failing to operate as designed, derived from an ASTM study [34]. They are given as operational reliabilities in Table 4.11.
WSA CL3012/003 30
Protection feature Operational reliability
Compartment wall (perforation before fire start)1 0.95 Fire door 0.70 Self-closing door to protected stairway 0.90 1. In this case the probability refers to perforation of the wall before fire
Table 4.11 Estimates of operational reliability of compartment penetrations [9]
Guymer and Parry [22] provide point estimate unavailabilities per demand for fire protection features (assumed to be system unavailabilities). These are derived from data collected from US nuclear power plants in the 1970s and 1980s. They are given as operational reliabilities in Table 4.12.
Table 4.13 summarises the probabilities adopted in the model for passive systems in compartment walls being successful in preventing fire spread. The above data suggest that the probability of a non-self closing fire door failing to operate as designed is 0.30 and this dominates the probability of failure of other passive systems to close. Therefore any compartment wall with such a door should not have a probability of success of greater than 0.70. With respect to fire doors mounted in plasterboard partitions, the doors will often achieve a better fire performance due to the flexibility of the stud framing. This can result in the door leaves remaining within their frames rather than bowing out of the frame, which may occur if the frame was more rigidly restrained as, for example, in a masonry wall.
Suppression type Operational reliability Fire doors and curtains 0.926 Fire walls and penetration seals 0.999 Fire and ventilation dampers 0.997
Table 4.12 Estimates of operational reliability of compartment penetrations [22]
1. Flexibility in wall construction allows improvement in success probability
Table 4.13 Probability of success of passive systems in compartment walls
Liquid fuel spread
Consideration also needs to be given to measures to prevent liquid fuel spread through compartment doors, which can be accomplished using shallow curbs or drainage channels at doorways, or by relying on sloping floors and drainage around particular storage areas. If spill containment is not provided then the model assumes that the success probability of compartmentation is significantly reduced for liquid fuels. It is assumed that 50% of liquid fuel fires will lead to spillage of liquid in the vicinity of a door and a probability of 0.5 is used for fire spread to adjacent compartments if curbs or drainage channels are not fitted at doorways. No published data has been identified for the probability that a curb or drainage channel will prevent liquid spread. In the absence of such data, it is assumed that this probability is similar to that for other passive measures such as a gypsum partitions or masonry walls (see Table 4.9). A probability of success of 0.7 is assigned to passive measures such as curbs or drainage in the event of a spill, giving a probability of success of 0.85 for these measures preventing liquid spread to adjacent compartments.
Table 4.14 summarises the probabilities adopted in the model for spill control at compartment boundaries being successful in preventing fire spread.
WSA CL3012/003 31
Fuel Type 1 2 3 4 5
Spill control at doorway 0.85 0.85 0.85 1 1 No spill control at doorway 0.50 0.50 0.50 1 1
Table 4.14 Probability of success of spill control at compartment boundaries
Sudden failure of containers
As discussed in Section 3.7, the sudden failure of flammable liquid containers has the potential to damage compartment walls due to both missile and blast effects. Incident data [35] suggests that the sudden failure of metal containers in warehouse fires is common, although there are insufficient data to quantify the frequency of sudden failure. The model uses an estimate of the probability of sudden failure per fire incident of 0.2, i.e. an average of one sudden failure for every five fires in a compartment. It is assumed that if sudden failure is possible, then this occurs for multiple containers.
There is the potential for a full container to fail in such a way that it can form a rocket type projectile. As discussed in Section 3.8, such a missile would breach both blockwork and stud partition walls, but not reinforced concrete walls. Fire spread to adjacent compartments via the roof is also possible due to rocketing containers. (The results of Section 3.7 suggest that velocities of rocketing containers, or parts of containers, are sufficient for the roof structure to be breached.) Clearly, this container will not then necessarily enter another compartment but in the model it is assumed that it does and that fire spread then results. Thus the probability that fire spread due to missile effects will occur to adjacent compartments, given that a sudden rupture has occurred, is assumed to be 1 for blockwork or stud partition walls. Thus the probability that fire will spread due to missile effects is 0.2x1=0.2. For reinforced concrete walls, missiles will not penetrate the walls, but the probability that missiles will breach the roof is taken to be 0.3. Thus the probability that fire spread will occur due to missile effects is 0.2x0.3=0.06 for each adjoining compartment.
Table 4.15 summarises the probabilities adopted in the model for fire spread via missile effects.
Table 4.15 Probability of fire spread via missile effects being prevented (given that a sudden failure of a container has occurred)
Reinforced concrete walls were found to withstand the worst-case blast effects of sudden failures of containers. Thus no penetrations which allow fire spread to adjacent compartments will be produced. Plasterboard partitions offer little protection blast effects and the model assumes that, if a container fails, then fire spread to the adjacent compartment will occur. The results of Section 3.7 suggest that blockwork walls will also be breached under the worst-case effects of sudden failures of containers. However, these worst-case effects assume that the containers are almost empty of liquid and are filled with fuel vapour. For full containers, as would be expected to be stored inside a warehouse, the blast effects would be significantly less severe than for an empty container and would be unlikely to cause blast damage to the wall. The probability that the container which is undergoing sudden failure is empty or partially empty is set to 0.2. Table 4.16 summarises the probabilities adopted in the model for fire spread via missile effects.
Table 4.16 Probability of fire spread via blast being prevented (given that a sudden failure of a container has occurred)
It is acknowledged that, due to the scarcity of incident data, there is much uncertainty in the derivation of probabilities relating to sudden failures of containers. Thus the sensitivity of the risk model to the choice of these probabilities has been tested and this is reported in Section 6.4.
4.6 Fire compartment withstand and Fire Brigade intervention
Probabilities are required for the fire being controlled by the fire brigade, thereby preventing its spread out of the compartment. For the purpose of the model it is assumed that, by the time the fire brigade arrives and is ready to tackle the fire, the fire will be fully developed within the compartment. Therefore, the benefit that the fire brigade provides in this case is to bring the fire under control before it breaches the fire compartmentation or, if separation by distance is used rather than compartmentation, before it spreads between separated areas. Note that this section considers the benefit of intact fire compartmentation. Early failure of compartments during fire development has been considered in Section 4.5.
The time available for the fire brigade to control the fire is defined by the withstand duration of the fire compartmentation, tW, as defined in Section 3.6, plus the time it takes for fire to spread across a separation, tS, as defined in Section 3.7.
The total time to control a fire, tC, is the sum of the four key components listed below. Each of these components is influenced by site features or provision of fire protection measures.
� Time to detection, tD, which depends on operation of AFD.
� Attendance time, tA, which depends on site location and direct link to fire brigade.
� Intervention time, tI, which depends on the requirement for search and rescue of building occupants and need to don protective gear.
� Control time, tC, which depends on fuel type (fire severity and toxicity), adequacy of water supplies and smoke logging of compartment (and hence roof venting).
A recent analysis of London Fire Brigade data [36] suggests that, for non-residential fires, the first three time components are short in comparison to the control time. Furthermore, the variation in tD, tA and tI only correlated weakly with the final damage area. However, the control time, tC, (comprising time to stop fire spread plus time to extinguish flames) was found to correlate with final damage area.
In the model, set values are used for tD, tA, tI, based on the ranges of times for these components provided in [3,36], and these are given in Table 4.17.
WSA CL3012/003 33
Operation of fire prevention Time delay (minutes) Time to detection, tD Early onsite detection 5
Offsite detection 10 + tG* Attendance time, tA Direct link to fire brigade 5
No direct link to fire brigade 10 Intervention time, tI, n/a 2 *tG = growth or development time, i.e. time for fire to reach size such that it is visible offsite
Table 4.17 Model values for detection, attendance and intervention times
The data on times from intervention to stop of fire spread, and then to suppression of flames, given by [36] are used to produce a distribution for control time, tC. This distribution is then converted to the cumulative probability of a fire being controlled within a specified time, as shown in Figure 4.1. This distribution is broadly consistent with data on control times from two further investigations reviewed by [3], if the control time is defined as the time at which the incident commander indicates that no more resources are required to handle the fire, even if the fire is not necessarily out.
Prob
abilit
y th
at fi
re is
und
er c
ontro
l, p C
1.000
0.800
0.600
0.400
0.200
0.000
Data
Fit
0 50 100 150 200 250 300 350 400 450 500
Control time, tC (minutes)
Figure 4.1 Cumulative probability of fire control
The following fit to the cumulative probability curve is then used in the model:
pC 0= t C < minutes 2
p p
C
C
0.8458)ln(t 0.0246 0.1690)ln(t 0.2500
C
C
+=
−=
minutes 500t90 minutes 90t2
C
C
<≤
<≤ (4.1)
pC 1= tC minutes 500 ≥
where pC is the probability that the fire is under control at time tC. In the model, the time available for control, is the withstand time plus separation time plus development time minus the time taken for the fire brigade to start attacking the fire. Thus tC is calculated as follows:
tC = tW + tS + tG − tD − tA − t I (4.2)
WSA CL3012/003 34
For the purpose of this study, the development time, tG, is simply set to the time required for each particular fire type to reach a fire power of 20MW.
It is recognised that the use of the generic data provided in [36] does not allow the effects of fuel type, and the use of fire mitigation measures such as roof venting, to be directly modelled. Furthermore, the data relate to all non-residential fires, and fire control times for warehouses alone may have a different distribution of control times. There would be benefit in analysing the London Fire Brigade source data for industrial or warehouse storage premises only to examine whether the cumulative probability curve should be revised. It should also be ascertained whether there are sufficient data to take account of different fuel types, or implementation of fire mitigation measures which are known to aid fire brigade response.
WSA CL3012/003 35
5. COSTS ASSOCIATED WITH FIRE PREVENTION MEASURES
5.1 Assumptions made in defining costs
Cost information was sought from suppliers and from quantity surveyors. This information was then supplemented by a literature search for published cost data. The information obtained was sparse and is used in the model to provide approximate (and generic) costs associated with fire prevention measures. It is acknowledged that these generic costs cannot be fully representative of the range of costs associated with particular installations of manufacturer’s equipment, or particular designs of equipment, within specific warehouses.
Only optional costs associated with fire protection measures are included in the model. Thus costs are provided for detection and suppression systems and installation of fire-rated compartment walls and spillage control. Costs associated with fire brigade requirements (e.g. provision of an adequate water supply and fire water containment), and manual extinguishing equipment are not included as these are required for all warehouse facilities.
5.2 Cost options for highly inflammable/hazardous liquid storage facility
Cost options have been derived for active fire protection measures, based on their installation within an existing facility. The facility has a floor area of 20m x 10m to house 750mm diameter by 1000mm high barrels stacked four to each pallet. Pallet size is approximately 1500 x 1500mm. These pallets are to be laid out in ten rows of two pallets to each footprint and these footprints will be stacked five high. There will be two footprints in the store set out to give forklift truck access between and all around each of the footprints. The 200m2 store will house 800 barrels for this arrangement.
Drainage
The lines of pallets are supported by a ‘hollow’ plinth constructed of 100mm Engineering brick walls (to the perimeter of the lines of pallets, i.e. 1500 x 1500mm outside dimensions). Across the ‘top’ of the brick walls are steel ‘I’ section beams 50 x 100mm (approx.) to support the pallets. The ‘hollow’ plinths contain any spillage of hazardous material and are drained by three gullies to each plinth. The drainage, which comprises three drainage runs to each of two plinths, drains to an ‘interceptor’ manhole, which is to be within 5m of the external wall of the store.
Within this interceptor manhole a sensor is to be installed, which would signal the BMS System if any hazardous material ‘leaks‘ into the drainage system.
Plant room (common to both suppression options given below)
The ‘plant room’ of the Sprinkler or Gas Systems is to be within 50 metres of the Hazardous Store i.e. this is the effective length of interconnecting pipe work, for water or gas.
The plant rooms, whilst not quite the same size for each of the options below, will be ‘fitted out’ in exactly the same way, with floor gulley; lights; power; heater; extract and protection in the same system as the Hazardous Store.
Sprinkler System
The costs for this system comprise:
a) Pipework distribution costs within the hazardous store. The density of heads used is 1 per 5m2, i.e. 40 including heads within the plant room.
b) Plant room costs including major plant and valves etc.
WSA CL3012/003 36
c) Extra cover for providing a larger diameter plant room gulley drain incorporating a sump or chamber to enable the pumps to be tested for maintenance and/or insurance company inspections.
d) Sprinkler main connection from Water Authority, including 50m of pipe in a trench including all connections and valves etc.
e) Sprinkler panel in the Plant Room with a gateway to the Fire Alarm.
f) System and the BMS System also a connection to the Interceptor Manhole sensor.
Gas System
The costs for this system comprise:
a) Gas bottles at 1 per 25-30 m3, stored in a separate Plant Room or Bottle Store which is to be within 50m of the Hazardous Material Store. Approximately 24 bottles and 1 further for the Plant Room.
b) Bottle rack to Plant Room / Bottle Store.
c) Electrical system of detectors and interconnecting cables for alarms and door release systems and alarm buttons etc.
d) Pressure relief system. Two ductwork runs for pressure relief points. Five pressure relief dampers to store (includes one to Bottle Store).
Based on the above descriptions, the cost estimates in Table 5.1 have been derived. It is emphasised that the values given are intended to be indicative of costs only, and relate to components and installation but not maintenance. Furthermore, the system descriptions given above are examples used to illustrate the key cost items. They are not intended for use as recommended approaches for designing such systems. Note that for use in the model, the costs for each system are broken down into a fixed cost and a cost per floor area in Section 5.3. The costs in Section 5.3 for sprinkler and gas suppression systems include the cost of the plant room.
System Cost (£)
Drainage 12,000
Plant room 5,000
Sprinkler 33,000
Gas suppression 64,000
Table 5.1 Estimated costs for fire protection systems in a 200m2 hazardous liquid store
5.3 Cost estimates used in model
Tables 5.2 and 5.3 summarise the cost data obtained for general fire protection and compartmentation measures, respectively. The costs have been updated to 2001 prices for the purposes of comparison. In each case, the cost C is given as a fixed cost component, a, plus a cost per area, b:
C = a + b.Af measures protection general for (5.1)
C = a + b.A measures tation compartmen for w
where Af is the floor area and Aw is the area of the compartment wall or door.
WSA CL3012/003 37
Fire prevention measure Fixed cost, a (£)
Area cost, b (£/m2)
Source/comments
Drainage system (hazardous material store)
9000 15 Section 5.2
Detection system (local alarm) 4500 3.3 [37] Detection system (direct line) 5300 3.3 [37] Alarm and detection system (factories / retail)
- 6 - 11 [38]
Detection system (industrial) - 9 [39] Detection system (local alarm) 4000 - Supplier data for 500m2
warehouse Direct line / central monitoring 1000 - Supplier data (plus annual cost) Infra-red/UV detection system – designated hazardous area
It can be seen from the above tables that there is reasonable agreement between published information, estimates provided by suppliers and the estimates given in Section 5.2. The values used in the model are as given in Table 5.4.
Note that in addition to the costs provided in the table, there will be operational costs associated with installation of fire protection measures. For most systems, there will be annual costs relating to maintenance and testing or provision of a direct link to the fire brigade. However, these annual costs are not included in the model. The installation of compartment walls will also result in operational costs relating to increased travel times when moving chemicals and time required to open and to shut fire doors. There will also be loss of floor space (required for manoeuvring) around any additional doors in the compartment walls. Discussions with warehouse operators suggested that the latter will be the most significant
WSA CL3012/003 38
operational cost associated with installation of compartments. Thus in the model the compartmentation costs are increased by a factor, F, calculated as follows:
2F = (A +∑ w ) / A (5.2)f d f
where Af is the floor area and wd is the door width for each additional compartment door. A similar calculation is used to account for loss of floor space due to use of separation between compartments.
Fire protection measure a (£) b (£/m2) Detection AFD 5000 3 Flame 9000 20 Automatic suppression Water sprinkler system 27000 55 Foam sprinkler system 32000 55 Gas suppression system 21000 240 Compartmentation Concrete partition - 300 Masonry partition - 120 Stud partition (< 90 minutes) - 120 Stud partition (> 90 minutes) - 220 Door (roller shutter) - 300 Spill control 9000 15 Fire brigade link 1000 -
Table 5.4 Cost data used in model
In order to put the cost data in Table 5.4 into context, an indicative cost for the construction of a new build warehouses, including foundations is £600/m2. Note that this does not include the cost of chemicals stored in the warehouse or design costs in the region of (10-15%).
WSA CL3012/003 39
6. MODEL TESTING
6.1 Model implementation
For the purpose of development and testing, the model has currently been implemented in spreadsheet format. The spreadsheet model is limited to a maximum of 6 areas and considers fire spread along a chain of up to three compartments (i.e. from the source compartment, through an adjacent compartment into the final compartment). This model has been used to undertake limited testing of the model and this is described in the following sections.
6.2 Scenario 1 – Existing chemical warehouse
The first scenario is based around an existing chemical warehouse site, the key features of which are illustrated in Figure 6.1. The site comprises a single warehouse, split into 3 compartments (Areas 1-3). All internal and external walls are of non-fire rated construction, assumed to have a nominal fire withstand of 15 minutes to BS476. Immediately outside of the warehouse there is a bunded area containing flammable liquids (Area 4) and an area used for temporary storage of chemicals before loading (Area 5). Beyond this area lies an open area for storage of solvents (Area 6), with spillage to adjacent areas controlled by a mixture of low walls and curbing. The stored materials in all external areas are separated from each other and from the warehouse by a distance of 7.5m. There is no automatic detection or suppression on site and so the only defence against fire is via manual detection and firefighting by onsite personnel, followed by attendance of the fire brigade. Table 6.1 summarises the key properties of each of the site areas defined in Figure 6.1.
A
Area 2
A
A
A
A
Door
rea 1 rea 4
rea 3
rea 5
rea 6
Figure 6.1 Site plan for Scenario 1
Area Floor area, m2
(and height, m) Material
(Ref.) Misc. features
1 900 (5) Combustible solid (4)
Non fire-rated door to Area 2
2 2700 (5) Mixed (M) Non fire-rated doors to Area 1 and Area 5 3 600 (5) Combustible
solid (4) Non fire-rated door to Area 5
4 900 Acids (2) Bunded area with 7.5m separation 5 3300 Mixed (M) Temporary storage with minimum 7.5m separation to
adjacent areas 6 2100 Solvents (1) Curbed area with 7.5m separation
Table 6.1 Area properties for Scenario 1
The configuration described above represents the base case, for which the risk model gives a damage area-fire frequency product of 936 m2/year. The fire frequency is 1.05x10⁻¹ /year and
WSA CL3012/003 40
the total storage area on site is 10500m2. Thus for each fire the mean damage area is 8914m2, i.e. approximately 85% of the total site area. It is considered that the prediction of area-fire frequency product in this case is pessimistic, resulting partly from the use of conservative probability data, but also the assumption that mixed storage areas exhibit the worst case features of all the other material types. However, as discussed in Section 4.1, the purpose of the model is to compare risk reduction measures rather than provide an absolute prediction of risk. The cost of automatic fire protection and compartmentation is zero for the Base Case, but there is approximately 2000m2 of unusable area (separation area and turning spaces at doors etc.). The model was then used to investigate various options for fire protection and the results are summarised in Table 6.2.
Case Area-frequency product
(m2/year)
Cost/Area (£/m2)
Risk w.r.t. Base Case1
1. Base Case 936 0 -2. Base Case with separation (external areas) removed 954 02 1.02 3. Base Case plus AFD3 in warehouse areas 697 3 0.74 4. Case 3 plus sprinklers (water) in warehouse areas 578 40 0.62 5. Case 3 plus 2 hour stud partition internal walls 695 17 0.74 1. Area-frequency product divided by Base Case area-frequency product 2. Removal of separation creates 1900m2 further storage space 3. Includes direct link to fire brigade
Table 6.2 Model results for Scenario 1
The model results suggest that installation of automatic fire detection in the warehouse (Case 3) is the most cost effective way of reducing the fire risk. Little further benefit is obtained by installation of fire-rated stud-partition internal walls (Case 5). Installation of sprinklers (Case 4) has a cost of more than double that of stud partition fire walls (in place of current internal partitions), but does provide the greatest benefit in terms of risk reduction. Note that for the Base Case, 44% of the fire risk (i.e. 414 m2/year out of the total area-frequency product of 936 m2/year) relates to fires starting in the external storage. Thus an area-frequency product of 414 m2/year represents the minimum fire risk possible through improvements to the warehouse fire protection alone.
The low risk reduction associated with the installation of fire-rated internal compartment walls is partly due to the large compartment sizes used in the scenario, the largest being 2700m2. The effect of sub-dividing a warehouse into smaller compartments is investigated in Section 6.3.
6.3 Scenario 2 – Modern warehouse
The second scenario is based around a hypothetical chemical warehouse site, the key features of which are illustrated in Figure 6.2. The site comprises a single warehouse, split into a maximum of four compartments. All external walls are of non-fire rated construction, assumed to have a nominal fire withstand of 15 minutes to BS476. Immediately outside the warehouse there is an area used for temporary storage and movement of chemicals, separated from the warehouse by a distance of 7.5m. Table 6.3 summarises the key properties of each of the site areas defined in Figure 6.2.
The base case configuration is a single compartment warehouse, i.e. no internal walls between Areas 1-4, with no automatic fire detection installed. The risk model gives a damage area-fire frequency product of 66 m2/year for this configuration. The model was then used to investigate various options for fire protection and the results are summarised in Table 6.4.
WSA CL3012/003 41
Area Floor area, m2
(and height, m) Material (Ref.) Misc. features
1-4 500 (10) Combustible Four identical areas with non fire-rated doors to liquid (3) Area 5.
5 800 Combustible Temporary storage with minimum 7.5m separation liquid (3) to warehouse
Table 6.3 Area properties for Scenario 1
Area 1 Area 2 Area 4 Area 3
Area 5
Door
Figure 6.2 Site plan for Scenario 2
Case Area-frequency product
(m2/year)
Cost/Area (£/m2)
Risk w.r.t. Base Case1
1. Base Case (single compartment) 66 0 -2. Base Case plus AFD2 in warehouse areas 37 10 0.56 3. Case 2 plus sprinklers (foam) in warehouse 21 102 0.32 4. Two compartments (using 2 hour reinforced
concrete internal walls) plus AFD2 in warehouse 34 68 0.52
5. Case 4 plus sprinklers (foam) in warehouse 19 161 0.30 6. Four compartments (using 2 hour reinforced
concrete internal walls) plus AFD2 in warehouse 29 185 0.44
7. Case 6 plus sprinklers (foam) in warehouse 17 277 0.26 1. Area-frequency product divided by Base Case area-frequency product 2. Includes direct link to fire brigade
Table 6.4 Model results for Scenario 2
It can be seen from Table 6.4 that, as for Scenario 1 in Section 6.2, the model results suggest that detection is the most cost effective way of reducing fire risk in a chemical warehouse. Compartmentation appears not to provide significant additional benefit over installation of detection, whereas installation of sprinklers further reduces the risk by a factor of almost two. It is noted that the costs of installation of detection and automatic suppression may be exaggerated for the compartmental cases in Scenario 2. This is because the fixed (i.e. nonarea) costs associated with these measures are included for each of the four separate areas of the warehouse.
As for Scenario 1 in Section 6.2, a high proportion of the residual risk is associated with the external area. Cases 1, 2, 3 and 4 have been rerun assuming that the external area is clear of combustibles and does not contribute to fire spread. The results are given in Table 6.5, noting that the increase in costs/area results from a reduction in storage area across the site, rather
WSA CL3012/003 42
than increase in the cost of installing systems in the warehouse. It can be seen from the table that the same pattern as for the case with external storage emerges with regard to the benefits of installing fire protection measures in the warehouse.
Case Area-frequency product
(m2/year)
Cost/Area (£/m2)
Risk w.r.t. Base Case1
1. Base Case (single compartment) 22.6 0 -2. Base Case plus AFD2 in warehouse areas 9.6 15 0.42 3. Case 2 plus sprinklers (foam) in warehouse 0.5 148 0.02 4. Two compartments (using 2 hour reinforced
concrete internal walls) plus AFD2 in warehouse 7.9 99 0.35
1. Area-frequency product divided by Base Case area-frequency product 2. Includes direct link to fire brigade
Table 6.5 Model results for Scenario 2 with external area clear of combustibles
The modelling is repeated for Cases 1, 2, 3 and 4 but with the combustible liquid replaced with a highly flammable liquid. The results are provided in Table 6.6, noting that the cost of sprinkler protection is increased due to the requirement for drainage underneath the storage racking (see Section 5.2).
Case Area-frequency product
(m2/year)
Cost/Area (£/m2)
Risk w.r.t. Base Case1
1. Base Case (single compartment) 36.5 0 -2. Base Case plus AFD2 in warehouse areas 31.7 15 0.87 3. Case 2 plus sprinklers (foam) in warehouse 6.3 186 0.17 4. Two compartments (using 2 hour reinforced
concrete internal walls) plus AFD2 in warehouse 22.4 99 0.61
1. Area-frequency product divided by Base Case area-frequency product 2. Includes direct link to fire brigade
Table 6.6 Model results for Scenario 2 with storage of HFL
The model results of Table 6.6 again suggest that a sprinkler system is more effective than compartmentation in reducing fire risk. However, there are two caveats to this conclusion. The first is that the model assumes appropriately designed protection systems and significant care is required when specifying a suppression system for liquid fuels. Secondly, the model results mask the fact that compartmentation is more effective in protecting adjacent storage areas than suppression systems. For the foam sprinkler system, the damage due to spread across the boundary between Areas 2 and 3 contributed 1.6 m2/year to the total of 6.3m2/year. When a concrete compartment wall is placed at this boundary, the contribution of damage due to fire spread is 2.0 m2/year out of a total of 22.4m2/year, i.e. most of the damage occurs in the compartment containing the original fire source. This may partly be a function of the model set-up, where it is assumed that the whole compartment is damaged once the fire has developed. However, it suggests that compartmentation is a better option than sprinklers if protection of adjacent high risk areas (e.g. those containing pesticides) or offsite premises is a priority.
Table 6.7 compares the effectiveness of other compartment wall options in reducing damage due to fire spread. It can be seen that blockwork walls and stud partitions offer significantly less protection than reinforced concrete against fire spread for HFLs. This is due to their reduced ability to withstand blast and missile effects from sudden failure of metal containers and also due to the higher likelihood of being perforated in a fast-growing hydrocarbon liquid
WSA CL3012/003 43
fire. The final row of Table 6.7 shows that installing a door within a compartment wall also significantly reduces its effectiveness.
Case Area-frequency product (m2/year)
Cost/Area (£/m2)
1. AFD1 plus sprinklers (foam) in warehouse 1.6 148 2. Two compartments (using 2 hour reinforced
concrete internal walls) plus AFD1 in warehouse 2.6 99
3. Two compartments (using 2 hour blockwork internal walls) plus AFD1 in warehouse
5.7 48
4. Two compartments (using 2 hour stud partition internal walls) plus AFD1 in warehouse
6.7 76
5. Two compartments (using 1 hour stud partition internal walls) plus AFD1 in warehouse
7.2 48
6. Two compartments (using 2 hour reinforced concrete internal walls with door) plus AFD1
6.1 101
1. Includes direct link to fire brigade
Table 6.7 Damage due to fire spread for storage of HFL
6.4 Sensitivity of model results to choice of probabilities for sudden burst of containers
As discussed in Section 4.5, it was considered necessary to test the sensitivity of results to the choice of values used for the probabilities for sudden burst of containers. This section considers the sensitivity of the model to probabilities for; containers rupturing in a fire; fire spread resulting from containers breaching masonry walls and; fire spread due to containers breaching the roof of a compartment. For HFL, these probabilities are assumed to be in the range; 0.1-0.5; 0.1-0.5 and; 0.25-1 respectively. Thus the probabilities in Table 4.15 of Section 4.5 can be revised to give the minimum and maximum probabilities of fire spread due to missile effects summarised in Table 6.8 below.
Wall type Probability Range Original Min Max
Concrete 0.94 0.75 0.99 Masonry 0.80 0.50 0.975
Table 6.8 Probability of fire spread via missile effects being prevented for HFL (given that a sudden failure of a container has occurred).
The chosen scenarios are based on the new warehouse configuration for Scenario 2, as discussed in Section 6.3 above, and are the same as Cases 2 and 3 in Table 6.7. The results of the sensitivity analysis are given in Table 6.9 for total damage.
Case Area-frequency product (m2/year) Original Min. Max.
2. Two compartments (using 2 hour reinforced concrete internal walls) plus AFD1 in warehouse
22.4 21.9 24.3
3. Two compartments (using 2 hour blockwork internal walls) plus AFD1 in warehouse
25.8 24.7 28.0
1. Includes direct link to fire brigade
Table 6.9 Sensitivity of damage due to fire spread for storage of HFL to choice of probabilities for sudden burst of containers
The range of total damage due to fire spread varies by approximately 10% from that using the original probabilities for sudden burst of containers assumed in the model. Although the
WSA CL3012/003 44
choice of missile probabilities is reasonably arbitrary, they appear to be non-critical with respect to total damage. It should be noted that the main differences in total fire spread are shown in the contribution to the damage resulting from spread across the boundary between Areas 2 and 3. This is illustrated in Table 6.10.
Case Area-frequency product (m2/year) Original Min. Max.
2. Two compartments (using 2 hour reinforced concrete internal walls) plus AFD1 in warehouse
1.97 1.65 3.20
3. Two compartments (using 2 hour blockwork internal walls) plus AFD1 in warehouse
4.24 3.48 5.68
1. Includes direct link to fire brigade
Table 6.10 Sensitivity of contribution to damage due to fire spread across the boundary between areas 2 and 3 to choice of probabilities for sudden burst of containers
WSA CL3012/003 45
7. CONCLUSIONS
7.1 Review of current legislation and guidance
A review of legislation and guidance has been undertaken, with particular attention to countries where performance-based design codes are used. The following countries were considered:
� UK � USA � Australia � New Zealand � Germany
Guidance on compartment sizes was found only for the UK and for the Comité Européen des Assurances (CEA), with the latter being produced in conjunction with the UK Loss Prevention Council. Building codes for England and Wales give a maximum allowable volume of 20,000m3 (i.e. 2000m2 for a 10m high warehouse or 4000m2 for a 5m high warehouse) for general storage, whereas there is a specific requirement in Scotland for high hazard storage to be limited to 1000m2. The LPC suggests a maximum area for general storage of 4000m2, although it is suggested that this limit is reviewed for storage of highly combustible substances or flammable liquids storage. The CEA recommends maximum compartment areas ranging from 50 to 7200m2 depending on material stored, access to the fire brigade and use of automatic suppression systems.
Guidance on fire resistance of compartment boundaries was found for the UK, USA, Australia and Germany. The guidance generally suggests 240 minutes fire resistance (to BS476 or equivalent), with reductions allowed for reduced compartment sizes (Scotland) and where sprinklers were installed (US NFPA 30 and UK LPC). The building code for England and Wales is the most significant exception to the above. It gives a fire resistance requirement of 60 minutes, reducing to 30 minutes for sprinklered buildings, although this relates to general storage rather than high hazard storage. German (TRGS) technical rules give a 90 minute fire resistance requirement for storage of toxic chemicals or oxidisers, which compares with the US NFPA 430 requirement of 60-120 minutes for storage of oxidisers.
7.2 Model development
A model has been developed for assessing the risk associated with fires in chemical warehouses. It considers the relative benefit of fire protection measures in limiting fire spread through output of a fire frequency-damage area product. The damage area is considered to correlate well with the severity of offsite effects such as the production of smoke plumes and fire water run-off. The model also indicates the costs associated with installation of fire protection measures.
The model considers the effects of:
� detection (manual and AFD); � automatic suppression; � manual fire fighting; � spillage control; � separation (including offsite spread of fire); � compartmentation (reinforced concrete, blockwork and stud partitions); � fire doors; � sudden failure of containers and resulting missile and blast effects; � fire brigade arrival and control times.
WSA CL3012/003 46
The model is essentially probabilistic but includes simple deterministic assessment of fire growth, fire spread across separation and withstand duration for fire compartment components.
7.3 Model testing
Limited testing of the model has been undertaken. The model appears to provide sensible results for the cases considered, although the results were considered to be conservative for Scenario 1, the existing chemical warehouse, as discussed in Section 6.2.
Some conclusions can be drawn from the testing as follows:
a) Automatic fire detection is generally more cost effective than other protection measures.
b) Automatic suppression is more effective than compartmentation in reducing fire damage, although it is noted that it is difficult to ensure the adequacy of suppression system designs for materials and storage configurations found in chemical warehouses.
c) Reinforced concrete fire compartmentation represents the most effective way to prevent fire spread offsite or into high hazard areas on site. The effectiveness reduces significantly if blockwork or stud partition walls are used or if fire doors are installed .
A detailed deterministic assessment was undertaken of missile and blast effects from the sudden failure of metal drums containing liquid fuels. The results of this assessment can be summarised as follows:
a) A reinforced concrete wall will not be penetrated by any blast or missile effects from a worst case failure of a drum.
b) The blockwork wall will fail due to blast effects from the worst case failure of a drum if this occurs within 5m of the wall. It will be penetrated by a missile if the missile impacts at angle of greater than 22 degrees from the wall surface. Local failure of the wall due to blocks being knocked out may also occur.
c) The plasterboard stud partition will not withstand blast or missile effects from the worst case failure of a drum at any location within the warehouse.
7.4 Modelling uncertainties and further development
In the development and testing of the model, various model uncertainties and weaknesses were identified, many of which could be rectified through further development of the model.
Potential areas for model development are listed below:
a) Direct incorporation of offsite effects based on recent HSE research [2], including the effect of roof structure on smoke plumes, the toxicity of smoke plumes for selected materials, and the probability of missile damage from sudden failure of containers. This would allow a more definitive assessment of offsite risk to be made so that the benefit of fire protection measures could be considered on an ALARP basis.
b) Incorporation of model for fire spread by incident radiation to metal drums or gas cylinders. Assessment would need to be made of the heat input required to cause failure of full partially-full and empty containers. This could be based on testing of representative containers and a complementary assessment of pressure build-up and weakening of walls at elevated temperatures. This would allow the acceptability of storage of full or empty drums adjacent to building walls to be considered, and would aid definition of separation distances for external drum storage based on wall construction (fire resistance and ventilation openings etc.).
WSA CL3012/003 47
c) Review of the simple fire withstand assessment for compartment walls incorporated in the model. Detailed structural assessment could be undertaken for the three wall constructions chosen for missile and blast analysis to ensure (or otherwise) that the current simple assessment is adequate for the purpose of the model.
d) Review of London Fire Brigade source data for response to warehouse fire incidents. This would allow a better definition of the cumulative probability of control of fire with respect to time. Currently the model uses a curve based on generic data which does not consider the effect of different fuel types, or the effect of protection measures such as roof vents.
e) Benchmarking of model results against available fire incident information for chemical warehouses in order to identify any areas of excessive conservatism. In particular review of fire initiation frequencies derived from general warehouse incidents and consideration of their applicability to chemical warehouses.
In addition to the above, various assumptions were made in the derivation of the probability data used in the model relating to effectiveness of fire protection measures. The probabilities leading to fire spread via missile effects have been analysed in Section 6.4, where it has been demonstrated that these parameters do not significantly contribute to the overall fire damage. There would be benefit in conducting further detailed sensitivity assessment on other parameters used, in order to identify which assumptions produce the greatest uncertainty in the model output.
WSA CL3012/003 48
REFERENCES
1. Tyldesley, A., ‘Fire Precautions for Chemical Warehouses, A Challenge for Fire Engineers’, INTERFLAM’99, Edinburgh, June 1999.
2. Offsite Risk Reduction Through Structural Fire Protection of Chemical Warehouses, HSE Mainstream Research Projects Handbook, 2001/2002, HSE Books.
3. Sardqvist, S., ‘Fire Brigade Use of Water’, INTERFLAM’99, Edinburgh, June 1999.
4. Comité Européen des Assurances, ‘Classification of Materials and Goods’, Loss Prevention Council, 1996.
5. Fowler, A.H.K. and Tyldesley, A., ‘Chemical warehousing – results of a HSE survey’, IChemE Loss Prevention Bulletin 141.
6. Hymes, I. and Flynn, J.F., ‘The Probability of Fire in Warehouses and Storage Premises, AEA Technology Report, SRD/HSE R578, 1992.
7. Rahikainen, J. and Keski-Rahkonen, O., ‘Determination of Ignition Frequency of Fires in Different Premises in Finland’, Fire Engineers Journal, November 1998.
8. Hockey, S.M. and O’Donovan, C., ‘Frequency of Fire Starts in Warehouses and External Storage Facilities’, HSE Contract Research Report, WS Atkins, AM5063/001, April 1997.
9. British Standards Institute, ‘Fire Safety in Buildings – Part 1. Guide to the application of fire safety engineering principles’, DD240, 1997.
10. British Standards Institution, BS476: Part 20: 1987, ‘Fire tests on building materials and structures, Part 20. Method for determination of the fire resistance of elements of construction (general principles)’.
11. Law, M., ‘A basis for the design of fire protection of building structures’, Ordinary Meeting, Institute of Structural Engineers, February 1985.
12. Melia, J., Heywood, G. & Liew, S., ‘A look into the fire resistance of road tunnels’, Tunnel Safety International, 1994.
13. Ingberg, S.H., ‘Fire Loads’, Quarterly Journal of the National Fire Protection Association, 22, 1928.
14. A Hydrocarbon Fire Standard for Offshore Structures – An Assessment of Existing Information, FRS report to the Department of Energy, OT/R/8294, January 1983.
15. Lawson, D.I. & Simms, D.L., 'Ignition of wood by radiation', British Journal of Applied Physics, Vol 3, September, 1952
16. Rew, P.J. & Hulbert, W.G., ‘Development of Pool Fire Thermal Radiation Model’, HSE Contractor Report WSA/RSU8000/018, HSE Books, 1995.
17. Bukowski, R.W., Budnick, E.K. & Schemel, C.F., ‘Estimates of the Operational Reliability of Fire Protection Systems’, Proceedings of Third International Conference of Fire Research and Engineering, 1999.
18. North, M.A., ‘Fire Damage to Buildings – Some Statistics’, Fire Research Note 994, FRS, 1973.
WSA CL3012/003 49
19. Hall, J.R., ‘US Experience with Smoke Detectors and Other Fire Detectors: Who has them, How well do they work, When don’t they work’, Fire Analysis and Research Division, National Fire Protection Association, Quincy, MA, June 1995.
20. van Wingerden, K., 'Guidelines for evaluating the characteristics of vapour cloud explosions, flash fires and BLEVES', Centre for Chemical Process Safety (CCPS) of the American Institute of Chemical Engineers (AIChE), 1994.
21. Warrington Fire Research, ‘Probabilistic Risk Assessment Data – Delphi Exercise’, 1996.
22. Guymer, P. & Parry, G.W., ‘Use of probabilistic methods in fire hazard analysis’, IAEA-SM-305/1.
23. Offshore Reliability Data Handbook, OREDA, Hovik, Norway, 1984.
24. Hall, J.R., ‘A Fire Risk Assessment Model for Assessing Options for Flammable and Combustible Liquid Products in Storage and Retail Occupancies’, Fire Technology, 4th Quarter, 1995.
25. Matthews, M.K., Karydas, D.M. and Delichatsios, M.A., ‘A Performance-based Approach for Fire Safety Engineering: A Comprehensive Engineering Risk Analysis Methodology, a Computer Model , and a Case Study’, Fire Safety Science, Proceedings of the 5th International Symposium, 1997.
26. Dowling, J., Robinson, J. and Crouch, E., ‘Sprinklers – the real story’, Sprinkler Focus, Fire Prevention 257, March 1993.
27. Fire Safety and Engineering, Technical Papers Book 2, The Warren Centre, University of Sydney, December 1989.
28. Finucane, M. and Pinkney, D., ‘Reliability of Fire Detection and Protection Systems’, Fire Safety Engineering, Proceedings of the 2nd International Conference, BHRA, 1989.
29. Atkinson, G., Buckland, I., Jagger, S.F. & Maddison, T., ‘Mitigation of fires in agrochemical stores’, INTERFLAM’99, Edinburgh, June 1999.
30. Milovancevic, M., ‘Fire behaviour of flammable products in plastic bottles and aerosol cans’, INTERFLAM’99, Edinburgh, June 1999.
31. Mulhaupt, R., ‘Fire protection for flammable and combustible liquids in warehouses’, First International Conference on Fire Suppression Research, 1992.
32. Melinek, S.J., ‘Fire Fighting and Extent of Spread’, Fire Research Note No. 912, January 1972.
33. Not used.
34. Steciak, J. and Zaosh, R.G., ‘A Reliability Methodology Applied to Halon 1301 Extinguishing Systems in Computer Rooms’, Fire Hazard and Fire Risk Assessment, Philadelphia, ASTM STP, 1992.
35. The Fire and Explosion at BDH Ltd, Poole, Dorset – 21 June 1988, Report of an Investigation by the Health and Safety Executive, Draft (Not for Publication), September 1988.
36. Sardqvist, S. and Holmstedt, G., ‘Correlation Between Firefighting Operation and Fire Area: Analysis of Statistics’, Fire Technology, Vol. 36, No. 2, 2000.
37. Rutstein, R. and Cooke, R.A., ‘The value of fire protection in buildings’, Home Office Fire Research and Development Group, FRDG16/78, 1979.
WSA CL3012/003 50
38. Quantifying the Cost of Meeting Building Regulations Fire Safety Requirements in New Buildings, Fire Research Station, Building Research Establishment, BR 312, 1996.
39. ‘Costs and Sprinklers’, Sprinkler Focus, Fire Prevention 257, March 1993.
40. Nakano, M., Aburano, K. and Yutani, T, ‘The Effect on Fireproof Cost and Evacuation Safety bythe Installation and Reliability of Fire Protection Devices’, Fire Science and Technology, Vol. 19, No. 1, 1999.
WSA CL3012/003 51
APPENDIX A
Impact of Sudden Failure of Container on Compartment Wall
A.1 Introduction
The ability of compartment walls to resist fire is dependent on their being able to resist the loads which may be imposed on them under a fire scenario. In certain fire scenarios loads might come from the explosion of a drum filled or partially filled with liquid, or from the projection of a drum towards the wall.
The possible loads produced by the failure of a 205 litre tight head steel drum at a pressure of 3barg, and the resistance of three different wall types to the loads, have been examined in this appendix.
A.2 Loading
A.2.1 Overpressure
The maximum pressure pulse is obtained when the drum is entirely filled with gas at the bursting pressure, since in this condition the maximum energy is stored in the barrel. Baker[1]
gives the air shock pressure at the instant the drum bursts, derived from one dimensional shock tube pressure relationships. The decrease in overpressure with distance can then be calculated. The magnitude of the initial shock wave following the drum bursting is influenced by the type of gas within the drum and the internal and external gas temperatures.
Ove
rpre
ssur
e (b
ar)
3.5
3
2.5
2
1.5
1
0.5
0 0 1 2 3 4 5
Distance (m)
Figure A.1 Variation of blast overpressure with distance
The overpressure decreases rapidly with distance, falling to 10% of its initial value at 2.5m. This means that the whole wall, measuring 7.5m x 9m, cannot be subjected to the full overpressure. The shock is not normal to the wall except over a limited area where the wall is closest to the drum. Where the shock is reflected normally from the wall, the pressure is increased substantially; Figure A1 gives the overpressure where this occurs. As one moves to the extremities of the wall, the overpressure will be significantly reduced, both due to the increased distance and the increasing angle of the shock to the wall.
WSA CL3012/003 52
The maximum overpressure of 2.86bar has been applied to the walls over a circle 0.3m in diameter, equivalent to the size of the end of the drum.
Because of the size of the building, reflected pressure waves will not contribute significantly to the overpressure due to the attenuation of the pressure pulse with distance.
A.2.2 Projectile velocity
Two options have been considered to propel the drum. If the drum fails when entirely filled with gas, the resulting impulse propels the parts of the drum in opposite directions. It has been assumed that the drum fails at the joint around the end plate, resulting in two parts, the larger of which has a mass of 15.3kg. Formulae given by two sources have then been used to calculate the fragment velocity. The larger of the two velocities obtained (63m/s, as predicted by Baker) has been used in the wall capacity calculations.
Alternatively the drum might be lying horizontally partially filled with liquid, with gas in the space above. A limited failure of the seam or plug below the level of the liquid could then result in a jet of liquid which would be capable of propelling the barrel and its contents. The velocity of the drum was calculated both including the possibility of flash boiling and with adiabatic expansion of the gas above the liquid. The consequences of the resulting jet impinging on the wall was also considered, but the load is significantly less than that for the drum impacting the wall.
1000 60
40
.v vM 500n n n
20
0 00 2 4 6 0 2 4 6 S S n n
Figure A.2 Drum momentum and velocity against distance – flash boiling
Although the mass of the drum and liquid is greater than that for the gas filled drum, the velocity is lower, resulting in a smaller total momentum. The load resulting from the gas filled barrel is therefore greater, and has been used in the calculation of the wall integrity.
To calculate the force on the wall due to the impact of the barrel a relationship between the velocity of the remaining, uncrushed barrel and the force has been used. The time averaged force for 90% of the momentum transfer has been calculated and used in subsequent analyses. The force has been derived iteratively based on the strength and mass distribution of the drum fragment. The maximum load applied to the wall due to the impact is 63kN.
A.3 Wall Integrity
The three wall types considered have been checked against the overpressure loading and penetration or cracking due to the impact of the drum fragment. The walls measure 9m wide and 7.5 m high, restrained by girders at their sides.
WSA CL3012/003 53
A.3.1 Concrete wall
The concrete wall is 200mm thick, constructed from dense aggregate with 0.4% steel reinforcement equally distibuted on both sides. The wall is assumed to be built in around its periphery.
The maximum capacity of the wall under a point load is 4.2MN. This gives a reserve factor against collapse of 67 for the drum impact and 52 for the shock wave. The concrete wall has also been analysed for cracking. The maximum load the wall can take without cracking is 930kN, giving a reserve factor of 14.7 for the drum impact and 11.5 for the shock loading.
In addition, checks have also been carried out on the ability of the wall to resist scabbing and punching. The capacity of the wall in all cases is well in excess of the drum impact and shock forces.
A.3.2 Lightweight blockwork wall
The blockwork wall considered is 215mm thick, constructed from aerated concrete blocks with a density of 620kg/m3 and a compressive strength of 4MPa. The wall is restrained around the periphery at 1m centres.
It has been assumed that the wall has no compression on it other than the weight of the wall itself. Where the wall is acting as a partition rather than a structural wall this is likely to be the case. The strength of the mortar has been taken from the Structural Masonry Designers’ Manual[2] as that typical for concrete block walls.
The maximum capacity of the blockwork wall under a point load is 26kN. This is less than the loading from the shock load and from the drum impact. If the drum hits the wall at an angle of less than 22 degrees, the blockwork wall will be able to resist the impact loads.
Harris[3] indicates that failure of the wall will occur at pressures above 70mbar for a wall of these dimensions under uniform loading. Because of the size of the wall, the pressure pulse is not uniform over the whole wall but is concentrated in the centre. It is therefore likely that the wall would remain intact at a distance of 5m from the blast.
Local failure of the wall due to blocks being knocked out will also occur if the drum impacts the wall over the area of one or two blocks, since the shear strength of the mortar is limited.
A.3.3 Plasterboard partition
The plasterboard partition considered is constructed using cold rolled ‘jumbo’ C studs (35mm x 146mm) of 0.5mm thick steel positioned at 600mm centres. Two layers of 12.5mm thick plasterboard are applied to each face, screwed to the studs at 300mm centres.
The suggested failure pressure given by Harris is 40 to 50 mbar for a double plasterboard partition of this construction. The wall is therefore unable to withstand the shock due to the drum failure even at a considerable distance from the blast. The panels nearest to the failed drum would see the maximum blast loading, possibly leading to a local failure. The supporting C channels are also unable to withstand significant load on the wall, which would lead to a global failure of the partition.
The ability of the C channel sections to absorb the energy from the impact of the barrel was also considered. It was found that the channels are unable to absorb the required energy without gross deformation, which would therefore result in failure.
WSA CL3012/003 54
REFERENCES
1. Explosion hazards and evaluation, W.E. Baker et al, Elsevier scientific publishing, 1983.
2. Structural masonry designers manual, W.G. Curtin et al, BSP professional books, Second edition 1987.
3. The investigation and control of gas explosions in buildings and heating plant, R.J. Harris, British Gas.
WSA CL3012/003 55
Printed and published by the Health and Safety ExecutiveC30 1/98
Printed and published by the Health and Safety Executive C0.6 0 9/03