Page 1
Abrasion resistance of aggregates in asphalt
December 2010
FG Bartley and RJ Peploe
Bartley Consultants Ltd, Level 2, 130 Khyber Pass Road, Auckland
PM Black
Geology Department, University of Auckland, Level 1, Building 301, 23 Symonds
Street, Auckland
NZ Transport Agency research report 433
Page 2
ISBN 978-0-478-37150-5 (print)
ISBN 978-0-478-37149-9 (electronic)
ISSN 1173-3756
ISSN 1173-3764
New Zealand Transport Agency
Private Bag 6995, Wellington 6141, New Zealand
Telephone 64 4 894 5400; facsimile 64 4 894 6100
[email protected]
www.nzta.govt.nz
Bartley, FG1, RJ Peploe
1 and PM Black
2 (2010) Abrasion resistance of aggregates in asphalt. NZ Transport
Agency research report 433. 70pp.
1 Bartley Consultants Ltd
2 University of Auckland
This publication is copyright NZ Transport Agency 2010. Material in it may be reproduced for personal or
in-house use without formal permission or charge, provide suitable acknowledgement is made to this
publication and the NZ Transport Agency as the source. Requests and enquiries about the reproduction of
material in this publication for any other purpose should be made to the Research Programme Manager,
Programmes, Funding and Assessment, National Office, NZ Transport Agency, Private Bag 6995, Wellington
6141.
Keywords: abrasion resistance, aggregate, compaction, durability, electric arc furnace slag, greywacke,
New Zealand, petrology, porous asphalt, PSV, specified criteria, roads.
Page 3
An important note for the reader
The NZ Transport Agency is a Crown entity established under the Land Transport Management Act 2003. The
objective of the Agency is to undertake its functions in a way that contributes to an affordable, integrated,
safe, responsive and sustainable land transport system. Each year, the NZ Transport Agency funds innovative
and relevant research that contributes to this objective.
The views expressed in research reports are the outcomes of the independent research, and should not be
regarded as being the opinion or responsibility of the NZ Transport Agency. The material contained in the
reports should not be construed in any way as policy adopted by the NZ Transport Agency or indeed any
agency of the NZ Government. The reports may, however, be used by NZ Government agencies as a reference
in the development of policy.
While research reports are believed to be correct at the time of their preparation, the NZ Transport Agency
and agents involved in their preparation and publication do not accept any liability for use of the research.
People using the research, whether directly or indirectly, should apply and rely on their own skill and
judgement. They should not rely on the contents of research reports in isolation from other sources of advice
and information. If necessary, they should seek appropriate legal or other expert advice.
Page 4
Acknowledgements
This project would not have been possible without the generous assistance willingly given by the following:
• Mr Robert Patience Group Technical Manager Higgins Group Holdings Ltd: Robert provided the
initial impetus to get the project started, gave helpful suggestions and guidance throughout the project,
and facilitated the construction of the test sections.
• Mr Malcolm Chiles, Technical Engineer, Higgins Group Holdings Ltd: Malcolm competently coordinated
the construction and testing of the test sections at Higgins yards in Auckland and Taupo. He also
processed the results of all the test work and carried out a review of the draft report
• Higgins Group: Higgins Contractors generously provided the space, the plant, the materials and the
labour to construct the test sections, and to sample and test the stone mastic asphalts all at a minor cost
to the project.
• Fulton Hogan Ltd, Waikato Laboratory: Fulton Hogan carried out the micro-deval tests on samples of
the aggregate at no cost to the project.
• Mr Steven McCone, Bitumen and Pavements Ltd: Steven carried out a peer review of the draft report and
provided useful guidance.
• Mr WL Cornwell, engineering geologist (retired): Sam Cornwell has been a friend and a mentor in
pavement materials for many years, for which we are deeply grateful. He also carried out a review of the
project report and suggested a number of improvements.
Page 6
5
Contents
Executive summary ............................................................................................................................................... 7
Abstract ............................................................................................................................................................ 10
1 Purpose and description of the proposed research .............................................................................. 11
1.1 Purpose ......................................................................................................................... 11
1.2 Original proposal ........................................................................................................... 11
1.3 Modified proposal ......................................................................................................... 12
1.4 Benefits of the project ................................................................................................... 12
1.5 Terminology .................................................................................................................. 13
2 Literature review .................................................................................................................................................. 14
2.1 Introduction .................................................................................................................. 14
2.2 Skid resistance of chipseals ........................................................................................... 14
2.3 Skid resistance of asphalt aggregates ............................................................................ 15
2.4 Durability of OGPA ........................................................................................................ 16
2.5 Tests for aggregate durability ........................................................................................ 17
2.6 Geological aspects ......................................................................................................... 19
2.7 Mix design .................................................................................................................... 20
2.8 Conclusions .................................................................................................................. 20
3 Selection of aggregates ..................................................................................................................................... 22
3.1 Available sources ........................................................................................................... 22
3.2 Geological characteristics .............................................................................................. 24
3.2.1 Introduction ........................................................................................................ 24
3.2.2 Significance of geological characteristics .............................................................. 24
3.2.3 Petrology of the samples ..................................................................................... 24
3.2.4 Comments ........................................................................................................... 26
3.2.5 Characteristics affecting skid resistance ............................................................... 27
4 Laboratory evaluation of engineering characteristics .......................................................................... 31
4.1 Aggregate source properties .......................................................................................... 31
4.2 Servopac gyratory compactor tests ................................................................................ 31
Page 7
6
5 Test sections ......................................................................................................................................................... 35
5.1 Introduction .................................................................................................................. 35
5.2 Location ........................................................................................................................ 35
5.2.1 Auckland ............................................................................................................. 35
5.2.2 Taupo ................................................................................................................. 36
5.3 Production properties .................................................................................................... 36
5.3.1 Test procedures .................................................................................................. 36
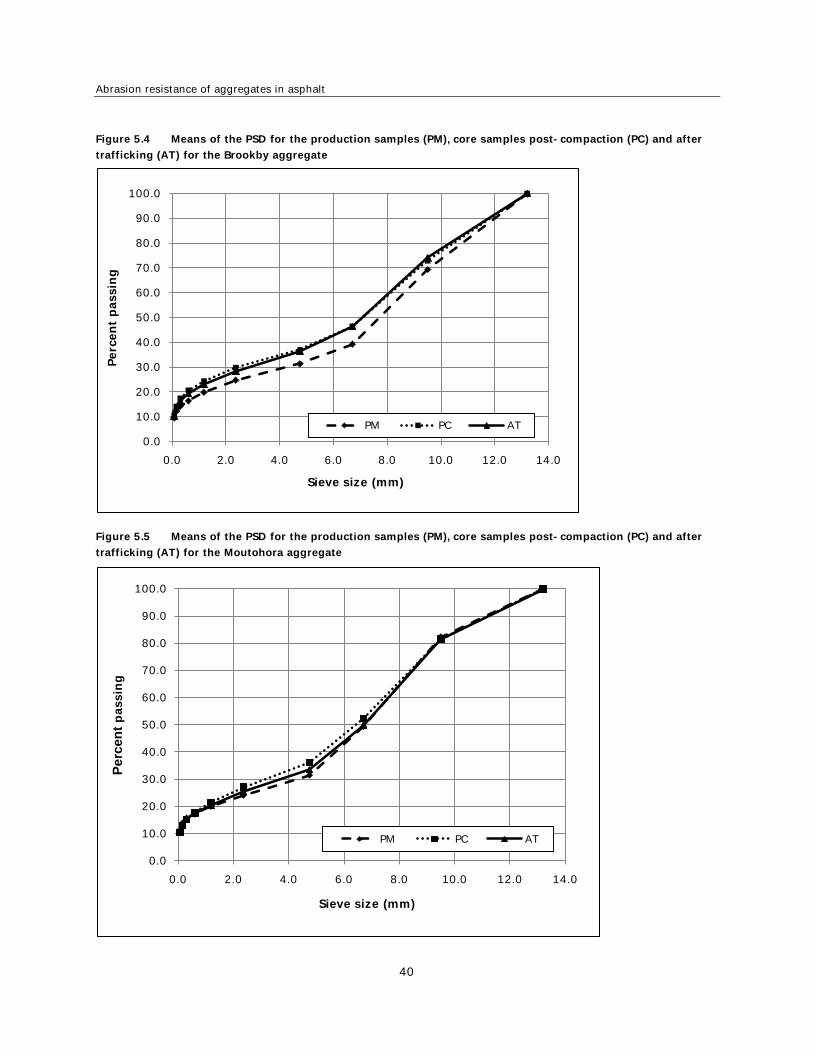
5.3.2 Test results ......................................................................................................... 37
5.3.3 Ranking and predictability ................................................................................... 46
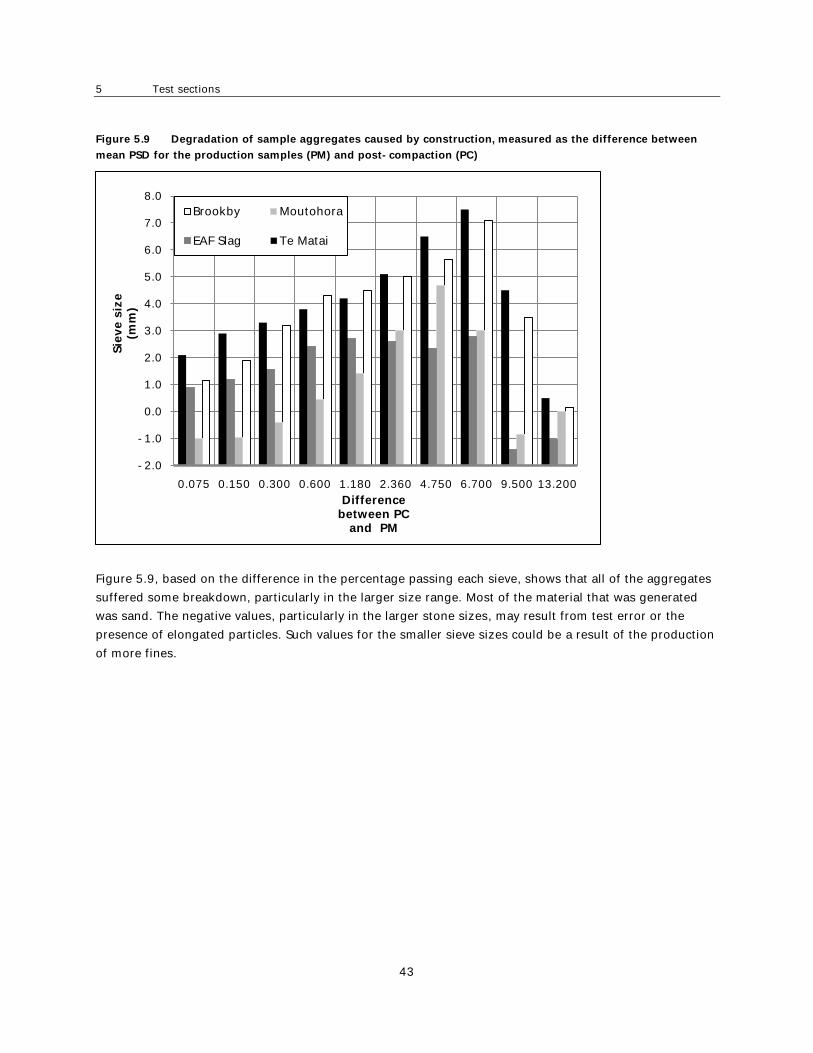
5.4 Degradation .................................................................................................................. 47
5.4.1 Results ................................................................................................................ 47
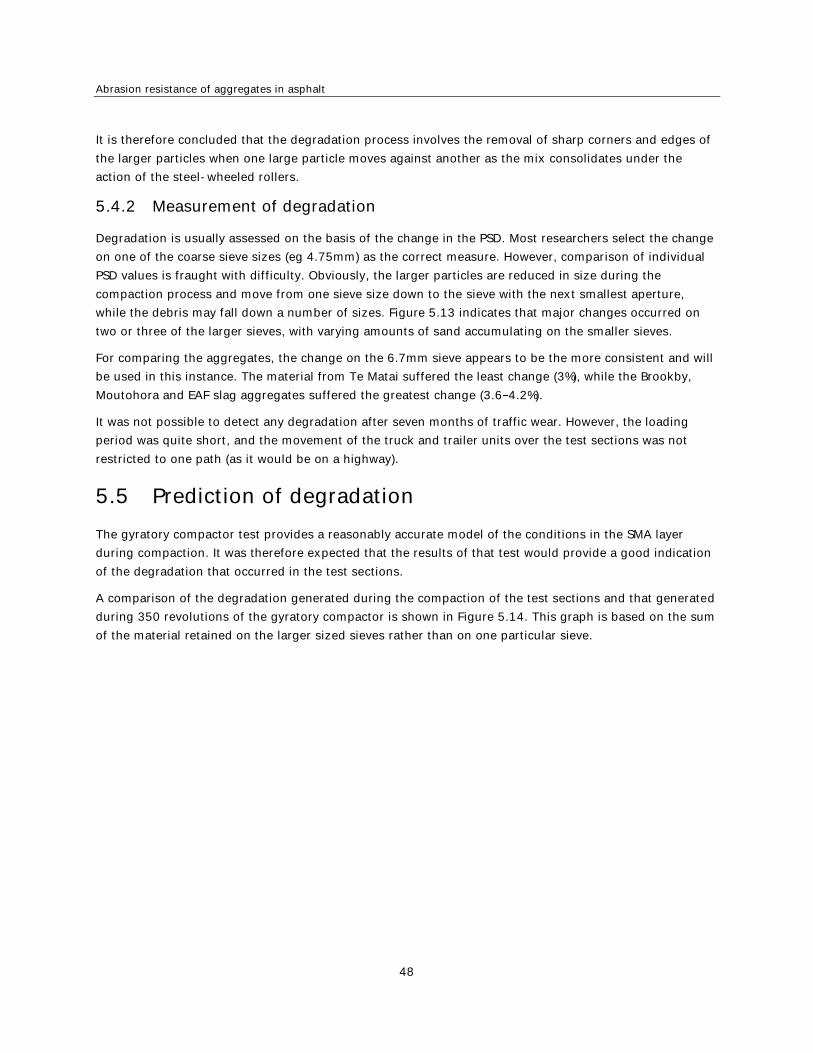
5.4.2 Measurement of degradation ............................................................................... 48
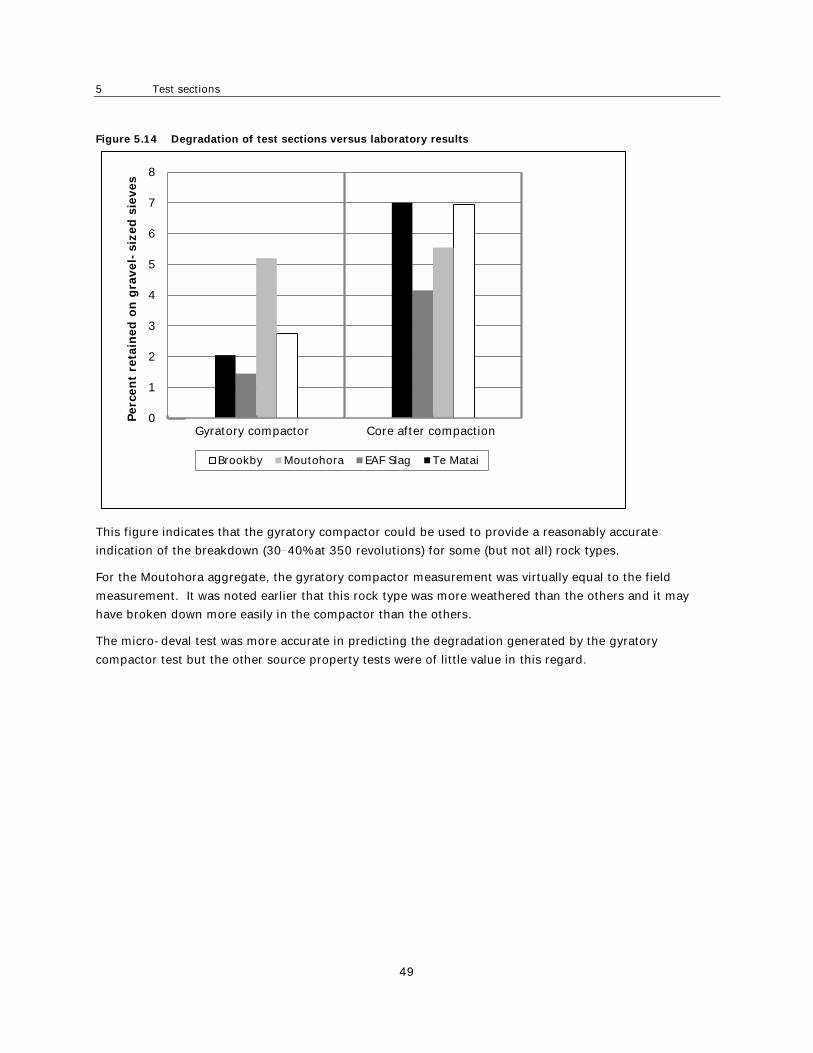
5.5 Prediction of degradation .............................................................................................. 48
6 Conclusions ............................................................................................................................................................ 50
6.1 Introduction .................................................................................................................. 50
6.2 Geology......................................................................................................................... 50
6.3 Source properties .......................................................................................................... 50
6.4 The gyratory compaction test ........................................................................................ 50
6.5 Test sections ................................................................................................................. 51
6.6 Air voids and surface texture ......................................................................................... 51
6.7 Degradation .................................................................................................................. 51
6.8 Degradation from traffic ................................................................................................ 51
7 Recommendations ............................................................................................................................................... 52
8 References .............................................................................................................................................................. 53
Appendices ......................................................................................................................................................................... 57
Page 8
7
Executive summary
The objective of this project was to investigate the durability and mechanical integrity of aggregate with a
high (>60) polished stone value (PSV) used in hot mix asphalt (HMA), particularly chips or coarse
aggregates in stone-on-stone mixes such as stone mastic asphalts (SMA) and open graded porous
asphalts (OGPA). The research was carried out in 2009 2010.
The structure formed by the aggregate particles and the bituminous binder carries and distributes the
applied wheel load to the underlying pavement layers. A major difference between dense graded asphalt
and the more open graded or stone-on-stone mixes is the way that the load is distributed through the
layer. In dense mixes, the coarse aggregate is fully supported by the smaller sized stone and the bitumen.
In more open graded mixes, the load is transferred by stone-on-stone contact. As a consequence, the
stability and long-term performance of the layer depends on the ability of the aggregate to resist the high
point stresses that are generated during construction and later under traffic.
Flushing within the surfacing layer because of degradation of the aggregate or other reasons is not
uncommon. For example, this project resulted from problems that were originally observed and
investigated during the construction of the Transit New Zealand Grafton Gully Project in Auckland where,
after a period of trafficking, it was observed that the macrotexture was reduced by flushing in the SMA
surfacing. This was more apparent where a high PSV aggregate was used. A subsequent investigation
indicated that some degradation of the aggregate had occurred, most probably during construction.
Therefore, the identification of the factors that influence degradation of the aggregates used in SMA and
similar mixes will be of interest to all suppliers of surfacing aggregates, asphalt producers, pavement
designers and asset managers. It is expected that this research will provide a better understanding of the
aggregate properties that are required to support high friction-resistant surfacing. It should ultimately
result in the incorporation of appropriate selection procedures in NZ Transport Agency specifications such
as P/11 and the new M/10, which is soon to replace NAS 2004 plus the New Zealand supplement.
Currently, -on-stone mix types. By using an appropriate
durability test, which is included in these specifications, the pavement designer and asset owner will be
able to determine the appropriateness of a particular aggregate source for use in asphalt at any particular
location.
The properties of the aggregate are basically determined by the inherent characteristics of the rock being
processed. The physical strength of the rock has a profound influence on the aggregate produced,
particularly the particle size distribution, the quantity and nature of the fines and the shape of the
particles.
The structure of this research project was as follows:
1 literature survey
2 selection of sites for test sections
3 selection of aggregates to cover a range of PSVs
4 testing to establish source properties of the aggregates
5 geological examination of samples of the aggregate used in project
6 construction of test sections in Auckland (three) and Taupo (one)
Page 9
Abrasion resistance of aggregates in asphalt
8
7 sampling and testing to establish baseline data
8 trafficking the test sections
9 sampling, primarily to establish change in the particle size distribution.
At an early stage in the project, it was decided to construct test sections within the plant yards at
Auckland and Taupo operated by Higgins Contractors Ltd. These areas were relatively heavily loaded and
were within a controlled environment, as well as being adjacent to the asphalt manufacturing plants.
However, because of time constraints, it was only possible to traffic the test area in Auckland for seven
months. In Taupo, it was limited to three months.
The aggregates used in the test sections were drawn from four different sources. They were:
• Brookby Quarry located south of Auckland City. It is a Waipapa greywacke rock with a PSV of 56.
• Moutohora Quarry in Poverty Bay. It is an East North Island greywacke rock with a PSV of 65.
• electric arc furnace (EAF) slag from Pacific Steel in Otahuhu, Auckland. It has a PSV of 65.
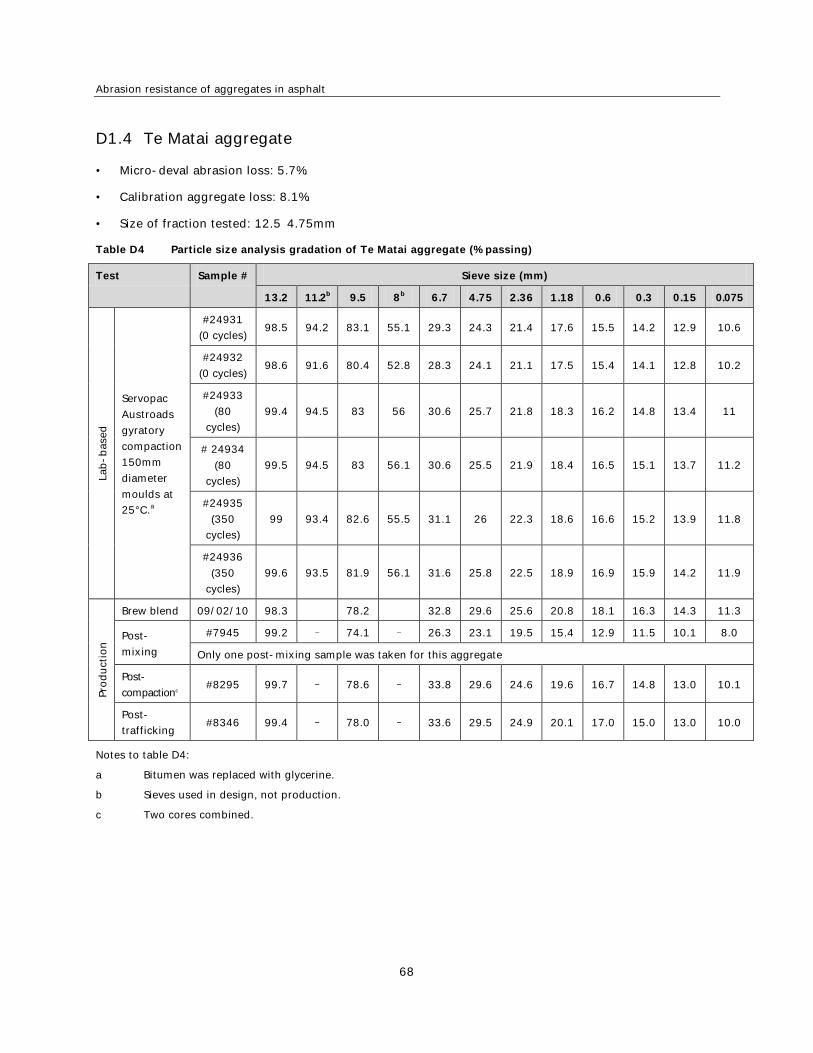
• Te Matai Pit in Palmerston North. This is a gravel with a PSV between 58 and 59 derived from the
Torlesse greywacke of the central North Island.
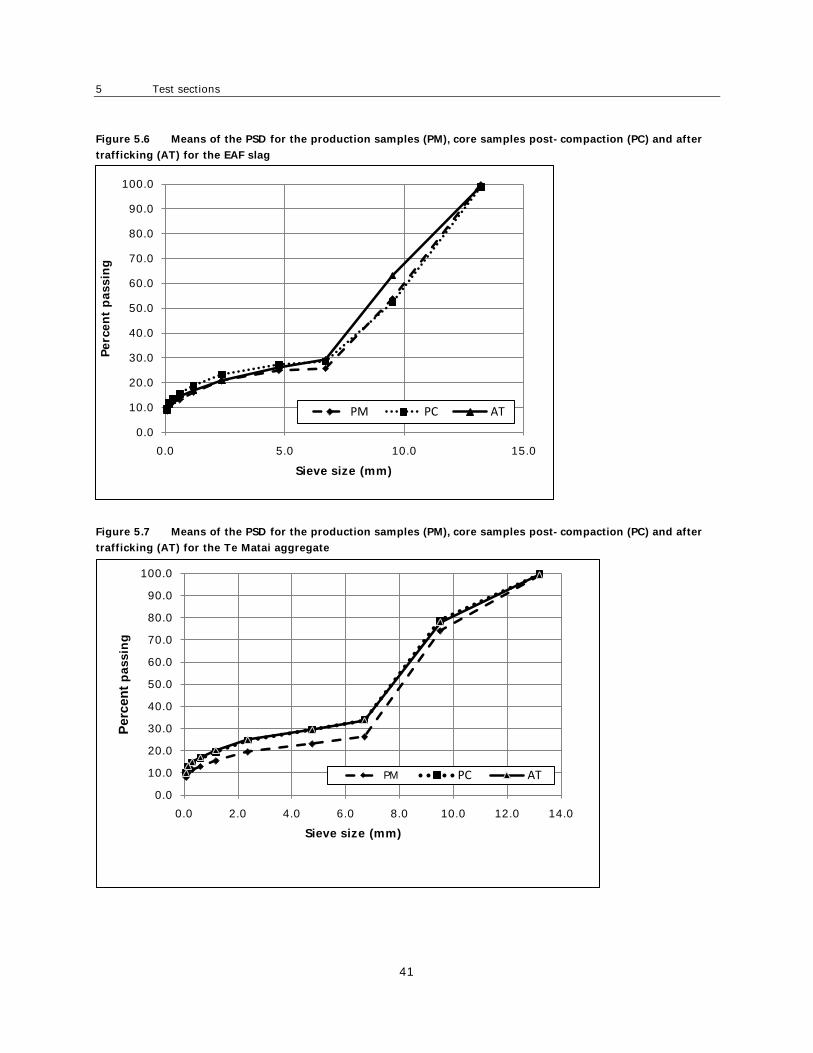
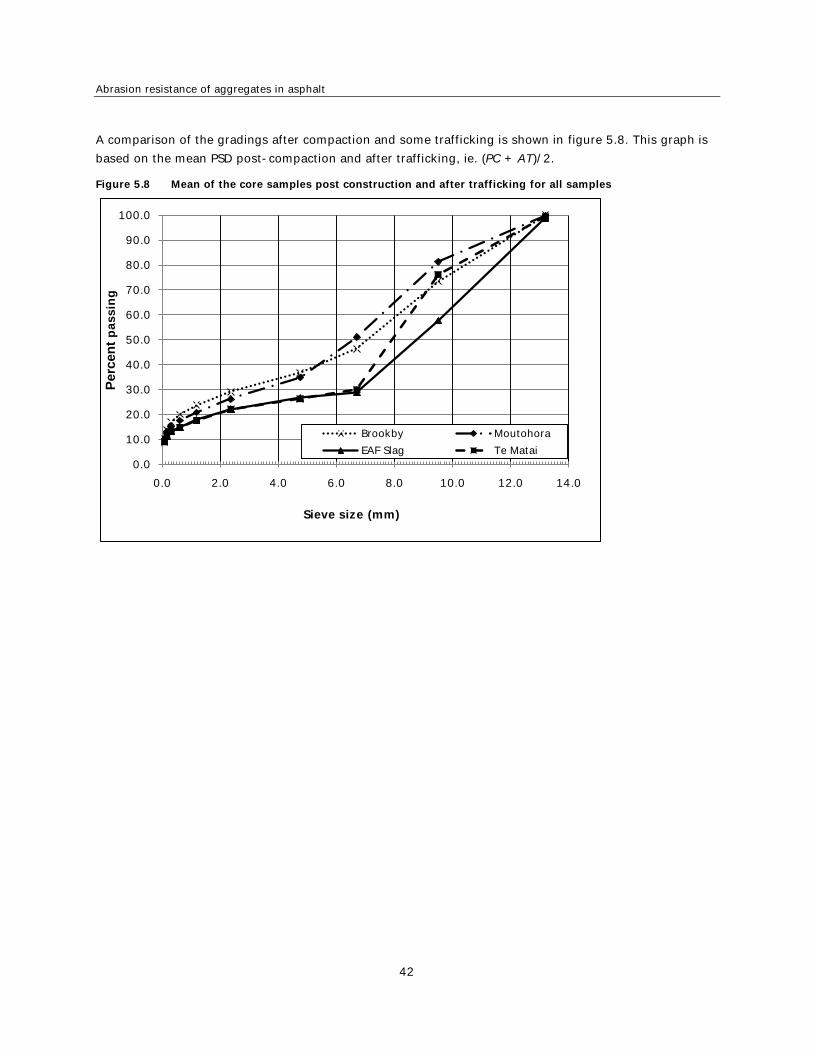
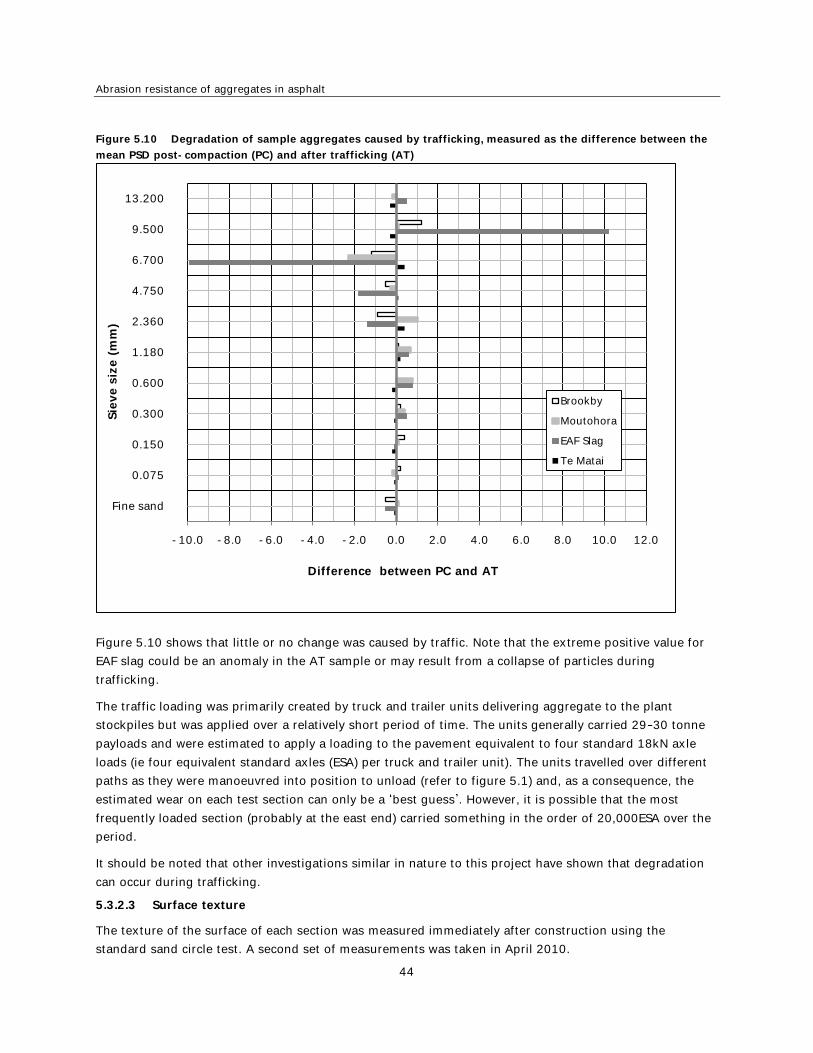
Comparison of the particle size distribution (PSD) of each aggregate after construction with that of
samples taken prior to laying showed that significant degradation took place during laying and
compaction. A similar comparison of the PSD after construction and at the end of seven months
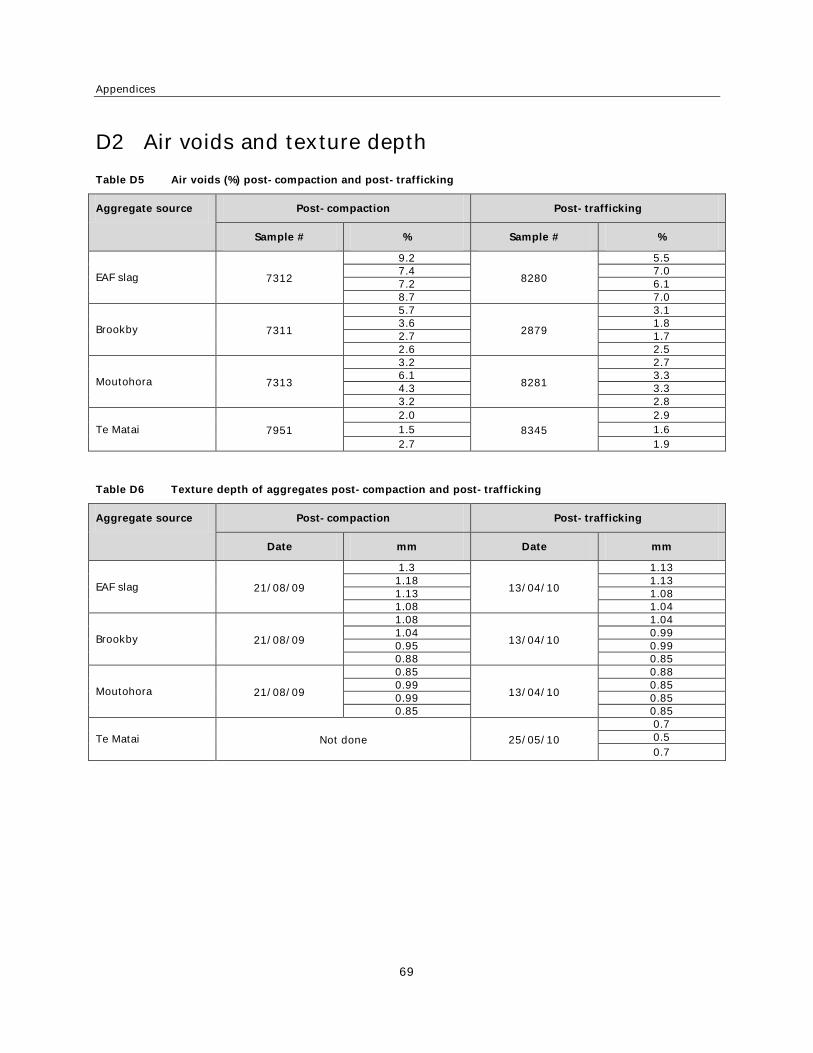
trafficking showed little degradation, if any. However, a slight decrease in air voids content was noted,
particularly in the most heavily loaded area. A similar decrease in texture depth was also recorded.
Examination of the results of the source property tests showed that none of the tests could be used to
predict the degradation that occurred in the test sections. The Los Angeles and micro-deval abrasion tests
were probably the most useful.
At a late stage in the project, it was decided to evaluate the suitability of the gyratory compactor test as a
prediction tool. The compactor gave a reasonably accurate measure of the degradation that occurred in
the Moutohora aggregate (the most weathered of the greywacke rock types). However, the results for the
other three aggregates were only 30 40% of the degradation measured in the test sections. It was noted
that the load used in the test was 40% of that specified in the American Superpave specification, while the
angle of gyration was 2.4 times larger. This suggests that each country has designed the test protocol to
suit the type of aggregate most commonly used. New Zealand should adopt a similar approach.
The micro-deval abrasion test ranked the aggregates in a similar sequence to that achieved using the
gyratory compactor test.
The following conclusions have been drawn:
• SMA mixes can be expected to degrade.
• Degradation occurs as the sharp point of one coarse particle is forced against another coarse particle.
The product is predominantly fine sand and silt-sized particles.
Page 10
9
• A geological evaluation provides a useful understanding of the properties of each aggregate and, in
particular, the difficulties involved in selection of a high PSV aggregate that will withstand the high
stress levels that occur within stone-on-stone mixes.
• None of the source property tests provided a useful ranking of the durability of the aggregates used in
the test sections. The micro-deval abrasion test gave a reasonably accurate prediction of the
breakdown that occurred in the gyratory compactor test but not of that measured in the test sections.
• Significant degradation occurred in all the aggregates used in the test sections as a result of the
stresses imposed during laying and compaction.
• The air voids and surface texture values decreased as a result of trafficking but no measurable change
was noted in the particle size distribution.
• A good set of baseline data has been established for all the test sections and it is recommended that
further samples be obtained in about two years time to ascertain the effects of trafficking.
Page 11
Abrasion resistance of aggregates in asphalt
10
Abstract
The objective of this project was to investigate the durability and mechanical integrity of aggregate with a
high polished stone value (>60) used in hot mix asphalt, particularly chips or coarse aggregates in stone-
on-stone mixes such as stone mastic asphalts and open graded porous asphalts. The research was carried
out in Auckland, New Zealand, in 2009 2010.
Test sections were constructed within yards at Auckland and Taupo. The aggregates
used were drawn from four different sources. Significant degradation took place during laying and
compaction, but trafficking produced little further breakdown, if any. However, a slight decrease in air
voids and texture depth was apparent.
Most of the source property tests could not predict the degradation that occurred in the test sections. The
Los Angeles and micro-deval abrasion tests were probably the most useful. The gyratory compactor test
was also evaluated as a prediction tool without a great deal of success. The micro-deval abrasion test
ranked the aggregates in a similar sequence to that achieved using the gyratory compactor test.
Page 12
1 Purpose and description of the proposed research
11
1 Purpose and description of the proposed research
1.1 Purpose
The objective of this project was to investigate the durability and mechanical integrity of high (>60)
polished stone value (PSV) aggregates for hot mix asphalt (HMA), particularly chips or coarse aggregates in
stone-on-stone mixes such as stone mastic asphalts (SMA) and open graded porous asphalts (OGPA).
The standard specifications published by the NZ Transport Agency (NZTA) such as M/4 (Transit
New Zealand (TNZ) 2004a), M/6 (TNZ 2004b), M/10 (TNZ 2005), P/11 (TNZ 2007a) and BCA 9808
all require that the aggregate shall be hard, durable, sound
material crushed from natural gravel or quarried rock. However, some weathered aggregates in
New Zealand meet the two standard source property tests of both crushing resistance and weathering, yet
still degrade and break down, certainly under steel wheel roller compaction during construction.
Experience also suggests that further breakdown occurs from trafficking, particularly on sites with high
traffic-induced surface stresses associated with braking and turning traffic.
The structure formed by the aggregate particles and the bituminous binder carries and distributes the
applied wheel load to the underlying pavement layers. A major difference between dense graded asphalt
(eg HMA) and the stone-on-stone mixes is the way that the load is distributed through the layer. In dense
mixes, the coarse aggregate is fully supported by the smaller sized stones and the bitumen. In SMA and
OGPA, the load is transferred by stone-on-stone contact, and the stability and long-term performance of
the layer depends on the ability of the aggregate to resist the high point stresses that are generated
during construction and later under traffic.
The current source property tests and acceptance criteria in New Zealand need to be reviewed to assess
whether they are appropriate for durable stone-on-stone mixes. Additional tests that will be evaluated
include water absorption, Los Angeles (LA) abrasion (Standards Australia 1995a), wet/dry strength
(Standards Australia 1995b), aggregate abrasion value, micro-deval (ASTM International 2003), gyratory
compaction and soundness tests.
1.2 Original proposal
The issue that needed to be addressed was whether the high PSV required for skid resistance was being
achieved at the expense of the durability of stone-on-stone mixes. Aggregate source property tests and
acceptance criteria need to be reviewed to ensure that appropriate specifications are being applied.
It was originally intended that up to three sites would be identified where durability issues have occurred
in SMA or OGPA mixes. Samples of material from these sites were to be removed to provide aggregate for
testing. A suite of aggregate source tests, namely crushing resistance, weathering quality index, LA
abrasion, wet/dry crushing strength and PSV (if the chip source is not known), and a soundness test were
to be completed on these aggregates to determine which tests are the most appropriate for identifying the
durability issue. In addition to this testing, it was proposed that up to four aggregates with high PSVs
Page 13
Abrasion resistance of aggregates in asphalt
12
would be sampled and tested directly from the stockpile. The tests were to be repeated on a hard
aggregate with a lesser PSV with good durability, for comparison.
However, in the preliminary stages of the research, it became apparent that sampling materials from
existing pavements was fraught with problems, including:
• locating sites with specific durability issues
• obtaining the controlling authorities permission to sample the pavements
• recovering representative samples from surface layers from heavily trafficked pavements
• determining the initial condition of the constituent materials prior to laying.
1.3 Modified proposal
As a result of discussions with Mr Robert Patience (peer reviewer and expert advisor), it was decided to
modify the project as follows:
• Aggregates would be selected to cover a range of PSVs.
• Test sections would be laid in a suitable location.
• Samples would be taken immediately after construction and after a period of trafficking.
The benefits of this approach were:
• It did not require approval from a road controlling authority, or the consequent restrictions on access,
sampling and the like.
• The characteristics of the materials prior to construction would be known.
• Construction could be easily organised and controlled.
• The characteristics of the aggregate immediately after construction could be determined.
• The applied traffic loading could be estimated with a reasonable degree of certainty.
• The characteristics of the materials after trafficking could be measured.
1.4 Benefits of the project
Flushing within the surfacing layer as a result of degradation of the aggregate or for other reasons does
occur. For example, this project resulted from problems that were originally observed and investigated
during the construction of the TNZ Grafton Gully Project in Auckland (Newby 2005). At Grafton Gully,
sections of the pavement were surfaced with a 40mm thick layer of SMA 14. Generally, aggregate from the
Brookby Quarry was used. However, a high PSV aggregate, which had been especially imported from
Moutohora Quarry in Poverty Bay, was used in areas where high surface shear loads were likely to be
generated by the traffic. It was later noticed that the macrotexture was reduced by flushing in the
surfacing. This was more apparent where the Moutohora aggregate was used. The investigation indicated
that some degradation of the aggregate had occurred, most probably during construction.
Page 14
1 Purpose and description of the proposed research
13
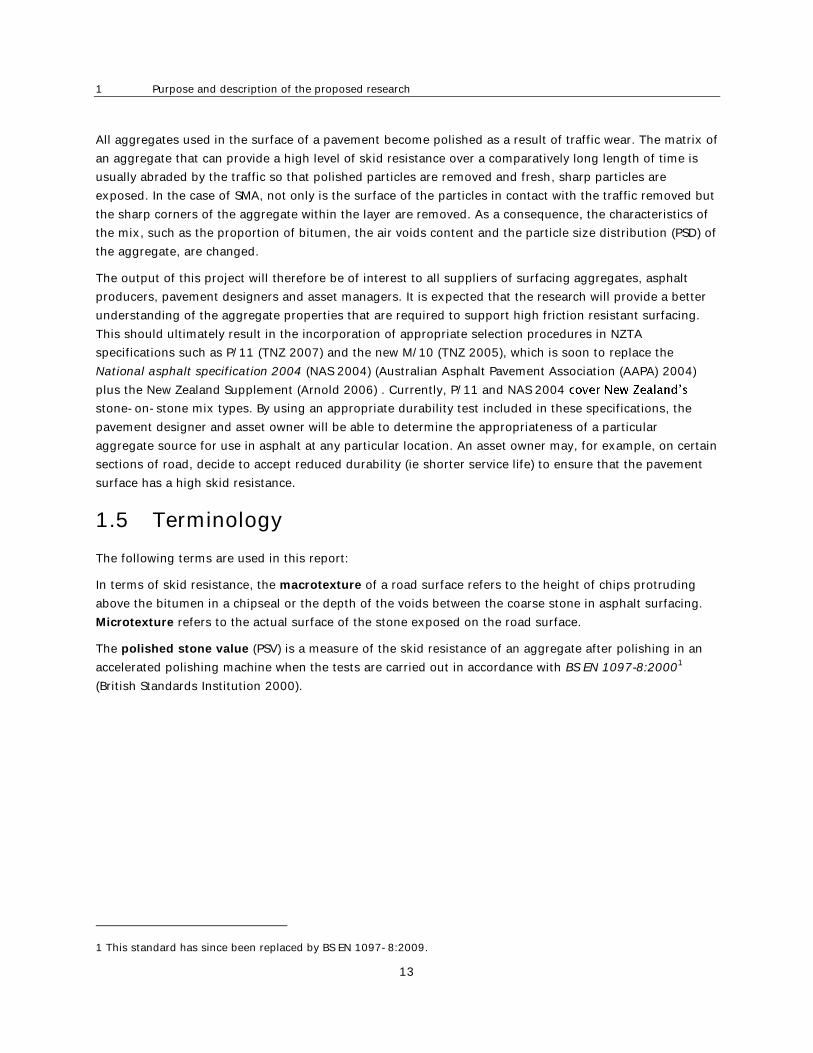
All aggregates used in the surface of a pavement become polished as a result of traffic wear. The matrix of
an aggregate that can provide a high level of skid resistance over a comparatively long length of time is
usually abraded by the traffic so that polished particles are removed and fresh, sharp particles are
exposed. In the case of SMA, not only is the surface of the particles in contact with the traffic removed but
the sharp corners of the aggregate within the layer are removed. As a consequence, the characteristics of
the mix, such as the proportion of bitumen, the air voids content and the particle size distribution (PSD) of
the aggregate, are changed.
The output of this project will therefore be of interest to all suppliers of surfacing aggregates, asphalt
producers, pavement designers and asset managers. It is expected that the research will provide a better
understanding of the aggregate properties that are required to support high friction resistant surfacing.
This should ultimately result in the incorporation of appropriate selection procedures in NZTA
specifications such as P/11 (TNZ 2007) and the new M/10 (TNZ 2005), which is soon to replace the
National asphalt specification 2004 (NAS 2004) (Australian Asphalt Pavement Association (AAPA) 2004)
plus the New Zealand Supplement (Arnold 2006) . Currently, P/11 and NAS 2004
stone-on-stone mix types. By using an appropriate durability test included in these specifications, the
pavement designer and asset owner will be able to determine the appropriateness of a particular
aggregate source for use in asphalt at any particular location. An asset owner may, for example, on certain
sections of road, decide to accept reduced durability (ie shorter service life) to ensure that the pavement
surface has a high skid resistance.
1.5 Terminology
The following terms are used in this report:
In terms of skid resistance, the macrotexture of a road surface refers to the height of chips protruding
above the bitumen in a chipseal or the depth of the voids between the coarse stone in asphalt surfacing.
Microtexture refers to the actual surface of the stone exposed on the road surface.
The polished stone value (PSV) is a measure of the skid resistance of an aggregate after polishing in an
accelerated polishing machine when the tests are carried out in accordance with BS EN 1097-8:20001
(British Standards Institution 2000).
1 This standard has since been replaced by BS EN 1097-8:2009.
Page 15
Abrasion resistance of aggregates in asphalt
14
2 Literature review
2.1 Introduction
The skid resistance of asphalt, and of SMA and OGPA, in particular, is of significant interest to the
New Zealand and Australian roading industry. Good friction characteristics are a product of the
macrotexture of the mix and the microtexture of the stone. It is believed that stone that wears under the
action of traffic is required to preserve a skid-resistant surface. Some authorities transport particular
aggregates over long distances to use them on sections of highway where a skid-resistant surface is
required. If the stone used is easily abraded, it may tend to break down during mixing, laying and
compaction, and during trafficking. The literature review, which involved a study of more than 30 technical
papers, sought to find the results of any research being carried out overseas into the topics of skid
resistance, aggregate durability, test procedures and mix design. The topics described in the papers that
were reasonably relevant to the project generally fell into one or more of the following areas:
• skid resistance of chipseals
• skid resistance of asphalt surfacing
• durability of OGPA
• tests for aggregate durability
• management of skid resistance
• the significance of New Zealand geology
• asphalt mix design.
2.2 Skid resistance of chipseals
In 1995, TNZ adopted a new policy on skid resistance that achieved a substantial reduction in the number
of wet road loss of control accidents. Owen and Donbavand (2005) reported a 30% decrease in three years
between 1995 (immediately prior to the introduction of the policy) and 1998. This was achieved by
improvements in the management and selection of surfacing types, along with measurement and the
identification of problem sites. Each problem site was treated with a chipseal with a predetermined level of
skid resistance. Over a similar period, developments within the quarrying industry resulted in the
production of chip with the required shape as well as a high PSV.
Towler and Stevenson (2000) describe the development of a pilot performance based specification for a
high PSV sealing chip (a high PSV chip is one that does not polish readily). They believed that if some of
the source requirements specified in the M/6 specification (TNZ 2004b) were relaxed, the amount of high
PSV chips would be substantially increased. The reason that some high PSV chips do not meet M/6 was
considered to result from the inverse relationship between PSV and chip strength and/or durability. The
pilot specification differs from M/6 in several ways, including:
• Crushing resistance geared to the traffic volume. A value of 150kN is required for low traffic volumes,
rising to 230kN for volumes greater than 10,000 annual average daily traffic.
Page 16
2 Literature review
15
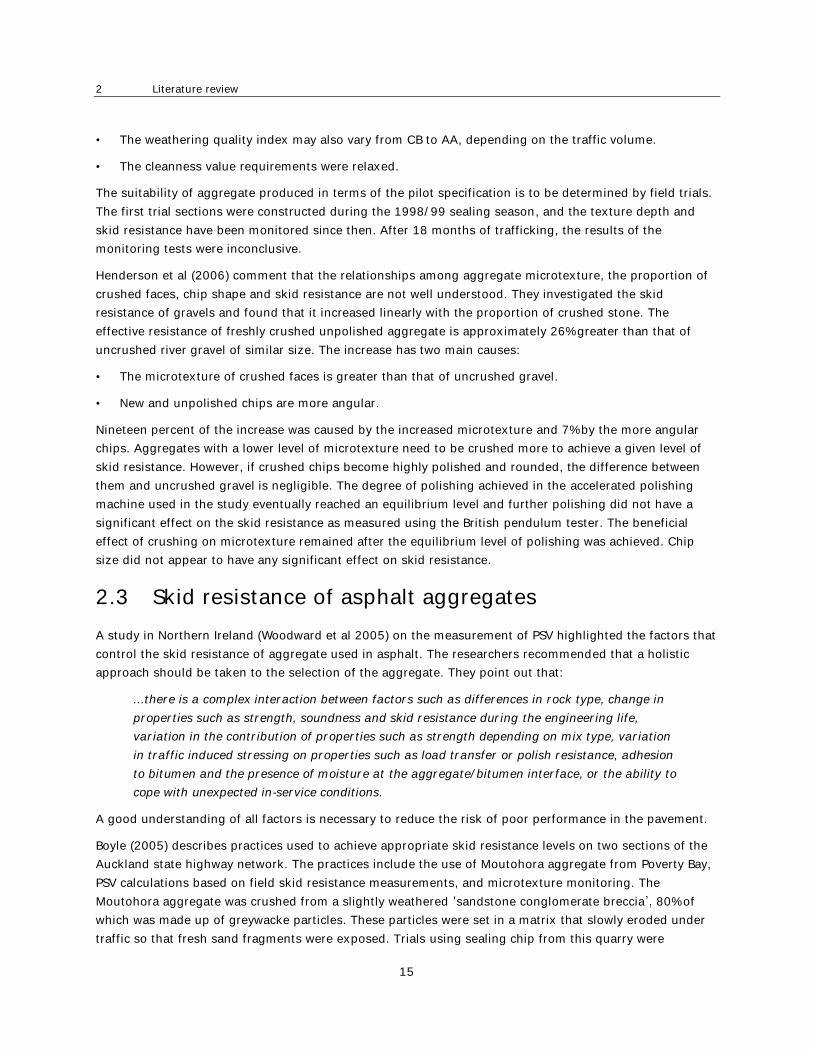
• The weathering quality index may also vary from CB to AA, depending on the traffic volume.
• The cleanness value requirements were relaxed.
The suitability of aggregate produced in terms of the pilot specification is to be determined by field trials.
The first trial sections were constructed during the 1998/99 sealing season, and the texture depth and
skid resistance have been monitored since then. After 18 months of trafficking, the results of the
monitoring tests were inconclusive.
Henderson et al (2006) comment that the relationships among aggregate microtexture, the proportion of
crushed faces, chip shape and skid resistance are not well understood. They investigated the skid
resistance of gravels and found that it increased linearly with the proportion of crushed stone. The
effective resistance of freshly crushed unpolished aggregate is approximately 26% greater than that of
uncrushed river gravel of similar size. The increase has two main causes:
• The microtexture of crushed faces is greater than that of uncrushed gravel.
• New and unpolished chips are more angular.
Nineteen percent of the increase was caused by the increased microtexture and 7% by the more angular
chips. Aggregates with a lower level of microtexture need to be crushed more to achieve a given level of
skid resistance. However, if crushed chips become highly polished and rounded, the difference between
them and uncrushed gravel is negligible. The degree of polishing achieved in the accelerated polishing
machine used in the study eventually reached an equilibrium level and further polishing did not have a
significant effect on the skid resistance as measured using the British pendulum tester. The beneficial
effect of crushing on microtexture remained after the equilibrium level of polishing was achieved. Chip
size did not appear to have any significant effect on skid resistance.
2.3 Skid resistance of asphalt aggregates
A study in Northern Ireland (Woodward et al 2005) on the measurement of PSV highlighted the factors that
control the skid resistance of aggregate used in asphalt. The researchers recommended that a holistic
approach should be taken to the selection of the aggregate. They point out that:
...there is a complex interaction between factors such as differences in rock type, change in
properties such as strength, soundness and skid resistance during the engineering life,
variation in the contribution of properties such as strength depending on mix type, variation
in traffic induced stressing on properties such as load transfer or polish resistance, adhesion
to bitumen and the presence of moisture at the aggregate/bitumen interface, or the ability to
cope with unexpected in-service conditions.
A good understanding of all factors is necessary to reduce the risk of poor performance in the pavement.
Boyle (2005) describes practices used to achieve appropriate skid resistance levels on two sections of the
Auckland state highway network. The practices include the use of Moutohora aggregate from Poverty Bay,
PSV calculations based on field skid resistance measurements, and microtexture monitoring. The
Moutohora aggregate was crushed from a slightly weathered sandstone conglomerate breccia 80% of
which was made up of greywacke particles. These particles were set in a matrix that slowly eroded under
traffic so that fresh sand fragments were exposed. Trials using sealing chip from this quarry were
Page 17
Abrasion resistance of aggregates in asphalt
16
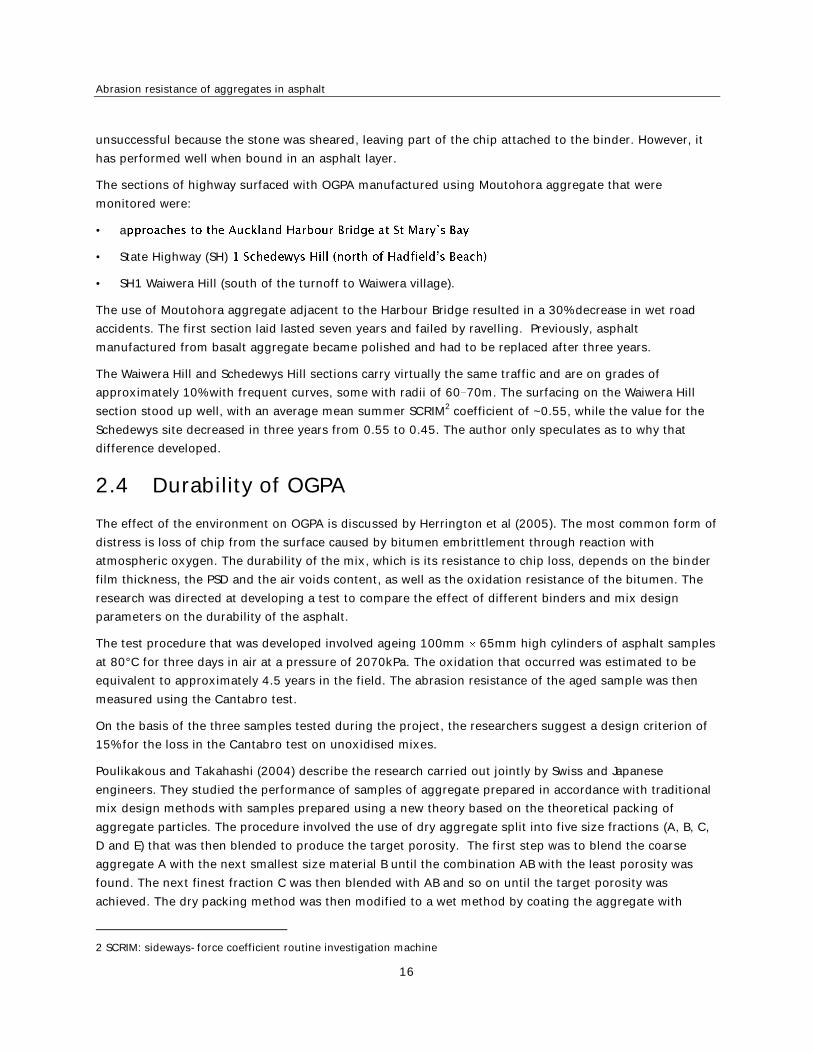
unsuccessful because the stone was sheared, leaving part of the chip attached to the binder. However, it
has performed well when bound in an asphalt layer.
The sections of highway surfaced with OGPA manufactured using Moutohora aggregate that were
monitored were:
• a
• State Highway (SH)
• SH1 Waiwera Hill (south of the turnoff to Waiwera village).
The use of Moutohora aggregate adjacent to the Harbour Bridge resulted in a 30% decrease in wet road
accidents. The first section laid lasted seven years and failed by ravelling. Previously, asphalt
manufactured from basalt aggregate became polished and had to be replaced after three years.
The Waiwera Hill and Schedewys Hill sections carry virtually the same traffic and are on grades of
approximately 10% with frequent curves, some with radii of 60 70m. The surfacing on the Waiwera Hill
section stood up well, with an average mean summer SCRIM2 coefficient of ~0.55, while the value for the
Schedewys site decreased in three years from 0.55 to 0.45. The author only speculates as to why that
difference developed.
2.4 Durability of OGPA
The effect of the environment on OGPA is discussed by Herrington et al (2005). The most common form of
distress is loss of chip from the surface caused by bitumen embrittlement through reaction with
atmospheric oxygen. The durability of the mix, which is its resistance to chip loss, depends on the binder
film thickness, the PSD and the air voids content, as well as the oxidation resistance of the bitumen. The
research was directed at developing a test to compare the effect of different binders and mix design
parameters on the durability of the asphalt.
The test procedure that was developed involved ageing 100mm 65mm high cylinders of asphalt samples
at 80°C for three days in air at a pressure of 2070kPa. The oxidation that occurred was estimated to be
equivalent to approximately 4.5 years in the field. The abrasion resistance of the aged sample was then
measured using the Cantabro test.
On the basis of the three samples tested during the project, the researchers suggest a design criterion of
15% for the loss in the Cantabro test on unoxidised mixes.
Poulikakous and Takahashi (2004) describe the research carried out jointly by Swiss and Japanese
engineers. They studied the performance of samples of aggregate prepared in accordance with traditional
mix design methods with samples prepared using a new theory based on the theoretical packing of
aggregate particles. The procedure involved the use of dry aggregate split into five size fractions (A, B, C,
D and E) that was then blended to produce the target porosity. The first step was to blend the coarse
aggregate A with the next smallest size material B until the combination AB with the least porosity was
found. The next finest fraction C was then blended with AB and so on until the target porosity was
achieved. The dry packing method was then modified to a wet method by coating the aggregate with
2 SCRIM: sideways-force coefficient routine investigation machine
Page 18
2 Literature review
17
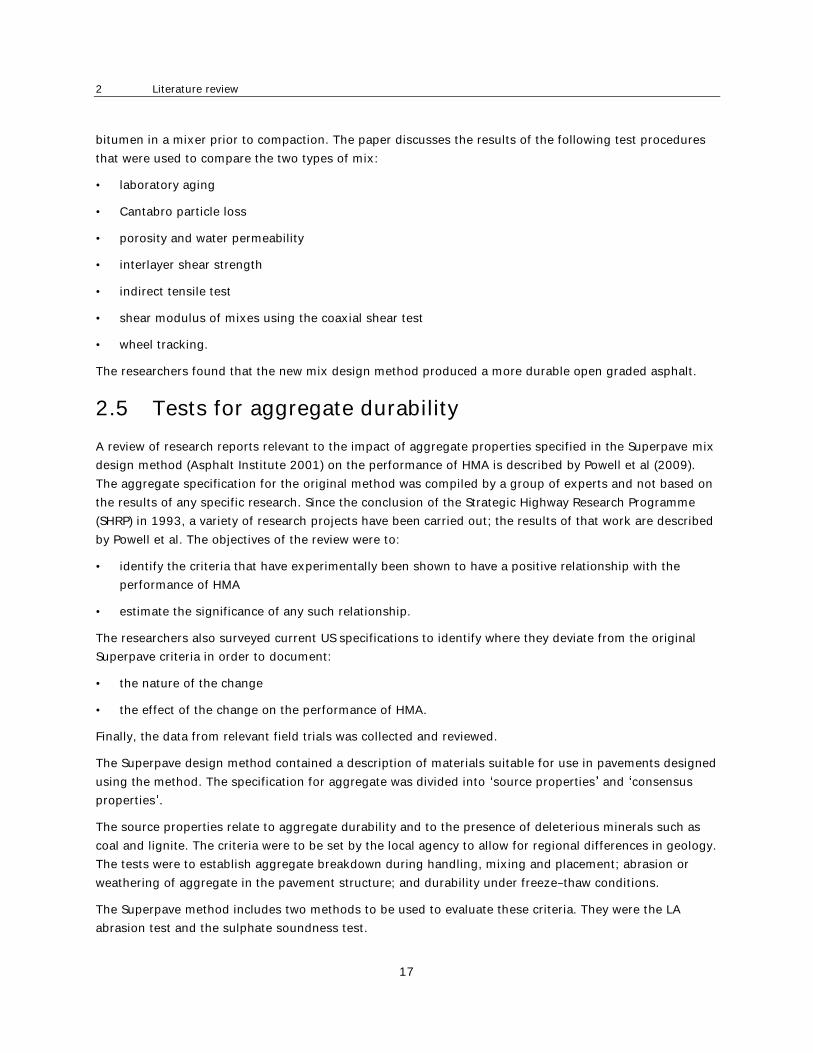
bitumen in a mixer prior to compaction. The paper discusses the results of the following test procedures
that were used to compare the two types of mix:
• laboratory aging
• Cantabro particle loss
• porosity and water permeability
• interlayer shear strength
• indirect tensile test
• shear modulus of mixes using the coaxial shear test
• wheel tracking.
The researchers found that the new mix design method produced a more durable open graded asphalt.
2.5 Tests for aggregate durability
A review of research reports relevant to the impact of aggregate properties specified in the Superpave mix
design method (Asphalt Institute 2001) on the performance of HMA is described by Powell et al (2009).
The aggregate specification for the original method was compiled by a group of experts and not based on
the results of any specific research. Since the conclusion of the Strategic Highway Research Programme
(SHRP) in 1993, a variety of research projects have been carried out; the results of that work are described
by Powell et al. The objectives of the review were to:
• identify the criteria that have experimentally been shown to have a positive relationship with the
performance of HMA
• estimate the significance of any such relationship.
The researchers also surveyed current US specifications to identify where they deviate from the original
Superpave criteria in order to document:
• the nature of the change
• the effect of the change on the performance of HMA.
Finally, the data from relevant field trials was collected and reviewed.
The Superpave design method contained a description of materials suitable for use in pavements designed
using the method. The specification for aggregate was divided into source properties and consensus
properties .
The source properties relate to aggregate durability and to the presence of deleterious minerals such as
coal and lignite. The criteria were to be set by the local agency to allow for regional differences in geology.
The tests were to establish aggregate breakdown during handling, mixing and placement; abrasion or
weathering of aggregate in the pavement structure; and durability under freeze thaw conditions.
The Superpave method includes two methods to be used to evaluate these criteria. They were the LA
abrasion test and the sulphate soundness test.
Page 19
Abrasion resistance of aggregates in asphalt
18
Four consensus properties set out in the Superpave method and these were to be universally
adopted by all agencies. They were concerned with:
• coarse aggregate angularity (percent crushed faces)
• flat and elongated particles (percent flat and elongated particles)
• fine aggregate angularity (uncompacted voids in the fine aggregate
• proportion of clay type fines (sand equivalent test).
The committee of experts also set the volumetric properties for the mix including:
• air voids content
• voids in the mineral aggregate
• voids filled with asphalt
• the proportion of dust to asphalt.
Once the design method was put into operation through out the United States (US), it was found that a
number of aggregates did not meet the specified criteria but had a long history of faultless performance.
The limits set for PSD were of particular concern.
An extensive list of results for the review is described by Powell et al (2005). Several may be relevant to
this project:
• No evidence suggested that the LA test, used for assessing breakdown during construction, should be
replaced.
• The sulphate soundness test appears to be a good predictor of performance under freeze thaw
conditions but these are unlikely to occur in a HMA pavement because the aggregate is coated with
bitumen.
• Flat and elongated particles are prone to breaking down during construction. In such circumstances,
the broken faces will not be coated with bitumen.
• Micro-deval testing provides a measure of the possible loss caused by abrasion of particles under
traffic loading.
• PSD has a significant impact on constructability and performance.
• Grading of both the fine and coarse aggregate has an influence on the rut resistance of the mix.
• For fines, D60 and the clay index were found to be related to rutting, while D10 and the clay index can
be related to stripping.
Several reports of studies that have been carried out in the US were briefly reviewed for this project. Most
refer to comparative studies of the various tests either to correlate the tests or to relate the tests to the
performance of HMA. Some were reviewed as part of the study described by Powell et al (2005).
Bjarnason et al (2002) describes comparative tests carried out on 20 samples of basaltic basecourse
aggregate produced in different areas of Iceland. Each of the 17 tests used could be classified into one of
three groups:
Page 20
2 Literature review
19
• fragmentation (eg aggregate impact value)
• weathering (eg Icelandic freeze thaw and sulphate soundness tests)
• abrasion (eg micro-deval test).
The study found a good correlation between all of the six fragmentation test methods.
The weathering tests could be grouped according to the type of test used. One group involved actually
freezing and thawing the aggregate in a special refrigerated cabinet, while the other group involved
soaking the aggregate in a solution of magnesium sulphate before it was dried. Two test methods in the
first group correlated well, while the correlation between the two groups of tests was not strong.
The two abrasion tests used, the Nordic abrasion and the micro-deval test, had a strong correlation. The
micro-deval test also correlated with the freeze thaw tests.
Gatchalian et al (2006), studied the degradation of aggregates used in SMA mixtures. The six aggregates
studied generally varied in shape, angularity and texture. The micro-deval test was used to measure the
resistance to abrasion and an advanced imaging technique was used to record the changes in the
characteristics of the aggregate caused by that test. The resistance of the aggregate to degradation when
used in SMA was evaluated using a gyratory compactor by comparing the PSD after 100 and 250
revolutions with the distribution prior to the test. They recommended that the weight loss in the micro-
deval test, the change in aggregate shape characteristics and the change in PSD be used to evaluate the
resistance of aggregate particles to degradation in SMA mixes.
2.6 Geological aspects
The properties of the aggregate are basically determined by the type of rock being processed. The
physical strength of the rock (ie crushing resistance) has a profound influence on the property of the
aggregate produced, particularly the PSD, the quantity and nature of the fines, and the shape of the
particles. The engineering properties of the aggregate will therefore be determined by:
• the type of rock (sedimentary, igneous or man-made)
• the mineral content (eg cementing characteristics, swelling or non-swelling clays)
• the degree of weathering
• the type of production process used.
We performed a geological assessment of the aggregate sources in the North Island of New Zealand. This
assessment highlights the fact that New Zealand is a geologically young country when compared to Europe
and North America, where many engineering tests to determine the engineering properties of aggregates
have been developed. For example, greywacke rocks, which are a major source of aggregate in
New Zealand, form a very small proportion of the materials used in Europe, North America, South Africa
and Australia. The sandstones often used in those countries usually contain physically and chemically
stable debris that has been through several cycles of sedimentation. It is therefore unlikely that such tests
will be appropriate for unqualified use in New Zealand. This assessment included a review of the tests
used by engineers to determine the properties of aggregates, and points out that most procedures
Page 21
Abrasion resistance of aggregates in asphalt
20
measure a combination of physical properties and that it is difficult to interpret the results unless each
variable is controlled. Ultimately, the properties measured are strongly related to:
• the geological nature of the rock
• the type of process used in the manufacture of aggregates.
Since many of the New Zealand rock types contain clay minerals and zeolites that absorb water and swell,
the durability of aggregate should always be determined under wet conditions.
2.7 Mix design
Asphalt mix design is based on empiricism, with different approaches being taken in different countries.
In the past, the Marshall and Hveem methods were adopted on a virtually universal basis. However, more
recently, each agency has tended to either develop its own method or adopt one proven to be suitable for
local materials and traffic.
The US developed the Superpave method (Asphalt Institute 2001) as part of the SHRP project carried out in
the 1980s. This is a volumetric method that begins with the selection of a number of aggregates (based
on their PSD) that will meet the specified volumetric and density requirements. Samples are then prepared
and compacted in a gyratory compactor. The height of the specimen is recorded during the compaction
process so that the rate of densification can be monitored. The most important criteria are the percentage
air voids, which is fixed at 4% for all mixtures, and traffic levels. The voids in the mineral aggregate
change as the nominal maximum particle size changes. The allowable percentage of voids in the mineral
aggregate filled with bitumen is reduced as the design traffic loading is increased. The optimum design is
based on the performance of each sample in the compactor compared with criteria established in terms of
the design traffic loading and the expected maximum temperature on the road.
The process used in Australia and New Zealand is similar to that described above in that the mix stability
is determined using a gyratory compactor. The method used in New Zealand to design OGPA is described
by TNZ (2007a, b). The main difference, apart from the porosity and associated criteria, is the skid
resistance requirement, which is described in terms of PSV and asphalt particle abrasion loss.
Sullivan (2005) comments that the current methods use historical data to produce a mix with a particular
surface texture. However, designers do not have any way to estimate the effect that a small change in
gradation or binder content might have on the texture. Sullivan used data from a test track operated by
the National Centre for Asphalt Technology at Auburn University, Alabama, to show that mean particle
depth could be predicted from the PSD and the binder content. The required stopping distance of the
design vehicle could then be estimated from the mean particle depth and the polished aggregate friction
value.
2.8 Conclusions
The literature review has provided an indication of the relevance of some aspects of the research to be
carried out.
• Open graded mixes such as OGPA will be more prone to particle breakdown than dense graded HMA.
Page 22
2 Literature review
21
• Flat and elongated particles will break down more readily than more cubic shaped aggregate.
• The LA abrasion test should provide a good indication of the likely breakdown of aggregate during the
batching, mixing, laying and compaction phases of construction.
• Micro-deval testing could be used to rank aggregate in terms of the likely abrasion loss under traffic.
• The likely breakdown of SMA mixes can be evaluated using the weight loss measured using the micro-
deval test, the change in aggregate shape characteristics and the change in PSD.
• Open graded mixes can be designed to provide a particular level of skid resistance.
• Rock is a heterogeneous material so its strength and durability can be expected to vary from one
sample to another.
• The skid resistance properties of an aggregate depend on the mineral composition and the grain size.
• The quality of any aggregate depends on the production processes used.
Page 23
Abrasion resistance of aggregates in asphalt
22
3 Selection of aggregates
3.1 Available sources
Five sources of aggregate were originally selected for use in the test sections. They provided a range of:
• the material used in SMA in the North Island
• skid resistance values when measured using the PSV test.
The five aggregates are listed in table 3.1.
Table 3.1 Aggregates selected for evaluation
Aggregate source Region Rock type PSV Mix
1 Brookby Quarry South Auckland Waipapa greywacke 55 56 SMA11
2 Horokiwi Wellington Torlesse greywacke 58 60 SMA11
3 Te Matai Palmerston North Greywacke (gravel) 58 59 SMA11
4 Moutohora Poverty Bay East North Island greywacke 65 SMA10
5 Electric arc furnace slag Auckland Man-made 65 SMA11
Previously, samples of similar aggregate had been subjected to a series of engineering tests as part of the
quality assurance programme carried out by Higgins Contractors. The tests included:
• crushing resistance
• PSV
• weathering quality index
• wet/dry crushing strength
• specific gravity and absorption.
In addition, samples were subjected to the micro-deval abrasion test. The results of these tests are
summarised in section 4.1.
Because of time and site constraints, it was only possible to construct four test sections. Regrettably, the
aggregate from the Horokiwi Quarry in Wellington was deleted from the programme.
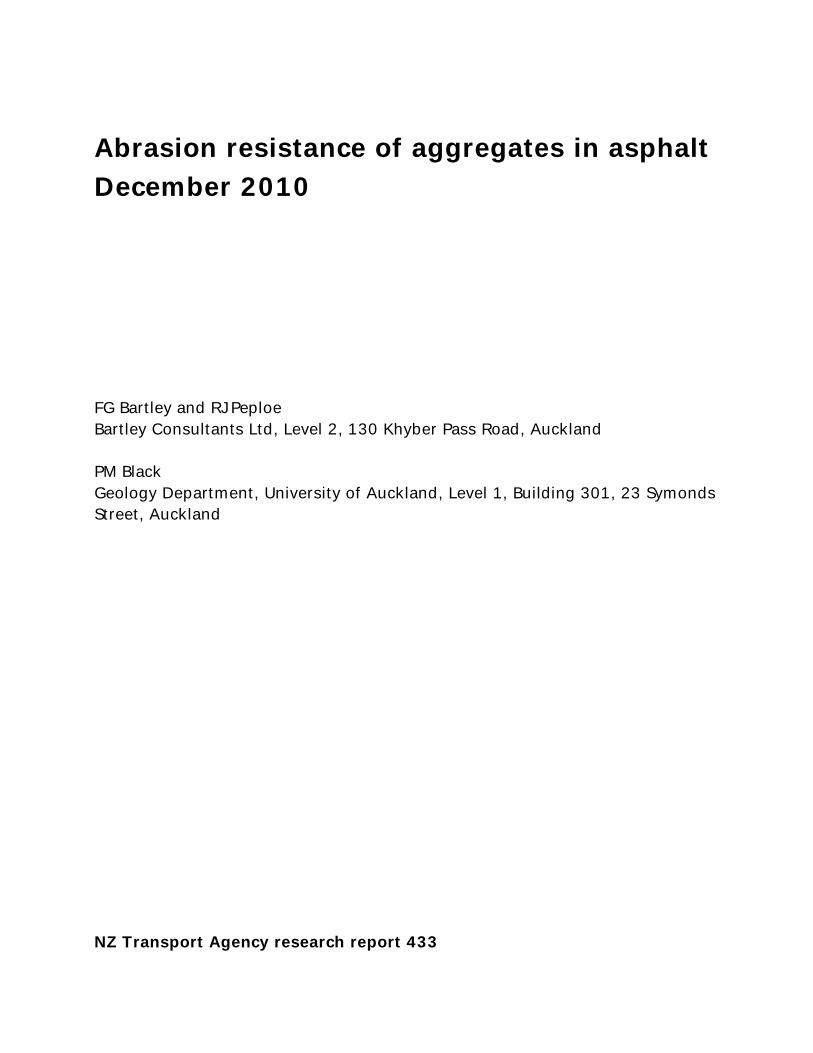
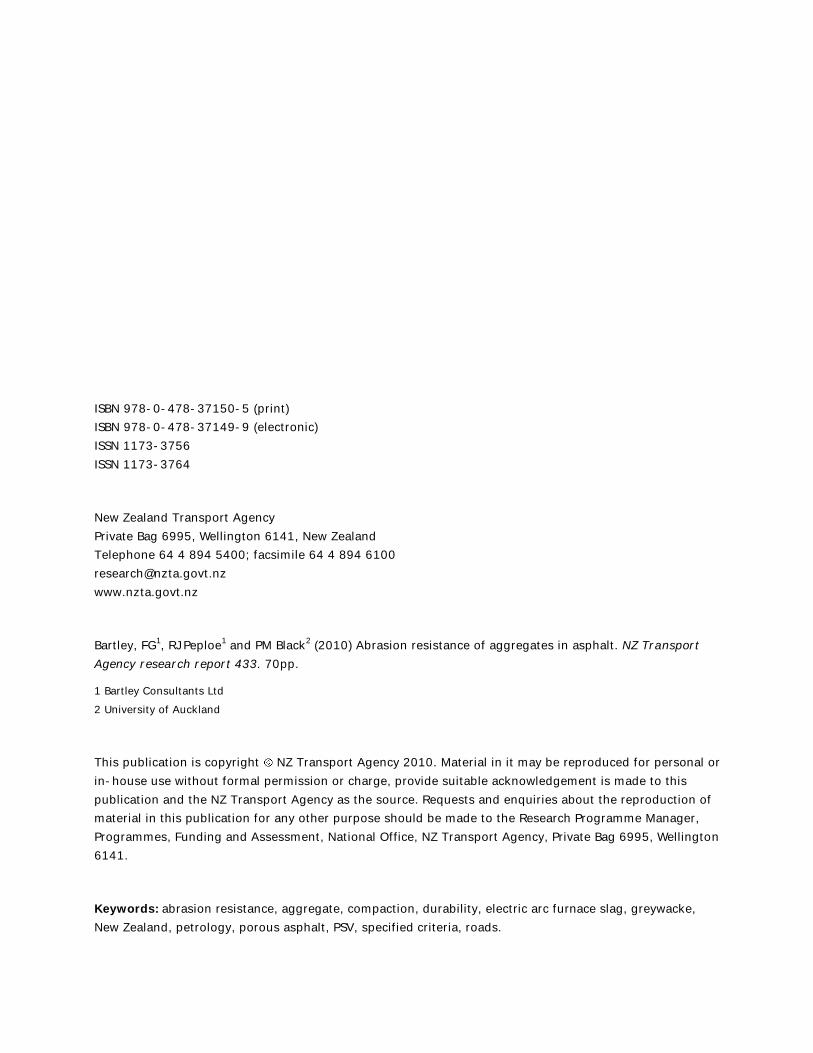
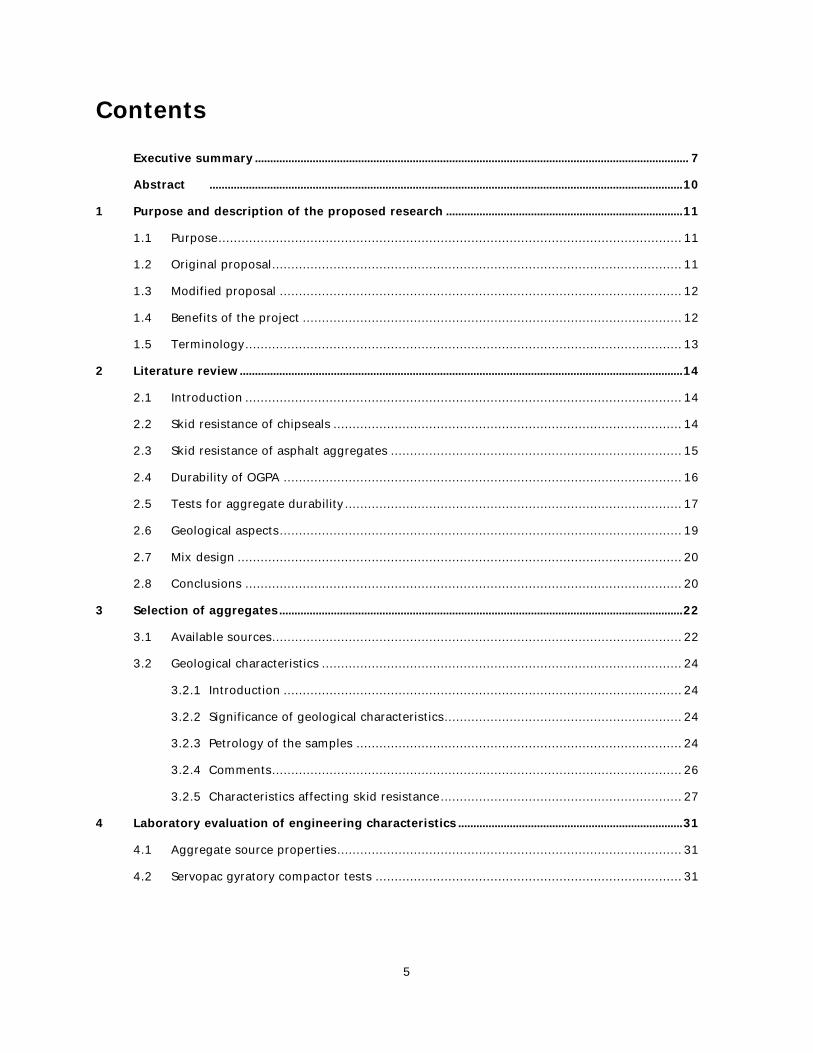
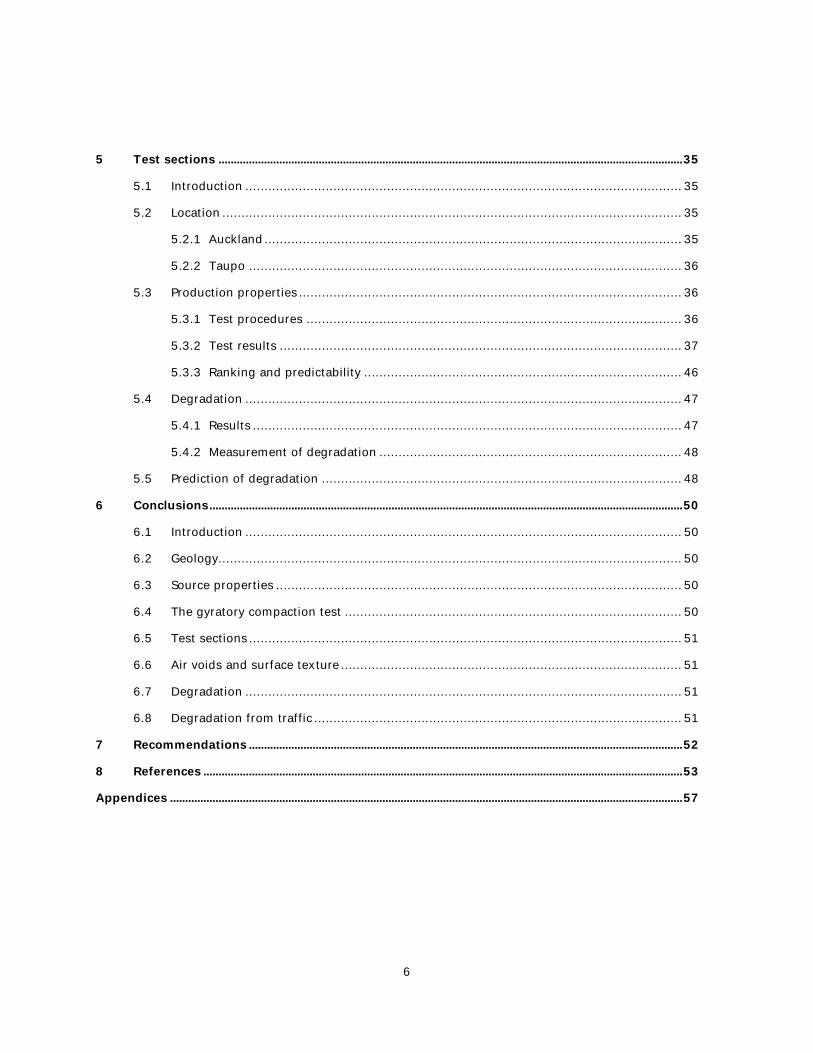
Samples of the aggregates used are shown in figures 3.1 3.4.
Page 24
3 Selection of aggregates
23
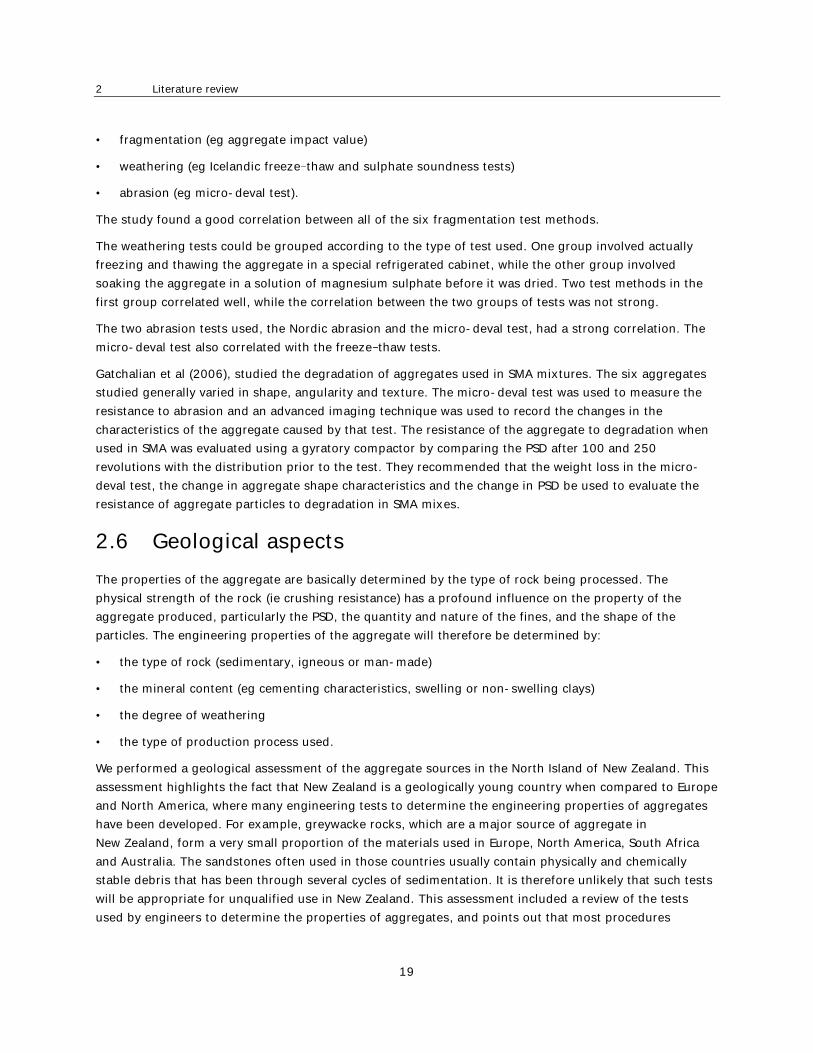
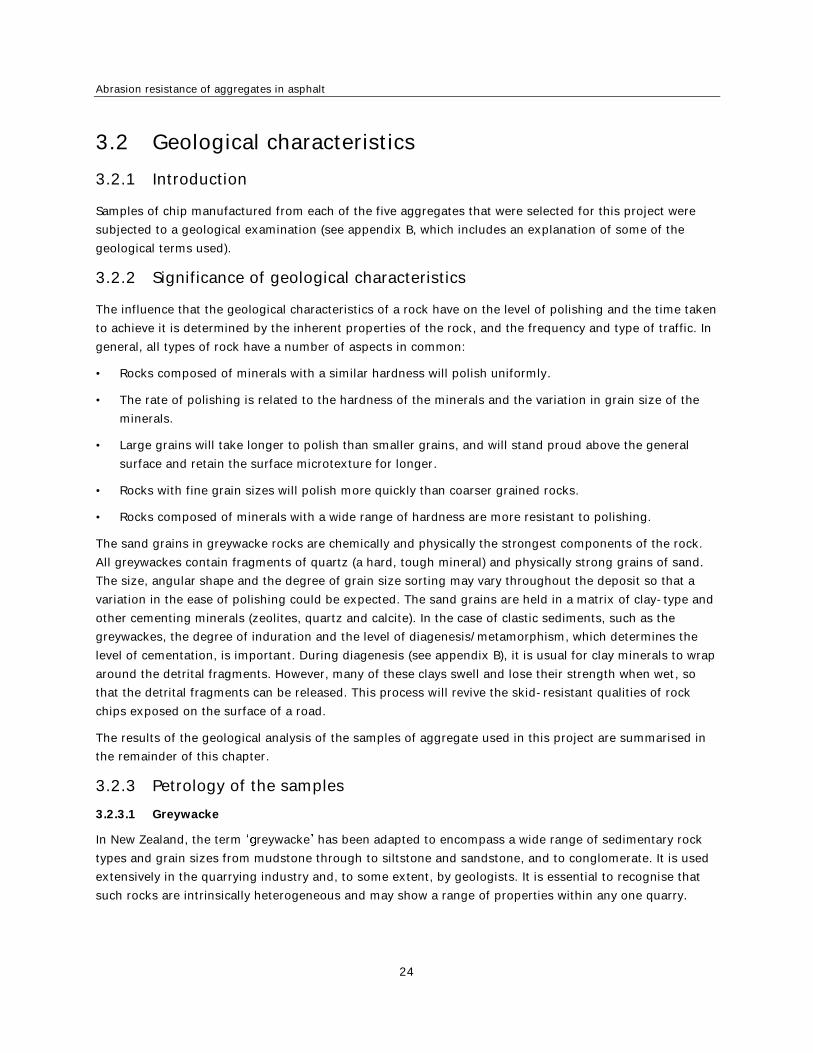
Figure 3.1 Sample of aggregate from Brookby Quarry
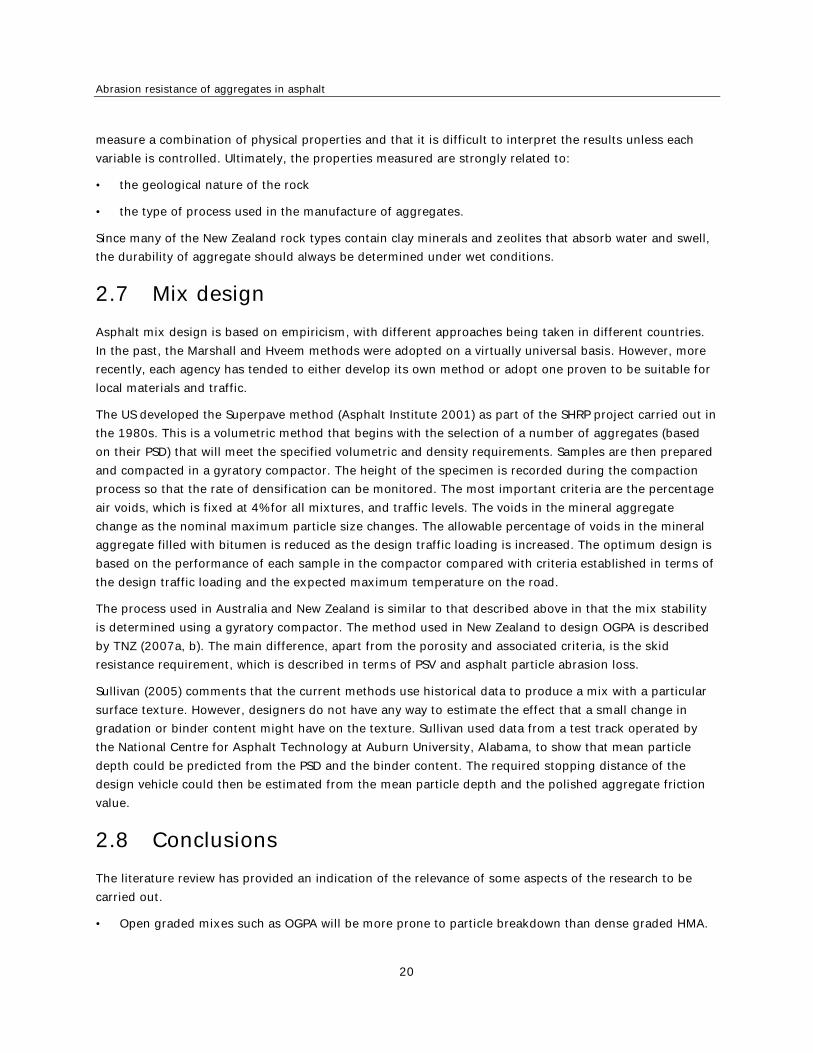
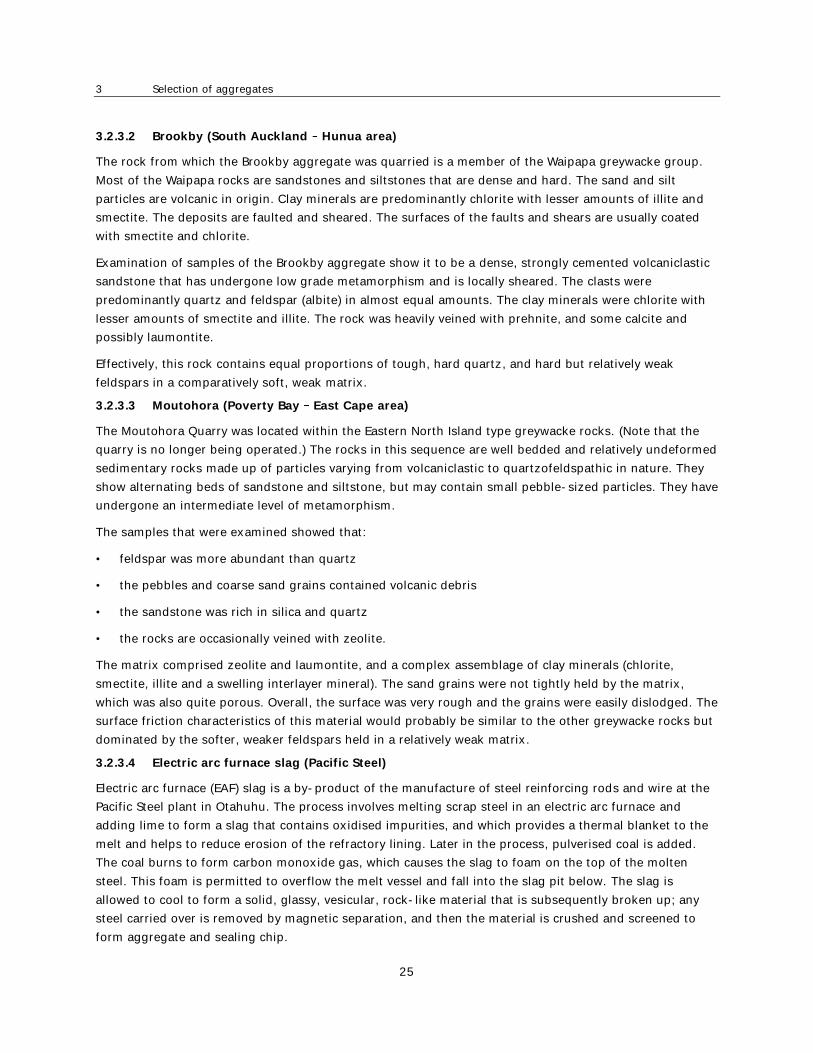
Figure 3.2 Sample of aggregate from Moutohora
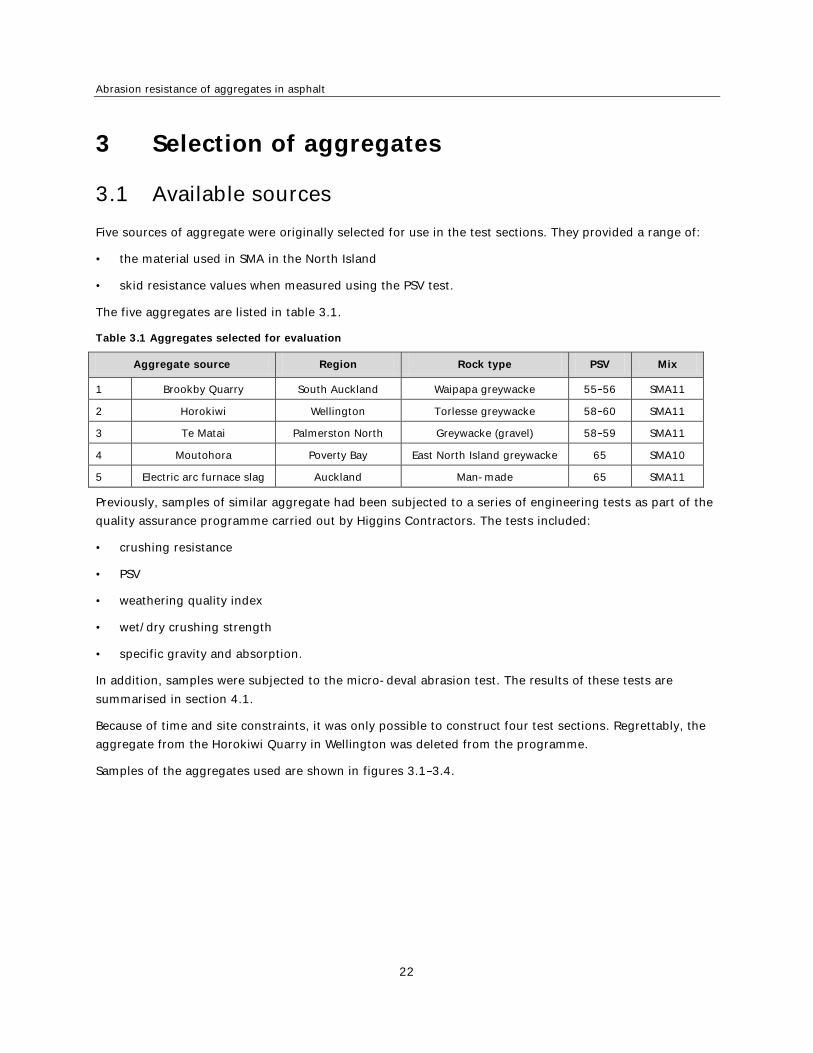
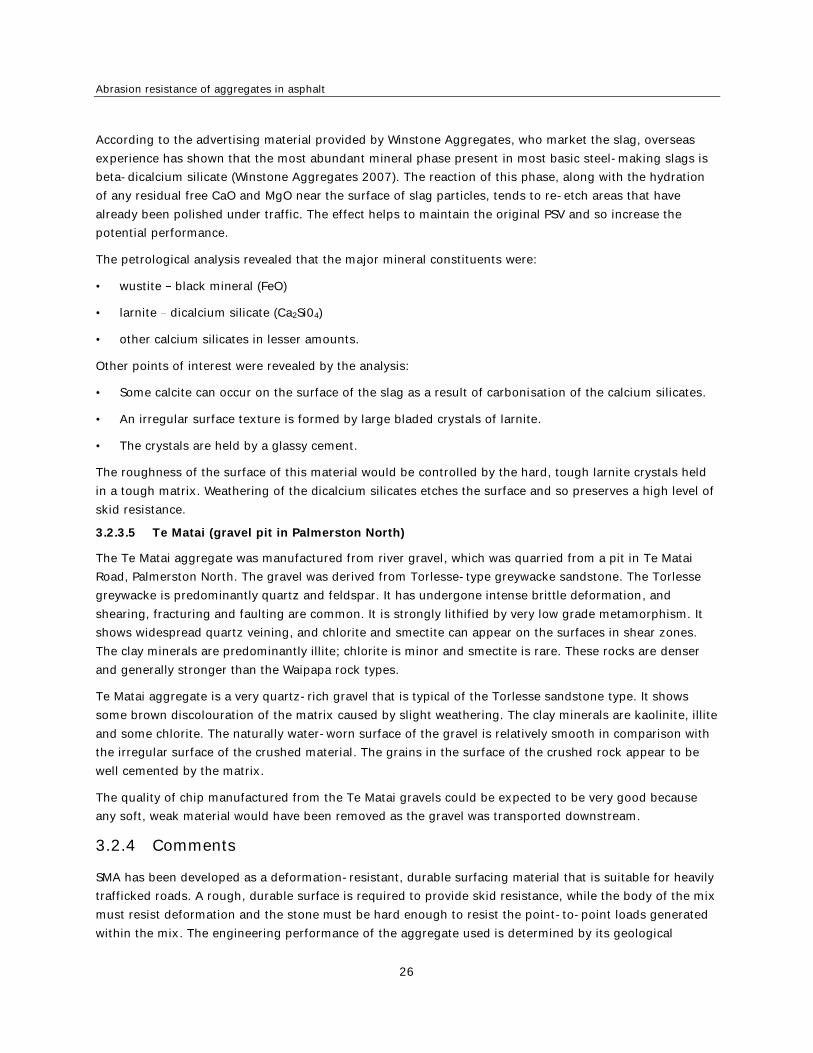
Figure 3.3 Sample of electric arc furnace slag
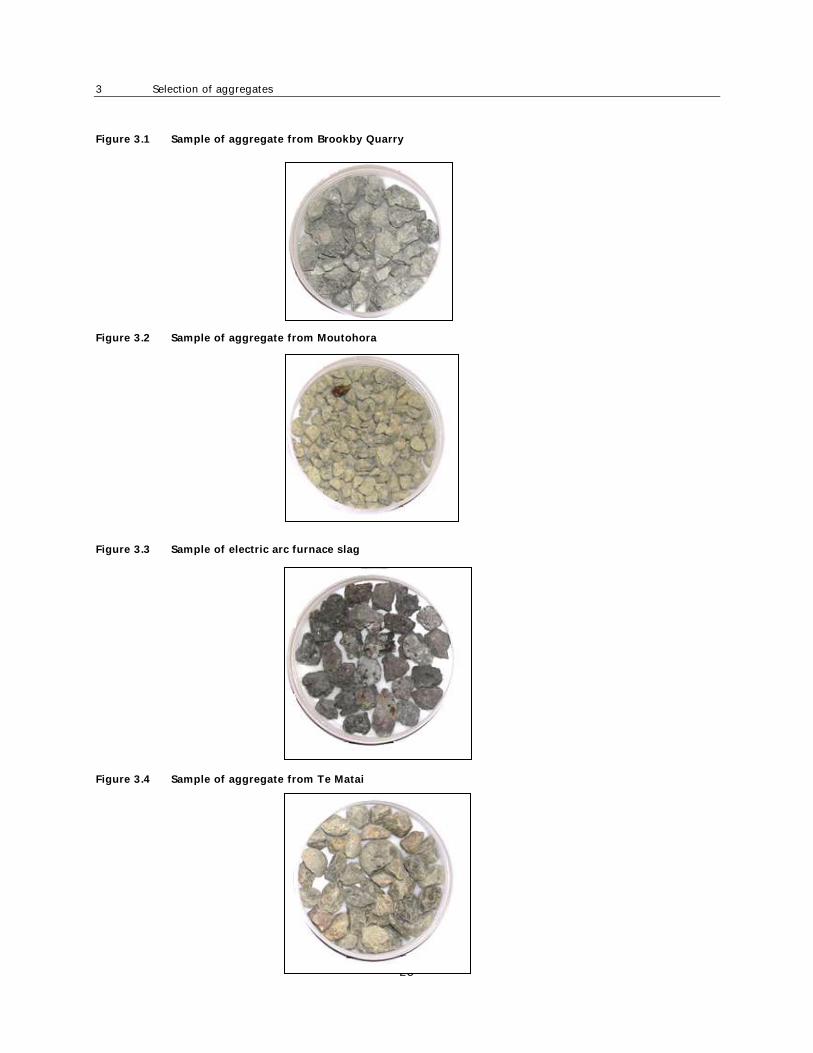
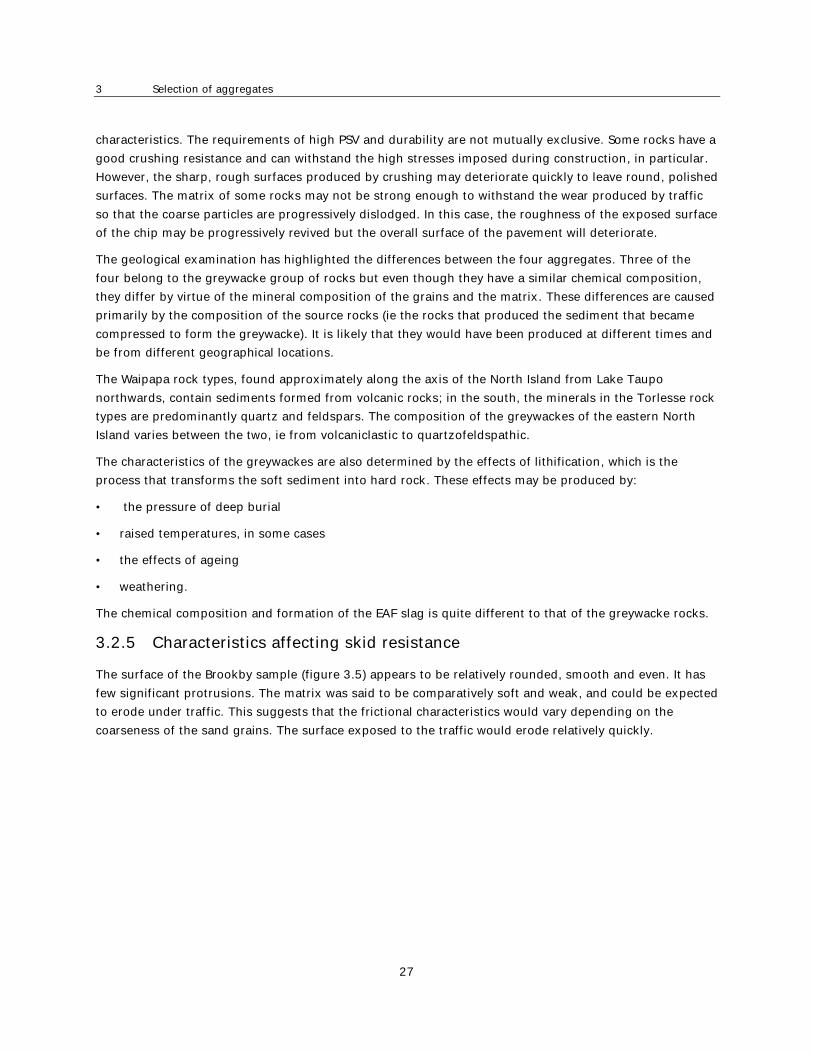
Figure 3.4 Sample of aggregate from Te Matai
Page 25
Abrasion resistance of aggregates in asphalt
24
3.2 Geological characteristics
3.2.1 Introduction
Samples of chip manufactured from each of the five aggregates that were selected for this project were
subjected to a geological examination (see appendix B, which includes an explanation of some of the
geological terms used).
3.2.2 Significance of geological characteristics
The influence that the geological characteristics of a rock have on the level of polishing and the time taken
to achieve it is determined by the inherent properties of the rock, and the frequency and type of traffic. In
general, all types of rock have a number of aspects in common:
• Rocks composed of minerals with a similar hardness will polish uniformly.
• The rate of polishing is related to the hardness of the minerals and the variation in grain size of the
minerals.
• Large grains will take longer to polish than smaller grains, and will stand proud above the general
surface and retain the surface microtexture for longer.
• Rocks with fine grain sizes will polish more quickly than coarser grained rocks.
• Rocks composed of minerals with a wide range of hardness are more resistant to polishing.
The sand grains in greywacke rocks are chemically and physically the strongest components of the rock.
All greywackes contain fragments of quartz (a hard, tough mineral) and physically strong grains of sand.
The size, angular shape and the degree of grain size sorting may vary throughout the deposit so that a
variation in the ease of polishing could be expected. The sand grains are held in a matrix of clay-type and
other cementing minerals (zeolites, quartz and calcite). In the case of clastic sediments, such as the
greywackes, the degree of induration and the level of diagenesis/metamorphism, which determines the
level of cementation, is important. During diagenesis (see appendix B), it is usual for clay minerals to wrap
around the detrital fragments. However, many of these clays swell and lose their strength when wet, so
that the detrital fragments can be released. This process will revive the skid-resistant qualities of rock
chips exposed on the surface of a road.
The results of the geological analysis of the samples of aggregate used in this project are summarised in
the remainder of this chapter.
3.2.3 Petrology of the samples
3.2.3.1 Greywacke
In New Zealand, the term reywacke has been adapted to encompass a wide range of sedimentary rock
types and grain sizes from mudstone through to siltstone and sandstone, and to conglomerate. It is used
extensively in the quarrying industry and, to some extent, by geologists. It is essential to recognise that
such rocks are intrinsically heterogeneous and may show a range of properties within any one quarry.
Page 26
3 Selection of aggregates
25
3.2.3.2 Brookby (South Auckland Hunua area)
The rock from which the Brookby aggregate was quarried is a member of the Waipapa greywacke group.
Most of the Waipapa rocks are sandstones and siltstones that are dense and hard. The sand and silt
particles are volcanic in origin. Clay minerals are predominantly chlorite with lesser amounts of illite and
smectite. The deposits are faulted and sheared. The surfaces of the faults and shears are usually coated
with smectite and chlorite.
Examination of samples of the Brookby aggregate show it to be a dense, strongly cemented volcaniclastic
sandstone that has undergone low grade metamorphism and is locally sheared. The clasts were
predominantly quartz and feldspar (albite) in almost equal amounts. The clay minerals were chlorite with
lesser amounts of smectite and illite. The rock was heavily veined with prehnite, and some calcite and
possibly laumontite.
Effectively, this rock contains equal proportions of tough, hard quartz, and hard but relatively weak
feldspars in a comparatively soft, weak matrix.
3.2.3.3 Moutohora (Poverty Bay East Cape area)
The Moutohora Quarry was located within the Eastern North Island type greywacke rocks. (Note that the
quarry is no longer being operated.) The rocks in this sequence are well bedded and relatively undeformed
sedimentary rocks made up of particles varying from volcaniclastic to quartzofeldspathic in nature. They
show alternating beds of sandstone and siltstone, but may contain small pebble-sized particles. They have
undergone an intermediate level of metamorphism.
The samples that were examined showed that:
• feldspar was more abundant than quartz
• the pebbles and coarse sand grains contained volcanic debris
• the sandstone was rich in silica and quartz
• the rocks are occasionally veined with zeolite.
The matrix comprised zeolite and laumontite, and a complex assemblage of clay minerals (chlorite,
smectite, illite and a swelling interlayer mineral). The sand grains were not tightly held by the matrix,
which was also quite porous. Overall, the surface was very rough and the grains were easily dislodged. The
surface friction characteristics of this material would probably be similar to the other greywacke rocks but
dominated by the softer, weaker feldspars held in a relatively weak matrix.
3.2.3.4 Electric arc furnace slag (Pacific Steel)
Electric arc furnace (EAF) slag is a by-product of the manufacture of steel reinforcing rods and wire at the
Pacific Steel plant in Otahuhu. The process involves melting scrap steel in an electric arc furnace and
adding lime to form a slag that contains oxidised impurities, and which provides a thermal blanket to the
melt and helps to reduce erosion of the refractory lining. Later in the process, pulverised coal is added.
The coal burns to form carbon monoxide gas, which causes the slag to foam on the top of the molten
steel. This foam is permitted to overflow the melt vessel and fall into the slag pit below. The slag is
allowed to cool to form a solid, glassy, vesicular, rock-like material that is subsequently broken up; any
steel carried over is removed by magnetic separation, and then the material is crushed and screened to
form aggregate and sealing chip.
Page 27
Abrasion resistance of aggregates in asphalt
26
According to the advertising material provided by Winstone Aggregates, who market the slag, overseas
experience has shown that the most abundant mineral phase present in most basic steel-making slags is
beta-dicalcium silicate (Winstone Aggregates 2007). The reaction of this phase, along with the hydration
of any residual free CaO and MgO near the surface of slag particles, tends to re-etch areas that have
already been polished under traffic. The effect helps to maintain the original PSV and so increase the
potential performance.
The petrological analysis revealed that the major mineral constituents were:
• wustite black mineral (FeO)
• larnite dicalcium silicate (Ca2Si04)
• other calcium silicates in lesser amounts.
Other points of interest were revealed by the analysis:
• Some calcite can occur on the surface of the slag as a result of carbonisation of the calcium silicates.
• An irregular surface texture is formed by large bladed crystals of larnite.
• The crystals are held by a glassy cement.
The roughness of the surface of this material would be controlled by the hard, tough larnite crystals held
in a tough matrix. Weathering of the dicalcium silicates etches the surface and so preserves a high level of
skid resistance.
3.2.3.5 Te Matai (gravel pit in Palmerston North)
The Te Matai aggregate was manufactured from river gravel, which was quarried from a pit in Te Matai
Road, Palmerston North. The gravel was derived from Torlesse-type greywacke sandstone. The Torlesse
greywacke is predominantly quartz and feldspar. It has undergone intense brittle deformation, and
shearing, fracturing and faulting are common. It is strongly lithified by very low grade metamorphism. It
shows widespread quartz veining, and chlorite and smectite can appear on the surfaces in shear zones.
The clay minerals are predominantly illite; chlorite is minor and smectite is rare. These rocks are denser
and generally stronger than the Waipapa rock types.
Te Matai aggregate is a very quartz-rich gravel that is typical of the Torlesse sandstone type. It shows
some brown discolouration of the matrix caused by slight weathering. The clay minerals are kaolinite, illite
and some chlorite. The naturally water-worn surface of the gravel is relatively smooth in comparison with
the irregular surface of the crushed material. The grains in the surface of the crushed rock appear to be
well cemented by the matrix.
The quality of chip manufactured from the Te Matai gravels could be expected to be very good because
any soft, weak material would have been removed as the gravel was transported downstream.
3.2.4 Comments
SMA has been developed as a deformation-resistant, durable surfacing material that is suitable for heavily
trafficked roads. A rough, durable surface is required to provide skid resistance, while the body of the mix
must resist deformation and the stone must be hard enough to resist the point-to-point loads generated
within the mix. The engineering performance of the aggregate used is determined by its geological
Page 28
3 Selection of aggregates
27
characteristics. The requirements of high PSV and durability are not mutually exclusive. Some rocks have a
good crushing resistance and can withstand the high stresses imposed during construction, in particular.
However, the sharp, rough surfaces produced by crushing may deteriorate quickly to leave round, polished
surfaces. The matrix of some rocks may not be strong enough to withstand the wear produced by traffic
so that the coarse particles are progressively dislodged. In this case, the roughness of the exposed surface
of the chip may be progressively revived but the overall surface of the pavement will deteriorate.
The geological examination has highlighted the differences between the four aggregates. Three of the
four belong to the greywacke group of rocks but even though they have a similar chemical composition,
they differ by virtue of the mineral composition of the grains and the matrix. These differences are caused
primarily by the composition of the source rocks (ie the rocks that produced the sediment that became
compressed to form the greywacke). It is likely that they would have been produced at different times and
be from different geographical locations.
The Waipapa rock types, found approximately along the axis of the North Island from Lake Taupo
northwards, contain sediments formed from volcanic rocks; in the south, the minerals in the Torlesse rock
types are predominantly quartz and feldspars. The composition of the greywackes of the eastern North
Island varies between the two, ie from volcaniclastic to quartzofeldspathic.
The characteristics of the greywackes are also determined by the effects of lithification, which is the
process that transforms the soft sediment into hard rock. These effects may be produced by:
• the pressure of deep burial
• raised temperatures, in some cases
• the effects of ageing
• weathering.
The chemical composition and formation of the EAF slag is quite different to that of the greywacke rocks.
3.2.5 Characteristics affecting skid resistance
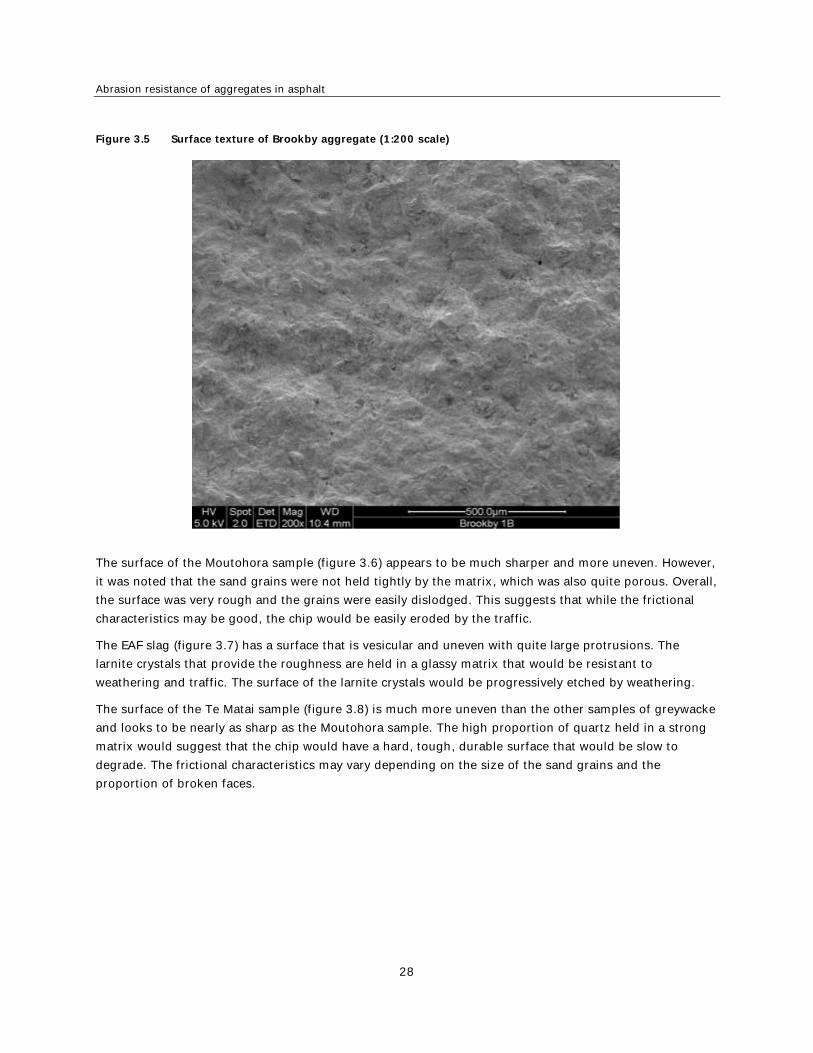
The surface of the Brookby sample (figure 3.5) appears to be relatively rounded, smooth and even. It has
few significant protrusions. The matrix was said to be comparatively soft and weak, and could be expected
to erode under traffic. This suggests that the frictional characteristics would vary depending on the
coarseness of the sand grains. The surface exposed to the traffic would erode relatively quickly.
Page 29
Abrasion resistance of aggregates in asphalt
28
Figure 3.5 Surface texture of Brookby aggregate (1:200 scale)
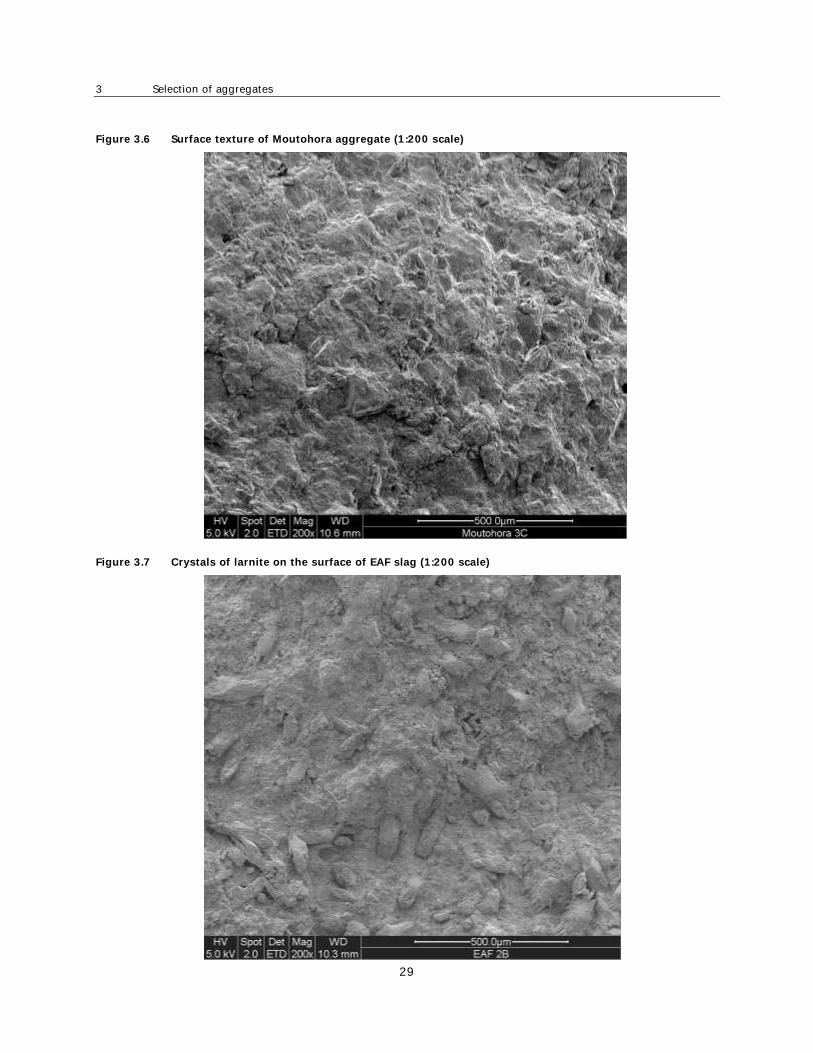
The surface of the Moutohora sample (figure 3.6) appears to be much sharper and more uneven. However,
it was noted that the sand grains were not held tightly by the matrix, which was also quite porous. Overall,
the surface was very rough and the grains were easily dislodged. This suggests that while the frictional
characteristics may be good, the chip would be easily eroded by the traffic.
The EAF slag (figure 3.7) has a surface that is vesicular and uneven with quite large protrusions. The
larnite crystals that provide the roughness are held in a glassy matrix that would be resistant to
weathering and traffic. The surface of the larnite crystals would be progressively etched by weathering.
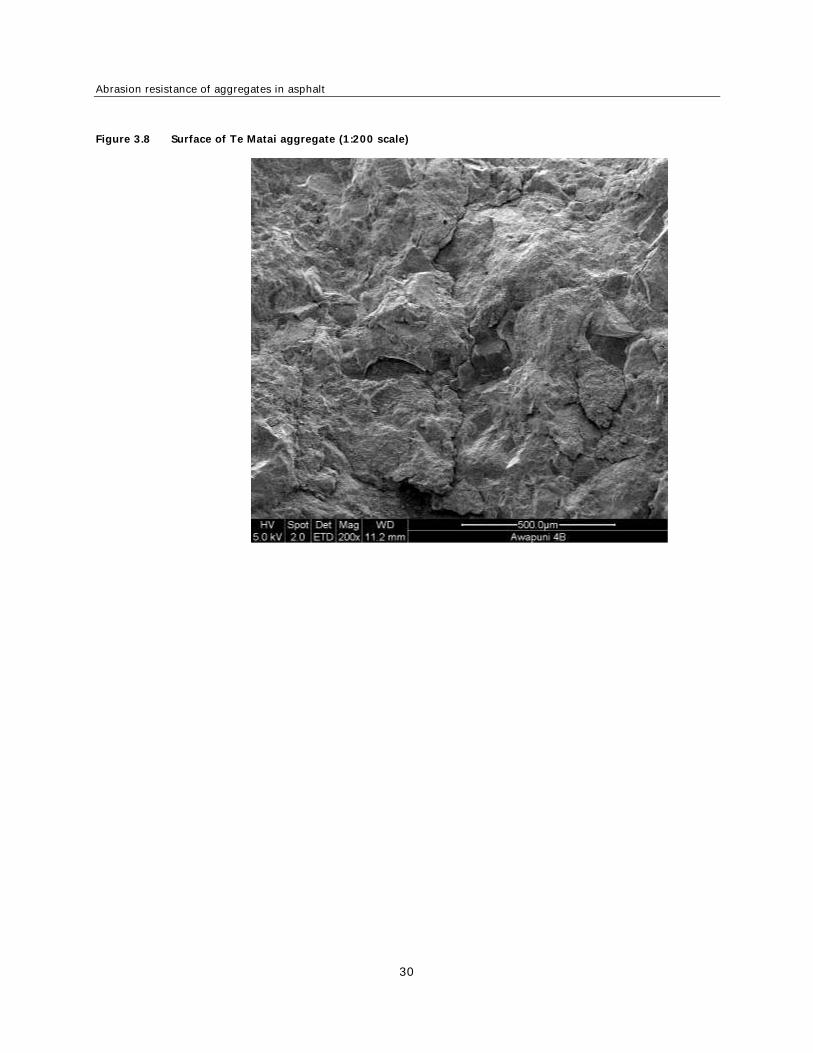
The surface of the Te Matai sample (figure 3.8) is much more uneven than the other samples of greywacke
and looks to be nearly as sharp as the Moutohora sample. The high proportion of quartz held in a strong
matrix would suggest that the chip would have a hard, tough, durable surface that would be slow to
degrade. The frictional characteristics may vary depending on the size of the sand grains and the
proportion of broken faces.
Page 30
3 Selection of aggregates
29
Figure 3.6 Surface texture of Moutohora aggregate (1:200 scale)
Figure 3.7 Crystals of larnite on the surface of EAF slag (1:200 scale)
Page 31
Abrasion resistance of aggregates in asphalt
30
Figure 3.8 Surface of Te Matai aggregate (1:200 scale)
Page 32
4 Laboratory evaluation of engineering characteristics
31
4 Laboratory evaluation of engineering characteristics
4.1 Aggregate source properties
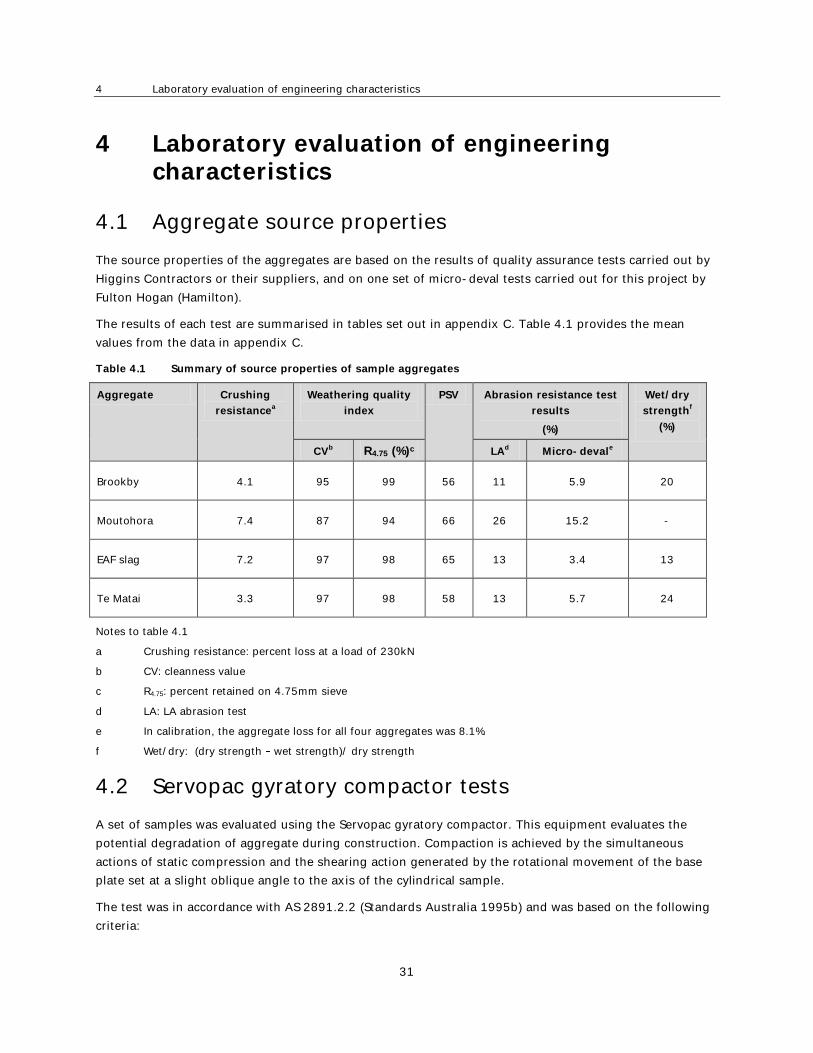
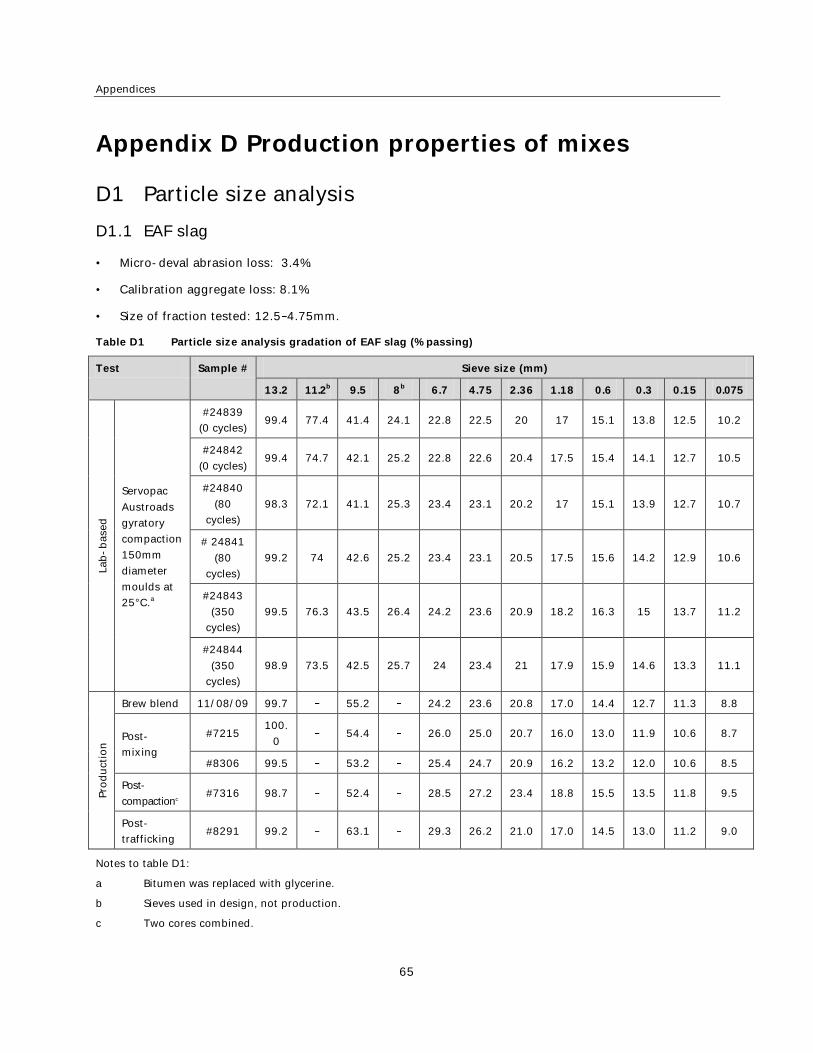
The source properties of the aggregates are based on the results of quality assurance tests carried out by
Higgins Contractors or their suppliers, and on one set of micro-deval tests carried out for this project by
Fulton Hogan (Hamilton).
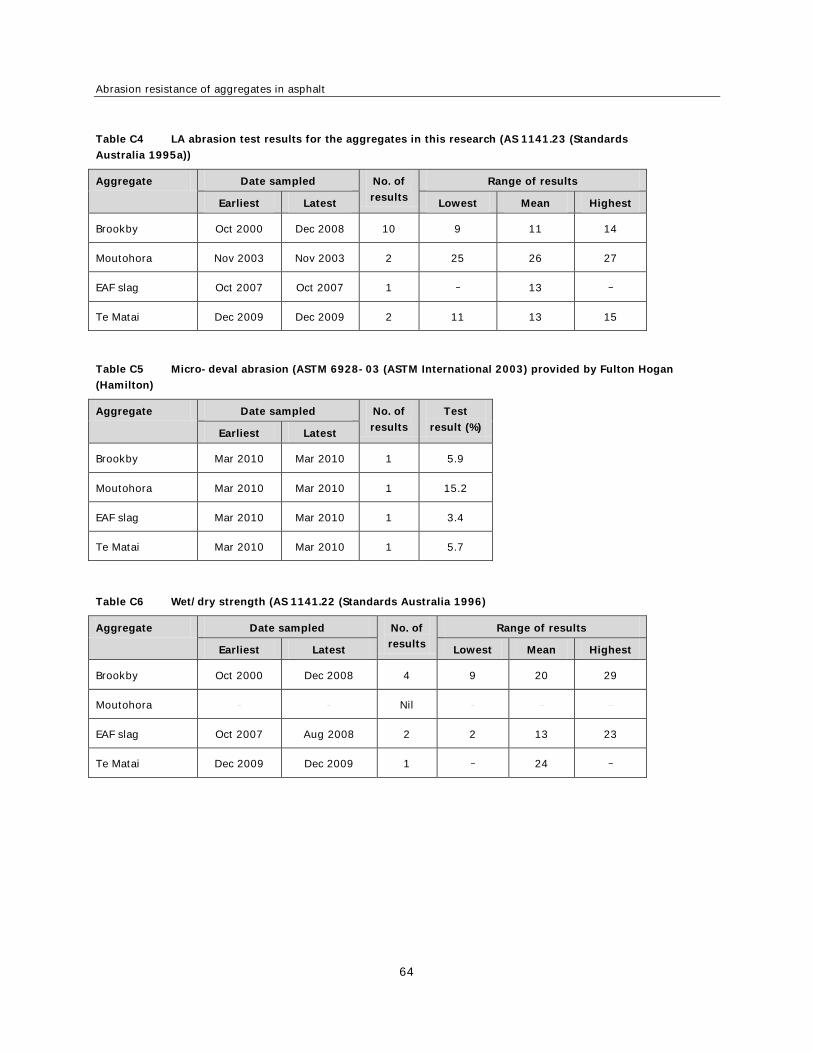
The results of each test are summarised in tables set out in appendix C. Table 4.1 provides the mean
values from the data in appendix C.
Table 4.1 Summary of source properties of sample aggregates
Aggregate Crushing
resistancea
Weathering quality
index
PSV Abrasion resistance test
results
(%)
Wet/dry
strengthf
(%)
CVb R4.75 (%)c LAd Micro-devale
Brookby 4.1 95 99 56 11 5.9 20
Moutohora 7.4 87 94 66 26 15.2 -
EAF slag 7.2 97 98 65 13 3.4 13
Te Matai 3.3 97 98 58 13 5.7 24
Notes to table 4.1
a Crushing resistance: percent loss at a load of 230kN
b CV: cleanness value
c R4.75: percent retained on 4.75mm sieve
d LA: LA abrasion test
e In calibration, the aggregate loss for all four aggregates was 8.1%.
f Wet/dry: (dry strength wet strength)/ dry strength
4.2 Servopac gyratory compactor tests
A set of samples was evaluated using the Servopac gyratory compactor. This equipment evaluates the
potential degradation of aggregate during construction. Compaction is achieved by the simultaneous
actions of static compression and the shearing action generated by the rotational movement of the base
plate set at a slight oblique angle to the axis of the cylindrical sample.
The test was in accordance with AS 2891.2.2 (Standards Australia 1995b) and was based on the following
criteria:
Page 33
Abrasion resistance of aggregates in asphalt
32
• mould diameter =150mm
• ram pressure = 240kPA
• rate of rotation = 60 cycles per minute
• base plate compaction angle = 3 .
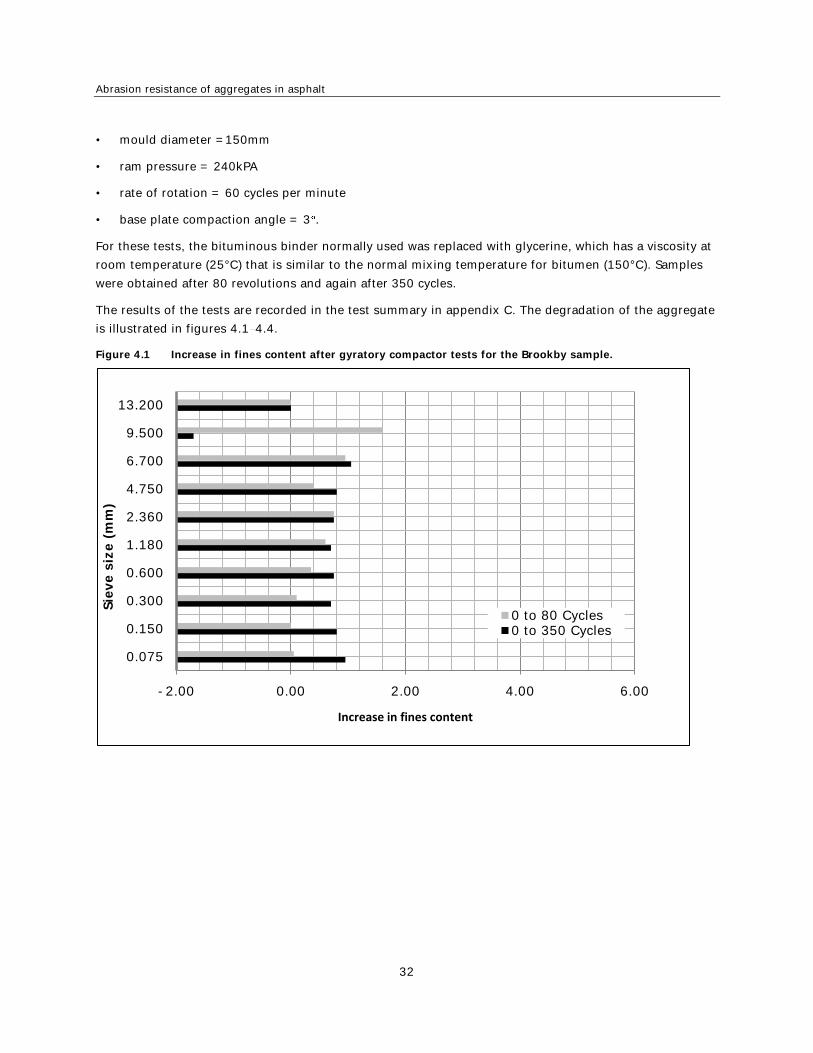
For these tests, the bituminous binder normally used was replaced with glycerine, which has a viscosity at
room temperature (25°C) that is similar to the normal mixing temperature for bitumen (150°C). Samples
were obtained after 80 revolutions and again after 350 cycles.
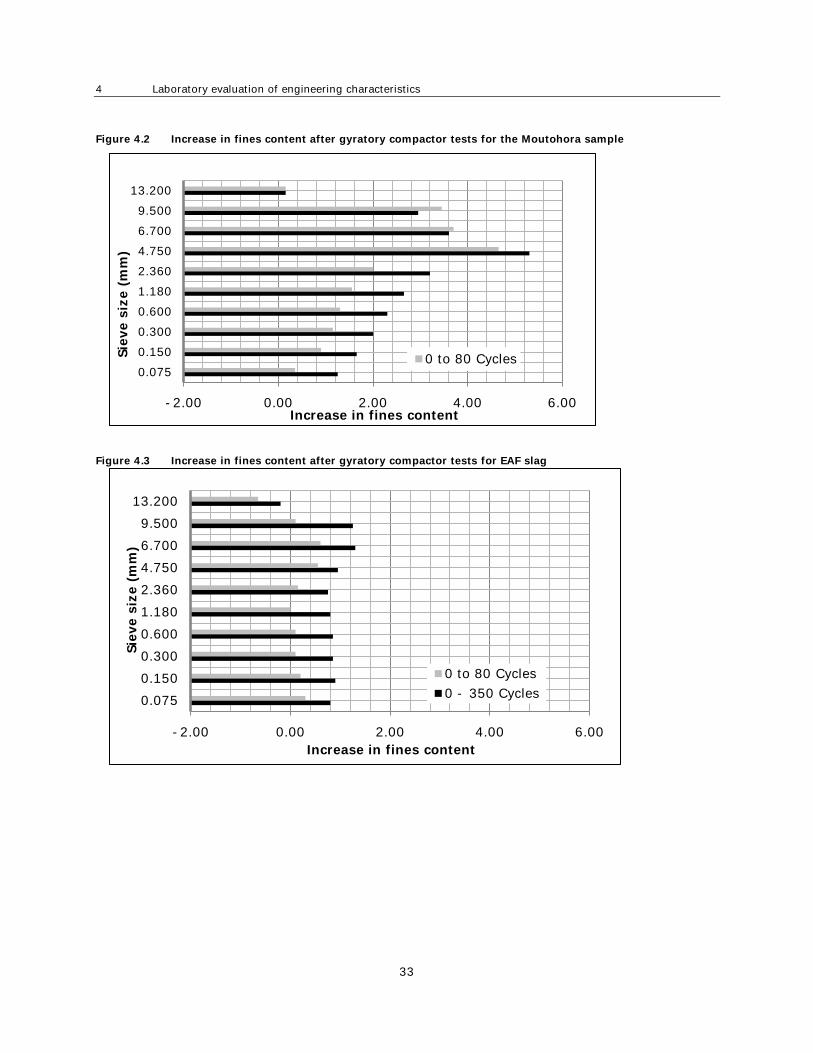
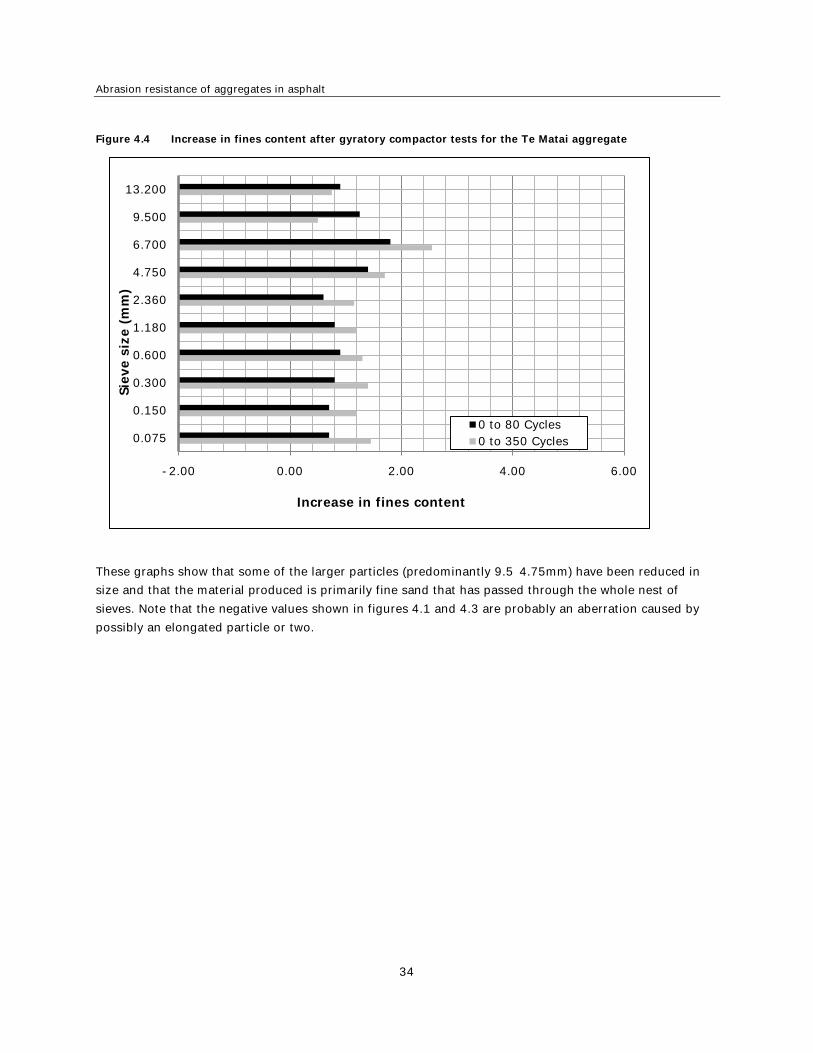
The results of the tests are recorded in the test summary in appendix C. The degradation of the aggregate
is illustrated in figures 4.1 4.4.
Figure 4.1 Increase in fines content after gyratory compactor tests for the Brookby sample.
-2.00 0.00 2.00 4.00 6.00
13.200
9.500
6.700
4.750
2.360
1.180
0.600
0.300
0.150
0.075
Increase in fines content
Sie
ve s
ize (
mm
)
0 to 80 Cycles0 to 350 Cycles
Page 34
4 Laboratory evaluation of engineering characteristics
33
Figure 4.2 Increase in fines content after gyratory compactor tests for the Moutohora sample
Figure 4.3 Increase in fines content after gyratory compactor tests for EAF slag
-2.00 0.00 2.00 4.00 6.00
13.200
9.500
6.700
4.750
2.360
1.180
0.600
0.300
0.150
0.075
Increase in fines content
Sie
ve s
ize (
mm
)
0 to 80 Cycles
-2.00 0.00 2.00 4.00 6.00
13.200
9.500
6.700
4.750
2.360
1.180
0.600
0.300
0.150
0.075
Increase in fines content
Sie
ve s
ize (
mm
)
0 to 80 Cycles
0 - 350 Cycles
Page 35
Abrasion resistance of aggregates in asphalt
34
Figure 4.4 Increase in fines content after gyratory compactor tests for the Te Matai aggregate
These graphs show that some of the larger particles (predominantly 9.5 4.75mm) have been reduced in
size and that the material produced is primarily fine sand that has passed through the whole nest of
sieves. Note that the negative values shown in figures 4.1 and 4.3 are probably an aberration caused by
possibly an elongated particle or two.
-2.00 0.00 2.00 4.00 6.00
13.200
9.500
6.700
4.750
2.360
1.180
0.600
0.300
0.150
0.075
Increase in fines content
Sie
ve s
ize (
mm
)
0 to 80 Cycles
0 to 350 Cycles
Page 36
5 Test sections
35
5 Test sections
5.1 Introduction
As discussed earlier, the original concept of sampling and testing material from existing pavements was
replaced by a plan to construct test sections under controlled conditions and then to sample and test from
each test section. By this means, it was possible to measure the changes that occurred in the layers that
were constructed using aggregates from four different sources.
The mix used for each test section was designed and manufactured by Higgins Contractors to meet the
requirements of National asphalt specification NAS 2004 (Australian Asphalt Pavement Association 2004).
The manufacture, laying and compaction of the mix followed protocols developed by Higgins Contractors
to meet the requirements of the relevant NZTA or local authority specifications.
The test sections were 40mm (nominal) thick.
All the test work related to the test sections was carried out at Higgins Laboratory at East Tamaki.
5.2 Location
5.2.1 Auckland
Three test sections of SMA were laid in the aggregate storage area at Higgins Contractors Auckland yard
in East Tamaki on 12 August 2009. The aggregates used were drawn from the Brookby Quarry south of
Auckland City, the Moutohora Quarry north of Gisborne and the EAF slag from Pacific Steel in
Auckland.
Samples of the mix prior to laying were collected from the feed chute conveyor as the material was
transferred from the mixer to the delivery hopper. Core samples were taken at the completion of
construction and the density of each layer was measured using a Troxler nuclear density meter. The
texture of the surface of each strip was determined using the standard sand circle test (TNZ 1981).
A further set of core samples was taken in April 2010 after eight months trafficking. The texture was re-
assessed at the same time.
The test sections were trafficked by truck and trailer units delivering aggregate to the stockpile bins.
Page 37
Abrasion resistance of aggregates in asphalt
36
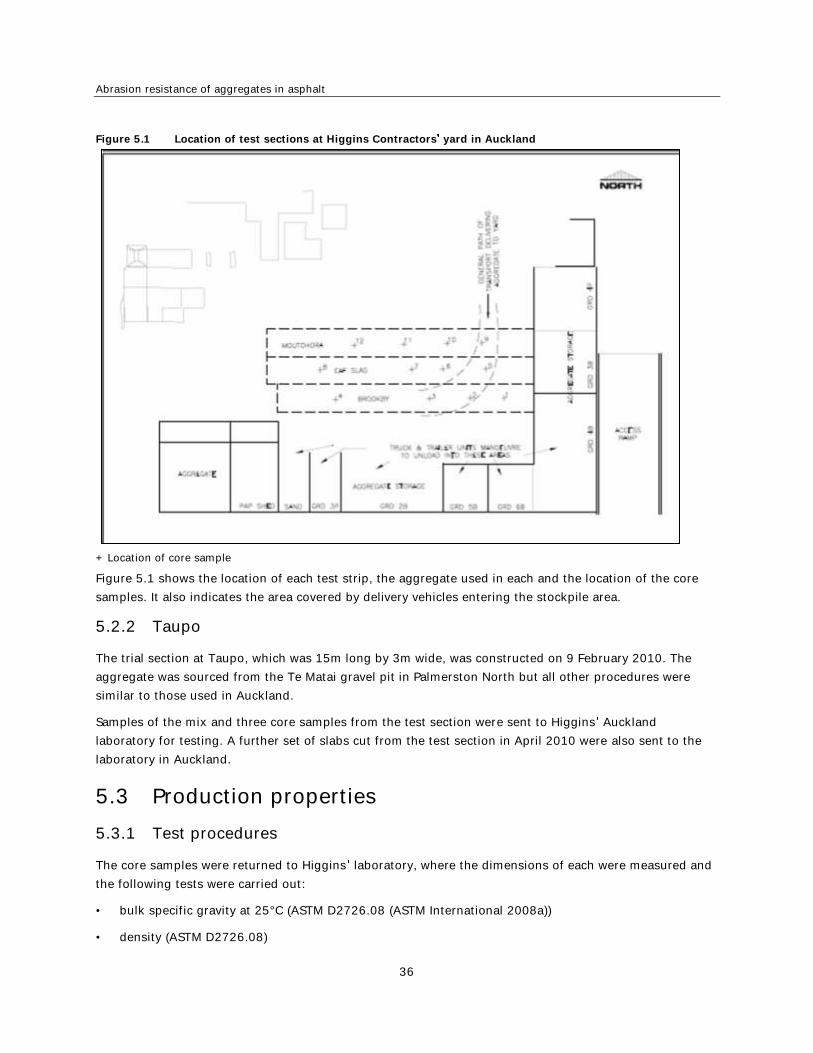
Figure 5.1 Location of test sections at Higgins Contractors yard in Auckland
+ Location of core sample
Figure 5.1 shows the location of each test strip, the aggregate used in each and the location of the core
samples. It also indicates the area covered by delivery vehicles entering the stockpile area.
5.2.2 Taupo
The trial section at Taupo, which was 15m long by 3m wide, was constructed on 9 February 2010. The
aggregate was sourced from the Te Matai gravel pit in Palmerston North but all other procedures were
similar to those used in Auckland.
Samples of the mix and three core samples from the test section were sent to Higgins Auckland
laboratory for testing. A further set of slabs cut from the test section in April 2010 were also sent to the
laboratory in Auckland.
5.3 Production properties
5.3.1 Test procedures
The core samples were returned to Higgins laboratory, where the dimensions of each were measured and
the following tests were carried out:
• bulk specific gravity at 25°C (ASTM D2726.08 (ASTM International 2008a))
• density (ASTM D2726.08)
Page 38
5 Test sections
37
• water absorption (ASTM D2726.08)
• percentage air voids (ASTM D3203.05 (ASTM International 2005a)).
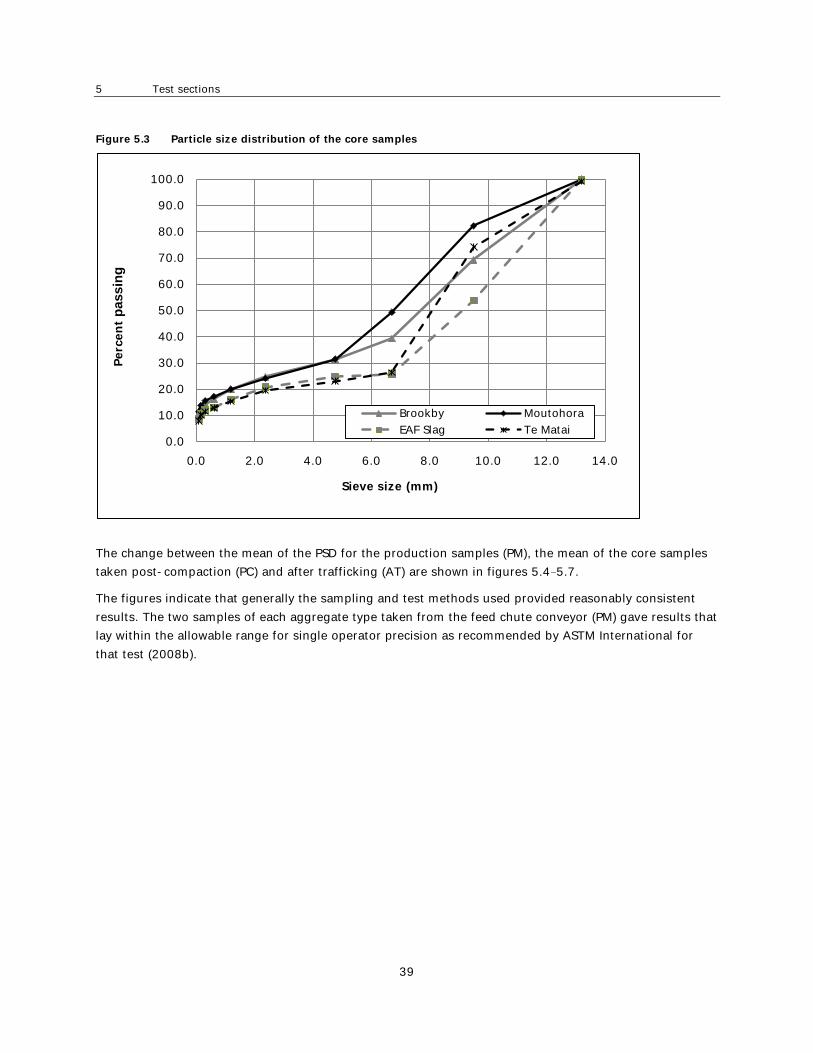
Subsequently, the bitumen was extracted from the core samples, all cut stone was removed, and the PSD
of the aggregate and the bitumen content were determined. Similarly, the bitumen was removed from the
samples of uncompacted mix, and the PSD of the aggregate and the bitumen content were determined
using the standard tests: ASTM D979-01(2006)e1, procedure 5.2.5 (ASTM International 2006), ASTM
D2172.05 (ASTM International 2005b) and ASTM D5444.08 (ASTM International 2008b).
The results of these tests are summarised in appendix B.
5.3.2 Test results
5.3.2.1 Density, water absorption and air voids after construction
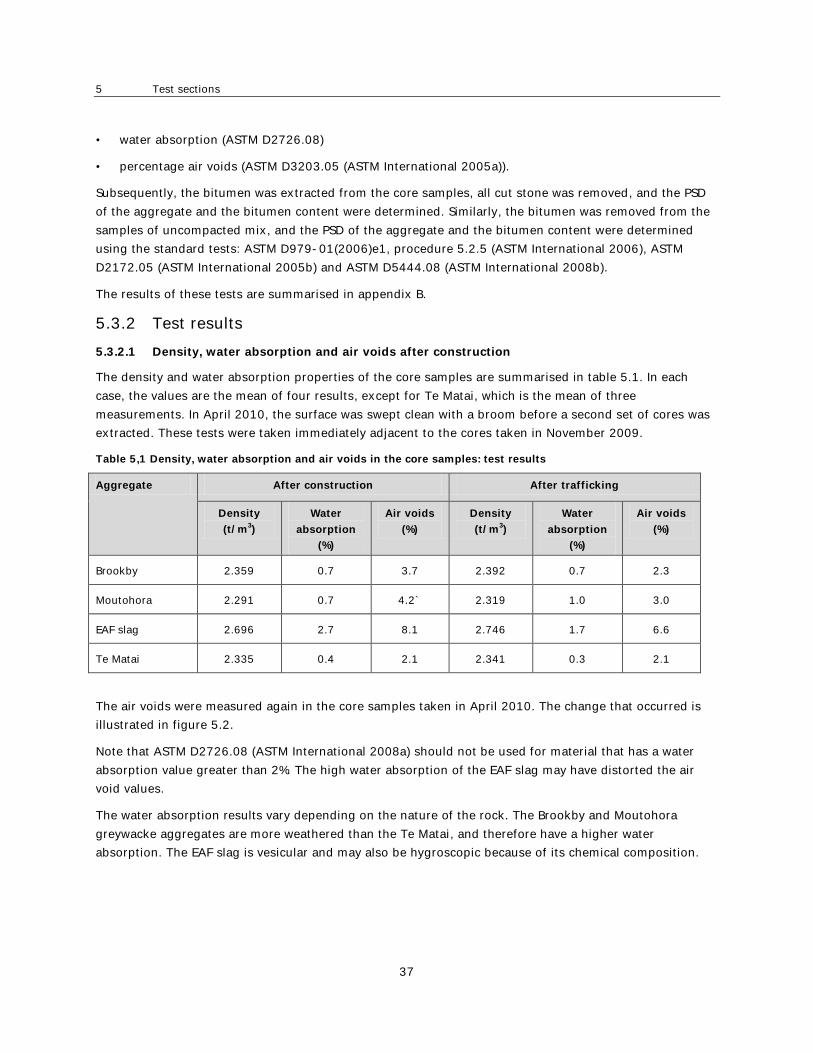
The density and water absorption properties of the core samples are summarised in table 5.1. In each
case, the values are the mean of four results, except for Te Matai, which is the mean of three
measurements. In April 2010, the surface was swept clean with a broom before a second set of cores was
extracted. These tests were taken immediately adjacent to the cores taken in November 2009.
Table 5,1 Density, water absorption and air voids in the core samples: test results
Aggregate After construction After trafficking
Density
(t/m3)
Water
absorption
(%)
Air voids
(%)
Density
(t/m3)
Water
absorption
(%)
Air voids
(%)
Brookby 2.359 0.7 3.7 2.392 0.7 2.3
Moutohora 2.291 0.7 4.2` 2.319 1.0 3.0
EAF slag 2.696 2.7 8.1 2.746 1.7 6.6
Te Matai 2.335 0.4 2.1 2.341 0.3 2.1
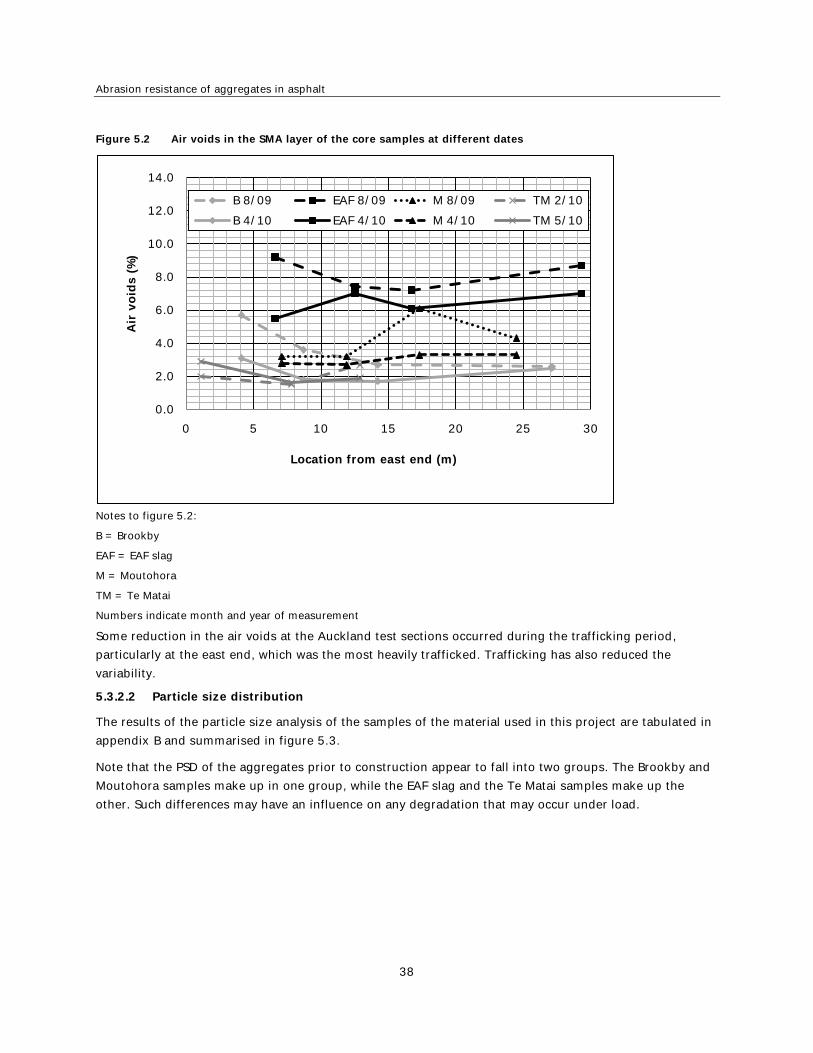
The air voids were measured again in the core samples taken in April 2010. The change that occurred is
illustrated in figure 5.2.
Note that ASTM D2726.08 (ASTM International 2008a) should not be used for material that has a water
absorption value greater than 2%. The high water absorption of the EAF slag may have distorted the air
void values.
The water absorption results vary depending on the nature of the rock. The Brookby and Moutohora
greywacke aggregates are more weathered than the Te Matai, and therefore have a higher water
absorption. The EAF slag is vesicular and may also be hygroscopic because of its chemical composition.
Page 39
Abrasion resistance of aggregates in asphalt
38
Figure 5.2 Air voids in the SMA layer of the core samples at different dates
Notes to figure 5.2:
B = Brookby
EAF = EAF slag
M = Moutohora
TM = Te Matai
Numbers indicate month and year of measurement
Some reduction in the air voids at the Auckland test sections occurred during the trafficking period,
particularly at the east end, which was the most heavily trafficked. Trafficking has also reduced the
variability.
5.3.2.2 Particle size distribution
The results of the particle size analysis of the samples of the material used in this project are tabulated in
appendix B and summarised in figure 5.3.
Note that the PSD of the aggregates prior to construction appear to fall into two groups. The Brookby and
Moutohora samples make up in one group, while the EAF slag and the Te Matai samples make up the
other. Such differences may have an influence on any degradation that may occur under load.
0.0
2.0
4.0
6.0
8.0
10.0
12.0
14.0
0 5 10 15 20 25 30
Air
void
s (
%)
Location from east end (m)
B 8/09 EAF 8/09 M 8/09 TM 2/10
B 4/10 EAF 4/10 M 4/10 TM 5/10
Page 40
5 Test sections
39
Figure 5.3 Particle size distribution of the core samples
The change between the mean of the PSD for the production samples (PM), the mean of the core samples
taken post-compaction (PC) and after trafficking (AT) are shown in figures 5.4 5.7.
The figures indicate that generally the sampling and test methods used provided reasonably consistent
results. The two samples of each aggregate type taken from the feed chute conveyor (PM) gave results that
lay within the allowable range for single operator precision as recommended by ASTM International for
that test (2008b).
0.0
10.0
20.0
30.0
40.0
50.0
60.0
70.0
80.0
90.0
100.0
0.0 2.0 4.0 6.0 8.0 10.0 12.0 14.0
Perc
ent
passin
g
Sieve size (mm)
Brookby Moutohora
EAF Slag Te Matai
Page 41
Abrasion resistance of aggregates in asphalt
40
Figure 5.4 Means of the PSD for the production samples (PM), core samples post-compaction (PC) and after
trafficking (AT) for the Brookby aggregate
Figure 5.5 Means of the PSD for the production samples (PM), core samples post-compaction (PC) and after
trafficking (AT) for the Moutohora aggregate
0.0
10.0
20.0
30.0
40.0
50.0
60.0
70.0
80.0
90.0
100.0
0.0 2.0 4.0 6.0 8.0 10.0 12.0 14.0
Perc
en
t p
assin
g
Sieve size (mm)
PM PC AT
0.0
10.0
20.0
30.0
40.0
50.0
60.0
70.0
80.0
90.0
100.0
0.0 2.0 4.0 6.0 8.0 10.0 12.0 14.0
Perc
ent
passin
g
Sieve size (mm)
PM PC AT
Page 42
5 Test sections
41
Figure 5.6 Means of the PSD for the production samples (PM), core samples post-compaction (PC) and after
trafficking (AT) for the EAF slag
Figure 5.7 Means of the PSD for the production samples (PM), core samples post-compaction (PC) and after
trafficking (AT) for the Te Matai aggregate
0.0
10.0
20.0
30.0
40.0
50.0
60.0
70.0
80.0
90.0
100.0
0.0 5.0 10.0 15.0
Perc
ent
passin
g
Sieve size (mm)
PM PC AT
0.0
10.0
20.0
30.0
40.0
50.0
60.0
70.0
80.0
90.0
100.0
0.0 2.0 4.0 6.0 8.0 10.0 12.0 14.0
Perc
en
t p
assin
g
Sieve size (mm)
PM PC AT
Page 43
Abrasion resistance of aggregates in asphalt
42
A comparison of the gradings after compaction and some trafficking is shown in figure 5.8. This graph is
based on the mean PSD post-compaction and after trafficking, ie. (PC + AT)/2.
Figure 5.8 Mean of the core samples post construction and after trafficking for all samples
0.0
10.0
20.0
30.0
40.0
50.0
60.0
70.0
80.0
90.0
100.0
0.0 2.0 4.0 6.0 8.0 10.0 12.0 14.0
Perc
en
t p
assin
g
Sieve size (mm)
Brookby Moutohora
EAF Slag Te Matai
Page 44
5 Test sections
43
Figure 5.9 Degradation of sample aggregates caused by construction, measured as the difference between
mean PSD for the production samples (PM) and post-compaction (PC)
Figure 5.9, based on the difference in the percentage passing each sieve, shows that all of the aggregates
suffered some breakdown, particularly in the larger size range. Most of the material that was generated
was sand. The negative values, particularly in the larger stone sizes, may result from test error or the
presence of elongated particles. Such values for the smaller sieve sizes could be a result of the production
of more fines.
-2.0
-1.0
0.0
1.0
2.0
3.0
4.0
5.0
6.0
7.0
8.0
13.2009.5006.7004.7502.3601.1800.6000.3000.1500.075
Difference between PC
and PM
Sie
ve s
ize
(mm
)
Brookby Moutohora
EAF Slag Te Matai
Page 45
Abrasion resistance of aggregates in asphalt
44
Figure 5.10 Degradation of sample aggregates caused by trafficking, measured as the difference between the
mean PSD post-compaction (PC) and after trafficking (AT)
Figure 5.10 shows that little or no change was caused by traffic. Note that the extreme positive value for
EAF slag could be an anomaly in the AT sample or may result from a collapse of particles during
trafficking.
The traffic loading was primarily created by truck and trailer units delivering aggregate to the plant
stockpiles but was applied over a relatively short period of time. The units generally carried 29 30 tonne
payloads and were estimated to apply a loading to the pavement equivalent to four standard 18kN axle
loads (ie four equivalent standard axles (ESA) per truck and trailer unit). The units travelled over different
paths as they were manoeuvred into position to unload (refer to figure 5.1) and, as a consequence, the
estimated wear on each test section can only be a best guess . However, it is possible that the most
frequently loaded section (probably at the east end) carried something in the order of 20,000ESA over the
period.
It should be noted that other investigations similar in nature to this project have shown that degradation
can occur during trafficking.
5.3.2.3 Surface texture
The texture of the surface of each section was measured immediately after construction using the
standard sand circle test. A second set of measurements was taken in April 2010.
-10.0 -8.0 -6.0 -4.0 -2.0 0.0 2.0 4.0 6.0 8.0 10.0 12.0
13.200
9.500
6.700
4.750
2.360
1.180
0.600
0.300
0.150
0.075
Fine sand
Difference between PC and AT
Sie
ve s
ize (
mm
)
Brookby
Moutohora
EAF Slag
Te Matai
Page 46
5 Test sections
45
The results are set out in table B1 in appendix B and summarised in the graph shown as figure 5.11. The
comparative texture at the time of construction is illustrated in figure 5.12.
Figure 5.11 Texture depth of samples at different dates
Numbers indicate month and year of measurement
0
0.5
1
1.5
0 5 10 15 20 25 30 35
Textu
re d
ep
th (
mm
)
Location (m)
Brookby 8/09 EAF Slag 8/09 Moutohora 8/09
Brookby 4/10 EAF Slag 4/10 Moutohora 4/10
Page 47
Abrasion resistance of aggregates in asphalt
46
Figure 5.12 Comparative texture of the three sections laid in Auckland
Figure 5.12 shows the difference in the texture of each section immediately after laying and after eight
months trafficking. The EAF slag, being the aggregate with the coarsest grading, has the deepest texture.
Initially, the texture of the Brookby and Moutohora aggregates was similar, although the Moutohora
aggregate showed a greater variation. After trafficking, the texture of the Brookby and EAF slag sections
showed little change but the surface of the Moutohora aggregate became almost uniform throughout its
length. However, the change is in the order of 0.1mm, which is probably within the tolerance for this type
of test.
5.3.3 Ranking and predictability
One of the objectives of this research was to review the current source property tests and acceptance
criteria to assess whether they are appropriate for durable stone-on-stone mixes.
The aggregates used in this project have been ranked in terms of the performance of each in the various
source property tests. This is shown in table 5.2
Table 5.2 Ranking in terms of the results for source and similar tests
Aggregate PSV Crushing
resistance
Weathering quality
index
Abrasion resistance
(%)
Wet/drystre
ngth
Dynamic
compactor
Cleanness
value
R4.75 LA Micro-deval
Moutohora 1 4 4 4 4 4 ? 4
EAF slag 2 3 1= 2= 2= 1 1 1
Te Matai 3 1 1= 2= 2= 2 3 2
Brookby 4 2 3 1 1 3 2 3
Brookby
EAF slag
Moutohora
Page 48
5 Test sections
47
The ranking indicates that the Moutohora aggregate, which has the best PSV, scored poorly in the tests
that indicate durability. The EAF slag, which also has good skid resistance qualities, has better strength
and durability characteristics. It has poor crushing resistance properties, but scored well in the micro-
deval and dynamic compactor tests. The other two greywacke aggregates from Brookby and Te Matai have
similar all-round source characteristics.
The properties that were predicted by the geological assessment are generally borne out by the results of
the tests. The results of the LA and micro-deval abrasion tests do not appear to be greatly different. The
micro-deval test ranked the aggregates in the same sequence as the dynamic compactor.
5.4 Degradation
5.4.1 Results
The research carried out during this project shows that the coarser particles of aggregate used in SMA
degrade during compaction. Most of the breakdown occurs in the larger particles, which can be described
as small to medium gravel. As these particles wear, they produce predominantly fine sand. This is
illustrated in figure 5.13.
Figure 5.13 Degradation caused by construction (based on material retained on each sieve), defined as the
difference between the mean PSD of the production samples (PM) and the post-conduction means (PC)
-2.0 -1.0 0.0 1.0 2.0 3.0 4.0 5.0
13.200
9.500
6.700
4.750
2.360
1.180
0.600
0.300
0.150
0.075
Fine sand
Sie
ve s
ize
(m
m)
Brookby Moutohora
EAF Slag Te Matai
Page 49
Abrasion resistance of aggregates in asphalt
48
It is therefore concluded that the degradation process involves the removal of sharp corners and edges of
the larger particles when one large particle moves against another as the mix consolidates under the
action of the steel-wheeled rollers.
5.4.2 Measurement of degradation
Degradation is usually assessed on the basis of the change in the PSD. Most researchers select the change
on one of the coarse sieve sizes (eg 4.75mm) as the correct measure. However, comparison of individual
PSD values is fraught with difficulty. Obviously, the larger particles are reduced in size during the
compaction process and move from one sieve size down to the sieve with the next smallest aperture,
while the debris may fall down a number of sizes. Figure 5.13 indicates that major changes occurred on
two or three of the larger sieves, with varying amounts of sand accumulating on the smaller sieves.
For comparing the aggregates, the change on the 6.7mm sieve appears to be the more consistent and will
be used in this instance. The material from Te Matai suffered the least change (3%), while the Brookby,
Moutohora and EAF slag aggregates suffered the greatest change (3.6 4.2%).
It was not possible to detect any degradation after seven months of traffic wear. However, the loading
period was quite short, and the movement of the truck and trailer units over the test sections was not
restricted to one path (as it would be on a highway).
5.5 Prediction of degradation
The gyratory compactor test provides a reasonably accurate model of the conditions in the SMA layer
during compaction. It was therefore expected that the results of that test would provide a good indication
of the degradation that occurred in the test sections.
A comparison of the degradation generated during the compaction of the test sections and that generated
during 350 revolutions of the gyratory compactor is shown in Figure 5.14. This graph is based on the sum
of the material retained on the larger sized sieves rather than on one particular sieve.
Page 50
5 Test sections
49
Figure 5.14 Degradation of test sections versus laboratory results
This figure indicates that the gyratory compactor could be used to provide a reasonably accurate
indication of the breakdown (30 40% at 350 revolutions) for some (but not all) rock types.
For the Moutohora aggregate, the gyratory compactor measurement was virtually equal to the field
measurement. It was noted earlier that this rock type was more weathered than the others and it may
have broken down more easily in the compactor than the others.
The micro-deval test was more accurate in predicting the degradation generated by the gyratory
compactor test but the other source property tests were of little value in this regard.
0
1
2
3
4
5
6
7
8
Core post compactionGyropactor
Perc
ent
reta
ined
on g
ravel-
siz
ed
sie
ves
Brookby Moutohora EAF Slag Te Matai
Gyratory compactor Core after compaction
Page 51
Abrasion resistance of aggregates in asphalt
50
6 Conclusions
6.1 Introduction
The objective of this project was to investigate the durability and mechanical integrity of high PSV (>60)
aggregates for HMA, particularly chips or coarse aggregates in stone-on-stone mixes such as SMA and
OGPA.
The methodology used was changed from that originally intended (for the reasons explained earlier) and,
as a consequence, the aggregates evaluated cover a much wider range of PSV values than would have been
originally possible.
One of the unsatisfactory characteristics of the stone-on-stone mixes is the potential for degradation,
which could lead to ravelling, rutting and flushing. Degradation can result from the removal of the sharp
corners as one large particle moves against another.
This project has explored some of the possible factors related to the breakdown of aggregate such as the
crushing strength and abrasion resistance, but a number of other factors, such as particle shape, have not
been evaluated.
6.2 Geology
The geological evaluation provided a good assessment of the different characteristics and potential
performance of the four types of aggregate used. It identified the properties that determine the skid
resistance and the durability of the chips, properties that are not mutually exclusive. The predictions made
from the geological assessment are generally borne out by the results of the engineering tests.
6.3 Source properties
Most of the properties determined using the source property tests had no particular relevance in terms of
the ability of the aggregate to withstand the construction process. The Moutohora aggregate had by far
the worst crushing resistance, weathering quality index and LA abrasion results, but did not degrade as
much in the test sections as would have been expected from the results of the source property tests.
The micro-deval test provided a reasonably accurate prediction of the degradation generated by the
gyratory compactor test but not the breakdown in the test sections.
6.4 The gyratory compaction test
The load applied in the gyratory compaction test on three of the four aggregates did not cause the level of
breakdown that occurred in the test sections. The one exception was the Moutohora aggregate. It is worth
noting that the test was based on the Australian standard (Standards Australia 1995b), which differs from
the American Superpave protocol in that the applied load is 40% of the Superpave requirement, while the
angle of gyration is 3° rather than 1.25°. This suggests that each country has adapted the test to suit the
Page 52
6 Conclusions
51
characteristics of the aggregate most commonly used, and it may be appropriate for New Zealand to adopt
the same approach.
6.5 Test sections
The three test sections in Auckland and the one in Taupo provided a useful source of test data for this
project. A good set of start data has been established and is recorded in the appendices. However, more
information is required about the breakdown of aggregate under traffic loading. It would therefore be
appropriate to monitor the condition of these pavements on an annual basis for a year or two to record
what changes occur.
6.6 Air voids and surface texture
The air voids and the surface texture in the test sections decreased but no apparent change in the
performance of the test sections was noted.
6.7 Degradation
All the aggregates in the test sections suffered degradation during compaction but to varying degrees.
The coarser gravel-sized particles degraded to release mainly fine sand particles.
Opinion differs regarding the measurement of degradation. Some prefer the change on one sieve size, but
others consider the change on a range of sieves may be a better measure. The volume of sand produced
could also be used.
6.8 Degradation from traffic
The PSD of the aggregates in the test sections in Auckland changed little during the seven-month
trafficking period, even though the trucks that used the test area were heavily loaded (4ESA per unit). This
result was different to that experienced in Grafton Gully (described in section 1.4). One reason could be
the short period of time but it may also be caused by the different loading conditions between the test
sections and the motorway in Grafton Gully.
At Higgins yard, the trucks delivering aggregate to the stockpiles were virtually unrestrained except that
most crossed the test sections at the east end. On a motorway, the traffic is virtually confined so that the
wheels travel down two paths, each approximately 700mm wide. So while the loading applied by each
truck and trailer unit delivering aggregate to the yard was relatively high, the number of passes over one
particular area varied and was probably comparatively low.
Page 53
Abrasion resistance of aggregates in asphalt
52
7 Recommendations
It is recommended that monitoring of the changes in the surface texture and the PSD of the test sections
be continued for at least two years.
It is also recommended that various types of specification for the use of the gyratory compactor should be
evaluated to establish the most suitable protocol for New Zealand aggregates.
Page 54
8 References
53
8 References
ASTM International (2003) Standard method of test for resistance of coarse aggregate to degradation by
abrasion in the micro-deval apparatus. ASTM D6928-03. West Conshohocken, PA: ASTM International.
5pp.
ASTM International (2005a) Standard test method for percent air voids in compacted dense and open
bituminous paving mixtures. ASTM D3203-05. West Conshohocken, PA: ASTM International. 2pp.
ASTM International (2005b) Standard test methods for quantitative extraction of bitumen from bituminous
paving mixtures. ASTM D2172-05. West Conshohocken, PA: ASTM International. 13pp.
ASTM International (2006) Standard practice for sampling bituminous paving mixtures. ASTM D979-
01(2006)e1. West Conshohocken, PA: ASTM International. 3pp.
ASTM International (2008a) Standard test method for bulk specific gravity and density of non-absorptive
compacted bituminous mixtures. ASTM D2726-08. West Conshohocken, PA: ASTM International. 3pp.
ASTM International (2008b) Standard test method for mechanical size analysis of extracted aggregate.
ASTM D5444-08. West Conshohocken, PA: ASTM International. 3pp.
Arnold, G (2006) RNZ/Transit NZ supplement to the AAPA National Asphalt Specification April 2004
version 2 (NAS). Accessed 19 October 2010. http://www.nzta.govt.nz/resources/national-asphalt-
specification/docs/TM-6002-v1.pdf.
Asphalt Institute (2001) Superpave mix design. Superpave series No. 2 (SP-02). Lexington KY, USA: Asphalt
Institute.
Australian Asphalt Pavement Association (AAPA) (2004) National asphalt specification. Second edition.
Kew, Vic., Australia: AAPA. 48pp.
BCA 9808: specification for stone mastic asphalt. Wellington:
Bjarnason, G, P Peturrson and S Erlingson (2002) Quality assessment of aggregates for road construction.
Proceedings from 9th
Nordic Aggregate Conference, Reykjavik, Iceland. 6pp.
Boyle, T (2005) Skid resistance management on the Auckland State Highway network. Transit NZ Surface
Friction Conference, Christchurch, May 2005. 15pp.
British Standards Institution (2000) Tests for mechanical and physical properties of aggregates.
Determination of the polished stone value BS EN 1097-8:2000. London: British Standards Institution.
34pp.
Gatchalin, D, E Masad, A Chowdhury and D Little (2006) Characterisation of aggregate resistance to
degradation in stone matrix asphalt mixtures. Journal of the Transportation Research Board No. 1962:
55 63.
Henderson, R, G Cook, P Cenek, J Patrick and S Potter (2006) The effect of crushing on the skid resistance
of chipseal roads. Land Transport New Zealand research report 295. Wellington: Land Transport
New Zealand. 132pp.
Page 55
Abrasion resistance of aggregates in asphalt
54
Herrington, P, S Reilly S and S Cook (2005) Porous asphalt durability test. Transfund New Zealand research
report 265. Wellington: Transfund New Zealand. 32pp.
Newby G (2005) SMA 14 surface flushing evaluation and remediation report. Auckland: Grafton Gully to
Central Auckland Alliance.
Owen, MT and J Donbavand (2005) There is a fraction, too little friction. Transit NZ Surface Friction
Conference, Christchurch, May 2005. 9pp.
Poulikakous, LD and S Takahashi (2004) A comparison of Swiss and Japanese porous asphalt through
various mechanical tests. Swiss Transport Research Conference, Ascona, Switzerland, March
2003.15pp.
Powell, BD, J Zhang and ER Brown (2005) Aggregate durability and the performance of Superpave designed
hot mix asphalt. National Cooperative Highway Research Program Report 539. Washington DC:
National Cooperative Highway Research Program. 90pp.
Standards Australia (1995a) Methods for sampling and testing aggregates Los Angeles value.
AS 1141.23-2009. Sydney: Standards Australia. 8pp.
Standards Australia (1995b) Methods of sampling and testing asphalt sample preparation compaction
of asphalt test specimens using a gyratory compactor. AS 2891.2.2. Sydney: Standards Australia. 4pp.
Standards Australia (1996) Methods for sampling and testing aggregates wet/dry strength variation.
AS 1141.22-1996. Sydney: Standards Australia. 10pp.
Standards New Zealand (1991a) Methods of sampling and testing road aggregates methods of testing
road aggregates laboratory tests test 3.10: the crushing resistance of coarse aggregate under a
specific load. NZS 4407.3.10:1991. Wellington: Standards New Zealand. 4pp.
Standards New Zealand (1991b) Methods of sampling and testing road aggregates methods of testing
road aggregates laboratory tests test 3.11: the weathering quality index of coarse aggregate.
NZS 4407.3.11:1991. Wellington: Standards New Zealand. 4pp.
Sullivan, BW (2005) Development of a fundamental skid resistance asphalt mix design procedure. Transit
NZ Surface Friction Conference, Christchurch, May 2005.15pp.
Transit New Zealand (TNZ) (1981) Texture by the sand circle method measurements. TNZ specification
T/3. Wellington: Transit New Zealand. 2pp.
TNZ (2004a) Specification for basecourse aggregate. TNZ specification M/4: 2006. Wellington: TNZ. 15pp.
TNZ (2004b) Specification for sealing chip. TNZ specification M/6: 2004. Wellington: TNZ. 4pp.
TNZ (2005) Specification for asphaltic concrete. TNZ M/10: 2005. Wellington: TNZ. 9pp.
TNZ (2007a) Specification for open graded porous asphalt. P/11:2007. Wellington: Transit New Zealand.
10pp.
TNZ (2007b) Notes to specification for open graded porous asphalt. Specification P/11(Notes): 2007.
Wellington: Transit New Zealand.
Towler, J and H Stevenson (2000) The development of Transit New Zealand M/21 pilot specification for
high polished stone value sealing chips. Proceedings of the Institute of Quarrying New Zealand Branch
Page 56
8 References
55
and the Aggregate and Quarry Association of New Zealand Inc. 32nd
Annual Conference, Blenheim, July
2000. 11pp.
Winstone Aggregates (2007) Gripchip™. Accessed 19 October 2010.
http://www.winstoneaggregates.co.nz/Downloads/4588_WI_GripChip_flyer_proof.pdf.
Woodward, WDH, AR Woodside and JH Jellie (2005) Higher PSV and other aggregate properties. Transit NZ
Surface Friction Conference, Christchurch, May 2005. 12pp.
Page 57
Abrasion resistance of aggregates in asphalt
56
Page 58
Appendices
57
Appendix A Abbreviations and acronyms
AAPA: Australian Asphalt Pavement Association
EAF: electric arc furnace
ESA: equivalent standard axles
HMA: hot mix asphalt
LA: Los Angeles
NAS: National asphalt specification
NZTA: NZ Transport Agency
OGPA: open graded porous asphalt
PSD: particle size distribution
PSV: polished stone value
SH: State Highway
SHRP: Strategic Highway Research Programme
SMA: stone mastic asphalts
TNZ: Transit New Zealand
US: United States
Page 59
Abrasion resistance of aggregates in asphalt
58
Page 60
Appendices
59
Appendix B Geological aspects of stone polishing
B1 Introduction
The association between the inherent properties of the rock and its resistance to polishing under traffic is
based on grain size and the hardness of the minerals. In general, the following tend to hold:
• Rocks composed of minerals with similar hardness polish uniformly.
• The rate of polishing is related to the hardness of the minerals and the variation in grain size of the
minerals.
• Large grains take longer to polish than smaller grains, and will stand proud above the general surface
of the rock and retain the microtexture of the surface for longer.
• Rocks with fine grain sizes polish more quickly than those with coarse grains.
• Rocks comprised of minerals with a wide range of hardness are more resistant to polishing.
The sand grains in greywacke rocks are chemically and physically the strongest components of the rock.
All greywackes contain fragments of quartz (a hard, tough mineral) and physically strong grains of sand.
The size, angular shape and the degree of grain size sorting may vary throughout the deposit so that a
variation in the ease of polishing could be expected. The sand grains are held in a matrix of clay and other
cementing minerals (zeolites, quartz and calcite). In the case of clastic sediments, such as the greywackes,
the degree of induration and the level of diagenesis/metamorphism, which determines the level of
cementation, is important.
Diagenesis is any chemical, physical or biological change undergone by a sediment after its initial
deposition, and during and after its lithification, exclusive of surface alteration (weathering) and
metamorphism. After deposition, sediments are compacted as they are buried beneath successive layers
of material and eventually become cemented by minerals that precipitate from a solution. These changes
happen at relatively low temperatures and pressures, and result in changes to the rock's original
mineralogy and texture. Grains of sediment, rock fragments and fossils can be replaced by other minerals
during diagenesis. The boundary between diagenesis and metamorphism, which occurs under conditions
of higher temperature and pressure, is gradational.
During diagenesis, it is usual for clay minerals to wrap around the detrital fragments. Many of the clay
minerals within the rock absorb water and swell. As a consequence, the cement holding the matrix
together will weaken when exposed to the weather so that the harder grains can be dislodged. This
process will revive the skid-resistant qualities of rock chips exposed on the surface of a road. For
example, the matrix holding partially polished grains in sealing chip can be removed by traffic to expose
fresh unpolished grains. Hence the long-term durability and skid resistance of sealing chip is related to
the weathering characteristics of the rock.
While most of the chips studied during this project were produced from sedimentary rocks, chips
produced from igneous rock types or from slag produced during the manufacture of steel may have
similar characteristics depending on the chemical composition and the mode of formation. For example,
the EAF slag used in this project has a surface roughness because of the vesicles formed during
Page 61
Abrasion resistance of aggregates in asphalt
60
manufacture. In addition, the presence of larnite and wustite minerals make it a very hard, durable
material.
The skid resistant properties of aggregate result from the presence of hard rock fragments contained
within a softer matrix. The action of rubber tyres then polishes the hard rock fragments and also erodes
the matrix. Eventually, a polished fragment is dislodged and the matrix is removed to expose other sharp
fragments in the layer below.
Many greywacke quarries produce high PSV aggregate described as being either slightly brown (oxidised)
or moderately weathered. This material will have a lower crushing resistance value than fresh rock from
the same quarry, but the fresh rock will probably have a lower PSV. However, the durability of the partially
weathered rock, particularly in wet situations, is likely to be in doubt.
The grains of EAF slag are welded together at high temperatures and rock has vesicles through which gas
has escaped during manufacture. The surface of the aggregate formed from the slag is therefore highly
irregular and sharp. It also contains large crystals of larnite (dicalcium silicate), which has an inherent
toughness that is considered to be good. Wustite, the other mineral in the slag, also has a high degree of
toughness. While dicalcium silicates commonly carbonate when exposed to the atmosphere, this does not
apparently affect the hardness.
B2 Hardness
Most common rock-forming minerals are solid solutions with a chemical composition that varies within
the constraints of the mineral formula. Their physical properties vary with the chemical composition. Most
are anisotropic so that the physical properties, such as hardness, vary with the orientation of the mineral.
The relative hardness of minerals can be assessed using the Mohs scale, which ranks the ability of one
mineral to abrade or scratch another. The Mohs scale has a range of 1 to 10, with talc having a value of 1
while diamond has a value of 10. Absolute hardness can be assessed using the Vickers microhardness test
indentation hardness or microhardness. Recent advances in nanotechnology provides hardness data from
Depth Sensing Nanoindentation experiments. Both tests provide absolute hardness data relative to the
crystal plane measured.
Only a few of the minerals in the Mohs hardness scale form rocks and are relevant to a study of
aggregates. These are calcite, quartz and corundum. Table B1 contains comparative data for a range of
minerals found in New Zealand aggregates.
Page 62
Appendices
61
Table B1 Summary of properties of minerals found in New Zealand rocks
Mineral Density Hardness scale Fracture properties Toughness Found in
Mohs Vickers*
Quartz 2.65 7 12.2 Conchoidal fracture Good (1.60) Greywacke
Olivine 3.3 3.6 7 10.3 Conchoidal fracture Good Basalt
K-feldspar 2.56
6 6.5 6.9 Two sets of perfect to
good cleavages Poor (0.88)
Basalt, dacite, andesite
and greywacke Na-feldspar 2.62
Ca-feldspar 2.73
Larnite and
Ca2SiO4 3.3 6 One distinct cleavage Good EAF slag
Magnetite 5.2 5.5 6 5.0 No cleavage Excellent (1.42?) Basalt
Pyroxene 3.2 3.5 5 6 4.9 (Est) Two sets of good
cleavage Poor Volcanic rocks and
detrital grains in many
greywackes Amphibole
(hornblende) 3.0 3.4 5 6
Two sets of good
cleavage
Poor, except
when fibrous
Laumontite 2.3 3 4 Two sets of cleavages;
very brittle Poor
Greywackes as veins and in
the matrix of some rocks
Calcite 2.7 3 1.5 Perfect cleavages Poor to good Greywackes
Chlorite 2.6 3.4 2.5 Platy: perfect cleavage Poor to tough.
Flexible sheets Greywackes
Clay
minerals 2 2.5
Platy: perfect cleavage
parallel to sheets
Poor to tough.
Flexible sheets
Greywackes, altered/
weathered rocks
* In GPa
B3 Mineral fracture behaviour and toughness
Toughness is the resistance of a mineral to fracture when subjected to impact stress from a high strain
rate. Mineral toughness is different from mineral hardness.
Each mineral has a unique crystal structure with lattice planes that are held together by forces with
variable strengths. Brittle minerals fail first along planes of minimum strength in the crystal structure.
These planes are called cleavages. In geological terms, the toughness of a mineral is graded as poor, fair,
good, excellent or exceptional. Data for the toughness of rock-forming minerals is very limited. The data
that is available for minerals relevant to aggregates is listed in table B1. The nonlinear relationship
between hardness and toughness is illustrated in figure B1.
Natural volcanic glass has a Mohs value between 5 and 6, and has brittle fracture properties similar to that
of quartz but notably higher than other silicate minerals in volcanic rocks. The layer silicates (clay
minerals) are the softest and least competent components of rocks.
Page 63
Abrasion resistance of aggregates in asphalt
62
Figure B1 Mineral toughness and hardness of rock-forming materials
0.0
0.5
1.0
1.5
2.0
2.5
3.0
0 5 10 15 20 25
Toughness
(MPa/m
2)
Hardness (GPa)
Orthoclase
Quartz
Corundum
Calcite
Page 64
Appendices
63
Appendix C Source properties of aggregates
The following information (tables C1 C6) is based on quality assurance test results provided by Higgins
Contractors and/or their suppliers, except when stated otherwise.
Table C1 Crushing resistance properties of the aggregates in this research (NZS 4407 test 3.10 (Standards
New Zealand 1991a)) percent loss for a load of 230kN
Aggregate Date sampled No. of
results
Range of results
Earliest Latest Lowest Mean Highest
Brookby Oct 2000 Oct 2009 10 2.9 4.1 7.2
Moutohora Sep 2002 Aug 2005 7 5.1 7.4 9.1
EAF slag Sep 2006 Dec 2009 6 4.7 7.2 9.5
Te Matai Aug 1998 Dec 2009 9 2.4 3.3 4.6
Table C2 Weathering quality index properties of the aggregates in this research (NZS 4407 test 3.11
(Standards New Zealand 1991b))
Aggregate Date sampled No. of
results
Range of results
Earliest Latest Lowest Mean Highest
CV* R4.75** CV R4.75 CV R4.75
Brookby Oct 2000 Oct 2009 11 91 98 95 99 98 99
Moutohora Oct 2002 Aug 2005 6 78 86 87 94 93 97
EAF slag Oct 2006 Aug 2009 4 95 94 97 98 98 100
Te Matai Aug 1998 Dec 2009 8 96 92 97 98 98 100
* CV = cleanness value
** R4.75 = percent retained on 4.75mm sieve
Table C3 PSV properties of the aggregates in this research (BS 1097 part 8 (British Standards
Institution 2000)
Aggregate Date sampled No. of
results
Range of results
Earliest Latest Lowest Mean Highest
Brookby Dec 2000 Oct 2008 8 55 56 58
Moutohora Oct 2002 Aug 2003 2 65 66 66
EAF slag Sep 2006 Aug 2009 6 63 65 67
Te Matai Nov 1997 Jun 2009 12 57 58 60
Page 65
Abrasion resistance of aggregates in asphalt
64
Table C4 LA abrasion test results for the aggregates in this research (AS 1141.23 (Standards
Australia 1995a))
Aggregate Date sampled No. of
results
Range of results
Earliest Latest Lowest Mean Highest
Brookby Oct 2000 Dec 2008 10 9 11 14
Moutohora Nov 2003 Nov 2003 2 25 26 27
EAF slag Oct 2007 Oct 2007 1 13
Te Matai Dec 2009 Dec 2009 2 11 13 15
Table C5 Micro-deval abrasion (ASTM 6928-03 (ASTM International 2003) provided by Fulton Hogan
(Hamilton)
Aggregate Date sampled No. of
results
Test
result (%) Earliest Latest
Brookby Mar 2010 Mar 2010 1 5.9
Moutohora Mar 2010 Mar 2010 1 15.2
EAF slag Mar 2010 Mar 2010 1 3.4
Te Matai Mar 2010 Mar 2010 1 5.7
Table C6 Wet/dry strength (AS 1141.22 (Standards Australia 1996)
Aggregate Date sampled No. of
results
Range of results
Earliest Latest Lowest Mean Highest
Brookby Oct 2000 Dec 2008 4 9 20 29
Moutohora Nil
EAF slag Oct 2007 Aug 2008 2 2 13 23
Te Matai Dec 2009 Dec 2009 1 24
Page 66
Appendices
65
Appendix D Production properties of mixes
D1 Particle size analysis
D1.1 EAF slag
• Micro-deval abrasion loss: 3.4%.
• Calibration aggregate loss: 8.1%.
• Size of fraction tested: 12.5 4.75mm.
Table D1 Particle size analysis gradation of EAF slag (% passing)
Test Sample # Sieve size (mm)
13.2 11.2b 9.5 8b 6.7 4.75 2.36 1.18 0.6 0.3 0.15 0.075
Lab-based
Servopac
Austroads
gyratory
compaction
150mm
diameter
moulds at
25°C.a
#24839
(0 cycles) 99.4 77.4 41.4 24.1 22.8 22.5 20 17 15.1 13.8 12.5 10.2
#24842
(0 cycles) 99.4 74.7 42.1 25.2 22.8 22.6 20.4 17.5 15.4 14.1 12.7 10.5
#24840
(80
cycles)
98.3 72.1 41.1 25.3 23.4 23.1 20.2 17 15.1 13.9 12.7 10.7
# 24841
(80
cycles)
99.2 74 42.6 25.2 23.4 23.1 20.5 17.5 15.6 14.2 12.9 10.6
#24843
(350
cycles)
99.5 76.3 43.5 26.4 24.2 23.6 20.9 18.2 16.3 15 13.7 11.2
#24844
(350
cycles)
98.9 73.5 42.5 25.7 24 23.4 21 17.9 15.9 14.6 13.3 11.1
Pro
ducti
on
Brew blend 11/08/09 99.7 55.2 24.2 23.6 20.8 17.0 14.4 12.7 11.3 8.8
Post-
mixing
#7215 100.
0 54.4 26.0 25.0 20.7 16.0 13.0 11.9 10.6 8.7
#8306 99.5 53.2 25.4 24.7 20.9 16.2 13.2 12.0 10.6 8.5
Post-
compactionc #7316 98.7 52.4 28.5 27.2 23.4 18.8 15.5 13.5 11.8 9.5
Post-
trafficking #8291 99.2 63.1 29.3 26.2 21.0 17.0 14.5 13.0 11.2 9.0
Notes to table D1:
a Bitumen was replaced with glycerine.
b Sieves used in design, not production.
c Two cores combined.
Page 67
Abrasion resistance of aggregates in asphalt
66
D1.2 Brookby aggregate
• Micro-deval abrasion loss: 5.9%.
• Calibration aggregate loss: 8.1%.
• Size of fraction tested: 12.5 4.75m
Table D2 Particle size analysis gradation (% passing) of Brookby aggregate
Test Sample
#
Sieve size (mm)
13.2 11.2b
9.5 8b 6.7 4.75 2.36 1.18 0.6 0.3 0.15 0.07
5
Lab-based
Servopac
Austroads
gyratory
compaction
150mm
diameter
moulds at
25°C.a
#24509
(0
cycles)
100 95.5 63 40.9 33.4 26.4 21.1 17.5 15 13.4 11.8 9.4
#24676
(0
cycles)
100 95.1 60.5 40.8 32.7 26.2 20.3 16.6 14.4 13 11.7 9.5
#24757
(80
cycles)
100 95.9 63.4 41.7 34.1 27.1 21.9 18.2 15.5 13.6 11.9 9.6
#24756
(80
cycles)
100 96 63.3 41.6 33.9 26.3 21 17.1 14.6 13 11.6 9.4
#24758
(350
cycles)
100 94.7 60 42.3 34.3 27.1 21.5 17.8 15.5 13.9 12.6 10.5
#24759
(350
cycles)
100 93.9 60.1 41.1 33.9 27.1 21.4 17.7 15.4 13.9 12.5 10.3
Pro
ducti
on
Brew blend 10/08/09 99.7 64.8 35.2 25.8 20.8 17.6 15.3 13.8 12.4 9.6
Post-
mixing
#7214 100 69.0 38.5 31.1 24.5 19.5 16.0 13.9 11.7 9.1
#8305 99.7 69.8 40.1 31.6 25.1 20.3 16.8 14.7 12.7 10.0
Post-
compactionc #7315 100 72.9 46.4 37.0 29.8 24.4 20.7 17.5 14.1 10.7
Post-
trafficking #8290 100 74.1 46.4 36.5 28.4 23.1 19.4 16.4 13.4 10.2
Notes to table D2:
a Bitumen was replaced with glycerine.
b Sieves used in design, not production.
c Two cores combined.
Page 68
Appendices
67
D1.3 Moutohora aggregate
• Micro-deval abrasion loss: 15.2%.
• Calibration aggregate loss: 8.1%.
• Size of fraction tested: 12.5 4.75mm.
Table D3 Particle size analysis gradation of Moutohora aggregate (% passing)
Test Sample # Sieve size (mm)
13.2 11.2b 9.5 8b 6.7 4.75 2.36 1.18 0.6 0.3 0.15 0.075
Lab-based
Servopac
Austroads
gyratory
compaction
150mm
diameter
moulds at
25°C.a
#24679
(0 cycles) 99.6 89.4 71.6 57.3 45.8 29.1 22.5 18.7 16.3 14.6 13.2 11.3
#24764
(0 cycles) 99.2 87.5 70.2 57.6 45.9 28.6 21.8 17.8 15.4 14.0 12.8 10.9
#24760
(80 cycles) 99.5 90.7 74.0 60.4 50.0 34.1 24.4 19.9 17.3 15.6 14.0 11.6
# 24761
(80 cycles) 99.6 90.3 74.7 60.5 49.1 32.9 23.9 19.7 17.0 15.3 13.8 11.3
#24762
(350
cycles)
99.6 90.0 76.3 61.9 49.0 34.0 25.8 21.3 18.4 16.5 14.7 12.4
#24763
(350
cycles)
99.5 88.5 71.4 58.8 49.9 34.3 24.9 20.5 17.9 16.1 14.6 12.3
Pro
ducti
on
Brew blend 10/08/09 99.6 74.5 46.5 28.1 22.2 18.6 15.9 14.4 13.0 10.2
Post-
mixing
#7216 100 81.6 47.6 30.6 23.4 19.6 16.9 15.3 13.5 11.1
#8307 100 82.9 51.0 32.4 24.8 20.4 17.6 15.9 14.2 11.7
Post-
compactionc #7317 100 81.4 52.3 36.2 27.1 21.4 17.7 15.2 12.9 10.4
Post-
trafficking #8292 98.2 81.3 49.9 33.5 25.4 20.7 17.5 15.4 13.2 10.5
Notes to table D3:
a Bitumen was replaced with glycerine.
b Sieves used in design, not production.
c Two cores combined.
Page 69
Abrasion resistance of aggregates in asphalt
68
D1.4 Te Matai aggregate
• Micro-deval abrasion loss: 5.7%.
• Calibration aggregate loss: 8.1%.
• Size of fraction tested: 12.5 4.75mm
Table D4 Particle size analysis gradation of Te Matai aggregate (% passing)
Test Sample # Sieve size (mm)
13.2 11.2b 9.5 8b 6.7 4.75 2.36 1.18 0.6 0.3 0.15 0.075
Lab-based
Servopac
Austroads
gyratory
compaction
150mm
diameter
moulds at
25°C.a
#24931
(0 cycles) 98.5 94.2 83.1 55.1 29.3 24.3 21.4 17.6 15.5 14.2 12.9 10.6
#24932
(0 cycles) 98.6 91.6 80.4 52.8 28.3 24.1 21.1 17.5 15.4 14.1 12.8 10.2
#24933
(80
cycles)
99.4 94.5 83 56 30.6 25.7 21.8 18.3 16.2 14.8 13.4 11
# 24934
(80
cycles)
99.5 94.5 83 56.1 30.6 25.5 21.9 18.4 16.5 15.1 13.7 11.2
#24935
(350
cycles)
99 93.4 82.6 55.5 31.1 26 22.3 18.6 16.6 15.2 13.9 11.8
#24936
(350
cycles)
99.6 93.5 81.9 56.1 31.6 25.8 22.5 18.9 16.9 15.9 14.2 11.9
Pro
ducti
on
Brew blend 09/02/10 98.3 78.2 32.8 29.6 25.6 20.8 18.1 16.3 14.3 11.3
Post-
mixing
#7945 99.2 74.1 26.3 23.1 19.5 15.4 12.9 11.5 10.1 8.0
Only one post-mixing sample was taken for this aggregate
Post-
compactionc #8295 99.7 78.6 33.8 29.6 24.6 19.6 16.7 14.8 13.0 10.1
Post-
trafficking #8346 99.4 78.0 33.6 29.5 24.9 20.1 17.0 15.0 13.0 10.0
Notes to table D4:
a Bitumen was replaced with glycerine.
b Sieves used in design, not production.
c Two cores combined.
Page 70
Appendices
69
D2 Air voids and texture depth
Table D5 Air voids (%) post-compaction and post-trafficking
Aggregate source Post-compaction Post-trafficking
Sample # % Sample # %
EAF slag 7312
9.2
8280
5.5 7.4 7.0 7.2 6.1 8.7 7.0
Brookby 7311
5.7
2879
3.1 3.6 1.8 2.7 1.7 2.6 2.5
Moutohora 7313
3.2
8281
2.7 6.1 3.3 4.3 3.3 3.2 2.8
Te Matai 7951
2.0
8345
2.9
1.5 1.6
2.7 1.9
Table D6 Texture depth of aggregates post-compaction and post-trafficking
Aggregate source Post-compaction Post-trafficking
Date mm Date mm
EAF slag 21/08/09
1.3
13/04/10
1.13 1.18 1.13 1.13 1.08 1.08 1.04
Brookby 21/08/09
1.08
13/04/10
1.04 1.04 0.99 0.95 0.99 0.88 0.85
Moutohora 21/08/09
0.85
13/04/10
0.88 0.99 0.85 0.99 0.85 0.85 0.85
Te Matai Not done 25/05/10
0.7 0.5
0.7
Page 71
Abrasion resistance of aggregates in asphalt
70