RESEARCH REPORT MAY 2018 School Closings in Chicago Staff and Student Experiences and Academic Outcomes Molly F. Gordon, Marisa de la Torre, Jennifer R. Cowhy, Paul T. Moore, Lauren Sartain, and David Knight with commentaries by Eve L. Ewing, University of Chicago and Douglas N. Harris, Tulane University
Transcript
RESEARCH REPORT MAY 2018
School Closings in ChicagoStaff and Student Experiences and Academic Outcomes
Molly F. Gordon, Marisa de la Torre, Jennifer R. Cowhy, Paul T. Moore, Lauren Sartain, and David Knight with commentaries by Eve L. Ewing, University of Chicago and Douglas N. Harris, Tulane University
1 Executive Summary
7 Introduction
Chapter 1
13 Overview of the School Closings Context and Process
Chapter 2
23 Planning and Transitioning into Designated Welcoming Schools
Chapter 3
33 Building Relationships and School Cultures in Welcoming Schools
Chapter 4
45 Impact on Student Outcomes
Chapter 5
57 Interpretive Summary
61 Commentaries
65 References
69 Appendices
TABLE OF CONTENTS
ACKNOWLEDGEMENTS
The authors wish to acknowledge all of the educators and students who graciously let us into their schools, generously gave their time, and shared their experiences with us. The authors are indebted to each of the welcoming school leaders who agreed to participate in this study, and to the staff members who helped us schedule the site visit interviews, collect parent/guardian permis-sion forms, and organize the student focus groups. We would also like to acknowledge the Chicago Public Schools for providing us with the administrative data that allowed us to do this work. The authors also appreciate the many individuals who contributed to this report. We thank Maheema Haque for helping us code interviews, summarize qualitative data, and for contributions to the literature review. We were also fortunate to have the input of several people who provided constructive criticism along the way. We are grateful to our Consortium colleagues who read multiple drafts of the report and provided us with helpful suggestions for improvement, including Elaine Allensworth, Kylie Klein, Bronwyn McDaniel, Eliza Moeller, Jenny Nagaoka, Penny Sebring, and Jessica Tansey. Furthermore, prior to writing this report, we presented preliminary findings to several groups, including to members of our Steering Committee, the Consortium Investors Council, and program staff at the Spencer Foundation and the Chicago Community Trust. At each presentation, participants asked us thought-provoking questions and offered helpful suggestions for our analysis, interpretation, and subsequent writing. We also received vital feedback on the penultimate draft from two external reviewers, James Kemple and Mary Pattillo, who provided important points for us to consider as we finalized this report. In addition, we received extensive written feedback on the penulti-mate draft from several Steering Committee members, including Gina Caneva, Lynn Cherkasky-Davis, Lila Leff, Shazia Miller, and Beatriz Ponce de León. We thank them for their close read and thoughtful comments. We also thank our colleague Todd Rosenkranz, who conducted a thorough technical read of the report, and the UChicago Consortium’s communications team, including Bronwyn McDaniel, Jessica Tansey, and Jessica Puller, who were instrumental in the production of this report. We are grateful to the Spencer Foundation and the Chicago Community Trust for supporting this work and providing us with the necessary resources to conduct the analyses and write the report. We also gratefully acknowledge the Spencer Foundation and the Lewis-Sebring Family Foundation, whose operating grants support the work of the UChicago Consortium. Finally, we greatly appreciate the support from the Consortium Investor Council that funds critical work beyond the initial research: putting the research to work, refreshing the data archive, seeding new studies, and replicating previous studies. Members include: Brinson Foundation, Chicago Community Trust, CME Group Foundation, Crown Family Philanthropies, Lloyd A. Fry Foundation, Joyce Foundation, Lewis- Sebring Family Foundation, McDougal Family Foundation, Osa Foundation, Polk Bros. Foundation, Robert McCormick Foundation, Spencer Foundation, Steans Family Foundation, and The Chicago Public Education Fund.
Cite as: Gordon, M.F., de la Torre, M., Cowhy, J.R., Moore, P.T., Sartain, L.S., & Knight, D. (2018). School closings in Chicago: Staff and student experiences and academic outcomes. Chicago, IL: University of Chicago Consortium on School Research.
This report was produced by the UChicago Consortium’s publications and communications staff: Bronwyn McDaniel, Director of Outreach and Communication; Jessica Tansey, Communications Manager; and Jessica Puller, Communications Specialist.
Graphic Design: Jeff Hall Design Photography: Eileen Ryan Editing: Katelyn Silva, Jessica Puller, Jessica Tansey, Andrew Zou, and Gina Kim
UCHICAGO Consortium Research Report | School Closings in Chicago 1
Executive SummaryAcross the country, urban school districts are opting to close under-enrolled schools as a way to consolidate resources. Motivated by a reported $1 billion deficit and declining enrollments in depopulating neighborhoods, the Chicago Board of Education voted in May 2013 to close 49 elementary schools and one high school program located in an elementary school—the largest mass school closure to date. In order to accommodate the nearly 12,000 displaced students, Chicago Public Schools (CPS) designated specific “welcoming” schools for each of the closed schools.1
Although cost savings was the primary stated reason for
closing schools, city and district officials saw this as an
opportunity to move students into higher-rated schools
and provide them with better academic opportunities.
Underutilized schools, the district argued, were not serv-
ing students well. Supporters of the policy hoped that ex-
posing students to better environments would generate
academic gains and offset negative consequences.
There was strong, vocal opposition to the policy,
including from the Chicago Teachers Union as well as
from many families, students, and community groups.
Most of the schools slated for closure were located in
historically disinvested and primarily Black neighbor-
hoods, with many of the schools serving areas of the
city with high unemployment and crime rates. Critics
feared that closing schools in these areas would destabi-
lize communities and disrupt the lives of children and
families, affecting their safety and security. Many also
worried about students in welcoming schools and how
they might be affected by large enrollment increases.
Prior studies on school closures have looked at the
effects of closing schools on students’ test scores, with a
few studies looking at effects on student attendance and
GPA. Evidence has shown that students experienced
minimal or negative short-term effects beginning in
the announcement year, with no long-term positive
impacts.2 Prior studies from the UChicago Consortium
on School Research (UChicago Consortium) and others
have shown that these effects were mitigated when
students attended significantly higher-performing
schools or had fewer disruptions.3 A small number
of qualitative studies have investigated how closing
schools affects students, families, and staff. Findings
reveal several potentially negative effects, including
on student and teacher relationships.4 Missing from
prior studies is an in-depth understanding and com-
parison of the experiences of staff and students across
multiple receiving schools. In addition, most studies
have not looked beyond test scores to other kinds of
relevant outcomes, such as mobility or suspension
rates for displaced students or students in receiving
schools. Policymakers need more information to
understand the pros and cons, and implications, of
closing schools.
1 Throughout the report we refer to district-designated wel-coming schools as welcoming schools and other CPS schools where displaced students attended as receiving schools.
2 de la Torre & Gwynne (2009); Kirshner, Gaertner, & Pozzoboni (2010); Barrow, Park, & Schanzenbach (2011); Engberg, Gill, Zamarro, & Zimmer (2012); Brummet (2014); Bross, Harris, & Liu (2016); Larsen (2014); Steinberg, Scull, & MacDonald (2015).
3 de la Torre & Gwynne (2009); Barrow et al. (2011); Engberg et al. (2012); Kemple (2015); Bross et al. (2016).
5 Core GPA is the combination of grades in English, math, science and social studies classes.
6 CPS labeled a school as underutilized if the enrollment of the
school was below 80 percent of its capacity, measured in fall 2012.7 Six percent of students from closed schools transferred out of
the district—a rate similar to prior years for the closed schools.
In this report, we provide evidence of the short-term
and multi-year impacts of the 2013 CPS school closures
on students’ academic, behavioral, and other relevant
outcomes. We also illuminate the voices and experienc-
es of the staff and students most directly affected by
closures across six welcoming schools.
Our study addresses two primary research questions:
Research Question 1: How did staff and students
affected by school closings experience the school
closings process and subsequent transfer into
designated welcoming schools?
Research Question 2: What effect did closing
schools have on closed and welcoming schools
students’ mobility, attendance, suspensions, test
scores, and core GPAs? 5
To answer our research questions, we used a mixed
methods design. This design allowed us to zoom in to
illustrate what it was like for staff and students going
through the school closings process in six welcoming
schools, and zoom out to look at the impact of the policy
on all affected students on a variety of outcomes.
Financial, utilization, and performance challenges
faced by districts will likely result in more school clo-
sures in the future, in Chicago and elsewhere around
the country. We hope findings from this report will
provide helpful information for policymakers, educa-
tors, community members, families, and students to
consider when closures are proposed.
CONTEXT
2013 School Closings in ChicagoIn early December 2012, CPS identified a list of 330
underutilized elementary and high schools at risk for
closures.6 By February 2013, the district narrowed
down the list to 129 elementary schools that were still
under consideration. At the end of March 2013, CPS
announced the final list of 53 schools and one program
recommended for closure, and a final vote was set for
the end of May 2013. Ultimately, 47 elementary schools
and one high school program at an elementary school
were closed at the end of the 2012–13 school year,
primarily in the south and west sides of the city. Two
other elementary schools were phased out the following
year. Communities and schools had several occasions
from December 2012 to May 2013 to attend meetings
and hearings to advocate that their school be removed
from the different recommended closure lists because
of the staggered process for and the late announcement
of the final list of school closures.
The district assigned students from closed schools
to specific welcoming schools. These schools had to
be within one mile of the closed school, higher-rated
than the closed school (according to the district perfor-
mance policy rating), and have enough available seats
to accommodate students. The district invested
resources in these welcoming schools, such as new or
upgraded technology and extra discretionary funds for
the first year, to enhance their learning environment
and to prepare for the influx of students. In 14 cases,
CPS determined that the closed school building should
house the welcoming school, meaning that welcoming
school staff and students had to relocate to the closed
school buildings.
When the closures took place at the end of the 2012–
13 school year, nearly 12,000 students were attending
the 47 elementary schools that closed that year, close to
17,000 students were attending the 48 designated wel-
coming schools, and around 1,100 staff were employed
in the closed schools. Thirty-six of the closed schools
had a Level 3 rating (“on probation;” the lowest of three
possible ratings), 11 had a Level 2 rating (“good stand-
ing;” the middle of three possible ratings), and none
had a Level 1 rating (“excellent standing;” the highest of
three possible ratings) in 2012–13. In contrast, 13 of the
designated welcoming schools had an “on probation”
rating, 23 had a “good standing” rating and 12 had an
“excellent standing” rating that same year.
Sixty-six percent of students from closed schools
attended the 48 designated welcoming schools. The
rest enrolled in 311 other schools in the district.7 On
UCHICAGO Consortium Research Report | School Closings in Chicago 3
average, a designated welcoming school received 150
displaced students, accounting for 32 percent of their
student population in fall 2013. However, some of the
designated welcoming schools doubled in size, while
others only received a small percentage of students
from their corresponding closed school.
While the changes in the population of students and
teachers suggest welcoming schools had to make major
adjustments, to really understand what happened re-
quires listening to student and staff experiences.
KEY FINDINGS
Student and Staff Experiences To understand student and staff experiences, we identi-
fied six welcoming schools in which to conduct in-depth
case studies, and interviewed educators and students
in these schools.8 The highlighted qualitative findings
represent the key themes we found across the six case
study schools and are based on the views, experiences,
and perceptions of staff and students in these schools.9
• School staff said that the planning process for merg-
ing closed schools into welcoming schools was not
sufficient, resulting in staff feeling unprepared. Once
welcoming schools were identified, the district asked
staff to produce written transition plans outlining
how the schools would serve their new student popu-
lations. To help support principals in this process,
the district provided them with principal transition
coordinators. Planning for a merger of this magni-
tude was highly complex and involved a great deal
of adaptation. School leaders said they did not know
how to balance the need to plan with the recognition
that the process, in reality, was unfolding with a high
degree of uncertainty and ambiguity.
Planning was also difficult because staff only
had a few months and they did not always know how
many of the closed school students would enroll in
their schools, nor their final budgets. As the school
year started, staff said they did not feel ready, and
much of what had been written in the transition
planning documents quickly became irrelevant as
realities shifted.
• Getting school buildings ready to receive students
on time was challenging because the moving
process was chaotic. After the Chicago Board of
Education voted to determine school closures at
the end of May 2013, there was only one month left
until the end of the school year. The new school year
was scheduled to start on August 26, 2013, giving
staff just two months to prepare the buildings, move
supplies and furniture, and hire personnel for the
2013–14 school year. One of the largest impediments
to getting ready for the school year was that the
moving process was perceived as poorly managed.
Roughly 95 school buildings needed to be packed up
for the move. Staff said boxes were strewn through-
out the school buildings and many staff reported
that they lost valuable school supplies and materi-
als during the move. As a result of the disorder and
chaos, teachers said they did not have everything
they needed for instruction or to support students at
the beginning of the school year.
In addition to having to deal with the clutter of
moving boxes and the chaos of unpacking, staff also
lamented that some of the welcoming school build-
ings were unclean, some needed serious repairs, and
many upgrades fell short of what was promised or
were delayed. Poor building conditions were seen as
a barrier to preparedness, undermining community
hopefulness about the transition. The inadequacy
of the building space resulted in administrators and
teachers spending a lot of time unpacking, cleaning,
and preparing the physical space, rather than on
instructional planning and relationship building.
• Students and staff appreciated new investments in
Safe Passage, technology, and resources. To help
support students in welcoming schools, the district
provided extra funds and technology the first year
of the merger. Some of the extra funds were used to
8 For more information about the qualitative methods, see Appendix A.
9 In addition to using interview and focus group data, we also analyzed survey data from the My Voice, My School surveys given to CPS students and staff yearly.
Executive Summary4
pay for welcoming events and activities, hire extra
student support personnel, and/or add or boost
academic supports for students. Many of these initial
supports, however, were hard to sustain after the
first year, according to school leaders, due to budget
cuts in subsequent years and the end of the one-time
influx of resources. However, some of the welcoming
schools gained new STEM or IB programs, which the
schools were able to maintain. One lasting support
that interviewees appreciated was the expansion of
the Safe Passage program, a program that hires Safe
Passage workers to stand along designated walking
routes during before- and after-school hours for
added safety. Although school communities appre-
ciated the expansion of Safe Passage, safety is still
a major concern in many communities affected by
school closures.
• When schools closed, it severed the longstand-
ing social connections that families and staff had
with their schools and with one another, resulting
in a period of mourning. Those impacted by school
closures expressed feelings of grief in multiple ways,
often referring to their closed school peers and
colleagues as “like a family.” The intensity of the
feelings of loss were amplified in cases where schools
had been open for decades, with generations of fami-
lies attending the same neighborhood school. Losing
their closed schools was not easy and the majority of
interviewees spoke about the difficulty they had in-
tegrating and socializing into the welcoming schools.
Even though welcoming school staff and students
did not lose their schools per se, many also expressed
feelings of loss because incorporating a large number
of new students required adjustments. Staff said they
wished that they had more training and support on
what it meant to welcome staff and students who just
lost their schools. Interviewees wished that their
grief and loss had been acknowledged and validated.
• A lack of proactive efforts to support welcoming
school communities in integrating the populations
created challenging “us” vs. “them” dynamics.
Creating strong relationships and building trust in
welcoming schools after schools closed was difficult.
Prior to the actual merger, school communities
said they felt as if they were competing with one
another to stay open, which made accepting the
loss that much more difficult. Displaced staff and
students, who had just lost their schools, had to go
into unfamiliar school environments and start anew.
Welcoming school communities also did not want to
lose or change the way their schools were previously.
To try to rebuild community within newly merged
welcoming schools, staff held welcoming events, but
these efforts often fell short. Tensions and con-
flicts arose, in part, because of differences in school
cultures and expectations. Closed school staff and
students, in each case, talked about feeling margin-
alized and not welcomed into the welcoming schools.
Because of these feelings, staff and students said
there was an increase in student fights and bullying,
especially the first year of the transition. Over time,
relationships began to improve. Staff expressed a
need for more training and support in integrating
school communities after school closures.
KEY FINDINGS
Student Outcomes In order to determine the effects of school closures on
student outcomes, we compared the outcomes trends
of students affected by closures with students in similar
schools that were not affected by any school actions.10
These comparisons allowed us to estimate how the af-
fected students would have performed had their schools
not been affected. Using administrative data, we analyzed
school transfer rates, number of days absent, suspension
rates, reading and math test scores, and core GPA.11
Compared to students from similar schools, we found:
• Students who were attending welcoming schools
that relocated into the building of closed schools
transferred out at higher rates just before the merg-
er; mobility was not affected by school closures in
subsequent years for either group of students.
10 We focused on students who were in grades K-7 in spring 2013: 10,708 students from closed schools and 13,218 students from designated welcoming schools.
11 For more information about the quantitative methods, see Appendix B.
UCHICAGO Consortium Research Report | School Closings in Chicago 5
Students from closed schools transferred by necessity,
while students in welcoming schools also left their
schools for other district schools at higher rates in the
summer prior to the merger. In fall 2013, 21 percent of
the welcoming school students did not return to these
schools. This number was almost 5 percentage points
higher than expected given their prior school mobil-
ity and the mobility rates of other students in similar
schools. The increase in the transfer rates was driven
exclusively by students who were attending the 14
welcoming schools that had to relocate to the closed
school buildings. In other words, when welcoming
school communities were faced with having to move
school buildings, families from the welcoming schools
were more likely to look at other options.
• All students affected by school closures had no
changes in absences or suspension rates after the
merger. The number of school days missed by all stu-
dents in our sample have been decreasing over time.
Absences for students affected by school closures
showed similar trends after the merger to the trends
for students in comparison schools. Consequently,
school closures did not affect the attendance rates of
these students because absences changed at similar
rates districtwide.
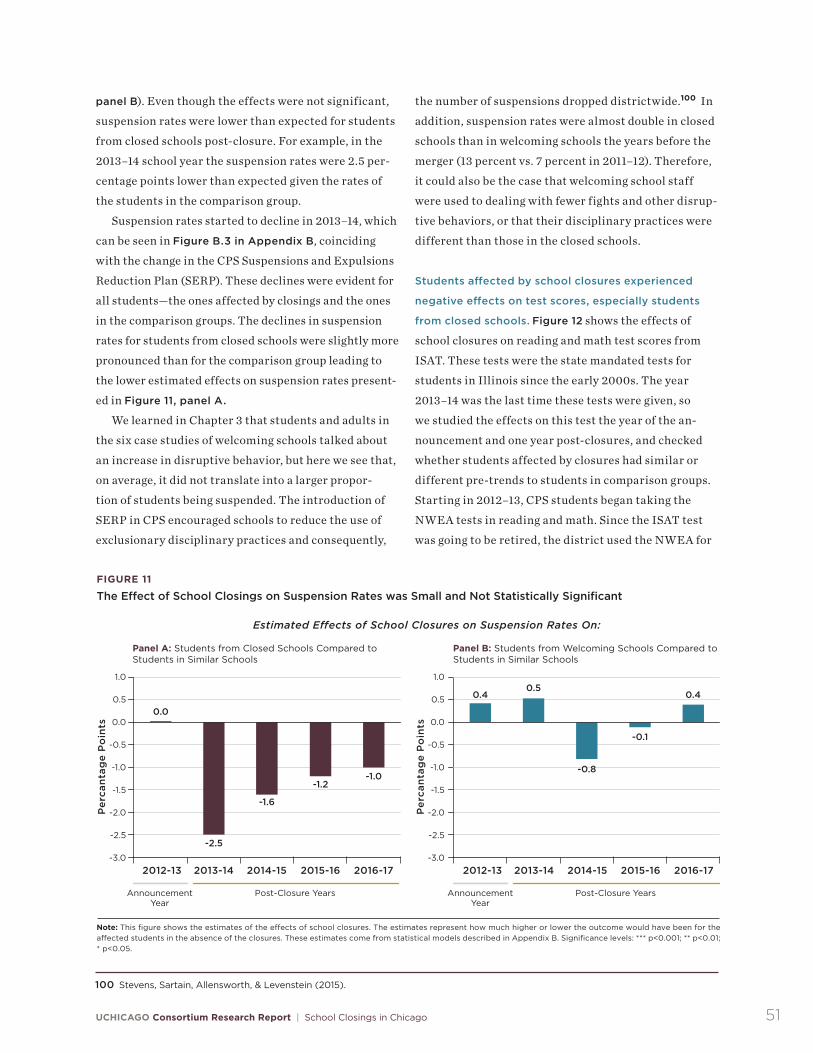
The percent of students suspended started to
decrease in the 2013–14 school year, coinciding with
the change in the CPS Suspensions and Expulsions
Reduction Plan (SERP). These declines were evident
for all students—those affected by closings and the
comparison groups. The decline in suspension rates
for students from closed schools was slightly more
pronounced than the one for the comparison group,
but differences were not significant.
• Students affected by school closures did experience
negative learning effects, especially students from
closed schools.
• The largest negative impact of school closures
was on the test scores of students from closed
schools; their scores were lower than expected
the year of the announcement. Similar to what
other studies on school closures have found, student
test scores in this case were lower than predicted
given students’ prior performance. Students’ scores
in the spring of the year of the announcement were
roughly one and a half months behind in reading
and two months behind in math. One reason for this
might be that the announcement year was a disrup-
tive year for many of these schools as they faced
uncertainty about whether they would be closed. The
district tried to avoid distractions in students’ learn-
ing by waiting to announce the final list of school
closures until after students took the state mandated
tests (ISAT). However, students in closed schools
still performed lower than the comparison group
in the spring, even though their performance had
been very similar in the fall and winter (measured by
NWEA tests). Given the push to announce final clo-
sure decisions post-ISAT testing, it is not clear why
there was a gap in ISAT test scores. The deviation in
test scores in March between closed and compari-
son schools was somewhat unexpected as both were
under the same threat of closing at the time the ISAT
tests were given.12
• Students from closed schools experienced a
long-term negative impact on their math test
scores; slightly lower and short-term effects for
reading test scores. Reading test scores rose back
to expected levels the second year post-closings for
students from closed schools, but their test scores
did not improve at a higher pace than students in
similar schools. However, the gap in math test scores
remained for four years post-closings, the last year in
our analyses. The size of the effect was similar to the
effect during the year of the announcement, which
was approximately two months behind in math.
• Students from welcoming schools had lower than
expected reading test scores the first year after
the merger. Reading test scores of students from
welcoming schools were negatively affected the first
year post-closing, scoring approximately one and
a half months lower than expected given students’
12 We ran some tests to try and understand whether there was any way to predict which schools would be on the final list of closures, but we found no distinctive data on these schools
that would allow us or them to predict which ones were going to be on the final list.
Executive Summary6
prior performance. This was a short-term effect,
as reading test scores rebounded the next year.
Welcoming school students also had slightly lower
than expected math scores, although this was not a
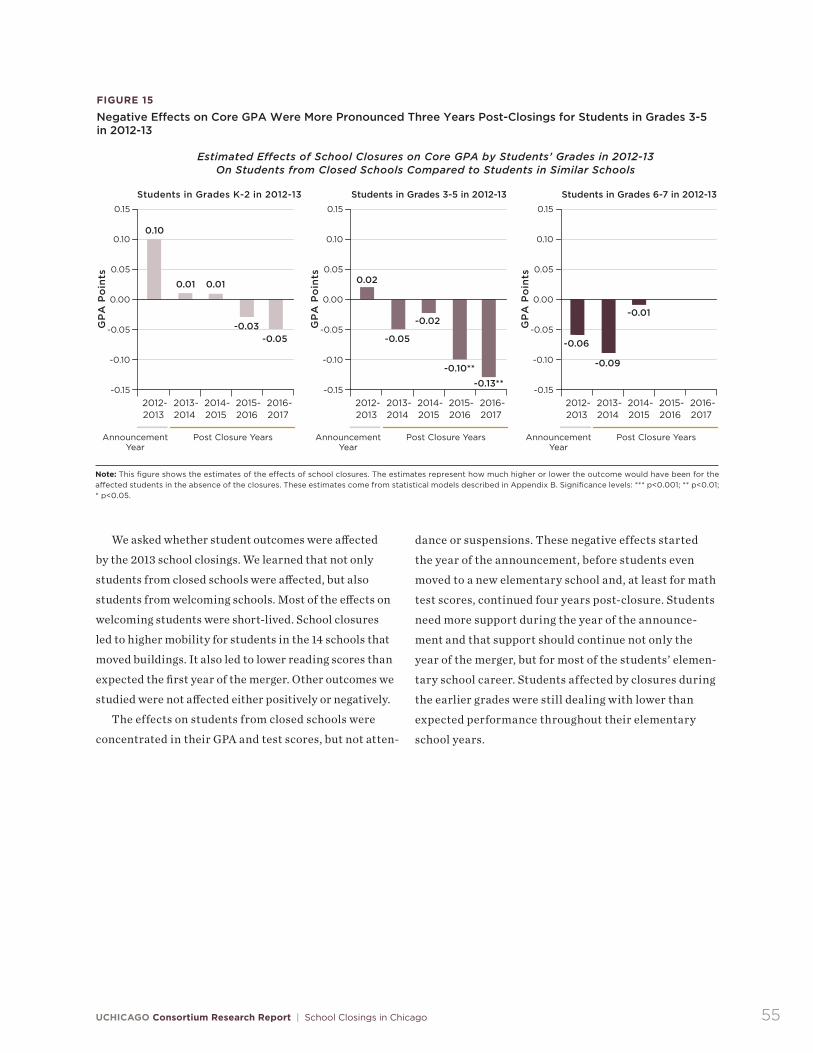
cially the years after school closures for students.
These increases initially occurred at the same rate
for students affected by closures and their compari-
son group, but in years three and four post-closures
(2015–16 and 2016–17), the core GPA for students
from closed schools did not increase as much as the
comparison group. The effects on core GPA were
small, but negative, in years three and four post-
closures. These negative effects were more pro-
nounced for students who were in primary grades
(3–5) in the announcement year (2012–13).
ConclusionOur findings show that the reality of school closures
was much more complex than policymakers anticipated;
academic outcomes were neutral at best, and negative in
some instances. Interviews with affected students and
staff revealed major challenges with logistics, relation-
ships, and school culture. A number of different factors
played a role in why students did not benefit as much
as hoped and why it was difficult for leaders and staff
to create positive and welcoming learning environ-
ments, especially the first year of the merger. Closed
school staff and students came into welcoming schools
grieving and, in some cases, resentful that their schools
closed while other schools stayed open. Welcoming
school staff said they were not adequately supported
to serve the new population and to address resulting
divisions. Furthermore, leaders did not know what it
took to be a successful welcoming school, suggesting a
need for training that is more ongoing, along with time
for reflections and targeted support. Students and staff
appreciated the extra resources, technology, programs,
and the expansion of Safe Passage, although they
wished for longer-term investments because student
needs did not end after one year. Staff and students said
that it took a long period of time to build new school
cultures and feel like a cohesive community. On the
other hand, many of the negative concerns that critics
raised did not materialize. Outcomes, such as absences
and suspensions, were not affected by school closures.
Our hope is that this report will add to our collective
understanding of the effects of school closings.
UCHICAGO Consortium Research Report | School Closings in Chicago 7
IntroductionDistricts across the United States, including Detroit, Philadelphia, New York, and Chicago, are closing schools, citing budget woes and population declines leading to a large number of under-enrolled schools. In May 2013, the Chicago Board of Education voted to close 49 elementary schools and one high school program located in an elementary school—the largest mass school closures to date.13 In order to accommodate the nearly 12,000 dis-placed students, CPS designated specific “welcoming” schools for each of the closed schools.14
To identify which schools to close, the district focused
on buildings with low enrollments. At the beginning
of 2013, Chicago Public Schools (CPS) explained that
the district had space for more than 500,000 students,
but enrolled just over 400,000, calling it a “crisis of
underutilization.” 15 Because of this crisis, “resources
across the district were spread too thinly and were
not being used in the best interest of our students and
school communities.” 16 According to reports from the
Commission on School Utilization, a group charged
by then-CPS Chief Executive Officer (CEO) Barbara
Byrd-Bennett to advise the district on school actions,
maintenance, and organizational costs which are borne
by students, schools, and the district as a whole.” 17
Academically, the commission argued, underutilized
schools were more likely to have either extremely
overcrowded classrooms or classes with multiple grade
levels, and students in these schools were less likely to
be exposed to art, music, or physical education classes.18
The city of Chicago has experienced periods of gen-
eral population stagnation and declines since the 1990s
due to changes in fertility/mortality rates, housing and
labor market changes, and out-migration, including
suburbanization and movement towards sun-belt re-
gions of the country.19 Recent losses are driven primar-
ily by the out-migration of Chicago’s Black population.
From 2005–15, Chicago lost approximately 104,000
Black residents.20 The current “crisis of underutiliza-
tion” can be attributed to these population shifts as well
as to various economic, housing, and education policy
decisions made over the last couple of decades. Declines
in school enrollment in areas impacted by closings have
been attributed, in part, to a long history of economic
and housing segregation, and racially biased urban
planning decisions. Beginning in the late 1940s, the
13 Forty-seven elementary schools and one high school program closed at the end of the 2012–13 school year; the board voted to phase out two more elementary schools the following year.
14 Throughout the report we refer to district-designated wel-coming schools as welcoming schools and other CPS schools where displaced students attended as receiving schools.
15 Chicago Public Schools (2013, January 10). 16 Chicago Public Schools (2013, February 13); Chicago Public
Schools Facility Standards (n.d.).17 CPS turned to an independent Commission on School
Utilization to define and calculate building utilization rates. Commission on School Utilization Final Report (2013, March 6).
18 The Commission on School Utilization did not define what they meant by overcrowded classrooms or explain why underutilized schools may have had more overcrowded classrooms. Catalyst Chicago found that 12 percent of classrooms in underutilized schools and 4 percent of classrooms in schools that closed had above recommended class sizes (defined as more than 28 stu-dents). They also found that schools slated for closure did not have significantly more split-grade level classrooms than other schools across the district. About 14 percent of classrooms in closed schools were split-grade. Karp (2013, May 15).
19 Frey (2018, March 26); Anderson (2014); Goerge, Dilts, Yang, Wasserman, & Clary (2007).
20 Chicago Metropolitan Agency for Planning (2017a; 2017b).
Introduction 8
city began erecting public housing units in primarily
low-income Black communities leading to dramatic
increases in the school-aged populations. The district,
in turn, built more schools to accommodate the popula-
tion growth in these concentrated areas.
By 1999, changes in the labor market, disinvestment in
low-income neighborhoods, mismanaged and dilapidated
buildings, and high crime rates led the Chicago Housing
Authority to create the “Plan for Transformation.” The
Plan involved razing public housing units and relocating
residents throughout the city, which contributed, along
with other factors, to declines in the school-aged popula-
tion in these areas.21 While the city carried out the Plan
for Transformation, there was also a big push to increase
school choice. In summer 2004, Mayor Daley introduced
Renaissance 2010, an effort to close low-performing
schools and rebuild 100 new charter, performance, and
contract schools by the year 2010. The stated purpose
of the policy was to offer higher-quality school options
for families.22 However, out-migration and declining
school-aged populations, paired with the effort to build
new schools, helped give rise to decreased neighborhood
school enrollments and underutilized schools, primarily
on the south and west sides of the city.23
Policymakers projected that closing underutilized
schools would save approximately $560 million in capital
costs and another $43 million in operating costs over
the span of 10 years.24 Others expressed doubts in these
savings; research on the sale of surplus buildings from
2005–12 in districts such as Philadelphia, Cincinnati,
Detroit, and Washington, found that actual savings
tended to fall well below projected valuations.25 Of the
schools closed in 2013, CPS had repurposed five of them,
transferred three to the city for economic development,
sold 26, and 10 buildings remained for sale as of April 2,
2018.26 Information regarding the actual cost and sav-
ings from the 2013 round of school closures in Chicago
has not yet been released or reported by the district.
Cost savings was the primary stated reason for
closing schools, but the mayor’s office and district
officials saw this as an opportunity to move students
from lower-resourced, lower-performing schools into
higher-achieving schools. The prevailing assumption by
policymakers was that under-enrolled schools were not
serving students well. As Barbara Byrd-Bennett stated:
“For too long, children in certain parts of Chicago have
been cheated out of the resources they need to succeed
because they are in underutilized, under-resourced
schools … By consolidating these schools, we can focus
on safely getting every child into a better performing
school close to their home.” 27
The district framed shuttering schools as an
opportunity to provide students with better academic
opportunities. As Mayor Rahm Emanuel stated, “I
know this is incredibly difficult, but I firmly believe the
most important thing we can do as a city is provide the
next generation with a brighter future.”28 The nearly
12,000 displaced students would, in theory, experi-
ence a brighter future because they would be trans-
ferred to district-assigned, higher-rated welcoming
schools with consolidated resources.29 The district
encouraged families to enroll their children into the
designated welcoming schools, but families could opt
to send their children to other schools with open seats.
In fall 2013, 66 percent of the displaced students ended
up enrolling into these designated welcoming schools.
Approximately one-third of all displaced students
enrolled in schools that had an “on probation” (Level
3) 2012–13 performance policy rating, with 21 percent
enrolling in schools with “excellent standing” (Level
1) ratings. In contrast, 78 percent of the displaced
students had attended closed schools that had an “on
21 For more information on Chicago’s history of population increases and subsequent declines as well as the rise and fall of public housing units, see Hirsch (2009); Ewing (2016); Eads & Salinas (2014, December, 23); Dumke, Chase, Novak, & Fusco (2016, June 25); Chicago Housing Authority Plan for Transformation (n.d.).
22 Chicago Public Schools, Renaissance 2010 (n.d.). For more information on priority areas, see Catalyst Chicago (2007, December 1).
23 For more information on the effects of Rensaissance 2010, see Lipman & Haines (2007); Banchero (2010, January 17).
24 Chicago Public Schools (2013, March 21a). 25 Dowdall & Warner (2013, Feburary 11). 26 Belsha & Kiefer (2017, February, 12). 27 Chicago Public Schools (2013, March 20). 28 Emanuel (2013) as cited in Byrne & Ruthhart (2013, May 22).29 Schools were rated on a scale of 1-3 based on the district’s
Performance, Remediation, and Probation Policy, the school accountability policy in place at the time of school closures. In the 2014–15 academic year, CPS introduced a new school accountability policy called School Quality Rating Policy (SQRP) for measuring annual school performance.
UCHICAGO Consortium Research Report | School Closings in Chicago 9
probation” (Level 3) rating, and the rest had attended a
school with a “good standing” (Level 2) rating.30
The notion of closing down long-standing neighbor-
hood schools is often met with fierce resistance. In a
recent Phi Delta Kappan public opinion survey, 84 per-
cent of Americans would rather opt to keep struggling
schools open and provide support rather than close
them down.31 In Chicago, however, levels of support
for school closures differed along racial lines; White
residents reported higher levels of support, while Black
residents reported lower levels of support. Differences
were attributed to the disproportionate impact of
closures on the Black community.32 Although levels of
support across the city varied, there was strong vocal
opposition to the policy. Critics feared that closing
schools would further threaten already economically
fragile communities. As Karen Lewis, president of the
Chicago Teachers Union, stated at the time, “We’re go-
ing to have abandoned buildings. They destabilize the
neighborhoods around them.” 33 Most of the schools
that were closed were located in historically disinvested
and primarily Black neighborhoods. Many schools
served areas of the city with high unemployment rates
and high levels of crime. Opponents cautioned that clos-
ing schools would further disrupt the lives of children
and families in affected communities. Compared to oth-
er students in the district, the students displaced by the
2013 round of closures were more likely to receive free
or reduced-price lunch and special education services,
and they were more likely to move residences and live in
neighborhoods with high rates of crime and unemploy-
ment than students not affected by closures.34
Community members also warned district officials
that sending displaced students to other schools in the
neighborhood could be dangerous, as some students
would have to cross gang lines in order to get to their new
schools. To try to address these concerns, CPS expanded
the Safe Passage program and hired Safe Passage workers
to stand along designated walking routes during before-
and after-school hours for added safety. Although more
Safe Passage routes were added for students to get to
and from the designated welcoming schools, opponents
still worried about the possibility of increased fights and
bullying inside and outside schools—especially between
closed and welcoming student groups.
Furthermore, opponents of the 2013 round of school
closings in Chicago worried about whether students go-
ing to the designated welcoming schools or other receiv-
ing schools throughout the district would actually fare
better academically, socially, and emotionally once they
were in their receiving schools. In addition, critics feared
that the education of students already enrolled in receiv-
ing schools would be disrupted by the sudden inflow of
large numbers of lower-performing displaced students,
making receiving schools more vulnerable and a target
for future rounds of school closures.
What Do We Know From Prior Research About the Effects of Closing Schools?Research on the effects of closing schools, either
elementary or high schools, is growing, but still sparse.
Hence, the impact of such policies is not well under-
stood. Most prior studies have shown that closing
schools had minimal or negative short-term impacts
on student test scores, with no long-term positive im-
pacts.35 The negative impacts on students’ test scores
often began the year of the announcement, at least in
districts where the announcement took place before
students took annual state tests.36 The reasons behind
the decline in students’ academic performance dur-
ing the announcement year are not well understood.
30 de la Torre, Gordon, Moore, Cowhy, Jagesic, & Nuynh (2015).31 Starr (2016).32 Nuamah (2017).33 Yaccino & Rich (2013, March 21). 34 de la Torre et al. (2015).
35 de la Torre & Gwynne (2009); Kirshner et al. (2010); Barrow et al. (2011); Engberg et al. (2012); Brummet (2014); Bross et al. (2016).
36 de la Torre & Gwynne (2009); Barrow et al. (2011); Engberg et al. (2012).
Introduction 10
In some instances, negative test score effects were
mitigated in later years when students attended signifi-
cantly higher-performing receiving schools.37 A small
number of studies have found positive effects involving
closures where there is less disruption for students,
such as phase-outs rather than immediate closures,
particularly for high school phase-outs.38
In addition to studying the effects on test scores, a
limited number of studies also looked at the impacts on
other kinds of student outcomes. For example, a recent
study of high school closures in Milwaukee found nega-
tive short-term effects on both GPA and attendance, but
students bounced back over time.39 Studies that looked
into the effects of high school closures on high school
graduation rates showed mixed results.40 In addition,
researchers also found short-term negative effects on at-
tendance after elementary schools closed in Pittsburgh
and Philadelphia.41
Policymakers rarely mention the effects of closing
schools on the students in receiving schools, and prior
evidence from a small number of studies is mixed. One
study, for example, found no adverse effects on receiv-
ing school students’ test scores,42 while another found
modest but significant negative effects on students’ test
scores in receiving schools.43 In addition, a study of
closed schools in Pittsburgh and Philadelphia showed
that absenteeism increased for students in receiving
schools as a result of closures.44
Very little research has been done on the experi-
ences of families, students, teachers, and other school
staff after transitioning to receiving schools. The few
studies out there suggest that those impacted can
experience a number of adverse academic, social, and
psychological effects when schools close. For example,
staff, students and their families going through a school
closure process may experience uncertainty, apprehen-
sion, and resistance during this time period.45 Student
friendship networks can be lost when students switch to
new schools.46 Affected students may also experience
significant shifts in peer relationships and relationships
with teachers,47 and feelings of safety and security.48
When students transfer to new schools, their families
can lose their social networks; parents may be less likely
to talk to or connect with new parents, thus eroding
social capital.49 In addition, students who transfer to
new schools because of mobility—forced mobility in the
case of school closures, or during traditional transition
periods (e.g. from middle school to high school)—can
experience interruptions in their learning. This is due to
changes in the kinds of curriculum, academic programs,
or offerings that students are exposed to, as well as
differences in instructional approaches and academic
expectations.50 These disruptions can sometimes result
in academic,51 behavioral,52 and attendance issues.53
The Focus of This ReportDistricts across the country are closing schools to save
money, consolidate resources, and as a means to offer
students better educational options. But to what extent
does closing schools actually help students experience
a “brighter future”? Critics warned of a number of pos-
sible adverse effects of closing schools—to what extent
did students and staff in receiving schools experience
any negative effects? Our convergent-parallel54 mixed
methods study helps answer these pressing questions
by zooming in to illustrate what it was like for staff and
students going through a school closings process, as
well as zooming out to look at the impact of the policy
on a variety of student outcomes.
In this study, we illuminate the voices of staff and
students from six designated welcoming schools,
37 de la Torre & Gwynne (2009); Barrow et al. (2011); Engberg et al. (2012).
38 Kemple (2015); Bross et al. (2016).39 Larsen (2014). 40 Larsen (2014); Kemple (2015); Bross et al. (2016).41 Engberg et al. (2012); Steinberg et al. (2015). 42 Engberg et al. (2012). 43 Brummet (2014). 44 Engberg et al. (2012); Steinberg et al. (2015).45 See: Witten, McCreanor, Kearns, & Ramasubramanian (2001);
Ewing (2016).
46 South & Haynie (2004); Deeds & Pattillo (2014).47 Cole & Cole (1993); Seidman et al. (1994); South & Haynie
UCHICAGO Consortium Research Report | School Closings in Chicago 11
comparing experiences across these sites, and adding
a nuanced perspective to the evidence base on school
closures. Whereas most prior studies on school closures
have focused narrowly on test scores or on attendance
and GPA, in this report, we also provide evidence of the
short-term and multi-year impacts of the 2013 round
of school closures on students’ academic, behavioral,
and other relevant outcomes. Our study utilizes rich
longitudinal datasets from CPS on individual students,
teachers, and schools; annual survey data collected
from students and teachers; and information from
interviews with staff and focus groups with students.
Our study addresses the following primary research
questions:
1. How did staff and students affected by school clos-
ings experience the school closings process and sub-
sequent transfer into designated welcoming schools?
2. What effect did closing schools have on closed and
welcoming school students’ mobility, attendance,
suspensions, test scores, and core GPA? 55
Financial, utilization, and performance challenges
faced by districts will likely result in more school
closures in the future, not only in Chicago, but else-
where around the country. As districts across the nation
design closing policies, it is imperative to understand
how these policies affect students, teachers, and admin-
istrators, including the potential benefits, challenges,
and trade-offs. In this report:
• Chapter 1 examines key elements of the school clos-
ings process and policy, including the timeline of
events, as well as a description of how welcoming
schools changed after the merger.
• Chapters 2 and 3 zoom in on the lived experiences
of students, teachers, and staff inside six designated
welcoming schools to detail how the transition
unfolded and what it was like to go through a school
closings process.
• Chapter 4 zooms out to look at the average impact of
school closings on students coming from the closed
schools and students who were already in receiving
schools, including their test scores, GPA, suspen-
sions, absences, and mobility.
• Chapter 5 concludes with some implications of our
findings.
55 Core GPA is the combination of grades in English, math, science, and social studies classes.
UCHICAGO Consortium Research Report | School Closings in Chicago 13
CHAPTER 1
Overview of the School Closings Context and ProcessAt the end of the 2012–13 school year, the Chicago Board
of Education voted to close 49 elementary schools and
a high school program. This was not the first time that
CPS had closed schools, but it was the first time that so
many schools closed in one year. In 2002, three schools
were closed for low performance. Since then, the dis-
trict has continued to close schools almost every year,
with up to a dozen closures happening at once in some
years.56 Low performance and low enrollment were
the main reasons for these prior closures and, in fact,
most schools shuttered in prior years could have been
described as both.
Even though CPS has gone through the process of
closing schools for many years, the 2013 school closures
process was unique, not just in the unprecedented
number of schools closed, but also in other important
aspects. Even though some of those factors were not
directly related to the school closures process, they
indirectly affected the planning. For example, the aca-
demic year started on September 4, 2012 with a longer
school year of 180 days. During the month of September,
a 10-day teacher strike took place and consequently, the
school year was extended until June 24, 2013. In addi-
tion, CPS named Barbara Byrd-Bennett its new CEO in
October 2012. This chapter describes more in-depth the
context and the steps during the 2012–13 school year
leading up to the closure of schools and the transition of
students into welcoming schools in fall 2013.
Leading Up to School Actions AnnouncementBy Illinois law, school districts planning any school
actions, including closures and turnarounds, need to
publish a draft of the guidelines that will be used in
deciding those actions by October and announcements
of any potential school actions need to be made by
December 1 in the year before closures (see Figure 1 for
a timeline of key events during the 2012–13 school year).
A few weeks after Byrd-Bennett was named CEO, CPS
released a draft of the guidelines and created an inde-
pendent Commission on School Utilization to gather
community input and make recommendations on
school actions guidelines. The Commission held a num-
ber of public meetings to gather input from the commu-
nity and issued a report with its recommendations.
In November 2012, the district sought a one-time
extension from the Illinois General Assembly to delay
the announcement of possible school actions from
December 2012 until spring 2013. The district released
a statement saying that extending the deadline to
March 31, “will give the commission the time it needs to
rigorously engage communities and will provide schools
with the time they need to focus on preparing their
students for annual ISAT tests and avoid any distrac-
tions to student learning.” 57 In exchange, the district
agreed to a five-year moratorium on closings that ended
in 2018. With the request granted, the school actions
announcement was extended to the end of March 2013.
Selection and Announcement of Schools for Closure Even though the final list of school actions did not have
to be public until the end of March 2013, the district
announced that 330 schools were underutilized in early
December 2012, suggesting that schools on that list
could be affected by school actions (a general term that
can mean closure, consolidation, reassignment, bound-
ary change, phase-out, or co-location).58 This initial
list included elementary schools, high schools, and
charter schools, regardless of school performance. By
56 Vevea, Lutton, & Karp (2013).57 Chicago Public Schools (2012, November 2).58 CPS labeled a school as underutilized if the enrollment of
the school was below 80 percent of its capacity, measured in fall 2012. Critics of the school closings policy questioned the formula the district used to calculate the utilization rates.
Chapter 1 | Overview of the School Closings Context and Process14
February, the district narrowed the list of 330 schools
down to 129 elementary schools that were under consid-
eration for closure. Using some of the recommendations
from the report issued by the Commission on School
Utilization, the district removed schools from the list
if they were high schools or top-performing schools
according to the district’s accountability system.
At the end of March 2013, CPS announced a final list
of 54 schools slated for closure. The district stated that
community feedback and other recommendations from
the Commission helped them to reduce the number of
the schools on the list. In a CPS press release, they
identified these criteria as “not closing schools that
underwent a turnaround this year or are in buildings
that were constructed or added additional permanent
capacity in the last 10 years, and avoiding where pos-
sible sending students in a closed neighborhood school
to a designated welcoming school more than a mile
away.” 59 The final vote took place at the end of May
2013 and the Chicago Board of Education voted to close
47 elementary schools, one high school program, and to
phase out two more elementary programs within two
years. Four elementary schools got a reprieve when the
CEO withdrew her support for closing them and the
Board of Education voted not to close them.60
Schools and communities had several occasions
from December 2012 to May 2013 to advocate to be
removed from the different lists, but the uncertainty
created an unsettling environment. A first round of
community engagement was hosted by the Commission
on School Utilization in November and December
2012.61 A second round was hosted by CPS from the
end of January until the beginning of March with two
community meetings per CPS network to gather infor-
mation on individual schools that were on the February
list.62 In April 2013, a third round was again hosted
by CPS and focused on the 54 schools on the final list. In
addition, the district held state-mandated public hear-
ings for each of the schools on the final list, presided
over by independent hearing officers. All meetings were
heated and contentious, with representatives from the
schools and families presenting testimony to keep their
schools open.63
After the Board of Education vote took place at the
end of May 2013, there was barely one month until the
end of the school year. The new school year was sched-
uled to start early on August 26, 2013, giving just two
months to prepare the buildings, move supplies and
furniture, and hire school staff to receive students for
the 2013–14 academic year.
59 Chicago Public Schools (2013, March 21b). More schools were removed from the 129 list than those that fit these criteria. We found no additional information that would help us understand what other criteria the district may have used to determine the final list of 54 schools.
60 We could not find any official information about why these particular schools were removed from the list.
61 The Commission wrote a report with recommendations on
school actions. Some of those recommendations were used as criteria to remove schools from the initial lists.
62 District-run schools in CPS are organized into geographic networks, which provide administrative support, strategic direction, and leadership development to the schools within each network. Community feedback from these meetings was used by the district to remove some schools from the 129 list.
63 Ahmed-Ullah (2013, April 25).
UCHICAGO Consortium Research Report | School Closings in Chicago 15
Pre-Announcement Phase
SEPT 2012
• September 4:Most schoolsstarted theacademic year
• September 10th:10-day teacherstrike started
OCT 2012
• October 12:Barbara Byrd-Bennett wasnamed CPS ChiefExecutive O�cer
• October 31:CPS released draftschool actionsguidelines
NOV 2012
NOV 2012
• A Commission onSchool Utilizationwas appointed byCPS CEO; it heldsix public hearingsto gather inputfrom community,the first round ofcommunityengagement
• CPS announcedthe plan to seekan extention tothe December 1statutory deadlinefor school actionsand a five-yearmoratorium onclosures shouldthe extention begranted
Decision-Making Phase
DEC 2012
• December 5:CPS announcedthat 330 schoolswere underutilizedand at risk ofclosure
JAN 2013
• The second roundof communityengagement started; hosted by CPS togather feedback onindividual schools;2 meetings hostedby networks fromJanuary 28 toMarch 4
FEB 2013
• February 13th:CPS announceda list of 129 ele-mentary schoolsunder consider-ation for closure,down from theinitial 330
MAR 2013
• ISAT tests duringthis month
• March 23:The districtrecommended53 elementaryschools forclosure and theclosure of a highschool programin an elementaryschool
• Letters weresent to parentswith informationon designatedwelcoming schools and thedraft transitionplans
APR 2013
• Third round ofcommunity meet-ings; 2 per schoolon the list
• State-mandatedpublic hearingsfor each proposedschool with CPSo�ering testimonyfollowed by publiccomments
MAY 2013
• Updated transitionplans for 9 of theschools afterpublic hearings
• May 22:The Chicago Boardof Education votedto close 47 elemen-tary schools, 1 highschool program,and to phase out 2more elementaryschools within twoyears. Four elemen- tary schools didnot close
• Enrollment fairsheld in eachclosing school
JUN 2013
• June 24:Last day of theacademic yearfor students
JUL 2013
• Updated transtion plans were sent to families
AUG 2013
• August 26:First day of the2013-14 academicyear
FIGURE 1
Timeline of Key Events of the 2012-13 Chicago School Closings Process
Planning and Transition Phase
Chapter 1 | Overview of the School Closings Context and Process16
Assigning and Preparing Designated Welcoming SchoolsAt the same time that district officials announced the
closures list in March 2013, they also announced the list
of designated welcoming schools, which would become
the newly assigned schools for the students previously
attending closed schools. These designated welcoming
schools had to be:
• within one mile of the closed school,
• higher-rated than the closed school according to the
district performance policy rating,
• and have enough available seats to accommodate the
closed school’s students.64
The second criterion was based on the 2012–13 pe-
formance policy rating that schools had and was avail-
able at the time the decisions were made. Three possible
ratings were available under this policy—“excellent
standing” or Level 1, “good standing” or Level 2, and “on
probation” or Level 3—based on a number of different
metrics that included test scores and attendance.65 A
school labeled as higher-rated by the district meant that
either the rating was higher or, in cases when the rat-
ings were the same, the welcoming school was higher-
rated in most of the underlying metrics.66 Thirty-six
of the closed schools had an “on probation” and 11 had
a “good standing” rating in 2012-13. In contrast, 13 of
the welcoming schools had an “on probation” rating, 23
had a “good standing” rating, and 12 had an “excellent
standing” rating that same year. Twenty-two of the
closed schools were paired with a welcoming school
that had the same rating.
The last criterion meant that the majority of the
48 designated welcoming schools (41 of the 48) were
underutilized themselves and therefore included in the
initial list of 330 potential schools to close; otherwise
they would not be able to withstand a large influx of
new students and staff.67
The district announced a series of investments and
supports for these schools in order to help the transi-
tion of students and enhance their learning environ-
ments (see Box entitled “Description of Stated Extra
Supports and Resources for Designated Welcoming
Schools”). Some of those investments were directed to
improve the facilities. In 14 cases, CPS determined, for
different reasons, that the closed school building should
house the designated welcoming school instead of
investing in the welcoming school building. Therefore,
the designated welcoming staff and students had to
relocate to the closed school building.
Receiving an influx of students from closed schools
meant that more teachers and staff would need to be
hired at the welcoming schools. Around 1,100 staff were
employed in the closed schools at the time of closures.
Per the district’s contract with the Chicago Teachers
Union, to fill any open teacher positions at the designat-
ed welcoming schools, teachers from the closed schools
who had tenure with “superior” or “excellent” ratings
on the teacher evaluation system were eligible to follow
their students if positions were open. Displaced teach-
ers had to apply for these positions. If more than one
high-rated tenured teacher from a closed school was
eligible for a single position, seniority was one of the
criteria considered during hiring.68
While the district encouraged families to enroll in
schools before the school year was over, some displaced
teachers and staff did not find out whether or not they
could follow their students into the designated welcom-
ing schools until late in the summer. In part, this was
due to the use of student-based budgeting giving each
school a fixed amount of money per pupil enrolled. Until
there were enough students enrolled into the desig-
nated welcoming schools to fund a position, principals
64 Busing was provided for students when the designated welcoming school was more than 0.8 miles from the closed school. Transportation assistance is offered to specific student populations (i.e., students with disabilities, students in tempo-rary living situations, and NCLB-qualifying students) based on the CPS transportation policy.
65 Schools earned points based on those metrics and an index was calculated based on the percentage of earned points. Level 1 schools received at least 71 percent of available points; Level 2 schools received between 50 and 70.9 percent of
available points; and Level 3 schools received fewer than 50 percent of available points.
66 See Chicago Public Schools (2012) for more details on how the district defined higher-rated schools.
67 Eighteen of the 48 designated welcoming schools remained under the threat of closure when the district identified the list of 129 schools in Febraury 2013. These schools were eventu-ally taken off the list at the end of March 2013.
68 Agreement between the Board of Education of the City of Chicago and Chicago Teachers Union (2012, October 24).
UCHICAGO Consortium Research Report | School Closings in Chicago 17
Description of Stated Extra Supports and Resources for Designated Welcoming Schools
When district officials announced the list of the designated welcoming schools, they also described the investments they planned to make in these schools during the summer before and first year of the transition (2013–14).A This section describes the investments, extra resources, and supports CPS stated they were going to give to the designated welcoming schools. Some investments were allocated to all designated welcoming schools and directed towards enhancing the learning environments:
• Air conditioning in every classroom and a libraryin every school
• iPads for students in grades 3–8 and new orupgraded technology
• Safe Passage routes with Safe Passage workersstanding along designated paths to providestudents travelling to and from designatedwelcoming schools with safer commutes
• Principal transition coordinators to help principalsand school teams create detailed transition plansand support principals through the transitionprocess. These principal transition coordinatorswere retired principals.
In order to support staff in helping students transi-tion, the district planned professional development and other supports for all designated welcoming schools in spring and summer 2013, including: B
• Positive Behavior Interventions and Supports(PBIS) training to help schools set school-widebehavior expectations for students and staff
• Second Step curriculum training to implement inclassrooms and help students build their socialand emotional skills
• Restorative practices training to help prevent andrespond to challenging behavior
• Social and emotional learning (SEL) and othertrauma-informed supports for students throughthe Office of Social Emotional Learning andLurie Children’s Hospital
In addition, designated welcoming schools had access to new discretionary funds during the first year, part of the “Welcoming School Support Fund”, to help with the transition. Some examples of how the district thought principals could use these funds included investing in programs to meet the unique needs of their students (e.g., tutoring, mentoring programs, counseling), hiring extra staff, and/or supporting welcoming events for families, students, and staff during the summer. Depending on the specific needs of designated welcoming schools, CPS said certain schools could get additional investments and supports such as:
• Security and safety supports for inside the schools
• ADA accessibility
• Building upgrades such as painting
• Enhanced lunch rooms and food services toaccommodate the larger student body
CPS also identified some areas of the city that were underserved in terms of access to high-quality pro-grams. In order to address that, 17 of the designated welcoming schools in different neighborhoods got new programs in their schools. Ten schools got a Science, Technology, Engineering, and Math (STEM) program; six received an International Baccalaureate (IB) program; and one started a new Fine Arts program.
A Chicago Public Schools (2013, March 21b). B Chicago Public Schools (2013, August 22).
Chapter 1 | Overview of the School Closings Context and Process18
could not hire staff.69 Yet, there was uncertainty about
how many students would enroll in the designated wel-
coming schools. The district allocated 89 percent of the
student-based budget from closed schools to the des-
ignated welcoming schools before the beginning of the
school year, and waited for final enrollment numbers to
avoid taking some of the money away in September, in
case the enrollment was lower than predicted.70
Merging Two Student and Teacher PopulationsPrevious research on school closings has focused on what
happened to the students attending the closed schools
after the closure, with a few other research studies
unpacking the effects on students in the designated wel-
coming schools. In order to provide a fuller picture of the
effects of the closings, we describe student and teacher
populations in both closed and welcoming schools.
In a prior Consortium study, we showed that 94
percent of students from the closed schools reenrolled
in CPS the following school year, which is comparable
to district exit rates at those schools in earlier years.71
Although the district designated a school for each closed
school, it is an open enrollment system and families
could choose to enroll their children into other schools
with available seats. Among students who re-enrolled
in CPS, 66 percent of displaced students enrolled into
one of the 48 designated welcoming schools with the re-
maining 34 percent enrolling in 311 other schools across
the district.72 On average, the welcoming schools each
received approximately 150 displaced students account-
ing for about 32 percent of their student population in
fall 2013.73 However, some of the welcoming schools
almost doubled their size; in 12 of the 48 welcoming
schools, 40 percent or more of their student popula-
tion in fall 2013 came from closed schools. Meanwhile,
other welcoming schools only got a small percentage
of students from the closed school. For example, six
welcoming schools had only about 10 percent or less of
their student population in fall 2013 coming from closed
schools. In contrast, the 311 receiving schools enrolled,
on average, nine students from closed schools—account-
ing for only about 3 percent of their student population
in fall 2013.74
Tables 1 and 2 show how the student and teacher
populations in the welcoming schools changed after the
merger by showing their characteristics in the year prior
to the announcement (2011–2012 school year, column 2),
and in the year after the closings (2013–14 school year,
column 3). For comparison, the tables also provide infor-
mation about the student and teacher populations in
other elementary schools (columns 4 and 5). As refer-
ence, the tables provide student and teacher charac-
teristics for the closed schools in the year prior to the
announcement as well (2011–12 school year, column 1).
Prior to the announcement year, the closed (column 1)
and welcoming (column 2) schools served students who
were more likely to be Black and receive free or reduced-
price lunch. These schools were also more likely to be
lower performing than other schools in the district
(column 4), and this is especially true for closed schools.
The policy disproportionately affected Black students—88
percent of the students in closed schools were Black com-
pared to 75 percent in welcoming schools and 36 percent
in other schools. Students in closed schools at that time
had average achievement levels that were 0.34 standard
deviation units below the district average. They were also
more likely to be old for their grade (23 percent of stu-
dents from closed schools compared to 11 percent in other
schools), and to qualify for free or reduced-price lunch
(96 percent compared to 85 percent in other schools).75
Table 1 allows for a comparison of how the composi-
tion of welcoming schools changed after the closings (by
comparing columns 2 and 3 from Table 1). Predictably,
about half of the students in the welcoming schools had
been in a different CPS school the year before 2013–14.
While this is mostly mechanical because the students in
closed schools had to switch schools, it makes
69 Karp (2013, October 7).70 Chicago Public Schools Fiscal Year 2014 (n.d.). 71 de la Torre et al. (2015). 72 These schools did not receive extra supports and resources.73 de la Torre et al. (2015). 74 One receiving school that was housed in a building with a
closed school, but was not identified as designated welcom-
ing school, received a large group of students from the closed school: 160 students. More than half of the other receiving schools served fewer than five displaced students.
75 A student who is old for their grade is a student whose age is over the traditional school age for their grade level. When students are old for their grade, it suggests that they have been retained in grade, either that year or in previous years.
UCHICAGO Consortium Research Report | School Closings in Chicago 19
TABLE 1
Student Characteristics by School Type
Student Characteristics
1. Closed Schools
(Fall 2011)
2. Welcoming
Schools (Fall 2011)
3. Welcoming
Schools (Fall 2013)
4. Other
Elementary Schools
(Fall 2011)
5. Other
Elementary Schools
(Fall 2013)
Black 88% 75% 79% 36% 35%
Latino 10% 22% 18% 49% 49%
Free/Reduced-Price Lunch
96% 95% 94% 85% 83%
Students with Identified Disabilities
15% 13% 15% 11% 12%
Incoming Math Achievement (prior spring—standard deviation units)*
-0.34 -0.20 -0.29 0.04 0.04
Same School Prior Year 79% 79% 49% 80% 81%
Number of Students 13,048 15,486 23,297 239,290 243,884
Notes. Student characteristics were taken from fall enrollment at the beginning of each school year. Analysis was restricted to students in elementary school grades K-8. * Test scores were standardized to have a mean of zero and standard deviation of one using the data from the 2012-13 year in order to be able to combine the scores of students in all grades. One standard deviation unit is roughly 30 ISAT points. On average, students have shown annual growth of 14 ISAT points in math. For example, students in closed schools were one-third of a standard deviation below the average student in the district. That translates to 10 ISAT points, close to a year of growth behind the average student.
explicit that there was a large disruption as the welcom-
ing schools had to integrate two student populations and
accommodate a much larger number of students. In con-
trast, in fall 2011, 80 percent of students in most elemen-
tary schools had been in those schools the year before.
Another large difference was in the average achieve-
ment levels of students since the welcoming schools took
in students who were, on average, lower achieving than
the students who were already in the welcoming schools.
Prior to the merger, the welcoming population was scor-
ing 0.20 standard deviations below the district average,
compared to 0.29 below after the merger. These differ-
ences were not uniform across all the welcoming schools.
Figure 2 shows this visually. The blue dot represents
the average ISAT scores for students from the welcom-
ing schools in the announcement year, and the purple
square represents the average ISAT scores for students
in the closed schools that same year. In cases where the
welcoming school students were higher scoring than the
closed school students, the blue dot is higher than the
purple square. The difference in the blue dot and purple
square for each school is shown with the grey line. In
75 percent of the welcoming schools, the closing school
students were, on average, lower performing than the
welcoming students. It is worth noting that, in some
instances, the average performance of students from
closed schools was similar or even higher than the aver-
age performance of students from welcoming schools.76
Table 2 is similar to Table 1, but shows teacher char-
acteristics. In the year prior to the closings announce-
ments (2011–12), the teacher populations in the eventual
closed and welcoming schools had a higher percentage
of Black teachers than the other schools in the district,
with fewer Latino and White teachers. About one-half of
the teachers in closed and welcoming schools were Black
compared to only about one-quarter of teachers in other
district elementary schools. This disproportionality in
the race/ethnicity of the teachers in closed schools was
76 Note that where only one dot can be seen, the achievement levels were the same among students who came from the closed school and students already in the welcoming school.
Chapter 1 | Overview of the School Closings Context and Process20
Designated Welcoming Schools
Sta
nd
ard
Dev
iati
on
Un
its
2.0
1.5
0.5
-0.5
-2.0
1.0
0.0
-1.0
-1.5
FIGURE 2
Incoming Academic Achievement of Students from Closed Schools was Lower than Students at Many, but Not All, Welcoming Schools
Di�erences in Student Math Incoming Achievement
Note: Based on spring 2013 ISAT data. Test scores were standardized to have a mean of zero and standard deviation of one using the data from the 2012-13 year in order to be able to combine the scores of students in all grades. One standard deviation unit is roughly 30 ISAT points. On average, students have shown annual growth of 14 ISAT points in math. To contextualize standard deviations, for example, a di�erence of one standard deviation means the lower scoring students were almost two years of growth behind the higher scoring students.
Average Math ISAT — Students from Closed SchoolsAverage Math ISAT — Students from Designated Welcoming SchoolsDi�erences in Averages
TABLE 2
Teacher Characteristics by School Type
Teacher Characteristics
1. Closed Schools (2011-12)
2. Welcoming
Schools (2011-12)
3. Welcoming
Schools (2013-14)
4. Other
Elementary Schools (2011-12)
5. Other
Elementary Schools
(2013-14)
Black 54% 46% 50% 23% 22%
Latino 7% 9% 8% 21% 22%
White 31% 37% 36% 48% 51%
Female 84% 85% 85% 85% 83%
Graduate Degree 68% 68% 68% 67% 66%
National Board Certified 4% 4% 4% 7% 7%
Years Teaching in CPS 10.8 10.3 10.2 11.3 10.7
Teaching < 4 Years 21% 24% 24% 17% 21%
In Same School for 3 Years in a Row
72% 69% 40% 76% 69%
Number of Teachers 839 975 1,497 12,476 12,063
Notes. The data in this table is for all non-charter elementary school teachers, as charter schools do not provide personnel data to the district. Race data was not available for all teachers and that could affect the percentages reported here. Missing data: 5 percent of teachers in closed schools in 2011-12, 4 percent and 1 percent for welcoming schools in 2011-12 and 2013-14 respectively, and 3 percent and 1 percent for other schools in 2011-12 and 2013-14.
UCHICAGO Consortium Research Report | School Closings in Chicago 21
similar to the trend for students. In 2011–12, the teacher
populations across closed and welcoming schools looked
very similar to each other on many dimensions in addi-
tion to race/ethnicity, including the percent of teach-
ers with a master’s degree, as well as average years of
experience in CPS. When it comes to teacher stability,
around 70 percent of the teachers in the closed and wel-
coming schools in 2011–12 had been in the same school
three years earlier (2008–09).
Table 2 also provides a sense of how much the teach-
ing population changed after the closed and welcom-
ing schools merged—that comparison is shown across
columns 2 and 3. The demographics of the teaching staff
across that time period were very similar in the welcom-
ing schools, as were the qualifications. The major change
was in the stability measures (whether teachers have
stayed in the same school over a number of years), as
well as the overall size of the teaching staff in welcoming
schools. Only 40 percent of the teachers in the welcom-
ing schools in 2013–14 were in the same school three
years prior; this is to be expected given the influx of
teachers from the closed schools. Even though it is to be
expected, this still meant that the welcoming schools
had a larger proportion of teaching staff that were new
to the school than other schools in the district.
The next chapter describes the ways in which the
closings affected the welcoming schools from the per-
spectives of the students and staff who lived through the
merging of the schools. While the statistics on changes
in the population of students and teachers suggest
schools had to make adjustments, to really understand
what happened requires listening to their experiences.
UCHICAGO Consortium Research Report | School Closings in Chicago 23
77 Transition plans were drafted in March 2013 per the IL state law. 78 See: http://www.cps.edu/qualityschools/Pages/parents.aspx, a
page for parents to search different closed school transition plans.79 Principal transition coordinators were retired CPS principals.
CHAPTER 2
Planning and Transitioning into Designated Welcoming SchoolsPlanning and preparing for merging two school popula-
tions was a complicated endeavor. Staff had to think
about such things as reorganizing school space to
accommodate large influxes of new students. Leaders
had to plan for and anticipate changes in how students
would move throughout the building, everything
from scheduling of classes to lunch times. In addi-
tion, administrators had to consider staffing changes
to utilize both existing and incoming staff from the
closed schools. Furthermore, administrators had to
think about the kinds of extra supports they needed to
provide students and staff.
The timing for planning and preparing for this tran-
sition was tight. The earliest administrators and other
staff could begin to plan for how to merge the old and
new populations was once they found out they would
be welcoming schools—around March 2013. However,
final decisions on which schools would close were not
made until the board voted at the end of May 2013. This
left staff approximately three months to prepare for the
merger. In this chapter, we used information obtained
through interviews and focus groups to better under-
stand what it was like for staff and students in welcom-
ing schools during this planning and transition period.
What kinds of initial transition efforts and supports
were provided by district and school staff? How did this
transition process and first year of the merger unfold in
welcoming schools? Were there factors that helped or
hindered the successful transition of students and staff
into designated welcoming schools?
The aim of this chapter and the next is to illuminate
the voices and experiences of those impacted directly by
school closures and transitions into welcoming schools.
Knowing more about the kinds of efforts made during this
critical transition period, including what worked or did
not work well, and the experiences of those going through
a merging process after closures, is important for under-
standing the implications of school closings policies.
Staff perceptions of the support from district person-
nel for transition planning was mixed. By the time CPS
formally announced the final list of closed and welcom-
ing schools in May 2013, draft transition planning was
underway.77 In order to plan for a transition of this
magnitude, the district mandated that all welcoming
schools produce written transition plans and provided
staff with planning templates to fill out. These templates
included sections for staff to give information on how the
welcoming schools would serve their new student popu-
lations, such as plans for students’ social-emotional and
academic learning needs, and more specific plans for stu-
dents with diverse learning needs, English Learners, and
students living in temporary situations. In addition, the
templates included a section for staff to outline proce-
dures and policies to ensure student safety and security.
Lastly, welcoming school staff had to provide specific de-
tails in the appendices on professional development for
teachers, structures, and resources that would be offered
in the schools, and other information such as curriculum
and cultural integration activities. A letter to parents
and staff members in schools proposed for closure, along
with draft transition plans, were sent in March 2013 and
more detailed transition plans were made public on the
CPS website in July 2013.78
Most of the welcoming school administrators in our
sample assembled transition committees, teams, or task
forces to help plan for the transition. To support admin-
istrators through this planning and transition process,
the district assigned each welcoming school a principal
transition coordinator.79 Several of the principals in
our six case schools valued the help they received
from their principal transition coordinators. As one
Chapter 2 | Planning and Transitioning into Designated Welcoming Schools24
Case Study Methodology
Case Study SamplingWe identified six welcoming schools in which to conduct in-depth case studies and make cross-case comparisons. These six welcoming schools had a range of school characteristics and outcomes so that we could capture a variety of transition experiences. Our sample included welcoming schools where at least 30 percent of the merged student populations came from the closed school, which was average. These schools had at least one administrator who was present the year of the merger. The final sample included schools on both the south and west sides of the city, with differing test score growth and perfor-mance levels (two schools were rated in “excellent standing,” one in “good standing,” and three “on probation” in the 2012–13 school year). Lastly, these six schools had a range of levels on school climate indicators such as teachers and students’ feelings of safety in their schools. We also sampled a few welcoming schools that relocated into the closed
school building. Table A summarizes the different characteristics of each of the case study schools (see Appendix A with more detailed information on the school sample and qualitative analysis). Given schools’ pre-closure trends (2009–10 to 2012–13) and controlling for the students being served in these schools, we predicted what the trends would be post-closure years in different outcomes using an HLM model. In the table, ‘as expected’ indicates that the actual school trends were similar to the predicted school trends. ‘Lower than expected’ indicates that the actual school trends were lower than the predict-ed trends. Lastly, ‘higher than expected’ indicates that the actual school trends were higher than the predict-ed ones. See Appendix B for a description of the data and the statistical models used to determine whether the outcomes were higher, lower, or as expected. Starting in March 2016, we conducted 6–8 interviews at each school, including the principal,
TABLE A
The Sample of Welcoming School Case Study Sites had a Range of Outcomes on Test Scores and School Climate Indicators
School 1 School 2 School 3 School 4 School 5 School 6
Welcoming School Relocated to Closed School Building
No No Yes Yes No Yes
Percent of Closed School Students in Welcoming School*
40-50% 50-60% 40-50% 45-55% 30-40% 40-50%
Math ISAT Test Scores
Higher than
Expected
As Expected
Slightly Lower than Expected
Higher than
Expected
As Expected
As Expected
Attendance As Expected
As Expected
As Expected
As Expected
As Expected
As Expected
Teacher Safety (Per Teacher Survey)
Lower than
Expected
Lower than
Expected
Higher than
Expected
Higher than
Expected
Lower than
Expected
Higher than
Expected
Safety Measure (Per Student Survey)
Lower than expected
As Expected
As Expected
Lower than expected
As Expected
As Expected
Classroom Behavior
Lower than
Expected
As Expected
Higher than
Expected
Lower than
Expected
As Expected
Slightly Higher than Expected
Student-Teacher Trust
Lower than
Expected
As Expected
As Expected
Slightly Lower than Expected
As Expected
As Expected
Note: *These ranges represent the percent of the student population in the welcoming schools coming from the closed school the fall of the merger, 2013. Ranges were used rather than actual percentages so as not to identify buildings. Given schools’ pre-closure trends (2009–10 to 2012–13) and controlling for the students being served in these schools, we predicted what the trends would be post-closure years for different outcomes using an HLM model. In the table “as expected” indicates that the actual school trends were similar to the predicted school trends; “lower than expected” indicates that the actual school trends were lower than the predicted trends; and “higher than expected” indicates that the actual school trends were higher than the predicted ones. See Appendix B for a description of the data and the statistical models used to determine whether the outcomes were higher, lower, or as expected.
UCHICAGO Consortium Research Report | School Closings in Chicago 25
CASE STUDY METHODOLOGY.... Continued
assistant principal (if applicable), a student support staff member (e.g., counselor, social worker), and four teachers—two who transferred from closed schools into the welcoming schools and two who were teaching in the welcoming schools prior to the transition. In addition, we conducted two student focus groups in each school with seventh- and eighth-graders—one group with students who transferred from the closed school into the welcom-ing school and one group with students who had been at the welcoming school prior to it becoming a welcoming school. In total, we conducted 40 interviews and 12 student focus groups. In addition, we collected and analyzed school transition plans that were created by staff from each welcoming school in summer 2013. We were unable to gather the views and perspec-tives of district personnel who played a role in the transition process. In 2013, we proposed to interview key district personnel involved in the school closings and transition processes. Our intended objective was to understand, from the district’s perspective, how these individuals facilitated this process, includ-ing the supports, trainings, and information district personnel provided to schools and families. However, the Chicago Public Schools Research Review Board did not approve our request, raising concerns over confidentiality of interview participants due to the small number of central office leaders involved in the process. Subsequent district staff turnover also
made seeking district perspectives not feasible for this study. Whenever possible, we used publicly available information and artifacts to understand how the district facilitated the process.
AnalysisThe qualitative results in this report represent the themes we found across the six case study schools, highlighting the patterns that emerged in all sites. The experiences included in this chapter and the next represent the views of staff and students in these six schools only and therefore are not gen-eralizable to the entire population of welcoming schools. Staff and students in welcoming schools not included in our analysis may have had very different experiences than the students and staff in our sample. At the same time, very clear and consistent patterns emerged across all six of our case study schools, despite being located in differ-ent parts of the city and having different outcomes, indicating that staff and students in other welcom-ing schools may have had similar experiences. In addition to using interview and focus group data, we also analyzed survey data from the My Voice, My School surveys given to CPS students and staff yearly. We included these data to examine whether and in what ways the patterns found in the case study data existed more generally across other welcoming and receiving schools (see Appendix B with more information about survey data).
principal stated, “[The principal transition coordinator]
was extremely helpful because it was at least somebody on
this level I could reach out and touch and so basically
[the coordinator] became very familiar with this building”
(Principal, School 2). Similarly, another principal said
that the principal transition coordinator served as their
“support system” while they were writing the transition
plans and accompanied staff to meetings at central
office (Principal, School 6).
Not all principals in our sample said that their prin-
cipal transition coordinators helped them during the
planning and transition process. When asked to describe
how the principal transition coordinators helped during
the planning period, one principal stated, “Not much.
Very little. Very nice person but basically we did every-
thing ourselves” (Principal, School 4). Overall, the degree
to which the principal transition coordinators helped
during this transition period depended on the match
between principal/school needs and the principal tran-
sition coordinator’s skills and abilities. For example, one
principal said that the principal transition coordinator
provided a lot of encouragement but was “not helpful in
actually making it happen” (Principal, School 5), some-
thing administrators in this school said they needed.
In addition to the principal transition coordinators,
principals in the six schools talked about meeting
regularly with network personnel during the transition
planning time. During these meetings, principals and
Chapter 2 | Planning and Transitioning into Designated Welcoming Schools26
transition teams shared drafts of transition plans for
feedback and received suggestions for improving their
plans. One principal (School 1) referred to network
personnel during this time as “thought partners” in
the planning process. Another principal agreed that
network personnel were helpful during the planning
stages, saying, “Whatever I needed, I called and I got it.”
However, not all of the principals thought that central
office or network personnel supported them adequately
during this crucial period. For example, one principal
(School 4) stated that central office staff asked their
transition team to revise and reword their transition
plan multiple times and that the process itself felt
“unorganized.” Overall, administrators and planning
teams had varying experiences with the supports they
received for planning purposes—from lots of helpful
supports offered to some schools, to little help and sup-
port for other welcoming schools.
Staff said the transition planning process was insuffi-
cient to fully prepare for students in the fall. Planning
is important for a complex process like merging a closed
school into a welcoming school, but staff across the six
schools reported that the process involved filling out a
lot of paperwork—including the district transition plan
template. However, staff recognized that the planning
template they filled out represented what they thought
they might be able to do, but did not often match what
they could actually accomplish once the school year
began. As one principal explained, the template was
“stationary” and meant for a very specific situation,
but the transition process itself was “very organic” and
principals and staff had to be “responsive” to what was
unfolding in real time. As they stated, “So you can write
all the plans you want, but when you get in there, you’re
not sure what’s gonna happen, right?” (Principal, School
1). Therefore, filling out the template ended up being
more about compliance rather than a living document
that was helpful or used once the school year began. As
another principal stated, “… people just sort of started
filling in anything for compliance” (Principal, School 5).
Part of the reason why the process was difficult to
go through and plan for was because of the high degree
of uncertainty involved in merging closed and receiv-
ing school populations. Planning for a transition like
this, according to school leaders, was akin to planning
for the unexpected. Leaders had to adapt in real time
to the shifting and changing circumstances. Staff cited
a number of reasons why the whole welcoming school
planning process was flawed, including the truncated
and rushed planning time, not knowing how many
students or staff would be joining the welcoming school
from closed schools, funding uncertainties associ-
ated with student-based budgeting, and uncertainties
around planning for the physical accommodation of
large influxes of new staff and students. Because of
these challenges, many of the administrators said the
planning directives and paperwork they had to fill out
a few months prior to the merger were not helpful.
Furthermore, in two of the six schools, new admin-
istrators took the reins during the late summer of the
transition year, but were not yet in buildings when tran-
sition plans were being developed by other staff mem-
bers, including outgoing principals. These principals
believed that not being a part of the planning process
made it even more difficult for them to carry out the
transition. As one new principal recalled about the
transition plans they inherited, “It wasn’t a clear road-
map of what this welcoming school was supposed to look
like” (Principal, School 5). Overall, staff across each of
the six schools said that once the school year started,
much of what they planned for “went out the window.”
Valuable supplies and materials were lost during the
moving process, leading to significant challenges for
staff. Staff across the six schools cited logistical issues
that delayed their readiness to receive students in fall
2013. One of the largest impediments to getting ready
for the school year was that staff lost valuable school
supplies and materials during the move. At the end of
the 2012–13 school year, all contents in the closed and
welcoming school buildings had to be packed up, includ-
ing all of the technology, books, furniture, etc. Some
of the welcoming schools moved into closed school
buildings, while others had to be packed up because
administrators were moving classrooms around and
rearranging space to accommodate staff and students
coming in from the closed buildings. Roughly 95 school
buildings needed to be packed up for the move at the
end of the 2012–13 school year.
UCHICAGO Consortium Research Report | School Closings in Chicago 27
When staff arrived to the school buildings to get
ready for the first day of school, administrators and
teachers said that they could not find some of their
school materials that they had packed up at the end of
the last school year. Boxes were stacked in hallways and
auditoriums and staff had to unpack and sort through
what they described as a complete mess. In some build-
ings, administrators said that what they did get tended
to be older supplies or equipment rather than what they
had before the move. In addition, some staff lamented
that valuable equipment was destroyed or lost during
the transport. Teachers and staff in all six schools
described that time period as “chaotic.” As one teacher
recollected while going through boxes:
“Nothing was left … It was like they packed it up,
they took it to a warehouse, and then they brought
it all back and just put it anywhere. And so it was
chaos … So some of the things that I was used to
finding, if I couldn’t find it, I didn’t have it anymore.”
(Welcoming school teacher, School 6)
In two instances, teachers from the closed schools
believed that their old materials were offered to other
schools within their network before they were offered to
staff in the welcoming school. One teacher recalled after
going to the closed school to try to collect supplies:
“Books were thrown all over the floors and every-
thing was just in a terrible, terrible mess. It was a
horrible mess. They [the closed school] used to have
a really nice audiovisual system in their audito-
rium, so one of the teachers went to get it, and it
had already been taken … Everything was gone.”
(Welcoming school teacher, School 1)
District personnel, and in some cases students, were
deployed to welcoming schools to help unpack. Staff
also talked about family members and friends coming
to help them unpack and set up to get the school ready
for the start of the school year.
As a result of the disorder with the move and the loss
of materials, teachers did not always have enough text-
books or supplies for students and in some instances
did not have any books in particular subject areas at the
start of the school year. Losing instructional materi-
als and classroom supplies was disastrous for teachers,
especially because many teachers use their own money
to buy materials. Ultimately, teachers and staff in the
six schools interpreted these losses as a sign that the
district did not respect staff or care about the students
in these schools. As one teacher explained, “CPS doesn’t
care. They just don’t care, and it shows” (Welcoming
school teacher, School 1).
Poor welcoming school building conditions hindered
school staff from creating clean and inviting environ-
ments for their students and communities at the start
of the year. In addition to having to deal with the clut-
ter of moving boxes and unpacking, staff faced another
logistical challenge during this transition time—some
building upgrades were delayed and many staff per-
ceived the welcoming school buildings as being unclean
and/or needing serious repairs. For example, one school
did not have doors on the bathrooms; in another, the
bathroom stalls had no locks on them. One principal
from a welcoming school that moved into the building
of the closed school called the condition of the building
“filthy” when they moved in.
Some buildings did get upgrades that first year, but
most interviewees said they were disappointed in the
district’s building improvement efforts—either because
they perceived them as poorly done and/or because
the upgrades were not made in a timely fashion. For
example, one principal stated, “They half painted. They
didn’t really paint the corridors or anything. It was very
tacky … So we’re still working on getting things in order
as far as the building” (Principal, School 4). Another
principal shared similar sentiments, saying, “All they
[the district] did was put in air conditioners … But they
were dragging their feet, and the building wasn’t clean.
And I really think that was a systemic issue” (Principal,
School 6).
The inadequacy of the building space resulted in
administrators and teachers spending a lot of time
cleaning and preparing the physical space rather than
focusing on instructional planning. For some staff, the
fact that the buildings were not ready and the promised
improvements were not made before the beginning
of the school year felt like a big setback for them. As
one principal from a school that moved into the closed
school building explained:
Chapter 2 | Planning and Transitioning into Designated Welcoming Schools28
“So I think that they could have had this building
more prepared to receive us, to make it look like a
new school for the current students that were at
[the closed school]… and then the [welcoming
school] students would feel like they were actually
coming to some place that was nice and new and
clean vs. coming into something that wasn’t ready or
prepared to receive us. I think that was the biggest
downfall, the way we came into this building, which
was a big setback for us.” (Principal, School 4)
In addition to the challenge with accommodating
a larger student population, in a few of the schools,
students and staff were confused about why the district
chose one of the buildings over the other. Some staff
and students said that the other school buildings were
preferable, meaning they were nicer, newer, or had
coveted features such as gymnasiums or auditoriums.
Because of this, several staff and students said they felt
like they were sent to less desirable school locations,
which made it even harder for them to accept the fact
that their schools were shuttered.
Overall, poor building conditions were seen as a detri-
ment to preparedness, undermining community hope-
fulness about the transition. These sentiments mirror
research evidence, which suggests that it is difficult to
create strong learning environments in facilities with
poor structural quality.80 Students and staff can feel dis-
couraged and deflated when they have to teach and learn
in run-down buildings. Several of the interviewees com-
mented that because the buildings they ended up in were
not well cared for, that it was another sign of the lack of
respect on the part of the district and especially for fami-
lies and children of color impacted by school closures.
Because of the large influx of students, scheduling
and allocating the physical use of space was also a
major challenge for administrators. In addition to the
logistical issues outlined above, administrators also
struggled with scheduling and planning for the use of
physical space, given the large enrollment increases
in these welcoming schools. In two of the schools, for
example, there was not any room for libraries, despite
the fact that all welcoming schools were promised a
library. Students in these two schools confirmed
this, saying things like, “We don’t have a library” and
“We don’t really have the library no more.” In two other
schools, administrators had to repurpose gymnasiums
for storage or other uses, prompting students to lament
the loss of exercise space. As one closed school student
explained, “I felt very angry when I found out that we
was coming over here … cause this [building] ain’t got no
gym room, ain’t got no auditorium.” Administrators also
talked about having to store supplies in classrooms and
auditoriums. For those welcoming school administra-
tors who moved into the building of the closed school,
planning for the physical usage of space was even more
daunting given that they moved into unfamiliar spaces.
Because all of the case study schools had large influx-
es of new students and staff, administrators and teachers
talked about having to rework schedules, including
everything from classes, to prep times, to lunch and
testing schedules. For example, one assistant principal
talked about the difficulty of scheduling students to take
exams. They said, “So instead of scheduling 200 students
or 150 students to test, now I need to schedule for 500 and
something students” (Assistant principal, School 1).
Another teacher talked about all of the complexities that
result from the merging of two populations. They explained:
“So I don’t think any of us understood the impact of
trying to learn 300 new students and dealing with so
many [new] parents. And we had a hard time trying
to figure out how could we get all of these kids fed in
one day and everybody get recess and the bathroom
situation, because there are like eight to ten classes
per floor with only one girls and one boys bathroom.
How are we gonna get all of these people in the bath-
room throughout the day? So that was big. [Laughs]
Scheduling was so much, and then providing preps
for all of these teachers. So it was a big scheduling
issue.” (Welcoming school teacher, School 6)
There were additional district-level changes on top
of school mergers, overwhelming staff in welcoming
There Were Similar Trends on How Safe Students Felt Travelling between Home and School After the Merger
Student Reports on How Safe They Felt Travelling between Home and School (Percent of Students Agreeing or Strongly Agreeing)
Note: This graph represents student responses on the My Voice, My School surveys. They reported on the school they attended in that particular year. See Appendix B for more details.
Closed Schools Designated Welcoming Schools Other Elementary Schools Other Receiving Schools
There Were No Major Changes in How Safe Students Felt Outside the Welcoming Schools after the Merger, but Safety is Still a Major Concern in Communities A�ected by Closures
Student Reports on How Safe They Felt Outside around School (Percent of Students Agreeing or Strongly Agreeing)
Note: This graph represents student responses on the My Voice, My School surveys. They reported on the school they attended in that particular year. See Appendix B for more details.
Closed Schools Designated Welcoming Schools Other Elementary Schools Other Receiving Schools
Chapter 2 | Planning and Transitioning into Designated Welcoming Schools32
staff received very little guidance on how to prepare
for large influxes of new staff and students. The things
the district did provide, such as the principal transition
coordinators and network personnel support, were not
sufficient for schools to handle all of the organizational
challenges. Delays in building preparation and the mis-
management of moving supplies and materials hindered
schools from creating welcoming spaces for students and
families. Administrators in these six sites said that they
did not have a lot of power or control over processes that
Wished-for Supports: Planning and Logistics
When asked what planning and logistical supports staff and students wished they had during the transition year, they gave a variety of suggestions, including:
• More support and training on dealing with logisticalchanges associated with large increases in schoolsize. Staff reported feeling overwhelmed by thelarge influx of students and struggled to adequatelyplan for the myriad of activities, from meals, to pass-ing times, to scheduling, etc. Many of these logisticalhurdles took much longer and required more timeand thoughtful planning than anticipated.
• More care and effort in managing the move ofsupplies and equipment. Staff lost their schools’,and in many instances their own, materials. Staffwished district personnel focused more attentionon what teachers needed to teach effectively andshowed more respect in teachers’ ownership overtheir own materials.
• Greater attention and investments made to wel-coming school facilities. Staff wished that build-
ings were ready and functional by the start of the school year. When students, families, and commu-nities lost their schools, staff in welcoming schools wished they could have provided a more attrac-tive, inviting, and welcoming space for their newly merged communities.
• More concerted, cohesive, and thoughtful effortby the district to bring principals going throughthis process together so that they could supportone another in figuring out how to organize theirschools and build a new school community.
• Longer term funding so that schools could contin-ue paying for extra student support personnel andresources. Some staff said having to cut neededsupport staff and/or not upgrade technology afterthat first year was detrimental to their continuedefforts to successfully merge communities.
they normally have control over because of late district
decisions, the lack of adequate building supplies and ma-
terials, as well as changes in networks and expectations.
The majority of interviewees said they felt as though
this transition process produced more losses for them,
their schools, and their communities, than gains.
In the next chapter, we illustrate the ways in which
staff and students in welcoming schools adjusted to the
newly merged environments, focusing on their efforts
to rebuild community.
UCHICAGO Consortium Research Report | School Closings in Chicago 33
CHAPTER 3
Building Relationships and School Cultures in Welcoming SchoolsMerging closed schools into welcoming schools involved
not only logistical and structural considerations as
outlined in Chapter 2, but also the complex social and
relational aspects of blending previously separate school
communities. Schools are social organizations in which
staff, students, and families interact with one another
regularly, forming a network of relationships.82 Strong
relationships characterized by high levels of trust and
collaboration are essential elements in well-functioning
schools. Schools are much more likely to improve, for
example, if they have strong professional community
among teachers, trust, and parent and community en-
gagement.83 Teachers are more likely to stay in schools
with trusting, supportive, and collaborative learning
environments and students are more likely to learn and
grow in these contexts.84 When schools are closed and
merged into another school, it can alter the delicate
social dynamics and cultures of school communities.
Different aspects of what makes a school a community
can shift, including individuals’ or groups’ sense of
membership or belonging, the degree of collaboration
and communication, as well as the level of trust and in-
fluence individuals and groups have within the school.85
In addition to altering the social dynamics of
schools, the merging process can also influence the
culture of a receiving school. Schools have their own
unique cultures and identities.86 Every school, for
instance, has its own norms, routines, goals, rules,
and rituals. Some schools have assemblies to enhance
school spirit, for example, while others have school
creeds that students read together each morning. A
school may have a mural representing the school’s val-
ues or mascots that characterize the school’s individu-
ality. When schools close, those unique things are likely
to be lost, and students and staff from closed schools
mourn that loss. When they enter a receiving school,
they may encounter a different school culture, resulting
in tensions and conflicts in some cases.
Creating strong relationships and building trust in
welcoming schools after schools closed was difficult.
Displaced staff and students, fresh from losing their
schools, had to go into unfamiliar school environments
and start anew. Staff in receiving schools had to think
about and plan for how to welcome newcomers from
closed schools into their building. In this round of
closures, enrollment in welcoming schools increased by
approximately 150 students. They also had to figure out
how to (re)build community and culture, while plan-
ning for and anticipating any potential issues that may
arise from bringing together students from different
neighborhoods. School leaders had to try to build trust
with the community and help staff, students, and fami-
lies build trust and relationships with one another.
In this chapter, we again use interviews with staff
and focus groups with students from the six welcoming
schools, as well as survey data to explore how staff and
student relationships, trust, and school culture shifted
as a result of merging closed schools into welcoming
schools. The highlighted findings represent the key
themes we found across the six case study schools, and
are based on the views, experiences, and perceptions of
staff and students in these schools. How did staff and
students from closed schools adjust to merging into wel-
coming schools? What kinds of welcoming events and
supports were offered and how did staff and students
respond to them? What was the process like from the
perspective of welcoming school staff and students? In
addition, were there factors that helped or hindered the
successful transition of students and staff into desig-
Students’ Assessment of Trust in their Teachers was Lower After the Merger, but Improved Over Time
Student-Teacher Trust
Note: This graph represents student responses on the My Voice, My School surveys. They reported on the school they attended in that particular year. The measure was standardized to have a mean of zero and standard deviation of one by year. A value of zero represents the average across the district. See Appendix B for more details.
Closed Schools Designated Welcoming Schools Other Elementary Schools Other Receiving Schools
“… there was a little tension in the beginning with
some of the teachers coming in and they’re not
having their principal and they’re kind of having
a new set of expectations. That was met with some,
a little bit of angst—I’ll put it like that—and some
did not take it well and some decided to leave.”
(School counselor, School 2)
Another closed teacher said that in the welcoming
school she joined, teachers were expected “to rise to the
occasion. Get in or fit in or [you’re] out” (Closed school
teacher, School 4). As mentioned above, teacher and stu-
dent mobility was an issue the first year of the transition.
Several principals believed that students and teachers
left the welcoming schools at higher rates than previous
years because of the rough transition period and differ-
ences in culture and expectations.
These conflicts emerged across the six schools, but we
also wanted to investigate how pervasive these dynamics
were across all of the welcoming schools. My Voice, My
School survey data showed that staff relationships across
all of the designated welcoming schools declined dur-
ing the year of the transition. Figure 6 displays survey
responses of teacher-teacher trust averaged across all 48
UCHICAGO Consortium Research Report | School Closings in Chicago 41
Trust Among Teachers in Designated Welcoming Schools Declined the Year of the Merger
Teacher-Teacher Trust
Note: This graph represents student responses on the My Voice, My School surveys. They reported on the school in which they worked in that particular year. The measure was standardized to have a mean of zero and standard deviation of one by year. A value of zero represents the average across the district. See Appendix B for more details.
Closed Schools Designated Welcoming Schools Other Elementary Schools Other Receiving Schools
welcoming schools from the 2008–09 school year until the
2016–17 school year. Survey items included questions such
as teachers in this school trust each other, feel respected
by other teachers, and feel comfortable enough to discuss
feelings, worries, and frustrations with other teachers.
As shown in the figure, trust between teachers in
designated welcoming schools dropped the first year of the
transition (from 2012–13 to 2013–14). Trust also dropped
a bit in the other receiving schools—schools across the
district that took in displaced students—in the 2013-14
school year. However, by the second and third year after
the merger, staff relationships appeared to have improved.
It is worth noting that teacher trust in the closed schools
in years prior to the announcement year was lower than
other schools across the district. It was only during the
announcement year that trust improved in these schools—
matching the average levels of teacher trust in the district.
Over time, staff who came from closed schools
and staff already in welcoming schools began to form
new common identities. After the first year, relations
between teachers in all six schools improved. As one
closed school teacher put it, “It is definitely not that feel-
ing of us against them anymore” (Closed school teacher,
School 6). And another teacher said, “Right now, I think
we are more like a family, now, because after four years,
it’s getting better. Little by little, it’s getting better”
(Closed school teacher, School 1).
There was an increase in fights and bullying between
students from the closed and welcoming schools.
Over time, student relationships improved. As a result
of feeling marginalized in the welcoming schools, staff
and students said there was an increase in student
fights and bullying, especially the first year of the
transition. For example, one student said, “That’s one
thing that’s increased a lot—fights and drama. Drama’s
the most major thing—” (Welcoming school student,
School 1). Welcoming school staff and students, in each
school, identified students coming from the closed
schools as the instigators and troublemakers. For
example, one staff member from a welcoming school
said students from the closed school were “fighters.”
Another teacher reiterated this sentiment, saying:
“Our school prior to being a welcoming school
had discipline issues, but they were not as severe
as the discipline issues that we experienced when
we became a welcoming school.” (Welcoming school
teacher, School 6)
Chapter 3 | Building Relationships and School Cultures in Welcoming Schools42
In other instances, closed school students were
labeled as “hostile” or as “rougher” and more “aggres-
sive” than welcoming school students. In most cases,
staff acknowledged that closed school students were en-
tering into the welcoming school only because they lost
their school, so to many it was not surprising that they
were angry. However, welcoming school staff reported
that they did not have the support or training they felt
they needed to handle students’ grief and anger.
Across all designated welcoming schools the first year
of the merger, the percentage of teachers who indicated
on the My Voice, My School surveys that such things as
physical conflicts, threats of violence toward teachers,
gang activity, and general disorder increased substantial-
ly from the previous year. After that first year, teachers’
perceptions of conflict within the schools decreased, but
those perceptions remain higher than before the merger
(see Figure 7). Prior to school closings, teachers in the
closed schools reported the highest incidences of con-
flicts and threats compared to teachers in other schools
across the district. Four years after the merger, the level
of conflict and disorder teachers felt fell in-between the
prior levels at both the receiving and closed schools.
Students across all designated welcoming schools
also reported an increase in fights and bullying in their
schools. Figure 8 shows that the year of the merger,
students were more likely to report having to worry
about crime and violence in their schools. Students in
designated welcoming schools also reported higher
incidences of being bullied, teased, or threatened the
year of the merger. Over time, students’ reports of these
incidences lessened. Nonetheless, students coming
from closed schools reported much higher incidences
of conflict than students in other buildings, suggesting
that the social needs of these students may have been
different than for other students across the district.
Staff attributed increases in student fights to a num-
ber of possible reasons. Some thought that it stemmed
from long-standing rivalries between the two student
populations, whereas others believed that closed school
students had a hard time adjusting to the expectations
of the welcoming schools and were still dealing with
mourning their previous schools. Many staff believed
that discipline policies tended to be lax in the closed
schools, so students were not used to consequences
for poor behavior. Still others believed these issues
stemmed from the various social-emotional learn-
ing needs of the incoming student population, mixed
with welcoming schools not being prepared to deal
with these issues adequately that first year. Displaced
students did say that they had a rough time adjusting
because they still identified with their closed schools
and felt sad that it closed. One student from a closed
school agreed that their behavior got worse when they
came to the welcoming school. They said,
“I argued ever since I got to [the welcoming
school]. I would argue with my teachers a lot.
And it’s crazy because that was never a problem
for me, never a problem for me at [the closed
school].” (Closed school student, School 1)
Some welcoming school students from this school also
felt neglected, suggesting that the staff focused so much
on helping the closed school students that they “forgot”
about the students from the welcoming school. In other
schools, displaced students said they felt like they were
blamed for the poor behavior of a very small group of
students. Even four years following the closings, students
said some of the comparisons and stereotypes lingered,
but it has gotten better over the years.
Rivalries and feelings of alienation ran high during
the first year of the merger, but students across all six
schools said that relationships between the two student
populations improved over time. Eventually students
became friends with one another and no longer identi-
fied as being from the closed or welcoming schools. For
example, one student said of their school now:
“I like the people that go here ‘cause it’s like I
wouldn’t say it’s the same [as before the merger], but
even though it took a while for everyone to get used
to it, it’s like we all have fun now. We joke around
with each other. It’s almost like a family to me.”
(Welcoming school student, School 1)
Another student also talked about adapting to the
welcoming school, saying, “I didn’t like it [the welcoming
school] at first at all but then I became more accompanied
to it and I got through it” (Closed school student, School
6). Overall, interviewees felt like the students adapted
more quickly than the adults did. As one teacher put it:
UCHICAGO Consortium Research Report | School Closings in Chicago 43
Teachers’ Assessment of Conflict and Disorder Increased After the Merger, Especially the First Year
Teacher Reports on Conflict and Disorder
Note: This graph represents teachers responses on the My Voice, My School survey Teacher Safety measure. They reported on the school in which they worked in that particular year. The measure was standardized to have a mean of zero and standard deviation of one by year. A value of zero represents the average across the district. See Appendix B for more details.
Closed Schools Designated Welcoming Schools Other Elementary Schools Other Receiving Schools
Students’ Assessment of Conflict and Bullying Increased After the Merger, Especially the First Year
Student Reports on Conflict and Bullying
Note: This graph represents student responses on the My Voice, My School survey School Safety measure. Higher values on the graph represent more conflict and bullying. They reported on the school they attended in that particular year. The measure was standardized to have a mean of zero and standard deviation of one by year. A value of zero represents the average across the district. This particular measure was asked for the first time in the school year 2010-11. See Appendix B for more details.
Closed Schools Designated Welcoming Schools Other Elementary Schools Other Receiving Schools
Chapter 3 | Building Relationships and School Cultures in Welcoming Schools44
Wished-for Supports: Building Community
When asked what relational supports staff and students wished they had during the school closings process to support building relationships and community in the welcoming schools, and throughout the first years after the merger, they gave a variety of suggestions, including:
• Validation for their feelings of loss and grief. Affected staff, students, and families mourned the loss of their schools and what their schools meant for their community. They wanted that loss to be recognized by the district.
• More support, training, and guidance on how to merge schools and create a new school culture to-gether. Newcomers entering into welcoming schools also wanted welcoming school staff to acknowledge that there are different ways of doing things.
• More thoughtful and proactive planning and train-ing around what staff might anticipate happening when schools merge, including strategies for how to address potential divisions resulting from an “us” vs.“them” mentality.
• Support groups or other venues to voice their con-cerns, feelings, and needs throughout the process
for all those affected, including staff, students, and families from both welcoming and closed school communities.
• More general emotional support for staff, along with an acknowledgement that the merging process was very difficult to go through. In general, staff felt like there was a great deal of focus on students, which was warranted, but not any emotional support for adults throughout the process.
• Longer-term social-emotional supports for students. Students’ grief, loss, subsequent behavior, and aca-demic needs did not end at the end of the first year of the merge. Staff said they wanted supports to last at least through the second year.
• More communication, clarity, and transparency from the district during the announcement year and clos-ings process.
“Students adapt a lot faster than adults do, so that’s
a good thing about being a child. I think that the
students have—at the beginning, it was really dif-
ficult for them, because they felt ostracized... But,
in general, I would say that the kids pretty much
adapted well. By the second year, they were already
building friendships, and doing that a lot. I think it
was easier for the kids than it was for the adults.”
(Closed school teacher, School 1)
When schools close and displaced staff and students
are sent into receiving schools, it is important to rec-
ognize the complex relational dynamics at play. In all
of the schools in our sample, relationships suffered and
trust was lost, which affected the culture and learning
environments of the schools. Prior to the actual merger,
school communities felt as if they were competing with
one another to stay open, which made accepting the
loss and merging into the welcoming schools that much
more difficult. Creating social cohesion and strong
school cultures in welcoming schools took time and a
great deal of support. Closed school staff and students
came into welcoming schools grieving and in some
cases resentful that their schools closed, while other
schools stayed open. Welcoming school staff and stu-
dents also grieved the way their school used to be, and
educators said they were unprepared to deal with new
populations and resulting divisions. Furthermore, lead-
ers did not know what it took to be a successful welcom-
ing school, suggesting a need for more ongoing training,
reflections, and support. Staff and students said that it
took a long period of time to build new school cultures
and feel like a cohesive community.
In the next chapter, we widen our lens to look at the
average effects of closing schools on a variety of student
outcomes. We explore not only the effects on students
whose schools were closed schools but also on the stu-
UCHICAGO Consortium Research Report | School Closings in Chicago 45
CHAPTER 4
Impact on Student Outcomes
Chapters 2 and 3 focused on the experiences of students
and staff in six welcoming schools as they merged their
populations with the one from the closed schools. This
chapter zooms out and describes the average impact of
school closings on all students affected by the 2013 clo-
sures through the 2016–17 school year. Using adminis-
trative data, we analyzed school transfer rates, number
of days absent, suspension rates, reading and math test
scores, and core GPA for students from closed schools,
as well as students from the welcoming schools.
As described previously, the district intended for
students from closed schools to transfer to higher-
rated welcoming schools to improve their academic
opportunities. Welcoming schools also had to have
enough available seats in order to accommodate stu-
dents coming from the closed schools. The district
made investments in welcoming schools to expand
students’ learning opportunities, such as implementing
a new STEM program or IB. By consolidating the school
populations, welcoming schools would have more
resources due to increased enrollment and extra funds
associated with student-based budgeting. In theory,
these efforts pointed to potential enhanced learning
environments for displaced students, as well as for stu-
dents in the designated welcoming schools, that could
improve student outcomes.
At the same time, the challenges of merging the
student and staff populations could potentially nega-
tively affect student outcomes. Previous chapters
showed that disruptions were common and trust was
low in the case study schools, at least in the first year.
The merger brought new challenges that could interfere
with educators’ ability to provide an environment
conducive to learning. In addition, all the students
from closed schools had to attend a new school with
the added stress of adjusting to new rules, expectations,
curriculum, and peers. Students already enrolled in
welcoming schools also had to adjust to increased
class sizes and larger schools in general. In addition,
14 of the welcoming schools moved to the closed
school building, meaning that these students also
faced new commutes to school and different building
conditions.
We studied a range of student outcomes to offer a
nuanced picture of the impacts of school closures.
We started by looking at student mobility—whether
displaced students changed schools again within a
year—after the first transition from their closed schools.
If the school attended right after the closures was not
a good fit, students might have been more likely to
change schools to find a better fit. Moreover, welcom-
ing school students might have transferred out of these
schools prior to the merger or in subsequent years. We
also explored student absences as a measure of whether
students were engaged in school and because it is a good
predictor of student performance.91 Furthermore, we
examined changes in student suspension rates over
time. In previous chapters, we learned that staff and
students reported more fights among students after
the merger and found that students were experiencing
loss and stigmatization. Lastly, we explored changes
in student performance. We followed students’ test
scores in math and reading, and core GPA, to measure
the degree to which students’ improved their academic
performance. Core GPA is associated with a higher like-
lihood of being on-track in ninth grade and graduating
from high school, much more than test scores, so it is an
important indicator to review.92
We examined student outcomes over nine years: four
years pre-closures (from 2008–09 to 2011–12), during
the year of the announcement (2012–13), and four years
post-closings (from 2013–14 to 2016–17) to show how
91 Aucejo & Romano (2016). 92 Allensworth, Gwynne, Moore, & de la Torre (2014).
Chapter 4 | Impact on Student Outcomes 46
the outcomes changed.93 Our sample is comprised of
students who were in grades K-7 in spring 2013, which
included 10,708 students from closed schools and 13,218
students from welcoming schools.94
How we determined the effects of school closures on
student outcomes. In order to determine the effects
of school closures on student outcomes, we compared
the trajectories of students affected by closures with
students in similar schools that were not affected by
any school actions.95 These comparisons allowed us to
estimate how students would have performed had their
schools not been affected by school closures. These
comparisons also helped to take into account other
changes that occurred in the district that should not be
attributed to the impact of school closures, such as the
change to the disciplinary policy in 2013–14. The fig-
ures presented in this chapter display how much higher
or lower the outcome would have been for the affected
students, focusing on the effects of the policy (see box
entitled ‘Measuring the Effects of School Closures’
on p.47 for more details on methods and figures). For
readers interested in the outcome trends over time for
affected students, see Appendix B.
We compared the outcomes of students from closed
schools to a group of students in similar schools
before the decision to close schools was final. To do
this, we selected the students who were attending the
other schools that were on the potential closing list in
February 2013 and were not affected by any school ac-
tions, such as turnaround or being a welcoming school.
These were 49 elementary schools that were not closed,
but were also underutilized (their average utilization
rate was 51 percent) and either rated “on probation”
(Level 3) or in “good standing” (Level 2); they enrolled
14,734 students in grades K-7 in May of 2013.96 The
comparison group of students were attending similar
schools to the closed ones and in the absence of clo-
sures, the displaced students would have been in simi-
lar circumstances. Thus, the outcomes of students in
the comparison group serve as a way of measuring the
expected outcomes for students in closed schools, had
their schools not closed.
Similarly, we compared the outcomes of students
from welcoming schools to a group of students that
were in similar schools to the welcoming schools prior
to the merger. Welcoming schools were selected to
be higher-rated based on the accountability rating
given to schools in 2012–13 at the time of the decision,
within a mile of closed schools, and with enough seats
to accommodate the students from closed schools. We
selected a comparison group of schools to satisfy the
same criteria, meaning they were higher-rated than the
closed schools and had enough capacity to withstand a
large influx of students. One small difference was that
we selected comparison schools that were just beyond a
mile (between 1 mile and 1.3 miles from closed schools).
Because they were over a mile away, these schools were
not under consideration to be welcoming schools, but
they were similar to those schools in other characteris-
tics. There were 73 comparison schools within the 1 to
1.3 mile distance satisfying these restrictions serving
25,947 students in grades K–7 in May 2013.97 These
comparison schools had an average utilization rate of
65 percent, and a similar distribution of performance
levels as the welcoming schools.98
93 Because we study the outcomes of a group of students in grades K-7 in May 2013 and follow them over time, the estimated effects in the first year post-closures are based on all students since all students should be in grades 1–8 in the 2013–14 school year. However, because we looked over time, the estimated effects in later years were based on students who remained in elementary grades. For example, the students who were in fourth grade the year of the announcement were in eighth grade in 2016–17. Thus, students that were in upper grades aged-out of the sample over time.
94 See ‘A Look at Student Characteristics’ box on p.48 and Appendix B for details on the characteristics of the students.
95 The methodology used is commonly known as a difference-in-difference approach because it compares changes in the affected group to the changes in a comparison group. See Appendix B for more details on the statistical models and the comparison groups.
96 See ‘A Look at Student Characteristics’ box on p.48 and Appendix B for details on the characteristics of the students.
97 See ‘A Look at Student Characteristics’ box on p.48 and Appendix B for details on the characteristics of the students.
98 See Appendix B for more details on the comparison group of schools for the welcoming students.
UCHICAGO Consortium Research Report | School Closings in Chicago 47
Measuring the Effects of School Closures
To estimate the effects of closing schools on student outcomes, we used a method called difference-in-difference. This approach infers the impact of an intervention, such as school closures, by comparing the pre- to post-intervention change in the outcome of interest for the treated group relative to a comparison group. The key assumption of this method is that the comparison group should have a similar trend before intervention to the trend of the affected group. When this is satisfied, the comparison group outcomes are a credible estimate of the trends of the affected group in the absence of the intervention. By comparing the ac-tual outcomes of the affected group by the estimated trend for this group based on the comparison group, we can estimate the effects of the intervention. Figure A depicts the approach. The left-hand panel shows the trends of a hypothetical outcome for a group of students affected by school closures and a comparison group. In our analysis we used data from 2008–09 to 2016–17: four years pre-closures (2008–09 to 2011–12), the announcement year (2012–13), and four years post-closures (2013–14 to 2016–17). The outcome trends for both groups of students are
parallel, which we tested in our statistical models in the pre-closure years. Because this assumption is satisfied, we used the post-closure trend of the comparison group to determine the possible outcome trajectory of students affected by school closures in the absence of this event (dotted line). We mea-sured the effects of school closures by comparing the actual outcome trajectory of students affected by school closures to the predicted outcome trajec-tory. The right-hand panel below shows the effects of school closures—the difference between the actual and predicted outcome—on the outcome for the year of the announcement and the years post-closures. Bar graphs similar to the one below are shown in this chapter. Positive or negative effects shown in the bar graphs can happen regardless of whether the overall trends in the outcomes are improving or not. Therefore, negative effects do not indicate that over-all trends are going down and positive effects do not imply that trends are going up. For readers interested in the actual outcome trends from which Figures 9-14 were built, corresponding figures like the line graph in Figure A are included in Appendix B.
FIGURE A
Simulated Example of How We Estimate the E�ect of School Closures on Student Outcomes
Stu
den
t O
utc
om
e L
evel
s 1.0
-1.5
1.5
0.5
0.0
-1.0
-0.5
0.5
1.0
0.00.0
-0.5
Post Closure YearsAnnouncement Year
2012-13 2013-14 2014-15 2015-16 2016-17
Note: This figure shows the estimates of the e�ects of school closures. The estimates represent how much higher or lower the outcome would have been for the a�ected students in the absence of the closures. These estimates come from statistical models described in Appendix B. Significance levels: *** p<0.001; ** p<0.01; * p<0.05
Student Outcome Trends for Students A�ected by School Closures and Comparison Group
Estimated E�ects of School Closures
4
6
2Stu
den
t O
utc
om
e L
evel
s
0
12
10
Students A�ected by School ClosuresComparison GroupPredicted Outcomes for Students A�ected by School Closures
2012-2013
2013-2014
2014-2015
2015-2016
2008-2009
2009-2010
2010-2011
2011-2012
20162017
8
Post-Closure YearsPre-Closure Years
Announcement Year
Estimated E�ects(Di�erences between purple lines)
Chapter 4 | Impact on Student Outcomes 48
A Look at Student Characteristics
Table B shows the characteristics of students affected by closures (both from closed and welcoming schools —columns 1 and 3) and their average outcomes the year prior to the announcement. The table also con-tains the comparison group of students for students in closed schools (column 2) and for students in welcom-ing schools (column 4). For reference, the last column shows all other students in grades K–7 enrolled in other elementary schools in the district in May 2013. The majority of students (88 percent) in the closed schools were Black students; around 10 percent were Latino. Most students (95 percent) were receiving free or reduced-price lunch and 17 percent were classified as diverse learners. Students in the comparison group shared very similar characteristics. Their outcomes prior to the announcement year were also very similar. In contrast, these two groups of students were more
likely to change schools, had higher absences and sus-pensions, and lower test scores than other elementary school students in the district. Three-quarters of students in the welcoming schools were Black students; one-quarter were Latino. Most stu-dents (92 percent) were also receiving free or reduced- price lunch and 15 percent were classified as diverse learn-ers. The racial composition of students in the comparison group had a slightly higher proportion of Latino students (26 percent) and a lower proportion of Black students (66 percent). Other characteristics and outcomes were very similar between these two groups of students. On average, students in welcoming schools had lower transfer rates, absences, and suspensions, and higher test scores than students in closed schools. However, students in welcoming schools were still lagging behind other elementary school students in the district.
TABLE B
Description of Students in Grades K-7 in May 2013
Student Characteristics
1. Students in
Closed Schools
2. Comparison
Group for Students in
Closed Schools
3. Students in Welcoming
Schools
4. Comparison
Group for Students in Welcoming
Schools
5. All Other
Students in Grades K-7
Number of Students
10,708 14,734 13,218 25,947 174,490
Black 88% 84% 74% 66% 26%
Latino 10% 13% 22% 26% 55%
Free/Reduced-Price Lunch
95% 94% 92% 90% 82%
Students with Disabilities
17% 16% 15% 14% 12%
Old for Grade 15% 15% 11% 11% 6%
Transferred School Fall 2012
23% 20% 18% 18% 13%
Number of Days Absent 2011-12
11 days 11 days 9 days 9 days 7 days
Percent Suspended2011-12
13% 12% 7% 7% 3%
ISAT Reading Test Spring 2012*
-0.40 StandardDeviation Units
-0.40 StandardDeviation Units
-0.19 sStandardDeviation Units
-0.13 StandardDeviation Units
0.06 Standard Deviation Units
ISAT Math Test Spring 2012*
-0.45 StandardDeviation Units
-0.45 StandardDeviation Units
-0.18 StandardDeviation Units
-0.14 StandardDeviation Units
0.06 Standard Deviation Units
Core GPA** 2011-12 2.4 2.3 2.5 2.6 2.9
Note. Eighth-graders were excluded because nearly all progressed to high school the following year and thus were forced to change schools regardless of whether their elementary schools were closed or not. * Test scores were standardized to have a mean of zero and standard deviation of one using the data from the 2012-13 year in order to be able to combine the scores of students in all grades. One standard deviation unit is roughly 30 ISAT points. On average students have shown annual growth of 12 ISAT points in reading and 14 ISAT points in math. For example, students in closed schools were almost half a standard deviation below the average student in the district. That translates to 15 ISAT points, more than a year of growth behind the average student. ** Core GPA is the combination of grades from English, math, science, and social studies classes.
UCHICAGO Consortium Research Report | School Closings in Chicago 49
School transfer rates increased more than expected
during the merger year for students in welcoming
schools that relocated to the closed school building;
no significant effect after the merger for either group
of students. Not only did students from closed schools
all transfer to a new school in fall 2013 due to school
closings, but students in welcoming schools also left
their schools for other schools at higher rates in the
summer prior to the merger. In fall 2013, 21 percent of
the welcoming school students did not return to these
schools. This number was almost 5 percentage points
higher than expected given their prior school mobility
and given the mobility trends of other students in simi-
lar schools (see Figure 9). Although the school trans-
fer rates for the welcoming school students remained
higher than expected the next three years, those effects
were not statistically significant.
As described previously, 14 of the welcoming schools
had to relocate to one of the closed school buildings.99
Because students at these 14 welcoming schools had to
start a new commute and attend school at a new build-
ing, families might have decided to look for other school
options. School transfer rates for these students were
higher in fall 2013 (27 percent) than for students in other
welcoming schools that did not have to move buildings (19
percent). The higher school transfer rates of welcoming
students who had to relocate to closed school buildings
drove the overall increase in school transfer rates the year
of the merger (a statistically significant effect of 12 per-
centage points). Students in the other welcoming schools
that did not move into a closed school building did not
have significantly higher school transfer rates (an effect
of 3 percentage points, but not statistically significant).
All students from closed schools had to transfer to
other schools the year of the merger, but their school
transfer rates were not affected in subsequent years
after their schools closed. The estimated effects were
small and not statistically significant (see Figure 9,
panel A). The school transfer rate was around 20
percent during the years after closings for displaced
3.0
4.0
FIGURE 9
Students from Welcoming Schools were More Likely to Have Transferred Schools in Fall 2013
Post-Closure YearsFall of the Merger
Per
cen
tag
e P
oin
ts
5.0
-2.0
6.0
2.0
0.0
1.0
-1.0
Fall2013
Fall2014
Fall2015
Fall2016
Fall2017
3.0
4.0
Per
cen
tag
e P
oin
ts
5.0
-2.0
6.0
2.0
0.0
1.0
-1.0
Fall2013
4.7**
Fall2014
2.9
Fall2015
2.5
Fall2016
2.6
Fall2017
1.1
Post-Closure YearsFall of the Merger
When school relocated: 12 percentage points***When school stayed: 3 percentage points
Note: This figure shows the estimates of the e�ects of school closures. The estimates represent how much higher or lower the outcome would have been for the a�ected students in the absence of the closures. The higher school transfer rates of welcoming students who had to relocate to closed school buildings drove the overall increase in school transfer rates the year of the merger (a statistically significant e�ect of 12 percentage points; see Panel B). These estimates come from statistical models described in Appendix B. Significance levels: *** p<0.001; ** p<0.01; * p<0.05.
Estimated E�ects of School Closures on School Transfers On:
Panel A: Students from Closed Schools Compared to Students in Similar Schools
Panel B: Students from Welcoming Schools Compared to Students in Similar Schools
1.7
-1.1
1.6
-0.2
99 In some instances, the district provided transportation for the students of the welcoming schools to attend these schools.
Chapter 4 | Impact on Student Outcomes 50
students. In general, school transfers were decreas-
ing for students included in the analyses. Figure B.1 in
Appendix B displays the school transfer rates over time.
Students affected by school closures (both the closed
and welcoming school students) had no changes in
absences and suspension rates. Given what we learned
in the six case study schools, one might have expected
that the school climate would have had an effect on
attendance and suspension rates overall. However,
this was not the case. Absences and suspension rates
showed similar trends after the merger to the trends
for students in comparison schools.
Figure 10 displays the estimated effects of school
closures on absences. Absences increased slightly for
students in closed schools the year of the announce-
ment (0.7 days) and one-year post-closures (0.5 days),
but in general, the effects were small and statistically
insignificant for both groups of students.
The average number of school days missed went up
for all students in 2012–13 (Figure B.2 in Appendix B
displays the trends over time for this outcome). It is not
clear why there was an increase in absences that year,
but a few things took place that might help explain part
of the rise. The year was unique because the school year
was extended by 10 days, and extra days were added at
the end of the year to recover the time missed during
the 10-day teacher strike in the fall. The slight uptick
in absences, however, was a bit larger for students in
closed schools and their comparison group than for
students in welcoming schools and their comparison
group. As communities, schools, and families were ad-
vocating for their schools not to close, this might have
reduced school attendance both for students in closed
schools and for students in their comparison schools,
which were also on the list of potential closures.
After 2012–13, the number of school days missed by all
students in our sample has been decreasing; see Figures
B.2 in Appendix B for the trends in absences. These
reductions in absences were similar for students in closed
schools and their comparison group, meaning that school
closures did not affect the absences of these students.
Figure 11 displays the estimated effects of school
closures on suspension rates. Overall, there were no
significant effects on either students from closed
(Figure 11, panel A) or welcoming schools (Figure 11,
0.2
0.4
FIGURE 10
The E�ect of School Closings on Absences was Small and Not Statistically Significant
Post-Closure YearsAnnouncement Year
Nu
mb
er o
f D
ays
0.8
-1.0
1.0
0.6
0.0
-0.4
-0.6
-0.2
-0.8
0.2
0.4
Nu
mb
er o
f D
ays
0.8
-1.0
1.0
0.6
0.0
-0.4
-0.6
-0.2
-0.8
2012-13 2013-14
0.5
2014-15
0.1
2015-16
0.3
2016-17
0.4
-0.1
0.7
0.3
-0.2
0.00.1
Post-Closure YearsAnnouncement Year
2012-13 2013-14 2014-15 2015-16 2016-17
Note: This figure shows the estimates of the e�ects of school closures. The estimates represent how much higher or lower the outcome would have been for the a�ected students in the absence of the closures. These estimates come from statistical models described in Appendix B. Significance levels: *** p<0.001; ** p<0.01; * p<0.05
Estimated E�ects of School Closures on Absences On:
Panel A: Students from Closed Schools Compared to Students in Similar Schools
Panel B: Students from Welcoming Schools Compared to Students in Similar Schools
UCHICAGO Consortium Research Report | School Closings in Chicago 51
panel B). Even though the effects were not significant,
suspension rates were lower than expected for students
from closed schools post-closure. For example, in the
2013–14 school year the suspension rates were 2.5 per-
centage points lower than expected given the rates of
the students in the comparison group.
Suspension rates started to decline in 2013–14, which
can be seen in Figure B.3 in Appendix B, coinciding
with the change in the CPS Suspensions and Expulsions
Reduction Plan (SERP). These declines were evident for
all students—the ones affected by closings and the ones
in the comparison groups. The declines in suspension
rates for students from closed schools were slightly more
pronounced than for the comparison group leading to
the lower estimated effects on suspension rates present-
ed in Figure 11, panel A.
We learned in Chapter 3 that students and adults in
the six case studies of welcoming schools talked about
an increase in disruptive behavior, but here we see that,
on average, it did not translate into a larger propor-
tion of students being suspended. The introduction of
SERP in CPS encouraged schools to reduce the use of
exclusionary disciplinary practices and consequently,
the number of suspensions dropped districtwide.100 In
addition, suspension rates were almost double in closed
schools than in welcoming schools the years before the
merger (13 percent vs. 7 percent in 2011–12). Therefore,
it could also be the case that welcoming school staff
were used to dealing with fewer fights and other disrup-
tive behaviors, or that their disciplinary practices were
different than those in the closed schools.
Students affected by school closures experienced
negative effects on test scores, especially students
from closed schools. Figure 12 shows the effects of
school closures on reading and math test scores from
ISAT. These tests were the state mandated tests for
students in Illinois since the early 2000s. The year
2013–14 was the last time these tests were given, so
we studied the effects on this test the year of the an-
nouncement and one year post-closures, and checked
whether students affected by closures had similar or
different pre-trends to students in comparison groups.
Starting in 2012–13, CPS students began taking the
NWEA tests in reading and math. Since the ISAT test
was going to be retired, the district used the NWEA for
-1.0
-0.5
FIGURE 11
The E�ect of School Closings on Suspension Rates was Small and Not Statistically Significant
Post-Closure YearsAnnouncement Year
Per
can
tag
e P
oin
ts
0.5
-3.0
1.0
0.0
-1.5
-2.5
-2.0
-1.0
-0.5
0.5
-3.0
1.0
0.0
-1.5
-2.5
-2.0Per
can
tag
e P
oin
ts
2012-13 2013-14
-2.5
2014-15
-1.6
2015-16
-1.2
2016-17
-1.0
0.0
0.5
-0.1
Post-Closure YearsAnnouncement Year
2012-13 2013-14 2014-15 2015-16 2016-17
Note: This figure shows the estimates of the e�ects of school closures. The estimates represent how much higher or lower the outcome would have been for the a�ected students in the absence of the closures. These estimates come from statistical models described in Appendix B. Significance levels: *** p<0.001; ** p<0.01; * p<0.05.
Estimated E�ects of School Closures on Suspension Rates On:
Panel A: Students from Closed Schools Compared to Students in Similar Schools
Panel B: Students from Welcoming Schools Compared to Students in Similar Schools
teacher evaluation purposes and eventually for stu-
dent promotion and school accountability. In 2012–13,
the NWEA was mandatory in the fall (October) and
spring (May), and voluntary in the winter (January).
The district made the test mandatory in the winter in
subsequent years. We used this test to estimate the long-
term effects on test scores. Figure 13 displays the effects
on reading and math NWEA test scores. Test scores
increased across the district during this time period,
as shown in Figures B.4 through B.7 in Appendix B.
However, test scores improved at a slower pace for stu-
dents affected by school closings than for other students.
• The largest negative impact of school closures was
on the test scores of students from closed schools
the year of the announcement. Similar to what was
found in other studies on school closures, student test
scores were lower than predicted in the year of the an-
nouncement given students’ prior performance. This
was true for the ISAT test taken in the spring and the
NWEA test taken in the spring. One reason for this
might be that the announcement year was a disruptive
year for many of these schools as they faced uncer-
tainty about whether they would be closed. Under
these circumstances, the learning environment may
have been affected. The district tried to avoid distrac-
tions in students’ learning by waiting to announce
the final list of school closures until after students
took the ISAT tests. However, these students still per-
formed lower than the comparison group, even though
their performance was very similar to students in the
comparison group in the pre-closure years (measured
by ISAT tests) and in the fall and winter (measured by
NWEA tests). Given the district’s decision to wait to
announce which schools they were going to close until
after students took the ISAT test, it is unexpected to
find a gap in test scores in March since the closed and
comparison schools were under the same threat of
closures at that time. Whatever the reason, students
who were eventually displaced were negatively
affected before they left their schools.
The negative effect was estimated to be 0.07
standard deviation units in reading in ISAT and 0.11
in math. This translated to roughly one and a half
-0.10
-0.05
FIGURE 12
Reading and Math ISAT Test Scores Were Negatively A�ected the Year of, and the Year After, the Closings Announcement
Post-Closure YearsAnnouncement Year
Sta
nd
ard
Dev
iati
on
Un
its
(Bas
ed o
n 20
12-1
3 T
ests
) 0.05
-0.15
0.10
0.00
-1.5
2012-13 2013-14
-0.11*** -0.11**
2014-15 2015-16 2016-17
Note: This figure shows the estimates of the e�ects of school closures. The estimates represent how much higher or lower the outcome would have been for the a�ected students in the absence of the closures. ISAT was no longer administered by CPS after the 2013-14 school year. These estimates come from statistical models described in Appendix B. Significance levels: *** p<0.001; ** p<0.01; * p<0.05.
Estimated E�ects of School Closures on ISAT Tests On:
Panel A: Students from Closed Schools Compared to Students in Similar Schools
Panel B: Students from Welcoming Schools Compared to Students in Similar Schools
-0.10
-0.05
Post-Closure YearsAnnouncement Year
Sta
nd
ard
Dev
iati
on
Un
its
(Bas
ed o
n 20
12-1
3 T
ests
) 0.05
-0.15
0.10
0.00
-1.5
2012-13 2013-14 2014-15 2015-16 2016-17
0.00
-0.09**-0.07***
-0.06-0.08**
-0.01
Reading Math Reading Math
UCHICAGO Consortium Research Report | School Closings in Chicago 53
-0.10
-0.05
FIGURE 13
Math NWEA Test Scores Were Negatively Aected for Students from Closed Schools, Even Four Years Later
Post-Closure YearsAnnouncement Year
Sta
nd
ard
Dev
iati
on
Un
its
(Bas
ed o
n 20
12-1
3 T
ests
) 0.05
-0.15
0.10
0.00
2012-13 2013-14
-0.12** -0.12**-0.11** -0.11*
2014-15 2015-16 2016-17
Note: This figure shows the estimates of the e�ects of school closures. The estimates represent how much higher or lower the outcome would have been for the a�ected students in the absence of the closures. These estimates come from statistical models described in Appendix B. Significance levels: *** p<0.001; ** p<0.01; * p<0.05.
Estimated E�ects of School Closures on NWEA Tests On:
Panel A: Students from Closed Schools Compared to Students in Similar Schools
Panel B: Students from Welcoming Schools Compared to Students in Similar Schools
Pos-Closure YearsAnnouncement Year
Sta
nd
ard
Dev
iati
on
Un
its
(Bas
ed o
n 20
12-1
3 T
ests
)
2012-13 2013-14 2014-15 2015-16 2016-17
-0.10*
-0.04 -0.04 -0.04-0.05
-0.02 -0.02
Reading Math Reading Math
-0.01-0.01
0.04 0.04
0.01 0.010.00
0.02 0.03
-0.10
-0.05
0.05
-0.15
0.10
0.00
months behind in reading and two months behind
in math.101
• Students from closed schools experienced a long-
term negative impact on their math test scores;
slightly lower, but not significant long-term effects
for reading test scores. Reading test scores bounced
back to their expected levels the second year post-
closings for students from closed schools, but their
test scores did not improve at a higher pace than stu-
dents in similar schools. However, the gap in math test
scores remained four years post-closings (2016–17),
the last year in our analyses. This longer lasting effect
in math could be driven by the fact that math learn-
ing depends upon mastering prior concepts. If key
concepts were missed the year of the announcement,
displaced students would have been behind their
peers who were taught these concepts earlier. This lag
time could explain why math test scores for displaced
students were still lower than the comparison group
several years later.
• Students from welcoming schools had lower than
expected reading test scores the first year after
the merger. Reading test scores of students from
welcoming schools were negatively affected the first
year post-merger by one and a half months. This
was a short-term effect as the reading test scores
rebounded a year after. Welcoming school students
also had slightly lower than expected math scores,
although this was not a significant difference. These
effects may not be surprising given the disruption
involved in the merger.
On average, effects on core GPA were small, although
some negative effects were evident three and four
years post-closures for students from closed schools.
The core GPA of students from welcoming schools (see
Figure 14, panel B) was not affected by school closures,
either positively or negatively. The effects were also
very small for students from closed schools (see Figure
14, panel A) in the first couple of years post-closures.
101 These numbers were calculated knowing that one standard deviation is around 30 ISAT points and an average annual
growth of 12 ISAT points for reading and 14 ISAT points for math.
Chapter 4 | Impact on Student Outcomes 54
However, in subsequent years, displaced students’ core
GPA was lower than expected by 0.1 GPA points. These
effects were estimated only by considering students’
core GPA while in elementary schools. Recall that given
the way the sample was selected, these negative effects
in the third and fourth years post-closures were based
on students who were affected by closures while they
were in earlier grades. For example, students who were
in eighth grade in 2016–17 were most likely in fourth
grade the year of the announcement. It is students in
grades 3–5 that account for the negative effect in the
later years—when they were in middle grades (see
Figure 15). In other words, groups of students were
affected differently, with the effects on GPA driven
primarily by younger students who were displaced;
the negative GPA effects for these students manifested
once they were in middle school.
It is worth noting that core GPA has been increasing
slightly over time for the affected students, especially
the years after school closures. This can be seen in
Figure B.8 in Appendix B. Thus, while students from
closed schools had lower core GPAs than expected, their
GPAs followed district-wide trends and improved over
time. In addition, while the increase in core GPA was
similar for students from welcoming schools and their
comparison group, there is a slight gap for students
from closed schools and their comparison group in the
last years (shown in Figure 14). On average, the core
GPA of students from closed schools was lower than the
core GPA for students from welcoming schools prior
to the announcement. It was still lower post-closings
despite the positive trend in core GPA.
Many students were affected by the school closures
in 2013. Students in 47 elementary schools had to con-
tinue their elementary years at a different elementary
school. Students and staff in 48 welcoming schools had
to get ready to receive these students, an average of 150
per school. Fourteen of these welcoming schools had to
move to the building of the closed school and adapt to a
new setting. In many cases displaced students attended
schools with peers who, on average, were absent fewer
days, less likely to be suspended, and higher perform-
ing. The merger of these student populations, and the
staff as well, was challenging, perhaps making these
environments, at least initially, less conducive to learn-
ing and student engagement.
-0.05
0.05
FIGURE 14
Most of the E�ects on School Closures on Core GPA were Negligible, Although in Later Years Core GPA was Negatively A�ected for Students from Closed Schools
Post-Closure YearsAnnouncement Year
GP
A P
oin
ts
0.10
-0.15
0.15
0.00
-0.10
2012-13 2013-14
-0.09**
-0.05
-0.11**
-0.03
2014-15 2015-16 2016-17
Note: This figure shows the estimates of the e�ects of school closures. The estimates represent how much higher or lower the outcome would have been for the a�ected students in the absence of the closures. These estimates come from statistical models described in Appendix B. Significance levels: *** p<0.001; ** p<0.01; * p<0.05.
Estimated E�ects of School Closures on Core GPA On:
Panel A: Students from Closed Schools Compared to Students in Similar Schools
Panel B: Students from Welcoming Schools Compared to Students in Similar Schools
0.01
-0.05
0.05
Post-Closure YearsAnnouncement Year
GP
A P
oin
ts
0.10
-0.15
0.15
0.00
-0.10
2012-13 2013-14
-0.02 -0.01
0.03
2014-15 2015-16 2016-17
0.01 0.01
UCHICAGO Consortium Research Report | School Closings in Chicago 55
We asked whether student outcomes were affected
by the 2013 school closings. We learned that not only
students from closed schools were affected, but also
students from welcoming schools. Most of the effects on
welcoming students were short-lived. School closures
led to higher mobility for students in the 14 schools that
moved buildings. It also led to lower reading scores than
expected the first year of the merger. Other outcomes we
studied were not affected either positively or negatively.
The effects on students from closed schools were
concentrated in their GPA and test scores, but not atten-
-0.05
0.05
FIGURE 15
Negative E�ects on Core GPA Were More Pronounced Three Years Post-Closings for Students in Grades 3-5 in 2012-13
Post Closure YearsAnnouncement Year
GP
A P
oin
ts
0.10
-0.15
0.15
0.00
-0.10
2012-2013
2013-2014
2014-2015
2015-2016
2016-2017
-0.05-0.03
Note: This figure shows the estimates of the e�ects of school closures. The estimates represent how much higher or lower the outcome would have been for the a�ected students in the absence of the closures. These estimates come from statistical models described in Appendix B. Significance levels: *** p<0.001; ** p<0.01; * p<0.05.
Estimated E�ects of School Closures on Core GPA by Students’ Grades in 2012-13On Students from Closed Schools Compared to Students in Similar Schools
Students in Grades K-2 in 2012-13
0.10
0.01 0.01
-0.05
0.05
Post Closure YearsAnnouncement Year
GP
A P
oin
ts
0.10
-0.15
0.15
0.00
-0.10
2012-2013
2013-2014
2014-2015
2015-2016
2016-2017
-0.05
-0.02
Students in Grades 3-5 in 2012-13
0.02
-0.05
0.05
Post Closure YearsAnnouncement Year
GP
A P
oin
ts
0.10
-0.15
0.15
0.00
-0.10
2012-2013
2013-2014
2014-2015
2015-2016
2016-2017
-0.09
Students in Grades 6-7 in 2012-13
-0.06
-0.01
-0.10**
-0.13**
dance or suspensions. These negative effects started
the year of the announcement, before students even
moved to a new elementary school and, at least for math
test scores, continued four years post-closure. Students
need more support during the year of the announce-
ment and that support should continue not only the
year of the merger, but for most of the students’ elemen-
tary school career. Students affected by closures during
the earlier grades were still dealing with lower than
expected performance throughout their elementary
school years.
UCHICAGO Consortium Research Report | School Closings in Chicago 57
CHAPTER 5
Interpretive SummarySchool districts across the nation are facing enormous economic challenges and many, like Chicago, are simultaneously experiencing steep enrollment declines. Cash-strapped districts in these circumstances face tough decisions: how does a school district reduce costs, but continue to provide students with high-quality educational experiences? In 2013, Chicago officials argued that the only option they had was to “right size” the district by closing an unprecedented number of schools all at once.
Policymakers assumed that their decision to close
schools would alleviate some of the financial burden
and align resources where they were needed most. They
also believed that by consolidating resources, students
would have greater access to programs, supports, and
services that they did not have in their former schools.
District officials hoped that students transferring to
higher-rated welcoming schools would experience im-
proved academic outcomes. As then-CPS CEO Barbara
Byrd-Bennett promised, although closing schools would
not be easy, “I also know that in the end this will benefit
our children.” 102
While rationales for closing schools may appear
straightforward to policymakers, justifications are
often unconvincing for those most directly affected.
Fierce resistance often arises because it is the com-
munity that must bear the burden of going through the
closing process. Community members worried about a
number of potentially negative consequences, includ-
ing community destabilization, increases in violence,
and students ending up in poor learning environments.
Opponents also decried the fact that these closings
mainly affected families and students living in histori-
cally disinvested, primarily Black areas of the city.
Our main research question, then, was: Did closing
schools provide students with better educational oppor-
tunities and stronger academic outcomes? The evidence
provided in this report suggests that closing schools and
moving students into designated welcoming schools
to consolidate resources did not automatically expose
them to better learning environments and result in
greater academic gains. At the same time, many of the
negative concerns that critics raised did not material-
ize. A number of different factors played a role in why
students did not benefit as much as hoped and why it
was difficult for leaders and staff to create positive and
welcoming learning environments, especially the first
year of the merger.
As districts across the country grapple with the deci-
sion to close schools, this report offers some evidence
that the intended benefits of closing schools may not
materialize. In particular, we offer the following points
for consideration:
Schools slated for closure need support the year of
the announcement. In the majority of studies done on
school closures thus far, including this one, students
experienced a slowdown in their achievement trajec-
tories the year of the announcement. This suggests
that the announcement itself interrupts the learning
environment in schools slated for closure. It is possible,
we speculate, that because staff and students in Chicago
102 Chicago Public Schools. (2013, March 21b)
Chapter 5 | Interpretive Summary 58
spent time and energy fighting to keep their schools
open, it may have influenced the learning climate in
their schools. It is also possible that once the decision
was made, students and staff—who were mourning the
loss of their schools—were not able to focus as much on
teaching and learning. Staff, students, and families in
these circumstances need much more support, start-
ing the year of the announcement, to help potentially
mitigate the learning loss.
The lengthy decision period during the 2012–13
school year heightened anxiety, anger, and distrustful-
ness felt in the affected communities. The magnitude
of closing so many schools amplified the disruption.
Having schools essentially compete to stay open over
an extended period resulted in feelings that there were
“winners” and “losers,” and caused fractures in some
communities who would then be expected to work
together. Furthermore, it limited the window for school
leaders and staff to plan and prepare adequately for the
transition into welcoming schools
Inadequate preparation of the learning environment
can aggravate feelings of loss. Leaders in welcoming
schools wanted to provide students, staff, and their
families with an updated, clean, and inviting learning
space. This requires sufficient time, and strong organi-
zation and planning for moving supplies and preparing
buildings. It also requires thinking beyond the techni-
cal aspects of the move to consider the more adaptive
elements that emerge when accommodating such large
influxes of staff and students. School leaders need sup-
port in thinking about and planning for how a change of
this magnitude will affect the day-to-day school opera-
tions, social interactions, and general functioning of the
school. Although the district planned for upgrades and
other logistical considerations, the monumental task of
moving approximately 95 school buildings in a matter
of months required much more time and consider-
ably more resources than was provided. This is critical
because preparing the physical space took valuable staff
time away from building relationships and integrating
communities. The physical environment affects the
learning environment, so it is important to ensure that
environments are welcoming; otherwise these logis-
tical problems amplify feelings of loss. It is vital for
policymakers to make sure that after closing schools,
welcoming schools have all of the valued equipment and
technology from the closed school, teachers have their
own materials, and all staff have what they need to help
support students at the beginning of the school year.
After students and staff lose their schools, they should
have the option to enter into receiving school buildings
that feel nicer and have more resources than the schools
they lost.
District leaders invested in extra professional devel-
opment and additional resources to put towards extra
student supports in the first year after the closures.
Students and staff appreciated the extra resources,
technology, programs, and the expansion of Safe
Passage, although they wished for a longer-term invest-
ment because student needs did not end after one year.
If the school environment is prepared adequately to
receive students on time, then educators can focus on
relationship building and instructional planning.
There is a need for active relationship building that
acknowledges both loss and opportunity. Leaders
in welcoming schools wanted to create positive and
welcoming learning environments for all staff and
students. But communities affected by school closures
first need their grief and loss acknowledged and vali-
dated, and need more social-emotional support. The
way that the closings process was set up—that certain
schools would be closed and others would stay open to
welcome the displaced students and staff—appeared to
promote assimilation into welcoming schools, rather
than co-creation of culture together. Preventing an “us”
by district and school leaders. District and school lead-
ers, for example, could work to proactively bust myths
and stereotypes that staff, students, and communi-
ties have about one another. It is also important to pay
attention to symbolic representations of separation
(such as labeling), and instead focus on creating and
promoting commonalities. In order to do this, staff and
students from the closed and welcoming school com-
munities must work together to co-create new school
cultures and identities. It takes time and support to
cultivate and rebuild relationships in welcoming
schools and in the community at-large.
UCHICAGO Consortium Research Report | School Closings in Chicago 59
Furthermore, many of the supports were directly
aimed at students with an assumption that students
would be most impacted by closures. However, educa-
tors said they believed that students adapted much
faster than the adults. This suggests that adults going
through a closure and merging process need much more
proactive support and guidance than were provided. As
some interviewees expressed, becoming a welcoming
school could be a positive experience, given adequate
resources and support, and with a focus on co-creating
new communities together.
Closing schools—even poorly performing ones—does
not improve the outcomes of displaced students, on
average. Closing underutilized schools was intended to
enhance students’ educational experiences by allowing
them an opportunity to learn in a better environment.
In this and other previous studies on the effects of
school closures, we have seen that academic outcomes,
on average, do not improve after students’ schools were
closed. Studies that find positive effects on displaced
students only happened in cases with fewer disruptions,
such as phase-outs, or when students attended top-per-
forming schools. The affected schools included in this
study closed immediately and the majority of students
did not attend top-performing schools.103 At the same
time, student performance on average did not go down
as much as some feared. Educators in this situation
struggled, but worked hard to make it work, despite the
challenges with the transition.
Students in earlier grades whose schools closed
ended up earning lower than expected grades in their
classes even four years later. One possible explanation
for this might be that displaced students were identified
as coming from lower-performing schools. This label of
being from a lower-performing school may have poten-
tially influenced how students saw themselves and ul-
timately impacted their long-term outcomes. Research
on noncognitive factors points to the importance of
students’ mindsets about themselves as learners be-
cause mindsets have a powerful influence on academic
performance.104 This suggests that educators could be
more proactive in trying to prevent negative academic
labeling (e.g., “low performer”) and focus on developing
students’ academic mindsets.
Closing schools can also have some short-term nega-
tive impacts, on average, for the students in receiving
schools. Most of the discussions regarding the poten-
tial impacts of closing schools focus on the students in
schools slated for closure, with very little attention paid
to what might happen to students already in designated
welcoming schools. This policy affected welcoming
students in a number of ways. Relatively more students
in welcoming schools transferred to other schools the
year of the merger (2013–14), especially in cases where
welcoming school buildings relocated into closed
school buildings. This suggests that families in these
circumstances also had to send their children into dif-
ferent neighborhoods. For students who stayed in their
welcoming schools, they too faced challenges in having
to rebuild their school cultures and adjust to new peers,
expectations, and, in some cases, new administra-
tion. The average test scores for students in welcoming
schools dropped a bit, especially in reading, but recov-
ered over time. These findings suggest that policymak-
ers need to think of the unique needs of students and
families attending schools that welcome students from
closed schools into their communities.
Five years later, the CPS budget is still tight, enroll-
ments are still declining, the moratorium on school
closings has ended, and the Chicago Board of Education
has recently voted to close and consolidate more
schools. School closures in Chicago, and elsewhere,
are still happening in communities beset by histori-
cal disinvestment and inequities, further amplifying
destabilization effects. We continue to have an equity
issue: many students are not being offered the same
kinds of opportunities afforded to students in higher-
income, higher-resourced communities. These patterns
are deeply interwoven with the historical, racial, and
geographical segregation in Chicago.105 Students across
the city deserve to have access to programs, supports,
and opportunities that help them learn, grow, and reach
103 Twenty-one percent of displaced students attended a Level 1 or “excellent standing” school. See de la Torre et al. (2015).
104 Farrington et al. (2012).105 For more about this history, see Ewing (forthcoming).
Chapter 5 | Interpretive Summary 60
their full potential. More must be done to address these
stark inequalities. Closing under-enrolled schools may
seem like a viable solution to policymakers who seek to
address fiscal deficits and declining enrollment, but our
findings show that closing schools caused large disrup-
tions without clear benefits for students.
More research is needed to understand what hap-
pens to staff and students in school buildings slated for
closure the year of the announcement to help unpack
why we see negative effects starting in that year. In
addition, we highlighted the average effects of clos-
ing schools on a variety of student outcomes, but we
know that there was a great deal of variation across
schools.106 More research is needed to explore this
variation and to unpack the factors that might help
explain these differences. Few studies have looked at
the potentially differential effects of closing schools
on sub-groups of students (e.g. students with special
learning needs). It is also important to investigate
whether or not future generations of students benefit
from attending consolidated schools. There are still
lingering questions regarding the potential financial
savings of consolidating buildings, and a thorough cost-
benefit analysis could help address these questions.
Furthermore, not much is known about the impact of
closing schools on the teacher workforce.
The decision to close schools is never an easy one,
nor is it clear-cut. By looking at a wider array of out-
comes and by including the experiences and voices
of the people directly impacted by school closures,
we can develop a more holistic understanding of the
effects of school closures. Our hope is that this report
will add to our collective understanding of the effects
of school closings.
106 For example, there was variation in the proportion of closed school staff and students who joined welcoming schools, in the performance level of the welcoming/receiving schools, as well as how different closed schools were from the welcoming/ receiving schools in terms of their performance.
UCHICAGO Consortium Research Report | School Closings in Chicago 61
CommentaryEve L. EwingProvost’s Postdoctoral ScholarSchool of Social Service Administration at the University of Chicago
“All they [the district] did was put in air conditioners … But they were dragging their feet, and the building wasn’t clean. And I really think that was a systemic issue.”
These words, spoken by a principal at a designated wel-coming school, illustrate the importance of this insightful and necessary report on the 2013 closure of 50 Chicago Public Schools. Building on their prior research on the topic, the authors have compiled a study that makes clear two things that should inform future proposed school closure decisions: the paramount importance of the notion of “respect” as part of any such process, and the ecological reality of the context within which such decisions are made.
“They Just Don’t Care:” The Question of Respect in School Closure ProcessesIn several places throughout the report, teachers and staff expressed feeling a lack of respect on the part of the school district, which left them with negative senti-ments in the wake of school closures. School personnel experienced the move from one building to another as disorganized and chaotic, and viewed the loss or destruction of valuable school materials as a sign of disrespect. “CPS doesn’t care. They just don’t care, and it shows.” Other principals described arriving in buildings with bathrooms that lacked doors or stall locks, corridors that were half-painted, and facilities that were “filthy.” In these cases, respondents said explicitly that they felt a lack of planning reflected a lack of respect. But the theme of respect is implicit in other areas of the findings. For instance, participants indicated that after a period of time the transition plan paperwork they filled out became less about creating a useful docu-ment, and more about complying with the requirement.
In other words, the transition plan was not worthy of their respect, and the necessity of completing it did not reflect respect on the part of the district (as opposed to, say, being able to create and modify a dynamic plan as unanticipated factors arose over time). Earlier studies have found that those impacted by school closures felt disrespected by the process leading up to the closure.107 This report reveals that this theme of respect remains salient even as the receiving schools transition into the task of uniting two disparate school communities. Why does respect matter? Because of the interwoven and longitudinal nature of relationships, both within schools, and between schools and district leaders. The 2013 school closures certainly do not rep-resent the last time district leaders will require compli-ance with a large-scale policy action. Indeed, as of this writing, CPS has been recently entangled in another round of highly visible and highly contentious school closures. Each time these occasions arise—whether they be school closures, new graduation requirements, new application and attendance guidelines, or any other broad-scale actions—the district asks, essentially, for trust and faith from the stakeholders it serves. And each time the district is perceived as disrespectful in its actions, the cache of such trust and faith erodes a bit further. Given that CPS lost approximately 10,000 students108 last year, it is safe to say that trust is not a commodity we can spare.
An Ecological View on School Closure DecisionsThis report’s focus on the dialectic relationship be-tween receiving schools and closing schools repre-sents a significant contribution to the literature. As the methodological approach implies, the profile of a prototypical receiving school and prototypical closed
107 Ewing (2016); Lipman, P., Vaughan, K., & Gutierrez, R.R. (2014). Root shock: Parents’ perspectives on school closings in Chicago. Chicago, IL: Collaborative for Equity & Justice in Education.
108 Perez, J. (2017, October 20). Chicago Public Schools enroll-ment drops by nearly 10,000 students. Chicago Tribune. Retrieved from http://www.chicagotribune.com/news/local/breaking/ct-met-chicago-schools-population-drop-20171020-story.html
school were actually quite similar, thanks in part to the constraints needed to designate a school as a “welcom-ing school.” Since designated “welcoming schools” needed to be within one mile of a closing school and Chicago is racially and socio-economically segregated, the two types of schools were largely demographically similar. And since receiving schools required adequate space to handle an influx of students, many of them had also been on the initial proposed schools list. Perhaps most notably, many students and teachers at so-called “welcoming schools” also experienced loss as they had to relocate from a familiar building into an unfamiliar building, and they saw higher-than-expected rates of mobility from their classmates and teachers. In other words, perhaps we should no longer think about the impact of closures in terms of “closed schools” and “receiving schools” as two distinct enti-ties, and even less as “losers and winners.” Rather, we should understand that all of these schools exist within an ecological matrix that created barriers to them optimally functioning as sites of excellent instruction. Though their challenges may differ, these schools are all struggling under the weight of closures—past closures, threatened closure, nearby closures, actual closures, responding to closures—and the possibility that they might very soon be on the proverbial chopping block once again. Thus, the findings contained in this report suggest that an ecological view of school closures would be more helpful—a view that understands each student, each teacher, and each school as situated within a dynamic
ecosystem alongside other schools, the neighborhood in which they are located, and the broader social context of Chicago and its present and historical struggles.109 Within this framework, the extraordinary stress and even harm caused by the nature of the pre-closure pro-cess is cast into relief. All schools involved in the closure process—whether in schools that would ultimately be closed or that received students—were embroiled in a highly stressful, internally competitive, even antagonis-tic process that established their institutional futures as being threatened by the institutional survival of their colleagues and neighbors. Given this context—which one participant in this study refers to depressingly as resembling “the Hunger Games”—any social cohesion that schools were able to develop whatsoever post-closure should be seen as nothing short of miraculous. Ultimately, as the authors’ conclusion suggests, we must ask how and why we continue to close schools in a manner that causes “large disruptions without clear benefits for students.” Taken together, these two insights—the importance of respect and the ecologi-cal nature of school closures’ effects—suggest that the calculus regarding school closure is much more compli-cated and difficult to anticipate than perhaps the dis-trict was prepared for. Determining costs and benefits goes beyond the already-complex measures of student academic achievement, building capacity, and finan-cial costs. Rather, in order to fully assess the impact a proposed school closure has on students, teachers, and communities, it is necessary to incorporate less-tangible factors, which may in fact be impossible to fully predict.
109 Bronfenbrenner, U. (1977). Toward an experimental ecology of human development. American Psychologist, 32(7),
UCHICAGO Consortium Research Report | School Closings in Chicago 63
CommentaryDouglas N. HarrisProfessor of EconomicsSchleider Foundation Chair in Public EducationDirector of the Education Research Alliance for New Orleans Tulane University
School closings represent one of the most difficult and important issues facing all kinds of school systems today. Enrollment cycles mean that some share of school districts will always be shrinking, requiring fewer buildings. Even for districts that remain at the same size, funding per student can drop or remain stagnant, creating financial distress. Closing schools is sometimes a necessary evil. Yet, at least in the short run, closures create chal-lenges for students, parents, and educators, all of whom have to find new schools. Students often end up travel-ling farther to school and have to adjust to new school environments and make new friends. The best schools are like families and changing families is hard. School closings also mean removing community anchors. For these reasons, closing and taking over schools is argu-ably the last thing any school district or system leader ever wants to do. On the other hand, some recent research suggests that the effects of closure are not quite what they seem. If the lowest-performing schools are closed, then students end up in better schools. Despite the initial disruption, even the students in schools at the time of their closure end up better off in the long run. Moreover, future generations of students benefit from having a better menu of schools to choose from. This is what we found in New Orleans, where the state aggressively closed low-performing schools and replaced them with new charter operators starting around 2014. System leaders closed the lowest-performing schools—lowest in terms of achievement growth—and, two years later, elementary students were doing better than we would have predicted if they had stayed in their old schools. Better schools, better results. This important new report from the UChicago Consortium presents a different picture. Not only did students from closed schools experience a short-term decline in achievement, but this persisted for several years afterwards. They did not bounce back. It is en-tirely unclear why we see results different from New Orleans, but one possible reason is that the schools that were closed in Chicago were not those with the lowest achievement growth. When we focus on outcome
levels, whether they be test scores or attendance, we end up attributing to schools what is actually due to factors outside school control. Another possibility is that when one school is closed, even the remaining schools are affected. The Consortium report illustrates that nearby schools that remain open face an influx of students (and educators) from the closed schools. To address these challenges, the leaders of Chicago Public Schools identified specific “welcoming schools” near the closed schools that would receive support for making the difficult transition. Through interviews with educators in welcoming schools, this Consortium report shows that the adjust-ment was difficult. Planning was poor and the additional supports provided to schools were mostly temporary. Even the seemingly basic step of physically moving equipment and supplies was carried out too slowly and the welcoming schools were not ready at the beginning of the school year. The best-laid plans are not meaning-ful without effective implementation. While this report addresses elementary schools, Chicago is now in the process of phasing out a number of high schools. Looking across cities, the effects of closure are clearly more negative in these higher grades. In our study of school closure and takeover in New Orleans, we found that students in closed high schools were less likely to graduate high school and attend college because of the closures. This pattern—one that we have seen when looking across cities—is most likely because high school students have less time to adjust and meet the academic requirements for graduation. Making friends is also more difficult for teenagers when moved to new social environments, leaving students more isolated. Elementary school stu-dents, in contrast, are almost automatically promoted to the next grade, have more time to bounce back and benefit from better schools, and have an easier time making new friends. Given the problems with the city’s last round of closures in 2013, and the even greater challenges that await high schools, Chicago Public Schools may be in for even greater problems ahead. Even if they do choose the truly lowest-performing schools, the district
Commentary64
has an obligation to plan better and provide even more resources to schools in this next round of closures. One option to consider, and one used in New Orleans, is to give students in closed schools priority to choose any school they wish. High school students are willing and able to travel farther to school, and this may allow them to find a school that is a better fit. The receiving schools should also consider making special accommodations to get students into the courses they need. Assigning extra counselors to help students make the adjustment is another option. This Consortium report provides a valuable service to the people, and especially the students, of Chicago.
It also adds to the growing body of evidence nationally, which points to several key conclusions and recommen-dations: First, school closure should be a rare occur-rence. When it is done, it is essential that system lead-ers focus on closing the schools that are truly lowest-performing—something most state-mandated school ratings are ill-designed for. System leaders should also do what they can to eliminate the short-term pain for students and educators. The dictum that we should “do no harm” is especially appropriate. We must pay atten-tion to the short-term effects of education decisions on current students, even as leaders try to create a system of schools designed to serve future generations.
UCHICAGO Consortium Research Report | School Closings in Chicago 65
References
Agreement between the Board of Education of the City of Chicago and Chicago Teachers Union Local 1, American Federation of Teachers, AFL-CIO. (2012, October 24)Retrieved from https://www.ctunet.com/for-members/text/CTU_Contract_As_Printed_2012_2015.pdf
Ahmed-Ullah, N.S. (2013, April 25)At Chicago school closing hearings, crowds fade. ChicagoTribune. Retrieved from http://articles.chicagotribune.com/2013-04-25/news/ct-met-cps-closing-hear-ings-20130426_1_schools-chief-barbara-byrd-bennett-final-list-two-community-meetings
Allensworth, E., & Easton, J.Q. (2007)What matters for staying on-track and graduating inChicago Public Schools. Chicago, IL: University of Chicago Consortium on Chicago School Research.
Allensworth, E.M., Gwynne, J.A., Moore, P., & de la Torre, M. (2014)Looking forward to high school and college: Middle grade indicators of readiness in Chicago Public Schools. Chicago, IL: University of Chicago Consortium on Chicago School Research.
Anderson, C.L. (2014)The disparate impact of shuttered schools. American University Journal of Gender, Social Policy & Law, 23(2), 319-351.
Arcia, E. (2007) A comparison of elementary/K-8 and middle schools’ suspension rates. Urban Education, 42(5), 456-469.
Aucejo, E.M., & Romano, T.F. (2016)Assessing the effect of school days and absences on test score performance. Economics of Education Review, 55, 70-87.
Banchero, S. (2010, January 17)Daley school plan fails to make grade. Chicago Tribune.Retrieved from http://articles.chicagotribune.com/2010-01-17/news/1001160276_1_charter-schools-chicago-reform-urban-education
Barrow, L., Park, K., & Schanzenbach, D.W. (2011)Assessing the impacts on students of closing persistently failing schools (Working Paper).
Belsha, K., & Kiefer, M. (2017, February 12)Empty schools, empty promises: What happened to the closed school in your neighborhood? The Chicago Reporter. Retrieved from http://chicagoreporter.com/what-happened-to-the-closed-school-in-your-neighborhood/
Branham, D. (2004)The wise man builds his house upon the rock: the effects of inadequate school building infrastructure on student attendance. Social Science Quarterly, 85(5), 1112-1128.
Bross, W., Harris, D.N., & Liu, L. (2016)The effects of performance-based school closure and charter takeover on student performance. New Orleans, LA: Tulane University: Education Research Alliance for New Orleans.
Brummet, Q. (2014)The effects of school closings on student achievement. Journal of Public Economics, 119, 108-124.
Bryk, A.S., Sebring, P.B., Allensworth, E., Luppescu, S., & Easton, J.Q. (2010)Organizing schools for improvement: Lessons from Chicago. Chicago, IL: University of Chicago Press.
Byrne, J., & Ruthhart, B. (2013, May 22)School closings disappoint many alderman. Chicago Tribune. Retrieved from http://www.chicagotribune.com/news/local/breaking/chi-school-closings-disappoint-many-aldermen-20130522-story.html
Catalyst Chicago. (2007, December 1)Map: Still waiting for better schools. Retrieved from http://www.chicagoreporter.com/map-still-waiting-bet-ter-schools/
Chicago Housing Authority. (n.d.)Plan for transformation. Retrieved from http://www.thecha.org/about/plan-for-transformation/
Chicago Metropolitan Agency for Planning. (2017a)Demographic shifts: Planning for a diverse region. Retrieved from http://www.cmap.illinois.gov/documents/10180/475314/FY17-0054%20Demographics%2Snapshot/8a9caead-a16a-4cba-a57d-7ffcbf33a1c0
Chicago Metropolitan Agency for Planning. (2017b) Socioeconomic shifts in the Chicago region. Retrieved from http://www.cmap.illinois.gov/updates/all/-/asset_pub-lisher/UIMfSLnFfMB6/content/socioeconomic-shifts-in-the-chicago-region
Chicago Public Schools. (n.d.)Chicago Public Schools fiscal year 2014. Retrieved from http://cps.edu/finance/FY14Budget/Pages/schoolsand-networks.aspx
Chicago Public Schools. (n.d.)Facility standards. Retrieved from http://cps.edu/About_CPS/Policies_and_guidelines/Pages/facilitystandards.aspx
Chicago Public Schools. (n.d.) Parents. Retrieved from http://www.cps.edu/qualityschools/Pages/parents.aspx
Chicago Public Schools. (n.d.)Renaissance 2010. Retrieved from http://www.cps.edu/PROGRAMS/DISTRICTINITIATIVES/Pages/Renaissance2010.aspx
Chicago Public Schools. (2012)2012-13 Guidelines for school actions. Retrieved from http://www.cps.edu/ABOUT_CPS/POLICIES_AND_GUIDELINES/Pages/2013GuidelinesforSchoolActions.aspx
Chicago Public Schools. (2012, November 2)CPS CEO Barbara Byrd-Bennett to launch thorough community engagement process on school actions. Retrieved from http://cps.edu/News/Press_releases/Pages/11_02_2012_PR1.aspx
Chicago Public Schools. (2013, January 10)Statement from CEO Barbara Byrd-Bennett on release of commission on school utilization report. Retrieved from http://cps.edu/News/Press_releases/Pages/01_10_2013_PR1.aspx
Chicago Public Schools. (2013, February 13)Based on community feedback, CPS releases detailed criteria to help guide decisions on district’s utilization crisis. Retrieved from http://cps.edu/News/Press_releases/Pages/2_13_2013_PR1.aspx
Chicago Public Schools. (2013, March 20)CPS CEO Byrd-Bennett unveils supports for students in all welcoming schools. Retrieved from http://cps.edu/News/Press_releases/Pages/3_20_2013_PR1.aspx
Chicago Public Schools. (2013, March 21a)Media briefing. Retrieved from https://cbschicago.files.wordpress.com/2013/03/cps-briefing.pdf
Chicago Public Schools. (2013, March 21b)Significant new investments to provide quality, 21st century education for CPS students transitioning from underutilized schools this fall. Retrieved from http://cps.edu/News/Press_releases/Pages/3_21_2013_PR2.aspx
Chicago Public Schools. (2013, August 22)Special curriculum to address students’ emotional needs. Retrieved from http://cps.edu/Spotlight/Pages/spot-light466.aspx
Cole, M., & Cole, S. (1993)The development of children (2nd Ed.). New York, NY: Scientific American Books.
Commission on School Utilization. (2013)Final report. Chicago, IL: Commission on School Utilization.
Cook, P.J., MacCoun, R., Muschkin, C., & Vigdor, J. (2008)The negative impacts of starting middle school in sixth grade. Journal of Policy Analysis and Management, 27(1), 104-121.
Creswell, J.W., & Clark, V.L.P. (2018)Designing and conducting mixed methods research (3rd Ed.) Los Angeles, CA: Sage Publications.
Deeds, V., & Pattillo, M. (2015)Organizational “failure” and institutional pluralism: A case study of an urban school closure. Urban Education, 50(4), 474-504.
de la Torre, M., & Gwynne, J. (2009)When schools close: Effects on displaced students in Chicago Public Schools. Chicago, IL: University of Chicago Consortium on Chicago School Research.
de la Torre, M., Gordon, M.F., Moore, P., Cowhy, J.R., Jagešić, S., & Huynh, M.H. (2015)School closings in Chicago: Understanding families’ choices and constraints for new school enrollment. Chicago, IL: University of Chicago Consortium on Chicago School Research.
Dowdall, E., & Warner, S. (2013, February 11)Shuttered public schools: The struggle to bring old buildings new life. Philadelphia, PA: The Pew Charitable Trusts.
Dumke, M., Chase, B., Novak, T., & Fusco, C. (2016, June 25)Daley’s CHA plan jolted region. The Better Government Association. Retrieved from https://www.bettergov.org/news/daleys-cha-plan-jolted-region
Durán-Narucki, V. (2008)School building condition, school attendance, and academic achievement in New York City public schools: A mediation model. Journal of Environmental Psychology, 28(3), 278-286.
Eads, D., & Salinas, H. (2014, December 23)Demolished: The end of Chicago’s public housing. National Public Ratio. Retrieved from https://apps.npr.org/lookat-this/posts/publichousing/
Eccles, J.S., Lord, S., & Midgley, C. (1991)What are we doing to early adolescents? The impact of educational contexts on early adolescents. American Journal of Education, 99(4), 521- 542.
Engberg, J., Gill, B., Zamarro, G., & Zimmer, R. (2012)Closing schools in a shrinking district: Do student out-comes depend on which schools are closed? Journal of Urban Economics, 71(2), 189-203.
Evans, G.W., Yoo, M.J., & Sipple, J. (2010)The ecological context of student achievement:School building quality effects are exacerbated by high levels of student mobility. Journal of Environmental Psychology, 30(2), 239-244.
Ewing, E.L. (2016)Shuttered schools in the Black metropolis: Race, history, and discourse on Chicago’s south side (Unpublished doctoral dissertation). Harvard University, Cambridge, MA.
UCHICAGO Consortium Research Report | School Closings in Chicago 67
Ewing, E.L. (forthcoming)Ghosts in the Schoolyard: Racism and School Closings on Chicago’s South Side. Chicago, IL: University of Chicago Press.
Farrington, C.A., Roderick, M., Allensworth, E., Nagaoka, J., Keyes, T.S., Johnson, D.W., & Beechum, N.O. (2012)Teaching adolescents to become learners: The role of noncognitive factors in shaping school performance: A critical literature review. Chicago, IL: University of Chicago Consortium on Chicago School Research.
Fink, L.L. (2010)A comparison of grade configuration on urban sixth to eighth grade students’ outcomes in regular and special edu-cation (Unpublished doctoral dissertation). University of Maryland, College Park, MD.
Firestone, W.A., & Louis, K.S. (1999)Schools as cultures. In J. Murphy & K.S. Louis (Eds.).Handbook of research on educational administration (pp. 297-322). San Francisco, CA: Jossey-Bass.
Fligstein, N., & McAdam, D. (2011)Toward a general theory of strategic action fields. Sociological Theory, 29(1), 1-26.
Frey, W.H. (2018, March 26)US population disperses to suburbs, exurbs, rural areas, and “middle of the country” metros. Brookings Institution. Retrieved from https://www.brookings.edu/blog/the-avenue/2018/03/26/us-population-disperses-to-suburbs-exurbs-rural-areas-and-middle-of-the-country-metros/
Goddard, R.D., Tschannen-Moran, M., & Hoy, W.K. (2001)A multilevel examination of the distribution and effects of teacher trust in students and parents in urban elementary schools. The Elementary School Journal, 102(1), 3-17.
Goerge, R., Dilts, J., Yang, D.H., Wasserman, M., & Clary, A. (2007)Chicago children and youth 1990-2010: Changing population trends and their implications for services. Chicago, IL: Chapin Hall Center for Children.
Gonzalez, R., & Komisarow, S. (2017)Community monitoring and crime: Evidence from Chicago’s Safe Passage program (Working Paper). Retrieved from https://drive.google.com/file/d/0B8yV-hmMmDh7X-3prbmRXTm95bFE/view
Gutman, L.M., & Midgely, C. (2000)The role of protective factors in supporting the academicachievement of poor African American students dur-ing the middle school transition. Journal of Youth and Adolescence, 29(2), 223-249.
Hirsch, A.R. (2009)Making the second ghetto: Race and housing in Chicago 1940-1960. Chicago, IL: University of Chicago Press.
Karp, S. (2013, May, 15)For the record: Class sizes, closing schools. Catalyst Chicago. Retrieved from http://www.chicagoreporter.com/record-class-sizes-closing-schools/
Karp, S. (2013, October 7)‘Structured out’ of a job. Catalyst Chicago. Retrieved from http://www.chicagoreporter.com/structured-out-job/
Kemple, J. (2015)High school closures in New York City: Impacts on students’ academic outcomes, attendance, and mobility. New York, NY: The Research Alliance for New York City Schools.
Kirshner, B., Gaertner, M., & Pozzoboni, K. (2010)Tracing transitions: The effect of high school closure on displaced students. Educational Evaluation and Policy Analysis, 32(3), 407-429.
Larsen, M.F. (2014)Does closing schools close doors? The effect of high school closings on achievement and attainment. New Orleans, LA: Tulane University.
Lipman, P., & Haines, N. (2007)From accountability to privatization and African American exclusion: Chicago’s “Renaissance 2010.” Educational Policy, 21(3), 471-502.
Manzo, L.C. (2003)Beyond house and haven: Toward a revisioning of emotional relationships with places. Journal of Environmental Psychology, 23(1), 47-61.
McMillan, D.W., & Chavis, D.M. (1986)Sense of community: A definition and theory. Journal of Community Psychology, 14(1), 6-23.
McMillen, D., Sarmiento-Barbieri, I., & Singh, R. (2017)More eyes on the street reduce crime? Evidence from Chicago’s Safe Passage Program (Working Paper). Urbana, IL: University of Illinois at Urbana-Champaign.
Merriam, S.B. (1998)Qualitative research and case study applications in education. San Francisco, CA: Jossey-Bass.
Miles, M.B., & Huberman, A.M. (1994)Qualitative data analysis: An expanded sourcebook.Beverly Hills, CA: Sage Publications.
Nuamah, S.A. (2017)The paradox of educational attitudes: Racial differences in public opinion on school closure. Journal of Urban Affairs, 1-17.
Osterman, K.F. (2000)Students’ need for belonging in the school community. Review of Educational Research, 70(3), 323-367.
Papay, J.P., & Kraft, M.A. (2017)Developing workplaces where teachers stay, improve, and succeed. In E. Quintero (Ed.), The social side of education reform (pp. 1-3). Cambridge, MA: Harvard Education Press.
Pettit, B. (2004)Moving and children’s social connections: Neighborhood context and the consequences of moving for low-income families. Sociological Forum, 19(2), 285-311.
Scannell, L., & Gifford, R. (2010)Defining place attachment: A tripartite organizing frame- work. Journal of Environmental Psychology, 30(1), 1-10.
Schein, E.H. (1996)Culture: The missing concept in organization studies. Administrative Science Quarterly, 41(2), 229-240.
Seidman, E., Allen, L., Aber, J.L., Mitchell, C., & Feinman, J. (1994)The impact of school transitions on the self-system and perceived social context of poor urban youth. Child Development, 65(2), 507-522.
Simmons, R.G., & Blyth, D.A. (1987)Moving into adolescence: The impact of pubertal change and school context. New York, NY: Aldine de Gruyter.
Starr, J.P. (2016)The 48th annual Phi Delta Kappa/Gallup Poll of the public’s attitudes toward the public schools: Why school? Americans speak out on education goals, standards,priorities, and funding. Phi Delta Kappan, 98(1), K1-K32.
South, S.J., & Haynie, D.L. (2004)Friendship networks of mobile adolescents. Social Forces, 83(1), 315-350.
Steinberg, M.P., Scull, J., & MacDonald, J.M. (2015, February 28)School closure and student relocation: Evidence from the school district of Philadelphia. Paper presented at theAssociation for Education Finance and Policy 40th Annual Conference, Washington, DC.
Stevens, W.D., Sartain, L., Allensworth, E.M., & Levenstein, R. (2015)Discipline practices in Chicago schools: Trends in the use of suspensions and arrests. Chicago, IL: University of Chicago Consortium on Chicago School Research
Tarter, C.J., & Hoy, W.K. (2004)A systems approach to quality in elementary schools: Atheoretical and empirical analysis. Journal of Educational Administration, 42(5), 539-554.
Temple, J.A., & Reynolds, A.J. (1999)School mobility and achievement: Longitudinal findings from an urban cohort. Journal of School Psychology, 37(4), 355-377.
Van Leeuwen, E., Van Knippenberg, D., & Ellemers, N. (2003)Continuing and changing group identities: The effects of merging on social identification and ingroup bias. Personality and Social Psychology Bulletin, 29(6), 679-690.
Vevea, B., Lutton, L., & Karp, S. (2013, January 15)The history of school closings in Chicago 2002-2012. WBEZ. Retrieved from https://www.wbez.org/shows/wbez-news/the-history-of-school-closings-in-chicago-200212/cdfc0755-27b9-48de-b5be-bce992124048
Weiss, C.C., & Kipnes, L. (2006)Middle school effects: A comparison of middle gradesstudents in middle schools and K-8 schools. American Journal of Education, 112(2), 239-272.
Witten, K., McCreanor, T., Kearns, R., & Ramasubramanian, L. (2001)The impacts of a school closure on neighborhood social cohesion: Narratives from Invercargill, New Zealand. Health & Place, 7(4), 307-317.
Yaccino, S., & Rich, M. (2013, March 21)Chicago says it will close 54 public schools. New York Times. Retrieved from http://www.nytimes.com/2013/03/22/education/chicago-says-it-will-close-54-public-schools.html
Yin, R.K. (1994)Case study research: Design and methods (Applied Social Research Methods Series, 5). London, UK: Sage Publications.
and general school climate. Lastly, we asked about their
overall opinions of the impact of closing schools on
individuals and on the welcoming school as a whole.
Interviews with teachers typically occurred during
their lunch or “prep” period and lasted approximately
45–50 minutes. Interviews with student support
personnel and administrators typically lasted between
45–60 minutes. Our contact person also identified stu-
dents who came from the closed and welcoming schools
to participate in focus groups. They also distributed and
collected signed parent permission forms for students
to participate in focus groups. All student focus groups
lasted about 45–50 minutes, or about one class period.
At each school, we spoke with between five and eight
staff members. In one instance, we were unable to
complete an interview with a principal. The principal
UCHICAGO Consortium Research Report | School Closings in Chicago 71
gave permission for the school to participate and also
personally agreed to participate in this study, but was
unavailable on the day of our site visit. We attempted to
reschedule the interview but were unsuccessful. In all
five of the other cases, we spoke with the principal and
in two cases, we also spoke with an assistant principal.
Additionally, in every case, we spoke with four teachers
(two from the closed school and two from the welcom-
ing school) and one student support staff. Collectively,
we interviewed 40 staff members.
In total, we conducted 12 student focus groups com-
prised of 52 students: 24 who attended closed schools
and 28 who attended welcoming schools in 2012–13. In
all case study schools, we were able to talk to students
who had attended the welcoming school before it be-
came a welcoming school; however, there was one case
where we were only able to speak with one student who
had attended a closed school, which was not the closed
school that was assigned to the welcoming school. In
all other instances, we were able to speak with more
than one student. With the exception of the one student
interview, our focus groups ranged from three to eight
students, with an average of four students per focus
group. In some cases where we quoted interviewees in
this report, we did not reveal which school the partici-
pant came from so as to ensure confidentiality.
In addition, we also collected and analyzed school
transition plans that were created by staff from each
welcoming school in summer 2013.
AnalysisThe case study interviews and documents were analyzed
following Miles and Huberman’s analytic approach:
1) We used descriptive coding to describe and summarize
segments of data; 2) Next, we used pattern coding for
emergent themes, relationships, explanations, and infer-
ential analysis.114 We first employed descriptive coding
and assigned codes based on the research questions and
themes that cut across the interviews, including themes
from prior literature on transitions, relationships,
policies and practices. Next, we employed a deeper and
more inductive pattern coding using broader theories on
place attachment theory, and general organizational and
school culture theories as a guide. During this phase of
coding, we looked for emergent themes and explanations
for why interviewees experienced the transition and
welcoming school environments in specific ways. We
looked for patterns and themes both within each of
these broader descriptive codes, but also within schools
and across our sites for cross-case comparison. We then
wrote case memos for each of the schools, summarizing
information across interviewees by each theme. We then
created cross-case matrices with information summariz-
ing themes across all six sites. Next, we grouped our pat-
tern codes into summaries and created a cognitive map
of the similarities and differences across our cases. In ad-
dition to coding and mapping the data, researchers also
produced analytic memos, which derived and developed
general themes from each individual case study school.
114 Miles & Huberman (1994).
72 Appendix B
Appendix BQuantitative Data, Sample, and Methods
Data Sources and VariablesThe data used for this report comes from CPS admin-
istrative records (including information on student
demographics, enrollment, test scores, absences and
suspensions, as well as personnel characteristics), and
surveys about students’ and teachers’ school experiences
(see Tables B.1 and B.2). All of these data sources are
linked together using a unique student identifier.
Analysis to Select Schools for Qualitative AnalysesTo identify welcoming schools that performed higher,
lower, or as expected in different outcomes, we used
2-level hierarchical models (HLM) with observations
over time nested within schools. The data included
pre-intervention years (from 2008–09 to 2012–13) and
two years post-intervention (2013–14 and 2014–15). All
schools that were opened and remained opened during
these years were included in the analyses. At level one,
we controlled for gender, race, socioeconomic status,
prior academic achievement as measured on prior math
test, whether a student was receiving special educa-
tion services, and whether a student was old for grade.
Variables were group-mean centered around the school
means across all years. All slopes were held constant
across schools.
We used residual files from our HLM analysis to
calculate whether schools were better than expected on
each outcome. Schools were identified as performing
higher than expected if the results of dividing empiri-
cal Bayes residuals by the square root of the posterior
variance were greater than 1.96. Similarly, schools were
identified as performing lower than expected if the re-
sults of dividing empirical Bayes residuals by the square
root of the posterior variance were lower than -1.96. If
the result was between 1.96 and -1.96 then schools were
classified as performing as expected.
Analysis to Estimate School Closure Effects on Student Outcomes
Description of SampleTable B.3 shows the 47 closed schools and their desig-
nated welcoming school or schools. The second column
shows the utilization rates of these schools based on the
fall 2012 enrollment. Utilization rates are based on the
ratio of the number of students enrolled in a school
compared to the ideal capacity of the school calculated
by CPS. The last column represents the performance
level of the schools in the year 2012-13, the year of the
announcement. The performance level was assigned to a
school based on ISAT test data and attendance. Schools
earned points for all metrics and an index was calcu-
lated (the percentage numbers in parenthesis in the last
column). Based on that index, schools were assigned one
of three ratings: Level 1 (“excellent standing”) schools
received at least 71 percent of available points; Level 2
(“good standing”) schools received between 50 and 70.9
percent of available points; and Level 3 (“on probation”)
schools received fewer than 50 percent of available
points. Welcoming schools were selected to be higher-
rated than the closed schools based on the 2012-13
performance policy rating. In cases where the rating
was the same, the district paired closed schools with
welcoming schools that were higher-rated on the major-
ity of the performance policy metrics.
We identified CPS students who were enrolled in
kindergarten through seventh grade as of May 2013,
the date nearest to the closing announcement that our
data would allow. Eighth-graders were excluded because
nearly all progressed to high school the following year
and thus were forced to change schools regardless of
whether their elementary schools were closed or not. We
then aggregated administrative data for these students
dating back to the 2008-09 school year and through the
2016-17 school year, resulting in an unbalanced panel.
UCHICAGO Consortium Research Report | School Closings in Chicago 73
TABLE B.1
Description of Variables
Student Variables Demographic variables such as gender, race/ethnicity, special education status, limited English proficiency, old for grade (suggesting the student has been retained).
Teacher Variables Demographic variables such as gender, race/ethnicity, years in CPS, education degree and school where they were employed.
School Transfers Among active students in the fall, how many are enrolled in a different school compared to the fall of prior year. If the student’s grade in fall is not served in the school he/she was enrolled in the prior fall, then the move is considered a forced move and the student is not part of the analyses.
Absences Annualized number of days absent. From 2008-09 to 2011-12 the number of school days were 170 days; in 2012-13 180 days, in 2013-14 178 days; and 180 days the subsequent years in our sample. Since the distribution of absences tend to be skewed, when modelling this outcome we take the natural logarithm.
Suspensions A dummy variable taking a value of 1 if a student received an in- or out-of-school suspension during the school year; 0 otherwise.
Test Scores Student performance on the Illinois Standards Achievement Test (ISAT) in reading and math and the NWEA test in reading and math. Scores are standardized within grade based on the 2012-13 spring data for each of the tests. Students in grades 3 through 8 take this test. See Table B.2 for the means and standard deviations used to standardize these variables.
Core GPA Core GPA is the combination of grades from English, math, science, and social studies classes in the elementary grades.
Survey Data Rasch scale made from items collected through the My Voice, My School survey. The following measures were used in our analyses:
Student Measures
Safety Measure: How safe do you feel:
• Outside around the school?• Traveling between home and school?• In the hallways of the school?
• In the bathrooms of the school?• In your classes?
Student Classroom Behavior Measure: Most students in my school:
• Like to put others down• Help each other learn
• Don’t get along together very well• Treat each other with respect
Student-Teacher Trust Measure: How much do you agree with:
• I feel safe and comfortable with my teachersat this school.
• My teachers always keep their promises
• My teachers will always listen to students’ideas?
• My teachers treat me with respect?
School Safety Measure: How much do you agree with the following statements about your school?
• I worry about crime and violence at this school• Students at this school are often teased or
picked on
• Students at this school are often threatenedor bullied
Teacher Measures
Teachers Safety Measure: To what extent is each of the following a problem at your school?
• Physical conflicts among students• Robbery or theft• Gang activity• Disorder in classrooms
• Disorder in hallways• Student disrespect of teachers• Threats of violence toward teachers
Teacher-Teacher Trust Measure: To what extent do you feel respected by other teachers at this school? How much do you agree with the following statements about your school?
• Teachers in this school trust each other• It’s OK in this school to discuss feelings,
worries, and frustrations with other teachers
• Teachers respect other teachers who takethe lead in school improvement efforts
• Teachers at this school respect thosecolleagues who are experts at their craft
74 Appendix B
TABLE B.2
Test Score Means and Standard Deviations in 2012-13, by Grade
MOLLY F. GORDON is a Research Scientist at the University of Chicago Consortium on School Research. Her current research focuses on the impact of closing schools on families, students, and staff and examining preschool attendance improvement efforts. Previously, she was a Research Associate at the Center for Applied Research and Educational Improvement (CAREI) at the University of Minnesota. She earned a BA in philosophy and an MA in educational policy studies from the University of Wisconsin–Madison, and a PhD in educational policy and administration from the University of Minnesota–Twin Cities.
MARISA DE LA TORRE is a Senior Research Associate and Managing Director at the University of Chicago Consortium on School Research. Her research interests include urban school reform, school choice, and early indicators of school success. Before joining UChicago Consortium, de la Torre worked for the Chicago Public Schools in the Office of Research, Evaluation, and Accountability. She received a master’s degree in economics from Northwestern University.
JENNIFER R. COWHY is a first-year PhD student in the School of Education and Social Policy at Northwestern University. Cowhy is interested in researching how schools can better serve students who have experienced adverse childhood experiences and students with IEPs. Cowhy worked at the Consortium for six years prior to beginning her studies at Northwestern and received her MPP and AM in social service administration from the University of Chicago and her AB in sociology from the University of Michigan.
PAUL T. MOORE was a Research Analyst at the University of Chicago Consortium on School Research at the time this research was conducted. He has substantial experience evaluating the impacts of education policies and is an ex-pert in causal inference with quasi-experimental designs. His research interests include urban school reform, school choice policies and practices, and quasi-experimental design methodologies. Moore has studied historical trends in student performance and school quality in Chicago. He has co-authored a number of journal articles and reports.
LAUREN SARTAIN is a Senior Research Analyst at the University of Chicago Consortium on School Research. She has a BA from the University of Texas at Austin, as well as a master’s degree in public policy and a PhD from the Harris School of Public Policy at the University of Chicago. She has worked at Chapin Hall and the Federal Reserve Bank of Chicago. Sartain’s research interests include principal and teacher quality, school choice, and urban school reform.
DAVID J. KNIGHT is a PhD student in the Department of Political Science and a fellow in the Interdisciplinary Training Program in Education at the University of Chicago. His current research focuses on the political consequences of housing and education policy and the intersections of race, ethnicity, and place in the transition to adulthood in Chicago. Prior to coming to Chicago, Knight was a pub-lic school teacher in Boston. He earned an AB in history from Dartmouth College, trained as a teacher at Stanford University, and began his research career as a master’s student at Harvard University.
ABOUT THE AUTHORS
This report reflects the interpretation of the authors. Although the UChicago Consortium’s Steering Committee provided technical advice, no formal endorsement by these individuals, organizations, or the full UChicago Consortium should be assumed.
RAQUEL FARMER-HINTONCo-Chair University of Wisconsin, Milwaukee
DENNIS LACEWELLCo-Chair Urban Prep Charter Academy for Young Men
Ex-Officio Members
SARA RAY STOELINGAUrban Education Institute
Institutional Members
SARAH DICKSONChicago Public Schools
ELIZABETH KIRBYChicago Public Schools
TROY LARAVIEREChicago Principals and Administrators Association
KAREN G.J. LEWISChicago Teachers Union
ALAN MATHERChicago Public Schools
TONY SMITHIllinois State Board of Education
Individual Members
GINA CANEVALindblom Math & Science
NANCY CHAVEZOneGoal
KATIE HILLOffice of the Cook County State’s Attorney
MEGAN HOUGARDChicago Public Schools
GREG JONESKenwood Academy
PRANAV KOTHARIRevolution Impact, LLC
LILA LEFFUmoja Student Development Corporation & Emerson Collective
RITO MARTINEZSurge Institute
LUISIANA MELÉNDEZErikson Institute
SHAZIA MILLERNORC at the University of Chicago
CRISTINA PACIONE-ZAYASErikson Institute
BEATRIZ PONCE DE LEÓNGeneration All
PAIGE PONDEROne Million Degrees
KATHLEEN CALIENTOThe Academy Group
AMY TREADWELLChicago New Teacher Center
REBECCA VONDERLACK-NAVARROLatino Policy Forum
PAM WITMERIllinois Network of Charter Schools
JOHN ZEIGLERDePaul University
DirectorsELAINE M. ALLENSWORTHLewis-Sebring Director
CAMILLE A. FARRINGTONManaging Director and Senior Research Associate
JULIA A. GWYNNEManaging Director and Senior Research Scientist
HOLLY HARTSurvey Director
KYLIE KLEINDirector of Research Operations
BRONWYN MCDANIELDirector of Outreach and Communication
JENNY NAGAOKADeputy Director
MELISSA RODERICKSenior DirectorHermon Dunlap Smith ProfessorSchool of Social Service Administration
PENNY BENDER SEBRINGCo-Founder
MARISA DE LA TORREManaging Director and Senior Research Associate
Steering Committee
Executive Summary88
OUR MISSION The University of Chicago Consortium on School Research (UChicago Consortium) conducts research of high technical quality that can inform and assess policy and practice in the Chicago Public Schools. We seek to expand communication among researchers, policymakers, and practitioners as we support the search for solutions to the problems of school reform. The UChicago Consortium encourages the use of research in policy action and improvement of practice, but does not argue for particular policies or programs. Rather, we help to build capacity for school reform by identifying what matters for student success and school improvement, creating critical indicators to chart progress, and conducting theory-driven evaluation to identify how programs and policies are working.