06 th June, 2017 Rising CV radialisation bodes well for JK Tyre JK Tyre is well poised to benefit from the radialisation story in India as it is the largest player with 28% market share in truck tyre segment. Notably, the radialisation levels have increased from 6% in FY09 to 44% in FY16. Owing to benefits like better mileage & durability, radialisation trend in truck & bus segment is expected to catch up at a rapid pace and is likely to reach around 77% by FY21E. JK Tyre’s share of radial tyres revenue has increased from 46% in FY14 to 58% in FY16. With the completion of expansion project at its Chennai plant, the TBR/PCR capacity has increased to 2.3mn/10mn tyres per annum. Further, CIL acquisition would expand its presence in truck radials segment with an incremental capacity of 1.2mn tyres per annum. Thus, we expect India business (contributes 86% to the consolidated revenues) to witness a CAGR of 10% over FY17-19E largely driven by enhanced capacities coupled with rising radialisation levels. Foray into two-wheeler segment has completed the portfolio With the acquisition of CIL, JK Tyre has forayed into the fast-growing 2/3 wheeler category (6.3mn tyres per annum). The entry into the 2Ws space not only helps JK Tyre in becoming a full-range tyre maker but also allows the company in penetrating rural markets. JK Tyre has launched premium 2 and 3-wheeler tyres under the brand ‘Blaze’. Notably, the product has been received well in the market. Currently, 2W tyres contribute nearly 5% to the total revenues & the company is targeting to double the contribution over the next 2 years. Turnaround of Cavendish acquisition to drive growth ahead Within one year of acquisition, JK tyre has managed to turnaround CIL. CIL turned PBT positive in Q4FY17 led by employee rationalisation & reduction in conversion costs. While TBR capacity for JK Tyre (excluding CIL) is being fully utilised, the utilisation level of TBR capacity at CIL has improved to 70-80% since acquisition. More importantly, CIL acquisition has enhanced the domestic capacity by 55% to 1,770 tonnes per day. JK tyre got an access to three factories located at Laksar (Haridwar) where the company would enjoy tax benefits up to 2020. Leverage ratio set to decline from FY18E onwards as no capex plans on the anvil As domestic capacity has increased by 55% with the acquisition of CIL, JK Tyre has no major capex lined up in the medium term. The debt/equity ratio rose from 1.5x in FY16 to 2.5x in FY17 as the company has funded major part of CIL’s acquisition through debt. However, the strong free cash flow generation to the tune of Rs1747cr over FY18-19E would help in improving the leverage ratio to 1.6x in FY19. Valuations Given JK Tyre’s dominant position in TBR segment coupled with robust brand equity, we expect revenue to grow at a CAGR of ~13.4% over FY17-19E. However, PAT is expected to grow at a CAGR of ~32% on account of low base effect. We initiate JK Tyre with a ‘BUY’ rating with a TP of Rs212 at 9.0x FY19E EPS. RETAIL EQUITY RESEARCH JK Tyre & Industries Ltd. Rating as per Mid Cap 12 month investment period Auto Ancillary BSE CODE: 530007 NSE CODE: JKTYRE CMP Rs179 TARGET Rs212 RETURN 18% Bloomberg CODE: JKI:IN SENSEX: 31,191 Company Data Market Cap (cr) Rs4,070 Enterprise Value (cr) Rs9,395 Outstanding Shares (cr) 22.7 Free Float 48% Dividend Yield 1.4% 52 week high Rs185 52 week low Rs83 6m average volume (cr) 0.2 Beta 1.5 Face value Rs2 Shareholding % Q2 FY17 Q3 FY17 Q4 FY17 Promoters 52.3 52.3 52.3 FII’s 12.2 12.7 11.6 MFs/Insti 1.8 1.9 2.0 Public 15.5 16.3 16.9 Others 18.2 16.8 17.2 Total 100.0 100.0 100.0 Price Performance 3mth 6mth 1 Year Absolute Return 44% 46% 107% Absolute Sensex 7% 18% 16% Relative Return* 37% 28% 91% *over or under performance to benchmark index Y.E Mar (Rs cr) FY17 FY18E FY19E Sales 7,689 8,794 9,880 Growth (%) 11.5 14.4 12.4 EBITDA 1,132 1,231 1,463 EBITDA Margin % 14.7 14.0 14.8 PAT Adj. 306 351 535 Growth (%) -36.2 14.5 52.5 Adj.EPS 13.5 15.5 23.6 Growth (%) -36.2 14.5 52.5 P/E 13.3 11.6 7.6 P/B 2.1 1.8 1.5 EV/EBITDA 8.2 7.2 5.8 ROE (%) 16.5 16.7 21.7 D/E 2.5 2.1 1.6 COMPANY INITIATING REPORT BUY Radialisation trend catching up fast… JK Tyre & Industries Ltd (JK Tyre) has been in the business of manufacturing and selling tyres since its inception in 1977. Further, JK Tyre derives ~86%/14% of its revenues from Indian/Mexican markets. It commands a dominant market share of 28% in truck tyre segment. JK Tyre is the major beneficiary of the radialisation trend gaining pace in the truck and bus segment. Radials now account for 44% share as against a meagre 6% share in FY09. With an entry into the lucrative 2W space through the acquisition of Cavendish Industries Limited (CIL), JK Tyre has become a full-range tyre player. India business is expected to grow at a CAGR of 10% over FY17-19E driven by enhanced capacities & acquisition of CIL. D/E ratio is expected to decline from 2.5x in FY17 to 1.6x by FY19E owing to strong free cash flow generation to the tune of Rs1747cr over FY18-19E. We initiate JK Tyre with a “BUY” rating valuing the stock at 9x FY19E EPS arriving at a target price (TP) of Rs212.
Transcript
06th June, 2017
Rising CV radialisation bodes well for JK Tyre
JK Tyre is well poised to benefit from the radialisation story in India as it is the largest player with 28% market share in truck tyre segment. Notably, the radialisation levels have increased from 6% in FY09 to 44% in FY16. Owing to benefits like better mileage & durability, radialisation trend in truck & bus segment is expected to catch up at a rapid pace and is likely to reach around 77% by FY21E. JK Tyre’s share of radial tyres revenue has increased from 46% in FY14 to 58% in FY16. With the completion of expansion project at its Chennai plant, the TBR/PCR capacity has increased to 2.3mn/10mn tyres per annum. Further, CIL acquisition would expand its presence in truck radials segment with an incremental capacity of 1.2mn tyres per annum. Thus, we expect India business (contributes 86% to the consolidated revenues) to witness a CAGR of 10% over FY17-19E largely driven by enhanced capacities coupled with rising radialisation levels.
Foray into two-wheeler segment has completed the portfolio With the acquisition of CIL, JK Tyre has forayed into the fast-growing 2/3 wheeler category (6.3mn tyres per annum). The entry into the 2Ws space not only helps JK Tyre in becoming a full-range tyre maker but also allows the company in penetrating rural markets. JK Tyre has launched premium 2 and 3-wheeler tyres under the brand ‘Blaze’. Notably, the product has been received well in the market. Currently, 2W tyres contribute nearly 5% to the total revenues & the company is targeting to double the contribution over the next 2 years. Turnaround of Cavendish acquisition to drive growth ahead Within one year of acquisition, JK tyre has managed to turnaround CIL. CIL turned PBT positive in Q4FY17 led by employee rationalisation & reduction in conversion costs. While TBR capacity for JK Tyre (excluding CIL) is being fully utilised, the utilisation level of TBR capacity at CIL has improved to 70-80% since acquisition. More importantly, CIL acquisition has enhanced the domestic capacity by 55% to 1,770 tonnes per day. JK tyre got an access to three factories located at Laksar (Haridwar) where the company would enjoy tax benefits up to 2020. Leverage ratio set to decline from FY18E onwards as no capex plans on the anvil As domestic capacity has increased by 55% with the acquisition of CIL, JK Tyre has no major capex lined up in the medium term. The debt/equity ratio rose from 1.5x in FY16 to 2.5x in FY17 as the company has funded major part of CIL’s acquisition through debt. However, the strong free cash flow generation to the tune of Rs1747cr over FY18-19E would help in improving the leverage ratio to 1.6x in FY19. Valuations Given JK Tyre’s dominant position in TBR segment coupled with robust brand equity, we expect revenue to grow at a CAGR of ~13.4% over FY17-19E. However, PAT is expected to grow at a CAGR of ~32% on account of low base effect. We initiate JK Tyre with a ‘BUY’ rating with a TP of Rs212 at 9.0x FY19E EPS.
RETAIL EQUITY RESEARCH
JK Tyre & Industries Ltd. Rating as per Mid Cap 12 month investment period Auto Ancillary
Relative Return* 37% 28% 91% *over or under performance to benchmark index
Y.E Mar (Rs cr) FY17 FY18E FY19E
Sales 7,689 8,794 9,880
Growth (%) 11.5 14.4 12.4
EBITDA 1,132 1,231 1,463
EBITDA Margin % 14.7 14.0 14.8
PAT Adj. 306 351 535
Growth (%) -36.2 14.5 52.5
Adj.EPS 13.5 15.5 23.6
Growth (%) -36.2 14.5 52.5
P/E 13.3 11.6 7.6
P/B 2.1 1.8 1.5
EV/EBITDA 8.2 7.2 5.8
ROE (%) 16.5 16.7 21.7
D/E 2.5 2.1 1.6
COMPANY INITIATING
REPORT
GEOJIT BNP PARIBAS
Research
COMPANY INITIATING REPORT
BUY
Radialisation trend catching up fast… JK Tyre & Industries Ltd (JK Tyre) has been in the business of manufacturing and selling tyres since its inception in 1977. Further, JK Tyre derives ~86%/14% of its revenues from Indian/Mexican markets. It commands a dominant market share of 28% in truck tyre segment.
JK Tyre is the major beneficiary of the radialisation trend gaining pace in the truck and bus segment. Radials now account for 44% share as against a meagre 6% share in FY09.
With an entry into the lucrative 2W space through the acquisition of Cavendish Industries Limited (CIL), JK Tyre has become a full-range tyre player.
India business is expected to grow at a CAGR of 10% over FY17-19E driven by enhanced capacities & acquisition of CIL.
D/E ratio is expected to decline from 2.5x in FY17 to 1.6x by FY19E owing to strong free cash flow generation to the tune of Rs1747cr over FY18-19E.
We initiate JK Tyre with a “BUY” rating valuing the stock at 9x FY19E EPS arriving at a target price (TP) of Rs212.
Valuations Our target price of Rs212 is based on 9x FY19E EPS. Over the past three years, the stock has traded between 2-11x one-year forward earnings, whilst its three-year average is ~7x. Our target multiple (9.0x) is at a premium of 28% to JK Tyre’s past three year average PE multiple. We are upbeat on the stock owing to several factors: a) diversified product mix with a greater focus on radialisation, b) holds dominant market share of 28% in TBR space, c) capacity expansion & CIL acquisition to drive volume growth, d) strong replacement demand and e) poised to enter the growth phase with India business expected to witness a healthy CAGR of 10% over FY17-19E. Peers like Apollo Tyres, at 12.2x/10.1x for FY18E/FY19E and CEAT, at 17.9x/14.1x for FY18E/FY19E, are valued far higher. Ceat enjoys a premium multiple (valued at 13.0x FY19 EPS) over JK Tyre as Ceat is relatively less leveraged (FY17 D/E ratio of Ceat was 0.4x versus JK Tyre’s 2.5x). However, with higher sales, better margin & return ratios profile, we believe the steep discount to Ceat’s multiple is unwarranted.
P/E one year forward
Source: Bloomberg, Geojit Research; Note: SD is Standard Deviation Peer comparison
Investment Rationale A well-diversified product portfolio
The company’s diverse product portfolio spans across the entire range including truck & bus, passenger cars, light trucks, agriculture & off-the road tyres. With the latest acquisition of Cavendish Industries, JK Tyre has forayed into two & three-wheeler space. This acquisition not only helps JK tyre in becoming a full-range tyre maker but also allows the company in penetrating rural markets. It is the largest player in the truck tyre segment with 28% market share. Notably, truck & bus segment contributes the maximum 67% to the total revenue followed by passenger car (15%), light truck (12%), farm (4%) and OTR & others (2%) segments. Notably, JK Tyre is a pioneer in the implementation of radialisation in the tyre industry. Over the past several years, JK Tyre has added clients to its OEM portfolio across categories, showcasing its R&D capabilities. The company is consistently investing in upgrading its technological capabilities and R&D to deliver high-quality, innovative and specialized products across categories.
Comprehensive product portfolio
Source: Company, Geojit Research
Revenue breakdown by product
Source: Company, Geojit Research
Many first to its credit
JK Tyre was the first player in India to launch radial technology for entire range (passenger car, LCV, bus, truck and tractors). Further, it was also the first company to launch V-Rated eco-friendly tyres with high performance.
Impressive customer base & extensive distribution network
JK Tyre has global presence in 100 countries spread across six continents. The company generates 35% of its revenue from OEMs, 56% from replacement market and 9% from exports. It has consistently added new customers and supplies to most of the OEMs in truck, passenger car, truck, tractor & OTR categories. JK Tyre is a partner to some of the renowned OEMs including Tata Motors, Ashok Leyland, M&M, Volvo Eicher, Maruti Suzuki, General Motors, Volkswagen, BEML & Caterpillar India. The company has 143 JK Tyre selling points which service the growing needs of about 4,000 dealers (1,000 exclusive) across India. Further, the company markets products through 25 ‘JK Tyre Truck Wheels’ (fully equipped tyre service centre). Moreover, it has about 230 one stop retail & tyre care outlets called ‘JK Tyre Steel Wheels’ which generate significant portion of PCR sales.
Diversified customer base
Source: Company, Geojit Research
New products launched over the years
Source: Company, Geojit Research
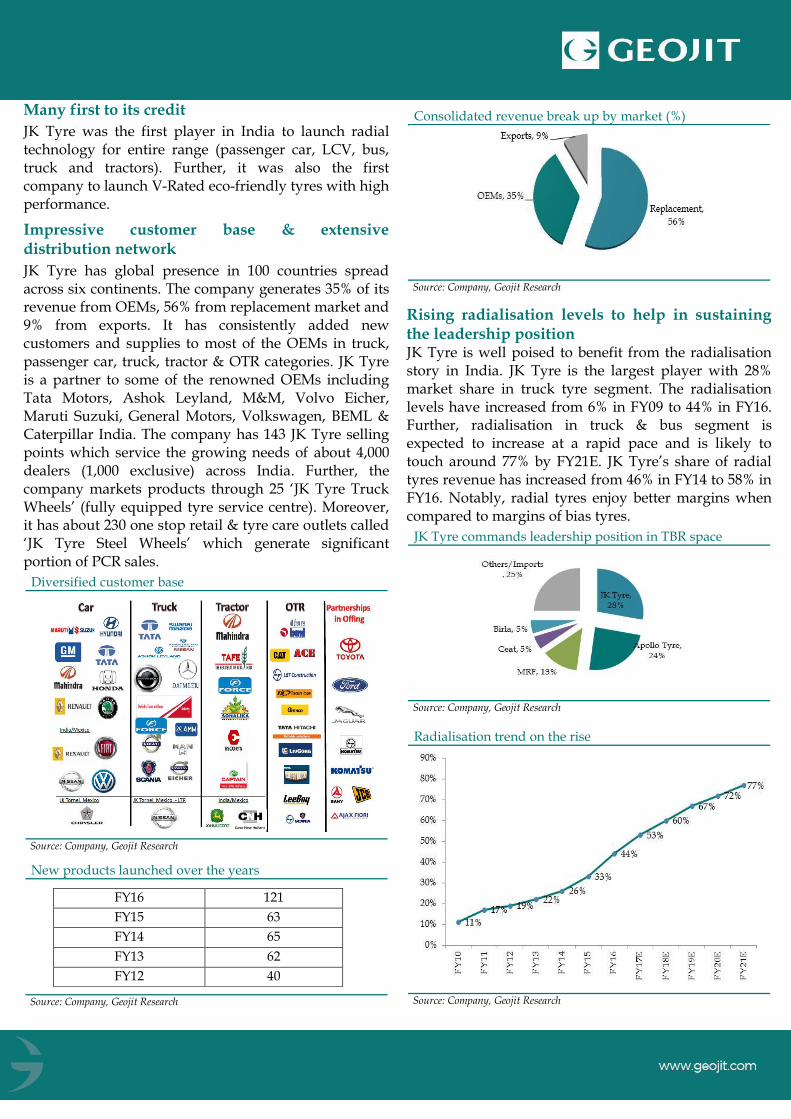
Consolidated revenue break up by market (%)
Source: Company, Geojit Research
Rising radialisation levels to help in sustaining the leadership position JK Tyre is well poised to benefit from the radialisation story in India. JK Tyre is the largest player with 28% market share in truck tyre segment. The radialisation levels have increased from 6% in FY09 to 44% in FY16. Further, radialisation in truck & bus segment is expected to increase at a rapid pace and is likely to touch around 77% by FY21E. JK Tyre’s share of radial tyres revenue has increased from 46% in FY14 to 58% in FY16. Notably, radial tyres enjoy better margins when compared to margins of bias tyres.
JK Tyre commands leadership position in TBR space
Source: Company, Geojit Research
Radialisation trend on the rise
Source: Company, Geojit Research
FY16 121
FY15 63
FY14 65
FY13 62
FY12 40
Truck tyre demand to revive
JK Tyre is India’s largest player with 28% market share in truck tyre segment. Importantly, during the past five fiscals (FY11-16), demand for truck tyre has been almost flat when compared to long-term average of 6-7%. However, going forward, we expect truck tyre demand to revive & register a CAGR of ~6% over FY16-19E on account of four factors: (1) shift towards large trucks, (2) government focus on infrastructure development, (3) stricter vehicle scrappage policy & (4) shift to stricter emission norms will drive the fleet demand.
India Truck tyre demand to witness a CAGR of 6% during FY16-19E
Source: Industry, Geojit Research; Note: figures are in million units
Cavendish Acquisition – The next growth engine In 2015, JK Tyre acquired Cavendish Industries Ltd (CIL), a unit of Kesoram Industries, for Rs2,195cr. Notably, since May, 2016, JK Tyre has started to consolidate the financials of CIL (acquisition impact) onto the overall financials of the company. The deal has added a capacity to produce 10mn tyres a year and hence the total manufacturing capacity in India will increase to 27mn units a year. More importantly, this acquisition has provided JK tyre an entry point into the fast-growing 2/3 wheeler category. Interestingly, CIL has a capacity of 6.3mn tyres per annum in this category. The foray into the 2Ws space not only helps JK Tyre in becoming a full-range tyre maker but also allows the company in penetrating rural markets. JK Tyre has launched premium two and three-wheeler tyres under the brand ‘Blaze’. Notably, the product has been received well in the market. Currently, 2W tyres contribute nearly 5% to the total revenues & the company is targeting to double the contribution over the next two years. Further, this acquisition would expand its presence in truck radials segment with an incremental capacity of 1.2mn tyres.
…Turnaround of Cavendish to aid growth
The operations of CIL have turned around & it posted a profit in its very first year of operations led by employee rationalisation & reduction in conversion costs. Notably, the utilisation levels of CIL’s units manufacturing truck radials have gone up to 70-80% since acquisition. JK tyre got an access to three factories located at Laksar (Haridwar) where the company would enjoy tax benefits up to 2020.
Chinese imports on the downtrend
Imports of the Chinese tyres have been severely hurt by the demonetisation drive. Further, the government is mulling to impose anti-dumping duty on imported Chinese truck radial tyres. This can further improve both volumes and realisations for Indian TBR players.
India revenue to grow at 10% CAGR over FY17-19E
Source: Company, Geojit Research
Mexican operations to witness an improving trend In 2008, JK Tyre acquired Mexican tyre-maker Tornel in order to gain free access to the North American markets. Mexico business contributed 14% to the total consolidated revenues in FY16. It has over 85% market share in Light Commercial Vehicles (LCVs) bias, 88% market share in truck bias and 8% market share in passenger line radials. It also supplies farm and industrial tyres. It has 3 manufacturing plants in Mexico & the total capacity is around 8.3mn tyres p.a. in PCR, truck bias and other tyres segments. Over the last 8 years, the capacity utilisation levels have increased from 40% to 70%. In FY16, JK Tyre has increased capacity in PCR segment by 1.5mn tyres. We expect the Mexican operations to register revenue CAGR of ~15% during FY17-19E aided by enhanced capacity.
Mexico revenue to grow at 15% CAGR over FY17-19E
Source: Company, Geojit Research
Financials
Enhanced capacity to aid JK Tyre’s overall revenue growth
During FY12-16, JK Tyre posted flat revenue CAGR of 0.6% due to sluggish performance of the Indian business. The Indian business registered a CAGR of just 1.8% over FY12-16 due to two major factors: a) decline in M&HCV volumes during FY12-14 (recovery witnessed from FY15 onwards) & b) lower TBR volumes due to Chinese dumping. However, during FY17-19E, we estimate overall revenue to witness a healthy CAGR of 13% primarily driven by Indian business. We expect India business (contributes 86% to the consolidated revenues) to witness a CAGR of 10% over FY17-19E largely driven by enhanced capacities (domestic capacity has increased by 55% with CIL acquisition) & rising radialisation levels. Further, truck tyre demand is expected to pick-up owing to robust replacement demand. Notably, truck & bus segment contributes the maximum 67% to the total revenue. While we expect M&HCV segment to grow at ~8% CAGR over FY16-19E, we expect truck tyre demand to revive & register a CAGR of ~6% over FY16-19E.
Overall revenue to grow at 13% CAGR during FY17-19E
Source: Company, Geojit Research
EBITDA margin to remain tepid JK Tyre’s EBITDA margin has increased from 4.8% in FY12 to 16.2% in FY16 on account of rising radialisation level & lower natural rubber prices (account for ~50% of the overall raw material costs). Notably, the average rubber prices have declined from ~Rs210/kg in FY12 to ~Rs115/kg in FY16. Further, higher proportion of revenues coming from value-added radial tyres has supported the margins. While the radialisation levels is expected to inch up to 67% in FY19E, any uptick in natural rubber prices would arrest any gains in margins. Interestingly, JK Tyre has been undertaking regular price hikes (increased prices by ~6-9% in the last seven months) to offset the higher raw material costs. Thus, we expect EBITDA margins to hover around 14.0%/14.8% levels in FY18E/FY19E.
EBITDA margin to recover in FY19E
Source: Company, Geojit Research
PAT to grow at 32% CAGR over FY17-19E In FY16, Adj. PAT stood at Rs480cr, reporting a growth of ~33% CAGR over FY13-16. PAT margin improved by 190bps to 7.0% YoY in FY16. We expect Adj. PAT to grow at a CAGR of ~32% over FY17-19E on account of low base effect.
PAT to grow at 32% CAGR over FY17-19E
Source: Company, Geojit Research
Comfortable balance sheet Barring FY13, JK Tyre has been generating strong operating cash flows (OCF) over the years. During FY12-16, OCF has grown at a CAGR of ~26%. Notably, JK Tyre improved its solvency ratios significantly over FY12-16. Net debt to equity ratio declined from 2.8x in FY12 to 1.5x in FY16. However, the leverage ratio rose to 2.5x in FY17 as the company has funded major part of CIL’s acquisition through debt. With no major capex plan on the anvil (domestic capacity has increased by 55% with CIL acquisition) coupled with strong free cash flow generation to the tune of Rs1747cr over FY18-19E, we expect leverage ratio to improve from the current levels to 1.6x in FY19.
Return ratios trend
Source: Company, Geojit Research
JK Tyres: Business Overview JK Tyre & Industries Ltd (JK Tyre) is one of the leading tyre manufacturers in the country. The company derives 86% & 14% of its revenues from India and Mexico markets respectively. It commands leadership position in the Indian truck and bus radial tyre segment, with a market share of 28%. The product profile spans the entire range including passenger cars, utility vehicles, light trucks, truck & bus, agriculture & off-the road tyres. With the acquisition of CIL, ATL forayed into two-wheeler segment. Its key brands include JK Tyre, Vikrant and Tornel. JK Tyre has 12 manufacturing locations spread across India (9) & Mexico (3). It has a total production capacity of 2,110 tonne per day.
Consolidated revenue break up by geography (%)
Source: Company, Geojit Research
Key Risks: Any sharp increase in natural rubber prices
Total Liabilities 6,584 6,544 10,038 10,080 10,351
BVPS (Rs) 61.8 77.2 86.6 98.8 118.5
Ratios
Y.E March FY15A FY16A FY17A FY18E FY19E
Profitab. & Return
EBITDA margin (%) 12.6 16.2 14.7 14.0 14.8
EBIT margin (%) 10.5 13.1 10.9 10.5 11.6
Net profit mgn.(%) 5.1 7.0 4.0 4.0 5.4
ROE (%) 30.1 30.5 16.5 16.7 21.7
ROCE (%) 19.3 21.0 15.2 12.9 16.3
W.C & Liquidity
Receivables (days) 65.6 68.2 81.0 75.3 75.3
Inventory (days) 52.6 59.7 79.2 73.8 73.7
Payables (days) 59.6 60.3 67.6 64.6 65.2
Current ratio (x) 1.6 1.6 2.0 1.9 1.9
Quick ratio (x) 1.2 1.1 1.3 1.3 1.3
Turnover &Levg.
Gross asset T.O (x) 1.5 1.2 1.0 1.0 1.1
Total asset T.O (x) 1.1 1.0 0.8 0.8 0.9
Adj. debt/equity (x) 2.1 1.5 2.5 2.1 1.6
Valuation ratios
EV/Sales (x) 0.9 1.0 1.2 1.0 0.9
EV/EBITDA (x) 7.4 5.9 8.2 7.2 5.8
P/E (x) 10.8 8.5 13.3 11.6 7.6
P/BV (x) 2.9 2.3 2.1 1.8 1.5
Recommendation Summary
Dates Rating Target
06-June-2017 BUY 212
Source: Bloomberg, Geojit BNP Paribas Research
Large Cap Stocks; Mid Cap and Small Cap;
Buy - Upside is 10% or more. Hold - Upside or downside is less than 10%. Reduce - Downside is 10% or more.
Buy - Upside is 15% or more. Accumulate* - Upside between 10% - 15%. Hold - Absolute returns between 0% - 10%. Reduce/Sell - Absolute returns less than 0%. To satisfy regulatory requirements, we attribute ‘Accumulate’ as Buy and ‘Reduce’ as Sell.
The recommendations are based on 12 month horizon, unless otherwise specified. The investment ratings are on absolute positive/negative return basis. It is possible that due to volatile price fluctuation in the near to medium term, there could be a temporary mismatch to rating. * For reasons of valuations/return/lack of clarity/event we may revisit rating at appropriate time. Please note that the stock always carries the risk of being upgraded to BUY or downgraded to a HOLD, REDUCE or SELL.
Geojit Financial Services Limited has outsourced the preparation of this research report to DION Global Solutions Limited whose relevant disclosures are
available hereunder. However, Geojit’s research desk has reviewed this report for any untrue statement of material fact or any false or misleading
information.
General Disclosures and Disclaimers
CERTIFICATION
I, Rohit Joshi, employee of Dion Global Solutions Limited (Dion) is engaged in preparation of this report and hereby certify that all the views expressed in this research report
(report) reflect my personal views about any or all of the subject issuer or securities.
Disclaimer
This report has been prepared by Dion and the report & its contents are the exclusive property of the Dion and the client cannot tamper with the report or its contents in any
manner and the said report, shall in no case, be further distributed to any third party for commercial use, with or without consideration.
Geojit Financial Services Limited has outsourced the assignment of preparation of this report to Dion.
Recipient shall not further distribute the report to a third party for a commercial consideration as this report is being furnished to the recipient solely for the purpose of
information.
Dion has taken steps to ensure that facts in this report are based on reliable information but cannot testify, nor make any representation or warranty, express or implied, to the
accuracy, contents or data contained within this report. It is hereby confirmed that wherever Dion has employed a rating system in this report, the rating system has been clearly
defined including the time horizon and benchmarks on which the rating is based.
Descriptions of any company or companies or their securities mentioned herein are not intended to be complete and this report is not, and should not be construed as an offer or
solicitation of an offer, to buy or sell any securities or other financial instruments. Dion has not taken any steps to ensure that the securities referred to in this report are suitable for
any particular investor. This report is not to be relied upon in substitution for the exercise of independent judgment. Opinions or estimates expressed are current opinions as of
the original publication date appearing on this report and the information, including the opinions and estimates contained herein, are subject to change without notice. Dion is
under no duty to update this report from time to time.
Dion or its associates including employees engaged in preparation of this report and its directors do not take any responsibility, financial or otherwise, of the losses or the
damages sustained due to the investments made or any action taken on basis of this report, including but not restricted to, fluctuation in the prices of securities, changes in the
currency rates, diminution in the NAVs, reduction in the dividend or income, etc.
Geojit Financial Services Ltd. (formerly known as Geojit BNP Paribas Financial Services Ltd.), Registered Office: 34/659-P, Civil Line Road, Padivattom, Kochi-682024, Kerala, India. Phone: +91 484-2901000, Fax: +91 484-2979695, Website: geojit.com. For investor queries: [email protected], For grievances: [email protected], For compliance officer: [email protected].
Corporate Identity Number: L67120KL1994PLC008403, SEBI Regn.Nos.: NSE: INB/INF/INE231337230 I BSE:INB011337236 & INF011337237 | MSEI: INE261337230, INB261337233 & INF261337233, Research Entity SEBI Reg No: INH200000345, Investment Adviser SEBI Reg No: INA200002817, Portfolio Manager:INP000003203, NSDL: IN-DP-NSDL-24-97, CDSL: IN-DP-CDSL-648-2012, ARN Regn.Nos:0098, IRDA Corporate Agent (Composite) No.: CA0226. Research Entity SEBI Registration Number: INH200000345
The investments or services contained or referred to in this report may not be suitable for all equally and it is recommended that an independent investment advisor be consulted.
In addition, nothing in this report constitutes investment, legal, accounting or tax advice or a representation that any investment or strategy is suitable or appropriate to individual
circumstances or otherwise constitutes a personal recommendation of Dion.
REGULATORY DISCLOSURES:
Dion is engaged in the business of developing software solutions for the global financial services industry across the entire transaction lifecycle and inter-alia provides research
and information services essential for business intelligence to global companies and financial institutions. Dion is listed on BSE Limited (BSE) and is also registered under the SEBI
(Research Analyst) Regulations, 2014 (SEBI Regulations) as a Research Analyst vide Registration No. INH100002771. Dion’s activities were neither suspended nor has it defaulted
with requirements under the Listing Agreement and / or SEBI (Listing Obligations and Disclosure Requirements) Regulations, 2015 with the BSE in the last five years. Dion has
not been debarred from doing business by BSE / SEBI or any other authority.
In the context of the SEBI Regulations, we affirm that we are a SEBI registered Research Analyst and in the course of our business, we issue research reports /research analysis etc
that are prepared by our Research Analysts. We also affirm and undertake that no disciplinary action has been taken against us or our Analysts in connection with our business
activities.
In compliance with the above mentioned SEBI Regulations, the following additional disclosures are also provided which may be considered by the reader before making an
investment decision:
1. Disclosures regarding Ownership
Dion confirms that:
(i) It/its associates have no financial interest or any other material conflict in relation to the subject company (ies) covered herein at the time of publication of this report.
(ii) It/its associates have no actual / beneficial ownership of 1% or more securities of the subject company (ies) covered herein at the end of the month immediately
preceding the date of publication of this report.
Further, the Research Analyst confirms that:
(i) He, his associates and his relatives have no financial interest in the subject company (ies) covered herein, and they have no other material conflict in the subject
company at the time of publication of this report.
(ii) He, his associates and his relatives have no actual/beneficial ownership of 1% or more securities of the subject company (ies) covered herein at the end of the month
immediately preceding the date of publication of this report.
2. Disclosures regarding Compensation:
During the past 12 months, Dion or its Associates:
(a) Have not managed or co-managed public offering of securities for the subject company (b) Have not received any compensation for investment banking or merchant banking
or brokerage services from the subject company (c) Have not received any compensation for products or services other than investment banking or merchant banking or
brokerage services from the subject. (d) Have not received any compensation or other benefits from the subject company or third party in connection with this report
3. Disclosure regarding the Research Analyst’s connection with the subject company:
It is affirmed that I, Rohit Joshi employed as Research Analyst by Dion and engaged in the preparation of this report have not served as an officer, director or employee of the
subject company
4. Disclosure regarding Market Making activity:
Neither Dion /its Research Analysts have engaged in market making activities for the subject company.
Copyright in this report vests exclusively with Dion.