Research Working Paper Series Nature Or Nurture: Why Do Railroads Carry Greater Freight Share In The United States Than In Europe? Jose Manuel Vassallo ∗ Associate Professor ETSI Caminos, Canales y Puertos Universidad Politécnica de Madrid (UPM) Mark Fagan + Senior Fellow Center for Business and Government Harvard University December 20, 2005 WP05-15 The views expressed in the Taubman Center Research Working Paper Series are those of the author(s) and do not necessarily reflect those of the John F. Kennedy School of Government or Harvard University. Copyright belongs to the author(s). Papers may be downloadable for personal use only. ∗ First Author. Mail Address: Departamento de Transportes. ETSI Caminos, Canales y Puertos. Profesor Aranguren s/n. 28040. MADRID. SPAIN. Phone: 34 91 3366657. Fax: 34 91 3366656. e-mail: [email protected]+ Second and Corresponding Author. Mail Address: Center for Business and Government. Kennedy School of Government. 79 JFK Street. CAMBRIDGE. MA-02138. USA. Phone: .Fax: 617 496 0063. e-mail: [email protected]1
Transcript
Research Working Paper Series
Nature Or Nurture: Why Do Railroads Carry Greater Freight Share
In The United States Than In Europe?
Jose Manuel Vassallo∗
Associate Professor ETSI Caminos, Canales y Puertos
Universidad Politécnica de Madrid (UPM)
Mark Fagan+
Senior Fellow Center for Business and Government
Harvard University
December 20, 2005
WP05-15
The views expressed in the Taubman Center Research Working Paper Series are those of the author(s) and do not necessarily reflect those of the John F. Kennedy School of Government or Harvard University. Copyright belongs to the author(s). Papers may be downloadable for personal use only. ∗ First Author. Mail Address: Departamento de Transportes. ETSI Caminos, Canales y Puertos. Profesor Aranguren s/n. 28040. MADRID. SPAIN. Phone: 34 91 3366657. Fax: 34 91 3366656. e-mail: [email protected] + Second and Corresponding Author. Mail Address: Center for Business and Government. Kennedy School of Government. 79 JFK Street. CAMBRIDGE. MA-02138. USA. Phone: .Fax: 617 496 0063. e-mail: [email protected]
1
Abstract
During the 1950s the share of freight carried by railroads was similar and declining in both the
United States and Europe. By 2000 the railroads’ share of freight (measured in ton-kilometers) had
reached 38 percent in the United States while falling to 8 percent in Europe. This paper examines the
reasons for the difference in rail’s share of freight in Europe and the United States. We find that almost
80 percent of the gap in 2000 is probably due to natural or inherent differences, principally geography,
shipment distance and commodity mix. A little more than a 20 percent of the gap cannot be explained by
these inherent differences and is presumably due to public policies including priority of passenger service,
lack of interoperability at borders, and incentives of the rail operators. We estimate that if that policy gap
were closed railroads’ share of freight in Europe would almost double, increasing to 15 percent.
Key Words: Railroad, freight transportation, Europe, United States, Competition.
2
I. Introduction
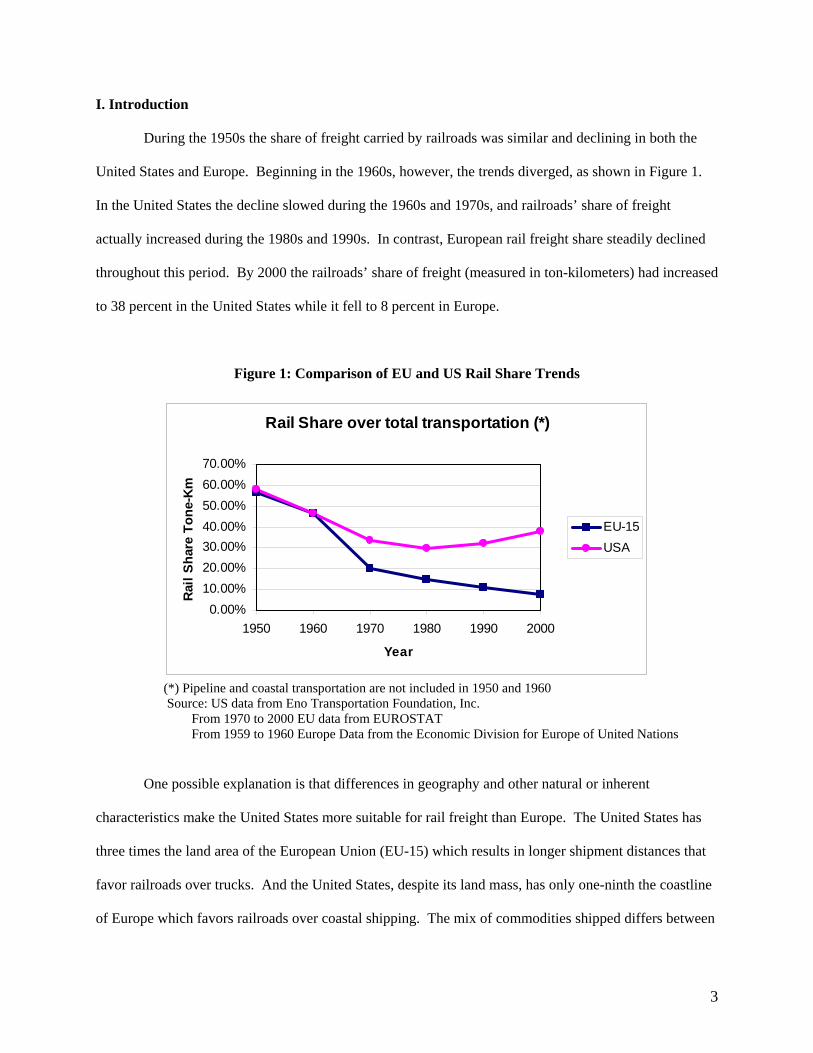
During the 1950s the share of freight carried by railroads was similar and declining in both the
United States and Europe. Beginning in the 1960s, however, the trends diverged, as shown in Figure 1.
In the United States the decline slowed during the 1960s and 1970s, and railroads’ share of freight
actually increased during the 1980s and 1990s. In contrast, European rail freight share steadily declined
throughout this period. By 2000 the railroads’ share of freight (measured in ton-kilometers) had increased
to 38 percent in the United States while it fell to 8 percent in Europe.
Figure 1: Comparison of EU and US Rail Share Trends
Rail Share over total transportation (*)
0.00%10.00%20.00%30.00%40.00%50.00%60.00%70.00%
1950 1960 1970 1980 1990 2000
Year
Rai
l Sha
re T
one-
Km
EU-15USA
(*) Pipeline and coastal transportation are not included in 1950 and 1960 Source: US data from Eno Transportation Foundation, Inc.
From 1970 to 2000 EU data from EUROSTAT From 1959 to 1960 Europe Data from the Economic Division for Europe of United Nations
One possible explanation is that differences in geography and other natural or inherent
characteristics make the United States more suitable for rail freight than Europe. The United States has
three times the land area of the European Union (EU-15) which results in longer shipment distances that
favor railroads over trucks. And the United States, despite its land mass, has only one-ninth the coastline
of Europe which favors railroads over coastal shipping. The mix of commodities shipped differs between
3
the United States and Europe as well, and often in ways that bolster United States railroad share. For
example, a substantial portion of United States electricity is generated by burning coal which requires
substantial movements of coal over long distances.
An alternative explanation is that public policies have been more supportive of rail freight in the
United States than in Europe. At first glance this idea seems suspect: Europe has much higher taxes on
motor vehicle fuels and a long history of subsidizing its railroads. And although both Europe and the
United States have built extensive high-performance highway systems, in Europe these are often financed
by tolls while in the United States many are not. However, countervailing factors could be at work. The
United States has encouraged its freight railroads to be more efficient by leaving them in private hands
instead of nationalizing them, as Europe did. Moreover, the United States released the private railroads
from the obligation to provide urban commuter service in 1958 and intercity passenger service in 1970
and then substantially eliminated government controls over freight tariffs in 1980, three steps which
allowed railroad managers the freedom and flexibility to focus on freight.
This paper adds to the literature an examination of the reasons for the difference in rail’s share of
freight in Europe and the United States. As the first comprehensive analytical comparison, the research
provides an initial explanation of the rail share issue at the macro level. The methodology features a step-
by-step calculation of European Union rail share under the assumption of United States conditions. We
begin by calculating the European Union rail freight volume assuming that its rail share equals that of the
Unites States. That theoretical volume is then reduced to reflect the role of water and pipeline, shipment
distance, and commodity mix. The residual is thought to be a result of policy differences.
In brief, we find that a bit less than 80 percent of the gap in 2000 is probably due to natural or
inherent differences, principally the shorter coastline and the longer shipment distances but also
differences in commodities moved. A little bit more than 20 percent of the gap cannot be explained by
these inherent differences and is presumably due to public policies. If that gap were closed, railroads’
share of freight in Europe would approximately double, increasing from 8 to 15 percent. We believe this
estimate is conservative because of the numerous European Union policies favoring railroads.
4
Section II of this paper provides background about the railroads in the United States and the
European Union as well as the current concerns about rail share in the European Union. Section III
describes the data sources used. Section IV explains the calculations used to estimate what portion of
rail’s lower European share is due to inherent differences between Europe and the United States. Section
V considers the residual portion, which we attribute to policy differences between Europe and the United
States. Section VI provides conclusions based on the research and suggests areas of further analysis.
In this paper the European Union refers to the EU-15: Austria, Belgium, Denmark, Germany,
Greece, Finland, France, Ireland, Italy, Luxembourg, the Netherlands, Portugal, Spain, Sweden, and the
United Kingdom. The ten countries which joined the European Union in 2004 are not included both
because their integration into the Union is just beginning and because consistent data for these new
members is not readily available.
II. Background
The United States. The improvement in the performance of United States freight railroads in the
late 20th century coincides with important changes in public policy toward railroads. Until 1970 virtually
all intercity railroad services—passenger and freight—were provided by privately owned but
government-regulated companies. The most important regulator was the Interstate Commerce
Commission (ICC), which had been established by Congress in 1887 in part to prevent railroads from
abusing the monopoly power they were thought to enjoy. Toward that end, the ICC eventually acquired
powers to control entry and exit to the railroad industry, mergers, service offerings and tariffs (Kheeler
1983). By the 1950s, however, improvements in waterways, the construction of the Interstate and
Defense Highway System and the growth of trucking had substantially weakened the railroads’ natural
monopoly in freight (Winston 1990 et al., Kheeler 1983). The development of the highway system and
the improvement in aircraft technology greatly increased competition from buses, autos, and airlines and
diverted almost all passengers from the railroads, with the exception of commuter services in the largest
5
metropolitan areas and intercity services along the Northeast Corridor running from Washington through
New York to Boston.
The railroads began to complain that the ICC, and its sister regulatory agencies at the state level,
were making it difficult for them to adapt to the increased competition. Regulators often prevented the
railroads from abandoning unprofitable passenger services or lightly used freight branch lines, for
example, forcing the companies to try to make up the losses in the declining number of markets that were
profitable. The railroads’ complaints gained credibility in the 1960s as the financial situation of the
industry deteriorated steadily (Winston 2004). By 1970 the railroad industry was in crisis, and between
1970 and 1975 several large carriers filed for bankruptcy.
Congress responded in part by passing two acts that relieved the railroads of the responsibility of
providing passenger services. The first, passed in 1958, stripped state regulators of the power to prevent
the railroads from abandoning unprofitable intrastate services. This act had the effect of forcing
metropolitan areas that wanted to maintain urban commuter railroad services to either subsidize their
operation by incumbent railroads or to take over the responsibility for commuter services themselves.
The second act, passed in 1970, established a government-owned company, Amtrak, to provide intercity
passenger services. Railroads were required to make a contribution (in cash or in rolling stock)
proportional to their estimated financial losses from intercity passenger service and to grant Amtrak the
right to operate over their lines at a reasonable cost and, in return, Amtrak would assume responsibility
for their passenger services. A few years later Amtrak acquired its own right-of-way in the Northeast
Corridor as the result of the bankruptcy of the largest railroad in the region.
When relief from passenger service proved insufficient to arrest the railroads’ decline Congress
responded in the 1970s by restricting the ICC’s powers to regulate freight services and tariffs. These
efforts culminated in the Staggers Act of 1980, which virtually eliminated ICC controls over freight tariffs
and rescinded the long-standing prohibition against private long-term contracts between shippers and
railroads. The act’s intention was that shippers and railroads would negotiate long term contracts
governing the services offered and the tariffs to be paid. Shippers would be protected from monopoly
6
power because they could negotiate a long-term contract before they invested in facilities on a railroad’s
lines (Gomez-Ibanez 2003). Shippers could appeal to the ICC (and later to its successor, the Surface
Transportation Board) in the event of an impasse, but only if the railroad was insisting on tariffs that were
more than 180 percent of its variable costs and certain other tests were met.
The effect of the Staggers Act was to allow the competitive market, not regulation, to drive
railroad decision-making. Private long-term contracts gave railroads and shippers the protection they
needed to make specialized cost-saving investments tailored to particular freight movements. The use of
dedicated unit trains to carry coal and other bulk commodities spread rapidly, for example, because of the
ability to customize services and assure long-term shipper commitments. These and other innovations led
to substantial productivity gains and cost reductions (Bitzan and Keeler 2003, Chapman and Martland
1997). Revenue ton-miles per employee-hour increased more than 320 percent from 1980 to 2002, for
example, while gallons of fuel per revenue ton-mile dropped 41 percent during that same time period. As
part of the effort to improve productivity, railroads shed excess and underutilized lines while improving
core operations. Light density lines were often sold to specialized short-line operators, whose flexible
work rules and low cost structures enabled them to compete with other modes for traffic.
Competition also brought new service offerings to customers. Many of the innovations addressed
the need for the railroads to compete with trucks. Intermodal traffic (trailers and containers moving on
railroad flatcars) became the fastest growing segment of railroad traffic as railroads found their niche in
this very competitive sector by leveraging lower line-haul costs. Ironically, trucking companies–
competitors with railroads–have become major railroad customers. Railroads have also entered the
logistics services arena to increase their ability to compete with trucks. For example, railroads have been
developing logistics parks that integrate rail, truck, and transload services with warehousing capabilities
to serve major markets.
United States policies that enabled freight railroads to create new services and lower costs have
resulted in the United States railroads dramatically improving their financial position. Net railway
operating income grew from $485 million in 1970 to $3.9 billion in 2000. Return on net investment
7
improved from 1.7 percent to 6.5 percent between 1970 and 2000, according to data from the Association
of American Railroads. From a social welfare perspective annual gains have been measured in billions of
dollars (Winston et al. 1990; Peltzman and Winston 2000).
The European Union. The European railroad system is profoundly influenced by the fact that it
developed as a set of national networks focused primarily on domestic rather than international traffic
(ECMT 2003; Meersman and Van de Voorde 2004). Thus, rail networks in countries such as France and
Spain mainly have corridors radiating from their capitals. Not only were country-centric networks
constructed, but little attention was paid to interoperability of equipment or crews. At borders,
locomotives and crews often must be changed because of different signal and electrification systems and
train crew licensing requirements as well as pressure from labor unions. Spain represents an extreme case
where the track gauge is different than its neighboring countries making interoperability an overwhelming
technical hurdle (Izquierdo and Vassallo 2004).
Most European railroads were nationalized after World War II, and their primary objective
continued to be the domestic movement of people and goods (Lewis, Semeijn and Vellenga 2001). In
most cases transporting people took priority over freight. This was seen in the allocation of track time
and in the investment in passenger rolling stock and infrastructure (ECMT 1998). The absence of market
incentives for innovation and rate freedom together with the continued improvements in truck, bus, auto
and air service, contributed to worsening financial performance (Cantos and Maudos 2001).
The creation of the European Economic Community in 1957 called the nationally focused
strategies into question since the benefits of a Common Market depended on cross-border trade. Road
operators made the transition to an “EU transportation mode” fairly quickly while the railroads lagged
(Commission of the European Communities 2001). But the resulting growth in highway traffic increased
traffic congestion and air pollution. Average traffic speeds have declined, an increasing portion of fuel is
consumed in traffic jams, and the cost of traffic delays has been estimated at two percent of GDP in
Europe (Ribbink 2005).
8
During the 1990s European Union policy makers responded to the shift to highway modes with a
series of directives designed to make rail more competitive. The key reform, set out in a 1991 EEC
Directive (number 91/440) was to require the national railroads to separate their train operations from the
management of track, stations and other infrastructure and to allow independent train operators to use the
infrastructure. The idea behind this directive was that while infrastructure was a natural monopoly, train
operations were not. Infrastructure would be managed as a regulated entity, providing equal access to all
train operators. The hope was that open access to the tracks would encourage new service offerings,
innovations and cost reductions (Rothengatter 1991). Separation of infrastructure from operations was
thought particularly important to promote pan-European traffic since independent train operators could, at
least in principle, provide seamless international through services.
The European Union allowed member countries wide latitude in deciding how to separate
infrastructure from train operations and, provided a generous timetable for achieving separation,
particularly for domestic services. However, certain obstacles, such as equipment compatibility and
interoperability, have proven more difficult than originally expected. There is considerable variation
among the member states in the progress they have made in separation and the means employed. Britain
is arguably furthest along in that infrastructure and operations are fully unbundled and the train
companies are all privately owned (Kain 1998; Dunn and Perl 2001; Helm 2001; Haubrich 2001).
Germany is close behind Britain while other countries are still in the first stages of applying the European
Union policy (Henry and Quinet 1999; Izquierdo and Vassallo 2004).
The European Union Ministers placed renewed emphasis on improving rail in their 2001 White
Paper on Transport. The paper outlines rail’s problems–lack of suitable infrastructure, constrained
interoperability, limited innovation, non-transparent costs and poor reliability. The document also
reiterates that open access to infrastructure is the key reform and establishes the objective of increasing
the rail’s share of the European freight market from 8 percent to 15 percent by the year 2020.
9
III. Data Sources
The primary source of data on rail shares in Europe is the Eurostat Transport Database. Eurostat
is the Statistical Office of the European Community and its mission is to gather and adjust data from the
different member statistics offices in order to provide consistent data to European institutions. European
Union freight traffic can be divided into three categories: (1) intra-country traffic (that originates and
terminates within a single EU country), (2) intra-EU traffic (that originates and terminates in different EU
countries) and (3) extra-EU traffic (that originates or terminates within the EU but is destined for or
originates outside the EU). The Eurostat database provides the most detailed data on intra-country traffic,
including freight volumes broken down by mode, commodity type, and distance traveled. The database
has less detailed information for intra-EU traffic; in particular, it gives rail and road tonnage by
commodity type but it does not specify the distances traveled, only the countries of origin and destination.
To estimate the intra-EU distances we used the average distance between the primary industrial centers of
the origin and destination countries. Eurostat provides only aggregated data on extra-EU rail
transportation, so this traffic segment, which is relatively small, is not included in the analysis.
The United States data on rail shares is drawn primarily from Rebbie Associates’ (now Global
Insight’s) Transearch Database, but is adjusted with information from the US Census of Transportation.
Transearch is widely used by carriers and governments for evaluating transportation issues because it
provides much more detailed data than the US Census. The Transearch database consists of an enormous
sample of individual shipments including mode, origin, destination, commodity, and tonnage. The origin-
destination information is used to estimate the distance for each shipment. One problem with the
Transearch data is that it is thought to oversample long distance truck shipments and undersample short
distance truck shipments compared to figures from the Census. Consequently, we distributed the
Transearch road tons by the Census mileage blocks to assure consistency with the official Census data.
A great deal of effort was required to ensure that the commodity classifications and distance
categories in the European and US data were consistent. Commodities are classified into seven
categories: agricultural products, coal/solid mineral fuels, petroleum products, iron ore/steel/metal
10
products, building products, chemical/fertilizer, and machinery/manufactured articles. The detailed
definitions of the categories are provided in Appendix A. Of note, the code 24 of NST/R “Miscellaneous
articles”, 46 of STTC “Miscellaneous mixed shipment”, and 40 of SCTG “Miscellaneous” include
manufactured articles that are shipped in containers.
The distance blocks adopted are conditioned by the information available. The Eurostat database
provides aggregated information in only 7 blocks: 0 – 50 km, 50 – 150 km, 150 – 500 km, 500 – 1,000
km, 1,000 – 2,000 km, 2,000 – 6,000 km, and more than 6,000 km. In order to compare the information,
the United States data are aggregated according to the European Union blocks.
IV. Inherent Differences and Their Effects on Rail Share
The starting point for assessing the rail share difference between the United States and the
European Union is to estimate the impact of the key inherent differences—competitive position of water
and pipeline modes, shipment distances, and commodity mix. The European freight volume across all
modes totaled 3,068 billion ton-kilometers in 2000. The United States rail share in that year was 38
percent. If the European railroads had captured the same share of freight traffic as the United States
railroads, they would have carried 1,165 billion ton-kilometers of freight, 974 billion ton-kilometers
greater than the 201 billion ton-kilometers1 the European railroads actually carried that year. The impact
of each inherent difference is explained below.
Water and Pipeline. As Table 1 shows, coastal and inland waterways carry 45 percent of all
freight in the European Union compared to 20 percent in the United States, a difference presumably due
in large part to Europe’s longer coastline. The importance of coastal and waterway shipping in Europe
probably also contributes to the fact that pipelines carry only 3 percent of freight in Europe compared to
12 percent in the United States. Many of the commodities that move by pipeline in the United States,
particularly petroleum and its byproducts, move by coastal and inland waterway shipping in Europe.
1 The EU railroads actually carried 240 billion ton-kilometers. 38 billion ton-kilometers were extra-EU shipments, which were excluded because of the data limitation described above.
11
Table 1: Freight Mode Share (Ton-kilometers in millions)
We interpret this 196 billion ton-kilometer shortfall as the likely consequence of different public
policies toward railroads and trucking in Europe and the United States. In other words, if Europe’s
relevant policies were the same as those in the United States’, European railroads might have carried
almost twice as much freight in 2000 as they actually did.
V. Possible Policy Explanations
This residual volume is assumed to reflect a combination of policies—some favor European
Union rail share and others serve to disadvantage rail’s competitive position. This section details the
policy differences that may have contributed to the differences in rail share. The discussion is at a macro-
level, more detailed analysis is required to understand the direct impact of each policy consideration. We
note that this section is somewhat speculative; however our objective is to provide a discussion of
relevant policies. One policy difference which is unlikely to impact the residual is the European Union's
requirement to separate infrastructure from operations and require open access. Our data on rail shares
are from 2000, when many European countries were just beginning to comply with the vertical
unbundling regulations, therefore, given our data set, such an analysis would be premature.
European Policies Favoring Rail Freight. In two respects, European transport policy favors
rail freight more than United States transport policy does, which makes the European rail traffic shortfall
17
somewhat surprising. First, road fuel prices are higher and road tolls more prevalent in the European
Union than in the United States. Diesel prices vary over time and by geography but generally fuel prices
in Europe are about twice that of the United States. With respect to road tolls, Table 5 shows that for
relevant European countries user fees are charged to use between 12 and 30 percent of their trunk
network. In contrast, only 1.3 percent of the United States interstate trunk highways are toll roads. Table
5 illustrates that toll fees per kilometer were comparable in the United States and the European Union.
Table 5: Road charges applied in some European Countries and in the United States in 2000
Country Charging mechanism Truck Fees
Kilometers in which the
charges are applied(*)
Percentage of the trunk network
Belgium Vignette 8.000 €/day 1,702 13.6 %
France Toll 0.196 €/km 7,840 27.9 %
Fee by Km 0.136 €/kmGermany
Vignette 8.000 €/day11,800 28.6 %
Italy Toll 0.100 €/km 5,563 12.1 %
Spain Toll 0.154 €/km 2,783 13.8 %
United States Toll 0.150 €/km 4,529 1.3 %
(*) US data in 2003
Second, Europe subsidizes its freight railroads more heavily than the United States although
precise comparisons are difficult. The principal subsidies in the United States are restricted to passenger
services2. United States freight railroads are not subsidized directly, and in fact pay substantial corporate
income taxes ($538 million in 2001) and property taxes to federal, state and local governments. The
European railroads receive substantial subsidies that support both passenger and freight operations. Table
6 shows that the vast majority of rail service subsidies support passenger services. However, more than
half of total railroad subsidies support infrastructure facilities, which are shared by both passengers and
freight.
2 The federal government spends approximately $1 billion per year to cover the deficit of Amtrak, and state and local governments spend a significant amount supporting commuter rail services.
18
Table 6: Public Budget Contributions to European Railroads (year 2001)
Form of payment EU-15 (million Euros)
Passenger Services 11,541
Freight Services 275
Infrastructure and Capital Investment 18,364
Others 8,126
Total 38,306
Source: NERA
European Policies Disadvantaging Rail Freight. European transport policies seem to
disadvantage rail freight in several ways, but probably the most important of these is the priority that is
given to passenger service. Rail carries 6.25 percent of all intercity passenger traffic in Europe compared
to 0.3 percent in the United States. (It is interesting to note that the improvement in rail position in the
United States coincides with the shedding of passenger services.) Freight and passenger services share 70
percent of railroad infrastructure in Europe and only 12 percent is exclusively devoted to freight
transportation. Track capacity is limited, thus, to the extent that it is used for passenger trains, it is
unavailable for rail freight. However, passenger operations are generally concentrated in the morning and
evening hours. There are thus many hours for freight operations; although, the scheduling task becomes
more complex.
A second way in which rail freight is probably disadvantaged in Europe is the lack of
interoperability at the borders and its consequent delays. The estimation of the policy impact includes the
effect of the borders since we applied the market share of the United States whose network, although built
by independent companies, was designed for interoperability; in strong contrast to the nationally focused
European Union railroads. Figure 5 shows the comparison of European Union international rail shares
along with United States rail share. As expected the United States share increased with distance. The
same was true for European international rail freight when shipment distances are lower than 1,000 km.
The evidence of a borders effect in Europe is that the international share declined in the distance blocks
19
above 1,000 kilometers (see Figure 5). The international transportation share in Europe in the shorter
mileage blocks does not seem to be much lower than in the United States. A possible explanation for this
result is that most of the short haul international transport in Europe takes place in central Europe, where
there are fewer interoperability problems.. Thus the borders effect may be higher in the more peripheral
countries such as Spain. The results of this analysis should be approached with caution, since the
international transportation by distance block was estimated on the basis of the origin-destination matrix
among the European Union countries. Nevertheless, Europe’s lower market share in long-distance blocks
seems to imply that policies facilitating cross-border movements of rail freight are likely to increase rail