BEEtag: A Low-Cost, Image-Based TrackingSystem for the Study of Animal Behavior andLocomotionJames D. Crall1*, Nick Gravish1,2, AndrewM. Mountcastle1, Stacey A. Combes1
1 Concord Field Station, Organismic and Evolutionary Biology, Harvard University, Bedford, Massachusetts,United States of America, 2 School of Engineering and Applied Sciences, Harvard University, Cambridge,Massachusetts, United States of America
AbstractA fundamental challenge common to studies of animal movement, behavior, and ecology is
the collection of high-quality datasets on spatial positions of animals as they change
through space and time. Recent innovations in tracking technology have allowed research-
ers to collect large and highly accurate datasets on animal spatiotemporal position while
vastly decreasing the time and cost of collecting such data. One technique that is of particu-
lar relevance to the study of behavioral ecology involves tracking visual tags that can be
uniquely identified in separate images or movie frames. These tags can be located within
images that are visually complex, making them particularly well suited for longitudinal stud-
ies of animal behavior and movement in naturalistic environments. While several software
packages have been developed that use computer vision to identify visual tags, these soft-
ware packages are either (a) not optimized for identification of single tags, which is gener-
ally of the most interest for biologists, or (b) suffer from licensing issues, and therefore their
use in the study of animal behavior has been limited. Here, we present BEEtag, an open-
source, image-based tracking system in Matlab that allows for unique identification of indi-
vidual animals or anatomical markers. The primary advantages of this system are that it (a)
independently identifies animals or marked points in each frame of a video, limiting error
propagation, (b) performs well in images with complex backgrounds, and (c) is low-cost. To
validate the use of this tracking system in animal behavior, we mark and track individual
bumblebees (Bombus impatiens) and recover individual patterns of space use and activity
within the nest. Finally, we discuss the advantages and limitations of this software package
and its application to the study of animal movement, behavior, and ecology.
IntroductionA fundamental challenge facing diverse fields of research is the accurate reconstruction of spa-tial position information over time. In biology, for example, fields such as biomechanics,
PLOSONE | DOI:10.1371/journal.pone.0136487 September 2, 2015 1 / 13
OPEN ACCESS
Citation: Crall JD, Gravish N, Mountcastle AM,Combes SA (2015) BEEtag: A Low-Cost, Image-Based Tracking System for the Study of AnimalBehavior and Locomotion. PLoS ONE 10(9):e0136487. doi:10.1371/journal.pone.0136487
Editor: Giorgio F Gilestro, Imperial College London,UNITED KINGDOM
Data Availability Statement: All relevant data arewithin the paper and its Supporting Information files.
Funding: This work was funded by an NSF GRFPfellowship to James Crall and an NSF CAREER grantto Stacey Combes (IOS-1253677). Nick Gravishwould like to acknowledge funding from the James S.McDonnell foundation.
Competing Interests: The authors have declaredthat no competing interests exist.
animal behavior, and ecology all depend heavily on reconstructing accurate spatiotemporaldata on either anatomical components (e.g. different joints) of animals or their entire bodies.Traditionally, such tracking has been done primarily through human observation or manualtracking of positional information. Studies of animal locomotion, for example, have ofteninvolved manual (although frequently computer-aided) tracking of anatomical features toreconstruct accurate movement kinematics [1,2]. On the other hand, studies of animal behav-ior and ecology have often involved marking animals with uniquely identifiable tags combinedwith manual observation [3].
While such data sets have been indispensable for advancing their respective fields, manualcollection of these data is time-intensive, laborious, and poorly-suited to generating large data-sets, particularly those that involve tracking either multiple individuals or body parts simulta-neously. In recent decades, advances in tracking technology have allowed researchers to collectlarge, highly accurate datasets in a fraction of the time taken by manual methods. For example,semi-automated marker tracking [4] or visual hull reconstruction [5] have allowed for the col-lection of highly accurate spatiotemporal datasets on animal locomotion. In ethology, auto-mated tracking techniques have allowed for the collection of vast, highly-accurate behavioraldatasets [6–8], which can be used, for example, in detailed quantitative analysis of animalbehavior [9,10].
A fundamental limit of many of the tracking methods described above, however, is the needfor a controlled, laboratory environment for high-quality tracking results, which for certainresearch questions can present a significant limitation. Partially for this reason, radio-frequencyidentification (RFID) technology, which does not require a controlled visual environment foridentification, has become particularly popular among behavioral ecologists for tracking andidentifying individuals in both vertebrate (see [11] for an excellent review of the use of this tech-nology in birds) and invertebrate [12,13] animals. While robust to limitations of the visual envi-ronment, however, the spatial information provided by RFID is limited, since spatial position isonly recorded when an animal is near an RFID reader, and the technology is therefore of limitedutility for addressing certain experimental questions.
Increasingly, automated image-based tracking has been used to explore basic questions inbehavior and ecology [8]. However, each tracking method has distinct strengths and limita-tions. One limitation that faces many image-based individual tracking methods is error propa-gation: since tracking is often based on using information from previous frames in a movie(e.g. spatial proximity of an animal from one frame to the next [4,14,15]), errors can be intro-duced when the paths of two animals cross. Such errors are generally irreversible and propagatethrough time, thus making it difficult or impossible to track individuals over long time periods.While computational advances can reduce [14] or nearly eliminate [7] this problem, these tech-niques still rely on controlled, homogenous visual environments for accurate tracking.
One method for avoiding such errors and allowing for long-term tracking of uniquely iden-tified points or individuals in complex visual environments is to use markers that can beuniquely identified by computer-vision in each picture or frame. Image-based recognition ofsuch markers has been widely used in commercial (e.g. barcodes and Quick-Response, or QRcodes) as well as in augmented reality (ARTag, [16]) and camera-calibration (CALTag, [17])applications. While such marker-systems have previously been used for high-throughputbehavioral studies in ants [10], previous software packages are either not optimized for recog-nizing isolated tags (as desired for most applications in animal movement), or suffer fromlicensing issues, making access to these techniques limited. Here, we present and characterizeBEEtag (BEhavioral Ecology tag), a new open-source software package in Matlab for trackinguniquely identifiable visual markers. First, we provide a basic description of the software andcharacterize its performance. Next, we validate the tracking system by marking and tracking
BEEtag: Low-Cost, Image-Based Tracking Software
PLOS ONE | DOI:10.1371/journal.pone.0136487 September 2, 2015 2 / 13
individual bumblebees (Bombus impatiens) within a nest. Finally, we consider the potentialextensions, future applications, and limitations of this tracking technique.
Tag Design and Tracking Software
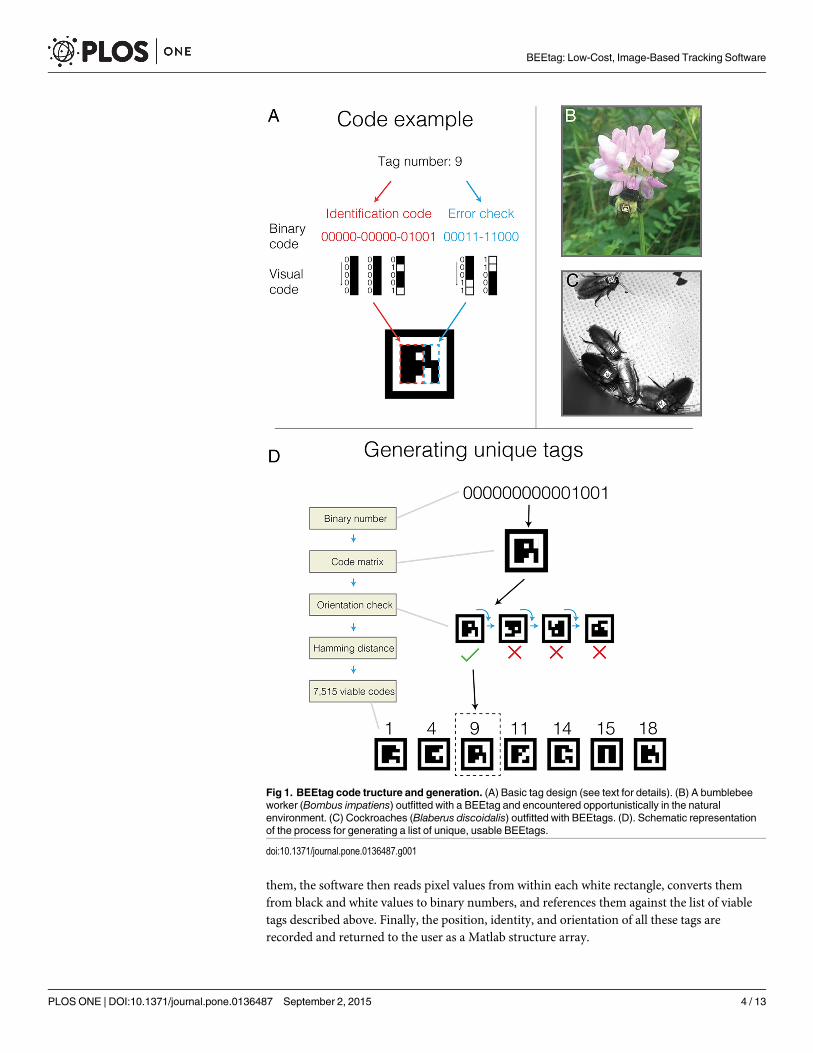
Tag designWe use a tag design that is inspired by similar markers for visual tracking such as ARtag [16]and CALTag [17]. Our tags consist of a 25 bit (5x5) code matrix of black and white pixels thatis unique to each tag surrounded by (1) a white pixel border and (2) a black pixel border (Fig1). The 25-bit matrix consists of a 15-bit identity code, and a 10-bit error check. The 15-bitidentity is the binary representation of a number between 1 and 32767, left-padded with zerosand reoriented into a 5x3 pixel matrix (Fig 1A). A unique 10-bit error check is then generatedfor each code. The first 3 bits of this error code are parity checks (1 (white) for odd and 0(black) for even) of each of the three columns of the 5x3 code matrix. The next two bits are gen-erated by checking the parity of the first 3 and last 2 columns of the 5x3 code matrix, respec-tively. This 5-bit error check is then repeated and reversed to give a complete 10-bit errorcheck (Fig 1). This simple binary image matrix can then be scaled to any size where it can bevisualized by a camera, for example small tags for use with bumblebees (Bombus impatiens, Fig1B, see below) or moderately larger tags for bigger invertebrates such as cockroaches (Blaberusdiscoidalis, Fig 1C, tags roughly 8 mm per side).
Generating a usable set of BEEtagsWhile a 15 bit encoding theoretically allows for 32,768 different possible code combinations,not all of these can be safely distinguished in practice when the orientation of the tag isunknown (as is the case in most tracking applications). We therefore restrict codes to be usedin tracking based on two additional criteria. First, a tag must be valid in only one orientation(i.e. the 10-bit error check matches the 15-bit code in only one of the four possible tag orienta-tions, Fig 1D). Second, any tag must have a Hamming distance of at least 3 (i.e. 3 bits are differ-ent) between itself and any valid tag (and its associated alternative orientations). Theserestrictions, which reduce the number of false positive tag identifications from an image, resultin a set of 7,515 viable tags out of the 32,767 possibilities (Fig 1D). Since many users will notrequire the use of over 7,000 unique codes, we have also generated a set of 110 unique tags witha Hamming distance of at least 7, available with the BEEtag software package as “robustCode-List.mat.”
Identifying BEEtags from an image or video frameUsing this technique, each tag can be uniquely identified in a still image or movie frame with-out prior knowledge of its position. The raw input for tracking is an image, in color or gray-scale format. If tracking tags in a movie, each frame is extracted and analyzed as a separateimage. If the frame or still image is in color, it is first converted to grayscale before furtherprocessing.
From the grayscale image, the first step is to threshold into a black and white image (Fig 2).In brief, this thresholding step works by converting the matrix of continuous pixel intensityvalues of an image (i.e. a grayscale image) into a binary matrix using a specified thresholdvalue. This results in a binary (i.e. black and white) image, where zeros are represented by blackand ones are represented by white. After converting to a binary image, the software finds allunique regions of white in the image and checks to see which are rectangular, and all of theseregions are considered possible tags (Fig 1C). To verify which regions are true tags and identify
BEEtag: Low-Cost, Image-Based Tracking Software
PLOS ONE | DOI:10.1371/journal.pone.0136487 September 2, 2015 3 / 13
them, the software then reads pixel values from within each white rectangle, converts themfrom black and white values to binary numbers, and references them against the list of viabletags described above. Finally, the position, identity, and orientation of all these tags arerecorded and returned to the user as a Matlab structure array.
Fig 1. BEEtag code tructure and generation. (A) Basic tag design (see text for details). (B) A bumblebeeworker (Bombus impatiens) outfitted with a BEEtag and encountered opportunistically in the naturalenvironment. (C) Cockroaches (Blaberus discoidalis) outfitted with BEEtags. (D). Schematic representationof the process for generating a list of unique, usable BEEtags.
doi:10.1371/journal.pone.0136487.g001
BEEtag: Low-Cost, Image-Based Tracking Software
PLOS ONE | DOI:10.1371/journal.pone.0136487 September 2, 2015 4 / 13
Software performanceTo test the basic performance of the BEEtag software, we took a video of 12 printed tags withthe built-in camera of an iPhone 5 from a constantly moving perspective (Fig 2A, S1 Movie, S1Dataset). We identified codes in each frame while independently varying image resolution,
Fig 2. Schematic representation of the algorithm for identify unique BEEtags from an image.Green circles show identified corners of the whitequadrangle, and red dots show points where separate pixel values were measured. See text for details.
doi:10.1371/journal.pone.0136487.g002
BEEtag: Low-Cost, Image-Based Tracking Software
PLOS ONE | DOI:10.1371/journal.pone.0136487 September 2, 2015 5 / 13
noise level, and black-white threshold levels to examine the effects of these parameters ontracking performance.
In general, tracking performance is strongly affected by all three of these parameters. Reso-lution was artificially modified using the “imresize” function in Matlab to a range of image res-olutions. The average area (in pixels) of the 12 tags in the image was then calculated and thesquare root of this value taken to estimate the functional resolution of each tag, expressed asthe mean length of each tag side (measured as the distance between 2 adjacent corners of thewhite rectangle containing the tag, Fig 3B). The portion of tags correctly tracked across 255frames from this sample video dropped dramatically below a resolution of around 25 pixels pertag edge (Fig 3B).
We explored the extent to which noise impairs tracking performance (Fig 3C) by introduc-ing Gaussian noise to each of 100 frames from the sample video using the “imnoise” functionin Matlab. This function allowed us to apply Gaussian noise with varying levels of intensity(normalized to an image intensity of 0 to 1) to a full resolution image (i.e. around 38 pixelsper tag edge). As expected, increased noise progressively impaired tracking performance, untilvalues of around 0.05 (i.e. variance of 5% of the intensity range) when very few tags were suc-cessfully tracked (Fig 2C). Noise impairs tracking by both reducing the efficiency of quadranttracking and increasing noise within the tag itself. In real applications, noise (i.e. “graininess”)
Fig 3. BEEtag tracking performance. Performance of the BEEtag tracking system in a sample video (A) in response to variation in resolution (B), gaussiannoise (C), and binary threshold value (D). See text for details. Transparent blue lines show data from a single video frame (N = 277 in B and N = 100 in C-D),and thickened red lines show the mean across all frames.
doi:10.1371/journal.pone.0136487.g003
BEEtag: Low-Cost, Image-Based Tracking Software
PLOS ONE | DOI:10.1371/journal.pone.0136487 September 2, 2015 6 / 13
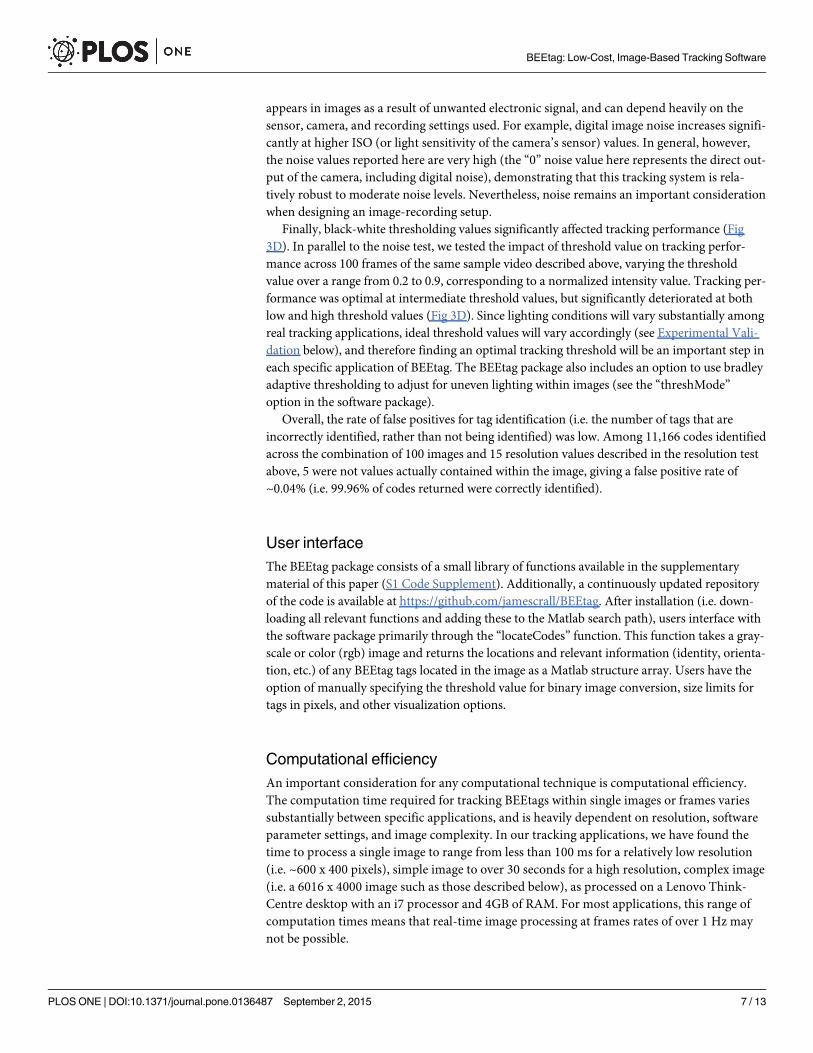
appears in images as a result of unwanted electronic signal, and can depend heavily on thesensor, camera, and recording settings used. For example, digital image noise increases signifi-cantly at higher ISO (or light sensitivity of the camera’s sensor) values. In general, however,the noise values reported here are very high (the “0” noise value here represents the direct out-put of the camera, including digital noise), demonstrating that this tracking system is rela-tively robust to moderate noise levels. Nevertheless, noise remains an important considerationwhen designing an image-recording setup.
Finally, black-white thresholding values significantly affected tracking performance (Fig3D). In parallel to the noise test, we tested the impact of threshold value on tracking perfor-mance across 100 frames of the same sample video described above, varying the thresholdvalue over a range from 0.2 to 0.9, corresponding to a normalized intensity value. Tracking per-formance was optimal at intermediate threshold values, but significantly deteriorated at bothlow and high threshold values (Fig 3D). Since lighting conditions will vary substantially amongreal tracking applications, ideal threshold values will vary accordingly (see Experimental Vali-dation below), and therefore finding an optimal tracking threshold will be an important step ineach specific application of BEEtag. The BEEtag package also includes an option to use bradleyadaptive thresholding to adjust for uneven lighting within images (see the “threshMode”option in the software package).
Overall, the rate of false positives for tag identification (i.e. the number of tags that areincorrectly identified, rather than not being identified) was low. Among 11,166 codes identifiedacross the combination of 100 images and 15 resolution values described in the resolution testabove, 5 were not values actually contained within the image, giving a false positive rate of~0.04% (i.e. 99.96% of codes returned were correctly identified).
User interfaceThe BEEtag package consists of a small library of functions available in the supplementarymaterial of this paper (S1 Code Supplement). Additionally, a continuously updated repositoryof the code is available at https://github.com/jamescrall/BEEtag. After installation (i.e. down-loading all relevant functions and adding these to the Matlab search path), users interface withthe software package primarily through the “locateCodes” function. This function takes a gray-scale or color (rgb) image and returns the locations and relevant information (identity, orienta-tion, etc.) of any BEEtag tags located in the image as a Matlab structure array. Users have theoption of manually specifying the threshold value for binary image conversion, size limits fortags in pixels, and other visualization options.
Computational efficiencyAn important consideration for any computational technique is computational efficiency.The computation time required for tracking BEEtags within single images or frames variessubstantially between specific applications, and is heavily dependent on resolution, softwareparameter settings, and image complexity. In our tracking applications, we have found thetime to process a single image to range from less than 100 ms for a relatively low resolution(i.e. ~600 x 400 pixels), simple image to over 30 seconds for a high resolution, complex image(i.e. a 6016 x 4000 image such as those described below), as processed on a Lenovo Think-Centre desktop with an i7 processor and 4GB of RAM. For most applications, this range ofcomputation times means that real-time image processing at frames rates of over 1 Hz maynot be possible.
BEEtag: Low-Cost, Image-Based Tracking Software
PLOS ONE | DOI:10.1371/journal.pone.0136487 September 2, 2015 7 / 13
Experimental Validation: Spatial Behavior Patterns in a BumblebeeColony
Study species and tag attachmentTo validate the BEEtag tracking system, we outfitted individual bumblebees (Bombus impa-tiens) with unique BEEtags to track spatial movement of multiple individuals simultaneouslywithin the nest. A single colony (Biobest) was maintained indoors but with access to the naturalenvironment through a plastic tube, which allowed the bees to enter and exit the nest at will toforage for nectar and pollen. The colony was initially placed on July 9th, 2014 and given sevendays to acclimate and begin normal foraging activity. On July 16th, we outfitted roughly 100workers with unique BEEtags. All BEEtags used were printed on a single 8.5 x 11”sheet ofwaterproof, tear-resistant paper on a high-resolution (1200 dpi) laserjet printer at Staples. Eachtag was cut out from the sheet by hand, measured roughly 2.1mm x 2.1 mm, and weighedaround 1.83 mg. All bees except the queen were removed from the nest at the same time usinga vacuum aspirator (Bioquip Products) and maintained for 30–60 min at 4°C to reduce activitylevel. Bees were then individually cold-anaesthetized at -20°C and outfitted with a unique tagattached with cyanoacrylate gel glue. After tagging, all bees were then returned to the nest andallowed to acclimate for 24 hours before data collection, which occurred on July 17th, 2014
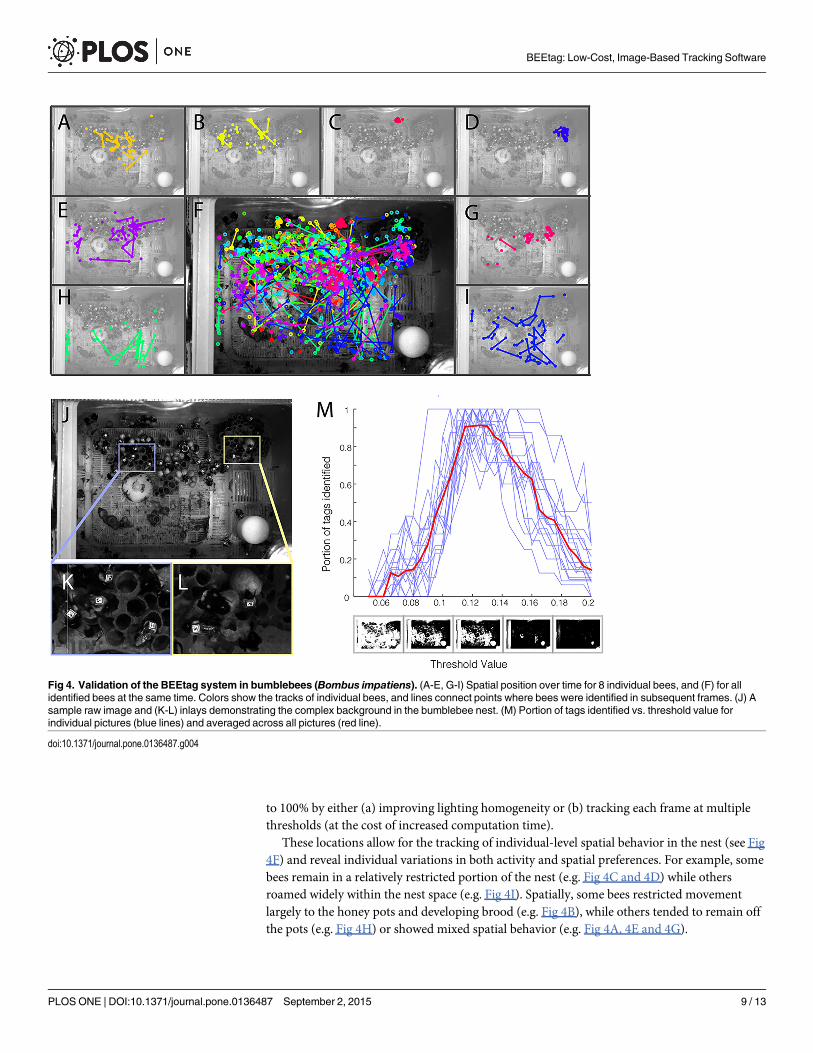
Imaging setup and data collectionTo capture images of sufficiently high resolution to track individual tags over the entire nestarea (roughly 21.5 x 15.0 cm), we used an entry-level DSLR camera (Nikon D3200), operatingat the maximum resolution of 6016 x 4000 pixels per image. The nest box was outfitted with aclear plexiglass top prior to data collection and illuminated by three red lights, to which beeshave poor sensitivity [18]. The camera was placed ~ 1 m above the nest top and triggered auto-matically with a mechanical lever driven by an Arduino microcontroller. On July 17th, pictureswere taken every 5 seconds between 12:00 pm and 12:30 pm, for a total of 372 photos. 20 ofthese photos were analyzed with 30 different threshold values to find the optimal threshold fortracking BEEtags (Fig 4M), which was then used to track the position of individual tags in eachof the 372 frames (S1 Dataset).
Results and tracking performanceOverall, 3516 locations of 74 different tags were returned at the optimal threshold. In theabsence of a feasible system for verification against human tracking, false positive rate can beestimated using the known range of valid tags in the pictures. Identified tags outside of thisknown range are clearly false positives. Of 3516 identified tags in 372 frames, one tag (identi-fied once) fell out of this range and was thus a clear false positive. Since this estimate does notregister false positives falling within the range of known tags, however, this number of falsepositives was then scaled proportionally to the number of tags falling outside the valid range,resulting in an overall correct identification rate of 99.97%, or a false positive rate of 0.03%.
Data from across 30 threshold values described above were used to estimate the number ofrecoverable tags in each frame (i.e. the total number of tags identified across all threshold val-ues) estimated at a given threshold value. The optimal tracking threshold returned an averageof around 90% of the recoverable tags in each frame (Fig 4M). Since the resolution of these tags(~33 pixels per edge) was above the obvious size threshold for optimal tracking (Fig 3B),untracked tags most likely result from heterogeneous lighting environment. In applicationswhere it is important to track each tag in each frame, this tracking rate could be pushed closer
BEEtag: Low-Cost, Image-Based Tracking Software
PLOS ONE | DOI:10.1371/journal.pone.0136487 September 2, 2015 8 / 13
to 100% by either (a) improving lighting homogeneity or (b) tracking each frame at multiplethresholds (at the cost of increased computation time).
These locations allow for the tracking of individual-level spatial behavior in the nest (see Fig4F) and reveal individual variations in both activity and spatial preferences. For example, somebees remain in a relatively restricted portion of the nest (e.g. Fig 4C and 4D) while othersroamed widely within the nest space (e.g. Fig 4I). Spatially, some bees restricted movementlargely to the honey pots and developing brood (e.g. Fig 4B), while others tended to remain offthe pots (e.g. Fig 4H) or showed mixed spatial behavior (e.g. Fig 4A, 4E and 4G).
Fig 4. Validation of the BEEtag system in bumblebees (Bombus impatiens). (A-E, G-I) Spatial position over time for 8 individual bees, and (F) for allidentified bees at the same time. Colors show the tracks of individual bees, and lines connect points where bees were identified in subsequent frames. (J) Asample raw image and (K-L) inlays demonstrating the complex background in the bumblebee nest. (M) Portion of tags identified vs. threshold value forindividual pictures (blue lines) and averaged across all pictures (red line).
doi:10.1371/journal.pone.0136487.g004
BEEtag: Low-Cost, Image-Based Tracking Software
PLOS ONE | DOI:10.1371/journal.pone.0136487 September 2, 2015 9 / 13
DiscussionHere, we have presented a new open-source software package—BEEtag—for tracking uniquevisual markers and demonstrated its utility for studies of animal behavior. This package buildsdirectly off previous work aimed at tracking individually identifiable markers [16,17] andextends previous efforts by providing a simple interface in Matlab that is intended to improveease of use for researchers in behavioral ecology and other branches of the life sciences.
Tracking systems that utilize uniquely identifiable markers such as BEEtag (or ARTag andCALTag) have some fundamental advantages over other techniques. One primary advantage isthat tags are identified independently in each photo or frame, so errors don’t propagate acrossframes. For example, in most automated tracking systems (e.g. [4,14,15], with notable excep-tions such as [7]), individual tracking depends on information from previous frames, andtherefore when an individual is either (a) not tracked or (b) incorrectly tracked in one or a fewframes (i.e. because the individual is occluded from view or interacts with another individual),tracking fails [7]. While acceptable for short-term data-collection, longer-term longitudinaldata sets (as are often particularly relevant for behavioral ecology) are difficult or impossible tocollect with such techniques.
Another important advantage of this tracking system is that it does not require a homoge-nous background, as do many optical tracking systems [7,14,15]. While it is possible in a con-trolled laboratory setting to create a homogenous background for automated detection ofimage regions associated with an animal’s body, this is difficult or impossible in most naturalis-tic contexts [8]. BEEtags, on the other hand, are robust to complexity in the background image(see Fig 1B and Fig 4J–4L [although not necessarily lighting heterogeneity, Fig 4M, see discus-sion above]). For example, the sample image used in Fig 2 of a bumblebee worker with a BEE-tag was taken opportunistically with an iPhone 5 against a natural background when the beewas encountered foraging outside of the nest, and emphasizes the robustness of this trackingsystem in natural environments.
Another important advantage of the BEEtag system is its cost. The examples included hereused either an iPhone 5, or a commercially available Nikon DSLR camera (currently availablefor ~$500 USD), and tags were printed on waterproof, tear-resistant paper at a cost of $0.87USD for 600 tags (approximately 0.145 cents each). This system thus makes the collection ofhigh-quality, high-throughput behavioral datasets possible at an extremely low cost comparedto alternative systems.
Like all other tracking systems, however, BEEtag has limitations that make it better suited tocertain applications than others. First, the system requires the application of a tag. Handling[19] and tag application [20] can significantly affect stress levels [21] and behavior in animals[22]. While BEEtags are lightweight (depending on size and printing material), the potentialbiomechanical and behavioral effects of both tag attachment [23] and handling need to be care-fully considered for each study organism and specific application.
Another important factor when considering the use of BEEtag for specific applications iscomputational intensity. As discussed above, computational time varies substantially depend-ing on image resolution, complexity, and tracking settings, but is generally slower than neces-sary for real-time image processing applications. While it is still possible to use BEEtag onlarge, high frame-rate videos, such videos will generally need to be captured and analyzed atdifferent times. For example, the tracking example presented above represents a small portionof a larger dataset consisting of over 80,000 images (data not shown). These images were cap-tured over the course of several weeks and analyzed separately using a parallel supercomputer.
Since BEEtag depends on visual information, performance also can be substantially affectedby (a) uneven lighting (see above and Fig 4M), (b) animal posture, and (c) tag cleanliness.
BEEtag: Low-Cost, Image-Based Tracking Software
PLOS ONE | DOI:10.1371/journal.pone.0136487 September 2, 2015 10 / 13
While issues of uneven lighting can be computationally overcome by either identifying codes atmultiple threshold values, applying an appropriate high-pass spatial filter to images, or usingadaptive thresholding (a user-specified option in BEEtag), the other limitations are more fun-damental and mean that BEEtag tracking performance will be impaired in situations wheretags are not visible (i.e. when animals are piled on top of each other) or cannot be kept clean(potentially an important consideration for freely behaving animals in natural environments).
Another important limitation when considering the utility of BEEtag for specific applica-tions are the challenges of data storage and processing, which can be significant for any imageprocessing techniques when compared to alternative tracking techniques such as RFID [12].While performing processing in real time can minimize data storage problems, this is not pos-sible in all applications. In particular, large images such as those used in the validation experi-ment described above (Fig 4) can be computationally intensive, and therefore impractical forreal-time processing.
Alternative application and future directionsWhile we have focused here on using BEEtags for tracking the overall spatial position of individ-uals, the utility of this tracking system is not limited to ethology or behavioral ecology. One suchpotential direction that seems particularly promising is use in the field of animal locomotion.Focus in the study of animal locomotion has increasingly shifted from steady-state locomotionin laboratory environments to dynamic movement in complex, naturalistic environments [24–26], where tracking is particularly challenging [8]. Since having tags obscured for some or manyframes is not highly problematic for BEEtag, we suggest that this tagging system could be of par-ticular utility for tracking the kinematics of animal locomotion through cluttered environments,where they are likely to be temporarily obscured. Additionally, in applications where multiplerigid points are tracked in order to, for example, reconstruct three-dimensional body rotations[27], these points could be automatically extracted from a properly oriented BEEtag, therebynegating the need for manual or semi-automated digitizing [4].
The BEEtag package will be maintained regularly on the GitHub site, which allows for usercontributions, and it is our hope that as use of this software increases, users will contribute im-provements, modifications, and extensions that will enhance both performance and ease of use tothe current implementation of BEEtag, as well as extending this technology to new applications.
Supporting InformationS1 Code Supplement. BEEtag tracking software. Functions and dependencies associated withthe BEEtag tracking software for Matlab.(ZIP)
S1 Dataset. Data from BEEtag tracking examples.(MAT)
S1 Movie. BEEtag tracking example. Visualization of tracking results of 12 unique BEEtags ina movie taken with an iPhone 5. Inlay shows binary thresholded image used for code identifica-tion.(MOV)
AcknowledgmentsWe are grateful to Benjamin de Bivort, Dominic Akandwanaho, Sawyer Hescock, and AndreSouffrant for help in debugging tracking software and placement of BEEtags on cockroaches.
BEEtag: Low-Cost, Image-Based Tracking Software
PLOS ONE | DOI:10.1371/journal.pone.0136487 September 2, 2015 11 / 13
This work was funded by an NSF GRFP fellowship to James Crall and an NSF CAREER grantto Stacey Combes (IOS-1253677). Nick Gravish would like to acknowledge funding from theJames S. McDonnell foundation.
Author ContributionsConceived and designed the experiments: JDC NG AMM SAC. Performed the experiments:JDC NG AMM. Analyzed the data: JDC. Contributed reagents/materials/analysis tools: JDCNG AMM SAC. Wrote the paper: JDC NG AMM SAC.
References1. Wakeling JM, Ellington CP. Dragonfly flight. I. Gliding flight and steady-state aerodynamic forces. J Exp
Biol. 1997; 200: 543–556. PMID: 9318238
2. Dudley R, Ellington CP. Mechanics of forward flight in bumblebees: I. Kinematics and morphology.Journal of Experimental Biology 1990; 148: 19–52.
3. Seeley TD, Camazine S, Sneyd J. Collective decision-making in honey bees: how colonies chooseamong nectar sources. Behav Ecol Sociobiol 1991; 28: 277–290.
4. Hedrick TL. Software techniques for two- and three-dimensional kinematic measurements of biologicaland biomimetic systems. Bioinspir Biomim. 2008; 3: 034001. doi: 10.1088/1748-3182/3/3/034001PMID: 18591738
5. Ristroph L, Berman GJ, Bergou AJ, Wang ZJ, Cohen I. Automated hull reconstruction motion tracking(HRMT) applied to sideways maneuvers of free-flying insects. J Exp Biol. 2009; 212: 1324–1335. doi:10.1242/jeb.025502 PMID: 19376953
6. Kain J, Stokes C, Gaudry Q, Song X, Foley J, Wilson R, et al. Leg-tracking and automated behaviouralclassification in Drosophila. Nat Comms. 2013; 4: 1910. doi: 10.1038/ncomms2908
7. Pérez-Escudero A, Vicente-Page J, Hinz RC, Arganda S, de Polavieja GG. idTracker: tracking individu-als in a group by automatic identification of unmarked animals. Nat Meth. 2014; 11: 743–748. doi: 10.1038/nmeth.2994
8. Dell AI, Bender JA, Branson K, Couzin ID, de Polavieja GG, Noldus LPJJ, et al. Automated image-based tracking and its application in ecology. Trends in Ecology & Evolution 2014; 29: 417–428. doi:10.1016/j.tree.2014.05.004
9. Berman GJ, Choi DM, Bialek W, Shaevitz JW. Mapping the stereotyped behaviour of freely moving fruitflies. Journal of The Royal Society Interface. 2014; 11: 20140672–20140672.
10. Mersch DP, Crespi A, Keller L. Tracking individuals shows spatial fidelity is a key regulator of ant socialorganization. Science 2013; 340: 1090–1093. PMID: 23599264
11. Bonter DN, Bridge ES. Applications of radio frequency identification (RFID) in ornithological research: areview. Journal of Field Ornithology. 2011; 82: 1–10.
12. Henry M, Beguin M, Requier F, Rollin O, Odoux JF, Aupinel P, et al. A Common Pesticide DecreasesForaging Success and Survival in Honey Bees. Science. 2012; 336: 348–350. doi: 10.1126/science.1215039 PMID: 22461498
13. Stelzer RJ, Chittka L. Bumblebee foraging rhythms under the midnight sun measured with radiofre-quency identification. BMC Biol 2010; 8: 93. doi: 10.1186/1741-7007-8-93 PMID: 20587015
14. Branson K, Robie AA, Bender J, Pietro Perona, Dickinson MH. High-throughput ethomics in largegroups of Drosophila. Nat Meth 2009; 6: 451–457. doi: 10.1038/nmeth.1328
15. de Chaumont F, Coura RD- S, Serreau P, Cressant A, Chabout J, Granon S, et al. Computerized videoanalysis of social interactions in mice. Nat Meth. 2012; 9: 410–417. doi: 10.1038/nmeth.1924
16. Fiala M. ARTag, a fiducial marker system using digital techniques. IEEE; 2005; 2: 590–596.
17. Atcheson B, Heide F, Heidrich W. CALTag: High Precision Fiducial Markers for Camera Calibration.Citeseer; 2010; 10: 41–48.
18. Briscoe AD, Chittka L. The evolution of color vision in insects. Annu Rev Entomol. Annual Reviews4139 El CaminoWay, PO Box 10139, Palo Alto, CA 94303–0139, USA; 2001; 46: 471–510. PMID:11112177
19. Pankiw T, Page RE. Effect of pheromones, hormones, and handling on sucrose response thresholds ofhoney bees (Apis mellifera L.). J Comp Physiol A. 2003; 189: 675–684.
20. Dennis RL, Newberry RC, Cheng HW, Estevez I. Appearance Matters: Artificial Marking Alters Aggres-sion and Stress. Poultry Science. 2008; 87: 1939–1946. doi: 10.3382/ps.2007-00311 PMID: 18809854
BEEtag: Low-Cost, Image-Based Tracking Software
PLOS ONE | DOI:10.1371/journal.pone.0136487 September 2, 2015 12 / 13
21. Sockman KW, Schwabl H. Plasma Corticosterone in Nestling American Kestrels: Effects of Age, Han-dling Stress, Yolk Androgens, and Body Condition. General and Comparative Endocrinology. 2001;122: 205–212. doi: 10.1006/gcen.2001.7626 PMID: 11316426
22. Ropert-Coudert Y, Wilson RP. Trends and perspectives in animal-attached remote sensing. Frontiersin Ecology and the Environment. Eco Soc America; 2005; 3: 437–444.
23. Aldridge H, Brigham RM. Load carrying and maneuverability in an insectivorous bat: a test of the5%”rule” of radio-telemetry. Journal of Mammalogy 1988;: 379–382.
24. Dickinson MH, Farley CT, Full RJ, Koehl M, Kram R, Lehman S. How animals move: an integrativeview. Science. American Association for the Advancement of Science; 2000; 288: 100–106.
25. Combes SA, Rundle DE, Iwasaki JM, Crall JD. Linking biomechanics and ecology through predator-prey interactions: flight performance of dragonflies and their prey. Journal of Experimental Biology.2012; 215: 903–913. doi: 10.1242/jeb.059394 PMID: 22357584
26. Daley MA, Biewener AA. Running over rough terrain reveals limb control for intrinsic stability. Proc NatlAcad Sci USA. 2006; 103: 15681–15686. doi: 10.1073/pnas.0601473103 PMID: 17032779
27. Ravi S, Crall J, Fisher A, Combes S. Rolling with the flow: Bumblebees flying in unsteady wakes. J ExpBiol. 2013; 216: 4299–4309. doi: 10.1242/jeb.090845 PMID: 24031057
BEEtag: Low-Cost, Image-Based Tracking Software
PLOS ONE | DOI:10.1371/journal.pone.0136487 September 2, 2015 13 / 13