United States Renal Data System National Institutes of Health National Institute of Diabetes and Digestive and Kidney Diseases Division of Kidney, Urologic, and Hematologic Diseases Researcher’s Guide to the USRDS Database eeeee 2010 ADR Edition
Transcript
United StatesRenal Data SystemNational Institutes of Health National Institute of Diabetes
and Digestive and Kidney DiseasesDivision of Kidney, Urologic,
and Hematologic Diseases
Researcher’s Guide to the USRDS Database
eeeee2010 ADR Edition
2 Introduction
PREFACEThe Researcher’s Guide is intended for investigators within and outside of the USRDS Coordinating Center who wish to undertake research projects using data from the USRDS database. The Guide places particular emphasis on the USRDS Standard Analysis Files (SAFs), the primary means by which USRDS data are available for use. The Researcher’s Guide includes the information needed to select and use the appropriate SAFs for the intended project.
ACKNOWLEDGEMENTSMost original data for the USRDS are provided by the Centers for Medicare & Medicaid Services through the interagency agreement between the NIDDK/DKUHD of the National Institutes of Health, and the Bureau of Data Management and Strategy of the Centers for Medicare & Medicaid Services. The United States Renal Data System offers its grateful apprecia-tion to everyone who contributed to the USRDS database and this guide, especially all the ESRD professionals and Networks on whose reporting of data this enterprise ultimately rests.
Allan J. Collins, MD, FACPDirector, USRDS Coordinating Center University of Minnesota, Hennepin County Medical Center
Robert N. Foley, MBDeputy Director, USRDS Coordinating CenterUniversity of Minnesota, Hennepin County Medical Center
Lawrence Y. C. Agodoa, MDCo-Project Officer, USRDSDirector, End-stage Renal Disease Program, DKUHD
Paul W. Eggers, PhDCo-project Officer, USRDSProgram Director, Kidney and Urology Epidemiology,NIDDK
Cheryl Arko, BASenior Systems Analyst/Programmer
Nan Booth, MSW, MPHEditor
Shu-Cheng Chen, MSDirector of Information Systems
Edward Constantini, MASenior Editor
Frederick Dalleska, MSSenior Systems Analyst/Programmer
James Ebben, BSManager, Data Systems
Susan Everson, PhDSenior Editor
Beth Forrest, BBAData Systems Coordinator
Eric Frazier, BSSystems Analyst/Programmer
David Gilbertson, PhDDirector of Analytical Services
SUGGESTED CITATIONThe suggested citation for this report is as follows:U.S. Renal Data System, USRDS 2010 Annual Data Report: Atlas of Chronic Kidney Disease and End-Stage Renal Disease in the United States, National Institutes of Health, National Institute of Diabetes and Digestive and Kidney Diseases, Bethesda, MD, 2010.
Publications based upon USRDS data reported here or supplied upon request must include this citation and the following notice: • The data reported here have been supplied by the United
States Renal Data System (USRDS). The interpretation and reporting of these data are the responsibility of the author(s) and in no way should be seen as an official policy or interpretation of the U.S. government.
32010 USRDS Researcher’s Guide
CONTENTS 4 Introduction 7 Getting Started 18 Section 1 · ESRD Data Sources and the USRDS Database System 21 Section 2 · ESRD Patients 22 Section 3 · Treatment History 25 Section 4 · Payer History 26 Section 5 · Transplant Process and Outcomes 28 Section 6 · Morbidity and Hospitalization 30 Section 7 · Survival and Mortality 31 Section 8 · Providers 32 Section 9 · Disease-Based Cohort 33 Section 10 · Comprehensive Dialysis Study
APPENDICES 35 A: USRDS Products and Services 45 B: Medicare Claims 53 C: Statistical Methods 57 D: Data File Descriptions 236 E: Data Formatting 406 F: Data Forms 410 G: Glossary
4 Introduction
INTRODUCTIONThis Researcher’s Guide to the USRDS Database is designed to assist those interested in using USRDS data to perform their own analyses. The following material is addressed: • Getting Started. Examples of datasets and steps to help
start constructing analyses.• Section 1 ESRD Data Sources and the Database System.
General descriptions of data available to the USRDS and the processes involved in their creation.
• Section 2 ESRD Patients. Methods used to define ESRD patients.
• Section 3 Treatment History. Methods used to create a treatment history for each patient.
• Section 4 Payer History. Methods for analyzing insurance payer information.
• Section 5 Transplant Process and Outcomes. Methods for analyzing transplant patient data.
• Section 6 Morbidity and Hospitalization. Methods for analyzing morbidity and hospitalization data.
• Section 7 Survival and Mortality. Methods for analyzing survival and mortality data.
• Section 8 Providers. Description of the Facility database, which contains data on US dialysis facilities.
• Section 9 Disease-Based Cohort. Description of the DM/CKD/CHF cohort finder files by year, using the 5% General Medicare Claims data and ESRD patient demographic information.
The appendices include:• Data products and descriptions.• Detailed discussion of the Medicare Claims.• Statistical methods used by the USRDS.• Data files available to researchers, with data dictionaries. • Data formatting information.• Lists of data forms available at www.usrds.org: CMS,
UNOS, and CDC ESRD data forms; Special Study ESRD data forms; DMMS Waves I, II, III, IV, and FACS study forms.
• A glossary.
HISTORY OF THE USRDSThe first USRDS contract was awarded in 1988 to the Urban Institute in Washington, DC, which worked in conjunction with investigatorss at the University of Michigan at Ann Ar-bor. Under a new contract created in 1999, the USRDS was divided into a Coordinating Center (CC) and four Special Studies Centers (SSCs), each of which continues to operate under the direction of the National Institute of Diabetes and Digestive and Kidney Diseases (NIDDK) at the National Institutes of Health (NIH).
The CC and Cardiovascular SSC contracts were awarded in 1999 to the Minneapolis Medical Research Foundation, and are directed by Allan Collins MD and Charles Herzog MD, respectively. The Economic SSC was awarded to the Univer-sity of Iowa under the direction of Lawrence Hunsicker MD. In 2000, the Nutrition SSC was awarded to the University of California at San Francisco, directed by Glenn Chertow MD, and the Rehabilitation SSC to Emory University, directed by Nancy Kutner PhD.
In early 2007, the CC and the SSCs entered a new seven-year contract period. The Cardiovascular, Nutrition, and Quality of Life/Rehabilitation SSCs remain as before, and the activities of the Economic SSC are included with those of the CC.
USRDS WEBSITE: WWW.USRDS.ORGThe USRDS website provides users with access to PDF
files of the printed Annual Data Report (ADR), Excel files of the Reference Tables and the data underlying the graphs and state maps, and PowerPoint slides of USRDS presentations and ADR figures. Because of the size and complexity of the ADR files, downloading time for large portions of the book may be substantial.
RENDERThe USRDS Renal Data Extraction and Referencing (Ren-DER) System is an online data querying application accessible through the USRDS website, allowing access to a wealth of information regarding ESRD in the United States. It quickly returns an accurate table of data or an interactive map based on the user’s query specifications. Tables can be copied into
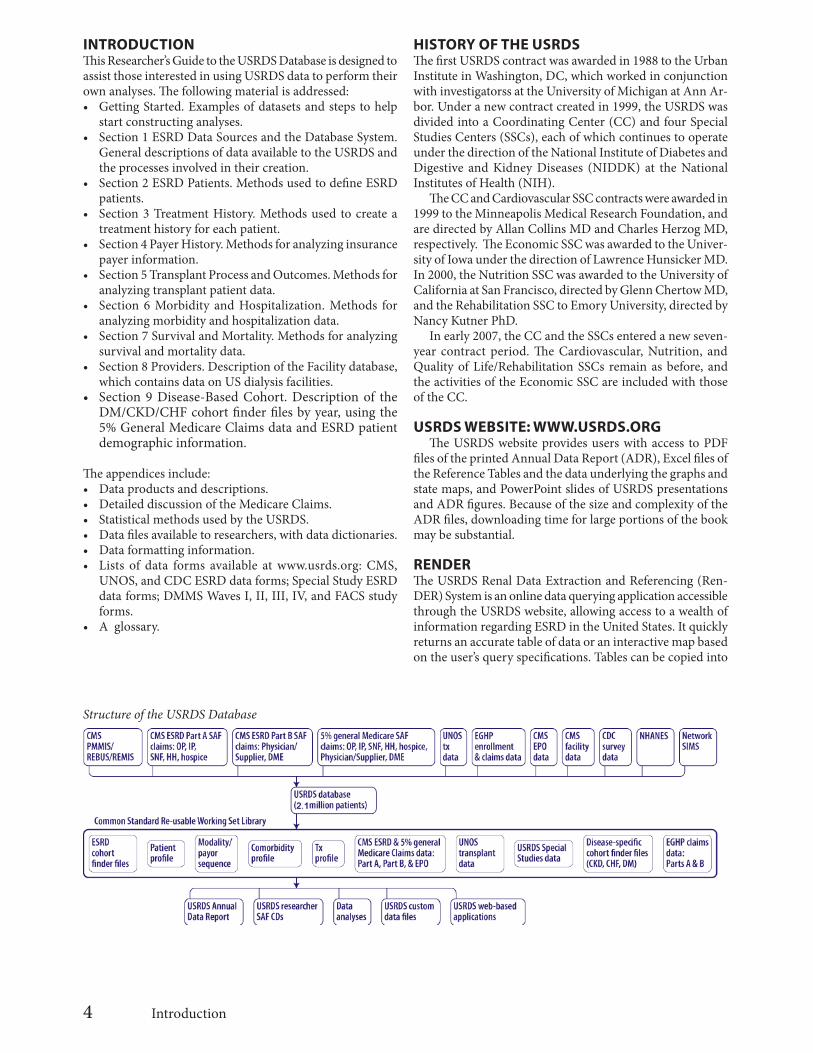
Structure of the USRDS Database
52010 USRDS Researcher’s Guide
a spreadsheet application on the user’s computer for further manipulation and investigation, and map images can be cop-ied or saved to local applications. A database file download of the mapped data, which can be opened or imported by most spreadsheet applications, is also available.
The RenDER System allows easy access to some of the most frequently requested data. While the ADR thoroughly covers many ESRD statistics, it cannot reasonably contain the more detailed tables often requested by researchers. RenDER allows users to “drill down” into the data behind many of the tables published in the ADR, allowing cross interactions among various demographic fields. For more information, visit http://www.usrds.org to access the RenDER tutorial.
WHAT’S NEW IN 2010PRE-ESRD PAYER FILEThe Pre-ESRD Payer file (PREESRD_PAYHIST) is available upon request. All variables and formats are the same as in the ESRD Payer file. The Pre-ESRD Payer file contains payer se-quences for all known payers through the day before the first service date; the ESRD Payer file contains all the sequences starting with first service date and on.
INSTITUTIONAL CLAIMSEffective on January 1, 2008, CMS required an important change in billing requirements for ESRD facilities. This change in turn had a substantial effect on the content of the institutional claims files that the USRDS receives from CMS for ESRD patients. The USRDS Institutional files for years prior to 2008 will not change, but USRDS Institutional files for calendar year 2008 and later will undergo some changes in order to accommodate the changes in the Institutional files obtained from CMS. In this guide, descriptions of Insti-tutional files for calendar years before 2008 will be followed by a description of any differences in the 2008 files compared to prior years. For more information see page 46.
WAITLIST_KI/WAITLIST_KP FILESAdded 38 variables, see What’s New 2010 text file on the Core SAF.
TXUNOS_KI/TXUNOS_KP FILESAdded 13 variables, see What’s New 2010 text file on the Core SAF.
5% DM/CHF/CKD CLAIM FILESAdded 1 variable, rev_dt - Revenue Center Service date
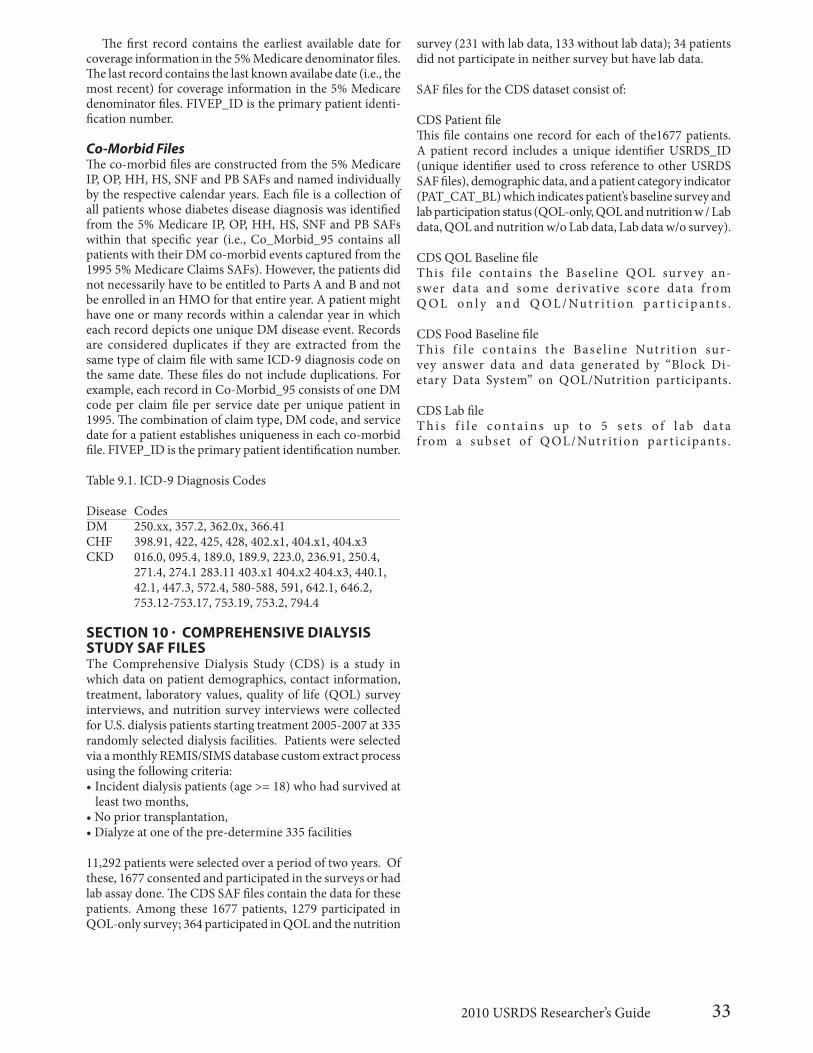
CLAIMS FOR COMPREHENSIVE DIALYSIS STUDY (CDS) CDAll institutional and physician/supplier claims data for pa-tients in the USRDS Comprehensive Dialysis Special Study.
INCLAIM: INSTITUTIONAL CLAIMSConsists of all Part A Claims for the Comprehensive Dialysis Study patients.
INDETAIL: INSTITUTIONAL CLAIM DETAILSContains details of all Part A Claims like diagnoses, and procedures for the Comprehensive Dialysis Study patients.
PSCLAIM: PHYSICIAN/SUPPLIER CLAIMSContains dollar amount, dates of service, diagnosis and proce-dure codes, type, and place of service for the Comprehensive Dialysis Study patients.
6 Introduction
Year-to-Year Comparison of Number of Records in USRDS Standard Analysis Files (SAF)
*TXWAIT is the total number of observations between Waitlist_ki and Waitlist_kp.†MEDEVID is the total number of observations between Medevid95 and Medevid05.
Getting Startedeeeee
8 Getting Started
INTRODUCTIONWork on a typical study consists of determining the study variables, selecting the variables from the datasets in which they are stored, merging the selected variables into one or more datasets for analysis, and finally performing the statistical analyses of the data. This section offers first-time users of the USRDS SAF datasets examples of this process.
All USRDS data are stored in SAS datasets that were created in the Windows environment and can be used only on the Windows operating system. Using the datasets on another computer platform requires moving and converting the data to SAS datasets for that platform. Using another data analysis system requires a conversion to a format compatible with that system.
The examples use basic SAS code. New SAS users should take classes, consult colleagues, or otherwise become familiar with the SAS system. Regardless of SAS experience, all users must know: • The location of the SAS dataset.• The location of the SAS catalog of FORMATS.
In the examples, the datasets and the FORMAT catalog are assumed to be in the same directory, namely, C:\SAF. Two SAS statements are needed to point to this information:
LIBNAME saf ‘c:\saf ’; * Directory location of the data;LIBNAME LIBRARY ‘c:\saf ’; * Directory location of format catalog;
Always assume that these two statements are required in all code. See Data Formatting, page 199, for additional information. The datasets and the format catalog may be in different directories.
BASIC SAS USEThe SAS CONTENTS procedure generates a list of all variables in the dataset and a label associated with each. The infor-mation in this label is usually an adequate indiction of whether the variable will be of use; however, PROC CONTENTS is always the best method for obtaining the latest variable list, as last minute updates may not be reflected in the printed documentation. (See Data Descriptions, page 57.) Note: In the following program examples, SAS keywords are in uppercase text. Datasets, comments, and variables in which SAS will perform operations are in lowercase text.
To determine the contents of the PATIENTS dataset, or any dataset, use the following code (remember the requirement of the two LIBNAMEs):
To see what the data look like, use the SAS procedure PRINT to list all observations of the dataset.PROC PRINT data=saf.patients; TITLE1 ‘DATASET: saf.patients;RUN;
A dataset can have thousands of observations. To print the first 500, use the following code:PROC PRINT DATA=saf.patients (OBS=500); TITLE1 ‘DATASET: saf.patients’;RUN;
To print a group of observations other than the first N observations, use the following code; this example prints observations 1500-2000, inclusive.
A dataset can contain hundreds of variables. Print selected variables using the ‘VAR’ statement:PROC PRINT DATA=saf.patients (OBS=500); VAR usrds_id sex race incyear; TITLE1 ‘DATASET: saf.patients’;RUN;
There are two parts to the ‘data=’ expression. The first is the directory location, defined by the LIBNAME, and the second is the dataset name. The first part (directory location) implies that the dataset is permanent. Later examples do not include
2010 USRDS Researcher’s Guide 9
this part, and the datasets you create will disappear when you leave SAS. To permanently save a dataset, the first part of the expression must be included.
SAS FORMATS FOR USRDS DATAInformation in a dataset may be coded. Thus, the variable GENDER may have the values F, M, or U, where F is the coded value for female, M is the value for male, and U is the value for unknown. Using one character instead of several saves disk storage, but because the coded values are not always easy for users to understand, a format is assigned to translate them. Many variables have been assigned formats by the USRDS.
In each program, SAS must be told where these formats are. Assume that the format catalog is in the directory C:\SAF. Then the following SAS LIBNAME makes the formats accessible to your SAS programs.
LIBNAME LIBRARY ‘c:\saf ’; * Directory location of format catalog;
The SAS keyword LIBRARY must be used because it tells SAS to look for formats in the directory, C:\SAF. Other methods can accomplishing this, but not as easily. To bypass the use of formats, use the following two SAS statements before running any SAS procedures:
LIBNAME LIBRARY;OPTIONS NOFMTERR
Bypassing the use of formats allows you to see raw data instead of the formatted values, which may be useful when you need to write SAS IF statements to control the flow of your program in a SAS data step. See Data Formatting for a tabular list of the formats with their coded values.
COMMENT LINESComment lines in the SAS code look like this:
/* Comment line */* Comment line;
These refer to any descriptive comment. The use of comments is optional but strongly recommended.
THE SAF DIRECTORYThroughout this section SAF has been used as the permanent SAS LIBNAME. It is assumed that all of the USRDS SAF datasets and catalogs have been placed in this directory. If the datasets have been placed in the WINDOWS directory C:\SAF, then the following SAS LIBNAME would point to the SAF datasets.
LIBNAME saf ‘c:\saf ’;Note: The datasets may be loaded into any directory, with the directory in the LIBNAME changed accordingly.
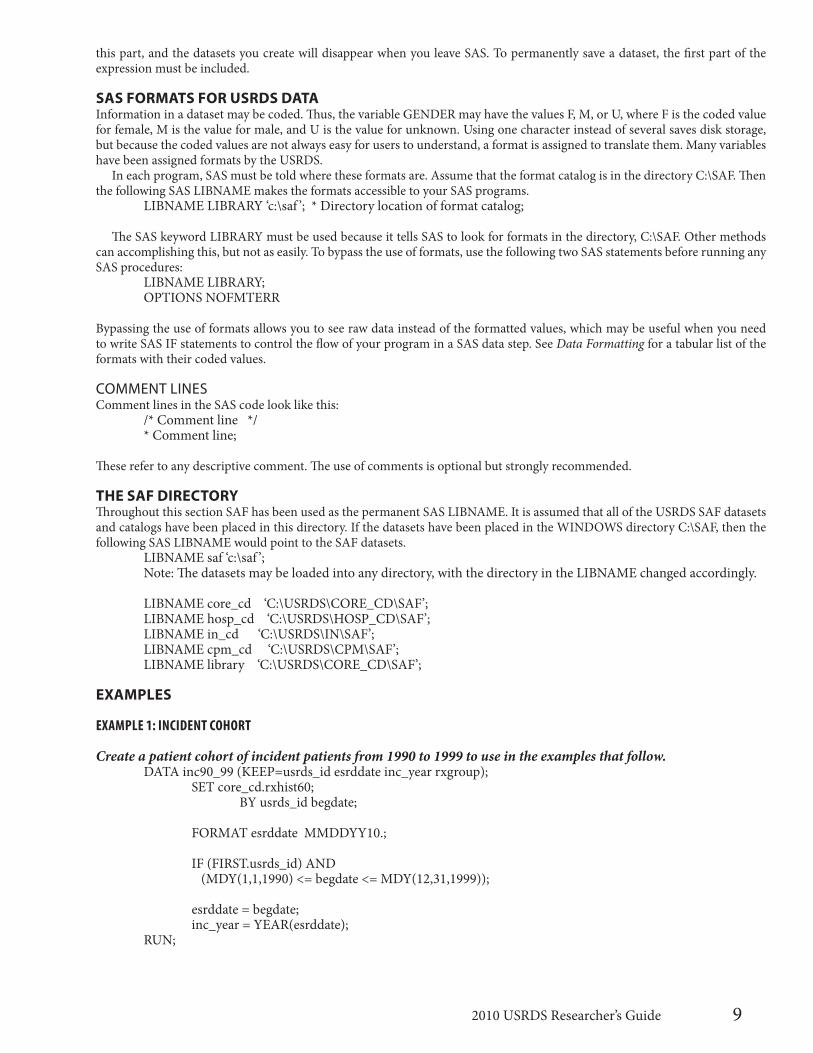
Create a patient cohort of incident patients from 1990 to 1999 to use in the examples that follow. DATA inc90_99 (KEEP=usrds_id esrddate inc_year rxgroup); SET core_cd.rxhist60; BY usrds_id begdate;
FORMAT esrddate MMDDYY10.;
IF (FIRST.usrds_id) AND (MDY(1,1,1990) <= begdate <= MDY(12,31,1999)); esrddate = begdate; inc_year = YEAR(esrddate);RUN;
10 Getting Started
PROC FREQ DATA=inc90_99;TABLES inc_year;TITLE ‘Frequency Distribution of Incident Patients 1990 - 1999: Rxhist60 file’;RUN;
PROC FREQ DATA=inc90_99;TABLE inc_year * rxgroup;TITLE ‘Frequency Distribution of Incident Patients 90-99 by Modality’;RUN;
EXAMPLE 2: INCIDENT PATIENTS DISTRIBUTION BY DEMOGRAPHIC DATA
PROC FREQ DATA=core_cd.patients;TABLE incagec sex race disgrpc;WHERE (incyear = 1999);TITLE ‘Frequency Distribution of 1999 Incident Patients by Demographic Data’;RUN;
EXAMPLE 3: POINT PREVALENT COHORT
Create a patient cohort of point prevalent dialysis patients who were alive on January 1, 1999.DATA pre_99 (KEEP=usrds_id rxgroup); SET core_cd.rxhist60; BY usrds_id begdate;
IF (begdate <= MDY(1,1,1999)) AND ((enddate = .) OR (enddate >= MDY(1,1,1999))) AND (rxgroup NOT IN (‘D’ ‘X’)) THEN OUTPUT;RUN;
PROC FREQ DATA=pre_99;TABLE rxgroup;TITLE ‘Frequency Distribution of 1-1-99 Point Prevalent Patients by Modality’;RUN;
EXAMPLE 4: 1995 INCIDENT PATIENT SURVIVAL RATES (KAPLAN MEIER)
Calculate 5-year survival rates of 1995 incident dialysis patients using Kaplan Meier method.DATA inc_95_s; MERGE inc90_99 (IN = x1) core_cd.patients (IN = x2 KEEP=usrds_id died tx1date); BY usrds_id;
IF x1 AND x2; * Extract only 1995 incident dialysis patients.; IF (inc_year = 1995) AND (rxgroup ^= ‘T’);
* Calculate the survival time (in month) of each incident patient.; t = (MIN(died, tx1date, MDY(12,31,1999)) - esrddate + 1) / 30.4375; IF (t < 0) THEN t = 0;
* Determine whether the patient is censored.; c = (MIN(died, tx1date, MDY(12,31,1999)) = died);RUN;
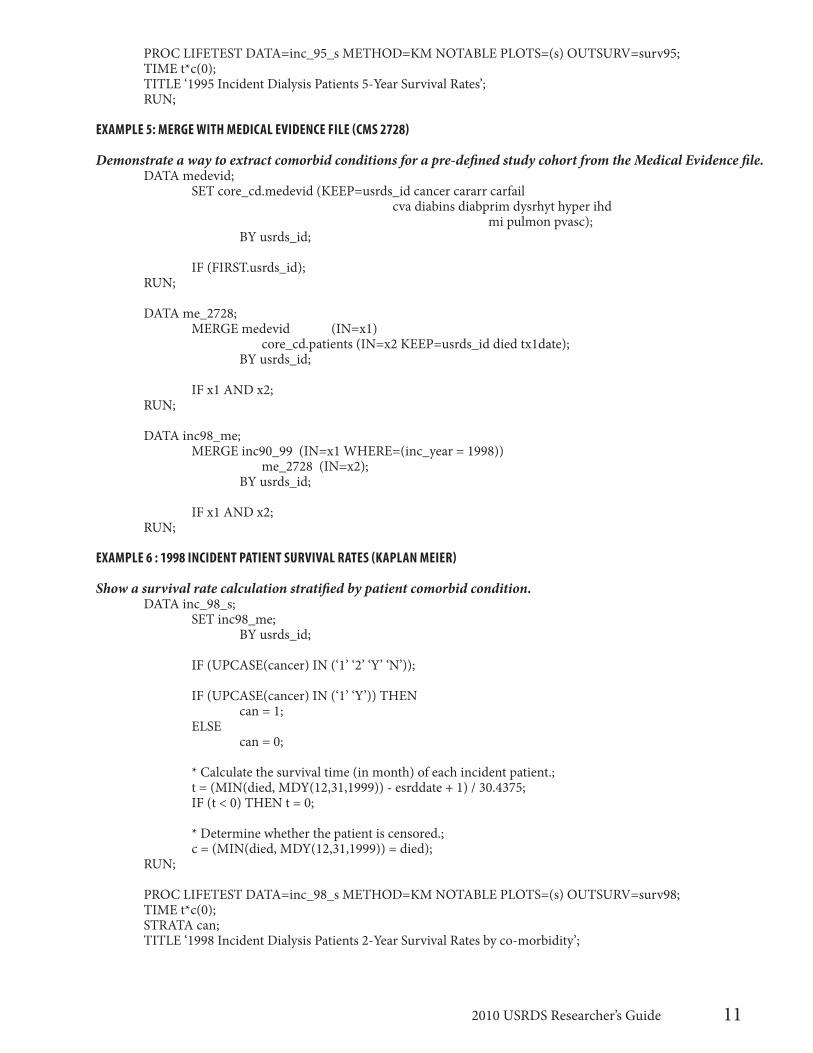
EXAMPLE 5: MERGE WITH MEDICAL EVIDENCE FILE (CMS 2728)
Demonstrate a way to extract comorbid conditions for a pre-defined study cohort from the Medical Evidence file.DATA medevid; SET core_cd.medevid (KEEP=usrds_id cancer cararr carfail cva diabins diabprim dysrhyt hyper ihd mi pulmon pvasc); BY usrds_id;
IF (FIRST.usrds_id);RUN;
DATA me_2728; MERGE medevid (IN=x1) core_cd.patients (IN=x2 KEEP=usrds_id died tx1date); BY usrds_id;
IF x1 AND x2;RUN;
DATA inc98_me; MERGE inc90_99 (IN=x1 WHERE=(inc_year = 1998)) me_2728 (IN=x2); BY usrds_id;
IF x1 AND x2;RUN;
EXAMPLE 6 : 1998 INCIDENT PATIENT SURVIVAL RATES (KAPLAN MEIER)
Show a survival rate calculation stratified by patient comorbid condition.DATA inc_98_s; SET inc98_me; BY usrds_id;
IF (UPCASE(cancer) IN (‘1’ ‘2’ ‘Y’ ‘N’));
IF (UPCASE(cancer) IN (‘1’ ‘Y’)) THEN can = 1; ELSE can = 0;
* Calculate the survival time (in month) of each incident patient.; t = (MIN(died, MDY(12,31,1999)) - esrddate + 1) / 30.4375; IF (t < 0) THEN t = 0;
* Determine whether the patient is censored.; c = (MIN(died, MDY(12,31,1999)) = died);RUN;
Determine waitlist access rate to December 31, 1999, of 1998 incident dialysis patients who were registered in the transplant waitlist. DATA txwait; set core_cd.waitseq_ki core_cd.waitseq_kp; run;
PROC SORT data=txwait; by usrds_id; RUN;
DATA inc_98_w; MERGE inc98_me (IN=x1) txwait (IN=x2 KEEP=usrds_id begin); BY usrds_id;
IF x1;
* Extract only 1998 incident dialysis patients.; IF (rxgroup ^= ‘T’); * Make sure all dialysis patients who were not put on the waitlist; * get to be censored at the end of follow-up period.; IF x1 AND ^x2 THEN begin = MDY(1,1,2000);
* Calculate the waitlist access time (in month) of each incident patient.; t = (MIN(begin, died, MDY(12,31,1999)) - esrddate + 1) / 30.4375; IF (t < 0) THEN t = 0;
* Determine whether the patient is censored.; c = (MIN(begin, died, MDY(12,31,1999)) = begin);RUN;
IF (died NE .) AND (died < sfu) THEN DELETE; FORMAT sfu efu MMDDYY10.;RUN;PROC SORT DATA=driver; BY usrds_id;RUN;
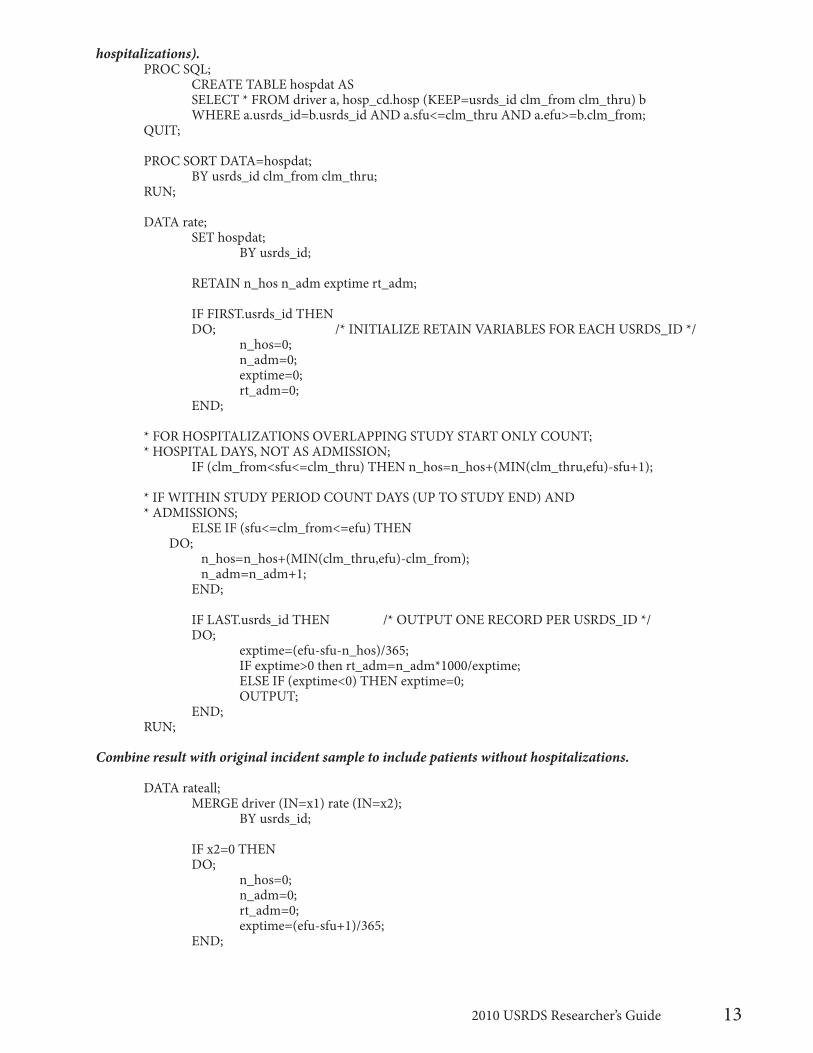
Link to hospitalization file; gather hospitalizations within period of interest (includes only patients with
2010 USRDS Researcher’s Guide 13
hospitalizations).PROC SQL; CREATE TABLE hospdat AS SELECT * FROM driver a, hosp_cd.hosp (KEEP=usrds_id clm_from clm_thru) b WHERE a.usrds_id=b.usrds_id AND a.sfu<=clm_thru AND a.efu>=b.clm_from;QUIT;
PROC SORT DATA=hospdat; BY usrds_id clm_from clm_thru;RUN;
DATA rate; SET hospdat; BY usrds_id;
RETAIN n_hos n_adm exptime rt_adm;
IF FIRST.usrds_id THEN DO; /* INITIALIZE RETAIN VARIABLES FOR EACH USRDS_ID */ n_hos=0; n_adm=0; exptime=0; rt_adm=0; END;
* FOR HOSPITALIZATIONS OVERLAPPING STUDY START ONLY COUNT; * HOSPITAL DAYS, NOT AS ADMISSION; IF (clm_from<sfu<=clm_thru) THEN n_hos=n_hos+(MIN(clm_thru,efu)-sfu+1);
* IF WITHIN STUDY PERIOD COUNT DAYS (UP TO STUDY END) AND* ADMISSIONS; ELSE IF (sfu<=clm_from<=efu) THEN DO; n_hos=n_hos+(MIN(clm_thru,efu)-clm_from); n_adm=n_adm+1; END;
IF LAST.usrds_id THEN /* OUTPUT ONE RECORD PER USRDS_ID */ DO; exptime=(efu-sfu-n_hos)/365; IF exptime>0 then rt_adm=n_adm*1000/exptime; ELSE IF (exptime<0) THEN exptime=0; OUTPUT; END;RUN;
Combine result with original incident sample to include patients without hospitalizations.
DATA rateall; MERGE driver (IN=x1) rate (IN=x2); BY usrds_id;
IF x2=0 THEN DO; n_hos=0; n_adm=0; rt_adm=0; exptime=(efu-sfu+1)/365; END;
14 Getting Started
IF x1 THEN OUTPUT;RUN;
Calculate mean admissions per 1000 patient-years by gender.PROC TABULATE DATA=rateall;VAR rt_adm;CLASS sex;WEIGHT exptime;TABLE sex=’’*rt_adm=’’*mean*f=8.1;KEYLABEL mean=’’;TITLE1 ‘Total Admission rates per 1,000 patient years’;RUN;
EXAMPLE 9: FIRST ADMISSION RATE
Using hospitalization data from above, calculate first hospitalization rates.DATA frate; SET hospdat; BY usrds_id;
RETAIN n_adm exptime rt_adm flag;
IF FIRST.usrds_id THEN DO; /* INITIALIZE RETAIN VARIABLES FOR EACH USRDS_ID */ n_adm=0; exptime=0; rt_adm=0; flag=0; END;
* FOR HOSPITALIZATIONS OVERLAPPING STUDY START SET EXPOSURE * TIME TO ZERO TO EXCLUDE FROM RATE; IF (clm_from<=sfu<=clm_thru) THEN DO; exptime=0; flag=1; END;
* IF WITHIN STUDY PERIOD COUNT ADMISSION AND CALCULATE* EXPOSURE TIME; ELSE IF (sfu<clm_from<=efu) AND flag=0 THEN DO; exptime=(clm_from-sfu+1)/365; n_adm=n_adm+1; flag=1; END;
IF LAST.usrds_id THEN /* OUTPUT ONE RECORD PER USRDS_ID */ DO; IF exptime>0 then rt_fadm=n_adm*1000/exptime; OUTPUT; END;RUN;
Combine result with original indicent sample to include patients without hospitalizations.DATA frateall; MERGE driver (IN=x1) frate (IN=x2);
2010 USRDS Researcher’s Guide 15
BY usrds_id;
IF x2=0 THEN DO; n_adm=0; rt_fadm=0; exptime=(efu-sfu+1)/365; END; IF x1 THEN OUTPUT;RUN;
Calcualte mean admissions per 1000 patient-years by gender.PROC TABULATE DATA=frateall;VAR rt_fadm;CLASS sex;WEIGHT exptime;TABLE sex=’’*rt_fadm=’’*mean*f=8.1;KEYLABEL mean=’’;TITLE1 ‘First Admission rates per 1,000 patient years’;RUN;
EXAMPLE 10: CREATE A PATIENT COHORT OF 1998 MEDICARE INCIDENT PATIENTS
Create the 1998 incident patient file.DATA inc_98; SET core_cd.patients (WHERE=(incyear=1998));RUN;
Find Medicare payer status at first service date;DATA first_payer; SET core_cd.payhist; BY usrds_id begdate; IF first.usrds_id;RUN;
Combine payer information with original incident cohort and limit to patients with Medicare payers at first service date;
PROC SORT DATA=inc_98; BY usrds_id;RUN;DATA medicare_inc_98; MERGE inc_98 (IN=x1) first_payer (IN=x2 KEEP=usrds_id mcare payer dualelig); BY usrds_id; IF x1 AND mcare = ‘Y’;RUN;
16 Getting Started
Sections 1-10eeeee
18 Sections 1-9
SECTION 1 · ESRD DATA AND THE USRDS DATABASE SYSTEMThe main objective of the USRDS CC is to use all relevant ESRD data to create an integrated and consistent database system for outcomes research. The CC database includes ESRD patient demographic and diagnosis data, biochemical values, dialysis claims, and information on treatment history, hospitalization events, and physician/supplier services.
DATA SOURCESThe data used by the USRDS CC originates from CMS, UNOS, the CDC, the ESRD Networks, and the USRDS special studies.
PMMIS/REBUS/REMIS DATABASE SYSTEM The major source of ESRD patient information for the USRDS is the CMS Renal Beneficiary and Utilization System (RE-BUS), which was adopted in 1995 as the On-Line Transaction Processing (OLTP) system from its predecessor, the Program Management and Medical Information System (PMMIS) da-tabase. The PMMIS/REBUS database contains demographic, diagnosis, and treatment history information for all Medicare beneficiaries with ESRD. The database has been expanded to include non-Medicare patients, as discussed below.
Having advanced its database technology, CMS trans-formed the REBUS database into an Oracle relational da-tabase system, called the Renal Management Information System (REMIS), in the fall of 2003. This database included all patients who were alive and had ESRD as of January 1, 1995, or were incident after this date. This approach was adopted from the Networks’ Standard Information Manage-ment System (SIMS) database creation procedure. However, because the REMIS system as it existed did not include legacy patients for longitudinal studies, CMS expanded it in the fall of 2004 to include all ESRD patients.
CMS regularly updates the PMMIS/REBUS/REMIS data-base, using the Medicare Enrollment Database (EDB), Medi-care inpatient and outpatient claims, the UNOS transplant database, the ESRD Medical Evidence Report (CMS-2728) provided by the ESRD Networks, the ESRD Death Notifica-tion (CMS-2746) obtained from renal providers, and the ESRD Networks’ SIMS database. CMS has established data integrity rules to ensure accurate identification of patients in the SIMS and CMS databases. Each ESRD patient (new and old) is identified with a unique patient identification number common to both databases, guaranteeing that data on all patients are consistently managed over time.
STANDARD INFORMATION MANAGEMENT SYSTEM (SIMS) DA-TABASEThe USRDS CC continues to collaborate with CMS and the ESRD Networks to address data-tracking issues relating to non-Medicare ESRD patients. Working solely with data from the Medical Evidence Report, the CC could establish the first ESRD service data for these patients, but could not generate a detailed treatment history in a consistent manner. The integration of the SIMS event data into the CC database, however, allows for the examination of issues that arise in the non-Medicare ESRD population, such as the large and
growing number of lost-to-follow-up patients, and for the gathering of data on patients for whom no data were previ-ously available on initial modality or death.
CMS MEDICAL EVIDENCE REPORT (FORM CMS-2728)The CMS Medical Evidence Report is completed by the renal provider for each new ESRD patient, and is sent to CMS through the ESRD Networks. It serves to establish Medicare eligibility for individuals who previously were not Medicare beneficiaries, reclassify previously eligible Medicare ben-eficiaries as ESRD patients, and provide demographic and diagnostic information on all new ESRD patients regardless of Medicare entitlement.
Before 1995, dialysis units and transplant centers were re-quired to file the Medical Evidence Report only for Medicare-eligible patients. With the adoption of the form revised in 1995, however, providers were required to complete the form for all new ESRD patients regardless of Medicare eligibility status. The 1995 form also contained new fields for comorbid conditions, employment status, expanded race categories, ethnicity, and biochemical data at the start of ESRD.
While only one Medical Evidence Report is expected for each ESRD patient for the entire ESRD treatment period, mul-tiple forms may be filed for patients with multiple insurance eligibility switches caused by therapy changes. For example, Medicare will drop ESRD benefits for a transplant patient whose graft is still functioning after three years if ESRD has been the patient’s sole qualification for Medicare eligibility. If this patient has a graft failure and subsequently returns to dialysis, a second Medical Evidence form must be filed to re-establish Medicare eligibility. As another example, a dialysis patient who stops dialysis for more than twelve months, resulting in the termination of Medicare ESRD benefits, and who returns to dialysis or receives a kidney transplant, gen-erates a second Medical Evidence form to resume receiving Medicare benefits.
REVISED MEDICAL EVIDENCE REPORT (FORM CMS-2728) Another revision of the Medical Evidence Report was intro-duced in May 2005. It includes new data collection methods and new variables. It allows users to specify if the form is for initial (new ESRD patient), re-entitlement (reinstating Medi-care entitlement after not filing claims for 12 or more months or having a functioning graft for 36 or more months), and supplemental (updating missing or incorrect information) registration. This will clarify the intended use of the form without relying on the “First Regular Dialysis Start Date,” and will help chronicle the historical sequence when multiple forms are submitted.
Patients can now check multiple races. CMS provides a single variable containing a concatenated string representing all selected race codes with binary digits (0s and 1s). This string must be decoded to determine patient race (or races). Similar formatting requirements apply to information on comorbid conditions, medical coverage, and reasons for pa-tients not being informed of transplant options. Because the required programming is substantial, we include, for each of these four patient data categories, the original variable with the concatenated string and a new variable with the decoded
192010 USRDS Researcher’s Guide
values (i.e., information noted on form CMS-2728). How-ever, the decoded multiple race values must be presented as “Other” or “Multiple race” to maintain consistency with the legacy race information.
Data on nephrologist care, diet care, and access type have also been added to the new form, with the respective time interval relative to ESRD onset. The laboratory values hema-tocrit, creatinine clearance, BUN, and urea clearance are no longer collected. Added laboratory values include HbA1c and lipid profiles such as TC, LDL and HDL cholesterol, and TG. Additional questions relate to whether patients were informed of transplant options and if not the reason, and donor type. Comorbid conditions and primary diagnoses have also been added. Please see ‘What’s New’ (page 5) for a detailed description of new and dropped variables. Both the 2005 and 1995 versions of the forms are provided on the USRDS Core SAF data set and are also available for download in PDF format from the USRDS website: http://www.usrds.org/reference.htm .
CMS ESRD DEATH NOTIFICATION (FORM CMS-2746)Like the Medical Evidence Report, the Death Notification Form is data rich, and its completion by renal providers is enforced by CMS. Providers usually have 45 days to report ESRD death events to their respective ESRD Networks, pro-viding information about the place, time, and cause of death. Data are thus available to the USRDS Coordinating Center to conduct research on cause-specific mortality outcomes.
CMS MEDICARE ENROLLMENT DATABASE (EDB)The CMS Enrollment Database is the designated repository of all Medicare beneficiary enrollment and entitlement data, including current and historical information on beneficiary residence, Medicare as Secondary Payer (MSP) status, and Health Insurance Claim/Beneficiary Identification Code (HIC/BIC) cross-referencing.
CMS PAID CLAIMS RECORDSInpatient transplant and outpatient dialysis claims records are sometimes used to identify new ESRD patients for whom no Medical Evidence Report has been filed. These patients, who are most likely to be non-Medicare patients or beneficiaries who develop ESRD while already on Medicare because of old age or disability, will eventually be entered into the PMMIS/REBUS database, and hence the USRDS database, through the claims records. For patients without Medical Evidence records, these claims are the only reliable information from which to determine first service dates for ESRD. These paid claims records, however, are only a supplement to, not a replacement of, other sources of information on incidence and prevalence.
It is important to note that some Medicare eligible patients may not have bills submitted to and paid by Medicare, in-cluding MSP patients covered by private insurance, HMOs, Medicaid, or the Department of Veterans Affairs (DVA).
UNOS TRANSPLANT DATABASECMS began collecting data on all Medicare kidney transplants in the early 1980s. In 1988, UNOS was created to provide a
national system for allocating donor organs and to maintain a centralized data depository on organ transplantation. UNOS also began collecting data on all transplants. Subsequently, these two collection efforts were consolidated in 1994, and UNOS became the sole source on transplant donors and recipients.
The CMS and UNOS transplant data files overlap for 1988–1993, and some patients with Medical Evidence Reports indicating transplant as the initial modality are not included in either file. To resolve the conflicts among these three sources, the USRDS has adopted the following procedure:• Before 1988, all transplant events found in CMS PMMIS/
REBUS Transplant files are used.• After 1994, all transplant events found in the UNOS files
are used.• Between 1988 and 1993, all transplant events found in the
UNOS files are used while additional transplant events are taken from the CMS PMMIS/REBUS Transplant file only if they occur at least 30 days either side of a previously accepted transplant event.
• Additionally, transplant events associated with the re-ported incident transplant patients from the Medical Evidence Report are taken if they also occur at least 30 days either side of a previously accepted transplant event.
• Each transplant event found in the Transplant file of the USRDS SAF Core CD is thus a unique event derived from the UNOS, CMS PMMIS/REBUS Transplant, and Medical Evidence record files.
CMS ESRD STANDARD ANALYTICAL FILES (SAFS)The CMS SAFs contain data from final action claims, submit-ted by Medicare beneficiaries, in which all adjustments have been resolved. For Part A institutional claims, the USRDS uses the following 100% SAF claims:• Inpatient• Outpatient• Skilled nursing facility (SNF)• Home health agency (HHA)• Hospice
For Part-B physician/supplier 100% SAF claims:• Physician/supplier• Durable medical equipment (DME)
CMS SAFs are updated each quarter through June of the next year, when the annual files are finalized. Datasets for the current year are created six months into the year and updated quarterly until finalized at 18 months, after which files are frozen and will not include late arriving claims. Annual files are thus approximately 98% complete. The USRDS 2006 ADR includes all claims up to December 31, 2004. Patient-specific demographic and diagnosis information, however, includes data as recent as October 2005.
CMS 5% GENERAL MEDICARE SAFSThe 5% general Medicare SAFs have the same structure and data elements as the ESRD 100% SAFs, but they were extracted from the general Medicare billing database on a random sample of just 5% of the entire Medicare population.
20 Sections 1-9
Because the sample is selected using the last two digits of patients’ Social Security Numbers, one should expect to see the same group of Medicare beneficiaries represented in the 5% SAFs each year, with exceptions for death, disenrollment, and new Medicare entitlements.
The USRDS Coordinating Center uses these files to con-duct studies on Healthy People 2010 objectives, comparing preventive care and other non-ESRD disease treatments in general Medicare and ESRD patients. In addition, these files are used to create DM/CKD/CHF cohort finder files.
CLINICAL PERFORMANCE MEASURES PROJECT (CPM)CMS developed the ESRD CPM (formerly the ESRD Core Indicators Project) to collect information on the quality of care provided to dialysis patients. The data originate from surveys completed by primary care facilities, and focus on dialysis adequacy measures, anemia management, and vascu-lar access use. Additional clinical parameters such as albumin are also available. These data have been collected annually since 1994, using a random sample of patients aged 18 years and older, alive and on dialysis at the end of each calendar year; on average, about 8500 in-center hemodialysis patients and 1500 peritoneal dialysis patients are surveyed each year. Data collection for all pediatric patients aged 12 to 17 years began in 2000, and in 2002 was expanded to all in-center hemodialysis patients aged younger than 18 years. Starting in 2005, all PD patients in the US have been sampled for the pediatric PD data collection. The USRDS CC, in collabora-tion with CMS, provides CPM/USRDS merged data to the general research community.
CMS DIALYSIS FACILITY COMPARE DATAThe USRDS uses the CMS Dialysis Facility Compare data to define chain and ownership information for each renal facil-ity; before the 2003 ADR, similar data were extracted from the Independent Renal Facility Cost Report (CMS 265-94).
CMS ANNUAL FACILITY SURVEY (AFS)In addition to the CMS ESRD databases, independent ESRD patient counts are available from the CMS Annual Facility Survey, which all Medicare-approved dialysis units and transplant centers are required to complete at the end of each calendar year. The AFS reports counts of patients being treated at the end of the year, new ESRD patients start-ing during the year, and patients who died during the year. Counts of Medicare and non-Medicare end-of-year patients are included. While AFS files do not carry patient-specific demographic and diagnosis information, they do provide independent patient counts used to complement the CMS patient-specific records.
CDC NATIONAL SURVEILLANCE DATAFrom 1993-2002, the CDC used its National Surveillance of Dialysis-Associated Diseases in the United States to col-lect information from dialysis facilities on patient and staff counts, membrane types, reuse practices, water treatment methods, therapy types, vascular access use, antibiotic use, hepatitis vaccination and conversion rates (for both staff and patients), and the incidence of HIV, AIDS, and tuberculosis.
None of the information is patient-specific. Because the CDC terminated this program in 2003, the last surveillance report is for 2002 data. The CDC did not conduct a survey in 1998.
DIALYSIS MORBIDITY AND MORTALITY STUDY (DMMS) The DMMS was an observational study in which data on demographics, comorbidity, laboratory values, treatment, socioeconomic factors, and insurance were collected for a random sample of US dialysis patients, using dialysis records. Data were collected on 6000 ESRD patients in each of Waves I, III, and IV, and 4500 patients in Wave II, a total of 22,500 patients over three years. Waves I, III, and IV are each his-torical prospective studies in which data were collected for patients receiving in-center hemodialysis on December 31, 1993. Data were abstracted from patient medical records, and each patient was followed from December 31, 1993, through the earliest of data abstraction, death, transplant, change in modality, or transfer to another facility. Wave II is a true prospective study of incident hemodialysis and peritoneal dialysis patients for 1996 and some incident patients entering the ESRD program in the first part of the 1997 calendar year.
CASE MIX ADEQUACY STUDYThe objectives of the USRDS Case Mix Adequacy Study of Dialysis were to:• establish the relationship between the dose of delivered
dialysis therapy and mortality.• determine the strength of this relationship when data are
adjusted for comorbidity.• assess how this relationship changes at different dialysis
doses• assess how this relationship is affected by dialyzer reuse.• assess the impact of different dialysis membranes on
patient morbidity and mortality.
The study consisted of two groups of patients: an incident sample of ESRD patients who began hemodialysis during 1990, and a prevalent sample of hemodialysis patients with onset of ESRD before 1990. A total of 7096 patients from 523 dialysis units were included, with approximately 3300 patients having the pre- and post-BUN values needed to calculate delivered dialysis dose. Ninety-four percent of these cases were matched to the USRDS database. The ESRD Networks collected these data in conjunction with their Medical Case Review data abstraction.
CASE MIX SEVERITY STUDYThe objectives of this study were to:• estimate the correlation of comorbidity and other factors
existing at the onset of ESRD to subsequent mortality and hospitalization rates, while adjusting for age, gender, race, and primary diagnosis
• evaluate possible associations of these factors with re-ported causes of death.
• assess the distribution of comorbidity and other factors among patients using different treatment modalities.
• compare relative mortality rates by treatment modality, adjusting for selected comorbid conditions and other factors.
212010 USRDS Researcher’s Guide
Data were collected on 5255 incident patients in 1986 and 1987 at 328 dialysis units nationwide.
PEDIATRIC GROWTH AND DEVELOPMENTThe objectives of the USRDS Pediatric ESRD Growth and Development Study were to:• establish a baseline for assessing the relation of pediatric
ESRD patient growth and sexual maturation to modality• establish a prototype for the ongoing collection of
pediatric data.
All patients prevalent in 1990 and born after December 31, 1970, were included in the study, a total of 3067 patients at 548 dialysis units.
CAPD AND PERITONITIS STUDYThe USRDS CAPD and Peritonitis Rates Study examined the relation of peritonitis episodes in CAPD patients to connec-tion device technology and other factors. The study popula-tion included all patients newly starting CAPD in the first six months of 1989, up to a maximum of 14 patients per dialysis unit. All units providing CAPD training participated in the study. The sample contains 3385 patients from 706 units.
USRDS DATABASE SYSTEMThe USRDS CC has developed a centralized ESRD patient database by integrating data from the above data sources and establishing methods to identify patients with ESRD. We use this database to update and maintain data on demographics, clinical measurements, biochemical lab test results, renal re-placement therapy, treatment history, and all medical service events reported in the Medicare claims database. Through this patient-oriented database we attempt to define each individual ESRD patient by going through multiple stages of data cleaning, conversion, validation, and consolidation. Establishment of a universal patient identification system was critical to ensure that unique patient identification numbers are assigned to each ESRD patient at the time of ESRD ini-tiation, to accurately track counts and rates of incident and prevalent cohorts over time.
In 1994, the USRDS CC introduced the Standard Analysis Files (SAFs)—not to be confused with the CMS Standard Analytical Files for Part A and Part B claims data—to help meet the ESRD data needs of a wide variety of research stud-ies. These SAFs have subsequently been enhanced to include not only ESRD clinical and claims data from CMS, but also transplant and wait list data from UNOS. All SAFs are sorted by the unique USRDS-specified patient identification num-ber, and patient identifiers (name, address, SSN, HIC/BIC, etc.) are removed to protect patient confidentiality.
The CC also uses the USRDS ESRD database to generate the data sets for the tables, graphs, and maps in the USRDS ADR.
The USRDS ESRD database is updated regularly with data obtained from the various data sources. The CC generally receives CMS SAF claims data, Facility Survey data, CDC Survey data, and UNOS transplant and wait-list data once a year, and REBUS and EDB data more frequently. These multiple updates allow the CC to assess growth of the ESRD
population, the demographic distribution of ESRD patients, and changes in the percent of patients diagnosed with major diseases secondary to ESRD.
SECTION 2 · ESRD PATIENTSESRD is defined as chronic renal failure requiring renal re-placement treatment—dialysis or transplant—to sustain life. It is not the same as acute renal failure, from which patients are expected to recover within weeks or months. A Medical Evidence Report must be completed immediately by renal providers for all ESRD patients to register them in the CMS ESRD database and to apply for Medicare eligibility if they were not previously eligible.
DATA SOURCESTo establish the incident and prevalent cohorts by year, modality, primary cause of renal failure, and other factors, patient demographic and clinical information are required as well as treatment history data. This information can be obtained from the USRDS Core CD with files “PATIENTS,” “MEDEVID,” “RXHIST,” “RXHIST60,” and “PAYHIST.”
FIRST ESRD SERVICE DATEThe first ESRD service date (FSD) is the single most impor-tant data element in the USRDS database, and each patient must, at a minimum, have a valid FSD. This date is used to determine each new patient’s incident year and the first year in which the patient is counted as prevalent. The date 90 days after the FSD is used as the starting point for most patient survival outcomes analyses. This rule allows each new ESRD patient to generate Medicare services despite potential delays in completing the Medicare eligibility application process, and it provides an adequate time period for patients to arrive at a stable and suitable dialytic treatment modality.
The FSD is derived by taking the earliest of:• the date of the start of dialysis for chronic renal failure, as
reported on the Medical Evidence report,• the date of a kidney transplant, as reported on a CMS or
UNOS transplant form, a Medical Evidence report, or a hospital inpatient claim, or
• the date of the first Medicare dialysis claim.
Most FSDs are derived from the Medical Evidence Report. In the absence of this form, the date of the first Medicare dialysis claim or transplantation usually supplies the FSD. In the few cases in which the date of the earliest dialysis claim is earlier than the first dialysis date reported on the Medical Evidence Report, the earliest claim date is used as the FSD.
IDENTIFYING ESRD PATIENTSA person is identified as having ESRD when a physician certi-fies the disease on the Medical Evidence (ME) Report (form CMS-2728), or when other evidence of chronic dialysis or kidney transplant exists. Patients with acute kidney failure who are on dialysis for days or weeks, but who then recover kidney function, are excluded from the database if their ME forms have not been submitted. Patients who die soon after kidney failure without receiving dialysis are sometimes missed.
22 Sections 1-9
The ESRD First Service Date (FSD) is the single most important data element in the USRDS database, and each patient must, at a minimum, have a valid FSD. This date is used to determine the incident year for each new patient and the first year in which the patient is counted as prevalent. The date 90 days after the FSD is used as the starting point for most survival analyses.
The FSD is derived by taking the earliest of dialysis start date, as reported on the ME form, for chronic kidney failure; the date of kidney transplant, as reported on a CMS or OPTN transplant form, an ME form, or a hospital inpatient claim; or the date of the first Medicare dialysis claim. Most FSDs are obtained from the ME form. In the absence of this form, the FSD usually comes from date of the first Medicare dialysis claim or transplant. In the few cases in which the date of the earliest dialysis claim precedes the first dialysis date reported on the ME form, the earliest claim date is used as the FSD. However, starting with the 2007 ADR, FSDs for patients entering the ESRD program after December 31, 1994, are defined solely by the regular dialysis start date or the preemp-tive transplant date, whichever is earliest, on the ME form. This new method of determining FSD has been introduced in this ADR to align more closely to methods used by CMS. After years of careful monitoring and repeated comparative analyses of the traditional USRDS method to the new ME method, the USRDS believes it is appropriate to apply the ME method to incident patients entering the ESRD program on or after January 1, 1995.
INCIDENCE AND PREVALENCEIncidence is defined as the number of people in a popula-tion newly diagnosed with a disease in a given time period, typically a year. Prevalence is the number of people in a population who have the disease at a given point in time (point prevalence) or during a given time period (period prevalence). The USRDS generally reports point prevalence, used primarily throughout the ADR, as of December 31, and period prevalence for a calendar year. Annual period prevalent data thus incljude people who have the disease at the end of the year and those who had the disease during the year and died before the year’s end. Please refer to Getting Started, page 7, for further details on defining incident and prevalent patient cohorts using the USRDS SAFs.
The USRDS treats successful transplantation as a therapy rather than as recovery from ESRD. Patients transplanted at the time of ESRD initiation are counted as incident patients, and those with functioning transplants as prevalent.
Because data are available only for patients whose ESRD therapy is reported to CMS, patients who die of ESRD before receiving treatment or whose therapy is not reported to CMS are not included in the database. The terms incidence and prevalence are thus qualified as incidence and prevalence of reported ESRD. Some ESRD registries, such as the European Dialysis and Transplantation Association, use the term “ac-ceptance into ESRD therapy.” The USRDS, however, believes that “incidence of reported ESRD therapy” is more precise, because “acceptance” implies that remaining patients are rejected, when in fact they may simply not be identified as ESRD cases or may not be reported to CMS.
Point prevalence is a useful measure for public health re-search because it measures the current burden of the disease on the health care delivery system. Period prevalence is ap-propriate for cost analysis because it indicates the total disease burden over the course of the year. The USRDS CC focuses primarily on ESRD incidence as the most useful measure for medical and epidemiological research that examines disease causality and its effect on different subpopulations.
MEDICARE AND NON-MEDICARE (‘ZZ’) PATIENTSBeneficiaries are enrolled in Medicare based on criteria de-fined in Title XVIII of the Social Security Act of 1965 and in subsequent amendments to the Act. A person in one of these four categories is eligible to apply for Medicare entitlement:• Aged 65 years and older• Disabled• Enrolled in the ESRD program• Railroad Retirement Board (RRB)
Most ESRD patients are eligible to apply for Medicare as their primary insurance payer. However, some patients are not immediately eligible for Medicare coverage as primary payer because of their employment status and pre-existing primary insurance payers such as Employer Group Health Plans (EGHPs), the Department of Veteran Affairs, and private insurers. Typically, they wait 30 to 33 months before becoming eligible for Medicare as primary payer, and are not in the EDB database during the waiting period. Some of these patients, particularly patients new since 1995, have FSDs established by Medical Evidence Reports, but have no dialysis claims or hospitalization events in the CMS claims database to establish treatment history events. In the PM-MIS/REBUS database, these patients are designated ‘ZZ,’ or non-Medicare (the PMMIS/REBUS group assigns ‘ZZ’ in the two-character Beneficiary Identification Code field to identify all non-Medicare ESRD patients). CMS does not generally include these patients in the datasets released to researchers.
The USRDS recognizes that ‘ZZ’ patients are ESRD pa-tients and should therefore be included in patient counts for incidence, prevalence, and treatment modality. However, calculations of standardized mortality ratios (SMRs), stan-dardized hospitalization ratios (SHRs), and standardized transplantation ratios (STRs) should not include these pa-tients because of the small number of claims available in the first 30 to 33 months after first ESRD service. Furthermore, linking ‘ZZ’ patients to their ESRD Death Notification (CMS 2746) or to the UNOS transplant data may be impossible, as may determining comorbid conditions or Part A and Part B services. Due to the limited availability of event data, event rates that include these patients must be assessed with cau-tion.
SECTION 3 · TREATMENT HISTORYThe USRDS CC uses billing information from the CMS ESRD database to create a longitudinal history of ESRD treatment for each patient in the database. This history defines incident and prevalent cohorts and determines censoring points and outcomes for observational studies.
232010 USRDS Researcher’s Guide
DATA SOURCESThe FSD is established by evaluating information from several sources. REBUS includes first ESRD service datefrom the Medical Evidence Report. The REBUS Quarterly Dialysis record summarizes dialysis billing information, and can also establish FSD if data are missing from other files. The UNOS transplant dataset provides FSD information for incident transplant patients. Data combined from these sources es-tablishrd the first ESRD service date. Section 2 describes the decision algorithm used.
TREATMENT MODALITY CATEGORIESTable 3.1 lists modality categories used by the USRDS. They-can be described as detailed or general. For most analyses the general categories, which combine detailed modality categories, are sufficient. A new modality/event—recovered renal function (RRF)—was introduced in the 2007 ADR. RRF can be established only if it occurs within the first 180 days of FSD, and the RRF period persists for at least 90 days. The RRF modality (i.e., event) is similar to the lost-to-follow-up event in that patients with an RRF event will not be included in the prevalent populations for outcomes analyses. However, as with lost-to-follow-up events, they remain in the modality sequence so subsequent renal failure episodes can be closely tracked in a timely manner.
Table 3.1. Treatment Modality Categories
Type Detailed General1 Center HD HD2 Center Self HD HD3 HD Training HD4 Home HD HD5 CAPD CAPD6 CAPD Training CAPD7 CCPD CCPD8 CCPD Training CCPD9 Other PD Unknown DialysisA Uncertain Dialysis Unknown DialysisT Functioning Tx TransplantX Lost to follow-up Lost to follow-upD Death DeathZ Recovered Function _________Recovered Function
HOW TREATMENT MODALITY IS DETERMINEDThe treatment history files in the USRDS Core CD record the sequence of modalities for each patient. The variables included in these files are presented in Table 3.2. Each record in the file indicates a period of therapy of a given modality, and any change in provider or detailed modality results in a new record. Several data sources are used to determine the treatment history, including the Medical Evidence file, the Quarterly Dialysis file, the UNOS Transplant events, and Medicare claims files.
BEGDATE Beginning date of a modality periodENDDATE Ending date of a modality periodBEGDAY Start day of modality period (First Service Date = 1)ENDDAY End day of modality period (First Service Date = 1)RXDETAIL Detailed treatment modality for periodRXGROUP Grouped treatment modality for periodPROVUSRD USRDS assigned facility identification
Table 3.2 (continued)
RXHIST60 Condensed Treatment HistoryUID USRDS Patient IdentificationBEGDATE Beginning date of a modality periodENDDATE Ending date of a modality periodBEGDAY Start day of modality period (First Service Date = 1)ENDDAY End day of modality period (First Service Date = 1)RXGROUP Grouped treatment modality for period
In constructing this treatment history file, these conven-tions are followed: • The sequence always begins with the first ESRD service
date and ends with the earliest of date of death or end of the period for which the data are complete. For the catego-ries death, loss-to-followup, and functioning transplant, the end date may be missing from a patient’s last record. Dialysis categories always have an end date.
• Death is treated as the last event of the day, and is the absolute end point of the treatment history.
• If two dialysis billing periods overlap, the earlier is termi-nated at the start of the later . If a dialysis billing period is entirely contained within another, the contained period is ignored.
• A functioning transplant is considered a treatment, not recovery from ESRD.
• If a dialysis billing period overlaps a transplant date, the dialysis period is closed at the transplant date.
• If a transplant failure is recorded in the database, but there are no subsequent records of dialysis or another transplant, a period of “unknown dialysis” is inserted. If no dialysis billing records or another transplantation appear within one year, the patient is designated lost-to-followup at the end of that year, and this status continues until dialysis or new transplant records appear.
• Once established, a modality is assumed to continue until a change in provider or detailed modality occurs. For dialysis patients, if no new dialysis billing data appear for one year, the patient is reclassified as lost-to-followup at the end of that one-year period.
• A functioning transplant is assumed to continue until an indication of transplant failure or death, or evidence of regular or maintenance dialysis.
24 Sections 1-9
TRANSPLANT FAILUREThe CC assumes that a graft failure date reported in the UNOS transplant follow-up file or the REBUS identification file is correct unless death or a new transplant occurs before this date. However, a transplant failure date can go unrecorded in both files. In this case, the CC derives the transplant failure date from the following sources:• Date of death• Date of subsequent transplant• Date of return to regular dialysis, indicated by a continu-
ous period of dialysis billing records covering a minimum of 60 days with at least 22 reported dialysis treatments
THE 60-DAY COLLAPSING RULEThe CC uses the convention that a dialysis modality must continue for at least 60 days to be considered stable. A trans-plant is considered a stable modality regardless of duration.
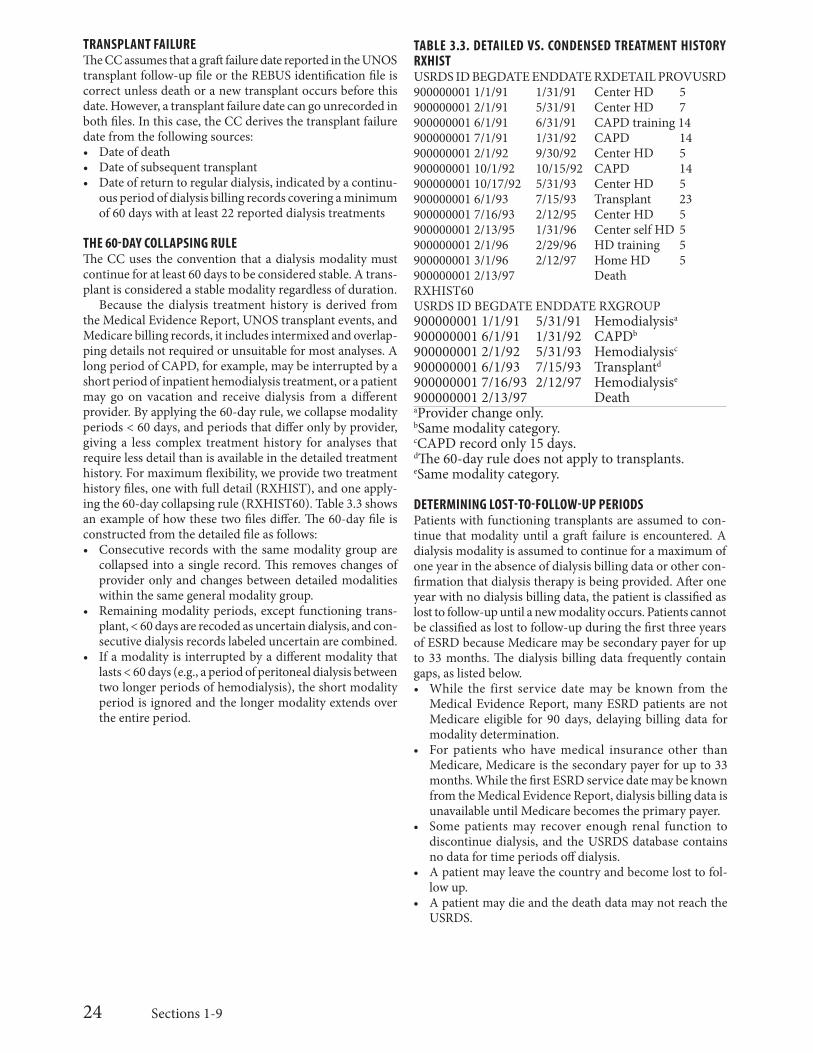
Because the dialysis treatment history is derived from the Medical Evidence Report, UNOS transplant events, and Medicare billing records, it includes intermixed and overlap-ping details not required or unsuitable for most analyses. A long period of CAPD, for example, may be interrupted by a short period of inpatient hemodialysis treatment, or a patient may go on vacation and receive dialysis from a different provider. By applying the 60-day rule, we collapse modality periods < 60 days, and periods that differ only by provider, giving a less complex treatment history for analyses that require less detail than is available in the detailed treatment history. For maximum flexibility, we provide two treatment history files, one with full detail (RXHIST), and one apply-ing the 60-day collapsing rule (RXHIST60). Table 3.3 shows an example of how these two files differ. The 60-day file is constructed from the detailed file as follows: • Consecutive records with the same modality group are
collapsed into a single record. This removes changes of provider only and changes between detailed modalities within the same general modality group.
• Remaining modality periods, except functioning trans-plant, < 60 days are recoded as uncertain dialysis, and con-secutive dialysis records labeled uncertain are combined.
• If a modality is interrupted by a different modality that lasts < 60 days (e.g., a period of peritoneal dialysis between two longer periods of hemodialysis), the short modality period is ignored and the longer modality extends over the entire period.
TABLE 3.3. DETAILED VS. CONDENSED TREATMENT HISTORY RXHISTUSRDS ID BEGDATE ENDDATE RXDETAIL PROVUSRD900000001 1/1/91 1/31/91 Center HD 5900000001 2/1/91 5/31/91 Center HD 7900000001 6/1/91 6/31/91 CAPD training 14900000001 7/1/91 1/31/92 CAPD 14900000001 2/1/92 9/30/92 Center HD 5900000001 10/1/92 10/15/92 CAPD 14900000001 10/17/92 5/31/93 Center HD 5900000001 6/1/93 7/15/93 Transplant 23900000001 7/16/93 2/12/95 Center HD 5900000001 2/13/95 1/31/96 Center self HD 5900000001 2/1/96 2/29/96 HD training 5900000001 3/1/96 2/12/97 Home HD 5900000001 2/13/97 DeathRXHIST60USRDS ID BEGDATE ENDDATE RXGROUP900000001 1/1/91 5/31/91 Hemodialysisa
900000001 6/1/91 1/31/92 CAPDb
900000001 2/1/92 5/31/93 Hemodialysisc
900000001 6/1/93 7/15/93 Transplantd
900000001 7/16/93 2/12/97 Hemodialysise
900000001 2/13/97 DeathaProvider change only.bSame modality category.cCAPD record only 15 days.dThe 60-day rule does not apply to transplants.eSame modality category.
DETERMINING LOST-TO-FOLLOW-UP PERIODSPatients with functioning transplants are assumed to con-tinue that modality until a graft failure is encountered. A dialysis modality is assumed to continue for a maximum of one year in the absence of dialysis billing data or other con-firmation that dialysis therapy is being provided. After one year with no dialysis billing data, the patient is classified as lost to follow-up until a new modality occurs. Patients cannot be classified as lost to follow-up during the first three years of ESRD because Medicare may be secondary payer for up to 33 months. The dialysis billing data frequently contain gaps, as listed below.• While the first service date may be known from the
Medical Evidence Report, many ESRD patients are not Medicare eligible for 90 days, delaying billing data for modality determination.
• For patients who have medical insurance other than Medicare, Medicare is the secondary payer for up to 33 months. While the first ESRD service date may be known from the Medical Evidence Report, dialysis billing data is unavailable until Medicare becomes the primary payer.
• Some patients may recover enough renal function to discontinue dialysis, and the USRDS database contains no data for time periods off dialysis.
• A patient may leave the country and become lost to fol-low up.
• A patient may die and the death data may not reach the USRDS.
252010 USRDS Researcher’s Guide
• Self-dialysis treatments are billed by two methods, one of which may not be captured by the CMS PMMIS/REBUS system, causing some home dialysis billing to be missed.
• Some dialysis bills for patients enrolled in Managed Care Organizations may be missed by the CMS billing system.
• Reporting, data entry, and clerical errors may obscure the first service date; for example, first-ever dialysis, not the start of maintenance dialysis, may be reported on the Medical Evidence Report.
• Errors in beneficiary identification may cause data for a single patient to be split between two patients or to be associated with the wrong patient.
DEFINING HOME HEMODIALYSIS PATIENTSThe 2006 ADR instituted an improved method for defining home hemodialysis patients. Previously, modality event data were taken from the SIMS event file only in the case of a gap or missing data in the USRDS Modality Sequence (i.e., Treatment History), which was constructed primarily from Medicare billing data and the REMIS database. However, after applying a series of systematic validation rounds to the SIMS database and examining the root causes of persistent under-counting of home hemodialysis patients, the CC concluded that SIMS event data should play a more promi-nent role. Thus, for the 2006 ADR, the CC incorporated all home hemodialysis events from SIMS data, with the billing data and the REMIS database, into the standard process of creating the final USRDS Modality Sequence. Subsequently, counts of incident and prevalent home hemodialysis patients rose substantially for all years reported in the 2006 ADR. In the event of data discrepancies, researchers should use home hemodialysis counts from the 2006 or later ADR.
SECTION 4 · PAYER HISTORYThe payer history file is similar to the treatment history file. CMS payer information is used to create a continuous sequen-tial history of payers for each patient in the ESRD database, beginning with the first ESRD service date. Each patient’s FSD in the payer history file is the same date reported in the treatment history file.
DATA SOURCESThe payer for any given time period is determined by evalu-ating several data sources. The CMS Enrollment DataBase (EDB) is used to determine Part A, Part B, Group Health Organization, MSP Primary Payer, Third Party Part A, and Third Party Part B payers. The CMS claims billing files provide dates of regular maintenance dialysis, used as an indicator of Medicare as primary payer. The “patients” file in the USRDS Core CD contains dates of death, used to help establish the end point of the payer sequence.
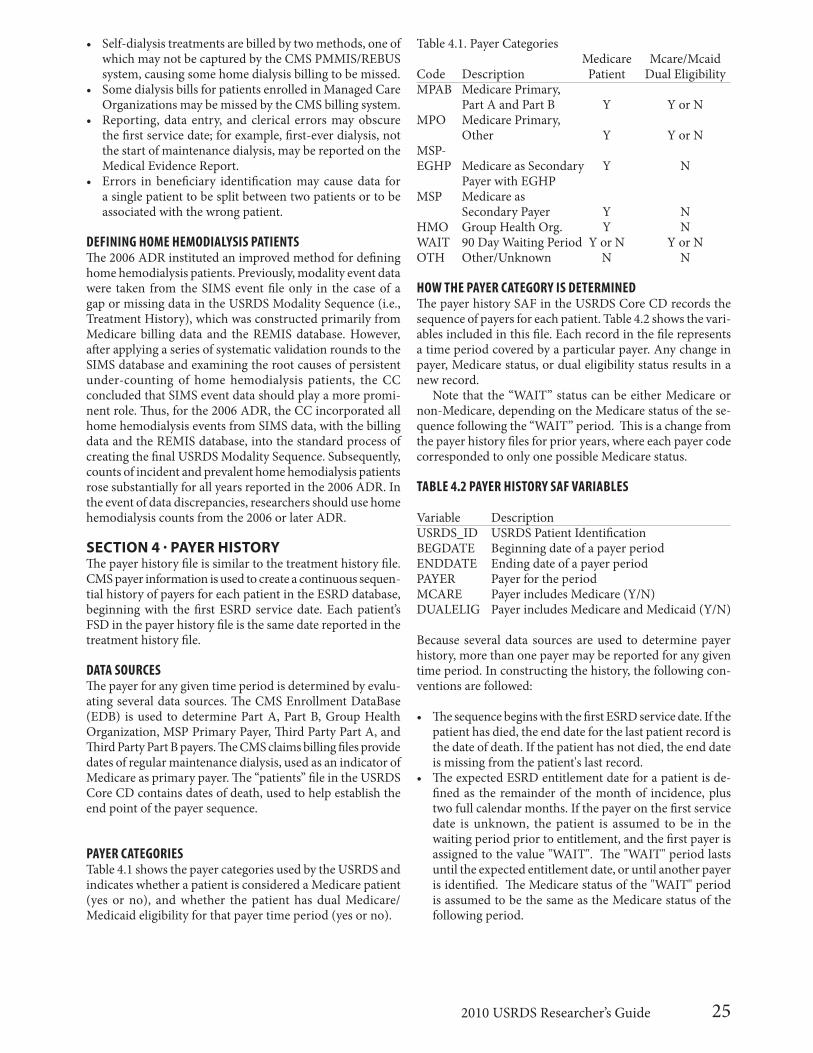
PAYER CATEGORIESTable 4.1 shows the payer categories used by the USRDS and indicates whether a patient is considered a Medicare patient (yes or no), and whether the patient has dual Medicare/Medicaid eligibility for that payer time period (yes or no).
Table 4.1. Payer Categories Medicare Mcare/McaidCode Description Patient Dual Eligibility MPAB Medicare Primary, Part A and Part B Y Y or NMPO Medicare Primary, Other Y Y or NMSP-EGHP Medicare as Secondary Y N Payer with EGHPMSP Medicare as Secondary Payer Y NHMO Group Health Org. Y NWAIT 90 Day Waiting Period Y or N Y or NOTH Other/Unknown N N
HOW THE PAYER CATEGORY IS DETERMINEDThe payer history SAF in the USRDS Core CD records the sequence of payers for each patient. Table 4.2 shows the vari-ables included in this file. Each record in the file represents a time period covered by a particular payer. Any change in payer, Medicare status, or dual eligibility status results in a new record.
Note that the “WAIT” status can be either Medicare or non-Medicare, depending on the Medicare status of the se-quence following the “WAIT” period. This is a change from the payer history files for prior years, where each payer code corresponded to only one possible Medicare status.
TABLE 4.2 PAYER HISTORY SAF VARIABLES
Variable DescriptionUSRDS_ID USRDS Patient IdentificationBEGDATE Beginning date of a payer periodENDDATE Ending date of a payer periodPAYER Payer for the periodMCARE Payer includes Medicare (Y/N) DUALELIG Payer includes Medicare and Medicaid (Y/N)
Because several data sources are used to determine payer history, more than one payer may be reported for any given time period. In constructing the history, the following con-ventions are followed:
• The sequence begins with the first ESRD service date. If the patient has died, the end date for the last patient record is the date of death. If the patient has not died, the end date is missing from the patient's last record.
• The expected ESRD entitlement date for a patient is de-fined as the remainder of the month of incidence, plus two full calendar months. If the payer on the first service date is unknown, the patient is assumed to be in the waiting period prior to entitlement, and the first payer is assigned to the value "WAIT". The "WAIT" period lasts until the expected entitlement date, or until another payer is identified. The Medicare status of the "WAIT" period is assumed to be the same as the Medicare status of the following period.
26 Sections 1-9
• If the reported end date for a payer is missing in the data source, the payer is assumed to continue sharing respon-sibility through the date of death or through the period of available payer information, whichever comes first.
• If more than one payer is identified for a time period, precedence for assigning the payer for the sequence is as follows: HMO, Medicare Primary if indicated by the claims billing file, MSP, then Medicare Primary if indicated by the Enrollment Database. Note this is a change from prior years, where MSP was given precedence over other payers.
• If consecutive payer sequences have the same payer and dual eligibility status, they are collapsed into one time period, starting with the beginning date of the first and ending with the end date of the last.
• Unlike the treatment history file, the payer history file does not require a payer to continue for any specific time period to be considered stable. Therefore, all changes in payer are reported. At their discretion, users may apply additional rules to manage the payer history sequence.
GAPS IN THE PAYER HISTORYSome patient payer histories include gaps with Other/Un-known as payer between sequences with identified payers. This might occur for several reasons, similar to the explana-tions for gaps in the treatment history:
. • Some patients recover enough renal function to discon-
tinue dialysis and the USRDS database may contain no payer information for time periods off dialysis
• Successful transplant patients may not have payer informa-tion reported in the data sources because Medicare eligi-bility terminated after three years of a functioning graft.
• A patient may leave the country and become lost to follow-up.
• A patient may die and the death data may not reach the USRDS.
• CMS may not capture payer information.• Reporting, data entry, and clerical errors may obscure the
record of first service date and the corresponding payer.• Errors in patient identification may cause data for a
single patient to be split between two patients or to be associated with the wrong patient.
If a patient is alive but the last reported payer in the data sources ends on a date before the reported data extraction date, an additional payer sequence is created with Other/Unknown payer to extend the patient’s payer history. Thus, only patients who have died have end dates in their last payer sequences, and the last end date is the date of death.
Some patients have no identified payers at all. Their payer histories are represented in the file as one payer sequence, starting at first ESRD service date, with missing end date and Other/Unknown payer.
SECTION 5 · TRANSPLANT PROCESS AND OUTCOMESTransplant patients constitute a unique subset of the ESRD population and are often studied separately from dialysis patients. Researchers may wish to simply count the number of transplant events that meet certain criteria, or calculate transplant event rates and survival probabilities. Using the USRDS transplant data, researchers can obtain information on both transplant events, such as donor and recipient char-acteristics, and patient- and graft-related outcomes.
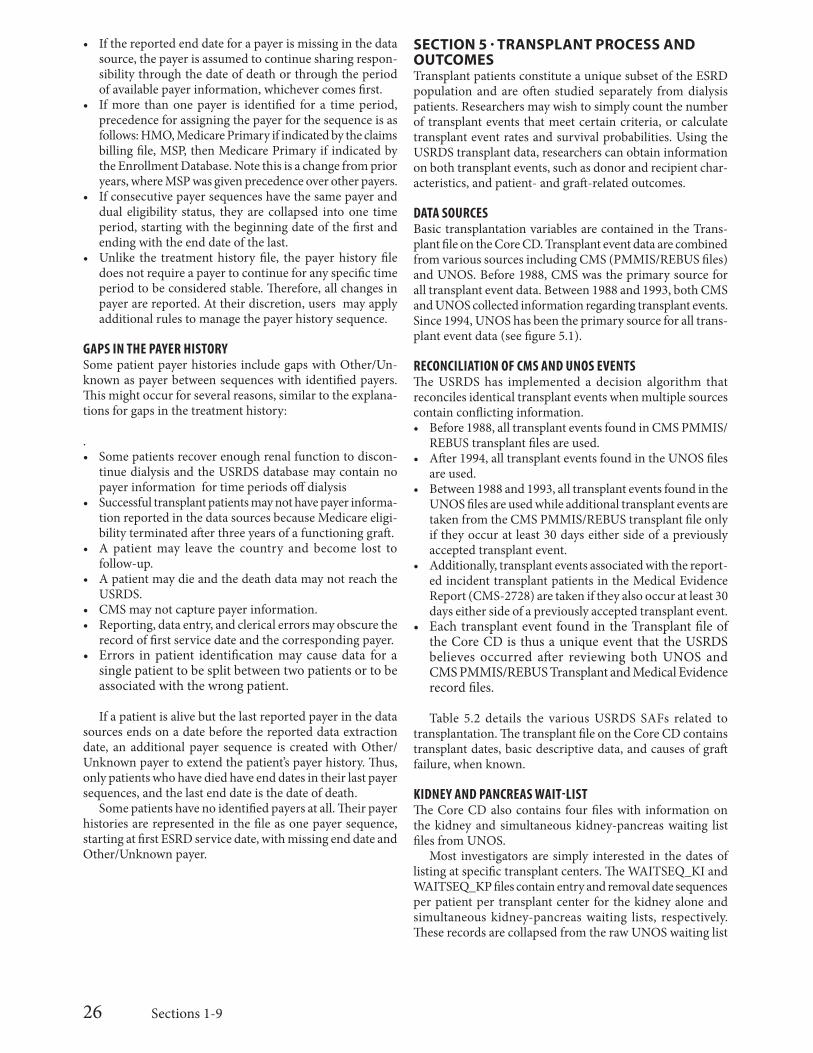
DATA SOURCESBasic transplantation variables are contained in the Trans-plant file on the Core CD. Transplant event data are combined from various sources including CMS (PMMIS/REBUS files) and UNOS. Before 1988, CMS was the primary source for all transplant event data. Between 1988 and 1993, both CMS and UNOS collected information regarding transplant events. Since 1994, UNOS has been the primary source for all trans-plant event data (see figure 5.1).
RECONCILIATION OF CMS AND UNOS EVENTSThe USRDS has implemented a decision algorithm that reconciles identical transplant events when multiple sources contain conflicting information.• Before 1988, all transplant events found in CMS PMMIS/
REBUS transplant files are used.• After 1994, all transplant events found in the UNOS files
are used.• Between 1988 and 1993, all transplant events found in the
UNOS files are used while additional transplant events are taken from the CMS PMMIS/REBUS transplant file only if they occur at least 30 days either side of a previously accepted transplant event.
• Additionally, transplant events associated with the report-ed incident transplant patients in the Medical Evidence Report (CMS-2728) are taken if they also occur at least 30 days either side of a previously accepted transplant event.
• Each transplant event found in the Transplant file of the Core CD is thus a unique event that the USRDS believes occurred after reviewing both UNOS and CMS PMMIS/REBUS Transplant and Medical Evidence record files.
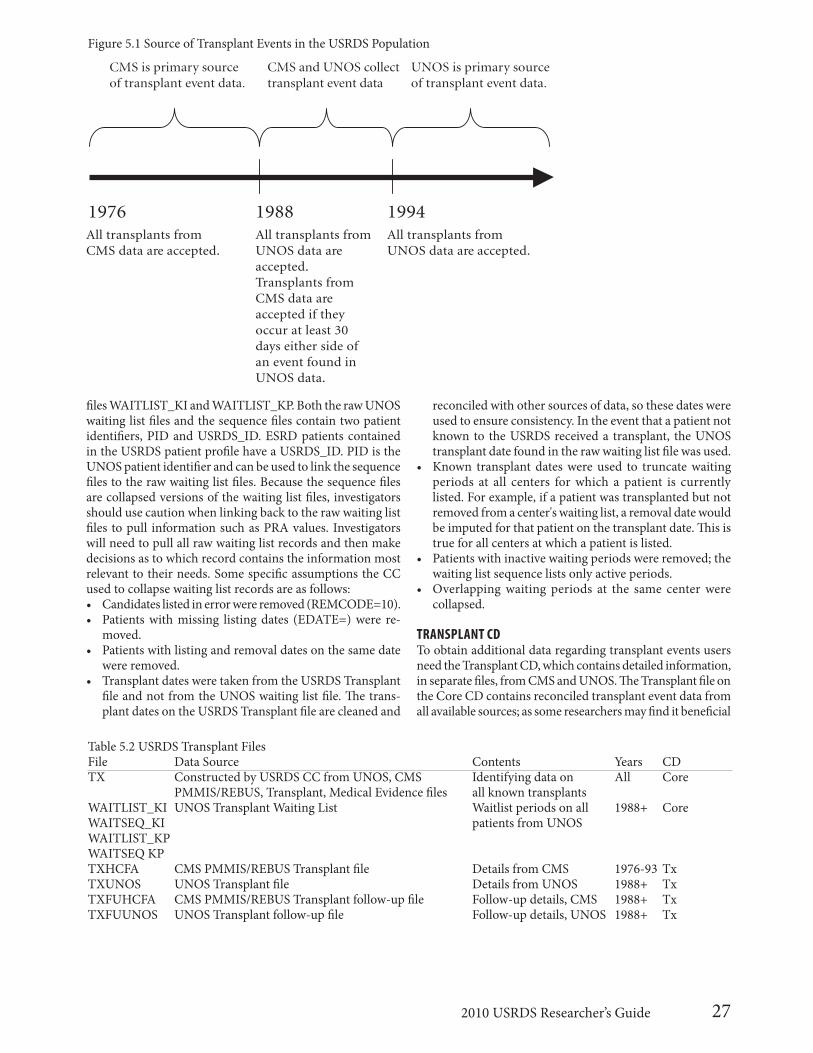
Table 5.2 details the various USRDS SAFs related to transplantation. The transplant file on the Core CD contains transplant dates, basic descriptive data, and causes of graft failure, when known.
KIDNEY AND PANCREAS WAIT-LISTThe Core CD also contains four files with information on the kidney and simultaneous kidney-pancreas waiting list files from UNOS.
Most investigators are simply interested in the dates of listing at specific transplant centers. The WAITSEQ_KI and WAITSEQ_KP files contain entry and removal date sequences per patient per transplant center for the kidney alone and simultaneous kidney-pancreas waiting lists, respectively. These records are collapsed from the raw UNOS waiting list
272010 USRDS Researcher’s Guide
files WAITLIST_KI and WAITLIST_KP. Both the raw UNOS waiting list files and the sequence files contain two patient identifiers, PID and USRDS_ID. ESRD patients contained in the USRDS patient profile have a USRDS_ID. PID is the UNOS patient identifier and can be used to link the sequence files to the raw waiting list files. Because the sequence files are collapsed versions of the waiting list files, investigators should use caution when linking back to the raw waiting list files to pull information such as PRA values. Investigators will need to pull all raw waiting list records and then make decisions as to which record contains the information most relevant to their needs. Some specific assumptions the CC used to collapse waiting list records are as follows:• Candidates listed in error were removed (REMCODE=10).• Patients with missing listing dates (EDATE=) were re-
moved.• Patients with listing and removal dates on the same date
were removed.• Transplant dates were taken from the USRDS Transplant
file and not from the UNOS waiting list file. The trans-plant dates on the USRDS Transplant file are cleaned and
reconciled with other sources of data, so these dates were used to ensure consistency. In the event that a patient not known to the USRDS received a transplant, the UNOS transplant date found in the raw waiting list file was used.
• Known transplant dates were used to truncate waiting periods at all centers for which a patient is currently listed. For example, if a patient was transplanted but not removed from a center's waiting list, a removal date would be imputed for that patient on the transplant date. This is true for all centers at which a patient is listed.
• Patients with inactive waiting periods were removed; the waiting list sequence lists only active periods.
• Overlapping waiting periods at the same center were collapsed.
TRANSPLANT CDTo obtain additional data regarding transplant events users need the Transplant CD, which contains detailed information, in separate files, from CMS and UNOS. The Transplant file on the Core CD contains reconciled transplant event data from all available sources; as some researchers may find it beneficial
Table 5.2 USRDS Transplant FilesFile Data Source Contents Years CDTX Constructed by USRDS CC from UNOS, CMS Identifying data on All Core PMMIS/REBUS, Transplant, Medical Evidence files all known transplantsWAITLIST_KI UNOS Transplant Waiting List Waitlist periods on all 1988+ CoreWAITSEQ_KI patients from UNOSWAITLIST_KPWAITSEQ KPTXHCFA CMS PMMIS/REBUS Transplant file Details from CMS 1976-93 TxTXUNOS UNOS Transplant file Details from UNOS 1988+ TxTXFUHCFA CMS PMMIS/REBUS Transplant follow-up file Follow-up details, CMS 1988+ TxTXFUUNOS UNOS Transplant follow-up file Follow-up details, UNOS 1988+ Tx
1976
CMS is primary source of transplant event data.
CMS and UNOS collect transplant event data
UNOS is primary source of transplant event data.
All transplants from CMS data are accepted.
1988 1994All transplants from UNOS data are accepted.Transplants from CMS data are accepted if they occur at least 30 days either side of an event found in UNOS data.
All transplants from UNOS data are accepted.
Figure 5.1 Source of Transplant Events in the USRDS Population
28 Sections 1-9
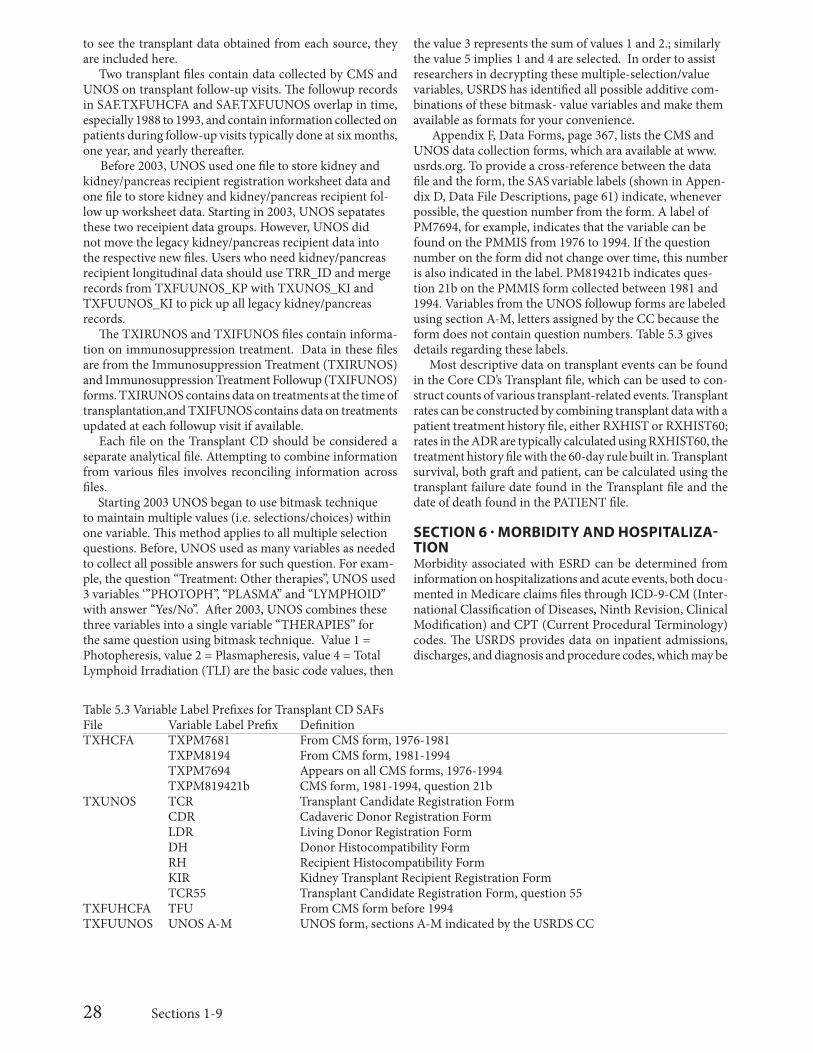
Table 5.3 Variable Label Prefixes for Transplant CD SAFsFile Variable Label Prefix DefinitionTXHCFA TXPM7681 From CMS form, 1976-1981 TXPM8194 From CMS form, 1981-1994 TXPM7694 Appears on all CMS forms, 1976-1994 TXPM819421b CMS form, 1981-1994, question 21bTXUNOS TCR Transplant Candidate Registration Form CDR Cadaveric Donor Registration Form LDR Living Donor Registration Form DH Donor Histocompatibility Form RH Recipient Histocompatibility Form KIR Kidney Transplant Recipient Registration Form TCR55 Transplant Candidate Registration Form, question 55TXFUHCFA TFU From CMS form before 1994TXFUUNOS UNOS A-M UNOS form, sections A-M indicated by the USRDS CC
to see the transplant data obtained from each source, they are included here.
Two transplant files contain data collected by CMS and UNOS on transplant follow-up visits. The followup records in SAF.TXFUHCFA and SAF.TXFUUNOS overlap in time, especially 1988 to 1993, and contain information collected on patients during follow-up visits typically done at six months, one year, and yearly thereafter.
Before 2003, UNOS used one file to store kidney and kidney/pancreas recipient registration worksheet data and one file to store kidney and kidney/pancreas recipient fol-low up worksheet data. Starting in 2003, UNOS sepatates these two receipient data groups. However, UNOS did not move the legacy kidney/pancreas recipient data into the respective new files. Users who need kidney/pancreas recipient longitudinal data should use TRR_ID and merge records from TXFUUNOS_KP with TXUNOS_KI and TXFUUNOS_KI to pick up all legacy kidney/pancreas records.
The TXIRUNOS and TXIFUNOS files contain informa-tion on immunosuppression treatment. Data in these files are from the Immunosuppression Treatment (TXIRUNOS) and Immunosuppression Treatment Followup (TXIFUNOS) forms. TXIRUNOS contains data on treatments at the time of transplantation,and TXIFUNOS contains data on treatments updated at each followup visit if available.
Each file on the Transplant CD should be considered a separate analytical file. Attempting to combine information from various files involves reconciling information across files. Starting 2003 UNOS began to use bitmask technique to maintain multiple values (i.e. selections/choices) within one variable. This method applies to all multiple selection questions. Before, UNOS used as many variables as needed to collect all possible answers for such question. For exam-ple, the question “Treatment: Other therapies”, UNOS used 3 variables ‘”PHOTOPH”, “PLASMA” and “LYMPHOID” with answer “Yes/No”. After 2003, UNOS combines these three variables into a single variable “THERAPIES” for the same question using bitmask technique. Value 1 = Photopheresis, value 2 = Plasmapheresis, value 4 = Total Lymphoid Irradiation (TLI) are the basic code values, then
the value 3 represents the sum of values 1 and 2.; similarly the value 5 implies 1 and 4 are selected. In order to assist researchers in decrypting these multiple-selection/value variables, USRDS has identified all possible additive com-binations of these bitmask- value variables and make them available as formats for your convenience. Appendix F, Data Forms, page 367, lists the CMS and UNOS data collection forms, which ara available at www.usrds.org. To provide a cross-reference between the data file and the form, the SAS variable labels (shown in Appen-dix D, Data File Descriptions, page 61) indicate, whenever possible, the question number from the form. A label of PM7694, for example, indicates that the variable can be found on the PMMIS from 1976 to 1994. If the question number on the form did not change over time, this number is also indicated in the label. PM819421b indicates ques-tion 21b on the PMMIS form collected between 1981 and 1994. Variables from the UNOS followup forms are labeled using section A-M, letters assigned by the CC because the form does not contain question numbers. Table 5.3 gives details regarding these labels.
Most descriptive data on transplant events can be found in the Core CD’s Transplant file, which can be used to con-struct counts of various transplant-related events. Transplant rates can be constructed by combining transplant data with a patient treatment history file, either RXHIST or RXHIST60; rates in the ADR are typically calculated using RXHIST60, the treatment history file with the 60-day rule built in. Transplant survival, both graft and patient, can be calculated using the transplant failure date found in the Transplant file and the date of death found in the PATIENT file.
SECTION 6 · MORBIDITY AND HOSPITALIZA-TIONMorbidity associated with ESRD can be determined from information on hospitalizations and acute events, both docu-mented in Medicare claims files through ICD-9-CM (Inter-national Classification of Diseases, Ninth Revision, Clinical Modification) and CPT (Current Procedural Terminology) codes. The USRDS provides data on inpatient admissions, discharges, and diagnosis and procedure codes, which may be
292010 USRDS Researcher’s Guide
used to produce different types of hospitalization rates, such as first hospitalization, total admission, and hospital day rates.
DATA SOURCESInpatient hospitalization data, a subset of the data in the Institutional Claims file, are included in the HOSP data file. These data originate from the Part A institutional inpatient claims data and are supplemented by the REBUS inpatient data, as hospitalizations may appear in both sources or in one but not the other. The patient treatment history file (RXHIST or RXHIST60) provides the patient modality treatment his-tory, which may be used to construct hospitalization rate data, while demographic data is obtained from the PATIENTS file.
CONTENTS OF THE HOSPITAL FILEA complete list of variables within the HOSP file can be found in Appendix D, Data File Descriptions page 174. The follow-ing list outlines some of the key variables:• HCFASAF: indicates the data source of the claim.• CLM_FROM: provides the from date of service, indicating
the admission date.• CLM_THRU: provides the through date of service, indi-
cating the date of discharge.• HSDIAG1-HSDIAG10: provide up to 10 ICD-9-CM
diagnosis codes.• HSSURG1-HSSURG10: provide up to 10 ICD-9-CM
procedure codes.• DRG_CD: provides diagnostic-related group (DRG)
codes, which categorize inpatient stays by ICD-9-CM diagnosis and procedure codes.
• PRIMDIAG: equals “YES” when HSDIAG1 provides the principal diagnosis code.
PREPARING INPATIENT CLAIMS DATA FOR USEData being prepared for analyses first need to be cleaned, with overlapping hospitalizations for the same patient combined into one. The principal diagnosis and procedure codes from the first of the two overlapping hospitalizations should be retained, with the combined hospitalization extending from the first admission date to the last discharge date.
To create a dataset to calculate rates for period prevalent patient cohorts, data for hospitalizations occurring during the selected year should be attached by patient UID to a period prevalent cohort file for the year. In this way, all patients in the file, including those with multiple hospitalizations and those with none, are included in the rate calculation. Data in which the 90-day rule has been used to define patient start dates should be used. The 90-day rule defines each patient’s start date as day 91 of ESRD, to avoid incomplete hospi-talization data from center hemodialysis patients younger than 65 and not disabled, who cannot bill Medicare until 90 days after their first ESRD service date. To calculate rates by patient characteristics, demographic data may be attached to the dataset by patient UID from the PATIENTS file.
Because hospitalization data are incomplete for non-Medi-care patients and patients classified as Medicare as secondary payer (MSP), it is best to exclude these patients and thereby limit their contribution of patient years at risk. One method of MSP patient exclusion used in the ADR hospitalization
rate calculation involves excluding dialysis patients who fail to reach a certain level of Medicare paid dialysis bills. Di-alysis patient start dates (January 1 of the year for prevalent patients and day 91 of ESRD for incident patients) must fall between start and end dates based on Medicare paid dialysis claims as follows:• Claims start date: the first day of the first month in which
there is at least $675 of Medicare paid dialysis claims.• Claims end date: the end of a three-month period in
which there is less than $675 of paid claims in each month.
If a patient’s start date does not fall between the claims start and end dates, he or she is excluded from the analysis for that year.
UNADJUSTED VS. STABILIZED HOSPITALIZATION RATESHospitalization rates may be computed as raw, unadjusted rates, or as model-based rates. While the calculation of raw rates is fairly straightforward, caution is needed when in-terpreting raw rates because they may be unstable for small patient groups. In the case of unstable raw rates, a pooled rate (comprising data from several combined years) or a model-based rate may be more appropriate.
Statistical modeling is used to produce stabilized rates, preventing instability of raw rates in groups with small sample sizes and few patient years at risk. Current USRDS methodology for computing total admission and hospital day rates uses a generalized linear model with log link and Poisson distribution. Calculation of raw rates is described below, and methods of calculating raw and model-based rates are described in further detail in Appendix C, Statistical Methods, page 55.
COMPUTATION OF UNADJUSTED RATES PER PATIENT- YEARUnadjusted first admission, total admission, and hospital day rates can be computed for period prevalent patients for selected years. For each year the unadjusted rates can be calculated as the total events divided by the total time at risk. These rates can also be pooled to increase stability, but follow-up is for single calendar year periods using cohorts of patients alive at the beginning of each year. The number of events and the number of years at risk for each event are computed separately for each year and summed over the pooled years; rates are then computed by dividing the total admissions or days by the total time at risk. Rates may be expressed per patient-year or per 1000 patient-years at risk.
For patients in the all-dialysis, hemodialysis, and perito-neal dialysis categories, the period at risk for all hospitaliza-tion analyses is from January 1 or day 91 of ESRD until the earliest of death, three days before transplant, or December 31. Modality change is considered a censoring event only in the case of a change from dialysis to transplant. For dialysis patients in the all-ESRD category, in contrast, the analysis pe-riod for hospitalization is censored only at death or December 31 of the year; modality change is not used as a censoring event. For transplant patients in the all-ESRD and transplant categories, the analysis period is censored at the earliest of death, three years following the transplant date, or December
30 Sections 1-9
31 of the year. The censoring of transplant patients at three years following the date of transplant is necessary because Medicare eligibility may be lost and hospitalization data may be incomplete for these patients.
In the case of a hospitalization that begins before January 1 or day 91 of ESRD and continues into the analysis year, the time at risk for first admission begins the day of discharge from this bridge hospitalization. Patients with bridge hospi-talizations that span the entire analysis period are excluded from the first admission rates.
Time at risk is calculated differently for length of stay and for total admissions. Because a hospitalized patient remains at risk for additional days in the hospital, rates for hospital days include hospital days in the time at risk. But because this currently hospitalized patient is not, however, at risk for additional admissions, hospital days for each year are sub-tracted from the time at risk for total admissions. In the case of hospitalizations in which admission occurs the same day as discharge, zero days are subtracted from the time at risk for total admissions. When bridge hospitalizations span the start of the analysis period, only the days within the period are subtracted from the time at risk for total admissions.
All admissions and hospital stay days that occur during the analysis period are included, respectively, in the total admissions and length of stay for each year. Admission for a hospitalization that occurs before and spans the start of the analysis period is excluded from the total admissions for that analysis period, and only the hospitalization days within the period are counted in the total days for length of stay rates. The minimum length of stay is one day; hospitalizations with admission and discharge on the same day and thosewith discharge the day after admission are counted as one day.
CAUSE-SPECIFIC UNADJUSTED RATES PER PATIENT- YEARCause-specific hospitalization rates may be computed bycounting only hospitalizations with selected principal ICD-9-CM diagnosis codes. In the denominator of the rate, the time at risk is computed similarly as described above for total admission rates. However, in the numerator, only hospitaliza-tions with specified principal diagnosis codes are counted in the total cause-specific admissions. For example, principal ICD-9-CM diagnosis codes of 480-486 and 487.0 can be used for pneumonia.
UNADJUSTED RATES PER PATIENTRates of hospital days and total admissions may also be calcu-lated per patient. For a selected year, the numerator remains the total number of events, and the denominator is the total number of period prevalent patients for the year. Rates per patient are susceptible to bias because they do not consider the actual length of time that a patient is at risk during the year. For example, a greater number of patients at risk for only a fraction of the year may produce smaller rates.
SECTION 7 · SURVIVAL AND MORTALITY Survival and mortality analyses are often used to compare outcomes among treatment modalities, age groups, or races, or to evaluate outcome trends over time. Results can
be reported for both incident and prevalent cohorts for the following groups: all-ESRD patients, all dialysis patients, all hemodialysis patients, all peritoneal dialysis patients, all transplant patients, or all ESRD patients aged 65 years and over. Primary analyses include unadjusted survival prob-abilities using the Kaplan-Meier method, adjusted survival probabilities using the Cox regression model, unadjusted death rates by cause of death, adjusted death rates, and ad-justed interval death rates.
DATA SOURCESThese survival and mortality analyses require patient demo-graphic information such as age, gender, race, primary cause of ESRD, death date, and cause of death, and treatment mo-dality history data, which can be obtained from the USRDS Core CD files PATIENTS and RXHIST or RXHIST60.
UNADJUSTED FIRST-YEAR SURVIVAL PROBABILITIES: INCIDENT PATIENTSFirst-year survival probability is the probability of surviving from day 91 after onset of ESRD to one year plus 90 days (days 91 to 455). This 90-day delay is necessary because many patients aged younger than 65 years do not become eligible for Medicare for up to 90 days, and their data may be incomplete for this period. The survival probability can be estimated for patient characteristics including age on the first ESRD service date, race, gender, and primary cause of ESRD. Age, race, and primary cause of ESRD can be broken down into groups as needed. The Kaplan-Meier method for calculating the unadjusted first-year survival probability is described in Appendix C, Statistical Methods, page 55.
ADJUSTED FIRST-YEAR SURVIVAL PROBABILITIES: INCIDENT PATIENTSThe adjusted first-year survival probability from day 91 can be estimated using the Cox regression model, and can be calculated for patient characteristics including age on the first ESRD service date, race, gender, and primary cause of ESRD. Age, race, and primary cause of ESRD can be broken down into groups as needed. To avoid excessive imprecision of the estimated survival probabilities due to small cell sizes, these probabilities can be calculated using aggregate categories for age, gender, race, and primary cause of ESRD, with a prob-ability calculated for groups defined by one of these variables adjusted for the remaining three. Overall probabilities for all patients can be adjusted for each of the four variables. The Cox regression model for calculating adjusted first-year survival probability is described in Appendix C, Statistical Methods, page 55.
ADJUSTED FIRST-YEAR DEATH RATES: INCIDENT HEMODIALYSIS COHORTSAdjusted first-year death rates for incident cohorts can be estimated using a Cox model. These death rates are presented using aggregate categories for age, gender, race, and primary cause of ESRD (diabetes, hypertension, glomerulonephritis, and other). A death rate estimated for one of these variables
312010 USRDS Researcher’s Guide
is adjusted for the remaining three; overall death rates for all patients are adjusted for each of the four variables. The method for calculating these death rates is also described in Appendix C, Statistical Methods, page 55.
UNADJUSTED DEATH RATES: PERIOD PREVALENT COHORTSPeriod prevalent cohorts include patients who are prevalent at a point in time (e.g. , January 1, 2007) and those who be-come incident during a time period (e.g., 2007). The cohort thus includes patients alive and on renal replacement therapy at the beginning of the year and whose first service date is at least 90 days before the beginning of the year. Incident cohorts are limited to patients who reach day 91 of ESRD treatment during the year. The follow-up time is begun on January 1, 2007 for prevalent patients and day 91 after the first ESRD service date for incident patients, and it is censored at transplant, death, or December 31 of the year. Because these calculations include only one year of followup, a prevalent patient surviving until the end of the year contributes one year at risk. Since the calculation for incident patients begins on day 91 of ESRD, most of these patients contribute less than one year; a full year is contributed only if day 91 of ESRD is January 1 and the patient survives until the end of the year.
For this cohort, deaths per 1000 patient-years at risk can be calculated using aggregate categories for age, gender, race, and primary cause of ESRD. The death rate for a specific primary cause of death is obtained by dividing the total deaths from the primary cause by total follow-up time. The sum of death rates for each specific cause is equal to the overall death rate of the cohort.
STABILIZED ANNUAL DEATH RATES FOR PREVALENT HEMODI-ALYSIS COHORTSA statistical model is needed to obtain stable annual death rates for prevalent patients in each aggregate category of age, gender, and primary cause of ESRD. The USRDS currently uses a generalized mixed model with log link and Poisson distribution, as described in the Statistical Methods section. When calculating death rates for the 2010 cohort, for ex-ample, we used 1998 to 2010 period prevalent patients— both prevalent and incident—to improve the stability of rates. The follow-up time started on January 1 for prevalent patients and on day 91 after the first ESRD service date for incident patients, and was censored at transplant, death, or December 31 of the year.
SECTION 8 · PROVIDERS The Facility SAF file is constructed from data supplied by the CMS Annual Facility Survey, the CDC National Surveillance of Dialysis-Associated Diseases, and the CMS Dialysis Facility Compare database. Information is for dialysis facilities only and the data are at the facility level; there are no individual patient-level data.
Construction of the Facility SAF file is accomplished by merging the CMS Annual Survey data with the CDC Na-tional Surveillance of Dialysis-Associated Diseases survey data by provider number and year. All provider numbers in
the Facility SAF file are assigned by the USRDS in an effort to ensure dialysis facility confidentiality; they are not the original provider numbers assigned by CMS.
Over time, dialysis facilities may be purchased and sold. Thus, a facility may have the same provider number for several years, be purchased by a different owner, and receive a new provider number. The physical facility and location may be the same, and staff may stay relativity intact, but the provider number has changed. Linking the two numbers is not possible. The Facility SAF file also contains some Veterans Administration providers.
Researchers who wish to conduct patient-level studies incorporating the Facility SAF file can link patient informa-tion from the Detailed Treatment History SAF file (RXHIST), the Condensed Treatment History SAF file (RXHIST60), or other SAF files that have an associated dialysis provider, to the Facility SAF file via the USRDS provider number and year.The Facility SAF file contains over 100 provider character-istics, including: • Transplant counts • Self-dialysis information• HD, IPD, CAPD, and CCPD patient counts• Number of in-center new dialysis patients at a facility• Kidney sources • Profit status, and hospital-based or freestanding status • Chain affiliation• Reuse practices
DATA SOURCESThe CMS Annual Facility Survey is obtained from the CMS End-Stage Renal Disease Public Use Files website. The CMS Dialysis Facility Compare data was received monthly from CMS until 2007; since then it has been obtained quarterly. The CDC National Surveillance of Dialysis-Associated Dis-eases survey was requested from the CDC annually through 2002. A list of the CMS and CDC Surveys can be found in Appendix F, Data Forms, page 271. The forms are available at www.usrds.org. As the last CDC National Surveillance survey occurred in 2002, all data for the CDC variables is missing after this date.
Provider Numbers Assigned by the USRDSEach provider has been assigned an identification number by CMS. To conceal provider identity, the USRDS converts this number to an anonymous number.Profit Status
The for-profit group consists of the facilities catego-rized on the CMS survey. They include individual-profit, partnership-profit, corporation-profit, or other-profit. The non-profit facilities are listed as individual-nonprofit, partnership-nonprofit, corporate-nonprofit, other-nonprofit, state-government non-federal, county-government non-fed-eral, city government non-federal, city/county-government non-federal, hospital district/authority government non-federal, other-government non-federal, Veterans Administra-tion Government Federal, Public Health Service Government Federal, military-government federal, or other-government federal.
32 Sections 1-9
The above 18 categories are designated by the variable TYPOWNER. The 2002 CMS Survey dropped this variable and it is missing in subsequent survey periods, starting with the 2004 SAF CDs. Profit status is now determined from CMS Dialysis Facility Compare data.Chain Affiliation
The USRDS definition of a chain is twenty or more facili-ties in two or more states owned by the same corporation. The number of chains can vary from year to year depending on the change of facility ownership and new facilities. The chain variable, CHAIN_ID, contains a value identifying the chain ownership of the facility. A blank value for CHAIN_ID indicates the facility has no chain affiliation. Table 8.1 shows chain affiliations and identification codes.Freestanding vs. Hospital-based Facility
A hospital-based dialysis facility is one associated with a hospital; it can be located in the hospital or at a remote loca-tion. Freestanding dialysis facilities operate independently of a hospital.
SECTION 9 · DISEASE-BASED COHORT (5% DM/CKD/CHF COHORT FINDER FILES) With the growing concern of various chronic diseases af-fecting the ESRD patients, the USRDS has constructed a set of disease-based finder files to help researchers gain a better understanding of causes and effects of these illnesses and their associations to morbidity and mortality in patients with ESRD.
DATA SOURCESTo create the DM/CHF/CKD cohort finder files by year, the CC uses 5% General Medicare Claims data (1992-2004) and ESRD patient demographic information. This informa-tion is available on the USRDS Core CD files “PATIENTS,” “MEDEVID,” “RXHIST,” and “RXHIST60.”
Each disease-based cohort finder file data set contains three basic data components, Patient Master File,Payer Sequence File, and a series of Co-Morbid Files. To illustrate the methodology used to ascertain patients with the specific disease of interest and the underlying data structure and file organization, below is a desscription of how the DM Cohort Finder File data set was created using the 5% General Medi-care Claims data. The CKD and CHF Cohort Finder Files are similar to the DM Finder File except they use different ICD-9 diagnosis codes for identifying their respective diseases.
Patient Master FileThe patients in this file had at least one DM ICD-9 diagnosis code (Table 9.1) identified in the 5% IP, OP, HH, HS, SNF, and PB SAFs, with one record per patient. The definitions of the two key variables DM_xx (patient’s one year entry period DM indicator) and DM_xxyy (two year entry period DM indicator) are defined as follows:
DM_xx = Y if a patient in year xx (e.g., DM_95 or DM_02)• was Part A and Part B entitled and not enrolled in an HMO
for the entire year (i.e., Payer_Seq_File);
• had any one DM ICD-9 diagnosis code from IP or HH or SNF, or any two DM ICD-9 diagnosis code combina-tions from PB or OP with different claim dates.
DM_xx = N otherwise.
DM_xxyy = Y if a patient in a two-year entry period (e.g., DM_9596, DM_9900, or DM_0102)• was Part A and Part B entitled and not enrolled in an HMO
for the entire two-year entry period (i.e., Payer_Seq_File),• was alive and did not develop ESRD as of December 31
of the two-year entry period, and• had any one DM ICD-9 diagnosis code from IP or
HH or SNF, or any two DM ICD-9 diagnosis code combinations from PB or OP with different claim dates identified at any time during the two year entry period (either in one of the two years or across the two years).
DM_xxyy = N otherwise.
Patients with DM_95 = Y are a subset of the patients from the 1995 co-morbid file (Co_Morbid_95) in the ‘Co-Morbid Files’ data set; patients with DM_9900 = Y are a subset of the patients from the 1999 and 2000 co-morbid files (Co_Mor-bid_99 and Co_Morbid_00) in the ‘Co-Morbid Files’ data set respectively.
Some patients in the Patient Master File may have all DM_xx = N and all DM_xxyy = N. This implies that these patients had at least one DM ICD-9 diagnosis code identified in the 1992 to 2004 5% IP, OP, HH, HS, SNF and PB SAFs but did not meet the one-year entry period and two-year entry period DM eligibility criteria described above.
Each patient is identified by two patient identification numbers. One is FIVEP_ID, a unique patient ID in the 5% sample population and the primary linking key within the USRDS DM Cohort Finder data set. Each year new FIVEP_ID numbers are generated only for the new patients added to the 5% sample. All existing patients (repeated patients) continue to be referenced with their previously assigned numbers. A second patient identification number, USRDS_ID, is the unique ID in the USRDS database system for identifying ESRD patients. Only patients with ESRD are assigned a valid USRDS_ID number. FIVEP_ID and USRDS_ID are not related.
Payer Sequence FileThis file was created from the 5% Medicare denominator files and the IP, OP, HH, HS, SNF and PB SAFs. The file contains Medicare coverage information for those 5% patients who had at least one DM ICD-9 diagnosis code identified through the 5% IP, OP, HH, HS, SNF and PB SAFs. A patient might have one or many sequence records in which each record indicates a different insurance coverage within a well-defined time period. There are five unique insurance types: • A - Entitled with Part A only• B - Entitled with Part B only• AB - Entitled with Part A and Part B• H - Enrolled in a Medicare HMO health plan• N - Non-Medicare
332010 USRDS Researcher’s Guide
The first record contains the earliest available date for coverage information in the 5% Medicare denominator files. The last record contains the last known availabe date (i.e., the most recent) for coverage information in the 5% Medicare denominator files. FIVEP_ID is the primary patient identi-fication number.
Co-Morbid FilesThe co-morbid files are constructed from the 5% Medicare IP, OP, HH, HS, SNF and PB SAFs and named individually by the respective calendar years. Each file is a collection of all patients whose diabetes disease diagnosis was identified from the 5% Medicare IP, OP, HH, HS, SNF and PB SAFs within that specific year (i.e., Co_Morbid_95 contains all patients with their DM co-morbid events captured from the 1995 5% Medicare Claims SAFs). However, the patients did not necessarily have to be entitled to Parts A and B and not be enrolled in an HMO for that entire year. A patient might have one or many records within a calendar year in which each record depicts one unique DM disease event. Records are considered duplicates if they are extracted from the same type of claim file with same ICD-9 diagnosis code on the same date. These files do not include duplications. For example, each record in Co-Morbid_95 consists of one DM code per claim file per service date per unique patient in 1995. The combination of claim type, DM code, and service date for a patient establishes uniqueness in each co-morbid file. FIVEP_ID is the primary patient identification number.
SECTION 10 · COMPREHENSIVE DIALYSIS STUDY SAF FILES The Comprehensive Dialysis Study (CDS) is a study in which data on patient demographics, contact information, treatment, laboratory values, quality of life (QOL) survey interviews, and nutrition survey interviews were collected for U.S. dialysis patients starting treatment 2005-2007 at 335 randomly selected dialysis facilities. Patients were selected via a monthly REMIS/SIMS database custom extract process using the following criteria:• Incident dialysis patients (age >= 18) who had survived at least two months,•Nopriortransplantation,•Dialyzeatoneofthepre-determine335facilities
11,292 patients were selected over a period of two years. Of these, 1677 consented and participated in the surveys or had lab assay done. The CDS SAF files contain the data for these patients. Among these 1677 patients, 1279 participated in QOL-only survey; 364 participated in QOL and the nutrition
survey (231 with lab data, 133 without lab data); 34 patients did not participate in neither survey but have lab data.
SAF files for the CDS dataset consist of: CDS Patient fileThis file contains one record for each of the1677 patients. A patient record includes a unique identifier USRDS_ID (unique identifier used to cross reference to other USRDS SAF files), demographic data, and a patient category indicator (PAT_CAT_BL) which indicates patient’s baseline survey and lab participation status (QOL-only, QOL and nutrition w / Lab data, QOL and nutrition w/o Lab data, Lab data w/o survey).
CDS QOL Baseline fileThis f i le contains the Baseline QOL sur vey an-swer data and some derivat ive score data from Q O L o n l y a n d Q O L / Nu t r i t i o n p a r t i c i p a n t s .
CDS Food Baseline fileThis f i le contains the Basel ine Nutr it ion sur-vey answer data and data generated by “Block Di-etary Data System” on QOL/Nutrition participants.
CDS Lab fileT h i s f i l e c o nt a i n s u p t o 5 s e t s o f l a b d at a f rom a subs et of Q OL/Nutr it ion par t ic ipants .
34 Sections 1-9
CDS DictionaryThis file contains each CDS SAF file contents, variable’s format.