Researching Behavior-Based Safety: A Multi-Method Assessment and Evaluation 1. E. Scott Geller, Thomas E. Boyce, Joshua H. Williams, Charles B. Pettinger, Jason P.DePasquale, and Steve Clarke Abstract Behavior-based (BB) approaches to injury prevention have a number of advantages, including: a) they can be administered by individuals with minimal professional training; b) they can reach people in the setting where a problem occurs (e.g., community, school, workplace); and c) the leaders in these settings can be taught the BB techniques most likely to work under specific circumstances (Baer, Wolf, & Risley, 1968, 1987; Daniels, 1989; Geller, 1997). Research has also shown this approach to be cost effective, primarily because BB techniques are straightforward and relatively easy to administer, and because intervention progress can be readily assessed by indigenous personnel monitoring target behaviors (e.g., Daniels, 1989; Geller, 1996; Geller, Winett, & Everett, 1982; Rudd & Geller, 1985; Sulzer-Azaroff & De Santamaria, 1980). Introduction Behavior-based approaches to safety focus on systematically studying the effects of various interventions on target behaviors, first by defining the target behavior in a directly observable and recordable way, and second by observing and recording it in its natural setting. When a stable baseline measure of the frequency, rate, or duration of behavior is obtained, an intervention is implemented to change the behavior in beneficial directions. Interventions typically involve modifying or changing the antecedents and/or consequences of specified target behavior(s). To determine intervention effectiveness, the frequency, duration, or rate of the target behavior is recorded during and/or after the intervention and compared to baseline measures of behavior (Daniels, 1989; Geller, 1996,1997). Agents Agents 1a 1b 1c Agents Intervention Effectiveness, Intensity, and Cost per Individual Repeated Applications Number of Individuals Targeted by the Intervention Figure 1. The MIL hierarchy, differentiating repeated prevention interventions at the same effectiveness level and higher level prevention interventions that are progressively more influential at changing behavior. 1. In Proceedings of the 37 th Annual Professional Development Conference and Exposition (pp. 537- 559). Des Plaines, IL: American Society of Safety Engineers, 1998.
Transcript
Researching Behavior-Based Safety: A Multi-Method Assessment and Evaluation1.
E. Scott Geller, Thomas E. Boyce, Joshua H. Williams, Charles B. Pettinger, Jason P.DePasquale, and Steve Clarke
Abstract
Behavior-based (BB) approaches to injury prevention have a number of advantages, including: a) they can be administered by individuals with minimal professional training; b) they can reach people in the setting where a problem occurs (e.g., community, school, workplace); and c) the leaders in these settings can be taught the BB techniques most likely to work under specific circumstances (Baer, Wolf, & Risley, 1968, 1987; Daniels, 1989; Geller, 1997). Research has also shown this approach to be cost effective, primarily because BB techniques are straightforward and relatively easy to administer, and because intervention progress can be readily assessed by indigenous personnel monitoring target behaviors (e.g., Daniels, 1989; Geller, 1996; Geller, Winett, & Everett, 1982; Rudd & Geller, 1985; Sulzer-Azaroff & De Santamaria, 1980). Introduction Behavior-based approaches to safety focus on systematically studying the effects of various interventions on target behaviors, first by defining the target behavior in a directly observable and recordable way, and second by observing and recording it in its natural setting. When a stable baseline measure of the frequency, rate, or duration of behavior is obtained, an intervention is implemented to change the behavior in beneficial directions. Interventions typically involve modifying or changing the antecedents and/or consequences of specified target behavior(s). To determine intervention effectiveness, the frequency, duration, or rate of the target behavior is recorded during and/or after the intervention and compared to baseline measures of behavior (Daniels, 1989; Geller, 1996,1997).
Agents
Agents
1a
1b
1c
Agents
Intervention Effectiveness, Intensity, and Cost per Individual
Repeated Applications
Number of Individuals Targeted by the Intervention
Figure 1. The MIL hierarchy, differentiating repeated prevention interventions at the same effectiveness level and higher level prevention interventions that are progressively more influential at changing behavior.
1. In Proceedings of the 37th Annual Professional Development Conference and Exposition (pp. 537-559). Des Plaines, IL: American Society of Safety Engineers, 1998.
Intervention Effectiveness Theory A multiple intervention level (MIL) hierarchy. Over two decades of behavior change research at corporate and community sites has led to our development of the multiple intervention level (MIL) hierarchy depicted in Figure 1. We use this model to categorize behavior change approaches and evaluate the cost-effectiveness of successive intervention strategies to alter the behavioral patterns of large numbers of individuals (Geller, Berry, Ludwig, et al., 1990; Ludwig & Geller, 1991). The MIL hierarchy is characterized by dividing intervention strategies into multiple tiers or levels, each defined by certain dimensions of intervention effectiveness. At the first (bottom) level the interventions are least intrusive and target the maximum number of people. At this level, the intervention is designed to have maximum large-scale appeal and minimum individual-to-individual contact. Those individuals affected at a particular intervention level may benefit from repeated exposure to similar interventions (as booster sessions), but we assume most individuals uninfluenced by the first exposure to a particular intervention will be uninfluenced by repeated exposure to interventions at the same level of intrusiveness. Thus, these individuals require a higher-level (more involving) intervention. Successively higher intervention levels are more costly and intrusive, but they are needed for the "hard core" problem individuals. These problem persons are likely at greater risk for injury. Thus, a MIL approach to public health has critical implications for evaluating the cost-effectiveness of a BB safety program. The MIL model also suggests that individuals influenced at a particular level of the intervention hierarchy become potential intervention agents for the next level of intervention (cf. Katz & Lazarfeld, 1955). The current research explored ways to involve indigenous personnel in the implementation of successful intervention strategies. We also studied personality, lifestyle, and attitudinal characteristics of those individuals who volunteer to help implement a program to promote safety at work. Additionally, evaluation of the MIL model was the catalyst for the research targeting driving behaviors.
Study 1: Nationwide Survey on Behavior-Based Safety Safety professionals were solicited for input through a nationwide survey published in Industrial Safety and Hygiene News (ISHN), a monthly magazine for safety professionals with 62,000 company subscribers. The survey was designed to assess readers' knowledge and interest in BB safety, and to explore ideas for improving the communication and implementation of BB principles and procedures for reducing industrial injuries. The survey also allowed us to begin constructing a database of organizations currently active in BB safety efforts. A total of 162 completed surveys were returned to us by mail or fax. An appreciation of the BB approach was shown by 80% (n=129) of the respondents answering “yes” to the question “Do you believe behavior-based safety is a viable approach for reducing at-risk work behaviors and activities?” (Only 3% responded “no” to this question; the rest said they didn’t know). In addition, more participants responded “no” (48%) than “yes” (34%)
to the question, “Do you think a safety program should put more direct focus on attitudes than on behaviors?” This is interesting because it not only shows preference for a BB approach, it reflects a shift from the traditional educational approach to injury prevention. The astute reader will note, however, that the sample of surveys we analyzed was not random and was likely biased toward the BB approach. The survey was presented within the context of research aimed at discovering how to make the BB approach more effective. Thus, it’s likely most people who took the time to complete and return the survey were at least interested in this particular approach to industrial safety. In fact, several respondents asked specifically to be included in our sample of organizations to visit for an on-site evaluation of factors contributing to the impact of a BB safety process. Thus, compared to the average reader ISHN, those who answered the questions and returned our survey were probably more informed about BB safety and had higher confidence in the effectiveness of BB safety. Even with this positive bias, however, the survey revealed some misperceptions about BB safety which can limit its application for safety improvement. What is behavior-based safety? The first part of the survey asked respondents to give their impression of BB safety by checking all of the items they believe are true from a list of 16 possible characteristics. In general, the respondents’ selections indicated accurate knowledge of BB safety, but there were a few notable exceptions. The three items selected most often as representing BB safety were: 1) an intervention approach for increasing safe behavior (selected by 143 respondents); 2) an observation and feedback process (n=130); and 3) a tool for managing safety (n=114). Relatively fewer respondents considered other characteristics of BB safety to be relevant. Specifically, only 42 of the 162 respondents considered BB safety an approach useful for investigating injuries. Only 88 respondents (54%) felt BB safety is useful for evaluating safety achievement, and 99 respondents (61%) considered BB safety an intervention approach for decreasing at-risk behavior. It is likely that people have a rather narrow viewpoint regarding BB safety. This limited perspective is also reflected in numerous safety articles, sales pitches from safety consultants, and presentations at safety conferences. In fact, BB safety is much more than a tool for doing observation and feedback. It is actually “a general philosophy that can be applied to many aspects of safety management.” This general definition was actually the most accurate item on our survey checklist, and was checked by 71% of the respondents. Principle versus application. Most survey respondents were aware that BB safety focuses on positive consequences to influence behavior change, since only four individuals indicated that BB safety was “an approach focusing on the use of punishment to decrease unsafe behavior.” However, a different story emerged when the survey asked respondents to check which techniques were actually used in their plant “to influence safety-related behaviors in the workplace.”
Activators (or antecedent strategies) were most popular, with policies (n=149), posted safety signs (n=124), demonstrations (n=108), and lectures (n=102) leading the list. Goal-setting, feedback, and incentive/reward programs were used frequently, but more companies focused on outcome (“accidents or injuries”) rather than process (“safety-related behaviors or activities”) when setting goals (n=95 vs. 48), when giving group feedback (n=83 vs. 60), when giving individual feedback in coaching sessions (n=96 vs. 74), and when rewarding people for safety improvement (n=72 vs. 56). The absence of checks for many techniques was quite revealing, and inconsistent with an appreciation for BB safety principles. For example, the most cost-effective BB approaches to improve safety are BB goal-setting and feedback for individuals and groups, yet these intervention approaches were being used at less than half of the sites represented by the survey respondents. It was encouraging, however, that almost two-thirds of the sample (n=102) use safety steering committees to manage their safety programs. Only 15% (n=24) of the respondents indicated they monitor “percent safe behavior” to assess the success of their safety programs. The traditional outcome measures were most popular, with 77% (n=125) using OSHA recordables, 75% (n=122) using lost-time accidents, 42% (n=68) using total recordable injury rate, and 44% (n=66) using total recordable rate, including illness. Interestingly, slightly more respondents reported they use attitude or perception surveys (17%) than percent safe behaviors (15%). Implications. The responses of those who completed and returned our BB safety survey published in ISHN reflected appreciation for a BB approach to injury prevention, but they also demonstrated substantial misunderstanding and misapplication. A majority of respondents, for example, perceived BB safety as an observation and feedback tool rather than a general approach to improving the human dynamics of safety, relevant for ergonomics, injury analysis, and the design of incentive/reward programs. Even with substantial appreciation for BB observation and feedback as a way to increase safe behavior, relatively few respondents indicated use of a relevant metric for monitoring the success of a behavior-improvement process. Thus, while safety leaders are increasing their belief in the power of observation and feedback to improve behavior, companies are apparently slow to apply appropriate feedback measures to evaluate and improve their safety programs. This is likely not due to inconsistencies between people’s beliefs and behaviors, but rather to management system variables that prevent a paradigm shift from an outcome-based and reactive evaluation process to one focused on up-stream process activities that contribute to the prevention of workplace illnesses and injuries.
STUDY 2: WHAT FACTORS DISTINGUISH SUCCESSFUL FROM UNSUCCESSFUL BEHAVIOR-BASED SAFETY PROGRAMS?
It was originally proposed that ten companies reporting exemplary success implementing a BB safety process and ten companies reporting unsuccessful implementation of a BB
safety process be selected for site visits. We quickly found that distinguishing between an effective BB safety process and an ineffective BB safety process was not simple. The majority of organizations returning surveys reported a decrease in incident and injury rate. And companies with a poor safety record were not apt to volunteer for a safety visit. As an alternative approach, we decided to approach site visits with the perspective of identifying themes or patterns of factors related to success vs. failure. To date, we have conducted 14 of the 20 proposed site visits. During the site visits, the teams conduct one-on-one interviews and hold focus-group meetings to discuss reasons for program successes/failures, and to explore strategies for improving the long-term implementation of a BB safety process. A separate group meeting is held with members of the plant safety steering committee and with a random sample of hourly employees. The survey team also tours the facilities and records any visible signs of support for BB safety (such as slogans, posters, billboards, feedback charts, team meeting announce-ments, etc.). In sum, 26 focus groups have been conducted with a total of 245 employees (221 males, 24 females). The Safety Culture Survey with 171 items was also administered to all employees in participating organizations. The 20 different variables assessed by the Safety Culture Survey are depicted in Table 1 above. Prior research has shown that all of the variables in Table 1 influence industrial safety. Results obtained in the current research will uncover relations among these variables as they relate to aspects of the BB safety process. Survey data are currently being completed and returned, and are not yet analyzed. Results discussed here rely on information gathered during structured interviews and focus-group sessions conducted at 14 sites. Results from structured interview and focus groups. Site-visit interviews and focus groups have provided a wealth of relevant information. Qualitative data collected so far have enabled us to begin identifying patterns and trends within organizations visited.
Specifically, responses from employees have helped to uncover factors that appear to act as obstacles across organizations, as well as factors that facilitate a BB safety process.
Assertiveness Reactance Personal
Responsibility for Safety
Frequency of Positive Feedback Given
Belonging Self-Esteem
Trust in Management
Frequency of Negative Feedback Given
Impulsivity Self-Efficacy Trust in Peers Frequency
of Positive Feedback Received
Optimism
Management
Support for Safety
Perceptions of Safety
Training Received
Frequency of Negative Feedback Received
Personal Control
Peer Support
for Safety
Frequency of Observations Propensity to Actively Care
Table 1. Sub-Scales of the Safety Culture Survey
Employee perceptions of observation and feedback. One of the primary techniques used to change behavior in a BB safety process is observation and feedback. If an organization is new to BB safety, the observation and feedback process can be perceived as threatening to many of the employees. Indeed, one of the most frequently voiced concerns by employees is that such a procedure is implemented for identifying and punishing those individuals who do not wish to perform their jobs safely. In an attempt to alleviate some of these suspicions, many organizations make participation in their observation and feedback process voluntary. The assumption is that a voluntary process will be less threatening to employees. As the resistors see their fellow coworkers taking part without negative consequences, their own trust in the process grows and eventually they also volunteer. It is a common perception that those employees with the opportunity to choose whether or not to participate in the observation and feedback process would be more accepting and positive in their regard for the process in comparison to those employees without such a choice. A content analyses of the data collected during focus groups suggest this may not be the case. Specifically, during focus group sessions, one of the questions asked employees was how they felt about the observation and feedback processes. A total of 51 comments (31 positive and 20 negative) were recorded. Results indicate no more positive regard for observation and feedback in those organizations using a voluntary process (n=8) than those organizations using a mandatory process (n=5). Although not significant, the correlation between using voluntary observation processes and positive regard was -.28. (Positive regard was determined by subtracting the number of negative verbal responses from the number of positive verbal responses). Further analyses of specific responses gives additional insight into what employees like and dislike about using observation and feedback. The most frequent positive comments indicated a perception that observation and feedback is beneficial because it increases one’s awareness of safe and at-risk behaviors (n=10). In contrast, the most frequent negative comments dealt with employee perceptions that inappropriate or negative feedback is given too often (n=4). For observation and feedback methods to be successful, the feedback must focus on the positive. When questioned about the observation and feedback process, those employees who were most vocal against the process pointed to the frequency with which negative feedback was occurring (reflected in statements like “Inappropriate feedback is often given;” “I give permission to be observed, then I’m made to look bad;” “The observers are looking for negatives.”). Consequently, if employees use the observations as opportunities to criticize a fellow employee, the process will likely meet with substantial resistance. Management involvement. An additional issue encountered by organizations in the BB safety journey involves deciding the role management should play in the process. Is it beneficial for management to play a controlling role in the BB process, or should the
process be more bottom-up (employee driven)? Does management need to be involved in the training? Should management be allowed to perform behavioral observations of line workers? Should managers’ behaviors be observed? There were 25 responses obtained for the question regarding management involvement (12 positive, 10 negative, 3 other). A content analyses of the responses revealed that most employees from the organizations (n=8) visited had more positive than negative comments regarding management involvement in the BB process. It should be noted however, that these organizations stressed the importance of management's role as supportive rather than directive. In other words, management involvement was perceived as positive as long as it did not become overbearing. The overwhelming consensus was that the driving force behind the BB efforts should be found at the level of the hourly employees. With regard to direct management involvement in the process, reactions were mixed. Some employee groups suggested the more management was involved the better (as evidenced by the quote “They should to be involved because a team means everyone.”). Other employee groups felt direct management involvement was a bad idea (as reflected in the consensus comment “Less management involvement is better, support is good if direct involvement is minimal.”). Those groups that discussed management involvement as a factor that would inhibit BB safety pointed to issues of trust as crucial in determining their perceptions. Management involvement should follow successful efforts to build interpersonal trust. In sum, while all those interviewed agreed management support is a necessity, perceptions regarding degree of direct management involvement in the process were mixed. In deciding the role management will play in the process, an organization would do well to heed employee perceptions on this issue. If safety has traditionally been top-down (management driven) in a particular culture (as reflected in the slogan, “safety is a condition of employment”), then it may be most advantageous for that organization to initially keep management involvement to a minimum, at least initially. Safety steering committees. Several factor concerning the safety steering team were found to have influences on BB safety efforts. Effective safety efforts require careful selection and grooming of safety champions. Approaches used to determine committee membership vary greatly, from allowing anyone to volunteer to an extensive selection and interview process. The individuals who compose the BB safety steering committee play a critical role in the success or failure of the process. Because of the importance of this team, it is critical an organization be selective in determining committee membership. A committee which does not have the respect of its coworkers (reflected by comments like “People just want overtime;” “I don’t even know who is on it;” “They’re brown-nosers;” “Some of those committee members are the most unsafe workers we got. Does that make any sense?”) may experience more difficulties in getting employee
participation as compared to a committee that does command such respect (reflected by comments like “They are dedicated and try hard;” “The facilitators really help get things done.”). Due to the significance of the behavior-based steering committee, organizations would benefit from selecting employees who are viewed as leaders and are respected by the workers in their area. A total of 48 responses (13 positive, 25 negative, 10 other) have been recorded for the item asking employees about perceptions of the BB safety steering committee. A content analysis of these items revealed the positive comments mentioned most often indicate employees feel members on the committees’ are well-intentioned and serious about safety (n=5). The most common negative responses centered on perceptions that employees on the committees’ tend to be “out of touch” and spend too much time in meetings (n=6).
Key ingredients to BB safety success. In addition to issues discussed above, participants in all focus groups were asked to indicate factors they perceived necessary for an organization
to achieve success with BB safety. To date, 126 responses have been recorded. A content analysis of these responses has uncovered useful information for under-standing what employees are looking for in a BB safety program.
Category Most Frequent Items Frequency
Person-Based (n=49)
1. Trust 2. Proper Attitude 3. Knowledge of Process
10 4 3
Environment-Based (n=40)
1. Management Support 2. Accountability 3. Training
16 2 2
Behavior-Based (n=37)
1. Involvement 2. Communication 3. Looking out for
self/others
9 5 5
Table 2. Most Frequent Responses to Key Ingredients Question
Responses were categorized using a systems perspective of industrial safety. Specifically, it is argued that in order for one to fully understand levels of safety within an organization, one must be aware of behavior-based factors, person-based factors, and environment-based factors. These three factors are dynamic and interrelated, so as one changes so do the others (Bandura 1977, 1997). A graphical representation of a systems perspective to injury prevention, commonly referred to as the Safety Triad (Geller, 1996), is given in Figure 2. Using a systems perspective, all responses recorded during focus groups were categorized as either a behavior-based, person-based, or an environment-based key ingredient for BB safety. The classification of each response was performed by two subject-matter experts who reached consensus on each item.
Results of the analysis revealed a majority of BB key ingredients focused on person-based factors (49). The next highest number of responses were classified as environment based factors (40). And the fewest number of responses were classified as behavior-based (37). Individual responses were examined within each of the factors to determine which were most common. The most common responses for each of the system factors are displayed in Table 2.
Biggest obstacles to BB safety success. The analyses performed for key ingredients to BB safety success were repeated for obstacles experienced. The same person-behavior-environment classification scheme was used. At present, 101 responses have been recorded.
Category Most Frequent Items
Frequency 1. Lack of Resources 2. Previous Failed Programs 3. Paperwork
14 7 Environment-Based
(n=55) 5
Results of the analysis revealed the majority of BB obstacles manifested in the environment-based factors (55). The next highest number of responses were classified as person-based factors (33). And the fewest number of responses were classified as behavior-based responses (13). The most common responses for each of the system factors are displayed in Table 3.
Person-Based (n=33)
1. Lack of Trust 2. Poor Attitudes 3. Lack of Buy-In
7 4 4
Behavior-Based (n=13)
1. Lack of Communication 2. Lack of Participation
2 2
Table 3. Most Frequent Responses to Biggest Obstacles Question
Study 3: Applications of Stategies to Increase Safe Driving: A Systematic Evaluation
of Intervention Effectivenss After a Decade of Culture Change Despite mandatory belt-use laws (BULs) and engineering strategies designed to protect vehicle occupants, many motorists still refuse to use the devices provided to safeguard them. This study had three primary objectives: a) to investigate the use of safety belts among industry workers after a decade of culture change, influenced in part by a mandatory BUL, b) to test the impact of several common behavior change techniques on the safe driving behaviors of industry employees, and c) to study generalization between changes in safety-belt use and the use of turn signals. Our recent observations of employees revealed remarkable increases in baseline safety-belt use from 1982, and a significant difference in mean belt use among wage (46%, n= 2,897 observations) and salary (65%, n= 1,744 observations) workers. More than a decade earlier, Geller, Davis, and Spicer (1983) found that during baseline, mean use of safety-belts among industry workers at the same plant was only 3.4% for wage workers and 17.4% for salary employees. At that time, an incentive program increased mean belt use more effectively among salary (50.6%) than wage (5.5%) employees.
Since the 1982 research, Virginia has instituted a mandatory BUL. The state average of safety-belt use remains near 70% which approximates the national average of 67% (Novack, 1995). The current study describes a systematic effort to increase safety-belt use among workers not influenced by Virginia's BUL. Subjects and Setting. Subjects consisted of 556 hourly and salary employees at an engine bearing manufacturing plant in southwest Virginia. The population of employees ranged in age from 19 to 63 years, and employee tenure at the facility ranged from six months to more than 25 years. The proportion of hourly to salary workers was approximately five to one. Procedure. Trained research assistants sat in two distinct parking lots of the facility during the first shift arrival, second shift arrival/first shift departure times for hourly workers, and at the arrival and departure time for salary employees during the regular work week. A minimum of three data collection times was scheduled at each lot every weekday. Observers collected data on driver gender, safety-belt use, turn-signal use, complete stops at a parking-lot stop sign, the presence or absence of traffic, and whether the targeted vehicle was entering or leaving the parking lot. Information on weather conditions (e.g., clear or rain, etc.) and road conditions (e.g., dry or wet, etc.) and the time of day were indicated on the data sheet. To assess inter-observer reliability, a second independent observer collected data with the primary observer on 30 percent of all observation sessions. As it was impossible to record data on every vehicle entering or leaving the parking lots, the primary observer identified vehicles to observe by calling out their make and color (e.g. the red pick-up) as they passed an obvious stationary landmark. Interobserver reliability exceeded 90% for all measures collected. Design and intervention techniques. Over the course of two years and after four weeks of baseline observations, a series of progressively more invasive interventions was implemented at the facility to test the validity of the MIL model. Interventions in sequential order consisted of written prompts for the hourly workers, written prompts for the salary workers, plant-wide written prompts, an employee safety-slogan contest and celebration, assigned goals, assigned goals with performance feedback, and a pledge-card commitment. Detailed descriptions of each respective intervention appear below. 1. Written prompt: This intervention consisted of a flyer displaying the logo of the industry and a message selected by a safety steering committee of wage workers which read: “We Buckle-Up Because Safety is Not Only for the Workplace.” These flyers were first attached to the paychecks of all wage employees and two weeks later all salary employees. After the initial attempts to prompt salary and wage employees separately, the same prompt was displayed plant-wide on table tents in the workers’ cafeteria, in bathrooms above hand dryers, and on doors located in strategic places throughout the plant. (Interventions B, C, and D respectively in Figures 3 and 4)
2. Plant-wide safety slogan and safety celebrations: A celebration announcing the winner of a plantwide safety slogan contest was scheduled near the Christmas Holidays during the first year of the research. This celebration consisted of rewarding the winner with a $50 gift certificate to a store of their choice. When the research team learned of this event, Vince and Larry (the famous Crash Test Dummies) made an appearance at the plant during the scheduled celebration to distribute posters featuring two prominent Virginia Tech football players encouraging safety-belt use. The event occurred between workshifts one and two to increase involvement, and included refreshments and photograph sessions with the dummies. (Intervention E in Figures 3 and 4) 3. Assigned goal-setting: This intervention involved setting a specific, difficult, but attainable goal for plant-wide safety-belt use. Feedback about the current amount of safety-belt use among employees was not provided. Flyers displaying the plant logo, winning safety slogan (“Bearings in Mind, Safety First!”), and set goal were posted on table tents in the workers’ cafeteria, in bathrooms above hand dryers, and on doors located in strategic places throughout the plant. These flyers were inspected weekly by research assistants and the plant safety manager for damage, and loss. Damaged and missing flyers were replaced throughout the goal-setting intervention. The goal was set at 80%, approximately 25% above their current rate of belt use. It met the criteria for effective assigned goals in that it was specific and difficult, but achievable. (Intervention F in Figures 3 and 4) Goal-setting plus feedback: This intervention was identical to the goal-setting intervention described above with one noteworthy exception --feedback in written and graphical form on the plant-wide safety-belt use from the previous week was included on the flyer. This feedback was updated weekly, and new flyers were posted during first shift each Monday. As a result of an employee suggestion, after an initial period of feedback, the flyers were done in bright colors which were changed weekly to attract attention. (Intervention G in Figures 3 and 4) 5. Pledge-card commitment: This intervention consisted of written pledge-cards distributed to all employees with their paychecks. The voluntary pledge encouraged safety-belt use for a two week period. The pledge cards contained the company logo, the winning safety slogan and a formal statement promising the use of safety-belts throughout the pledge period. The pledge also contained a location for the employees to sign, and a box they could check if they would allow their pledge to be posted in the plant. Pledges indicating posting (n = 200, 82% of the signed pledges) were laminated on a 4 foot by 4 foot poster-board and posted on the plant safety bulletin board after the second week of the pledge period. Blank pledge-cards were distributed next to the signed pledges and labeled “Second-Chance Pledges.” This was done to encourage workers who had not initially pledged to do so. The initial pledge period was extended an additional two weeks. New pledges (n = 31) were posted (with approval) at the time they were signed. The flyers displaying the safety-belt use goal and performance feedback were posted as described above throughout the pledge period. (Interventions H and I respectively in Figures 3 and 4)
6. Return to baseline: Each return to baseline was marked by removal of all intervention materials. Trained research assistants continued their observations as usual during baseline periods. (Represented by A in Figures 3 and 4)
Safety-belt use. Figures 3 and 4 display the weekly percent of safety-belt and turn-signal use respectively for all employees throughout
the research. Vertical lines indicate the introduction of a new intervention or return to baseline as described above. Horizontal lines represent the mean percent safe for each specific phase of the research. The number of observations per phase are indicated above each intervention condition. A visual inspection of the data indicate some surprising results. Most noteworthy are the lack of significant increases in safety-belt use, the target behavior, as interventions became more intrusive. Of particular interest is the lack of impact resulting from the addition of performance feedback to the initial goal-setting intervention. Previous research (e.g. Sulzer-Azaroff, Loafman, Merante, & Hlavacek, 1990) suggest that timely feedback would have an additive effect with goal-setting done alone. The absence of this effect may have resulted from the failure of the initial goal-setting strategy to influence safety-belt use (54% n = 6604 observations) significantly above the baseline mean (52%, n = 1235). A closer look at the data indicate that the most powerful intervention to date was the employee selected safety slogan contest and celebration. This intervention resulted in an immediate increase in safety-belt use for six weeks to 57% (n = 337) and a longer-term maintenance of 58% (n =1266) during a subsequent six-week return to baseline. These increases resulted after three attempts to prompt the use of safety belts resulted in a decrease of safety-belt use to 47% (n = 637) during the plant-wide prompt condition. Intrinsic motivation theory would suggest that the
Safety Belt Use
0102030405060708090
100
0 10 20
Perc
ent S
afe
Safety Belt Use
30 40 50 60 70 80 90Consecutive Observation Weeks
B ED
n = 1235
n = 1266
n = 337
n = 635
n = 528
n = 1116
n = 9788
n = 6604
n = 1363
n = 1401 n =
632n = 387
n = 1161
A AC F G AIAH G(Interventions)
er duration of study. Figure 3. Percent safety-belt use ov
Turn Signal Use
0
10
20
30
40
50
60
70
80
90
100
0 10 20 30 40 50 60 70 80 90
Consecutive Observation Weeks
Perc
ent S
afe
Turn Signal Use
A AIAHGFAEDCB G
n = 139
n = 535
n = 1514
n = 685
n = 411
n = 1279
n = 10704
n = 6774
n = 1314
n = 366
n = 671
n = 981
n = 1466
(Interventions)
Figure 4. Percent turn-signal use over duration of study.
beneficial impact of the safety-slogan contest resulted because it was developed "in-house" as opposed to the other efforts which were imposed by "outside" researchers. Similarly, Boyce and Geller (1998) describe the powerful effects of using indigenous personnel on maintenance of safety-related behaviors in their conceptual review of the industrial safety literature. This intervention was also the only one associated with a monetary consequence for participation. Although not contingent on safety-belt use, employees participating in the contest may have felt the need to match their behavior to their thoughts about safety as a result of submitting a slogan. This result is consistent with the literature on cognitive dissonance (Festinger, 1957). It is particularly noteworthy that approximately 59% of the workers submitted a legitimate safety slogan. This level of participation matches the proportion of employees using their safety belts during this phase of the research. The modest increase in safety-belt use above baseline suggests that the contest may have influenced some safety-belt nonusers, but it is likely that the majority of the slogans were submitted by workers who already used their safety belts. The only intervention to date that has had similar effects was the pledge-card commitment campaign. Two-hundred and seventy-five (49%) of the workers signed the buckle-up pledge. This strategy increased safety-belt use to 61% (n = 1161) during the two week pledge period. An increase to 67% (n =387) was observed during a return to baseline, but upon posting the pledges publicly, use of safety-belts dropped to 57% (n = 632), the level obtained during the safety slogan contest. Like the voluntary slogan contest, the voluntary pledge technique provided employees with choice, and thus may have enhanced internal control as predicted by intrinsic motivation theory. It is noteworthy that safety-belt use decreased when pledge-cards were posted. It could be speculated that upon public posting (done by research personnel) some of the feelings of personal control and ownership established by the initial voluntary pledge was diminished, resulting in observed decreases of the target behavior. As of this writing, safety-belt use in a goal-setting plus feedback phase remains near 60% (n = 1363 observations), 10 percentage points higher than the initial baseline taken nearly two years ago. Turn-signal use. Although not targeted, turn-signal use was observed in general to decrease throughout the course of the research. During the initial phases of the study, turn-signal use covaried positively with safety-belt use, suggesting support for response generalization (RG) theory (Bandura, 1969; Carr, 1988). This theory proposes that some behaviors (e.g., safe-driving behaviors) are organized in a class of functionally-related responses. As a result, RG theory predicts an increase in one safe behavior will be accompanied by increases in other related safe behaviors. Firm conclusions cannot be drawn, however, because of the failure of the interventions to impact the target behavior, safety-belt use. A systematic relationship between turn-signal use and the use of safety-belts was lost after the first return to baseline. Visual inspection of the data indicates that turn-signal use did not differ markedly throughout the course of research from the baseline mean of 50% (n = 1190), but trended downward to its current level of 46% (n = 1301). Thus from the big picture, the trend upward in safety-belt use (10% over initial baseline) coupled
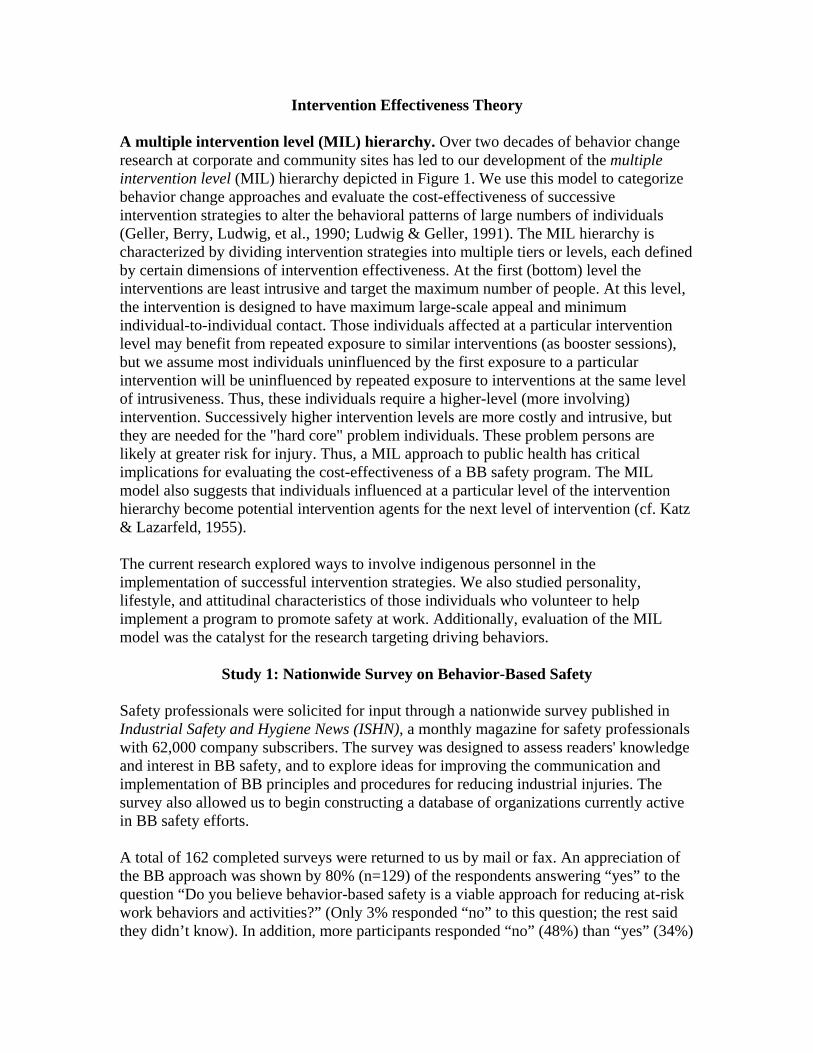
with the trend downward in turn-signal use (4% below baseline) would support risk compensation (RC) theory (Peltzman, 1975). That is, as people perceive themselves to be less at-risk in some situations, they will compensate by taking more risks in others. Conclusions. Overall, these data support the MIL model. That is, one could argue that the antecedent strategies used to motivate safety-belt use in the current research are all first level interventions, less powerful than Virginia’s BUL. As such it follows that the hard-core resistors, not influenced by the BUL, would not be impacted by repeated applications of lower level interventions. As suggested by the MIL, the modest improvements seen in the use of safety belts may have been in part due to the involvement of belt users as intervention agents to get some non-users to buckle-up. Modeling appropriate behavior has been shown to increase the likelihood of others emitting the desired response by: a) demonstrating the ease at which it can be done; b) making more salient the costs versus benefits of the target behavior; and c) changing cultural norms regarding the behavior.
Study 4: The Effects of Employee Involvement on Behavior-Based Safety This research evaluated intervention procedures commonly taught by industrial safety trainers and consultants as part of a BB safety process. More specifically, this research studied the effects of involving employees in the development and implementation of BB safety interventions as opposed to the typical top-down approach to occupational safety. Training BB safety. The BB safety process at a large manufacturing plant in southwest Virginia began by training volunteer safety facilitators from representative areas and then conducting facility-wide training sessions for the remaining employees (n=550). The format of the training sessions was manipulated in order to investigate the impact of employee participation during BB safety training. The materials for all sessions were held constant. However, the safety trainers in the Choice condition (n=230 on Shift 1) were instructed to ask questions and facilitate group discussion and involvement with workers. This included group exercises in which workers presented their suggestions for safety enhancement. In contrast, the same trainers in the Assigned conditions (n=246 on Shifts 2 and 3) presented the safety material in a lecture format without asking questions or
4.02
0.35 0.38
0
1
2
3
4
5
6
7
Ave
rage
Num
ber o
f Que
stio
ns A
nsw
ered
Shift 1 Shift 2 Shift 3
Number of Questions Answered by Shift
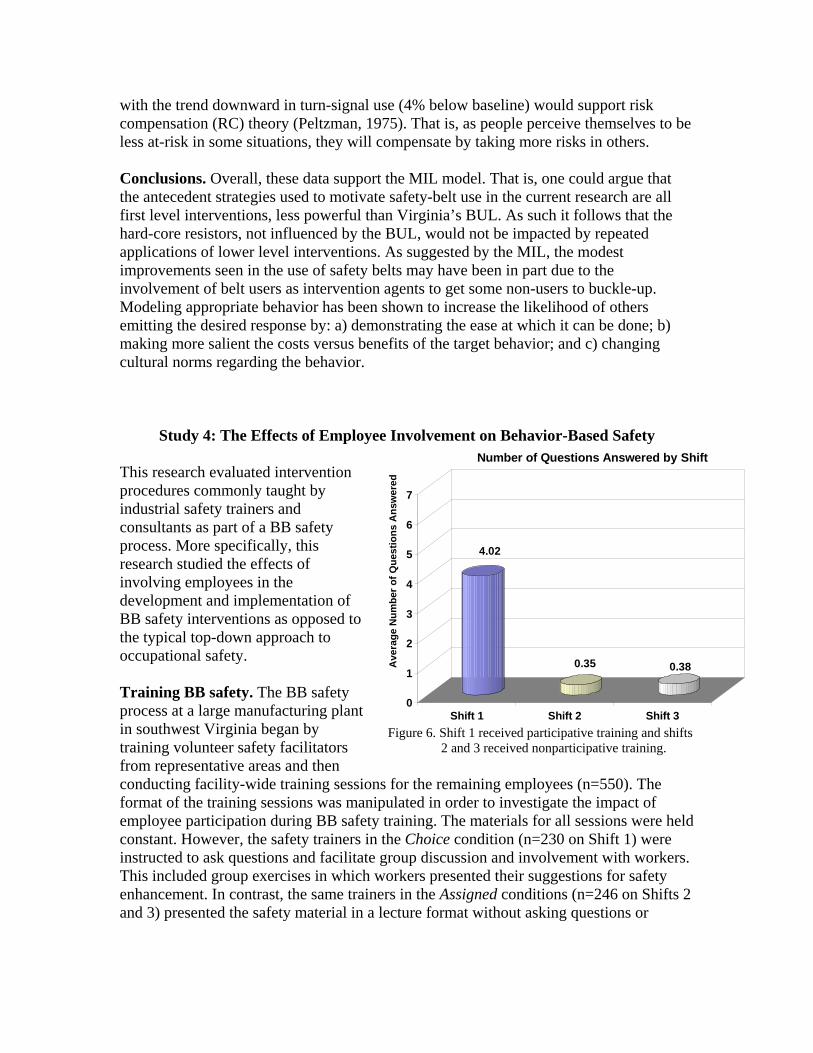
Figure 6. Shift 1 received participative training and shifts 2 and 3 received nonparticipative training.
facilitating workers’ input. Further, group exercises in this condition were “yoked” from the responses of the groups in the Choice condition (i.e., Shift 1).
Four-hour training sessions, presented by two trainers, were held for 12 Choice groups and 14 Assigned groups, ranging in size from 7 to 30 individuals. To assess the impact of the two training approaches, three variables were measured – – the amount of verbal participation directed at the trainers, participants’ reported satisfaction with the training, and the participants’ retention of safety training information.
6.48
0
1
2
3
4
5
6
7
Ave
rage
Num
ber o
f Ver
bal B
ehav
iors
1.09 1.19
All verbal behaviors from the participants, including questions
asked, questions answered, and reactive statements, were evaluated for each training session. As shown in Figure 5, a one-way analysis of variance (ANOVA) of verbal behavior for training format (Choice vs. Assigned) indicated that participants in the Choice condition emitted significantly more verbal behaviors (M = 6.48) than participants in the Assigned conditions (Shift 2: M = 1.09, Shift 3: M = 1.19, p < .05).
Shift 1 Shift 2 Shift 3
Number of Verbal Behaviors by Shift
Figure 5. Shift 1 received participative training and Shifts 2 and 3 received nonparticipative training.
Further analyses were conducted on each type of verbal response: questions answered, reactive statements, and questions asked. As shown in Figure 6, a one-way ANOVA of questions answered per Shift indicated that participants in the Choice condition answered significantly more questions (M = 4.02) than participants in the Assigned condition (Shift 2: M = .35, Shift 3: M = .38, p < .05). As illustrated in Figure 7, a one-way ANOVA of reactive statements per Shift indicated that participants in the Choice condition made significantly more reactive statements (M = 2.32) than participants in the Assigned conditions (Shift 2: M = .67, Shift 3: M = .73, p < .05). Additionally, a one-way ANOVA of questions asked per Shift indicated no significant difference in the average number of questions asked by participants in the Choice (M = .14) and Assigned conditions (Shift 2: M = .08, Shift 3: M = .08, p > .05). Overall, these findings suggest participants in the Choice condition were significantly more involved in the training process than employees in the Assigned condition, although there were no differences in number of questions from participants. Participants’ responses to the following post-training questionnaires were also evaluated: a) an 18-item knowledge test, b) a 5-item measure of involvement, and c) a 1-item measure of satisfaction with the training. As illustrated in Figure 8, a one-way ANOVA by Shift indicated no significant differences between the knowledge scores of participants 2.32
0.67 0.73
0
1
2
6
Ave
rage
Num
3
4
5
ber o
f Com
men
ts M
7
de
a
Shift 1 Shift 2 Shift 3
ber of Comments Made by Shift
Figure 7. Shift 1 received participative training and Shifts 2 and 3 received nonparticipative training.
Num
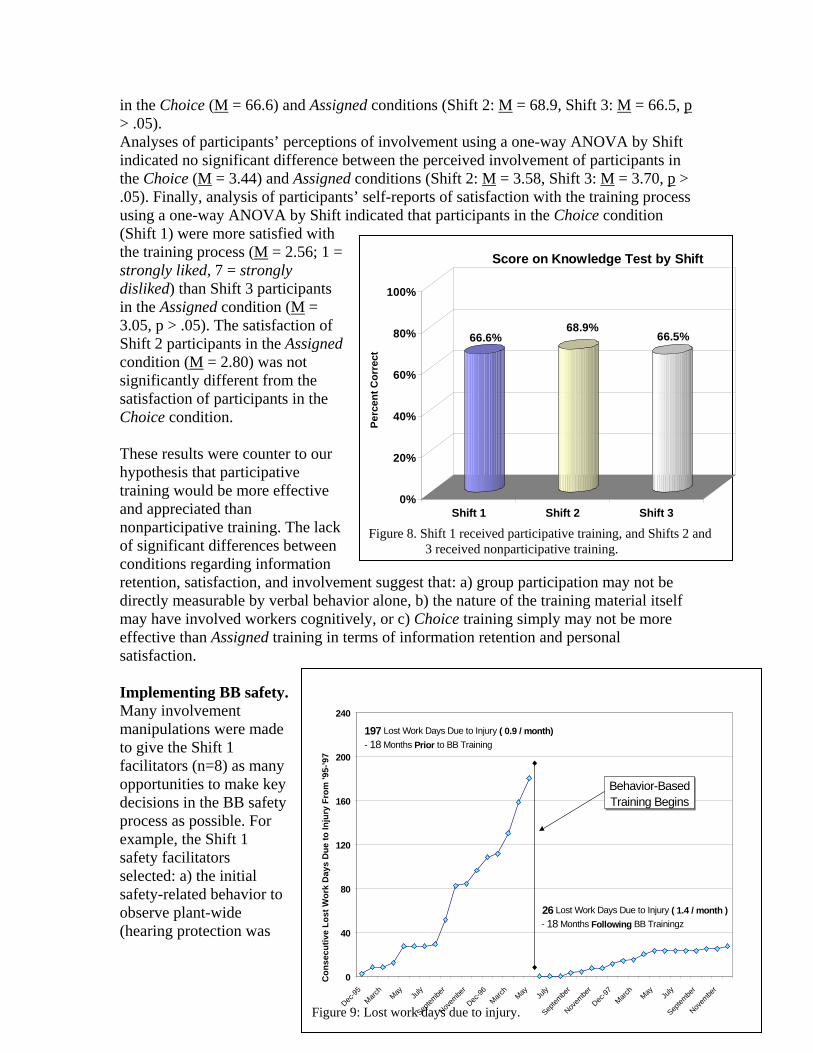
in the Choice (M = 66.6) and Assigned conditions (Shift 2: M = 68.9, Shift 3: M = 66.5, p > .05).
Analyses of participants’ perceptions of involvement using a one-way ANOVA by Shift indicated no significant difference between the perceived involvement of participants in the Choice (M = 3.44) and Assigned conditions (Shift 2: M = 3.58, Shift 3: M = 3.70, p > .05). Finally, analysis of participants’ self-reports of satisfaction with the training process using a one-way ANOVA by Shift indicated that participants in the Choice condition (Shift 1) were more satisfied with the training process (M = 2.56; 1 = strongly liked, 7 = strongly disliked) than Shift 3 participants in the Assigned condition (M = 3.05, p > .05). The satisfaction of Shift 2 participants in the Assigned condition (M = 2.80) was not significantly different from the satisfaction of participants in the Choice condition.
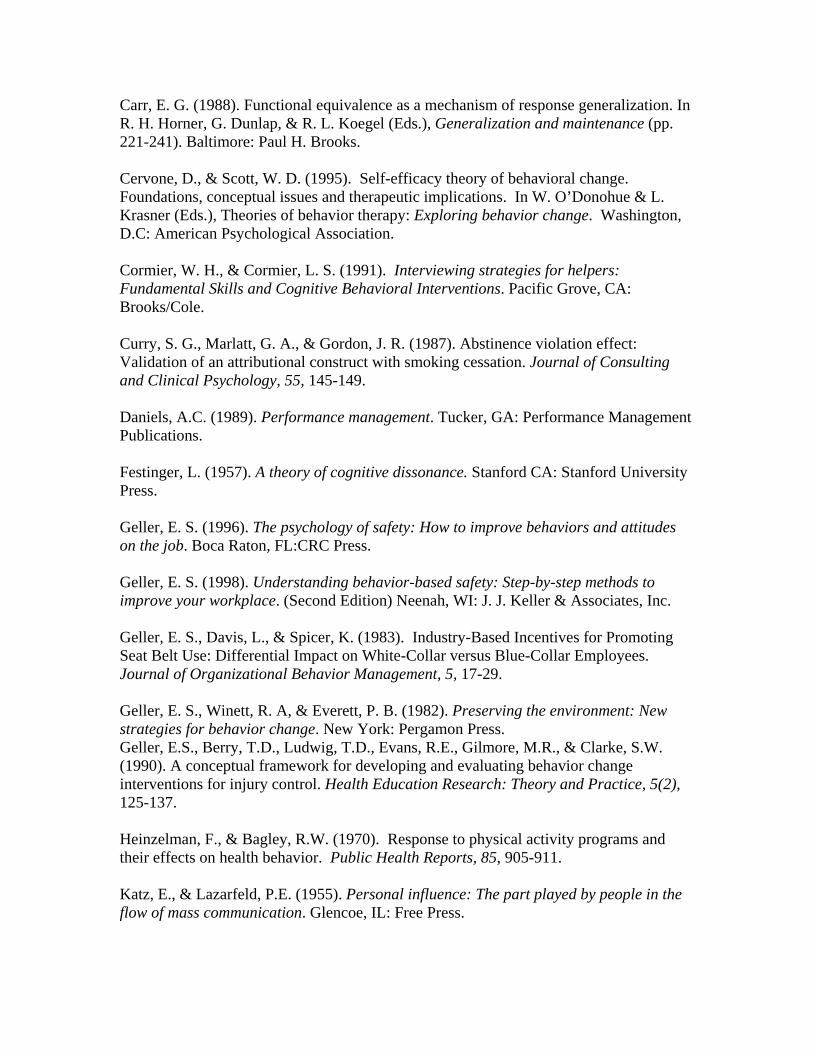
Figure 9: Lost work days due to injury.
These results were counter to our hypothesis that participative training would be more effective and appreciated than nonparticipative training. The lack of significant differences between conditions regarding information retention, satisfaction, and involvement suggest that: a) group participation may not be directly measurable by verbal behavior alone, b) the nature of the training material itself may have involved workers cognitively, or c) Choice training simply may not be more effective than Assigned training in terms of information retention and personal satisfaction.
0%
20%
40%
60%
80%
100%
Perc
ent C
orre
ct
68.9%
Implementing BB safety. Many involvement manipulations were made to give the Shift 1 facilitators (n=8) as many opportunities to make key decisions in the BB safety process as possible. For example, the Shift 1 safety facilitators selected: a) the initial safety-related behavior to observe plant-wide (hearing protection was
0
Dec-95
March
May July
Septem
ber
Novem
ber
Dec-96
March
May July
Septem
ber
Novem
ber
Dec-97
March
May July
Septem
ber
Novem
ber
Con
secu
t
40
80
120
160
200
240
ive
Lost
Wor
k D
ays
Due
to In
jury
Fro
m '9
5-'9
7
Behavior-Based Training Begins
197 Lost Work Days Due to Injury ( 0.9 / month)- 18 Months Prior to BB Training
26 Lost Work Days Due to Injury ( 1.4 / month ) - 18 Months Following BB Trainingz
66.6% 66.5%
Shift 1 Shift 2 Shift 3
Score on Knowledge Test by Shift
Figure 8. Shift 1 received participative training, and Shifts 2 and 3 received nonparticipative training.
chosen), b) the design and location of group feedback prompts, c) the initial plant-wide safety intervention, d) the design of a safety slogan contest, and e) the safety-related behaviors to observe in individual work areas. The choices made by the Shift 1 safety facilitators were assigned (or yoked) to the Shift 2 safety facilitators (n=6), thus limiting Shift 2 input into the BB safety process. This extended the Choice vs. Assigned manipulations implemented during training. For nine weeks, the safety facilitators of Shift 1 (n=230) and Shift 2 (n=210) made behavioral observations on hearing protection. The data were graphed and posted on a safety bulletin board located at the entrance to the production areas of the plant. The dependent measure used to assess facilitator involvement was number of observations taken. Results and discussion. Over the nine-week period, the Shift 1 facilitators (n = 8) made significantly more observations per facilitator per week (M = 10.57, SD = 3.39) than the Shift 2 facilitators [(n = 6, M = 6.13, SD = 3.76, t (16) = 3.1, p < .05]. Also, the Shift 1 facilitators observed a significantly greater [t (8) = 2.6, p < .05] percentage of their shift than did the Shift 2 facilitators (37% vs. 23%, respectively). Shift 1 facilitators also took significantly more observations per person each week than the Shift 2 facilitators [t (16) = 3.05, p < .05]. These findings show promise regarding the effects of giving employees choice regarding the implementation of a BB safety process. In addition, a time series tabulation of this plant’s injury statistics shows the bottom-line beneficial impact of the BB safety process across all three shifts (see Figure 9). Lost days due to injuries decreased markedly after the BB safety training and observation/feedback programs were put in place (10.9 lost days per month prior to BB safety versus 1.5 lost days per month after the initiation of BB safety).
Study 5: Effects of Self-Observation on Safe Driving Practices Self-management (Mahoney, 1971, 1972) is an improvement process whereby individuals change their own behavior in a goal-directed fashion by: a) manipulating behavioral antecedents, b) observing and recording specific target behaviors, and c) self-administering rewards for personal achievements (Kazdin, 1994; Watson & Tharp, 1997). The practical benefits of self-management processes have been demonstrated in numerous clinical settings, including the reduction of alcohol consumption (Sobell & Sobell, 1995), weight control (Baker & Kirschenbaum, 1993), and smoking cessation (Curry, Marlatt, & Gordon, 1987; Shiffman, 1984). Social cognitive theory (Bandura, 1991) suggests that self-observation is one of the primary components of the self-regulation of behavior change. According to Bandura (1991), critical elements in the application of self-observation include specific self-set goals, and a belief in the “value” of behavior change. Research also indicates that perceptions of choice and increased self-awareness of specific behaviors can focus individuals' attention on behavior improvement (Binswanger, 1991). In addition, the impact and maintenance of a self-management effort is determined by an individual’s
ability to sustain focus on the consequences motivating behavior change (such as avoiding injury). Need for Self-Management in Safety While a variety of procedures have been developed to improve safety performance (i.e., reward systems, feedback), most rely on the interpersonal observation of behavior by supervisors or coworkers. While these techniques have been effective in increasing safety, there is a need for effective behavior-change techniques among solitary workers and for infrequent safety-related behaviors (such as lockout-tagout), which are not likely to be observed in most behavior-based coaching systems. Self-management strategies. Research indicates that five self-management procedures can facilitate behavior change: a) activator management, b) social support, c) goal-setting, d) self-observation and self-recording, and e) self-rewards. Activator management involves identifying environment, behavior, and person factors that precede the occurrence of safe and at-risk behaviors. Strategies are then employed to eliminate activators that precede at-risk behaviors and add activators to increase the probability of safe behaviors (i.e., reminder messages to direct target safe behaviors). Creating a supportive environment can also improve self-management success (Stuart, 1967). Sources of social support can include supervisors, coworkers, friends, and family who can encourage the targeted behaviors (Heinzelman & Bagley, 1970; Lawson & Rhodes, 1981; Moss & Arend, 1977). For example, social support can include positive feedback and encouragement for personal successes (Perri & Richards, 1977), particularly when self-observation data is displayed so others can see accomplishments (Taylor, Neter, & Wayment, 1995). Additionally, specific behavioral goals should be: a) set high, yet b) be achievable, c) specify expectations for improvement, and d) include the tracking of progress (Geller, 1996, 1997). Regularly engaging in the self-observation and self-recording of specific behaviors is also a key component of self-management (Bagozzi, 1992; Kazdin, 1994). Self-observation involves observing one’s own target behavior soon after it occurs, as well as noting related environmental events that precede and follow the target behavior (Watson & Tharp, 1997). Recording the occurrence of safe and at-risk behaviors provides an objective record of current safety performance; and charting progress toward reaching specific behavior-based safety goals provides feedback on achievements, and identifies areas for improvement. Finally, using self-rewards to recognize personal achievement motivates continued self-management. While self-management techniques are new to the field of occupational safety, studies in clinical settings indicate that individuals who use self-rewards are more likely to: a) sustain attempts to change their behavior, and b) maintain behavior change (Watson & Tharp, 1997). However, the efficacy and “social validity” of using self-rewards to improve personal safety in the workplace needs to be established.
Implementing safety self-management. Self-management is typically a six-step process, including: a) establishment of a behavioral baseline using self-observation, including the identification of antecedents and consequences associated with the occurrence and non-occurrence of the target behaviors (Cormier & Cormier, 1991); b) identification of target behaviors (Cervone & Scott, 1995); c) selection of a self-management strategy to promote desired behavior change and chart progress; d) selection of a goal which is specific, motivational, attainable, recordable, and trackable (Geller, 1996); e) self-observing and self-recording of target behaviors to measure progress toward the goal (Kirschenbaum et al., 1982), and f) administration of self-rewards that are accessible, individualized, valued, varied, and follow the targeted behavior as immediately as possible (Cormier & Cormier, 1991). Identification of target behaviors can be accomplished by: a) reviewing injury and crash data, b) analyzing “near misses,” and c) most importantly, evaluating previous behavioral observations to identify individual problem areas. Since self-management is a self-directed process, the most beneficial approach to identifying target behaviors is for individuals to survey their own work practices to determine personal at-risk behaviors. Self-observation of behavior has been shown to be effective at identifying and changing behavior within clinical psychology. To date their has been little research on the use of self-observation to improve individual safety-related performance in work settings, and more specifically, driving behavior. This study investigated the viability of using self-observation technology to increase the safe driving of short-haul truck drivers.
Method A sub-sample of 12 male drivers from Site A (self-observation) and 11 male drivers from Site B (control) were randomly selected to evaluate the self-observation intervention. During the week prior to implementing the self-observation intervention, trained research assistants observed the driving behaviors of participants while riding in the passenger seat of their delivery truck. All employees at Site A (n = 30) were then asked to complete a self-observation checklist each work day for a two-week period. While on their sales routes, participants recorded the following behaviors when arriving at each of their accounts: a) use of running/head lights, b) safety-belt use, and c) walking around the vehicle before leaving account. At the end of the day, participants estimated their percent safe on the following behaviors: a) following distance, b) lane change, c) traffic lights, d) complete stops at stop signs, and e) vehicle speed. Self-observation forms were collected and graphed on a daily basis. These graphs were posted in a break room where employees gathered before and after their routes each day. The self-observation data which were graphed each day are presented in Figure 10.
99%
81%
100%
54%
93%
74%
40
50
60
70
80
90
100
Pre 1 2 3 4 5 6 7 8 9 10 Post
Consecutive Self-Observation Days
Following DistanceLane ChangeVehicle Speed
Self-Monitoring Intervention
Self-observation occurred on ten consecutive work days. During the week following the intervention, research assistants again observed the driving behaviors of the drivers during a ride-along. Since only one observer was permitted to ride with each participant, it was necessary to assess
reliability (inter-observer agreement) of the driving measures in an alternative setting using the same observers. The inter-observation reliabilities for all behaviors were above .88.
Results
A percent safe score was calculated for each participant’s driving behaviors by dividing the number of safe behaviors by the number of safe and at-risk behaviors. A total percent safe score was also calculated based on the total number of safe behaviors (collapsed across all driving behaviors). An ARCSIN transformation was calculated on all percent safe scores. A 2 Time (pre- vs. post-intervention) x 2 Group (self-observation vs. control) mixed model ANOVA was calculated for each dependent variable. Results indicated a significant Time x Group interaction for overall percent safe, p < .05. Follow-up analyses indicated that overall safety did not improve in the control group (from 71.5% to 75.4%), p > .05. In contrast, there was a significant increase in the overall safety of the self-observation group (from 66.8% to 87.8%), p < .05. Based on this finding, each driving behavior was examined separately. Sample sizes varied for each analysis because there was no opportunity to observe some behaviors for some drivers on neither the first nor second ride-along. Thus, n-sizes are reported for each analysis. As shown in Figure 10, results indicated a significant Time x Group interaction for lane changes, p < .01 and following distance, p < .01. Follow-up analyses indicated that safe lane changes and following distances did not improve in the control group (from 94.3% to 81.9% for lane changes, n = 5; from 64.4% to 75.0% for following distance, n = 5), ps > .05. In contrast there was a significant increase for both lane changes and following distance in the Self-Observation group (from 0.0% to 100.0% for lane changes, n = 5; from 48.1 to 96.9% for following distance, n = 7), ps < .05. No other effects were significant for the remaining driving behaviors, but they were in the expected and desired direction.
Discussion. Self-observation may be one of the most effective behavior change techniques in situations where social support is not available. In fact, it is the only technique that can be applied by solitary workers without extensive support from supervisors and coworkers. Self-management is non-invasive, simple, and practical. If self-management activities can be integrated with other job activities, safety practitioners will have an effective tool for improving safety-related behaviors that occur when there is little or no opportunity for interpersonal BB observation and feedback (as with low base-rate behaviors like lockout-tagout, and with workers who work alone). The successful integration of self-management behaviors into daily work tasks is invaluable for the maintenance of safe work practices.
Summary Our comprehensive review of the research literature turned up convincing evidence that a BB approach to occupational safety can be extremely effective at reducing at-risk behavior and workplace injuries. A key ingredient of every effective BB intervention was observation and feedback. In other words, participants need a mechanism for learning what to do differently in order to prevent the possibility of personal injury. Little is known, however, about the best way to implement a BB observation and feedback process, nor has there been any systematic study of the organizational factors needed to institutionalize a BB process for improving safety-related work practices. This defines the mission of our research reviewed here. Our two-year project is still underway, and most of the survey data are not yet analyzed. However, the preliminary research and five experiments described here enable the following conclusions: Although appreciation for BB safety is on the rise, BB safety principles are rarely applied in the development of a company-wide accountability system. In other words, outcome numbers (such as total recordable injury rate) rather than process numbers (such as quality and quantity of participation) are used most often to evaluate safety performance, even on the shop floor. Involving employees in a BB safety training program did not facilitate knowledge gained nor personal satisfaction in the process. However, involving employees in the development of an intervention tool and protocol had prominent beneficial effects on actual implementation of an observation and feedback process. Marked reductions in workplace injuries occurred at two study sites immediately after a BB observation and feedback process was put in place. Interviews and focus groups at sites with varying success implementing BB safety indicated key roles of an employee steering committee, visible management support, one or more champions to drive the process, and personal perceptions of program ownership and interpersonal trust. The most successful organizations "do it their own way," and the procedures and support systems vary dramatically across cultures. A systematic evaluation of successive interventions to improve safety-belt use supported a key assumption of a multiple intervention level (MIL) model, namely that people who
are uninfluenced by a BB intervention presented at one level of intrusiveness will not be influenced by subsequent interventions with the same degree of intrusiveness. In other words, repeating the same kind of intervention process will not influence the critical resistors unless a more intense and intrusive procedure is added. Self-management techniques developed in clinical settings seem to be a viable behavior change tool for workers in a solitary work environment. And finally, we realize we have only cracked the surface in determining the critical success factors of BB safety. We will obtain much more information before our grant ends, but then we will have only begun an important discovery process. Much more research is needed in this human factors domain of industrial health and safety.
References
Baer, D. M., Wolf, M. M., & Risley, T. R. (1968). Some current dimensions of applied behavior analysis. Journal of Applied Behavior Analysis, 1, 91-97. Baer, D. M., Wolf, M. M., & Risley, T. R. (1987). Some still-current dimensions of applied behavior analysis. Journal of Applied Behavior Analysis, 20, 313-327. Bagozzi, R. P. (1992). The self-regulation of attitudes, intentions and behaviors. Social Psychology Quarterly, 55(2), 178-204. Baker, R. C., & Kirschbaum, D. S., (1993). Self-monitoring may be necessary for successful weight control. Behavior Therapy, 24, 377-394. Bandura, A. (1969). Principles of behavior modification. New York: Holt, Rinehart & Winston. Bandura, A. (1977). Self-efficacy: Toward a unifying theory of behavioral change. Psychological Review, 84, 191-215. Bandura, A. (1991). Social Cognitive Theory of Self-Regulation. Organizational Behavior And Human Decision Processes, 50, 248-287. Bandura, A. (1997). Self-efficacy: The exercise of control. New York: W. H. Freeman and Company. Binswanger, H. (1991). Volition as cognitive self-regulation. Organizational Behavior and Human Decision Processes, 50, 154-178. Boyce T. E., & Geller, E. S. (1998). Guidelines for improving behavioral maintenance in occupational safety: An integration of research and theory for large-scale application. Behavior and Social Issues, under review.
Carr, E. G. (1988). Functional equivalence as a mechanism of response generalization. In R. H. Horner, G. Dunlap, & R. L. Koegel (Eds.), Generalization and maintenance (pp. 221-241). Baltimore: Paul H. Brooks. Cervone, D., & Scott, W. D. (1995). Self-efficacy theory of behavioral change. Foundations, conceptual issues and therapeutic implications. In W. O’Donohue & L. Krasner (Eds.), Theories of behavior therapy: Exploring behavior change. Washington, D.C: American Psychological Association. Cormier, W. H., & Cormier, L. S. (1991). Interviewing strategies for helpers: Fundamental Skills and Cognitive Behavioral Interventions. Pacific Grove, CA: Brooks/Cole. Curry, S. G., Marlatt, G. A., & Gordon, J. R. (1987). Abstinence violation effect: Validation of an attributional construct with smoking cessation. Journal of Consulting and Clinical Psychology, 55, 145-149. Daniels, A.C. (1989). Performance management. Tucker, GA: Performance Management Publications. Festinger, L. (1957). A theory of cognitive dissonance. Stanford CA: Stanford University Press. Geller, E. S. (1996). The psychology of safety: How to improve behaviors and attitudes on the job. Boca Raton, FL:CRC Press. Geller, E. S. (1998). Understanding behavior-based safety: Step-by-step methods to improve your workplace. (Second Edition) Neenah, WI: J. J. Keller & Associates, Inc. Geller, E. S., Davis, L., & Spicer, K. (1983). Industry-Based Incentives for Promoting Seat Belt Use: Differential Impact on White-Collar versus Blue-Collar Employees. Journal of Organizational Behavior Management, 5, 17-29. Geller, E. S., Winett, R. A, & Everett, P. B. (1982). Preserving the environment: New strategies for behavior change. New York: Pergamon Press. Geller, E.S., Berry, T.D., Ludwig, T.D., Evans, R.E., Gilmore, M.R., & Clarke, S.W. (1990). A conceptual framework for developing and evaluating behavior change interventions for injury control. Health Education Research: Theory and Practice, 5(2), 125-137. Heinzelman, F., & Bagley, R.W. (1970). Response to physical activity programs and their effects on health behavior. Public Health Reports, 85, 905-911. Katz, E., & Lazarfeld, P.E. (1955). Personal influence: The part played by people in the flow of mass communication. Glencoe, IL: Free Press.
Kazdin, A. E. (1994). Behavior modification in applied settings. Pacific Grove, CA: Brooks/Cole. Kirschenbaum, D. S., Ordman, A. M., Tomarken, A. J., & Holtzbauer, R. (1982). Effects of differential self-monitoring and level of mastery of sports performance: Brain power bowling. Cognitive Therapy and Research, 6, 335-342. Lawson, D.M., & Rhodes, E.C. (1981, November). Behavioral self-control and maintenance of aerobic exercise: A retrospective study of self-initiated attempts to improve physical fitness. Paper presented at the meeting of the Association for the Advancement of Behavior Therapy, Toronto. Ludwig, T. D., & Geller, E. S. (1991). Improving the driving practices of Pizza deliverers: Response generalization and moderating effects of driving history. Journal of Applied Behavior Analysis, 24, 31-44. Mahoney, M. J. (1971). The self-management of covert behavior: A case study. Behavior Therapy, 2, 575-578. Mahoney, M. J. (1972). Research issues in self-management. Behavior Therapy, 3, 45-63. Moss, M. K., & Arend, R. A. (1977). Self-directed contact desensitization. Journal of Consulting and Clinical Psychology, 45, 730-738. Novak, L. (1995, May). National Highway Traffic Safety Administration. Personal communication with E. Scott Geller. Peltzman, S. (1975). The effects of automobile safety regulation. Journal of Political Economics, 83, 677-725. Perri, M. G., & Richards, C. S. (1977). An investigation of naturally occurring episodes of self-controlled behaviors . Journal of Counseling Psychology, 24, 178-183. Rudd, J. R., & Geller, E. S. (1985). A university-based incentive program to increase safety belt use: Toward cost-effective institutionalization. Journal of Applied Behavior Analysis, 18, 215-226. Shiffman, S. (1984). Coping with temptations to smoke. Journal of Consulting and Clinical Psychology, 52, 261-267. Sobell, L.S., & Sobell, M.B. (1995). Guided self-change case study: Lisa. Toronto, Canada: Addiction Research Council. Sohn, D., & Lamal, P.A. (1982). Self-reinforcement: Its reinforcing capability and its clinical utility. Psychological Record, 32, 179-203.
Streff, F. M., Kalsher, M. J., & Geller, E. S. (1993). Developing efficient workplace safety programs: Observations of response covariation. Journal of Organizational Behavior Management, 13(2), 3-15. Stuart, R.B. (1967). Behavioral control of overeating. Behaviour Research and Therapy, 5, 357-365. Sulzer-Azaroff, B., & De Santamaria, M. C. (1980). Industrial safety hazard reduction through performance feedback. Journal of Applied Behavior Analysis, 13, 287-295. Sulzer-Azaroff, B., Loafman, B., Merante, R. J., & Hlavacek, A. C. (1990). Improving occupational safety in a large industrial plant: A systematic replication. Journal of Organizational Behavior Management, 11(1), 99-120. Taylor, S. E., Neter, E., Wayment, H. A. (1995). Self-Evaluation Processes. Personality and Social Psychology Bulliten, 21, 1278-1287. Watson, D. P., & Tharp, R. G. (1997). Self-directed behavior: Self-modification for personal adjustment (6th ed.). Monterey, CA: Brooks/Cole.