ResearchReviewSupporting the Principal’s Data-Informed Decisions
Principal’s
i ssn 1558-5948 Vol. 8, i ssue 4 JulY 2013
Implementing Early Warning SystemsBy Sarah Frazelle and Rhonda Barton
Early warning systems (EWS) can be a powerful tool for identifying students at risk of not graduating from high school
in four years. Much like emergency systems that sound a warning of natural disasters, such as hurricanes or tsunamis, educational EWS signal school staff that action is needed to mitigate undesirable outcomes.
Many EWS use predictive indicators, such as attendance, behavioral incidents, and course grades—often called the ABCs of disengagement—that are based on a school or district’s longitudinal data to place students into three categories: on track, sliding, or off track. These indicators are often interrelated and have been repeatedly tied to higher prob-abilities that students will drop out (Mac Iver & Mac Iver, 2009).
According to Cunningham and Van Alstyne (2012), “when accurate indicators
are aligned with appropriate interventions, students who are off-track can be brought back on-track for graduation” (p. 1). Com-bining indicators and targeted interven-tions represents “a collaborative approach among educators, administrators, parents, and communities to using data effectively to keep students on the pathway to graduation” (Bruce, Bridgeland, Fox, & Balfanz, 2011, p. 2). Furthermore:
The best EWS are characterized by a combination of features that enable rapid identification of students who are in trouble; rapid interventions that are targeted to stu-dents’ immediate and longer-term need for support, redirection, and greater success; the frequent monitoring of the success of inter-ventions; a rapid modification of interventions that are not working; and shared learning from outcomes. (Bruce et al., 2011, p. 2)
Much like emergency systems that sound a warning of natural disasters, such as hurricanes or tsunamis, educational EWS signal school staff that action is needed to mitigate undesirable outcomes.
Just the Facts
n Combining indicators and targeted interventions represents “a
collaborative approach among educators, administrators, parents, and
communities to using data effectively to keep students on the pathway
to graduation” (Bruce, Bridgeland, Fox, & Balfanz, 2011, p. 2).
n Most districts use the ABCs (attendance; behavioral incidents; and
course grades, particularly in math and english language arts) as a
starting point (Allensworth & easton, 2007; Balfanz, Herzog, & Mac
The National High School Center and similar organizations have designed easy-to-use templates for EWS, and in an era of data-driven education reform, districts and schools have been eager to embrace those systems. School leaders, however, often face two challenges in successfully implement-ing an EWS: One barrier comes in creating a system and the other in helping staff members routinely use it. From a technical perspective, indicators must be valid and identify unique leverage points for inter-vention. Too often indicators are developed without asking critical questions about whether there is evi-dence of a strong link between the indicator and the desired outcome. Second, from a practical perspec-tive, indicator systems are not likely to produce the desired improvements in student outcomes unless they are part of a regular cycle of data use by teach-ers and principals.
Research offers some guidance for developing a dedicated EWS team, choosing and reporting accu-rate indicators, aligning interventions with indica-tors, and evaluating EWS effectiveness. To ensure a successful process, school leaders must support prac-titioners in learning to use multiple types of data to understand their students’ progress and difficulties.
Establishing a TeamEWS teams can be established at the district or school level, depending on how centralized the decision-making process is. For example, when schools are highly autonomous and have many different policies and programs, a school-level approach might be most appropriate. In that model, each school works inde-pendently. A district-level approach would be most appropriate when the district historically has exercised centralized authority over its schools. For example, an EWS team of school and district representatives convenes to share responsibility for monitoring and assigning students to appropriate interventions uni-formly across schools. Researchers from The National High School Center (Therriault, O’Cummings, Heppen, Yerhot, & Scala, 2013) suggested a blended approach with school-based teams to monitor and assign students to interventions and a district team to
2
track overall progress and implementation strategies. Participation from all stakeholders who will interact with the EWS encourages proper feedback cycles and can improve coordination and communication among teams (Therriault et al., 2013).
Establishing specific roles and responsibilities sets clear expectations for each member and provides accountability for tasks. Although EWS teams vary in their composition, many include the following positions: information technology staff; school- and district-level leaders; program coordinator; school counselor; and representatives of such groups as teachers, parents, equity coordinators, parent orga-nizations, student organizations, and specialists (e.g., ELL or special education instructors). Therriault, Heppen, O’Cummings, Fryer, and Johnson (2010) emphasized that team members should have “the authority to make decisions about staff and students” and “know a diverse array of students” (p. 4).
A first order of business for the team is to agree on realistic goals, objectives, and strategies. The SMART (i.e., specific, measurable, achievable, relevant, and time-bound) framework can be used to establish goals and objectives and time frames to achieve them. School-level meetings should focus on individual students, with discussion centering on each new student who is flagged as struggling and on how interventions are working for students previously identified by the EWS. District-level meetings should examine each school’s trends and look at interventions overall. Frequency of meetings can vary: school-based teams in the Houston (TX) Independent School District (2012) meet weekly, and school teams in the joint program of Big Broth-ers Big Sisters of Eastern Missouri and ABC Today! supplement weekly meetings with monthly principal meetings and quarterly district meetings (Bruce et al. (2011). The Diplomas Now program holds biweekly meetings of teachers who share students in common and other support staff members who work together to analyze data and design interventions (Herzog, Davis, & Legters, 2012). The bottom line is that the meeting schedule should reflect the school’s needs and how often indicator data are updated.
Team members may need professional devel-opment in using the EWS system, particularly in accessing the data and interpreting results. The Sioux Falls (SD) School District provides examples of professional development through a list of “Action Initiatives,” which its EWS committee established (Hauser & Koenig, 2011). These emphasize train-ing student assistance teams in a tiered, response to intervention model and training staff members to recognize risk-factor subgroups and related triggers for intervention.
Selecting and Reporting Accurate Indicators Focusing attention on a small set of indicators allows EWS teams to allocate their time and efforts most efficiently. Most districts use the ABCs (attendance; behavioral incidents; and course grades, particularly in math and English language arts) as a starting point (Allensworth & Easton, 2007; Balfanz, Herzog, & Mac Iver, 2007; Balfanz, Wang, & Byrnes, 2010; Celio, 2009a; Celio, 2009b; Mac Iver, 2010; Mac Iver & Mac Iver, 2009; Roderick, 1993; Uekawa, Merola, Fernandez, & Porowski, 2010). Although other measures may also predict student success, each additional indicator requires a change in report-ing format, more data to analyze, and the design of additional interventions to help students improve in the indicator area. Over time, EWS teams can assess whether additional indicators actually led to signifi-cant increases in accurately identifying more students who were off track.
EWS teams should set thresholds to flag students who are struggling, on the basis of local, historical patterns of dropping out. National recom-mendations for thresholds may not have the same predictive power in every school as indicator reli-ability can vary by school context and the precise definition a school uses for its indicator (Therriault et al., 2013).
Although compiling data to identify student needs is an important role for the EWS team, members must also create a way to alert other staff members when the data indicate a student is falling
Merging RTI Efforts with EWS
Many districts have invested in an RTI framework
that emphasizes a tiered approach to supporting
student success. According to the American
Institutes for Research, National Center on Response
to Intervention (2010), the RTI model consists of
three levels of intervention:
n The primary level focuses on all students and involves “district curriculum and instructional practices that are evidence-based; aligned with state or districts standards, and incorporate differentiated instruction”
n The secondary level focuses on identified at-risk students and provides “targeted, supplemental instruction delivered in small groups”
n The tertiary level focuses on students who struggle after receiving primary and secondary interventions and provides “intensive, supplemental instruction delivered individually or to small groups.” (p. 4)
The RTI framework can provide EWS teams with a
way to conceptualize their interventions. Likewise,
EWS can provide RTI programs with a strong system
for monitoring data. (See Mac Iver & Mac Iver [2009,
p. 3] for a description of how the two frameworks
can map together.)
Sources: American Institutes for Research, National Center on Response to Intervention. (2010). Essential components of RTI:
A closer look at response to intervention. Retrieved from www.rti4success.org/pdf/rtiessentialcomponents_042710.pdf
Mac Iver, M. A., & Mac Iver, D. J. (2009). Beyond the indicators:
An integrated school-level approach to dropout prevention. Retrieved from George Washington University, Center for Equity and Excellence in Education, Mid-Atlantic Equity Center website: http://maec.ceee.gwu.edu/sites/default/files/
Dropout Early Warning System includes a list of more than 50 interventions to which EWS teams can assign off-track students (Louisiana Department of Education, 2009). Those interventions include tutor-ing programs, home visits, and moving students to alternative schools. Many schools have invested in a response to intervention (RTI) approach that can be combined with the EWS.
The National High School Center (Therriault et al., 2010) suggests the following series of ques-tions to consider when conducting an inventory of interventions:
■n What are the features of the available inter-ventions and supports, and what strategies do they include?
■n What other needs do the interventions seek to meet, and which students are best suited for the interventions?
■n What does the evidence say about the inter-vention’s effectiveness?
■n Are any at-risk students currently receiving these interventions, and if so, how long have they been participating and what indicators of success are documented in their records? (p. 18)
Once the team has compiled a list of interven-tions, the next step is to identify which indicator that intervention can best accommodate. For example, a peer mediator group may help students who are flagged for behavioral incidents. Then, the team works to assign the students who have been identi-fied to the various interventions. EWS team mem-bers can investigate a student’s needs by talking to the student directly and conferring with the student’s family and school staff members (e.g., teachers, coaches, and counselors) who may be able to provide insights into why the student is off track.
In the Sioux Falls School District, all students who are identified as needing interventions are as-signed to a student engagement case manager who works with the student on a daily basis. Further interventions can be implemented depending on which indicator was flagged: if the issue is academic performance, the student may be sent to after-school
off track. School summary reports may be most help-ful for administrators, and classroom-level reports may provide more insights for teachers. Similarly, student-level reports are useful for teachers, counsel-ors, students, and their families. The University of Chicago Consortium on Chicago School Research (2007) has created a series of What Matters briefs that specifically explain to freshman students and their parents how grades and attendance affect the students’ chances of graduating from high school.
Connecting Indicators and InterventionsAfter the school or district has established a strong foundational base for the EWS team and team members have agreed on indicators and reporting structures, the next step is to align intervention pro-grams with the chosen indicators. Typically, districts have already adopted a wide variety of interventions that range from district policies to IEPs. Teams may find it easier to catalogue interventions already in place to help students succeed rather than begin by adopting new strategies. For example, the Louisiana
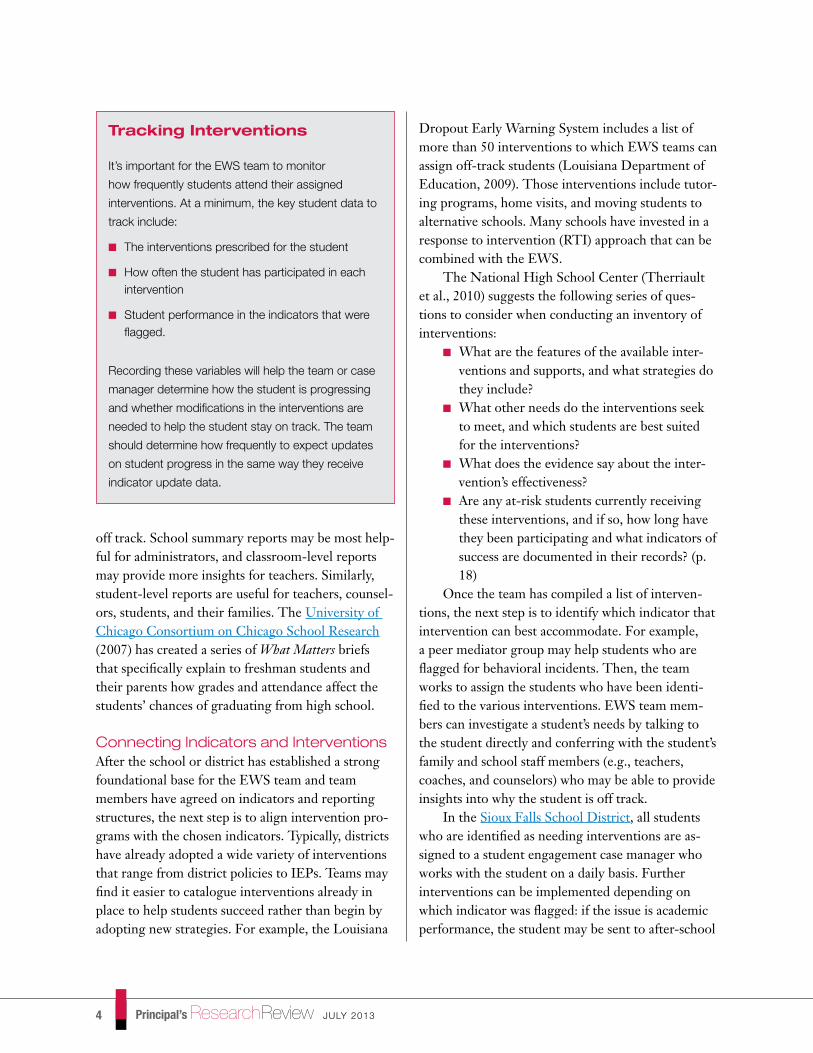
Tracking Interventions
It’s important for the EWS team to monitor
how frequently students attend their assigned
interventions. At a minimum, the key student data to
track include:
n The interventions prescribed for the student
n How often the student has participated in each intervention
n Student performance in the indicators that were flagged.
Recording these variables will help the team or case
manager determine how the student is progressing
and whether modifications in the interventions are
needed to help the student stay on track. The team
priate interventions.Large districts that have found EWS helpful
report that carefully considering EWS team mem-bers’ roles, the data they collect and analyze, and the alignment of indicators and interventions are all important factors in helping keep their students on track for graduation.
By “having better data, an understanding of why and where students drop out, a heightened awareness of the consequences to individuals and the economy, a greater understanding of effective reforms and interventions, and real-world examples of progress and collaboration” our schools, districts, and states can continue to make progress in solving the dropout crisis (Balfanz, Bridgeland, Bruce, & Fox, 2013, p. 1).
JULY 2013 Principal’s ResearchReview 5
tutoring; a student with 10 or more absences is as-signed to a social worker or counselor advocate who investigates the cause of the poor attendance (Hauser & Koenig, 2011).
Evaluating the SystemMany districts encounter difficulties in assessing their interventions, regardless of how many they have or how well-funded each is. Districts and schools need to know which interventions have the greatest impact and whether they need to adopt new programs to address gaps in student services. Proper implementation of an EWS and a record of student progress by intervention can help teams examine trends and make decisions that are based on student needs (see Tracking Interventions). Evaluation of in-terventions should take place annually (Therriault et al., 2013), although teams should set their evaluation schedule according to their specific school context and how quickly they expect to see student outcomes improve.
To date, there have been few rigorous studies of the effectiveness of EWS intervention strategies. One reason why there is relatively little national information on the effectiveness of either interven-tions or EWS as a whole may be that districts and school have only recently adopted EWS on a wide scale. One rigorous EWS examination by the What Works Clearinghouse, however, reviewed a study of the “Check and Connect” program and found it “to have positive effects on staying in school and poten-tially positive effects on progressing in school” (US Department of Education, 2006, p. 1). A Statewide Longitudinal Data Systems Spotlight (US Depart-ment of Education, 2011) reported on efforts in Massachusetts, Maine, and South Carolina.
ConclusionEffective implementation of an EWS can be a pow-erful system-wide approach to proactively assisting students when they first begin to struggle. An EWS can help districts maximize dropout prevention initiatives by catching students at the onset of their struggles and providing them with the most appro-
B.J. ParisPresident
G.A. Buie President-Elect
JoAnn Bartoletti Executive Director
Dick Flanary Deputy Executive Director for Programs and Services
Nancy Riviere Interim Deputy Executive Director
Jeanne Leonard Director of Marketing
Robert N. Farrace Director of Communications
Jan Umphrey Associate Director for Publications
Sharon Teitelbaum Editor
Tanya Seneff Associate Director of Graphic Services
David Fernandes Production Manager
Lisa Schnabel Graphic Designer
Principal’s Research Review is a publication of NASSP, 1904 Association Dr., Reston, VA 20191-1537. Telephone 703-860-0200. Fax 703-476-5432. Website www.nassp.org.
NASSP dues include the annual subscription rate of $50; individual subscriptions are not available. NASSP members can download this issue at www.nassp.org/prr. Copyright 2013 NASSP.
National Association of Secondary School Principals
■n Allensworth, E. M., & Easton, J. Q. (2007). What matters for staying on-track and graduating in Chicago public high schools: A close look at course grades, failures, and attendance in the freshman year. Retrieved from University of Chicago, Consortium on Chicago School Research website: http://ccsr.uchicago.edu/publications/what-matters-staying-track-and-graduating-chicago-public-schools
■n Balfanz, R., Bridgeland, J. M., Bruce, M., & Fox, J. H. (2013). Building a grad nation: Progress and challenge in ending the high school dropout epidemic. Executive summary (Annual updated ed.). Retrieved from Johns Hopkins University, School of Education, Everyone Graduates Center website: http://new.every1graduates.org/wp-content/uploads/2013/02/Building-A-Grad-Nation-2013-ES-FINAL-web.pdf
■n Balfanz, R., Herzog, L., & Mac Iver, D. J. (2007). Preventing student disengagement and keeping students on the graduation path in urban middle grades schools: Early identification and effective interventions. Educational Psychologist, 42(4) 223–235. Retrieved from http://web.jhu.edu/sebin/q/b/preventingstudentdisengagement.pdf
■n Balfanz, R., Wang, A., & Byrnes, V. (2010). Early warning indicator analysis: Tennessee. Retrieved from Tennessee Department of Education, Office of Safe & Supportive Schools website: www.tn.gov/education/safe_schls/dropout/doc/EarlyWarningIndicatorAnalysisTN.pdf
■n Bruce, M., Bridgeland, J. M., Fox, J. H., & Balfanz, R. (2011). On track for success: The use of early warning indicator and intervention systems to build a grad nation. Retrieved from Johns Hopkins University, School of Education, Everyone Graduates Center website: http://new.every1graduates.org/wp-content/uploads/2012/03/on_track_for_success.pdf
■n Celio, M. B. (2009a, April). Getting to graduation: Kent school district cohort study. PowerPoint presentation to Kent School District. Retrieved from Road Map Project website: www.roadmapproject.org/wp-content/uploads/2012/08/EWIs_Kent-Schools-2009-Cohort-Study.pdf
■n Celio, M. B. (2009b, September). Seattle School District 2006 cohort study. PowerPoint presentation to Bill and Melinda Gates Foundation. Retrieved from
■n Cunningham, B., & Van Alstyne, S. (2012). Developing and implementing early warning indicator systems and intervention strategies: An inventory of early warning indicator systems in road map school districts. Renton, WA: Puget Sound Educational Service District.
■n Hauser, R. M., & Koenig, J. A. (Eds.). (2011). High school dropout, graduation, and completion rates: Better data, better measures, better decisions. Washington, DC: National Academies Press.
■n Herzog, L., Davis, M., & Legters, N. (2012). Learning what it takes: An initial look at how schools are using early warning indicator data and collaborative response teams to keep all students on track to success. Retrieved from Johns Hopkins University, School of Education, Everyone Graduates Center website: http://new.every1graduates.org/wp-content/uploads/2012/04/Learning_what_it_Takes.pdf
■n Houston Independent School District. (2012). Apollo 20 [Program information and fact sheets]. Retrieved from www.senate.state.tx.us/75r/senate/commit/c530/handouts12/0913-RodneyWatson-2.pdf
■n Louisiana Department of Education. (2009). Louisiana Dropout Early Warning System: DEWS from the ground up. Presentation at Data Quality Campaign hosted webinar. Retrieved from www.dataqualitycampaign.org/files/EWI-DEWS-Presentation_Webinar_.pdf
■n Mac Iver, M. A. (2010). Gradual disengagement: A portrait of the 2008–09 dropouts in the Baltimore city schools. Retrieved from Baltimore Education Research Consortium website: http://baltimore-berc.org/pdfs/Gradual%20Disengagement%20final.pdf
■n Mac Iver, M. A., & Mac Iver, D. J. (2009). Beyond the indicators: An integrated school-level approach to dropout prevention. Retrieved from George Washington University, Center for Equity and Excellence in Education, Mid-Atlantic Equity Center website: http://maec.ceee.gwu.edu/sites/default/files/Dropout%20report%208.11.09_0.pdf
■n Roderick, M. (1993). The path to dropping out: Evidence for intervention. Westport, CT: Auburn House.
■n Therriault, S., Heppen, J., O’Cummings, M., Fryer,
L., & Johnson, A. (2010). Early warning system implementation guide: For use with the national high school center’s early warning system tool v2.0. Retrieved from www.betterhighschools.org/documents/NHSCEWSImplementationguide.pdf
■n Therriault, S. B., O’Cummings, M., Heppen, J., Yerhot, L., & Scala, J. (2013). High school early warning intervention monitoring system implementation guide. Retrieved from American Institutes for Research, National High School Center website: www.betterhighschools.org/documents/EWSHSImplementationguide.pdf
■n Uekawa, K., Merola, S., Fernandez, F., & Porowski, A. (2010) Creating an early warning system: Predictors of dropout in Delaware (REL MA 1.2.75-10). Retrieved from Delaware Department of Education website: www.doe.k12.de.us/infosuites/ddoe/p20council/docs/MA1275TAFINAL508.pdf
■n University of Chicago, Consortium on Chicago School Research. (2007). Freshman year: The make-it or break-it year [Research brief]. Retrieved from http://ccsr.uchicago.edu/publications/what-matters-staying-track-and-graduating-chicago-public-schools/
■n US Department of Education, Institute of Education Sciences, State Longitudinal Data Systems Grant Program. (2012). SLDS spotlight: Development and use of early warning systems. Retrieved from http://nces.ed.gov/programs/slds/pdf/Early_Warning_Systems_FINAL.pdf
■n US Department of Education, Institute of Education Sciences, What Works Clearinghouse. (2006). WWC intervention report: Check & connect. Retrieved from http://ies.ed.gov/ncee/wwc/pdf/intervention_reports/WWC_Check_Connect_092106.pdf