Page 1
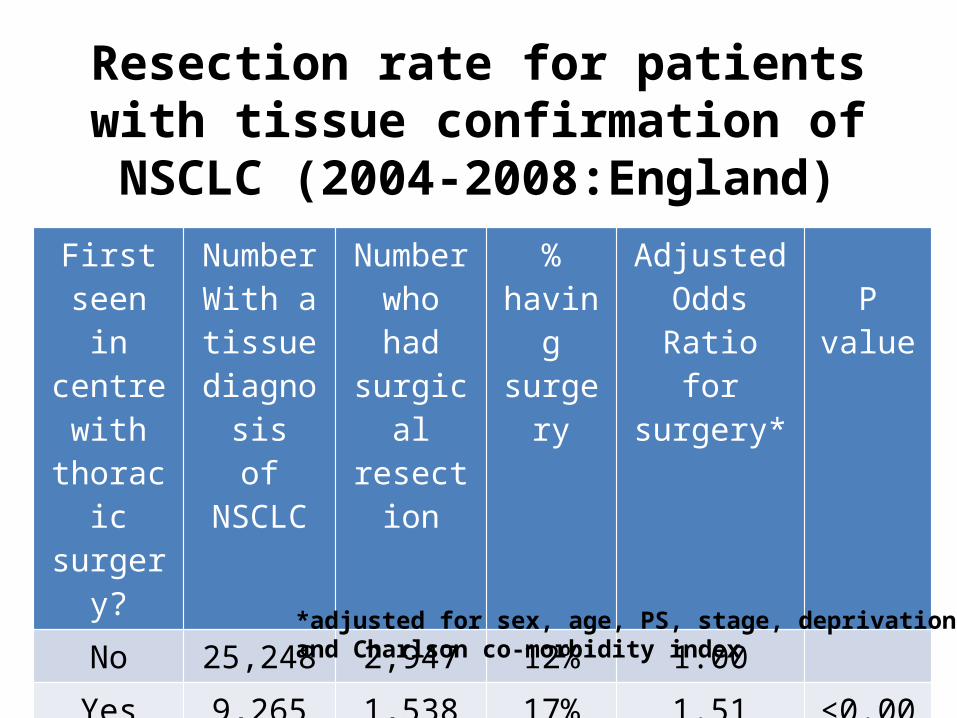
Resection rate for patients with tissue confirmation of NSCLC (2004-2008:England)
First seen in centre
with thoracic surgery?
NumberWith a tissue
diagnosisof NSCLC
Number who had surgical
resection
%having surgery
Adjusted Odds Ratio
for surgery*P value
No 25,248 2,947 12% 1.00Yes 9,265
(27%)1,538 17% 1.51 (1.16-
1.97)<0.001
*adjusted for sex, age, PS, stage, deprivation indexand Charlson co-morbidity index
Page 2
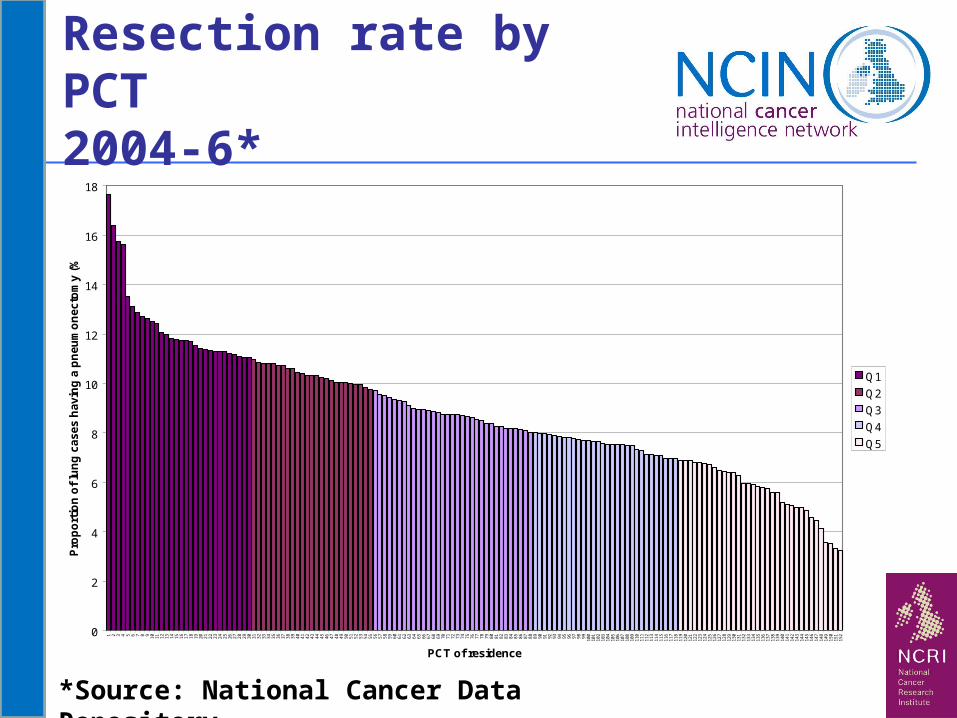
Resection rate by PCT 2004-6*
0
2
4
6
8
10
12
14
16
18
1 2 3 4 5 6 7 8 9 10 11 12 13 14 15 16 17 18 19 20 21 22 23 24 25 26 27 28 29 30 31 32 33 34 35 36 37 38 39 40 41 42 43 44 45 46 47 48 49 50 51 52 53 54 55 56 57 58 59 60 61 62 63 64 65 66 67 68 69 70 71 72 73 74 75 76 77 78 79 80 81 82 83 84 85 86 87 88 89 90 91 92 93 94 95 96 97 98 99 100
101
102
103
104
105
106
107
108
109
110
111
112
113
114
115
116
117
118
119
120
121
122
123
124
125
126
127
128
129
130
131
132
133
134
135
136
137
138
139
140
141
142
143
144
145
146
147
148
149
150
151
152
PCT of residence
Pro
po
rtio
n o
f lu
ng
ca
ses
havin
g a
pn
eu
mo
necto
my
(%
)
Q1
Q2
Q3
Q4
Q5
*Source: National Cancer Data Repository
Page 3
EMEE
L
NENW
SE
SW
WM
Y&H
0.85
0.90
0.95
1.00
1.05
Ha
zard
ra
tio
5 6 7 8 9 10 11Radical surgery (%)
Hazard ratio 95% CIRadical surgery 95% CI
N = 77,349
Mortality Hazard Ratios for Lung Cancer Patients in England 2004-6 related to resectionrate by government office region
Page 4
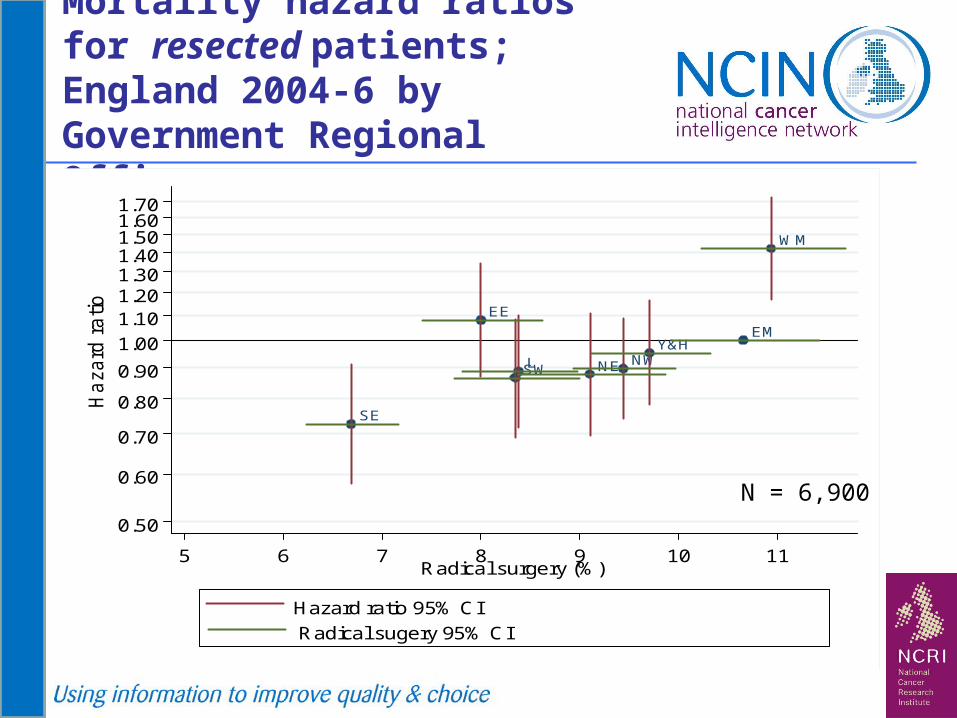
Mortality hazard ratios for resected patients; England 2004-6 by Government Regional Office
EM
EE
L NE NW
SE
SW
WM
Y&H
0.50
0.60
0.70
0.80
0.90
1.00
1.101.201.301.401.501.601.70
Ha
zard
ra
tio
5 6 7 8 9 10 11Radical surgery (%)
Hazard ratio 95% CI
Radical sugery 95% CI
N = 6,900
Page 5
Mortality hazard ratios for resected patients; England 2004-6 by Government Regional Office
EM
EE
L NE NW
SE
SW
WM
Y&H
0.50
0.60
0.70
0.80
0.90
1.00
1.101.201.301.401.501.601.70
Ha
zard
ra
tio
5 6 7 8 9 10 11Radical surgery (%)
Hazard ratio 95% CI
Radical sugery 95% CI
N = 6,900
Implications: comparing the top quintile PCT withLower 4: 5420 deaths ‘postponed’ by surgery 146 deaths related to higher resection rates
Page 6
Kelvin LauDavid Waller
Sridhar RathinamMichael Peake
Glenfield Hospital, Leicester, UK UK National Lung Cancer Audit Programme
The effects of investing in thoracic surgery on
lung cancer resection rates
Page 7
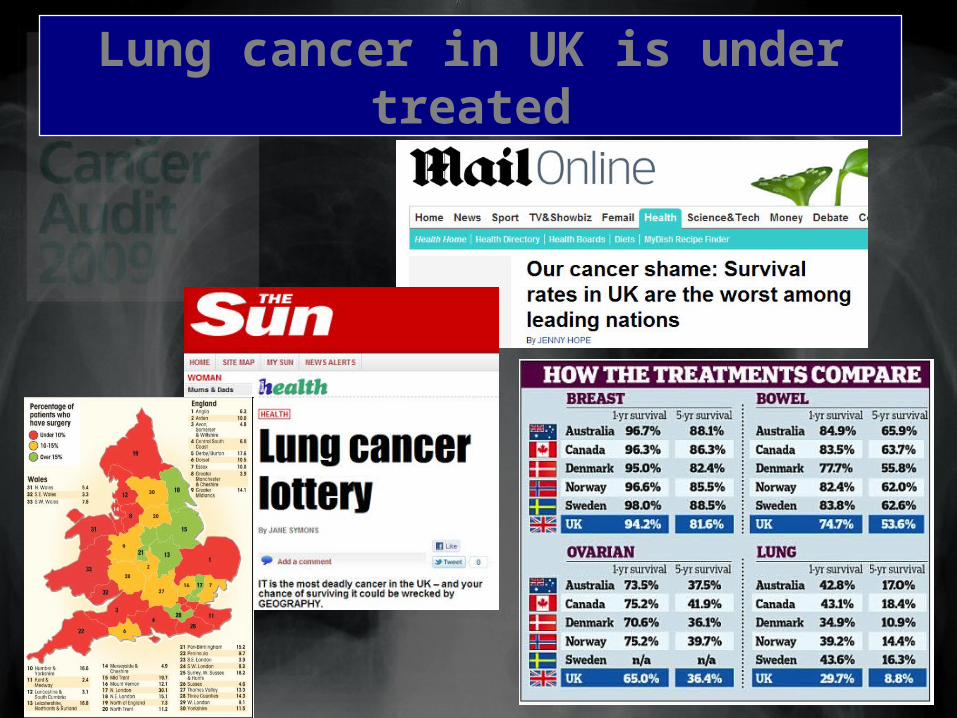
Lung cancer in UK is under treated
Page 8
There is a wide variation in lung cancer surgery in England
5.2% – 10.1%10.9% – 13.2%13.6% – 14.5%14.6% – 16.5%16.9% – 31.8%
Page 9
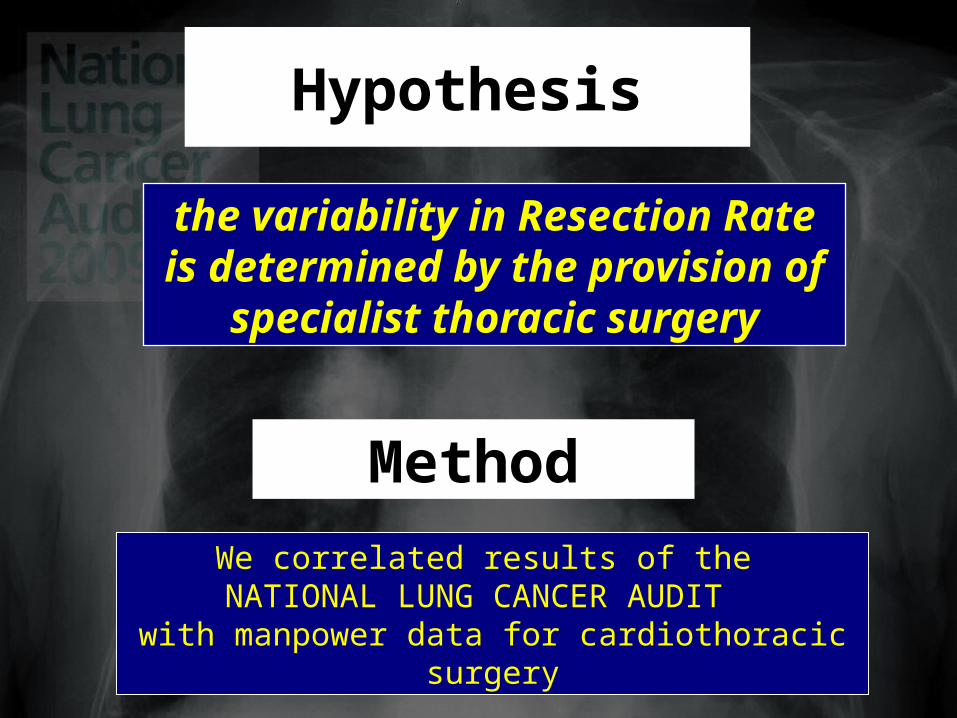
Hypothesis
the variability in Resection Rate is determined by the provision of
specialist thoracic surgery
Method
We correlated results of the NATIONAL LUNG CANCER AUDIT
with manpower data for cardiothoracic surgery
Page 10
0.0
0.5
1.0
1.5
2.0
2.5
3.0
3.5
4.0
4.5
5.0
N15
N23
N22
N20
N31
N03
N14
N08
N11
N29
N06
N21
N01
N02
N07
N38
N27
N30
N35
N33
N36
N37
N26
N12
N13
N24
SWW
N28
N25
N32
NW
W
N34
SEW
Adj
uste
d O
R (
95%
CI)
Network
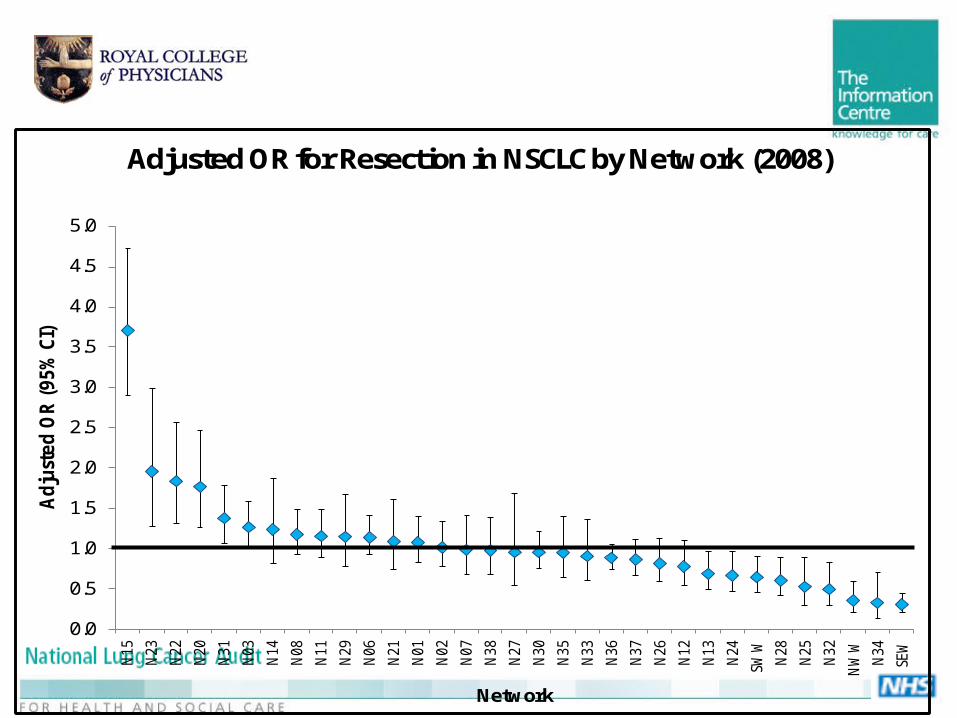
Adjusted OR for Resection in NSCLC by Network (2008)
Page 11
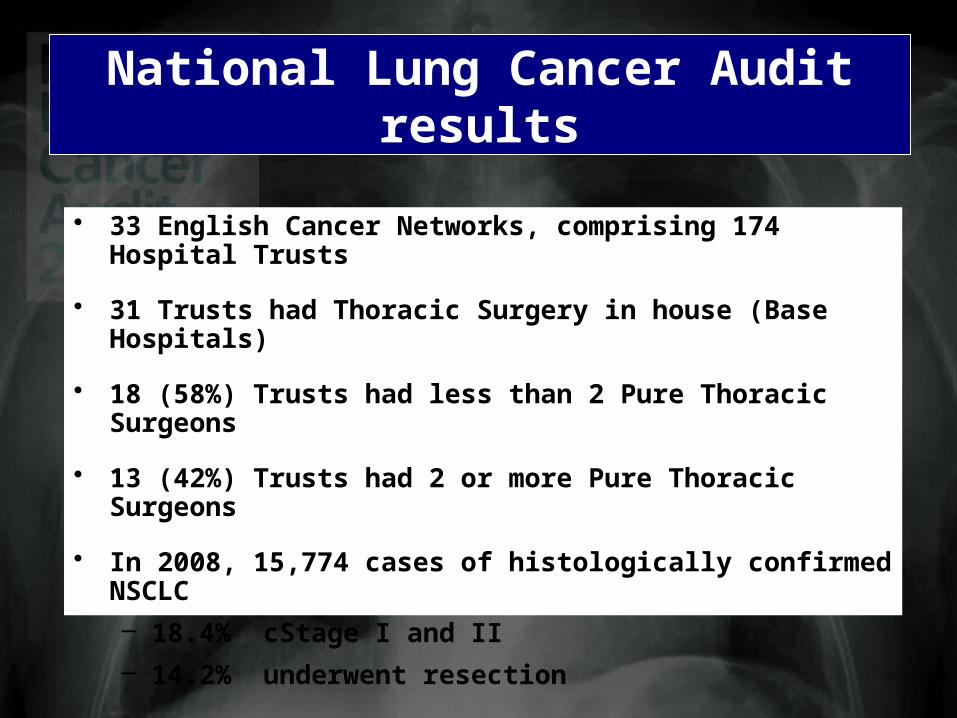
National Lung Cancer Audit results
• 33 English Cancer Networks, comprising 174 Hospital Trusts
• 31 Trusts had Thoracic Surgery in house (Base Hospitals)
• 18 (58%) Trusts had less than 2 Pure Thoracic Surgeons
• 13 (42%) Trusts had 2 or more Pure Thoracic Surgeons
• In 2008, 15,774 cases of histologically confirmed NSCLC
– 18.4% cStage I and II
– 14.2% underwent resection
Page 12
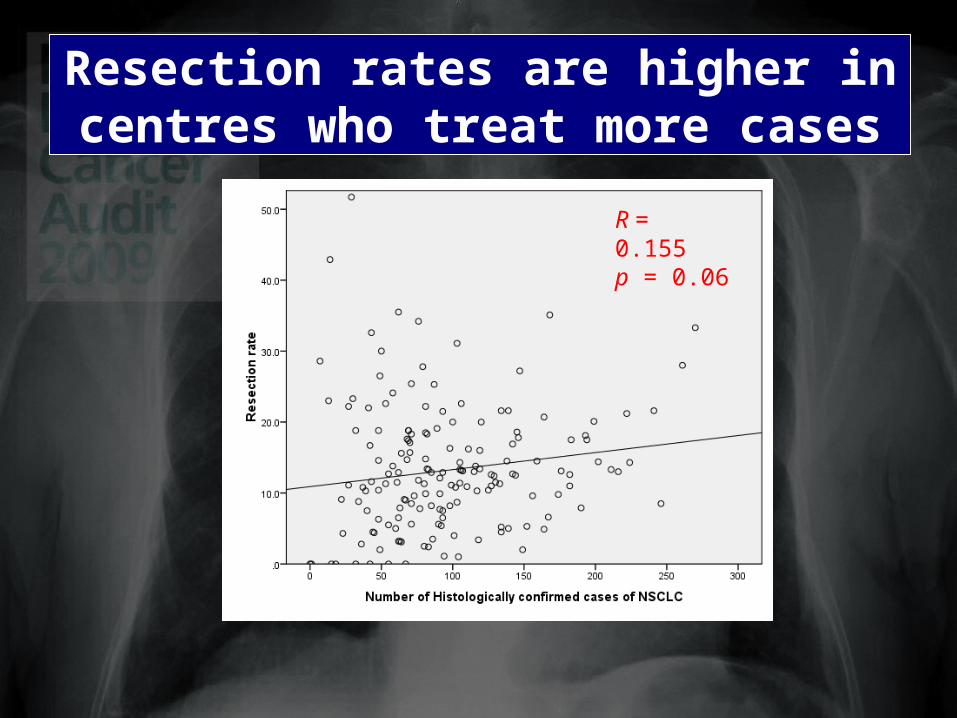
Resection rates are higher in centres who treat more cases
R = 0.155p = 0.06
Page 13
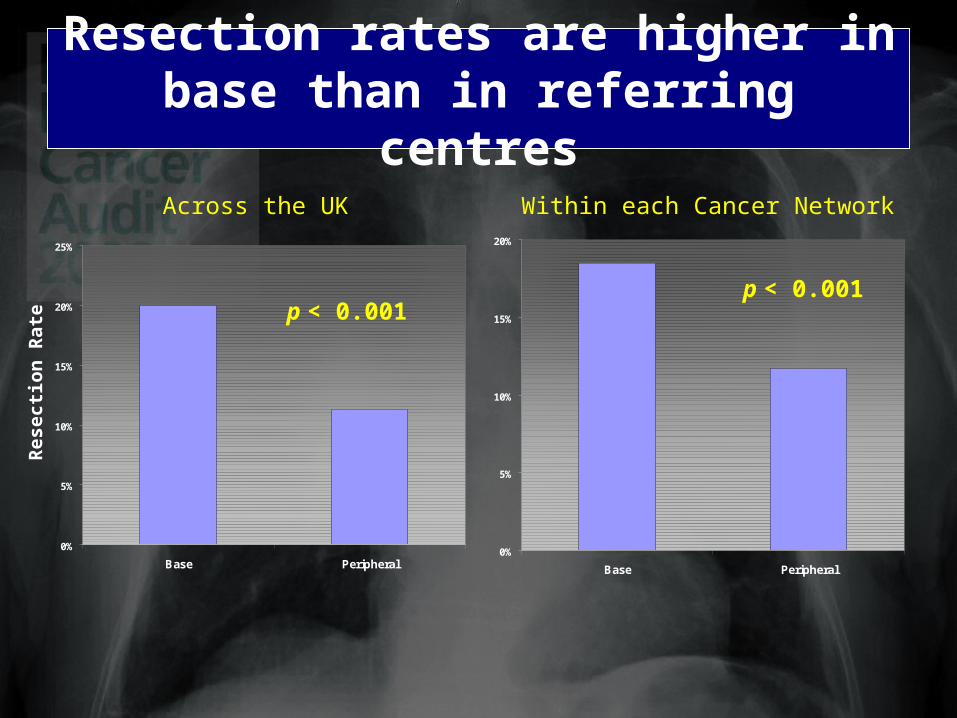
Resection rates are higher in base than in referring centres
0%
5%
10%
15%
20%
25%
Base Peripheral
p < 0.001
Res
ecti
on
Rat
e
0%
5%
10%
15%
20%
Base Peripheral
p < 0.001
Across the UK Within each Cancer Network
Page 14
0%
5%
10%
15%
20%
25%
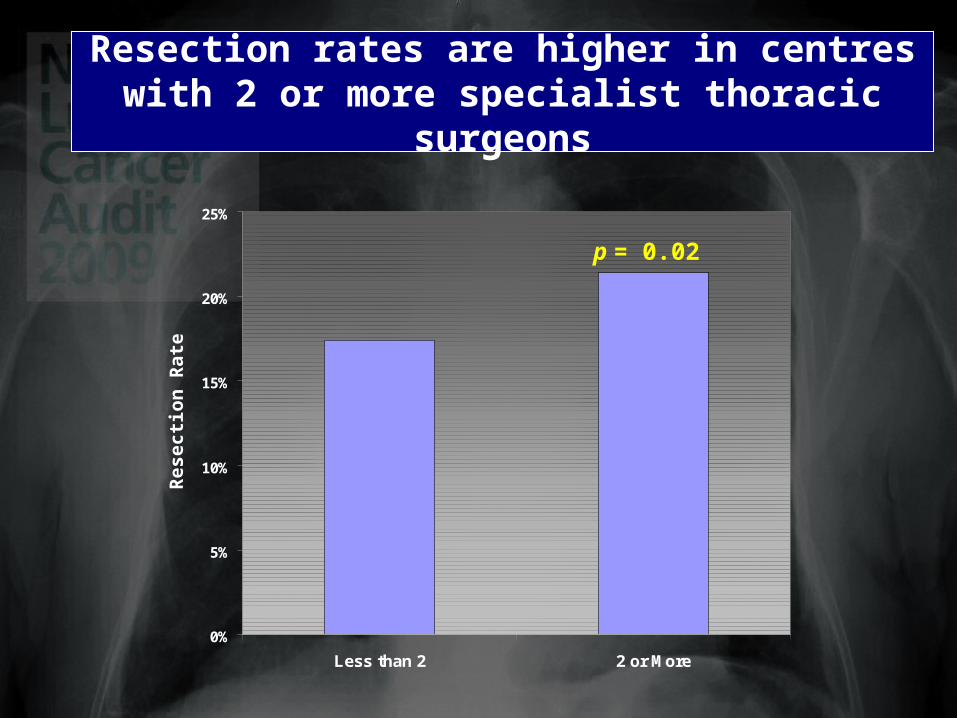
Less than 2 2 or More
Resection rates are higher in centres with 2 or more specialist thoracic surgeons
p = 0.02
Res
ecti
on
Rat
e
Page 15
0
2
4
6
8
10
12
14
16
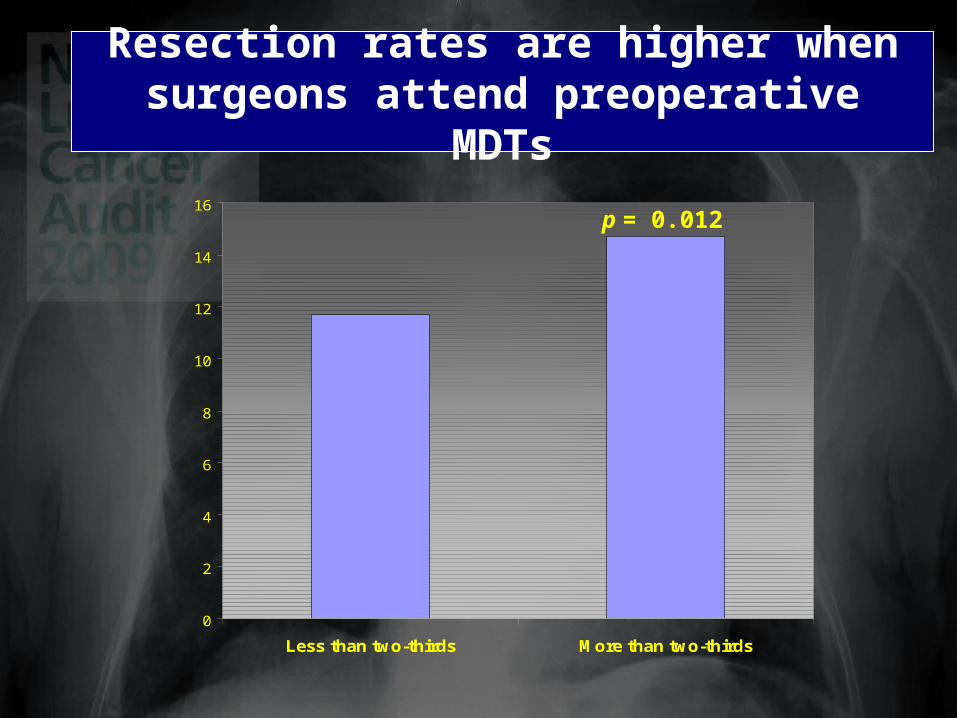
Less than two-thirds More than two-thirds
Resection rates are higher when surgeons attend preoperative MDTs
p = 0.012
Page 16
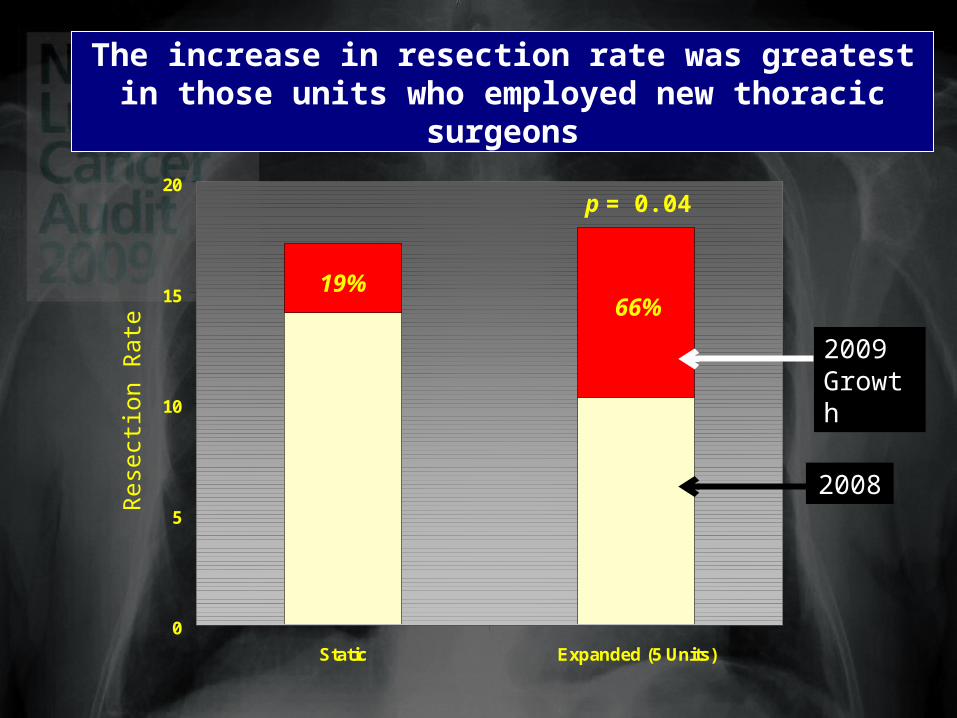
0
5
10
15
20
Static Expanded (5 Units)
The increase in resection rate was greatest in those units who employed new thoracic surgeons
p = 0.04
19%66%
2008
2009Growth
Res
ectio
n R
ate
Page 17
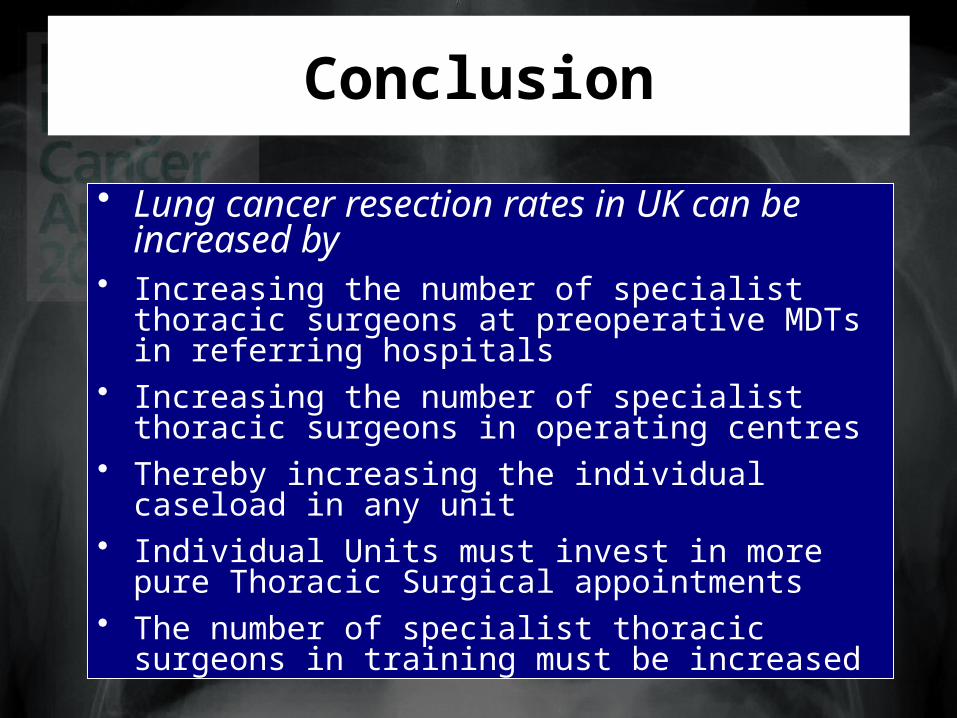
Conclusion
• Lung cancer resection rates in UK can be increased by
• Increasing the number of specialist thoracic surgeons at preoperative MDTs in referring hospitals
• Increasing the number of specialist thoracic surgeons in operating centres
• Thereby increasing the individual caseload in any unit
• Individual Units must invest in more pure Thoracic Surgical appointments
• The number of specialist thoracic surgeons in training must be increased
Page 18
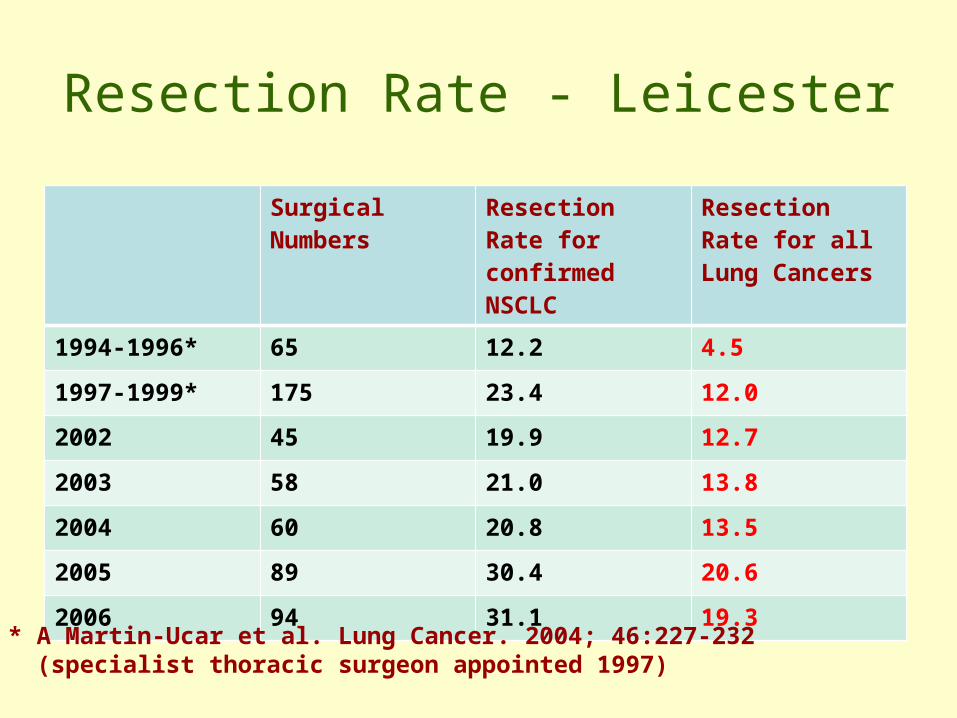
Resection Rate - Leicester
Surgical Numbers
Resection Rate for confirmedNSCLC
Resection Rate for all Lung Cancers
1994-1996* 65 12.2 4.5
1997-1999* 175 23.4 12.0
2002 45 19.9 12.7
2003 58 21.0 13.8
2004 60 20.8 13.5
2005 89 30.4 20.6
2006 94 31.1 19.3
* A Martin-Ucar et al. Lung Cancer. 2004; 46:227-232 (specialist thoracic surgeon appointed 1997)