4 Reserve Bank of New Zealand: Bulletin, Vol. 76, No. 4, December 2013
circumstances. If successful, they help provide a clear
anchor for inflation expectations, and facilitate public
understanding and endorsement of the role of monetary
policy.
Each country sets out its flexible inflation targeting
framework somewhat differently. In some cases, the central
bank itself sets the target. In other cases, the Minister of
Finance sets the target. In many countries, the target is
set jointly, as in New Zealand. New Zealand, though, is
one of the few countries with a statutory requirement to
have, and publish, a formal operational goal.
New Zealand’s current (2012) PTA is reproduced
in the Appendix.
The numerical inflation target is set out in clause
2. That clause provides the constraint: it requires the
Reserve Bank to target a specific, low rate of inflation,
which in turn provides a reference point for inflation
expectations.
The flexibility around that target is provided by
such features as:
• the “on average over the medium term” articulation
of the target;
• the 2 percentage point wide target range;
• the special circumstances (such as indirect taxes,
price effects of natural disasters and commodity
price fluctuations) that are recognised as reasons
for temporary deviations of CPI inflation from the
target range (clause 3); and
• the requirement, in the pursuit of price stability,
to avoid unnecessary volatility in a range of other
macroeconomic variables (output, interest rates,
the exchange rate), and (as of the 2012 PTA) to
have regard to the soundness and efficiency of the
financial system (clause 4).
The PTA’s inflation target specification is similar
to those in other countries, both in terms of its expression
and its quantitative parameters. Some emphasise a
band while others emphasise a point (Table 1). In most
developed countries, inflation targets are clustered around
2 percent.
Country/Region Inflation target
New Zealand Future CPI inflation outcomes between 1 and 3 percent on average over the medium term, with a focus on keeping future average inflation near the 2 percent target midpoint
Australia CPI inflation between 2 and 3 percent, on average, over the cycle
United Kingdom 2 percent as measured by the 12-month increase in the CPI
Sweden Annual CPI inflation of 2 percent
Canada 2 percent midpoint of the 1 to 3 percent inflation-control range for the 12-month rate of change in the total CPI
Norway Annual CPI of approximately 2.5 percent over time
Israel Annual rate of increase in the CPI between 1 and 3 percent
United States Inflation at the rate of 2 percent, as measured by the annual change in the price index for personal consumption expenditures
Euro area A year-on-year increase in the Harmonised Index of Consumer Prices for the euro area of below 2 percent, aim to maintain inflation rates close to 2 percent over the medium term
Japan 2 percent in terms of the year-on-year rate of change in the CPI
Poland Continuous inflation target of 2.5 percent with a permissible volatility bandwidth of ±1 percentage point assessed on the basis of the CPI on a year-over-year basis
Chile Annual CPI inflation around 3 percent most of the time, within a tolerance range of plus or minus one percentage point
Table 1Inflation target specifications in selected economies
Sources: Reserve Bank of Australia (2013), Osborne (2013), Riksbank (2010), Bank of Canada (2011), Norges Bank (2001), Bank of Israel (2012), Bank of Japan (2013), ECB 2003, Federal Reserve (2012), National Bank of Poland (2003), Banco Central de Chile (2007).
5Reserve Bank of New Zealand: Bulletin, Vol. 76, No. 4, December 2013
The source documents cited above outline both
inflation targets and other considerations that the central
bank takes into account (whether by choice or by formal
requirement) in conducting monetary policy. In that sense,
they have some parallels to New Zealand’s PTA. Such
documents, read as a whole, make clear that there are
short-term trade-offs between keeping inflation near
target and other economic variables, including output and
employment. For example, in the United Kingdom, the
Chancellor of the Exchequer’s recently renewed monetary
policy ‘remit’ to the Bank of England stated that it may wish
to allow inflation to deviate from the target temporarily,
in order to avoid undesirable volatility in output or
the exacerbation of financial imbalances. In Sweden,
the Riksbank’s explanation of the monetary policy
framework mentions a concern to stabilise production
and employment around long-term sustainable paths
and to avoid risks linked to developments in the financial
markets. Both are important considerations in the conduct
of Sweden’s inflation-targeting monetary policy.
New Zealand’s PTA is unusual in explicitly
mentioning unnecessary interest rate and exchange
rate volatility as concerns. Hunt (2004) discusses the
reasoning behind this provision. Volatility in interest rates
creates uncertainty for businesses and households, and
may cause incorrect or delayed decisions. Volatility in the
exchange rate may adversely affect the export sector by
squeezing profits when the exchange rate is very high, and
could lead to the demise of some firms that might otherwise
have turned out to be innovative and profitable in the long
run. A very low exchange rate could encourage marginal
businesses to set up that then become unprofitable when
the exchange rate returns to more typical levels, utilising
scarce resources that might have been better employed
elsewhere.4 Reflecting these concerns, the PTA also
requires that the Bank, in conducting monetary policy
in pursuit of price stability, seek to avoid unnecessary
instability in the exchange rate and interest rates.
The desire to avoid unnecessary variability in
output, interest and exchange rates has been one of
the reasons why countries have consistently preferred
a flexible approach to inflation targeting. Countries have
recognised that attempting to offset the short-term impact
on inflation of an oil price shock, for example, would typically
exacerbate any associated economic downturn. Doing
so would be unnecessary if the public remains confident
that inflation will settle back in the target range over the
medium-term. While the principle is uncontroversial,
putting it into practice can be more challenging. In general,
the concern to avoid unnecessary variability means that
interest rates are sometimes adjusted more gradually than
they would be otherwise.
Changes to the PTA in 2012PTAs have evolved considerably since the first
one in 1990. In general, PTAs have, over time, become
more explicit about the nature of the flexibility the Reserve
Bank should exercise in pursuing the inflation target
(see Reserve Bank of New Zealand, 2000). In 2002 and
2007, the Reserve Bank reviewed the successive PTAs
in the light of domestic and international experience with
inflation targeting.5 More recently, the global financial
crisis has led many central banks to focus more heavily on
how financial system developments should be treated by
monetary policy, and there has also been renewed debate
about the role of monetary policy in stabilisation policy
more generally.
There were three additions to the 2012 PTA.
First, clause 2a of the PTA now explicitly requires
the Reserve Bank to monitor “asset prices” among the
“range of price indices” it regularly examines. Successive
PTAs have required that, while targeting CPI inflation,
the Reserve Bank monitor a range of prices. The Bank
has always monitored asset prices and taken them into
account in both monetary and prudential policy (see
4 The exchange rate can also play an important shock-absorbing role. For example, when New Zealand’s terms of trade weaken (and hence inflationary pressures decline), the exchange rate typically depreciates, providing some cushion for tradables sector producers and economic activity.
5 The 2002 briefing paper on the PTA and related monetary policy issues is available at http://www.rbnz.govt.nz/monetary_policy/policy_targets_agreement/0124760.html, and the Reserve Bank’s submissions to the Finance and Expenditure Select Committee inquiry into the future monetary policy framework are available at http://www.rbnz.govt.nz/monetary_policy/about_monetary_policy/3074316.html
flexibility and constraint since its inception. The clause
4b addition continues in the direction of making more
explicit the flexibility considerations that have always
been important, while the clause 2b addition adds some
additional constraint by adding a midpoint focus (making
it more explicit that not all areas of the target range are
equally satisfactory for projected medium-term inflation).
How monetary policy is conducted over time will be the
key determinant of the impact of the new provisions.
6 Other measures of inflation expectations have also tended to be above the midpoint of the target range.
7Reserve Bank of New Zealand: Bulletin, Vol. 76, No. 4, December 2013
3 The PTA and the conduct of monetary policy in practiceSince low inflation was re-established in New
Zealand in the early 1990s, monetary policy has faced
several episodes that illustrate some of the trade-offs
between keeping projected inflation close to target, and
not generating unnecessary volatility in the economy in
the process.
For example, during the mid-2000s, the Official
Cash Rate (OCR) was raised from 4.75 percent in 2002
to 8.25 percent in 2008. Despite that marked tightening,
core inflation measures rose to around the 3 percent
upper end of the range, while headline inflation was often
outside the target range. During this time, output was
growing strongly, as were house, farm and commercial
property prices and credit. As well, the exchange rate was
highly elevated and, later in the period, commodity prices
were booming. With hindsight, monetary policy should
probably have been tightened earlier during that period, in
view of the credit developments at the time (see Chetwin
and Reddell, 2012). However, in facing these emerging
pressures there was a real concern that a sharper
tightening might also have exacerbated pressures on the
exchange rate “unnecessarily”. Another example during
this period relates to the oil price spike in 2008, when oil
prices rose to US$150 per barrel and headline inflation
rose well above the upper end of the inflation target
range. The Reserve Bank expressed concerns about the
risks of inflation expectations becoming unanchored, but
was able to use the flexibility in the framework to cut the
OCR in July 2008 even while CPI inflation was above the
top of the target range. Dealing with such issues is, of
course. not unique to New Zealand. In fact, the conduct
of monetary policy in New Zealand in response has been
similar to other countries over the past two decades,
including Australia (Kendall and Ng, 2013).
More recently, the New Zealand economy has
again shown signs of pressures in different dimensions
that the PTA requires monetary policy to consider. While
CPI inflation has been very low during much of 2012 and
2013, tracking near or below the bottom of the target range,
the exchange rate has been quite high relative to historical
averages, reflecting strong commodity export prices and
domestic interest rates at levels well above those of most
major trading partners. At the same time, house prices
and credit growth have strengthened materially.7 One
element of the PTA might have pointed to further cuts in
the OCR, possibly easing pressure on the exchange rate
in the short-term, while other elements might instead have
suggested earlier increases in the OCR, which might have
further increased the near-term pressure on the exchange
rate.
Considered judgement of the specific
circumstances at hand, and transparent conduct of policy,
are central to handling these sorts of pressures. They are
also central to the accountability of the Reserve Bank to its
Board, to the Minister of Finance, and to the general public
as the Bank makes those choices and trade-offs.
4 Alternatives to the current flexible inflation-targeting frameworkThe new Policy Targets Agreement was agreed
against a backdrop of more challenging times for monetary
policy in many other countries. During the global financial
crisis, several advanced economies, such as the United
States, the United Kingdom, Canada, Switzerland,
and Sweden, reached the “zero lower bound” effective
constraint on how low short-term nominal interest rates
could go.8 This experience has led to renewed debate
about whether alternatives to a low CPI inflation target
might better stabilise inflation and economic activity in the
presence of extreme economic weakness. Suggestions
have included nominal GDP targeting (e.g. McCallum,
2011) and price level targeting (Carney, 2012).
Both price level targeting and nominal GDP (level
or growth rate) targeting can be quite consistent with the
goal of medium-term stability in the general level of prices.
Proponents argue that these approaches would reduce
overheating during boom times and, in particular, would
better stabilise economies in severe downturns, especially
when the zero bound is hit. In the current international
7 Governor Wheeler (2013a, 2013b) discusses the current forces affecting the New Zealand economy and how the Reserve Bank is viewing them.
8 Joining Japan, which had already experienced near-zero interest rates for the majority of the previous decade.
8 Reserve Bank of New Zealand: Bulletin, Vol. 76, No. 4, December 2013
context, the argument is that a credible commitment
to get nominal GDP back to its pre-crisis trend - which
in some countries might require several years of strong
GDP growth and rapid inflation – would help to reduce real
interest rates and build greater confidence that monetary
conditions would be kept loose for a lengthy period.
There has been little debate over any of these
options in the New Zealand context. That is understandable,
since even after the deep recession of 2008/09, interest
rates have still been consistently well above the zero
lower bound. But even internationally, despite the debate,
no country has abandoned its inflation target. Indeed,
in the United States and Japan the respective central
banks have recently moved to adopt explicit inflation
targets. The costs involved with a regime shift may be
quite large, due to a lack of public familiarity with the
target measures, and revisions in the case of nominal
GDP, creating transparency and accountability issues.
Level targets, based on either prices or nominal GDP,
could be more difficult to credibly commit to than inflation
targets, because, faced with some types of shocks, cycles
in economic activity may need to be larger. Carney (2012)
discusses nominal GDP targeting and price level targeting
and the choice of the Bank of Canada – where the idea of
price level targeting was explored in considerable depth
over several years – to retain its flexible inflation targeting
framework.
Alternative treatments of exchange rate volatility
within an inflation-targeting framework have also come
under consideration internationally in recent years,
with the IMF being among those prompting renewed
debate, especially for emerging economies (see e.g.
Ostry et al., 2012). Intervention in foreign exchange
markets to smooth short-term exchange rate volatility
alongside inflation targeting is most likely to be effective
in economies with less developed and integrated financial
markets.9 In developed economies, however, the evidence
suggests little effect of intervention beyond very short time
horizons (e.g. Fatum, 2006). IMF authors (Blanchard et
al (2013, p8)) have recently noted that “the answer to the
feasibility question [regarding using foreign exchange
market intervention to actively target the exchange rate] is
probably no for economies with highly integrated financial
markets (and almost certainly no for small, very open,
advanced economies–say, New Zealand).”
5 ConclusionPrice stability is the statutory goal for New
Zealand’s monetary policy. That reflects the widely-
accepted principle that monetary policy’s best contribution
to long-run economic growth comes through ensuring
low and stable inflation. Experience – and the bulk of
the theory – suggests that monetary policy is unable to
do much to improve the long-run productive potential of
the economy. Potential output is determined by structural
factors such as innovation and the supply of labour and
capital. Monetary policy, by maintaining medium-term
price stability, helps sets the background for these other
factors to flourish.
Monetary policy also has an important role to play
in handling the shorter-term economic shocks that face
every economy. Responding very actively with monetary
policy to shocks that boost inflation temporarily can
generate unnecessary and costly volatility. But excessively
lax policy can allow imbalances to build up and inflation
expectations to increase, which is also costly.
The New Zealand monetary policy framework
– very similar in its essential features to those of other
advanced countries with floating exchange rates –
recognises all these imperatives. However, it does not,
and cannot, specify a mechanical approach to handling all
possible economic circumstances; instead, the complex
and difficult trade-offs have to be judged and explained by
the Reserve Bank in each particular case.
New Zealand’s PTA-based approach to flexible
inflation targeting has evolved with experience. The
modification of the inflation target in the 2012 PTA, to
require a focus on keeping future average inflation near
the 2 percent target midpoint, is intended to help to solidify
the midpoint as an anchor for inflation expectations. The
explicit inclusion of requirements to have regard to the
9 See Chetwin and Munro (2013) for a discussion of different emerging and developed economies’ choices regarding exchange rate intervention, independent monetary policy and openness of capital markets.
9Reserve Bank of New Zealand: Bulletin, Vol. 76, No. 4, December 2013
efficiency and soundness of the financial system and to
monitor asset prices emphasises the post-crisis world in
which financial developments are given more prominence.
These amendments to the PTA continue the evolution of
New Zealand’s approach to flexible inflation targeting,
while keeping a strong emphasis on the importance of
transparency in the conduct of monetary policy.
ReferencesBanco Central de Chile (2007) ‘Monetary
policy in an inflation targeting framework’, January,
11Reserve Bank of New Zealand: Bulletin, Vol. 76, No. 4, December 2013
Appendix A
Policy Targets Agreement
This agreement between the Minister of Finance and the Governor of the Reserve Bank of New Zealand (the
Bank) is made under section 9 of the Reserve Bank of New Zealand Act 1989 (the Act). The Minister and the Governor
agree as follows:
1. Price stabilitya) Under Section 8 of the Act the Reserve Bank is required to conduct monetary policy with the goal of maintaining
a stable general level of prices.
b) The Government’s economic objective is to promote a growing, open and competitive economy as the best
means of delivering permanently higher incomes and living standards for New Zealanders. Price stability plays
an important part in supporting this objective.
2. Policy targeta) In pursuing the objective of a stable general level of prices, the Bank shall monitor prices, including asset prices,
as measured by a range of price indices. The price stability target will be defined in terms of the All Groups
Consumers Price Index (CPI), as published by Statistics New Zealand.
b) For the purpose of this agreement, the policy target shall be to keep future CPI inflation outcomes between 1 per
cent and 3 per cent on average over the medium term, with a focus on keeping future average inflation near the
2 per cent target midpoint.
3. Inflation variations around targeta) For a variety of reasons, the actual annual rate of CPI inflation will vary around the medium-term trend of
inflation, which is the focus of the policy target. Amongst these reasons, there is a range of events whose impact
would normally be temporary. Such events include, for example, shifts in the aggregate price level as a result
of exceptional movements in the prices of commodities traded in world markets, changes in indirect taxes,
significant government policy changes that directly affect prices, or a natural disaster affecting a major part of the
economy.
b) When disturbances of the kind described in clause 3(a) arise, the Bank will respond consistent with meeting its
medium-term target.
12 Reserve Bank of New Zealand: Bulletin, Vol. 76, No. 4, December 2013
4. Communication, implementation and accountabilitya) On occasions when the annual rate of inflation is outside the medium-term target range, or when such occasions
are projected, the Bank shall explain in Policy Statements made under section 15 of the Act why such outcomes
have occurred, or are projected to occur, and what measures it has taken, or proposes to take, to ensure that
inflation outcomes remain consistent with the medium-term target.
b) In pursuing its price stability objective, the Bank shall implement monetary policy in a sustainable, consistent
and transparent manner, have regard to the efficiency and soundness of the financial system, and seek to avoid
unnecessary instability in output, interest rates and the exchange rate.
c) The Bank shall be fully accountable for its judgements and actions in implementing monetary policy.
13Reserve Bank of New Zealand: Bulletin, Vol. 76, No. 4, December 2013
1 IntroductionIn May 2013, the Governor of the Reserve Bank
and the Minister of Finance signed a Memorandum of
Understanding setting out the objectives, governance,
and instruments for macro-prudential policy.2 The
memorandum stipulates that the Reserve Bank will
publish information on its risk assessment framework,
including the indicators that it uses to guide its macro-
prudential policy settings (RBNZ, 2013).3 Accordingly, the
Reserve Bank has been developing its indicators in this
area as part of the development of the macro-prudential
framework.
This article provides an overview of the role
of macro-prudential indicators (MPIs) currently used
in assessing ‘systemic risk’ – the risk of disruptions to
financial services caused by an impairment of all or
parts of the financial system, that can have serious
negative consequences for the real economy (IMF, 2011).
It presents some of the key MPIs the Reserve Bank
analyses to assess the build-up of risk across the New
Zealand financial system, including those indicators that
helped frame the recent decision to implement residential
mortgage loan-to-value (LVR) restrictions. The article
concludes with a brief discussion of the role of some
indicators in determining when to remove or release
macro-prudential policy.
2 Macro-prudential indicators – an overview
2.1 Role of MPIs in the Reserve Bank’s macro-prudential policy frameworkGood policy needs sound data. The collection and
reporting of MPIs mark the first step in the Reserve Bank’s
MPIs are an integral part of a systemic risk assessment
which includes consideration of emerging risks such as
whether debt levels are becoming ‘excessive’, asset
prices ‘over-valued’, or lending standards becoming too
loose.
Individual MPIs can offer a general guide based on
the past historical experience of the indicator concerned,
but the indicators are not used mechanically to implement
macro-prudential policy. Risks can build up in the financial
system from different sources and in many different ways.
Consequently, judgement is required in considering the
case for macro-prudential intervention, selecting the
appropriate instrument to deploy, and in deciding when to
remove any instrument (steps 2-4). Nevertheless, robust
and reliable indicators provide the basis for better decision
making.
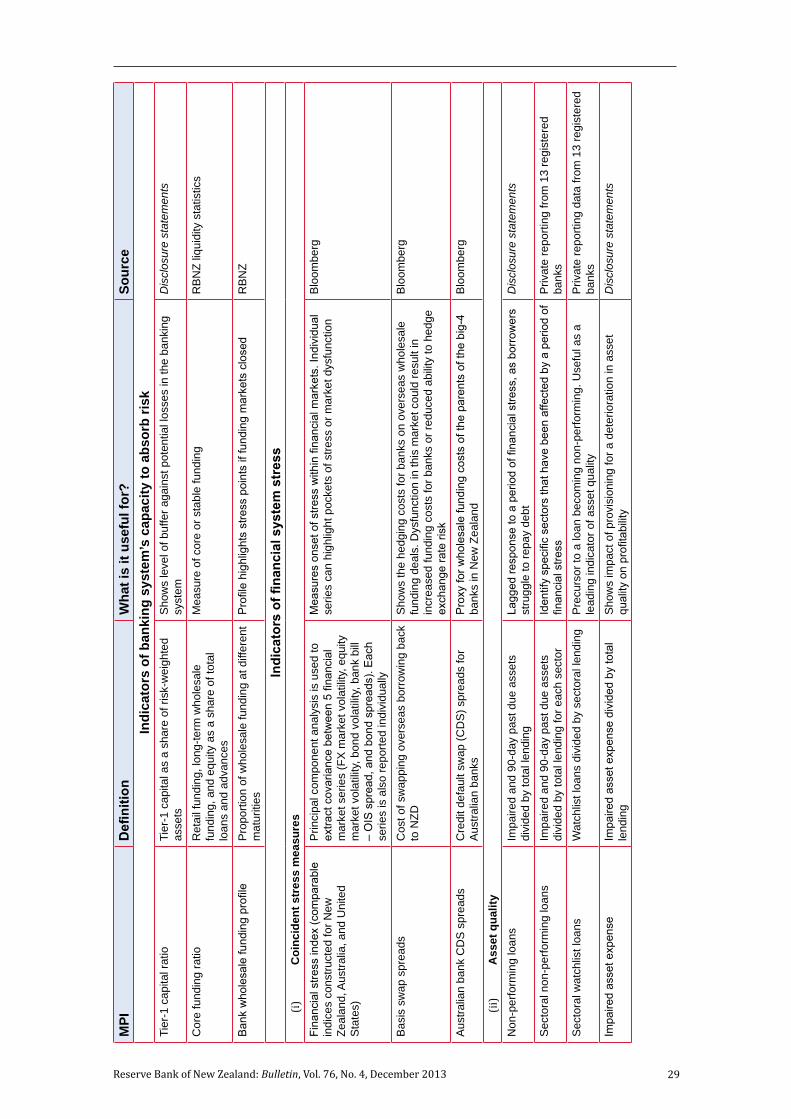
Measuring systemic risk: the role of macro-prudential indicators Tony Wolken1
This article outlines some of the key indicators the Reserve Bank uses to help inform macro-prudential policy
decisions. Macro-prudential indicators (MPIs) play an important role in the identification of financial system risk;
the assessment of the banking system’s capacity to weather periods of financial stress; and in signalling periods of
financial stress. The indicators inform decisions to both deploy and remove macro-prudential instruments. The article
explains how the MPI framework helped to frame the recent decision to impose residential mortgage loan-to-value
(LVR) restrictions.
1 The author would like to thank Chris Hunt, Anella Munro, Roger Perry and other colleagues at the Reserve Bank for their helpful comments.
2 See Rogers (2013) for an overview of the macro-prudential policy framework.
3 The Reserve Bank will begin publishing a full set of MPIs in March 2014. The data for MPIs discussed in the main text of this article are available here: http://www.rbnz.govt.nz/research_and_publications/reserve_bank_bulletin/2013/2013dec76_4wolken_data.xls
14 Reserve Bank of New Zealand: Bulletin, Vol. 76, No. 4, December 2013
2.2 Types of indicatorsSystemic risk indicators can be grouped into two
main categories (Borio and Drehmann, 2009a):
• ‘Time-dimension’ indicators, which measure how
systemic risk evolves over the financial cycle.
• ‘Cross-sectional’ indicators, which measure how
systemic risk is distributed within the financial
system at a point in time.
The time dimension is linked to the idea that there
is a strong tendency for both financial intermediaries
and borrowers to take on excessive risk in the upswing
of a financial cycle, and become overly risk averse in a
downturn. This procyclicality as a source of systemic
risk arises from a number of features of the financial
system such as information frictions, and incentive and
coordination problems.4 MPIs in this dimension aim to
give a sense of the degree of procyclicality and benchmark
at what point risk-taking, debt levels or asset price
developments are becoming excessive or unsustainable.
Cross-sectional systemic risks arise from
institutional concentration (the ‘too-big-to-fail’
phenomenon); the interconnectedness of different financial
institutions, and; common exposures, where different
institutions are exposed to the same risk. Cross-sectional
risk can provide an important amplification mechanism for
cyclical developments. In New Zealand, many of these
aspects of cross-sectional risk are addressed through the
underlying prudential framework, rather than through the
use of specific macro-prudential instruments per se.
The Reserve Bank’s Macro Financial Committee
(MFC) examines a set of indicators in a quarterly MPI
Report (primarily focused on indicators across the time
dimension). Some indicators in the Report help identify
the build-up of risk (early warning indicators); benchmark
the capacity of the banking system to absorb risk; or signal
when a period of financial stress has materialised (near-
coincident indicators, figure 2). The latter set of indicators
can help to assist decisions concerning the removal of
macro-prudential policy.
Figure 1The macro-prudential decision framework
MACRO-PRUDENTIALINTERVENTION
Step 1: Systemic risk assessment
Step 2: Case for macro-prudential intervention
Step 3: Instrument selection
Step 4: Implementation
Are debt levels excessive?
Are asset pricesovervalued?
Are lending standardsdeteriorating significantly?
Is this a macro-prudential issue?
What is the case for intervention?
What are the intervention objectives/targets?
Which instrument(s) best fits the objective(s)?
What is the optimum mix of tools?
How should the tool(s) be applied?
Exit strategyAre the benefits of intervention
likely to outweigh the costs?
Note: The red shared area illustrates cyclical amplification arising from cross-sectional risks.
Figure 2Stylised financial system risk and MPIs
Sys
tem
ic ri
sk
Time
Coincident and lagged indicators
Early warning indicators Early warning indicators
Indicators of banking system resilience
Period of financial stress
MPIs
4 For further discussion see Bank of England (2009) and Nicolò, G et al (2012). See Craigie and Munro (2010) for a discussion of procylicality in the New Zealand financial system.
15Reserve Bank of New Zealand: Bulletin, Vol. 76, No. 4, December 2013
2.3 What is a good indicator?The Reserve Bank’s macro-prudential decision
framework suggests several desirable features of a good
indicator that help to identify the build-up of systemic risk,
the subsequent materialisation of stresses in the financial
system, and the capacity of the system to absorb risk.
Relevant
Some risks to financial stability, such as excessive
credit expansion, are characteristic of all financial systems
and therefore imply a common set of MPIs. Other risks
might be more country-specific and relate to the particular
structure of the financial system (see section 3), or the way
the economy is exposed to the global environment. For
example, the New Zealand financial system is exposed
to risks arising from the importance to the economy of the
agricultural sector and, in recent years, of the dairy sector
in particular.
Collectable
While New Zealand has many of the core
indicators used overseas, some indicators used in other
jurisdictions might be unavailable in New Zealand. For
example, most New Zealand banks are not listed on the
domestic stock exchange, so indicators that use market
pricing of bank equity risk are unavailable.
Comprehensive and dynamic
Macro-prudential indicators should aim to cover
the whole financial system. Attention has naturally
focused on banks as the largest participants in the
financial system, but the GFC drew attention to the
risks concentrated in parts of the ‘shadow’ or non-bank
system (Adrian, Covitz and Liang, 2013). Even though
the non-bank lending sector is currently very small in New
Zealand, it is important to monitor developments there
as the sector could be a source of systemic risk in the
future. Regulators need to be dynamic to keep abreast of
building risks, particularly if the implementation of macro-
prudential tools directed at the banking system results in
‘regulatory leakage’.5 We expect the indicator set to evolve
over time.
Forward looking
Indicators are required that provide an early
warning of building financial stress in sufficient time for
policy action to be taken. In practice, different indicators
give warnings at different time horizons, and therefore it
will be necessary to assess a mix of indicators, including
‘contrarian’ indicators that might suggest when current
financial conditions look ‘too benign’.
Accurate
The signal from early warning indicators will never
be exact. If an indicator warns of a crisis that does not
eventuate, then efficiency costs may be incurred that
reduce overall welfare. If no signal is issued and a period
of financial stress or, worse still, a crisis occurs, then
there may be large social costs of the kind seen in many
economies during and after the GFC. Policymakers have
to assess the probability of both types of ‘errors’ occurring
as part of a cost-benefit analysis of macro-prudential
action (or inaction). An accurate indicator should therefore
minimise ‘noise’ or the extent of false calls.
3 Structural features of the New Zealand financial system and the choice of MPIsFour key features of the New Zealand financial
system influence the specific choice of MPIs.
Banks play a large role
New Zealand banks account for around 80 percent
of total financial system assets and around 97 percent of
lending from domestic financial institutions.6 Total bank
lending is around $320 billion, or 148 percent of annual
gross domestic product (GDP).
5 See box C of the November 2013 Financial Stability Report for a discussion of regulatory leakage.
6 Lending from financial institutions located offshore is another potential source of credit for New Zealand households and firms. Data from the Balance of Payments accounts suggest, however, that this direct cross-border lending is very small. This contrasts with many other jurisdictions where direct cross-border lending plays a greater role.
16 Reserve Bank of New Zealand: Bulletin, Vol. 76, No. 4, December 2013
Lending outside of the banking sector is small
by comparison (figure 3).7 Non-bank lenders accounted
for 10 percent of total lending just before the GFC, but
receiverships, mergers and exit to the banking sector
have meant the sector now accounts for a much smaller
share of total lending. In addition, equity and corporate
bond markets play a much smaller role as a source
of business finance in New Zealand than in most other
developed economies.
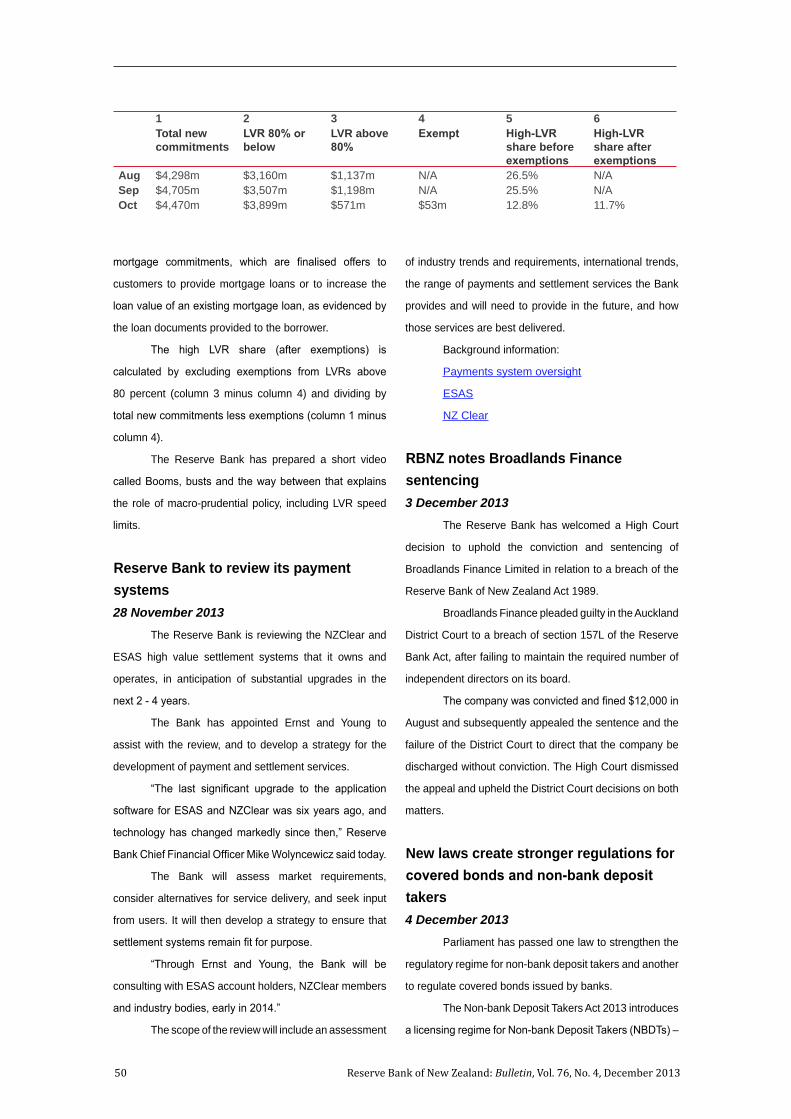
LVR residential mortgage lending in October 2013 (see
7 There is also very little ‘off-balance’ activity by New Zealand banks used to fund lending (such as that involved in the ‘securitisation’ of residential mortgages), compared to banks elsewhere.
Dairy sector lending is a large proportion of
agricultural lending
Risks in the agriculture sector stem from drought,
or a sharp decline in commodity prices which could
negatively affect rural incomes and land values. A decline
in rural incomes and land values would fall hardest on
those farms most in debt. Agricultural lending amounts
to around 15 percent of total bank lending, and of this,
around 60 percent is lent to the dairy sector (figure 5).
17Reserve Bank of New Zealand: Bulletin, Vol. 76, No. 4, December 2013
Offshore funding has been a high proportion of
bank funding
In recent decades the banking system has relied
heavily on offshore wholesale funding. This has reflected
inadequate domestic savings relative to the investment
needs of the economy, and hence persistent current
account deficits and a large net external liability position.
A key source of financial system risk has been the roll-
over risk associated with this reliance on global funding
sources – much of which was previously very short-term
(figure 6). The introduction of the core funding ratio (CFR)
requirement in 2010, designed to increase the stability of
banks’ funding, has moderated that risk. Nevertheless, the
banking system still relies on a greater share of offshore
funding relative to banks in other jurisdictions.
4 Constructing MPIs for New ZealandThis section explains some of the key indicators
used in the Reserve Bank’s MPI Report, and the risk
factors they each aim to capture. The MPIs in the Report
can be categorised into those indicators that:
1. Identify the build up of risk (early warning
indicators), including those related to:
• an ‘excessive’ build up in credit;
• ability to repay debt;
• inflated asset prices, and;
• deteriorating lending standards.
2. Signal when a period of financial system stress
has materialised.
3. Assess the banking system’s capacity to absorb
risk.
Each group of indicators is briefly explained
below, with a fuller set of MPIs the Reserve Bank currently
considers listed in the appendix.
4.1 Identifying the build up of riskAssessing whether a build up in credit is
‘excessive’
During a financial cycle, rising business and
household optimism leads to an increased demand for
loans to fund projects and asset purchases. Credit growth
may be amplified by a relaxation in lending standards as
banks respond to a decline in non-performing loans and
the rising value of borrowers’ collateral. This makes credit
measures some of the most important indicators of rising
systemic risk.
The Reserve Bank examines a range of credit
measures for the financial system as a whole, and for
each of the major sectors – household, business and
agriculture.
• The rate of growth of credit. While not all credit
booms end with a period of financial stress, severe
financial crises are almost always preceded by a
rapid increase in credit. By itself, however, the rate
of growth is an unreliable indicator as credit may
be expanding for a range of reasons, including
productivity growth in the economy. The rate of
credit growth may provide lead information on
Figure 6Offshore bank funding(percent of GDP)
Source: Statistics New Zealand.Note: Series derived from Balance of Payments data. Short-term is
less than one-year to maturity.
0
10
20
30
40
50
60
0
10
20
30
40
50
60
2000 2002 2004 2006 2008 2010 2012
Short-term liabilities
Long-term liabilities
% %
The features of New Zealand’s financial system
described above imply a set of MPIs heavily weighted to
assessing the risks specific to the banking system as well
as the banking system’s capacity to weather a shock to
balance sheets. Given the nature of banks’ exposures,
a broad set of indicators related to developments in both
the housing and agricultural sector are important, as are
funding-related indicators.
18 Reserve Bank of New Zealand: Bulletin, Vol. 76, No. 4, December 2013
developments in the credit-to-income ‘gap’ (see
below).
• The ratio of credit relative to income. At the
economy-wide level this is the ratio of total system
credit relative to GDP. At the sectoral level a proxy
measure for income is used. A rise in credit relative
to income can be a concern with international
experience showing that rapid increases in the
ratio often precede financial crises. However,
there can also be reasons unrelated to system
risk for increases in credit-to-income measures.
For example, emerging countries have found
that financial system liberalisation has been
associated with a significant rise in the ratio. A
similar effect may have occurred in New Zealand
after the financial deregulation of the 1980s.
• The credit-to-income ‘gap’. This measure shows
the difference between the level of credit-to-
income and its trend, and therefore allows for
other influences on the trend such as financial
deepening within the economy. The Bank for
International Settlements (BIS) recommends
credit-to-income gaps as a useful early warning
indicator of future periods of financial system
stress.8 The Reserve Bank calculates credit-to-
income gaps for the system (the credit-to-GDP
gap), and for each of the major sectors (see figure
Figure 8Credit-to-GDP and DSR gaps(percent of GDP)
Source: Statistics New Zealand, RBNZ SSR, RBNZ calculations.Note: The horizontal line indicates the upper threshold of the
credit-to-GDP gap range for when a crisis signal is issued at the three-year horizon, aligned with the six percent DSR threshold at a one-year ahead horizon.
1980 1984 1988 1992 1996 2000 2004 2008 2012-5
-3
-1
1
3
5
7
9
-17
-13
-9
-5
-1
3
7
11
15
Credit-to-GDP gap
DSR gap (RHS)
% %
Deteriorating ability to repay debt
A significant deterioration in borrowers’ ability to
repay debt increases the fragility of the financial system.
The debt service ratio (DSR) measures the proportion
of income that is required to service both principal and
interest costs. This indicator can be calculated as a ‘gap’
or level measure for the system as a whole (figure 8), and
for the major sectors (figure 9).9 An elevated DSR suggest
borrowers have less spare income after debt repayments
to absorb an unexpected rise in debt service costs or other
expenses, or a loss of income.
Financial liberalisation and innovation have
facilitated a structural increase in the DSR over time.
Interest rates have declined steadily over the past 20
years, increasing firms’ and households’ capacity to
borrow. However with lending rates now at 30-year lows, a
higher debt burden makes the economy more vulnerable
to a rise in interest rates and rising servicing requirements.
To take account of long-term trends in the structure of the
financial system, the DSR is calculated using deviations
from a 15-year moving average.
Source: Statistics New Zealand, RBNZ SSR, RBNZ calculations.Note: Where available, the average interest rate paid is used
to compute interest payments. Principal repayments are estimated assuming a constant average time to maturity.
Figure 9Sectoral DSRs levels(principal and interest as a share of income)
0
2
4
6
8
10
12
14
16
18
20
0
5
10
15
20
25
30
35
40
1980 1984 1988 1992 1996 2000 2004 2008 2012
Business/agriculture (% operating suplus)
Household (% disposable income, RHS)
% %
9 For more information, see box B of the November 2013 Financial Stability Report.
20 Reserve Bank of New Zealand: Bulletin, Vol. 76, No. 4, December 2013
Box A The credit-to-GDP gap – technical discussion
BIS researchers have recommended the use
of the credit-to-GDP gap as an early warning indicator
of periods of financial stress. In cross-country empirical
studies, the gap measure was found to increase
substantially three to five years before a financial stress
event. When combined with other indicators such as
the debt servicing ratio and asset price information
(discussed in the main text), it has been found to predict
many episodes of impending financial stress. Few such
stress events occurred without a preceding signal from
the credit-to-GDP gap, but not all signals from the credit-
to-GDP gap have been followed by an episode of serious
financial stress in the country concerned. Changes
in the credit-to-GDP gap can be particularly useful
because they allow policymakers time to consider policy
responses to growing financial imbalances while looking
for corroborating information from other indicators.
The credit-to-GDP gap suggests credit growth
can be considered ‘excessive’ when the ratio rises
significantly above its long-term trend, creating a
large positive ‘gap’. The long-term trend is calculated
using a smoothing technique that removes the cyclical
component from the data – a Hodrick-Prescott (HP)
filter, with a lambda of 400,000. The trend is calculated
in real-time, using only information available up until that
point in time.10 This choice of lambda implies the credit
cycle is longer than the business cycle, consistent with
significant financial contractions occurring about every
20 to 25 years. This shows what policymakers at the
time were seeing when making decisions, without these
being revised as the end-point changes.
Thresholds are used to indicate when a positive
gap might prompt policymakers to consider macro-
prudential intervention. The BIS suggests the use of a
range rather than point thresholds for policy purposes –
2-10 percent for the gap, depending on the country and
policymaker’s preference (Borio and Drehman, 2009b).
For an economy that is already highly indebted on a
credit-to-GDP basis, a threshold closer to 2 percent is
recommended.
In the New Zealand context the credit-to-GDP
gap would have provided a reasonable signal of growing
financial imbalances leading into the GFC (Hunt, 2013).
Had a macro-prudential framework been in place prior
to the GFC, the elevated gap measure (figure A2) would
have prompted policymakers to seriously consider the
deployment of macro-prudential policy measures during
2004/05 to address the increase in systemic risk.
Figure A1Private sector credit-to-GDP
Figure A2Private sector credit gap and growth
10 For a critique of the BIS approach based on problems calculating credit gaps in ‘real time’, see Edge and Meisenzahl (2011). For the BIS rejoinder see Drehmann et al (2011).
21Reserve Bank of New Zealand: Bulletin, Vol. 76, No. 4, December 2013
The credit-to-GDP gap can be less useful in the
aftermath of a large credit boom, such as the one New
Zealand experienced during 2002-2007. Following such
periods, the statistical estimate of the trend credit-to-GDP
will typically continue to increase. This implicitly assumes
that the risks from the previous credit boom dissipate
rapidly, so that a further period of very elevated credit
growth is required to generate another early warning
signal. This assumption is particularly questionable
in the current environment, where, for example, the
level of indebtedness is historically high, house prices
remain overvalued, and where there has been no recent
structural change, such as a financial liberalisation or an
acceleration in underlying productivity growth, that could
rationalise further trend increases in indebtedness. As a
result, our judgement has been that a credit-to-GDP gap
indicator does not adequately capture the increase in
systemic risk currently associated with rapid house price
growth and the recovery in housing-related credit. This
underscores that it is necessary to examine a range of
indicators, avoiding any sort of mechanical approach,
when assessing a build-up of systemic risk.
International research has suggested that the
DSR is best suited to providing a warning around one year
in advance of a period of financial stress.11 Consequently,
the DSR can be a useful indicator of the rising probability
of future periods of financial system stress, if used to
corroborate information from the credit-to-GDP gap
and other credit measures. In line with the international
research, the aggregate DSR for New Zealand issued
warnings later than the credit-to-GDP gap in the run-up to
the 2008 financial crisis (figure 8).
Inflated asset prices
Credit growth often supports asset price inflation,
which in turn can support further credit growth by easing
‘collateral constraints’ on borrowers. This amplification
process works in reverse in a downturn. For that reason,
deviations of asset prices from long-term trends have
proved useful in helping to predict periods of financial
system stress (Borio and Drehman, 2009b). In particular,
property prices tend to show exceptionally strong growth
ahead of a financial stress event. Property prices can also
fall rapidly in a period of financial stress, as borrowers’
ability to repay declines, collateral constraints become
binding and a ‘fire sale’ dynamic sets in.
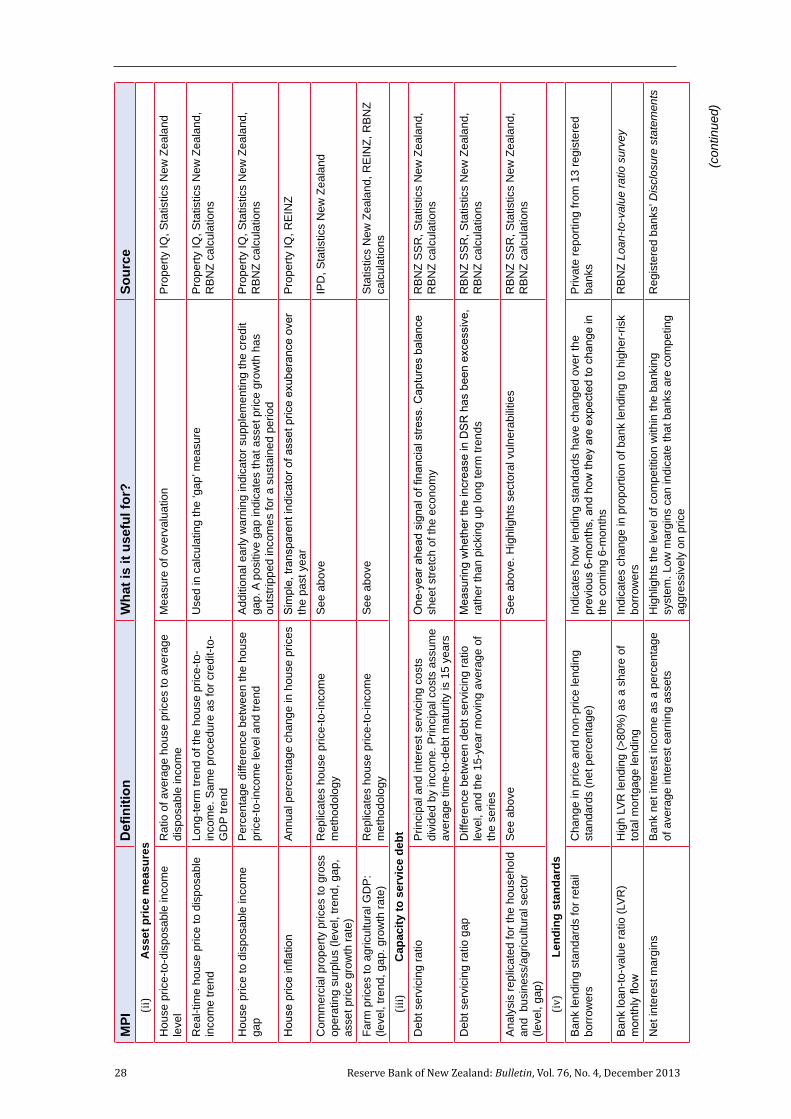
The Reserve Bank monitors asset price
developments in the residential, commercial, and
agricultural sectors (figure 10, overleaf). Property prices for
these sectors are compared to a proxy for sectoral income
to guide the level of ‘over’ or ‘undervaluation’. The use
of asset price-to-income ‘gaps’ helps to corroborate the
information coming from credit-based MPIs in assessing
the scope for financial system stress.12
Deteriorating lending standards
During the upswing in the credit cycle, lending
standards within the financial system often relax in
response to a fall in formal measures of risk, helping
to support overall credit growth. Conversely, lending
standards can tighten significantly during a period of stress
as measures of risk rise, making it difficult for otherwise
creditworthy borrowers to obtain credit. Consequently
lending standards can amplify the financial cycle, both in
the price and non-price terms at which banks are willing to
provide credit to borrowers.
11 A DSR above six percent (relative to its 15-year moving average) provides this one-year ahead signal of future financial stress (see Drehmann and Juselius, 2012 and 2013).
12 These asset price gaps are only as good as the underlying asset price series. A commercial property ‘gap’ is not shown in figure 10 due to the absence of a reliable commercial property price series that covers a long time span. This is unfortunate, as exposure to commercial property assets has been an important factor in many previous financial stress events, including recent finance company failures and the financial crisis in the late 1980s.
22 Reserve Bank of New Zealand: Bulletin, Vol. 76, No. 4, December 2013
During the late stages of a credit boom overall
lending standards may become excessively loose for
two reasons. First, banks may extend lending to less
creditworthy borrowers – for example borrowers with very
little equity. Second, the shadow banking system, which
typically lends to riskier projects – for example commercial
property development – may expand significantly.
The Reserve Bank monitors a range of lending
standard indicators. These measures include residential
mortgage LVRs, and bank net interest margins. Twice a
year the Reserve Bank surveys bank lending standards,
both in terms of price and non-price lending intentions. A
judgement as to whether lending standards are becoming
Figure 10dFarm price gap and inflation
Figure 10Asset prices
Figure 10bHouse price gap and inflation
Figure 10aHouse price-to-disposable income
Figure 10cFarm prices-to-agricultural GDP
Note: See appendix for an explanation of each indicator.
too loose (for lending as a whole, or for specific sectors)
and contributing to excessive risk-taking, can help
inform whether macro-prudential intervention should be
considered.
4.2 Signalling financial system stressFinancial market stress
Market indicators can be useful ‘near coincident’
indicators of financial system stress or crises. While early
warning indicators measure the build-up of systemic risk,
market indicators show that this stress is materialising.
The market price of risk tends to increase sharply
during periods of financial stress. Typical indicators
23Reserve Bank of New Zealand: Bulletin, Vol. 76, No. 4, December 2013
include the risk premia on riskier assets such as corporate
debt relative to safer assets such as government debt
(although as the GFC demonstrated, not all government
debt is safe). Volatility-based measures of risk typically
escalate during times of market stress. ‘Stress indices’
can be used to aggregate across a number of financial
market variables (figure 11).
The paradox of financial stability is that financial
market conditions can look at their most benign just before
a period of stress materialises. So while financial market
MPIs are not early warning indicators per se, they can be
valuable as contrarian measures of risk-taking. If financial
market volatility, or the pricing of traditionally risky assets,
is very low by historical standards, the market may be
under-pricing risk.
In severe events, a financial institution’s solvency could
be threatened. Watch list loans – loans banks expect will
become impaired – can be a leading indicator of NPLs.
Figure 11 Domestic and international stress indices
-5
0
5
10
15
20
-5
0
5
10
15
20
25
1998 2000 2002 2004 2006 2008 2010 2012
New ZealandAustraliaUnited States
Index Index
Source: Bloomberg, RBNZ calculations.Note: The stress index for each country is calculated using
principal components. This captures the covariance from a set of financial market series and attributes this simultaneous movement as ‘stress’ within financial markets (see appendix for further information).
Deteriorating asset quality
Asset quality indicators typically lag the financial
cycle. Asset quality is measured across the key lending
portfolios of banks and in aggregate (figure 12), and
include non-performing loans (NPLs) and bank ‘watch
list’ loans. During the upswing in the cycle these
indicators typically look healthy as borrowers easily meet
repayments. However, as the economic cycle goes into
the removal of macro-prudential policy (see section 5).
Depending on the macro-prudential instrument, a sharp
increase in NPLs might suggest removal of a policy
instrument, such as a counter-cyclical capital buffer
(CCB), while a more modest deterioration in asset quality
could prompt a gradual and more considered release.
4.3 The banking system’s capacity to absorb riskThe banking system should have appropriate
buffers to weather difficult conditions in a crisis. If buffers
are low, or being run down during the upswing of the credit
cycle, then the ability of a bank to carry on its normal
functions may be impaired during a subsequent period of
stress. In an extreme case, the solvency of the bank could
be threatened.
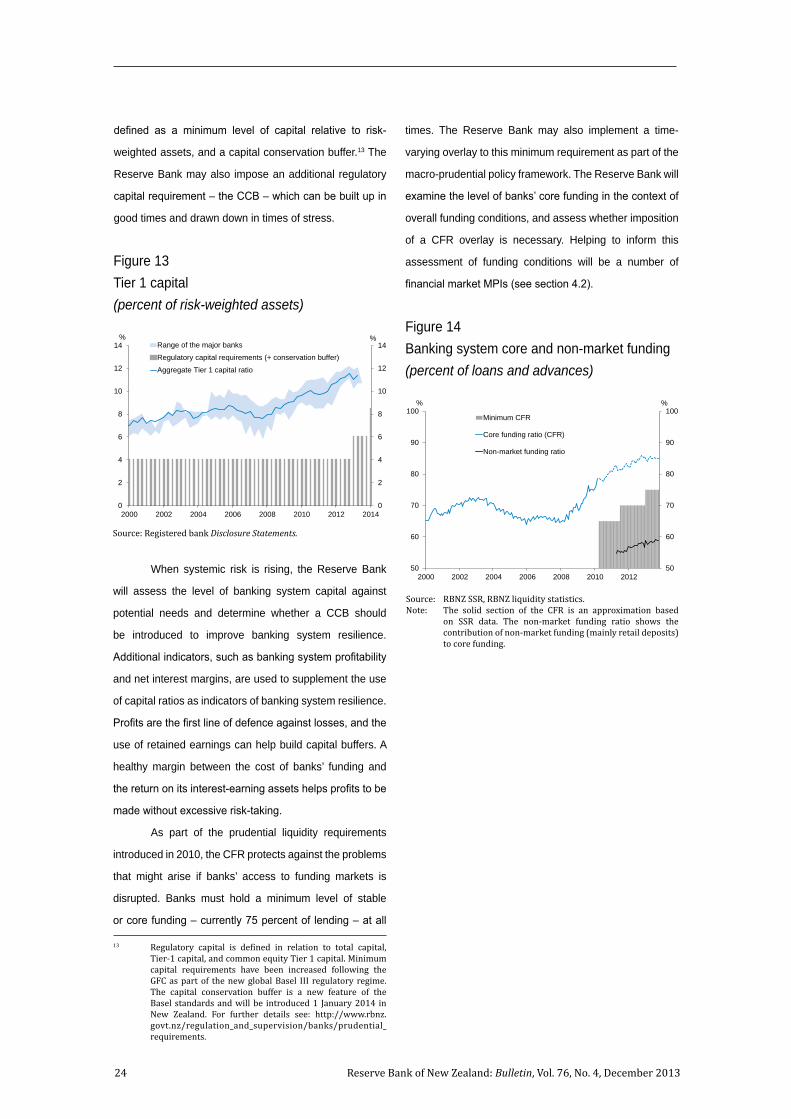
The two main buffers that the Reserve Bank can
influence are the regulatory requirements associated
with capital and liquidity. Regulatory capital requirements
enable banks to absorb losses in a downturn without
threatening their underlying solvency. Capital requirements
are set at a specific permanent level through the cycle,
24 Reserve Bank of New Zealand: Bulletin, Vol. 76, No. 4, December 2013
defined as a minimum level of capital relative to risk-
weighted assets, and a capital conservation buffer.13 The
Reserve Bank may also impose an additional regulatory
capital requirement – the CCB – which can be built up in
good times and drawn down in times of stress.
times. The Reserve Bank may also implement a time-
varying overlay to this minimum requirement as part of the
macro-prudential policy framework. The Reserve Bank will
examine the level of banks’ core funding in the context of
overall funding conditions, and assess whether imposition
of a CFR overlay is necessary. Helping to inform this
assessment of funding conditions will be a number of
financial market MPIs (see section 4.2).
Figure 13Tier 1 capital (percent of risk-weighted assets)
Source: Registered bank Disclosure Statements.
0
2
4
6
8
10
12
14
0
2
4
6
8
10
12
14
2000 2002 2004 2006 2008 2010 2012 2014
Range of the major banks
Regulatory capital requirements (+ conservation buffer)
Aggregate Tier 1 capital ratio
% %
Source: RBNZ SSR, RBNZ liquidity statistics.Note: The solid section of the CFR is an approximation based
on SSR data. The non-market funding ratio shows the contribution of non-market funding (mainly retail deposits) to core funding.
Figure 14Banking system core and non-market funding(percent of loans and advances)
13 Regulatory capital is defined in relation to total capital, Tier-1 capital, and common equity Tier 1 capital. Minimum capital requirements have been increased following the GFC as part of the new global Basel III regulatory regime. The capital conservation buffer is a new feature of the Basel standards and will be introduced 1 January 2014 in New Zealand. For further details see: http://www.rbnz.govt.nz/regulation_and_supervision/banks/prudential_requirements.
50
60
70
80
90
100
50
60
70
80
90
100
2000 2002 2004 2006 2008 2010 2012
% %
Minimum CFR
Core funding ratio (CFR)
Non-market funding ratio
When systemic risk is rising, the Reserve Bank
will assess the level of banking system capital against
potential needs and determine whether a CCB should
be introduced to improve banking system resilience.
Additional indicators, such as banking system profitability
and net interest margins, are used to supplement the use
of capital ratios as indicators of banking system resilience.
Profits are the first line of defence against losses, and the
use of retained earnings can help build capital buffers. A
healthy margin between the cost of banks’ funding and
the return on its interest-earning assets helps profits to be
made without excessive risk-taking.
As part of the prudential liquidity requirements
introduced in 2010, the CFR protects against the problems
that might arise if banks’ access to funding markets is
disrupted. Banks must hold a minimum level of stable
or core funding – currently 75 percent of lending – at all
26 Reserve Bank of New Zealand: Bulletin, Vol. 76, No. 4, December 2013
.5 Removing macro-prudential instruments
Decisions on the release or removal of macro-
prudential instruments will typically be based on a
different set of indicators than those used to guide the
implementation of the instrument. The range of indicators
used to guide removal will also be influenced by how
financial system stress materialises. The following three
scenarios indicate the considerations that would be
involved in the withdrawal of a policy measure.
In the first scenario, an increase in systemic risk
does not result in any obvious negative impact on the
financial system or the economy. Financial imbalances
unwind in a benign and orderly fashion, perhaps in
part due to the macro-prudential instrument in place.
The Reserve Bank would look at indicators of financial
imbalances to guide removal. In the current context
where LVR restrictions have been implemented, the
Reserve Bank would expect to see house price and
housing credit growth moderating, and more prudent bank
lending practices – all of which would be necessary to
return household indebtedness and house prices towards
historic norms.
In the second scenario, an increase in systemic
risk results in a mild stress event, perhaps typical of
‘normal recessions’ or slowdowns in economic activity.
Financial imbalances accumulated during the upswing
are unwound in a more or less orderly fashion, but
some degree of deleveraging by borrowers and financial
intermediaries contributes to a slowdown in economic
activity. The Reserve Bank would examine coincident and
lagged indicators of financial stress to gauge the speed
and magnitude of the slowdown, and how this was flowing
through to bank balance sheets. Some macro-prudential
tools, such as temporary capital and liquidity buffers, could
be removed gradually in this scenario.
In a third scenario, an increase in systemic risk
during a credit upswing materialises in a financial crisis
(perhaps precipitated by an international shock), forcing
the economy to contract sharply and imbalances to
correct in a painful or disorderly fashion. Again, coincident
MPIs would help to guide removal of the macro-prudential
instrument, which would be likely to more timely than in
either of the other two scenarios.
The current MPI Report contains a number of
indicators that will help guide the release of macro-
prudential policy. The Reserve Bank will be looking to
further develop the indicators.
6 ConclusionThis article has provided an overview of the
indicators currently used to guide macro-prudential
policy. Macro-prudential policy is still in its infancy and
the Reserve Bank will continue to develop all aspects of
the framework. For example, the calibration of macro-
prudential policy settings will evolve as experience is
gained with specific tools. The Reserve Bank will also
continue to refine the set of indicators used to help guide
the macro-prudential decision-making process, including
both the deployment of tools and their eventual release.
The Reserve Bank expects that an understanding
of the ‘best’ indicator (or set of indicators) will develop
over time, and the knowledge of the thresholds at which
the indicators point to a stress event will become more
accurate. Nonetheless, because of the complex nature
of systemic risk and periods of financial system stress,
there will always be considerable scope for policymaker
judgement in the macro-prudential decision-making
process.
27Reserve Bank of New Zealand: Bulletin, Vol. 76, No. 4, December 2013
Appe
ndix
New
Zea
land
MPI
s
(con
tinue
d)
MPI
Defi
nitio
nW
hat i
t is
usef
ul fo
r?So
urce
Early
war
ning
indi
cato
rs
(i)
Cre
dit m
easu
res
Priv
ate
sect
or c
redi
t-to-
GD
P le
vel
Rat
io o
f int
erm
edia
ted
cred
it (b
ank
and
non-
bank
lend
ing)
, to
annu
al n
omin
al G
DP
Indi
cato
r of v
ulne
rabi
lity,
may
be
influ
ence
d by
tren
d ch
ange
s su
ch a
s ch
ange
s in
neu
tral i
nter
est r
ates
or fi
nanc
ial
liber
alis
atio
n
Sta
tistic
s N
ew Z
eala
nd, R
BN
Z S
tand
ard
Sta
tistic
al R
etur
n (S
SR
)
Rea
l-tim
e cr
edit-
to-G
DP
trend
Tren
d is
cal
cula
ted
usin
g a
one-
side
d H
odric
k-P
resc
ott (
HP
) filte
r, w
ith a
lam
bda
of 4
00,0
00. E
ach
data
poi
nt fo
r the
tren
d is
es
timat
ed u
sing
the
data
that
wou
ld h
ave
been
ava
ilabl
e to
pol
icym
aker
s at
that
tim
e
Use
d in
cal
cula
ting
the
‘gap
’ mea
sure
Sta
tistic
s N
ew Z
eala
nd, R
BN
Z S
SR
, R
BN
Z ca
lcul
atio
ns
Cre
dit-t
o-G
DP
real
tim
e ga
pD
iffer
ence
bet
wee
n cr
edit-
to-G
DP
leve
l an
d tre
ndTh
ree-
year
ahe
ad s
igna
l of fi
nanc
ial s
tress
. Ind
icat
es a
su
stai
ned
perio
d (o
ver a
num
ber o
f yea
rs) o
f stro
ng g
row
th in
th
e cr
edit-
to-G
DP
ratio
Sta
tistic
s N
ew Z
eala
nd, R
BN
Z S
SR
, R
BN
Z ca
lcul
atio
ns
Tota
l cre
dit g
row
thA
nnua
l per
cent
cha
nge
of b
ank
and
non-
bank
inte
rmed
iate
d cr
edit
Sim
ple,
tran
spar
ent i
ndic
ator
mea
surin
g th
e in
crea
se in
im
bala
nces
ove
r a g
iven
tim
e fra
me.
Can
be
a le
adin
g in
dica
tor o
f the
cre
dit g
ap
RB
NZ
SS
R
Priv
ate
sect
or c
redi
t cro
ss-c
ount
ryP
rivat
e se
ctor
cre
dit d
ivid
ed b
y no
min
al
GD
PC
ompa
re th
e st
ock
of o
utst
andi
ng in
term
edia
ted
cred
it on
an
inte
rnat
iona
l bas
isS
tatis
tics
New
Zea
land
, RB
NZ,
Hav
er
Hou
seho
ld c
redi
t-to-
disp
osab
le
inco
me
(leve
l, tre
nd, g
ap, c
redi
t gr
owth
)
Rep
licat
es c
redi
t-to-
GD
P m
etho
dolo
gyId
entifi
es s
ecto
ral s
peci
fic v
ulne
rabi
litie
s an
d ris
ksS
ee a
bove
Bus
ines
s cr
edit-
to-g
ross
ope
ratin
g su
rplu
s (le
vel,
trend
, gap
, cre
dit
grow
th)
Rep
licat
es c
redi
t-to-
GD
P m
etho
dolo
gyId
entifi
es s
ecto
ral s
peci
fic v
ulne
rabi
litie
s an
d ris
ksS
ee a
bove
Agr
icul
tura
l cre
dit-t
o-ag
ricul
tura
l G
DP
(leve
l, tre
nd, g
ap, c
redi
t gr
owth
)
Rep
licat
es c
redi
t-to-
GD
P m
etho
dolo
gyId
entifi
es s
ecto
ral s
peci
fic v
ulne
rabi
litie
s an
d ris
ksS
ee a
bove
Sha
re o
f non
-ban
k le
ndin
g N
on-b
ank
lend
ing
divi
ded
by to
tal fi
nanc
ial
syst
em le
ndin
gM
easu
re o
f stru
ctur
al c
hang
e an
d ‘le
akag
e’ in
to th
e no
n-ba
nk
sect
or (a
s a
resu
lt of
pol
icy)
RB
NZ
SS
R
Pub
lic d
ebt c
ross
-cou
ntry
Gen
eral
gro
ss g
over
nmen
t deb
t as
a sh
are
of G
DP
Com
pare
the
leve
l of p
ublic
deb
t on
an in
tern
atio
nal b
asis
The
Trea
sury
, Sta
tistic
s N
ew Z
eala
nd,
Hav
er
Pub
lic a
nd p
rivat
e de
bt ra
tios
Tota
l priv
ate
debt
(inc
ludi
ng c
orpo
rate
bo
nds)
and
pub
lic d
ebt a
s a
shar
e of
no
min
al G
DP
Mea
sure
s ch
ange
in c
ompo
sitio
n of
tota
l fina
ncia
l sys
tem
de
bt o
ver t
ime
The
Trea
sury
, RB
NZ,
Sta
tistic
s N
ew
Zeal
and
Net
fore
ign
liabi
litie
sFo
reig
n as
sets
less
liab
ilitie
s di
vide
d by
no
min
al G
DP
Mea
sure
of n
et e
xter
nal i
ndeb
tedn
ess.
Can
be
brok
en d
own
by s
ecto
rs (b
anks
, gov
ernm
ent)
Sta
tistic
s N
ew Z
eala
nd
28 Reserve Bank of New Zealand: Bulletin, Vol. 76, No. 4, December 2013
MPI
Defi
nitio
nW
hat i
s it
usef
ul fo
r?So
urce
(ii)
Ass
et p
rice
mea
sure
sH
ouse
pric
e-to
-dis
posa
ble
inco
me
leve
lR
atio
of a
vera
ge h
ouse
pric
es to
ave
rage
di
spos
able
inco
me
Mea
sure
of o
verv
alua
tion
Pro
perty
IQ, S
tatis
tics
New
Zea
land
Rea
l-tim
e ho
use
pric
e to
dis
posa
ble
inco
me
trend
Lo
ng-te
rm tr
end
of th
e ho
use
pric
e-to
- in
com
e. S
ame
proc
edur
e as
for c
redi
t-to-
GD
P tre
nd
Use
d in
cal
cula
ting
the
‘gap
’ mea
sure
Pro
perty
IQ, S
tatis
tics
New
Zea
land
, R
BN
Z ca
lcul
atio
ns
Hou
se p
rice
to d
ispo
sabl
e in
com
e ga
pP
erce
ntag
e di
ffere
nce
betw
een
the
hous
e pr
ice-
to-in
com
e le
vel a
nd tr
end
Add
ition
al e
arly
war
ning
indi
cato
r sup
plem
entin
g th
e cr
edit
gap.
A p
ositi
ve g
ap in
dica
tes
that
ass
et p
rice
grow
th h
as
outs
tripp
ed in
com
es fo
r a s
usta
ined
per
iod
Pro
perty
IQ, S
tatis
tics
New
Zea
land
, R
BN
Z ca
lcul
atio
ns
Hou
se p
rice
infla
tion
Ann
ual p
erce
ntag
e ch
ange
in h
ouse
pric
esS
impl
e, tr
ansp
aren
t ind
icat
or o
f ass
et p
rice
exub
eran
ce o
ver
the
past
yea
rP
rope
rty IQ
, RE
INZ
Com
mer
cial
pro
perty
pric
es to
gro
ss
oper
atin
g su
rplu
s (le
vel,
trend
, gap
, as
set p
rice
grow
th ra
te)
Rep
licat
es h
ouse
pric
e-to
-inco
me
met
hodo
logy
See
abo
veIP
D, S
tatis
tics
New
Zea
land
Farm
pric
es to
agr
icul
tura
l GD
P:
(leve
l, tre
nd, g
ap. g
row
th ra
te)
Rep
licat
es h
ouse
pric
e-to
-inco
me
met
hodo
logy
See
abo
veS
tatis
tics
New
Zea
land
, RE
INZ,
RB
NZ
calc
ulat
ions
(iii)
Cap
acity
to s
ervi
ce d
ebt
Deb
t ser
vici
ng ra
tioP
rinci
pal a
nd in
tere
st s
ervi
cing
cos
ts
divi
ded
by in
com
e. P
rinci
pal c
osts
ass
ume
aver
age
time-
to-d
ebt m
atur
ity is
15
year
s
One
-yea
r ahe
ad s
igna
l of fi
nanc
ial s
tress
. Cap
ture
s ba
lanc
e sh
eet s
tretc
h of
the
econ
omy
RB
NZ
SS
R, S
tatis
tics
New
Zea
land
, R
BN
Z ca
lcul
atio
ns
Deb
t ser
vici
ng ra
tio g
apD
iffer
ence
bet
wee
n de
bt s
ervi
cing
ratio
le
vel,
and
the
15-y
ear m
ovin
g av
erag
e of
th
e se
ries
Mea
surin
g w
heth
er th
e in
crea
se in
DS
R h
as b
een
exce
ssiv
e,
rath
er th
an p
icki
ng u
p lo
ng te
rm tr
ends
RB
NZ
SS
R, S
tatis
tics
New
Zea
land
, R
BN
Z ca
lcul
atio
ns
Ana
lysi
s re
plic
ated
for t
he h
ouse
hold
an
d b
usin
ess/
agric
ultu
ral s
ecto
r (le
vel,
gap)
See
abo
veS
ee a
bove
. Hig
hlig
hts
sect
oral
vul
nera
bilit
ies
RB
NZ
SS
R, S
tatis
tics
New
Zea
land
, R
BN
Z ca
lcul
atio
ns
(iv)
Lend
ing
stan
dard
sB
ank
lend
ing
stan
dard
s fo
r ret
ail
borr
ower
sC
hang
e in
pric
e an
d no
n-pr
ice
lend
ing
stan
dard
s (n
et p
erce
ntag
e)In
dica
tes
how
lend
ing
stan
dard
s ha
ve c
hang
ed o
ver t
he
prev
ious
6-m
onth
s, a
nd h
ow th
ey a
re e
xpec
ted
to c
hang
e in
th
e co
min
g 6-
mon
ths
Priv
ate
repo
rting
from
13
regi
ster
ed
bank
s
Ban
k lo
an-to
-val
ue ra
tio (L
VR
) m
onth
ly fl
owH
igh
LVR
lend
ing
(>80
%) a
s a
shar
e of
to
tal m
ortg
age
lend
ing
Indi
cate
s ch
ange
in p
ropo
rtion
of b
ank
lend
ing
to h
ighe
r-ris
k bo
rrow
ers
RB
NZ
Loan
-to-v
alue
ratio
sur
vey
Net
inte
rest
mar
gins
Ban
k ne
t int
eres
t inc
ome
as a
per
cent
age
of a
vera
ge in
tere
st e
arni
ng a
sset
sH
ighl
ight
s th
e le
vel o
f com
petit
ion
with
in th
e ba
nkin
g sy
stem
. Low
mar
gins
can
indi
cate
that
ban
ks a
re c
ompe
ting
aggr
essi
vely
on
pric
e
Reg
iste
red
bank
s’ D
iscl
osur
e st
atem
ents
(con
tinue
d)
29Reserve Bank of New Zealand: Bulletin, Vol. 76, No. 4, December 2013
MPI
Defi
nitio
nW
hat i
s it
usef
ul fo
r?So
urce
Indi
cato
rs o
f ban
king
sys
tem
’s c
apac
ity to
abs
orb
risk
Tier
-1 c
apita
l rat
ioTi
er-1
cap
ital a
s a
shar
e of
risk
-wei
ghte
d as
sets
Sho
ws
leve
l of b
uffe
r aga
inst
pot
entia
l los
ses
in th
e ba
nkin
g sy
stem
Dis
clos
ure
stat
emen
ts
Cor
e fu
ndin
g ra
tioR
etai
l fun
ding
, lon
g-te
rm w
hole
sale
fu
ndin
g, a
nd e
quity
as
a sh
are
of to
tal
loan
s an
d ad
vanc
es
Mea
sure
of c
ore
or s
tabl
e fu
ndin
gR
BN
Z liq
uidi
ty s
tatis
tics
Ban
k w
hole
sale
fund
ing
profi
leP
ropo
rtion
of w
hole
sale
fund
ing
at d
iffer
ent
mat
uriti
esP
rofil
e hi
ghlig
hts
stre
ss p
oint
s if
fund
ing
mar
kets
clo
sed
RB
NZ
Indi
cato
rs o
f fina
ncia
l sys
tem
str
ess
(i)
Coi
ncid
ent s
tres
s m
easu
res
Fina
ncia
l stre
ss in
dex
(com
para
ble
indi
ces
cons
truct
ed fo
r New
Ze
alan
d, A
ustra
lia, a
nd U
nite
d S
tate
s)
Prin
cipa
l com
pone
nt a
naly
sis
is u
sed
to
extra
ct c
ovar
ianc
e be
twee
n 5
finan
cial
m
arke
t ser
ies
(FX
mar
ket v
olat
ility
, equ
ity
mar
ket v
olat
ility
, bon
d vo
latil
ity, b
ank
bill
– O
IS s
prea
d, a
nd b
ond
spre
ads)
. Eac
h se
ries
is a
lso
repo
rted
indi
vidu
ally
Mea
sure
s on
set o
f stre
ss w
ithin
fina
ncia
l mar
kets
. Ind
ivid
ual
serie
s ca
n hi
ghlig
ht p
ocke
ts o
f stre
ss o
r mar
ket d
ysfu
nctio
nB
loom
berg
Bas
is s
wap
spr
eads
Cos
t of s
wap
ping
ove
rsea
s bo
rrow
ing
back
to
NZD
S
how
s th
e he
dgin
g co
sts
for b
anks
on
over
seas
who
lesa
le
fund
ing
deal
s. D
ysfu
nctio
n in
this
mar
ket c
ould
resu
lt in
in
crea
sed
fund
ing
cost
s fo
r ban
ks o
r red
uced
abi
lity
to h
edge
ex
chan
ge ra
te ri
sk
Blo
ombe
rg
Aus
tralia
n ba
nk C
DS
spr
eads
Cre
dit d
efau
lt sw
ap (C
DS
) spr
eads
for
Aus
tralia
n ba
nks
Pro
xy fo
r who
lesa
le fu
ndin
g co
sts
of th
e pa
rent
s of
the
big-
4 ba
nks
in N
ew Z
eala
ndB
loom
berg
(ii)
Ass
et q
ualit
yN
on-p
erfo
rmin
g lo
ans
Impa
ired
and
90-d
ay p
ast d
ue a
sset
s di
vide
d by
tota
l len
ding
Lagg
ed re
spon
se to
a p
erio
d of
fina
ncia
l stre
ss, a
s bo
rrow
ers
stru
ggle
to re
pay
debt
Dis
clos
ure
stat
emen
ts
Sec
tora
l non
-per
form
ing
loan
sIm
paire
d an
d 90
-day
pas
t due
ass
ets
divi
ded
by to
tal l
endi
ng fo
r eac
h se
ctor
Iden
tify
spec
ific
sect
ors
that
hav
e be
en a
ffect
ed b
y a
perio
d of
fin
anci
al s
tress
Priv
ate
repo
rting
from
13
regi
ster
ed
bank
s
Sec
tora
l wat
chlis
t loa
nsW
atch
list l
oans
div
ided
by
sect
oral
lend
ing
Pre
curs
or to
a lo
an b
ecom
ing
non-
perfo
rmin
g. U
sefu
l as
a le
adin
g in
dica
tor o
f ass
et q
ualit
y P
rivat
e re
porti
ng d
ata
from
13
regi
ster
ed
bank
s
Impa
ired
asse
t exp
ense
Im
paire
d as
set e
xpen
se d
ivid
ed b
y to
tal
lend
ing
Sho
ws
impa
ct o
f pro
visi
onin
g fo
r a d
eter
iora
tion
in a
sset
qu
ality
on
profi
tabi
lity
Dis
clos
ure
stat
emen
ts
30 Reserve Bank of New Zealand: Bulletin, Vol. 76, No. 4, December 2013
ReferencesAdrian, T, D Covitz and N Liang (2013) ‘Financial
Stability Monitoring’, Federal Reserve Board Finance and
Economic Discussion Series, 2013-21.
Bank of England (2009) ‘The role of
macroprudential policy’, Bank of England Discussion
Paper, November.
Borio, C and M Drehmann (2009a) ‘Towards
an operational framework for financial stability: “fuzzy”
measurement and its consequences’, BIS Working
Papers, No 284, June.
Borio, C and M Drehmann (2009b) ‘Assessing the
risk of banking crises - revisited’, BIS Quarterly Review,
March.
Committee on the Global Financial System
(2012) ‘Operationalising the selection and application
of macroprudential instruments’, CGFS Papers No 48,
December.
Craigie, R and A Munro (2010) ‘Financial sector
amplification and credit cycles in New Zealand’, Reserve
Bank of New Zealand Bulletin, 73(2), June, pp. 15-34.
Drehmann, M, C Borio and K Tsatsaronis (2011)
‘Anchoring countercyclical capital buffers: the role of credit
aggregates’, BIS Working Papers, No 355, November.
Drehmann, M and M Juselius (2013) ‘Evaluating
early warning indicators of banking crises: Satisfying policy
requirements’, BIS Working Papers, No 421, August.
Drehmann, M and M Juselius (2012) ‘Do debt
service costs affect macroeconomic and financial
stability?’, BIS Quarterly Review, September 2012.
Edge, R, and R Meisenzahl (2011) ‘The unreliability
of credit-to-GDP ratio gaps in real-time: Implications for
countercyclical capital buffers’, Division of Research &
Statistics and Monetary Affairs, Federal Reserve Board.
Hunt, C (2013) ‘The last financial crisis and the
case for macro-prudential intervention’, Reserve Bank of
New Zealand Bulletin, 76(2), June, pp. 3-16.
IMF (2011) ‘Macroprudential policy: an organizing
framework’, March.
Nicolò, G , G, G Favara and L Ratnovski (2012)
‘Externalities and Macroprudential Policy’, IMF Staff
Discussion Note, SDN/12/05, June.
RBNZ (2013) ‘Memorandum of Understanding on
Macro-prudential policy and operating guidelines’, May.
Rogers, L (2013) ‘A new approach to macro-
prudential policy for New Zealand’, Reserve Bank of New
Zealand Bulletin, 76(3), September, pp.12-22.
31Reserve Bank of New Zealand: Bulletin, Vol. 76, No. 4, December 2013
1 Introduction1
Foreign exchange is the transaction of one
country’s money for that of another. It facilitates trade
in goods and services and in financial instruments, and
saving and investment across borders. In other words,
in today’s highly globalised and interdependent markets,
foreign exchange is the oil that keeps the machinery
humming.
Foreign exchange transactions largely occur
directly between two parties (typically one of these parties
is a bank) without passing through a centralised exchange.
As a result, the vast majority of foreign exchange flows is
only observable to a limited number of parties.
In an attempt to understand trends in foreign
exchange, the Bank for International Settlements (BIS)
coordinates a comprehensive global survey, formally
known as the BIS Triennial Central Bank Survey of
Foreign Exchange and Derivatives Market Activity. The
BIS survey has been conducted every three years since
1989, taking a snapshot of activity during the April month
of the reporting year.2 In the 2013 survey, 1,300 financial
institutions in 53 jurisdictions submitted turnover data. In
New Zealand, five financial institutions were asked to take
part: ANZ, ASB, BNZ, Deutsche Bank, and Westpac.
Complementing the BIS survey, the Reserve
Bank of New Zealand (RBNZ) collects foreign exchange
turnover data on a daily basis. These data are a subset
of those collected for the New Zealand submission to the
BIS survey, but provide more timely information about
the trends in New Zealand’s onshore foreign exchange
market.3
This article discusses the results of the 2013
survey and recent trends in the foreign exchange market,
based on both data sources, with a focus on the New
Zealand dollar.
2 Global trends in foreign exchange and the New Zealand dollar in a global contextGlobal foreign exchange (FX) turnover increased
by 35 percent between the 2010 and 2013 BIS surveys,
to US$5.3 trillion worth of transactions on average per
working day. This rate of growth is high but not exceptional:
rapid growth in turnover has been evident since the 2001
survey, with an average three-yearly growth rate of 38
percent.4 Higher FX turnover since 2010 is a by-product of
Foreign exchange turnover: trends in New Zealand and abroadLauren Rosborough and Raiko Shareef
This article examines recent trends in global and local foreign exchange (FX) markets, using the 2013 Bank
for International Settlements Triennial Survey and the Reserve Bank’s foreign exchange turnover data. Global FX
turnover continued to increase in 2013, with the US dollar remaining the most-traded currency and the United Kingdom
the favoured trading hub. The New Zealand dollar was the tenth most traded currency, with the large majority of these
transactions occurring outside New Zealand. FX and cross-currency swaps together accounted for more than half of
FX turnover in the New Zealand domestic market, reflecting their use by New Zealand’s major financial institutions for
hedging and liquidity management purposes.
1 The authors would like to thank Michael Reddell, Jeremy Richardson, and other colleagues at the Reserve Bank of New Zealand for their comments on earlier drafts.
2 The BIS survey has evolved over time, in both methodology and coverage (for instance to include the euro). To compare like with like, we discuss the latest survey results in relation to surveys from 2001 onwards.
3 The RBNZ survey is based on the foreign exchange section of the BIS survey. Banks reporting to the RBNZ survey are required to report transactions that involve the three following currencies: the New Zealand dollar, the US dollar and the euro. Transactions in these three currencies amount to 99.91 percent of the New Zealand turnover captured in the 2013 BIS survey.
4 This trend is slightly lower (35 percent) when exchange rates are held constant at 2013 levels.
32 Reserve Bank of New Zealand: Bulletin, Vol. 76, No. 4, December 2013
international investors increasingly diversifying into riskier
assets, such as international equities and emerging-
market bonds (Rime and Schrimpf, 2013). Recovering
risk appetite in a post-global financial crisis world may also
have encouraged higher turnover and the world economy
has continued to recover (albeit haltingly) from a period
of weak growth, contributing to a rise in FX transactions.
three percentage points from 2010, while spot, outright
forward, and option transactions each gained roughly one
percentage point.
NB At prevailing exchange rates in survey years. Net-net basis (adjusted for local and cross-border inter-dealer double counting).
Source: BIS.
Figure 1Daily average global FX turnover
0.0
1.0
2.0
3.0
4.0
5.0
6.0
2001 2004 2007 2010 2013
US$ trillions
Turnover in developed markets is 34 percent
higher than in 2010, but a notable feature of the global
results is the pace at which turnover in emerging-market
currencies has increased, up 72 percent since 2010. Since
2001, emerging-market currency turnover has grown by a
factor of 9, in contrast with turnover in developed-market
currencies which has quadrupled. That said, emerging-
market currencies make up a small proportion of total FX
turnover, accounting for just 19 percent out of a possible
200 percent in 2013.5
The share of FX turnover by instrument type
was little changed between 2010 and 2013. FX swaps
remained the most traded instrument, accounting for 42
percent of all FX turnover in April 2013. This was down
5 As two currencies are involved in each transaction, the sum of shares in individual currencies will total 200 percent. The discussion here is based on Rime and Schrimpf’s classification, where HKD and SGD are treated as emerging market currencies. Elsewhere in this commentary we classify these two currencies as developed market currencies, in line with the MSCI definitions.
Figure 2Breakdown of FX turnover worldwide
Source: BIS
0102030405060708090
100
2001 2004 2007 2010 2013
Percent
Spot Outright forwards FX swaps Cross-currency swaps OTC options
FX trading continued to be concentrated in a
small number of countries (table 1 opposite). The United
Kingdom has held a central place in global financial
markets for some time, and that dominance increased
over recent history. Between 2001 and 2013, the United
Kingdom’s share of global FX turnover rose from 32
percent to 41 percent. In April 2013, FX turnover in the
United Kingdom was larger than the next six countries
combined. The United States’ share of turnover also
increased since 2001 but to a smaller extent – from 16
percent to 19 percent. In the 2013 survey, Singapore’s
share of global FX trading outstripped Japan’s for the first
time, making it the third-largest trading centre in the world.
The US dollar maintained its position as the
world’s most traded currency, reflecting its role as the
numeraire for a range of prices and financial contracts.
The US dollar’s share of FX turnover increased by over
two percentage points to 87 percent, although this is down
from its 2001 high of 90 percent (table 2). As a proportion
of cross-currency turnover, emerging-market currencies
transact more frequently against the US dollar than
developed-market currencies do (figure 3). For countries
closely integrated with the euro area (such as Sweden,
Norway, and Poland), a significant proportion of local
currency transactions is against the euro.
33Reserve Bank of New Zealand: Bulletin, Vol. 76, No. 4, December 2013
Box 1FX instrument definitions
Spot: A spot foreign exchange transaction is
the outright purchase of one currency in exchange for
another. The price (i.e. exchange rate) is agreed today,
with market convention dictating that settlement occurs
within two business days.
Outright forwards: An outright forward transaction
is similar to a spot transaction, with a settlement date
that occurs more than two days hence.
FX swaps: A foreign exchange swap is an
agreement to exchange one currency for another on one
date and to reverse the transaction at a future agreed
date. The exchange of two currencies at the outset is
based on the prevailing spot exchange rate while the
reverse payment, also agreed at the outset, is based on
Table 1Geographical distribution of global foreign exchange market turnover (% of total)
the currency’s forward rate.
Cross-currency swaps: A cross-currency swap
is a foreign exchange swap that also involves the
exchange of streams of interest payments in different
currencies for an agreed period of time. The principal
amount exchanged is based on the spot rate, at both
the outset and contract expiry. A cross-currency swap is
also often known as a currency swap or a basis swap.*
OTC options: A currency option gives the holder
the right, but not the obligation, to buy or sell a given
amount of one currency against another at a specified
exchange rate over a specified period or at a specified
future date.
* See Hawkesby (1999) for more details.
NB: Net-gross basis (adjusted for local inter-dealer double counting). Source: BIS.
34 Reserve Bank of New Zealand: Bulletin, Vol. 76, No. 4, December 2013
The euro’s share of global turnover declined
sharply from 2010, while the Japanese yen’s share of
global turnover rose four percentage points, probably
due to the Bank of Japan’s open-ended monetary easing
programme introduced in early April 2013. Turnover may
have increased due to a diversity of views surrounding the
range of expected future outcomes of this policy shift.
Table 2Global turnover and rank by currency,* selected years
NB: As two currencies are involved in each transaction, the sum of shares in individual currencies will total 200 percent. * Currency acronyms are explained in the Appendix. Net-net basis.Source: BIS.
2013 Rank 2010 Rank 2007 Rank 2004 Rank
USD 87.0 1 84.9 1 85.6 1 88.0 1
EUR 33.4 2 39.1 2 37.0 2 37.4 2
JPY 23.0 3 19.0 3 17.2 3 20.8 3
GBP 11.8 4 12.9 4 14.9 4 16.5 4
AUD 8.6 5 7.6 5 6.6 6 6.0 6
CHF 5.2 6 6.3 6 6.8 5 6.0 5
CAD 4.6 7 5.3 7 4.3 7 4.2 7
MXN 2.5 8 1.3 14 1.3 12 1.1 12
CNY 2.2 9 0.9 17 0.5 20 0.1 29
NZD 2.0 10 1.6 10 1.9 11 1.1 13
NB: Net-net basis. Source: BIS.
Figure 3Share of total global turnover against major currencies in April 2013
In the 2013 survey, the New Zealand dollar
remained the tenth-most traded currency in the world.
Its share of global FX turnover rose slightly, from 1.6
percent in 2010 to 2.0 percent in 2013. On average, the
New Zealand dollar was involved in US$105 billion of
transactions per day in April 2013.
3 Foreign exchange turnover and GDPAmong developed markets, there has long been
a log-linear relationship between FX turnover in a given
currency and the size of a country’s economy. Such a
relationship was not apparent among emerging-market
currencies at the turn of the century, but appears to be
forming now.
BIS research argues that, in the early stages of a
country’s development, FX turnover increases in line with
trade-related transactions.6 But as the country develops,
FX turnover increases at a faster rate than GDP growth
due to the greater depth, complexity, and openness of
the country’s financial markets. Those factors allow the
6 McCauley and Scatinga (2011).
0
10
20
30
40
50
60
70
80
90
100
MXN IN
RC
NY
KRW
RU
BTR
YH
KDTW
DSG
DZA
RC
AD BRL
JPY
AUD
NZD
GBP
EUR
CH
FN
OK
SEK
PLN
Percent JPY EUR USD
35Reserve Bank of New Zealand: Bulletin, Vol. 76, No. 4, December 2013
Horizontal axis: natural logarithm of nominal GDP (US$ billions); vertical axis: natural logarithm of daily FX turnover (US$ billions).NB: The 2013 GDP figures are estimates from the IMF World Economic Outlook.Sources: BIS, IMF (2013).
Figure 4Currency FX turnover versus the associated country’s nominal GDP
home currency to become more internationally traded,
thereby generating greater FX turnover. Factors common
to developed markets, such as open financial markets
and free capital account convertibility, place the cluster
of developed-market points higher than the equivalent in
emerging markets (figure 4). In other words, for developed
economies, FX turnover is higher on average for any given
level of GDP.
Among emerging market economies, the increase
in turnover in the Chinese yuan is particularly evident. In
2001, the CNY was an outlier compared to other emerging
market economies, as its trading volume was unusually
small compared to the size of China’s economy (figure
4, left-hand panel). Over the past decade, transactions
in CNY have increased more rapidly than the Chinese
economy has grown (figure 4, right-hand panel). The
rise in turnover reflects the Chinese Government’s
efforts to internationalise the yuan (see box 2). Recent
developments include allowing Singapore-, Hong-Kong-,
and UK-based investors to buy yuan-denominated
securities, and allowing the yuan to be transacted
in offshore trading centres such as Hong Kong and
Singapore.
New Zealand has had a high FX turnover to GDP
ratio throughout history. Spencer (2009) attributes this to
the ability of non-residents to freely trade directly in the
currency as well as in New Zealand dollar-denominated
USD
EURJPYGBP
AUD
CHF CADNZD SEK
HKD NOKSGD
DKK
R² = 0.9011
R² = 0.4406-3.0
-1.0
1.0
3.0
5.0
7.0
9.0
3.0 4.0 5.0 6.0 7.0 8.0 9.0 10.0
FX turnover
nominal GDP
Developed markets
Emerging markets
CNY
PEN
HUF
RON
CZK CLP
ZAR
MYRTHB
ILSPHP COP
IDR
SAR
TRYPLNTWD
RUBKRWMXN
BRLINR
2013
USD
EURJPYGBP
AUDCHFCAD
NZD
SEKHKDNOKSGD
DKK
R² = 0.9545
R² = 0.0877-3.0
-1.0
1.0
3.0
5.0
7.0
9.0
3.0 4.0 5.0 6.0 7.0 8.0 9.0 10.0
FX turnover
nominal GDP
Developed markets
Emerging marketsCNYPEN HUF
RON
CZK CLP
ZAR
MYRTHB
ILS
PHP
COP
IDR SAR
TRY
PLNTWD
RUB
KRW MXN
BRLINR
2001
instruments for more than 20 years. Internationalisation
has many benefits, such as lower transaction costs and
diversification gains for borrowers, a greater ability to
issue debt in the local currency, and an increased ability to
hedge or manage exchange rate risk (Bini Smaghi, 2008).
There is mixed empirical evidence on the
relationship between turnover and short-term currency
volatility,7 and the causal relationship between turnover
and daily volatility is unclear. Galati (2000) finds evidence
of a positive correlation between daily volume and
currency volatility in emerging market currencies. In the
case of New Zealand on the other hand, the exchange rate
is more stable when FX volumes are high (Rosborough,
2001). A reason for this is that as turnover increases,
liquidity also improves, in the sense that there are more
buyers and sellers at every price point, and less currency
movement for every given trade (black line in figure 5).
By comparison, low volume periods in the New Zealand
market are related to a material rise in NZD/USD volatility
(red line in figure 6), possibly reflecting a lack of liquidity
and unwillingness of market participants to transact.
7 This definition of volatility differs from that expressed in Chetwin, Ng, and Steenkamp (2013).
36 Reserve Bank of New Zealand: Bulletin, Vol. 76, No. 4, December 2013
4 Onshore versus offshore tradingOn average, 20 percent of the home currency’s
turnover occurs onshore in developed market countries
(this excludes the UK, which is an outlier at 55 percent,
because of its position as the world’s main trading hub
for FX). The proportion of onshore turnover in the New
Zealand dollar is similar to (although slightly smaller than)
Box 2Currency internationalisation*
As characterised by Kenen (2009), to qualify
as internationalised, a currency must meet most of the
following conditions (in order of descending importance):
1. Any foreign or domestic party must be able to
buy or sell that currency in the spot or forward
market without any restrictions.
2. Domestic and foreign firms can invoice some, if
not all, of their exports in that country’s currency.
3. Foreign entities can hold that country’s currency
(and financial instruments denominated in that
currency) in amounts that they deem useful and
prudent.
4. Foreign and domestic entities can issue
marketable instruments (such as debt securities)
Figure 5NZD/USD daily volatility per NZ$1bn transacted in the New Zealand market
NB: High/low volume days are defined as volume +/- 1 standard deviation compared to its historical average. Series are a 60 working day moving average. Breaks in the series reflect a lack of high/low volume trading within the 60 working day window.
Sources: Bloomberg, RBNZ.
in that country’s currency both within the country,
and in foreign markets.
5. International financial institutions (such as the
World Bank) can issue marketable securities in
that country’s domestic market, as well as use its
currency in their operations.
6. The currency may be included in currency
baskets of other countries (where a currency
basket for a given country is a weighted portfolio
of selected foreign currencies, against which
the value of the country’s domestic currency is
compared).
* This material draws heavily from a BIS conference on the topic (BIS 2009).
0.0
0.5
1.0
1.5
2.0
2.5
3.0
2004 2006 2008 2010 2012
Percent
Low volume days
Average volume days
High volume days
that in currencies the New Zealand dollar is often grouped
with, such as the Australian and Canadian dollars, the
Swedish krona, and the Norwegian krone (see figure 6).
Figure 6Proportion of home currency trading taking place in home country
0
10
20
30
40
50
60
Uni
ted
King
dom
Kore
aH
ong
Kong
SAR
Rus
sia
Indi
aC
hine
se T
aipe
iD
enm
ark
Sing
apor
eC
hina
Sout
h Af
rica
Turk
eyM
exic
oU
nite
d St
ates
Japa
nBr
azil
Switz
erla
ndEu
ro-a
rea
Aust
ralia
Swed
enC
anad
aN
orw
ayH
unga
ryN
ew Z
eala
nd
Percent
One reason for the lower proportion of onshore
trading of the New Zealand dollar relative to developed-
market peers may be New Zealand’s long-term savings-
investment imbalance. A reliance on foreign savings
37Reserve Bank of New Zealand: Bulletin, Vol. 76, No. 4, December 2013
to fund domestic investment means that debt has to be
raised offshore, either in New Zealand dollars or in foreign
currency subsequently converted into New Zealand
dollars (see next section). A corollary to New Zealand’s
savings-investment imbalance is relatively high interest
rates. The small proportion of onshore trading may simply
reflect the fact that, even though the underlying (e.g.
corporate) domestic foreign exchange activity might be
similar as a share of GDP in two countries, there is often
greater international investor interest in currencies with
typically higher interest rates (such as New Zealand) than
those with typically lower interest rates (such as Sweden).
In addition, two particular events may have
contributed to greater turnover of the New Zealand dollar
in the month of April 2013. Firstly, the New Zealand dollar
was seen as one potential destination for Japanese funds
after the Bank of Japan’s announcement of unprecedented
monetary easing. The Australian dollar and the Mexican
peso were other beneficiaries cited in analyst reports
and the financial news media, and these currencies
also experienced increased turnover in the 2013 survey
results.8 Secondly, the New Zealand dollar traded at
exceptionally high levels in April, with the New Zealand
trade-weighted index reaching 79.67 on 11 April 2013, its
highest level since the New Zealand dollar was floated in
1985.9 The unusually high level of the New Zealand dollar
may have polarised opinions among market participants
about the direction of the currency, thereby generating
greater-than-usual FX turnover (as participants executed
trades reflecting their opinions).
5 Trends in New Zealand’s FX marketTotal turnover in New Zealand’s onshore FX
market, in New Zealand dollar terms, rose 10.3 percent
between 2010 and 2013, with average daily turnover in
April 2013 of NZ$14.6bn.
In 2013, NZD/USD transactions equated to 69
percent of all FX deals struck in the New Zealand market
(figure 7), while trades in Asia-Pacific currencies (which
include NZD/USD, NZD/AUD, AUD/USD and USD/
JPY) accounted for 86 percent of all local turnover. The
dominance of these currencies within the New Zealand
dollar market reflects New Zealand’s geographical
position and trading partner linkages. Spot FX trades
were skewed towards NZD/USD trades, with 84 percent
involving that currency pair.
8 This reflects a strategy known as the carry trade, where the ‘carry’ is the positive return from borrowing in a low-yield currency and investing in a high-yielding currency.
9 The New Zealand trade-weighted index is a measure of the value of the New Zealand dollar relative to the currencies of New Zealand’s major trading partners. See http://www.rbnz.govt.nz/statistics/twi/ for more details.
Source: RBNZ FX turnover survey
Figure 7Currency pairs traded in New Zealand onshore market
0
10
20
30
40
50
60
70
80
90
100
2004 2006 2008 2010 2012
Percent
NZD/USD AUD/USD NZD/AUD
USD/JPY NZD/other EUR/USD
GBP/USD USD/other All other
FX swaps continue to dominate turnover in the
onshore market (figure 8), accounting for 69 percent of the
total in 2013. This is consistent with previous BIS surveys,
which have shown FX swaps contributing about 70 percent
of onshore turnover since 2001. Financial intermediaries,
such as domestic banks, are major participants in FX
swap markets. The reasons they use FX swaps include:
to manage daily funding requirements; to offset risk
taken on in providing services to end-users (such as
exporters); and to position for expected future changes in
relative interest rates and exchange rates. Furthermore,
an offshore investor looking to hold New Zealand dollar
assets may undertake an FX swap with a local bank,
rather than placing a term deposit with the bank or buying
a New Zealand government bond, because the FX swap
market is relatively deep and liquid. There has been an
increase in assets invested in New Zealand managed
cross-currency swaps had increased to 6.8 percent of
all FX turnover in the New Zealand market, up from 1.5
percent in 2010 and 0.2 percent in 2004. Cross-currency
swaps can be used to hedge risk but can also be utilised in
liquidity management transactions. For example, onshore
banks with large portfolios of New Zealand residential
mortgages partly fund their balance sheets by issuing
bonds overseas in foreign currencies where there is a
greater savings pool. These bond issues may be targeted
at the European, Japanese, or the US markets, using lead
managers to distribute the bonds to investors in those
markets, or may be private placements with individual
counterparties. Some bonds have had maturities for as
long as 15 to 20 years, although durations of five to seven
years tend to be more common. The banks then use
cross-currency swaps to transform this long-term foreign
currency funding into New Zealand dollar funding. New
Zealand non-bank corporates also use cross-currency
Figure 9Outstanding non-NZD debt issued offshore by New Zealand entities
NB: Non-New Zealand dollar debt issued by the private sector is likely to be underestimated, as untraded debt securities, such as private placements, are not usually captured by Bloomberg.
Source: Bloomberg.
0
5
10
15
20
25
2000 2002 2004 2006 2008 2010 2012
Local government
Other financial
Banks
Non-financial corporates
Percent of GDP
swaps to hedge non-New Zealand dollar funding. Figure
9 provides a proxy for the scale of such issuance and its
rise since 2001.
On the other side of a cross-currency swap is the
issuance of New Zealand dollar bonds by non-residents.
These are known as Kauri, Eurokiwi, and Uridashi bonds.
Kauri bonds are debt securities denominated in New
Zealand dollars that are issued within New Zealand by a
non-New Zealand entity. Eurokiwi and Uridashi bonds are
New Zealand dollar bonds issued outside New Zealand (in
the case of Uridashis, in Japan) by a foreign borrower.10
Total issuance outstanding in these markets exceeded 35
percent of GDP in 2007 (figure 10). While the amounts
outstanding of Eurokiwi and Uridashi bonds have fallen
since then, the global market for Kauri bonds has grown
since its inception in 2004 to NZ$22bn in November 2013.
Kauri, Eurokiwi, and Uridashi bond issues are typically
linked to cross-currency swap transactions as the issuer
switches the proceeds of the issue into foreign currency.
Some of these swap transactions take place with New
Zealand counterparties.
10 See Drage, Munro, and Sleeman (2005) for more details of these instruments.
39Reserve Bank of New Zealand: Bulletin, Vol. 76, No. 4, December 2013
New Zealand financial institutions can use both
FX swaps and cross-currency swaps to manage their
day-to-day liquidity, hedging, and wholesale funding
requirements. Therefore, the sum of FX and cross-
currency swap transactions in New Zealand provides
a more comprehensive understanding of the hedging
behaviour and liquidity requirements of New Zealand’s
major institutions. Together, FX swaps and cross-currency
swaps grew 11 percent between the 2010 and 2013 BIS
surveys, and total turnover is one-and-a-half times greater
than in 2001.
The rise in cross-currency swaps as a proportion
of total turnover since 2010 is consistent with domestic
banks moving towards funding for longer durations in
a post-global financial crisis world, partly in order to
meet the RBNZ’s new prudential liquidity requirements
(implemented in 2010). Longer-dated funding provides
both a more stable source and a more stable average
price of funding, with less volatility and reduced roll-over
risk (Wong, 2012).
6 Concluding remarksGlobal FX turnover continued to increase at a
substantial rate between 2010 and 2013. Although the
breakdown by instrument traded was relatively unchanged,
the 2013 survey did see some shifts in the share of
individual currencies. While the US dollar maintained its
share of global turnover, the euro lost significant ground
while the Japanese yen gained.
The New Zealand dollar saw its share of total
turnover rise slightly. A large proportion of New Zealand
dollar trading occurred offshore, perhaps reflecting New
Zealand’s long-term savings-investment imbalance and
the related offshore issuance of New Zealand dollar-
denominated debt.
Turnover in New Zealand’s onshore market also
grew, with trading in Asia-Pacific currencies accounting
for 86 percent of all local FX transactions. FX swaps
remained the most-utilised instrument and cross-currency
swaps have increased in popularity, reflecting hedging
and investing behaviour by domestic institutions and
international investors.
ReferencesBank for International Settlements (2013)
‘Triennial Central Bank Survey of foreign exchange and
derivatives market activity in 2013’, http://www.bis.org/
publ/rpfx13.htm
Bini Smaghi, L (2008) ‘The internationalisation of
currencies – a central bank perspective’, speech delivered
to the Peterson Institute of International Economics and
41Reserve Bank of New Zealand: Bulletin, Vol. 76, No. 4, December 2013
DISCUSSION PAPERSDP2013/02 A tractable framework for zero lower bound Gaussian term structure modelsKrippner, Leo
When nominal interest rates are near their zero
lower bound (ZLB), as in many developed economies at
the time of writing, it is theoretically untenable to apply
the popular class of Gaussian affine term structure models
(GATSMs) given their inherent material probabilities
of negative interest rates. Hence, I propose a new and
tractable modification for GATSMs that enforces the ZLB,
and which approximates the fully arbitrage-free but much
less tractable framework proposed in Black (1995). I apply
my framework to United States yield curve data, with
robust estimation via the iterated extended Kalman filter,
and first show that the two-factor results are very similar
to those from a comparable Black model. I then estimate
two- and three-factor models with longer-maturity data
sets to illustrate that my ZLB framework can readily be
applied in circumstances that would be computationally
burdensome or infeasible within the Black framework.
DP2013/03 Deep habits, price rigidities and the consumption response to Government spendingJacob, Punnoose
This paper presents the novel implications of
introducing price rigidities into a model of good-specific
habit formation, for the response of private consumption
following a positive government spending shock. With
‘deep’ habits in demand, the price elasticity of demand
rises after the fiscal expansion and it is optimal for the firm
to lower the mark-up while increasing production. This in
turn raises the demand for labour and the real wage rises.
Consequently, agents raise consumption at the expense
of leisure and overcome the negative wealth effect of the
fiscal shock. We show that increasing price stickiness
in a model with deep habits hinders the crowding-in of
consumption. If the degree of price stickiness is high
enough, consumption is crowded out by government
spending. These dynamics are in stark contrast to those
in traditional models where price rigidities are known to
weaken the crowding-out of consumption.
DP2013/04 Dissecting the dynamics of the US trade balance in an estimated equilibrium modelJacob, Punnoose; Peersman, Gert
In an estimated two-country DSGE model, we
find that shocks to the marginal efficiency of investment
account for more than half of the forecast variance of
cyclical fluctuations in the US trade balance. Both domestic
and foreign marginal efficiency shocks generate a strong
effect on the variability of the imbalance, through shifts
in international relative absorption. On the other hand,
shocks to uncovered interest parity and foreign export
prices, which transmit mainly via the terms of trade and
exchange rate, have a strong influence at short forecast-
horizons, before the investment disturbances begin their
dominance.
DP2013/05 What happens when the Kiwi flies? Sectoral effects of the exchange rate shocksKaragedikli, Özer; Ryan, Michael; Steenkamp, Daan; Vehbi, Tugrul
We estimate a Factor Augmented Vector
autoregression (FAVAR) to identify idiosyncratic exchange
rate shocks and examine the effects of these shocks
on different sectors of the economy. We find that an
unexpected shock to the exchange rate has significant
effects on the tradable sector of the economy. While this
is expected, the non-tradable sectors of the economy are
also influenced by shocks to exchange rate. We argue
that one important channel for this in influence is the
endogenous/cyclical nature of the population dynamics
due to permanent and long term migration.
42 Reserve Bank of New Zealand: Bulletin, Vol. 76, No. 4, December 2013
ANALYTICAL NOTESAN2013/05 Estimating the impacts of restrictions on high LVR lending Bloor, Chris; McDonald, Chris
The Reserve Bank recently imposed a loan-to-
value ratio limit governing bank lending on residential
mortgages. This note outlines the analysis undertaken to
estimate the likely impact of this limit on several macro-
economically significant variables.
AN2013/06 Some revisions to the sectoral factor model of core inflationPrice, Gael
The sectoral core factor model of inflation is one of
many series that the Reserve Bank uses to help interpret
inflation developments. This Analytical Note explains the
model and outlines some modifications that have led to
revisions to the published historical series.
AN2013/07 Neutral interest rates in the post-crisis periodChetwin, Willy; Wood, Amy
Estimates of neutral interest rates play a useful
role in thinking about monetary policy. This note explores
the concept of a neutral interest rate and provides some
simple empirical illustrations of the trend decline in neutral
rates, here and abroad, over the last couple of decades.
AN2013/08 What in the world moves New Zealand bond yields?Lewis, Michelle; Rosborough, Lauren
We use statistical techniques to identify the
co-movement among the bond yields of 12 advanced
countries, and thus estimate two-year and 10-year World
Interest Rates. Daily and monthly changes in the estimated
World Interest Rates explain a lot of the variation in New
Zealand bond yields.
AN2013/09 Fresh perspectives on unobservable variables: Data decomposition of the Kalman smootherSander, Nicholas
Macroeconomics makes extensive use of
concepts for which there are no observed data. Empirical
estimates of such unobservable variables - core inflation is
one example - have to be estimated from observed data.
The data decomposition tool helps identify the contribution
of each piece of observed data to the estimate of the
unobservable variable.
DP2013/06Financial exposure and the international transmission of financial shocksKamber, Gunes; Thoenissen, Christoph
This paper analyzes the transmission mechanism
of banking sector shocks in an international real business
cycle model with heterogeneous bank sizes. We examine
to what extent the financial exposure of the banking sector
affects the transmission of foreign banking sector shocks.
In our model, the more exposed domestic banks are to the
foreign economy via lending to foreign firms, the greater
are the spillovers from foreign financial shocks to the
home economy. The model highlights the role of openness
to trade and the dynamics of the terms of trade in the
international transmission mechanism of banking sector
shocks Spillovers from foreign banking sector shocks are
greater the more open the home economy is to trade and
the less the terms of trade respond to foreign shocks.
43Reserve Bank of New Zealand: Bulletin, Vol. 76, No. 4, December 2013
NEWS RELEASESReserve Bank Bulletin released26 September 2013
The Reserve Bank today released the September
2013 edition of the Reserve Bank Bulletin.
The Bulletin’s first article looks at why inflation
in New Zealand has been surprisingly low for the past
18 months, even though GDP growth has been much
as expected. The article concludes that the unexpected
strength in the exchange rate, reinforcing strong
competitive pressures, has played a key role. Encouraging
declines in inflation expectations and low wage inflation
have also contributed.
The Bulletin’s second article outlines the Reserve
Bank’s new macro-prudential policy framework and the
governance arrangements surrounding it. The article
provides background to the development of macro-
prudential policy, explains the objectives, and describes
the four macro-prudential tools that the Reserve Bank can
use. The article notes that the macro-prudential approach
is still in its early stage and there is scope to refine it in
light of domestic and international experience.
The Bulletin’s third article outlines some of the
approaches used to help reach a position on how much
capital the Reserve Bank needs to underpin its financial
operations. Recent changes in methodology improve the
robustness of estimated capital needs and increase the
transparency of the framework.
Reserve Bank responds to economic challenges27 September 2013
The Reserve Bank’s latest Annual Report
demonstrates the Bank’s commitment to meeting the
challenges facing the New Zealand economy and financial
system, Governor Graeme Wheeler said today.
Mr Wheeler said that the 2012-13 Annual Report
reported a positive outlook for the New Zealand economy,
which was currently growing faster than nearly all of the
advanced economies, but was being buffeted by a range
of domestic and international factors.
“Just as firms and households develop strategies
to adjust to the wide range of forces that hit our economy,
the Reserve Bank also needs to respond to them in
meeting its goals of price stability and financial stability.”
Mr Wheeler said the Bank kept its strategies,
policies and tools under constant review and, in the last
year, it adopted several strategic priorities to enhance
the Bank’s capacity to handle the current challenging
environment.
“These priorities, announced in the Bank’s
Statement of Intent in June and emphasised in the Annual
Report, build on the Bank’s achievements in the last
year,” Mr Wheeler said. “They are designed to continue
to strengthen the Bank’s performance; develop a more
integrated approach to the Bank’s monetary and financial
stability policies; and improve infrastructure and reduce
enterprise risk.”
The Annual Report shows that in the financial
year 2012-13 the Bank undertook substantial research
on the economic and financial environment following the
global financial crisis and Canterbury earthquakes. This
work had fed into the Bank’s regular Monetary Policy
Statements, Financial Stability Reports, speeches and
research publications.
The Bank signed a Memorandum of Understanding
with the Minister of Finance on macro-prudential policy
and operating guidelines. Work progressed on the
implementation of loan-to-value restrictions – coming into
force from 1 October 2013 – to reduce financial stability
risks arising from excessive house price and credit growth.
Measures undertaken during the year to reduce
risk in the banking system included the implementation
of revised capital adequacy requirements for registered
banks; and a requirement for large banks to have pre-
positioned their systems to enable the operation of the
Open Bank Resolution policy.
Financial results show the Bank spent a net $48.3
million on activities covered by its Funding Agreement,
and a dividend of $175 million was paid to the Crown.
Why NZ’s neutral interest rates have fallen2 October 2013